Embed Size (px)
Citation preview

Solar Energy Vol. 47, No. 3, pp. 219-222, 1991 00384)92X/91 $3.00 + .00 Printed in the U.S.A. Copyright © 1991 Pergamon Press plc
CLOUD COVER AS DERIVED FROM SURFACE OBSERVATIONS, SUNSHINE DURATION,
AND SATELLITE OBSERVATIONS
W. W. MORIARTY Moriarty Meteorological Services, Sunbury, Victoria 3429, Australia
Abstract--The proportion of the sky visibly covered by low and middle level clouds increases towards the horizon, due to their vertical extent, and this was considered in relation to its effect on direct solar radiation. The increase was found as a function of elevation above the horizon and of cloud amount, and it was shown to follow from its functional form that photographs from polar-orbiting satellites would give lower estimates of cloud cover than ground observations, and so would sunshine duration measurements in low latitudes. In high latitudes sunshine duration would yield higher estimates than ground observations. Other investigators had found that both the other methods gave lower estimates than surface observations at all latitudes, and the discrepancies were larger than those in this study. The differing results could be seen as due at least in part to differing treatments of high cloud.
1. I N T R O D U C T I O N
Many recent techniques for estimating solar radiation at the ground have relied on surface meteorological observations, and particularly on observations of cloud [ 1-3 ]. It is important that the cloud observations, and especially the reports of cloud amount, should be dependable. Hence, there has been concern about the fact that observations of total cloud cover made by observers on the ground do not agree with satellite- based observations, nor with the amount of cloud cover suggested by observations of bright sunshine duration.
Malberg[4], comparing mean cloud cover obtained by polar-orbiting satellite photographs (Essa 8 ) and by surface based observers over Europe and the Atlantic, found a mean difference of (0.240-0.0018v) between 30°N and 70°N, where v is the latitude in degrees. The surface based observations were the larger. Malberg suggested various factors contributing to the differ- ences. The satellite photographs would not show many of the thin cirrus clouds included in the surface ob- servations, but as against this they would be unable to distinguish many of the open spaces in areas of cumulus cloud. The surface observations would be representa- tive of much smaller areas than the satellite observa- tions (which were means taken over sections covering 2.5 ° of latitude and longitude). He felt that a major cause of the discrepancies was the fact that for a surface- based observer part of the sky, especially towards the horizon, is often obscured by the sides of clouds with vertical extent (such as cumulus clouds). The satellite photographs used, on the other hand, since they only covered a view within about 45 ° of the vertical, would show mainly the horizontal extent of such clouds. Malberg felt that the vertical extent of clouds would cause surface observers to overestimate cloud cover.
Hoyt [ 5 ] compared the mean values of total cloud cover obtained from bright sunshine records over North America with those from surface observations. He too found that the surface observations gave the larger values, by an average amount of(0.176-0.009~)
between 20°N and 70°N. He considered various pos- sible sources of the differences, including the fact that sunshine recorders may not show the presence of thin cirrus clouds--though he omitted to note the offsetting fact that when the sun is near the horizon, even though it is unobscured, it will fail to turn on most recorders. Like Malberg, he felt that an important factor was the effect of the vertical extent of clouds on surface obser- vations. Since the discrepancies he found were in the same sense and of comparable magnitude to those found by Malberg, and by other investigators using polar-orbiting satellites, he concluded that the surface based observations were in error.
Hoyt's data showed clearly that the magnitude of the difference between sunshine derived and surface observed cloud cover depended on the amount of cloud, in a nonlinear way. This conclusion was rein- forced by a study published by Rangarajan et al.[6]. It should be remarked that, in these circumstances, any conclusions derived by averaging over different cloud amounts should be received with caution.
Many of those who have written about the dis- agreement between different types of cloud observa- tions have concluded, like Malberg and Hoyt, that the discrepancies were due to errors on the part of the sur- face observers [ 3-6 ]. It is not clear to the present writer why this conclusion should have been reached--unless it is because of a satellite oriented understanding of the meaning of the term "total cloud cover." As we shall see, some discrepancies were to be expected, and there is no need to suppose that there have been any systematic errors. It should be remarked, too, that a comparison by McGuf~e and Henderson-Sellers [ 7 ] of traditional surface observations of cloud with all-sky photographs over the ocean showed general agreement.
2. THEORETICAL CONSIDERATIONS
As there seems to be some confusion of usage in the literature, some definitions will be set out. For pur- poses of this paper, "overcast" means that (for a ground
219

220 W.W. MORIARTY
based observer) there is no blue sky visible anywhere in the celestial dome; and "clear" means that there is no cloud visible in the celestial dome. References to "patches of clear sky" imply, of course, that there are both cloudy and blue sky areas visible. It seems to the present writer, and it will be assumed in this paper, that the definition of total cloud cover or total sky cover as "the fraction of the celestial dome hidden by all the visible clouds ' [8] means the fraction of the sky hemi- sphere, as seen from a single point on the ground, which is obscured by cloud (or partially obscured by thin cloud) from the view of the observer. It does not mean the fraction of the ground surface over an area which has cloud vertically above it. Thus the sides of a cu- mulus cloud, say, near the horizon form a legitimate part of the total cloud cover. The instructions issued by the Australian Bureau of Meteorology to its co-op- erative observers [ 9 ] certainly have this interpretation in mind. In any case, for purposes of estimating direct solar radiation, cloud cover estimated in this way is more appropriate than a figure which gives the fraction of the ground surface with cloud vertically above it. For if an observer cannot see blue sky in a particular direction, the sun, when in that direction, cannot "see" the ground, and whether the obstruction is the base of a cloud or part of its superstructure is not relevant.
We shall consider the total cloud as consisting of "opaque" cloud (low and middle cloud layers, and any patches of thick high cloud) which blocks out direct sunlight, and thin high cloud, which reduces the in- tensity of the direct solar beam without completely blocking it. Thin high cloud does not usually turn off bright sunshine recorders, and may not show up on satellite photographs using the visible spectrum. Mal- berg noted, and in any case it is a matter of common experience, that opaque cloud often has a significant vertical extent, which tends to cause an increase to- wards the horizon of the proportion of the sky hidden by such cloud. With a given amount of opaque cloud cover, then, the probability that the sun will find a hole to shine through decreases as it approaches the horizon.
The reported (by a ground-based observer) opaque cloud cover is an all-sky average, so it must be modified by a function of solar elevation if it is to be used for estimating the probability of bright sunshine. The probable brightness of the sunshine, if it occurs, is in turn a function of the amount of thin high cloud, but we will leave that point on one side for the present.
Suppose the reported fraction of the visible sky covered by opaque cloud is L, and the probability that an element of sky dx cos xdO should be obscured is f (X)L, dX. cos XdO, X being elevation above the ho- rizon and 0 the azimuth. We may suppose that the function f (x) , which we will call the "elevation ad- justment factor for L," is symmetrical about the zenith. It must reduce identically to 1 for L = 1 and for L = 0[5], as there can be no modification towards the horizon of the cloud cover of an overcast or a clear sky. It follows that f ( x ) is a nonlinear function of L. The reported cloud cover L is an all-sky average of the
probability of finding cloud in a particular sky element, SO
F g L = ( 1/27r) j j f (x )L .dx .cos XdO
the integration being over the sky hemisphere, so
f~r/2 f~-/2 f (x)cos XdX = 1 = cos XdX.
~0 dO (1)
We have seen that the fraction of sky obscured is great- est near the horizon, so f (x ) > 1 in this region. Since this is where cos X is greatest, it follows tha t f (x) < 1 over a considerable part of the sky around the zenith.
The average probability of bright sunshine during a day (or half-day) with constant cloudiness L is, if we use the solar hour angle ¢0 and the celestial latitude ~, as coordinates,
f f ( X ) L . d h . c o s Adr0 / f dX-cos Xd¢o (2)
where the integrals are along the path of the sun across the sky, i.e., with ~ = const. Whether this expression is less than L, as suggested by Hoyt's observation that average values of L deduced from bright sunshine du- ration tend to be less than the values reported by ground based observers, will depend on the functional form of f (x ) .
3. RESULTS FROM RADIATION OBSERVATIONS
The behaviour of the function f ( × ) has been ex- amined as part of a study of solar radiation under Aus- tralian conditions [10]. Theoretical considerations led to a relationship between the direct radiation and the cloud cover, namely.
Average [lh/(rl sin Xs)]
= g { l - ( l - n ) H - L } (3)
where Ih = measured direct radiation on a horizontal surface; I = solar radiation at the top of the atmosphere; r = transmissivity of the cloud free atmosphere; xs = solar elevation; H = proportion of the visible sky covered by high cloud; n = proportion of direct radia- tion transmitted by high cloud; g = elevation adjust- ment factor for (1 - L), the proportion of sky clear of opaque cloud. In eqn (3) g would be a function of Xs, but more generally it would be a function of × related tof(X) by the equation
f ( x ) . L + g ( X ) . ( 1 - L ) = 1.
In applying (3) the usually small contribution of thick high cloud was neglected. The averages were taken over groups, each with the same (approximately)

Cloud cover 221
solar elevation, high cloud cover, and opaque cloud cover, selected from a large set of Australian data. g and n were treated as unknown quantities, and were found as functions of solar elevation Xs and cloud cover by fitting (3) to the observations. In the case of g the dependence found on xs was only incidental, and could be translated into a dependence on X, elevation above the horizon.
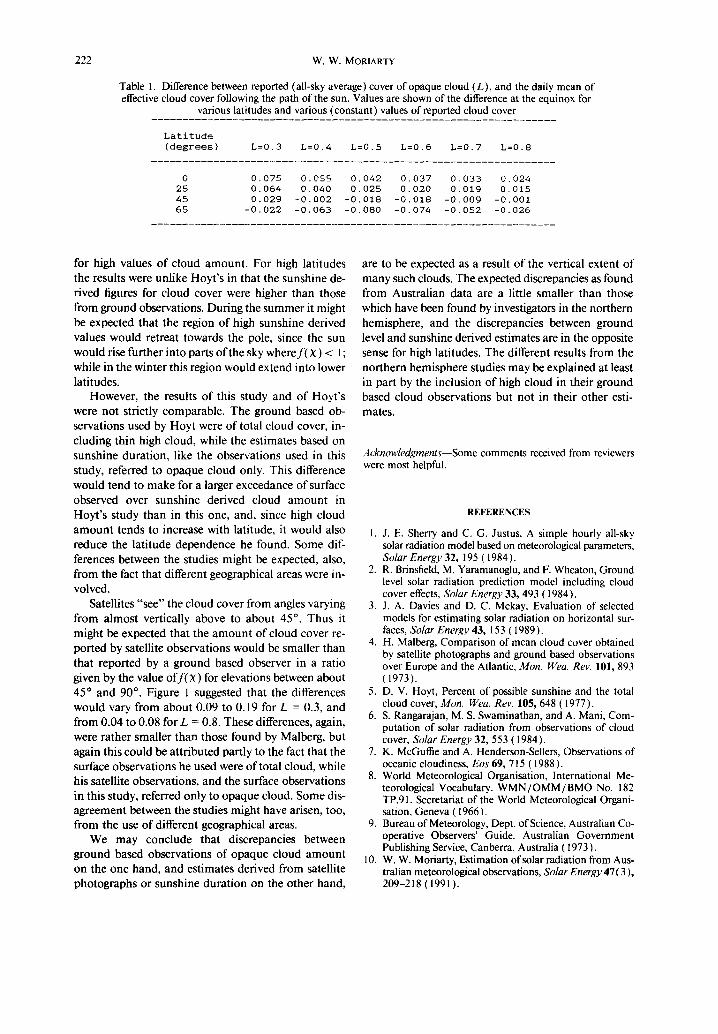
Figure 1 shows the function f (× ) , found from the fitted values of g(×), for various values of opaque cloud cover. Since the frequency of tall clouds varies with latitude, and also with other locality-dependent factors, these values for f ( x ) should strictly be applied only to the area for which they were derived. This was the Australian continent between 45°S and 20°S. How- ever, the function g(x) was derived as part of a system for estimating the solar radiation from meteorological observations, and this system was found to work quite well for the tropical parts of Australia as well as for the more southerly regions. Thus, the values found for g( × ), and hence those for f (× ) , may be taken to apply reasonably well over the whole continent, to 10°S. The general form of f (x ) may be taken as a first indication of its form for other parts of the world as well.
There was a possibility of compensating errors in the two parameters estimated from the radiation data, but it was possible to check g(×) by using a relationship similar to ( 1 ). This was derived in the same way as ( 1 ), but had g( X ) in place off(X). Integration showed that this equation was satisfied within 8.5% for all val- ues of L, within 5% for values of L greater than 0.3, and within 2% for values of L from 0.4 to 0.7.
With f ( x ) known as a function of x and L, it be- came possible to evaluate expressions such as (2). For simplicity days at the equinox were considered, so X = 0 and (2) became (considering it as applying to a half-day )
;:o /; f(x)" L.dk.d~o dk . de0 =~'/2 /2
= (2L/ l r ) . L'/2f(x)doa
with sin x = cos v. cos ~0 (for the solar path at the equinox).
This expression was integrated numerically for var- ious latitudes and for various values of L, and in each case the amount by which the result fell short of L was noted. These shortfalls, corresponding to the differences between a constant cloud cover as observed from the ground and as estimated from sunshine duration, are set out in Table 1. The figures for 0 ° and for 65 ° lat- itude should be received with caution, as they involve extrapolation beyond the area of the data base used to find f (× ) .
4. CONCLUSIONS
It may be seen from Table 1 that for all cloud amounts at low latitudes the discrepancies were in the same sense but somewhat less than those found by Hoyt. There was a latitude dependence in the same sense as that found by Hoyt, but it was larger except
1 " 6 m * * * | i i *
1.L,
g ~ 1.2
1"0 o, L=O.8 -------.
,o.,
~ o.6
~ 0.~,
0.2
0 o o ib o 2'0 o io o io o s'o o 6b o 7b o io o
ELEVATION (X)
Fig. 1. Variation of the modifying (elevation adjustment) factor for opaque cloud with elevation above the horizon, for various values of reported all sky opaque cloud cover L.
222 W. W. MORIARTY
Table 1. Difference between reported (all-sky average) cover of opaque cloud (L), and the daily mean of effective cloud cover following the path of the sun. Values are shown of the difference at the equinox for
various latitudes and various (constant) values of reported cloud cover
Latitude (degrees) L=0.3 L=0.4 L=0.5 L=0.6 L=O.7 L=0.8
.................................................................
0 0 . 0 7 5 0 . 0 5 5 O. OZI2 O. 0 3 7 0 . 0 3 3 O. 024 25 0.064 0.040 0.025 0.020 0.019 0.015 45 0 . 0 2 9 -0.002 -0.018 -0.018 - 0 . 0 0 9 -0.001 65 -0. 022 -0. 063 -0. OBO -0. 074 -0. 052 -0. 026
.................................................................
for high values of cloud amount. For high latitudes the results were unlike Hoyt's in that the sunshine de- rived figures for cloud cover were higher than those from ground observations. During the summer it might be expected that the region of high sunshine derived values would retreat towards the pole, since the sun would rise further into parts of the sky wheref(x ) < 1 ; while in the winter this region would extend into lower latitudes.
However, the results of this study and of Hoyt's were not strictly comparable. The ground based ob- servations used by Hoyt were of total cloud cover, in- cluding thin high cloud, while the estimates based on sunshine duration, like the observations used in this study, referred to opaque cloud only. This difference would tend to make for a larger exceedance of surface observed over sunshine derived cloud amount in Hoyt's study than in this one, and, since high cloud amount tends to increase with latitude, it would also reduce the latitude dependence he found. Some dif- ferences between the studies might be expected, also, from the fact that different geographical areas were in- volved.
Satellites "see" the cloud cover from angles varying from almost vertically above to about 45 ° . Thus it might be expected that the amount of cloud cover re- ported by satellite observations would be smaller than that reported by a ground based observer in a ratio given by the value off (×) for elevations between about 45 ° and 90 °. Figure 1 suggested that the differences would vary from about 0.09 to 0.19 for L = 0.3, and from 0.04 to 0.08 for L = 0.8. These differences, again, were rather smaller than those found by Malberg, but again this could be attributed partly to the fact that the surface observations he used were of total cloud, while his satellite observations, and the surface observations in this study, referred only to opaque cloud. Some dis- agreement between the studies might have arisen, too, from the use of different geographical areas.
We may conclude that discrepancies between ground based observations of opaque cloud amount on the one hand, and estimates derived from satellite photographs or sunshine duration on the other hand,
are to be expected as a result of the vertical extent of many such clouds. The expected discrepancies as found from Australian data are a little smaller than those which have been found by investigators in the northern hemisphere, and the discrepancies between ground level and sunshine derived estimates are in the opposite sense for high latitudes. The different results from the northern hemisphere studies may be explained at least in part by the inclusion of high cloud in their ground based cloud observations but not in their other esti- mates.
Acknowledgments--Some comments received from reviewers were most helpful.
REFERENCES
1. J. E. Sherry and C. G. Justus, A simple hourly all-sky solar radiation model based on meteorological parameters, Solar Energy 32, 195 ( 1984 ).
2. R. Brinsfield, M. Yaramanoglu, and F. Wheaton, Ground level solar radiation prediction model including cloud cover effects, Solar Energy 33, 493 (1984).
3. J. A. Davies and D. C. Mckay, Evaluation of selected models for estimating solar radiation on horizontal sur- faces, Solar Energy 43, 153 (1989).
4. H. Malberg, Comparison of mean cloud cover obtained by satellite photographs and ground based observations over Europe and the Atlantic, Mon. Wea. Rev. 101,893 (1973).
5. D. V. Hoyt, Percent of possible sunshine and the total cloud cover, Mon. Wea. Rev. 105, 648 (1977).
6. S. Rangarajan, M. S. Swaminathan, and A. Mani, Com- putation of solar radiation from observations of cloud cover, Solar Energy 32, 553 (1984).
7. K. McGuffie and A. Henderson-Sellers, Observations of oceanic cloudiness, Eos 69, 715 ( 1988 ).
8. World Meteorological Organisation, International Me- teorological Vocabulary. WMN/OMM/BMO No. 182 TP.91. Secretariat of the World Meteorological Organi- sation, Geneva (1966).
9. Bureau of Meteorology, Dept. of Science, Australian Co- operative Observers' Guide. Australian Government Publishing Service, Canberra, Australia (1973).
10. W. W. Moriarty, Estimation of solar radiation from Aus- tralian meteorological observations, Solar Energy ,17 (3), 209-218 ( 1991 ).