Embed Size (px)
Citation preview
The disclosures and limitations of this research on page X are an integral part of this report. Copyright © 2017 Cogent Valuation. All Rights Reserved. COGENTVALUATION.COM The disclosures and limitations of this research on page X are an integral part of this report. Copyright © 2017 Cogent Valuation. All Rights Reserved. COGENTVALUATION.COM
AS OF JUNE 30, 2017
Q2: Quarterly Industry Update
Cloud Computing
Median 52-Week Return
28.5% Median 3-Year CAGR Return
8.0% Median EV/Revenue Multiple
2.1x Median EV/EBITDA Multiple
17.3x Median Price/Earnings Multiple
24.4x Median EV/Gross CF Multiple
17.3x
Public Company Key Statistics
INDUSTRY SUMMARY
COGENT VALUATION identified Cloud Computing publicly traded companies, IPOs, and recent M&A transactions within the Cloud Computing industry, which provides a basis for market and transaction pricing that can be used by your firm in estimating market sentiment and its impact on your firm's value. Over the last year since June 30, 2016, the median 52-week share price return of the Cloud Computing industry was 28.5%. Between June 30, 2015 and June 30, 2017, the median EV/EBITDA multiple increased from 7.9 to 9.5. Furthermore, the median price-to-earnings multiple increased from 16.2 to 24.4 over the same period.
| 1
The disclosures and limitations of this research on page X are an integral part of this report. Copyright © 2017 Cogent Valuation. All Rights Reserved. COGENTVALUATION.COM
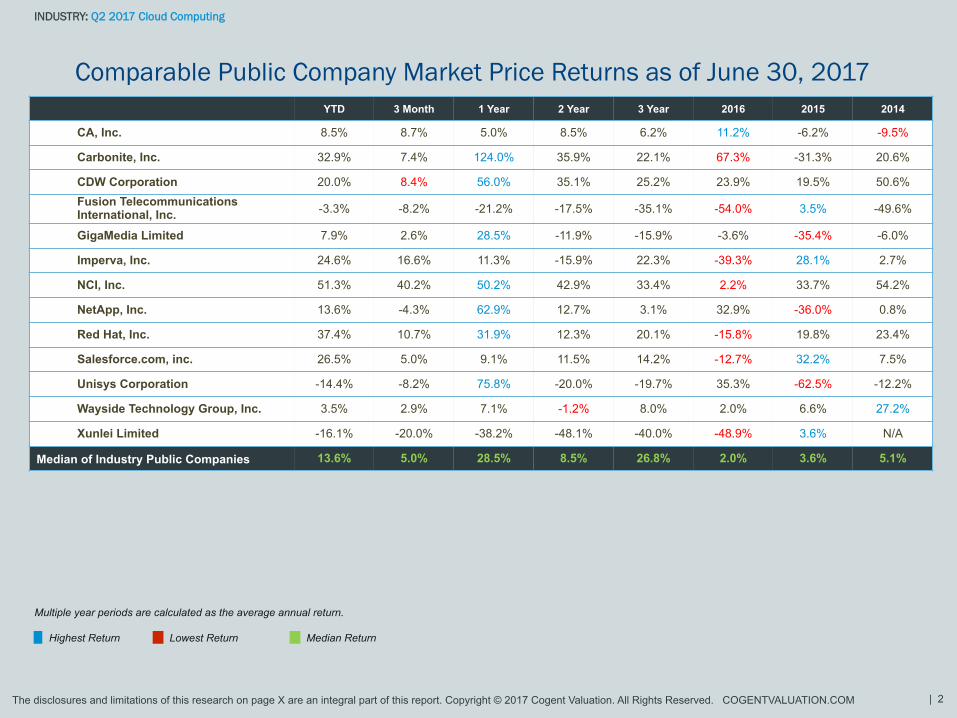
Comparable Public Company Market Price Returns as of June 30, 2017
INDUSTRY: Q2 2017 Cloud Computing
YTD 3 Month 1 Year 2 Year 3 Year 2016 2015 2014
CA, Inc. 8.5% 8.7% 5.0% 8.5% 6.2% 11.2% -6.2% -9.5%
Carbonite, Inc. 32.9% 7.4% 124.0% 35.9% 22.1% 67.3% -31.3% 20.6%
CDW Corporation 20.0% 8.4% 56.0% 35.1% 25.2% 23.9% 19.5% 50.6% Fusion Telecommunications International, Inc. -3.3% -8.2% -21.2% -17.5% -35.1% -54.0% 3.5% -49.6%
GigaMedia Limited 7.9% 2.6% 28.5% -11.9% -15.9% -3.6% -35.4% -6.0%
Imperva, Inc. 24.6% 16.6% 11.3% -15.9% 22.3% -39.3% 28.1% 2.7%
NCI, Inc. 51.3% 40.2% 50.2% 42.9% 33.4% 2.2% 33.7% 54.2%
NetApp, Inc. 13.6% -4.3% 62.9% 12.7% 3.1% 32.9% -36.0% 0.8%
Red Hat, Inc. 37.4% 10.7% 31.9% 12.3% 20.1% -15.8% 19.8% 23.4%
Salesforce.com, inc. 26.5% 5.0% 9.1% 11.5% 14.2% -12.7% 32.2% 7.5%
Unisys Corporation -14.4% -8.2% 75.8% -20.0% -19.7% 35.3% -62.5% -12.2%
Wayside Technology Group, Inc. 3.5% 2.9% 7.1% -1.2% 8.0% 2.0% 6.6% 27.2%
Xunlei Limited -16.1% -20.0% -38.2% -48.1% -40.0% -48.9% 3.6% N/A
Median of Industry Public Companies 13.6% 5.0% 28.5% 8.5% 26.8% 2.0% 3.6% 5.1%
Multiple year periods are calculated as the average annual return.
Highest Return Lowest Return Median Return
| 2
The disclosures and limitations of this research on page X are an integral part of this report. Copyright © 2017 Cogent Valuation. All Rights Reserved. COGENTVALUATION.COM
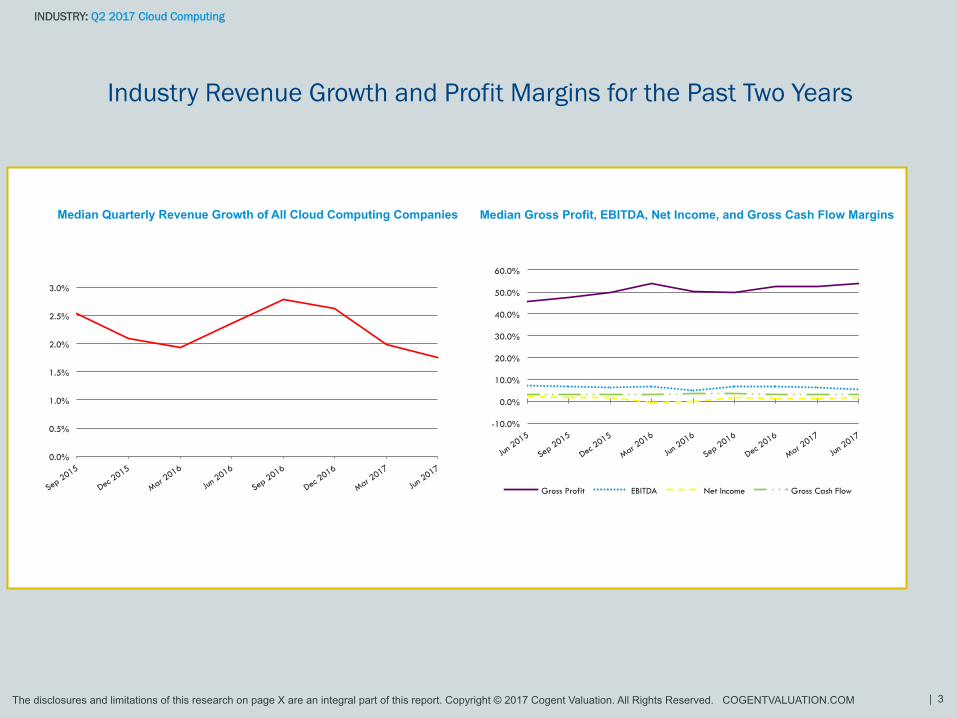
Median Quarterly Revenue Growth of All Cloud Computing Companies Median Gross Profit, EBITDA, Net Income, and Gross Cash Flow Margins
Industry Revenue Growth and Profit Margins for the Past Two Years
INDUSTRY: Q2 2017 Cloud Computing
| 3
0.0%
0.5%
1.0%
1.5%
2.0%
2.5%
3.0%
-10.0%
0.0%
10.0%
20.0%
30.0%
40.0%
50.0%
60.0%
Gross Profit EBITDA Net Income Gross Cash Flow
The disclosures and limitations of this research on page X are an integral part of this report. Copyright © 2017 Cogent Valuation. All Rights Reserved. COGENTVALUATION.COM
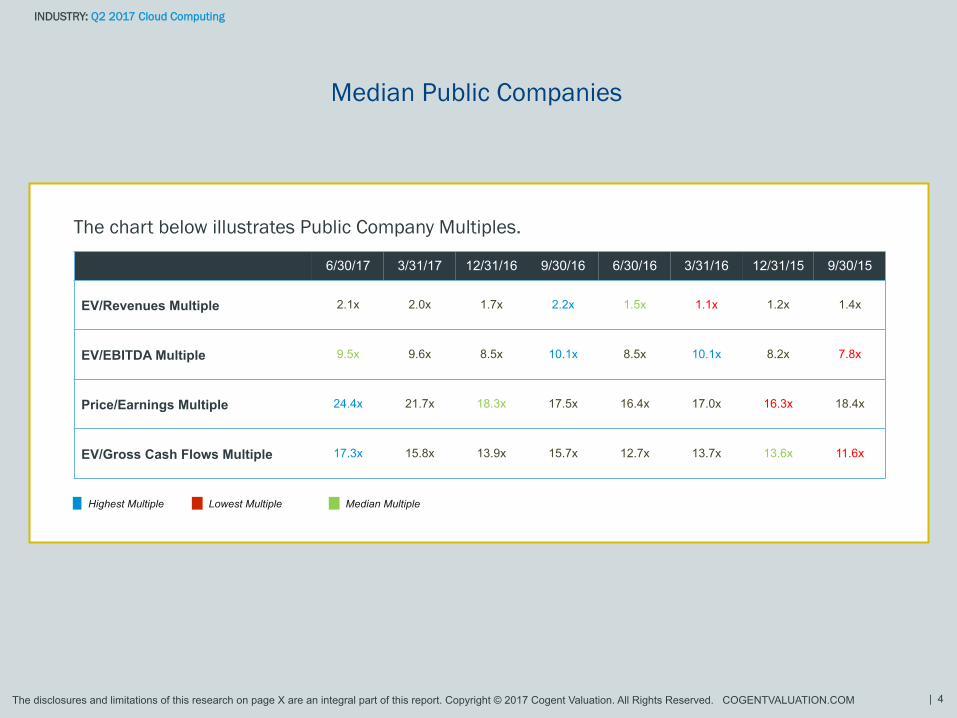
6/30/17 3/31/17 12/31/16 9/30/16 6/30/16 3/31/16 12/31/15 9/30/15
EV/Revenues Multiple 2.1x 2.0x 1.7x 2.2x 1.5x 1.1x 1.2x 1.4x
EV/EBITDA Multiple 9.5x 9.6x 8.5x 10.1x 8.5x 10.1x 8.2x 7.8x
Price/Earnings Multiple 24.4x 21.7x 18.3x 17.5x 16.4x 17.0x 16.3x 18.4x
EV/Gross Cash Flows Multiple 17.3x 15.8x 13.9x 15.7x 12.7x 13.7x 13.6x 11.6x
The chart below illustrates Public Company Multiples.
Highest Multiple Lowest Multiple Median Multiple
Median Public Companies
INDUSTRY: Q2 2017 Cloud Computing
| 4
The disclosures and limitations of this research on page X are an integral part of this report. Copyright © 2017 Cogent Valuation. All Rights Reserved. COGENTVALUATION.COM
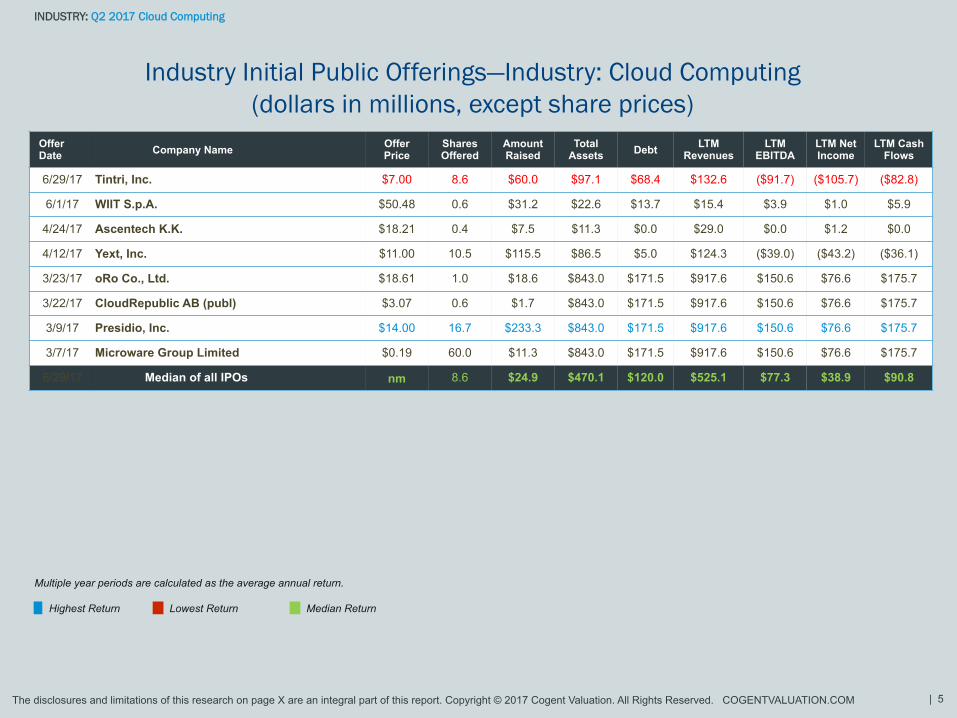
Industry Initial Public Offerings—Industry: Cloud Computing (dollars in millions, except share prices)
INDUSTRY: Q2 2017 Cloud Computing
Offer Date Company Name Offer
Price Shares Offered
Amount Raised
Total Assets Debt LTM
Revenues LTM
EBITDA LTM Net Income
LTM Cash Flows
6/29/17 Tintri, Inc. $7.00 8.6 $60.0 $97.1 $68.4 $132.6 ($91.7) ($105.7) ($82.8)
6/1/17 WIIT S.p.A. $50.48 0.6 $31.2 $22.6 $13.7 $15.4 $3.9 $1.0 $5.9
4/24/17 Ascentech K.K. $18.21 0.4 $7.5 $11.3 $0.0 $29.0 $0.0 $1.2 $0.0
4/12/17 Yext, Inc. $11.00 10.5 $115.5 $86.5 $5.0 $124.3 ($39.0) ($43.2) ($36.1)
3/23/17 oRo Co., Ltd. $18.61 1.0 $18.6 $843.0 $171.5 $917.6 $150.6 $76.6 $175.7
3/22/17 CloudRepublic AB (publ) $3.07 0.6 $1.7 $843.0 $171.5 $917.6 $150.6 $76.6 $175.7
3/9/17 Presidio, Inc. $14.00 16.7 $233.3 $843.0 $171.5 $917.6 $150.6 $76.6 $175.7
3/7/17 Microware Group Limited $0.19 60.0 $11.3 $843.0 $171.5 $917.6 $150.6 $76.6 $175.7
6/29/17 Median of all IPOs nm 8.6 $24.9 $470.1 $120.0 $525.1 $77.3 $38.9 $90.8
Multiple year periods are calculated as the average annual return.
Highest Return Lowest Return Median Return
| 5
The disclosures and limitations of this research on page X are an integral part of this report. Copyright © 2017 Cogent Valuation. All Rights Reserved. COGENTVALUATION.COM
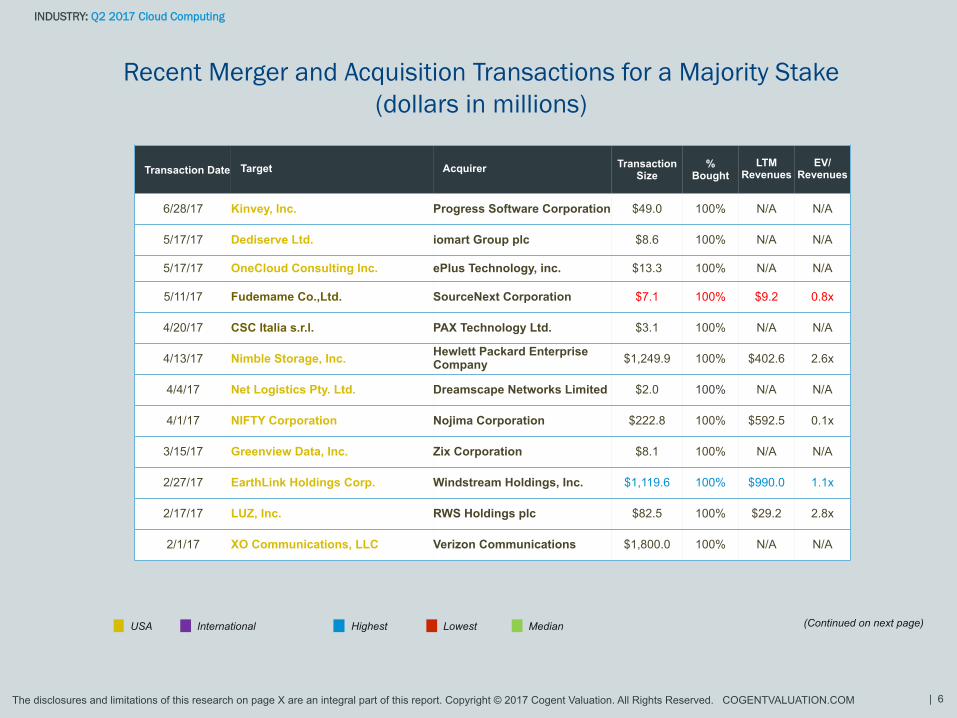
Recent Merger and Acquisition Transactions for a Majority Stake (dollars in millions)
INDUSTRY: Q2 2017 Cloud Computing
| 6
(Continued on next page) USA International Highest Lowest Median
Transaction Date Target Acquirer Transaction Size
% Bought
LTM Revenues
EV/Revenues
6/28/17 Kinvey, Inc. Progress Software Corporation $49.0 100% N/A N/A
5/17/17 Dediserve Ltd. iomart Group plc $8.6 100% N/A N/A
5/17/17 OneCloud Consulting Inc. ePlus Technology, inc. $13.3 100% N/A N/A
5/11/17 Fudemame Co.,Ltd. SourceNext Corporation $7.1 100% $9.2 0.8x
4/20/17 CSC Italia s.r.l. PAX Technology Ltd. $3.1 100% N/A N/A
4/13/17 Nimble Storage, Inc. Hewlett Packard Enterprise Company $1,249.9 100% $402.6 2.6x
4/4/17 Net Logistics Pty. Ltd. Dreamscape Networks Limited $2.0 100% N/A N/A
4/1/17 NIFTY Corporation Nojima Corporation $222.8 100% $592.5 0.1x
3/15/17 Greenview Data, Inc. Zix Corporation $8.1 100% N/A N/A
2/27/17 EarthLink Holdings Corp. Windstream Holdings, Inc. $1,119.6 100% $990.0 1.1x
2/17/17 LUZ, Inc. RWS Holdings plc $82.5 100% $29.2 2.8x
2/1/17 XO Communications, LLC Verizon Communications $1,800.0 100% N/A N/A
Option: Yellow USA Target names
The disclosures and limitations of this research on page X are an integral part of this report. Copyright © 2017 Cogent Valuation. All Rights Reserved. COGENTVALUATION.COM
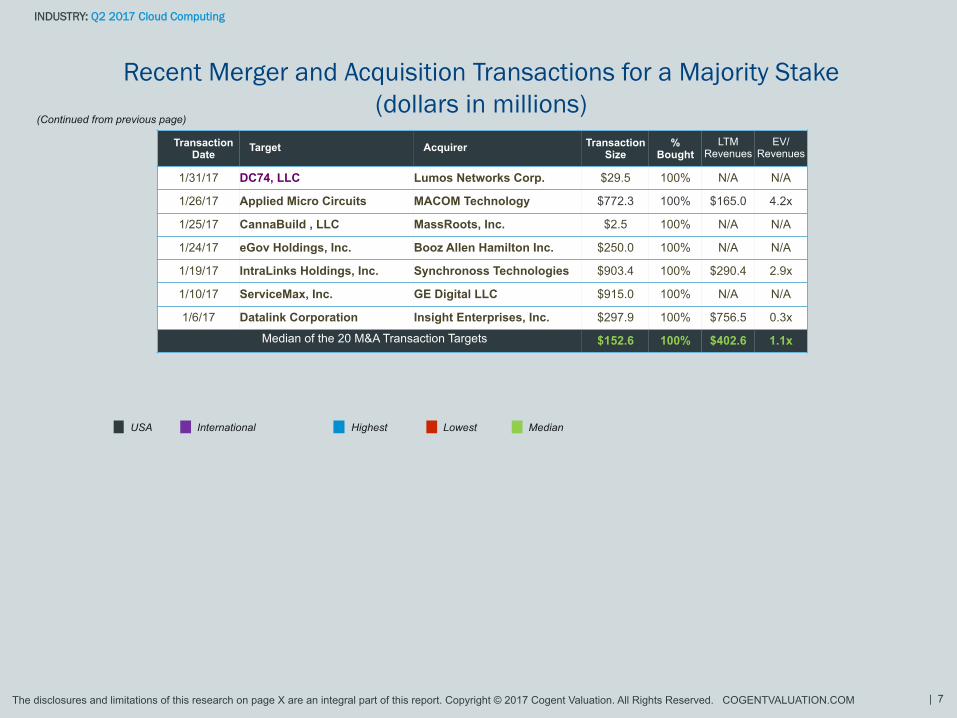
Recent Merger and Acquisition Transactions for a Majority Stake (dollars in millions)
INDUSTRY: Q2 2017 Cloud Computing
Transaction Date Target Acquirer Transaction
Size %
Bought LTM
Revenues EV/
Revenues
1/31/17 DC74, LLC Lumos Networks Corp. $29.5 100% N/A N/A
1/26/17 Applied Micro Circuits MACOM Technology $772.3 100% $165.0 4.2x
1/25/17 CannaBuild , LLC MassRoots, Inc. $2.5 100% N/A N/A
1/24/17 eGov Holdings, Inc. Booz Allen Hamilton Inc. $250.0 100% N/A N/A
1/19/17 IntraLinks Holdings, Inc. Synchronoss Technologies $903.4 100% $290.4 2.9x
1/10/17 ServiceMax, Inc. GE Digital LLC $915.0 100% N/A N/A
1/6/17 Datalink Corporation Insight Enterprises, Inc. $297.9 100% $756.5 0.3x
Median of the 20 M&A Transaction Targets $152.6 100% $402.6 1.1x
| 7
(Continued from previous page)
USA International Highest Lowest Median
Option: Grey USA Target names
The disclosures and limitations of this research on page X are an integral part of this report. Copyright © 2017 Cogent Valuation. All Rights Reserved. COGENTVALUATION.COM
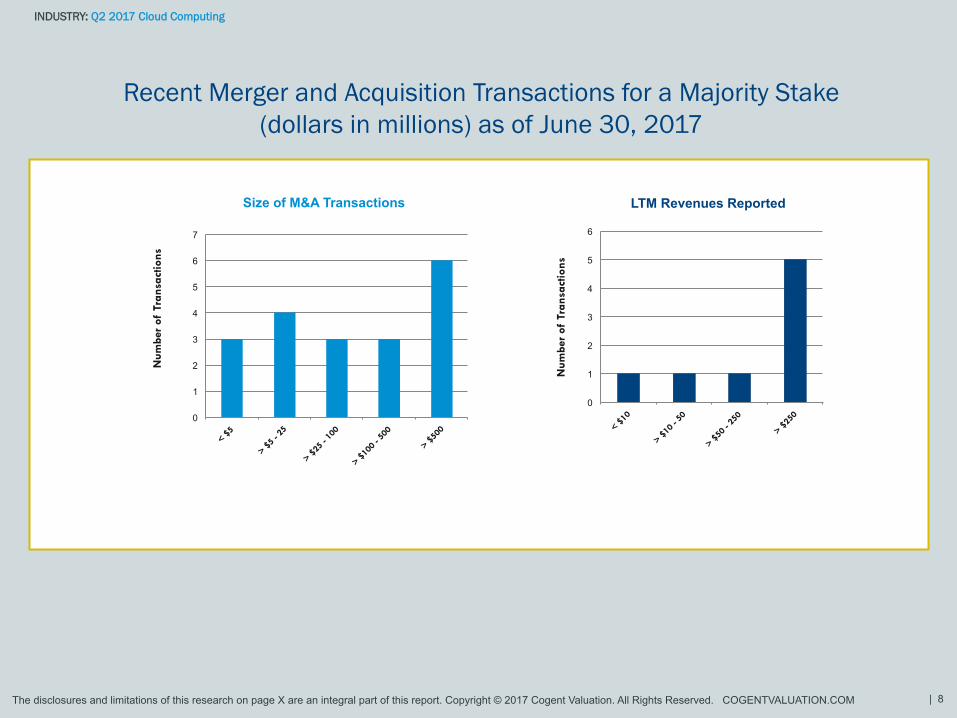
Recent Merger and Acquisition Transactions for a Majority Stake (dollars in millions) as of June 30, 2017
INDUSTRY: Q2 2017 Cloud Computing
| 8
0
1
2
3
4
5
6
7
Num
ber
of T
rans
actio
ns
Size of M&A Transactions
0
1
2
3
4
5
6
Num
ber
of T
rans
actio
ns
LTM Revenues Reported
The disclosures and limitations of this research on page X are an integral part of this report. Copyright © 2017 Cogent Valuation. All Rights Reserved. COGENTVALUATION.COM
COGENT VALUATION is a nationally recognized full service business valuation firm that has provided
independent valuation and financial advisory opinions in thousands of situations since 1991. These
assignments include the valuation of companies and pass-through entities, their securities, and their
intangible assets ranging in size from small, closely-held businesses and start-ups, to corporations with
market values over a billion dollars, covering almost every industry and all types of transactions. With the
collective backgrounds of our managing directors and professional staff, Cogent Valuation brings
substantial large deal experience to bear on our middle market transaction opinions. Cogent
Valuation utilizes proprietary research, intensive due diligence, and the experience and insights of its
professionals to produce thoughtful, well-documented opinions that have consistently withstood the
scrutiny of clients and their advisors, investors, regulators, and courts.
This industry research is provided at no charge to Cogent Valuation's clients. Research or detailed information not
covered in this report can be obtained for a fee. Contact Steven Kam at 415-392-0888 for additional information or
questions in connection with this research report.
| 9
The disclosures and limitations of this research on page X are an integral part of this report. Copyright © 2017 Cogent Valuation. All Rights Reserved. COGENTVALUATION.COM
Definitions of Financial Terms Used in this Quarterly Industry Update: Enterprise Value (EV): Market Value of Equity + Market Value of Debt
—Cash Earnings Before Interest, Taxes, Depreciation and Amortization (EBITDA): Profitability metric sometimes also referred to as operating
profit or operating earnings.
Gross Cash Flows: Net Income + Depreciation and Amortization Expense Latest Twelve Months (LTM): Financial information is as of the latest
twelve months through the date of this Quarterly Industry Update.
Disclosures and Limitations: This research report is for informational and discussion purposes only. Information presented herein is not
investment advice of any kind to any person and does not constitute a recommendation as to the purchase or sale of any interests or as to any
other course of action. General, financial, and statistical information concerning the details of this report and related industry are from sources
Cogent Valuation believes to be reliable. Cogent Valuation has accurately reflected such information in this research report; however, Cogent
Valuation makes no representation as to the sources’ accuracy or completeness and has accepted this information without further verification.
Neither all nor any part of the content of this report may be conveyed to the public through advertising, public relations, news, sales, mail, direct
transmittal, or other media without the prior written consent of Cogent Valuation. Cogent Valuation's research is as of the date reported herein.
Cogent Valuation has no affiliation with any of the companies comprising the industry used as a basis for research in this report, nor does Cogent
Valuation hold any investments in the companies listed herein. The content of this report may be used, in part, as a basis for any work that Cogent
Valuation performs for you in the future at the sole discretion of Cogent Valuation. THIS REPORT IS NOT TO BE USED OR CONSIDERED
UNDER ANY CIRCUMSTANCE BY ANYONE AS INVESTMENT ADVICE.
| 10