Embed Size (px)
Citation preview
applied sciences
Article
Cloud-Based Collaborative 3D Modeling to TrainEngineers for the Industry 4.0
José Luis Saorín 1 , Jorge de la Torre-Cantero 1, Dámari Melián Díaz 1,* andVicente López-Chao 2,*
1 Engineering Graphic Area, Universidad de La Laguna, Avenida Ánguel Guimerá Jorge s/n,38204 La Laguna, Spain; [email protected] (J.L.S.); [email protected] (J.d.l.T.-C.)
2 Department of education, University of Almería, 04120 La Cañada, Spain* Correspondence: [email protected] (D.M.D.); [email protected] (V.L.-C.); Tel.: +34-950-015750 (V.L.-C.)
Received: 4 October 2019; Accepted: 25 October 2019; Published: 27 October 2019�����������������
Abstract: In the present study, Autodesk Fusion 360 software (which includes the A360 environment)is used to train engineering students for the demands of the industry 4.0. Fusion 360 is a tool that unifiesproduct lifecycle management (PLM) applications and 3D-modeling software (PDLM—productdesign and life management). The main objective of the research is to deepen the students’ perceptionof the use of a PDLM application and its dependence on three categorical variables: PLM previousknowledge, individual practices and collaborative engineering perception. Therefore, a collaborativegraphic simulation of an engineering project is proposed in the engineering graphics subject atthe University of La Laguna with 65 engineering undergraduate students. A scale to measure theperception of the use of PDLM is designed, applied and validated. Subsequently, descriptive analyses,contingency graphical analyses and non-parametric analysis of variance are performed. The resultsindicate a high overall reception of this type of experience and that it helps them understand howprofessionals work in collaborative environments. It is concluded that it is possible to respond to thedemand of the industry needs in future engineers through training programs of collaborative 3Dmodeling environments.
Keywords: collaborative learning; engineering graphics; PLM; 3D modeling; engineering education
1. Introduction
At the end of the 20th century, companies indicated that engineers were very individualistic.This profile did not meet the new needs of the industry, such as task management between severalwork teams or design and manufacturing time. For this, communication between all project memberswas a major requirement [1]. This lack inevitably relates to the fact that in engineering education thelecture method was the main teaching approach [2]. Today, human collaboration and interoperabilityof software systems are essential requirements in industry 4.0 [3].
In the industry, product lifecycle management (PLM) applications have been used for decades toreduce design time and to manage collaborative work of the product engineering teams [4]. So, 3Dmodeling software companies for engineering such as Pro-Engineer, Autodesk or Solidworks offercollaborative work platforms (Autodesk Vault, PTC PLM Cloud or 3D Experience) that are mainlyaimed at large companies and combine PLM tasks and 3D modeling, that we will abbreviate as PDLM(product design and life management). Nevertheless, the cost and use complexity of these collaborativeplatforms makes their implementation in educational engineering environments very difficult.
Meanwhile, collaborative pedagogies and project-based learning methods are becomingincreasingly popular. Their combination with cloud-based software creates a simulation of theprofessional context. So, this approach fosters coordination and communication between team members
Appl. Sci. 2019, 9, 4559; doi:10.3390/app9214559 www.mdpi.com/journal/applsci
Appl. Sci. 2019, 9, 4559 2 of 11
while solving challenges. For this, several cloud technologies have been tested in education to improvecollaborative learning (Google Docs, Skype, Dropbox, Facebook, Prezi, Skype, etc.) [5]. Collaborativewriting tasks in distance engineering education have also been tested with web-based tool experiencesand have obtained high student acceptability [6], deeper learning and high motivation [7]. Moreover,they promote a self-motivational environment and help students to comprehend the engineeringprofession [8]. Likewise, e-journals allow sharing laboratory resources among colleagues with certainlimitations due to technical compatibility problems [9]. However, they focus on communication andwriting [10]. They are not entirely appropriate for particular engineering activities such as design and3D modeling.
In Spain, engineering graphics professors have begun to assume the shift towards multi-methodactive teaching [11] and the inclusion of ICT (Information and Communication Technologies)methodologies [12,13]. Furthermore, project-based learning stands as one of the most appropriatemethods for the development of professional competencies of the engineer [14].
In this context, a collaborative experience has been carried out with civil engineering students atthe University of La Laguna in the academic year 2018–2019. The novelty of this study relies on the useof categories to deepen the student perception of usability of a PDLM software through a categoricalanalysis of variance, which is essential to know how to design training experiences for industry 4.0.Autodesk Fusion 360 software is used to develop the graphic simulation of an engineering project.This cloud-based software incorporates PLM tools and a 3D modeling synchronous environment.This paper focuses on the explanation of the educational experience and the student’s perception ofthe resolution of an engineering project under the approach of collaborative design as training forindustry 4.0.
At the University of La Laguna, engineering graphics professors teach under a project-basedlearning approach. In groups, students design an engineering product made of five components,which they model in 3D solids. Then, they develop 2D drawings and produce dynamic animationsand create some realistic infographics. In 2013, Autodesk Inventor and Dropbox were combined toachieve collaboration in the 3D modeling process [15,16]. This system was a simulation of a PDLMapplication in terms of functionality, which allowed several students to work simultaneously in thecreation of the project graphic documentation. However, this system had the following limitation:students could not use simultaneously the same design file. A similar experience took place at theSchool of Engineering Arts et Metiers ParisTech by combining Catia V5 and Dropbox [17].
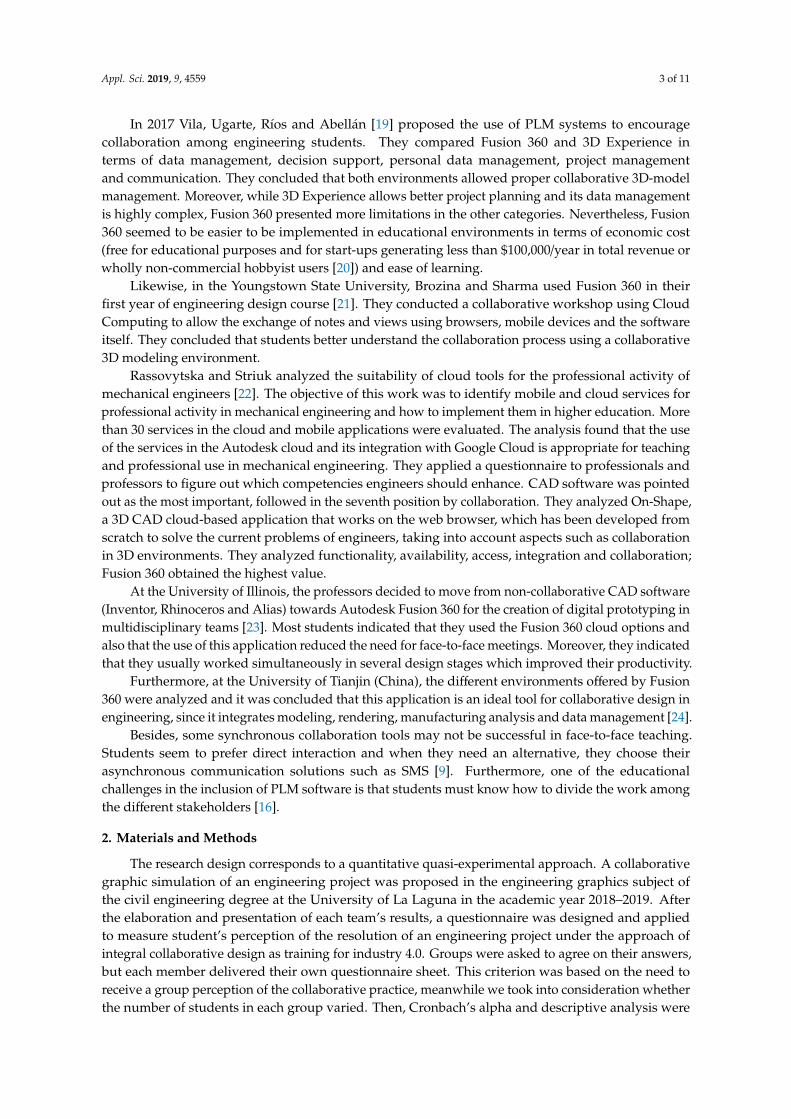
The recent arrival of Autodesk Fusion 360 solves some of the tasks reserved for the PLM programsthat the engineering companies use. Fusion 360 combines 3D modeling with the advantages of cloudcomputing tools (Figure 1) through cloud-stored files in the Autodesk cloud (called A360). It naturallyallows collaborative 3D modeling, which is appropriate for educational environments and fab labs [18].Appl. Sci. 2019, 9, x FOR PEER REVIEW 3 of 11
(a) (b)
Figure 1. (a) A 3D modeling environment and (b) file web environment (A360).
Rassovytska and Striuk analyzed the suitability of cloud tools for the professional activity of
mechanical engineers [22]. The objective of this work was to identify mobile and cloud services for
professional activity in mechanical engineering and how to implement them in higher education.
More than 30 services in the cloud and mobile applications were evaluated. The analysis found that
the use of the services in the Autodesk cloud and its integration with Google Cloud is appropriate
for teaching and professional use in mechanical engineering. They applied a questionnaire to
professionals and professors to figure out which competencies engineers should enhance. CAD
software was pointed out as the most important, followed in the seventh position by collaboration.
They analyzed On-Shape, a 3D CAD cloud-based application that works on the web browser, which
has been developed from scratch to solve the current problems of engineers, taking into account
aspects such as collaboration in 3D environments. They analyzed functionality, availability, access,
integration and collaboration; Fusion 360 obtained the highest value.
At the University of Illinois, the professors decided to move from non-collaborative CAD
software (Inventor, Rhinoceros and Alias) towards Autodesk Fusion 360 for the creation of digital
prototyping in multidisciplinary teams [23]. Most students indicated that they used the Fusion 360
cloud options and also that the use of this application reduced the need for face-to-face meetings.
Moreover, they indicated that they usually worked simultaneously in several design stages which
improved their productivity.
Furthermore, at the University of Tianjin (China), the different environments offered by Fusion
360 were analyzed and it was concluded that this application is an ideal tool for collaborative design
in engineering, since it integrates modeling, rendering, manufacturing analysis and data
management [24].
Besides, some synchronous collaboration tools may not be successful in face-to-face teaching.
Students seem to prefer direct interaction and when they need an alternative, they choose their
asynchronous communication solutions such as SMS [9]. Furthermore, one of the educational
challenges in the inclusion of PLM software is that students must know how to divide the work
among the different stakeholders [16].
2. Materials and Methods
The research design corresponds to a quantitative quasi-experimental approach. A collaborative
graphic simulation of an engineering project was proposed in the engineering graphics subject of the
civil engineering degree at the University of La Laguna in the academic year 2018–2019. After the
elaboration and presentation of each team’s results, a questionnaire was designed and applied to
measure student’s perception of the resolution of an engineering project under the approach of
integral collaborative design as training for industry 4.0. Groups were asked to agree on their
answers, but each member delivered their own questionnaire sheet. This criterion was based on the
need to receive a group perception of the collaborative practice, meanwhile we took into
consideration whether the number of students in each group varied. Then, Cronbach’s alpha and
Figure 1. (a) A 3D modeling environment and (b) file web environment (A360).
Appl. Sci. 2019, 9, 4559 3 of 11
In 2017 Vila, Ugarte, Ríos and Abellán [19] proposed the use of PLM systems to encouragecollaboration among engineering students. They compared Fusion 360 and 3D Experience interms of data management, decision support, personal data management, project managementand communication. They concluded that both environments allowed proper collaborative 3D-modelmanagement. Moreover, while 3D Experience allows better project planning and its data managementis highly complex, Fusion 360 presented more limitations in the other categories. Nevertheless, Fusion360 seemed to be easier to be implemented in educational environments in terms of economic cost(free for educational purposes and for start-ups generating less than $100,000/year in total revenue orwholly non-commercial hobbyist users [20]) and ease of learning.
Likewise, in the Youngstown State University, Brozina and Sharma used Fusion 360 in theirfirst year of engineering design course [21]. They conducted a collaborative workshop using CloudComputing to allow the exchange of notes and views using browsers, mobile devices and the softwareitself. They concluded that students better understand the collaboration process using a collaborative3D modeling environment.
Rassovytska and Striuk analyzed the suitability of cloud tools for the professional activity ofmechanical engineers [22]. The objective of this work was to identify mobile and cloud services forprofessional activity in mechanical engineering and how to implement them in higher education. Morethan 30 services in the cloud and mobile applications were evaluated. The analysis found that the useof the services in the Autodesk cloud and its integration with Google Cloud is appropriate for teachingand professional use in mechanical engineering. They applied a questionnaire to professionals andprofessors to figure out which competencies engineers should enhance. CAD software was pointedout as the most important, followed in the seventh position by collaboration. They analyzed On-Shape,a 3D CAD cloud-based application that works on the web browser, which has been developed fromscratch to solve the current problems of engineers, taking into account aspects such as collaborationin 3D environments. They analyzed functionality, availability, access, integration and collaboration;Fusion 360 obtained the highest value.
At the University of Illinois, the professors decided to move from non-collaborative CAD software(Inventor, Rhinoceros and Alias) towards Autodesk Fusion 360 for the creation of digital prototyping inmultidisciplinary teams [23]. Most students indicated that they used the Fusion 360 cloud options andalso that the use of this application reduced the need for face-to-face meetings. Moreover, they indicatedthat they usually worked simultaneously in several design stages which improved their productivity.
Furthermore, at the University of Tianjin (China), the different environments offered by Fusion360 were analyzed and it was concluded that this application is an ideal tool for collaborative design inengineering, since it integrates modeling, rendering, manufacturing analysis and data management [24].
Besides, some synchronous collaboration tools may not be successful in face-to-face teaching.Students seem to prefer direct interaction and when they need an alternative, they choose theirasynchronous communication solutions such as SMS [9]. Furthermore, one of the educationalchallenges in the inclusion of PLM software is that students must know how to divide the work amongthe different stakeholders [16].
2. Materials and Methods
The research design corresponds to a quantitative quasi-experimental approach. A collaborativegraphic simulation of an engineering project was proposed in the engineering graphics subject ofthe civil engineering degree at the University of La Laguna in the academic year 2018–2019. Afterthe elaboration and presentation of each team’s results, a questionnaire was designed and appliedto measure student’s perception of the resolution of an engineering project under the approach ofintegral collaborative design as training for industry 4.0. Groups were asked to agree on their answers,but each member delivered their own questionnaire sheet. This criterion was based on the need toreceive a group perception of the collaborative practice, meanwhile we took into consideration whetherthe number of students in each group varied. Then, Cronbach’s alpha and descriptive analysis were
Appl. Sci. 2019, 9, 4559 4 of 11
conducted (mean, median and standard deviation). Consequently, line graphs were generated toobserve whether Usability of Product Design and Life Management platform (UPDLM) scale valuesvaried concerning three grouping variables. Finally, non-parametric analyses were applied to checkwhether the previous differences were statistically meaningful.
2.1. Sample
The sample consisted of 65 civil engineering undergraduate students from the University of LaLaguna. A proportion of 30% the students knew PLM applications for collaborative work in CADenvironments. However, 95% of the them had not worked in a collaborative 3D modeling experience.They considered that group work in engineering environments is very important for their professionalactivity and 97% reflected that working with cloud-based data is fundamental for an engineer.
2.2. Software
Autodesk Fusion 360 was the selected parametric design software due to its collaborativecloud-based environment. Moreover, A360 (the Autodesk cloud) was used for data management.
2.3. Measurement Instrument
The usability of product design and life management platform (UPDLM) scale (Table 1) wasdesigned to measure the perception of the participants about the use of the Fusion 360 software forthe accomplishment of collaborative work. UPDLM scale is a 1–5 Likert scale style, in other words,students were indicated to score each item from 1 (low importance) to 5 (high importance).
Table 1. Usability of product design and life management platform (UPDLM) scale.
Factor Items Abbreviation
F1
Fusion 360 boosts communication and collaboration V1
Fusion 360 reduces the need for face-to-face group meetings. V2
Fusion 360 allows simultaneous 3D modeling on differentcomponents. V3
Fusion 360 improves the coordination of the group V4
Fusion 360 is intuitive in terms of geometry drawing V5
F2
Fusion 360 is easier to collaborate with under assigned roleswithin the group V6
A360 Comment is useful for communication V7
A360 Calendar is useful for coordination V8
A360 is useful for data management V9
A360 Conversations foster communication V10
F3
Fusion 360 helps to understand professional collaborative workenvironments V11
A360 public 3D viewer is useful V12
Fusion 360 is a worthy PDLM application V13
Fusion 360 should incorporate permissions (editing,visualization, etc.) V14
This questionnaire is composed of 14 questions divided into three categories: collaboration anddesign features (Factor 1 or F1), PLM features (Factor 2 or F2) and collaborative engineering (Factor 3or F3). The design of the measurement instrument was based on the theoretical ground that has beenreferenced in the introduction section by combining collaborative-based learning and PLM theorieswith the needs of the industry 4.0.
Appl. Sci. 2019, 9, 4559 5 of 11
In addition, students rated three grouping variables from 1 to 5: PLM knowledge, individualpractices utility and collaborative engineering perception.
2.4. Procedure
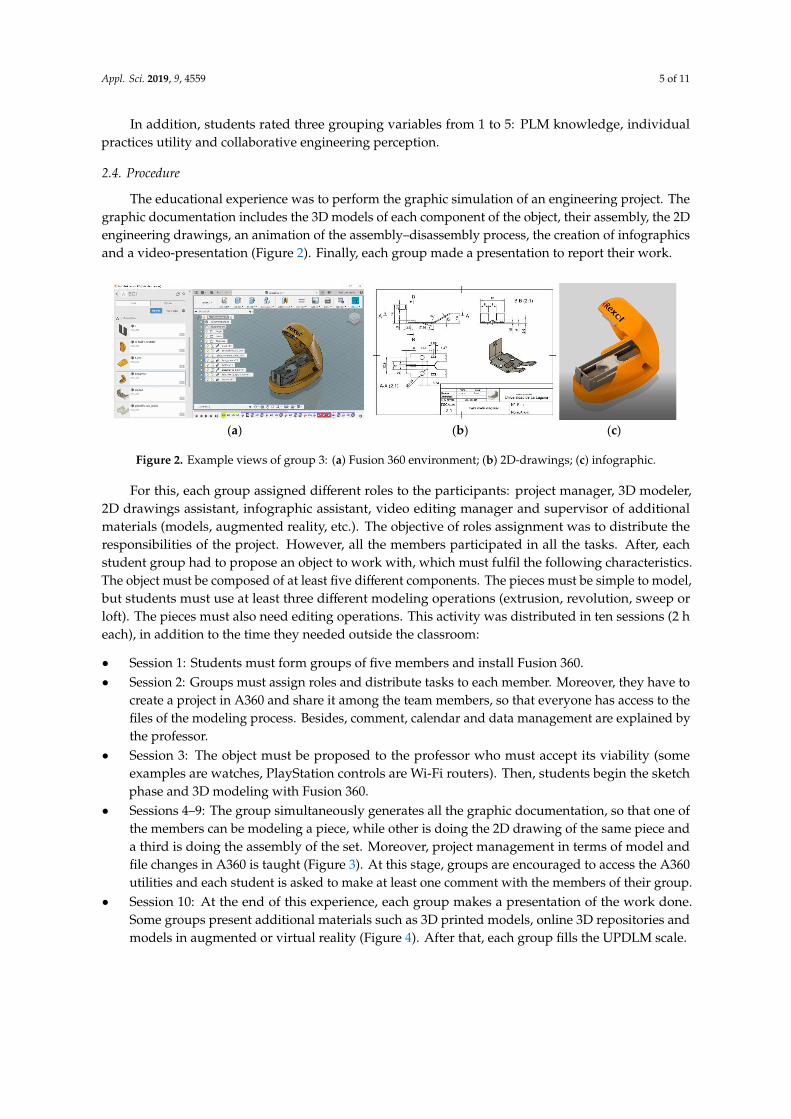
The educational experience was to perform the graphic simulation of an engineering project. Thegraphic documentation includes the 3D models of each component of the object, their assembly, the 2Dengineering drawings, an animation of the assembly–disassembly process, the creation of infographicsand a video-presentation (Figure 2). Finally, each group made a presentation to report their work.
Appl. Sci. 2019, 9, x FOR PEER REVIEW 5 of 11
In addition, students rated three grouping variables from 1 to 5: PLM knowledge, individual
practices utility and collaborative engineering perception.
2.4. Procedure
The educational experience was to perform the graphic simulation of an engineering project.
The graphic documentation includes the 3D models of each component of the object, their assembly,
the 2D engineering drawings, an animation of the assembly–disassembly process, the creation of
infographics and a video-presentation (Figure 2). Finally, each group made a presentation to report
their work.
(a) (b) (c)
Figure 2. Example views of group 3: (a) Fusion 360 environment; (b) 2D-drawings; (c) infographic.
For this, each group assigned different roles to the participants: project manager, 3D modeler,
2D drawings assistant, infographic assistant, video editing manager and supervisor of additional
materials (models, augmented reality, etc.). The objective of roles assignment was to distribute the
responsibilities of the project. However, all the members participated in all the tasks. After, each
student group had to propose an object to work with, which must fulfil the following characteristics.
The object must be composed of at least five different components. The pieces must be simple to
model, but students must use at least three different modeling operations (extrusion, revolution,
sweep or loft). The pieces must also need editing operations. This activity was distributed in ten
sessions (2 h each), in addition to the time they needed outside the classroom:
Session 1: Students must form groups of five members and install Fusion 360.
Session 2: Groups must assign roles and distribute tasks to each member. Moreover, they have
to create a project in A360 and share it among the team members, so that everyone has access to
the files of the modeling process. Besides, comment, calendar and data management are
explained by the professor.
Session 3: The object must be proposed to the professor who must accept its viability (some
examples are watches, PlayStation controls are Wi-Fi routers). Then, students begin the sketch
phase and 3D modeling with Fusion 360.
Sessions 4–9: The group simultaneously generates all the graphic documentation, so that one of
the members can be modeling a piece, while other is doing the 2D drawing of the same piece
and a third is doing the assembly of the set. Moreover, project management in terms of model
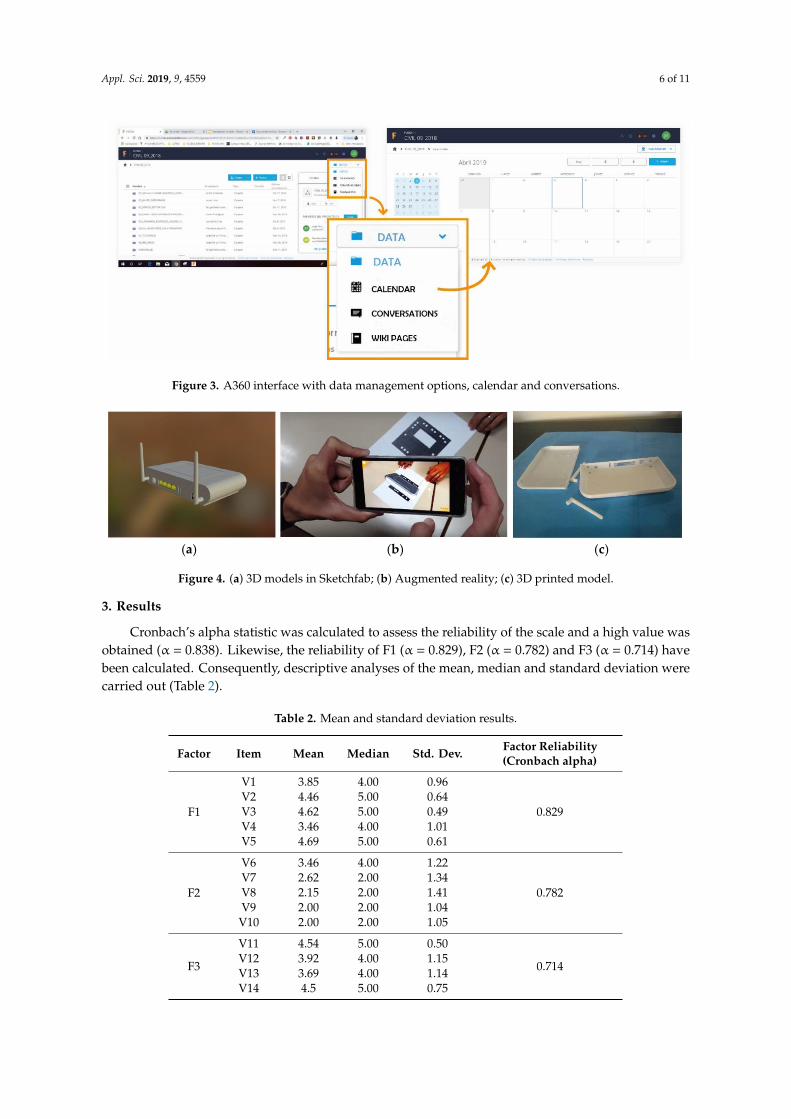
and file changes in A360 is taught (Figure 3). At this stage, groups are encouraged to access the
A360 utilities and each student is asked to make at least one comment with the members of their
group.
Session 10: At the end of this experience, each group makes a presentation of the work done.
Some groups present additional materials such as 3D printed models, online 3D repositories and
models in augmented or virtual reality (Figure 4). After that, each group fills the UPDLM scale.
Figure 2. Example views of group 3: (a) Fusion 360 environment; (b) 2D-drawings; (c) infographic.
For this, each group assigned different roles to the participants: project manager, 3D modeler,2D drawings assistant, infographic assistant, video editing manager and supervisor of additionalmaterials (models, augmented reality, etc.). The objective of roles assignment was to distribute theresponsibilities of the project. However, all the members participated in all the tasks. After, eachstudent group had to propose an object to work with, which must fulfil the following characteristics.The object must be composed of at least five different components. The pieces must be simple to model,but students must use at least three different modeling operations (extrusion, revolution, sweep orloft). The pieces must also need editing operations. This activity was distributed in ten sessions (2 heach), in addition to the time they needed outside the classroom:
• Session 1: Students must form groups of five members and install Fusion 360.• Session 2: Groups must assign roles and distribute tasks to each member. Moreover, they have to
create a project in A360 and share it among the team members, so that everyone has access to thefiles of the modeling process. Besides, comment, calendar and data management are explained bythe professor.
• Session 3: The object must be proposed to the professor who must accept its viability (someexamples are watches, PlayStation controls are Wi-Fi routers). Then, students begin the sketchphase and 3D modeling with Fusion 360.
• Sessions 4–9: The group simultaneously generates all the graphic documentation, so that one ofthe members can be modeling a piece, while other is doing the 2D drawing of the same piece anda third is doing the assembly of the set. Moreover, project management in terms of model andfile changes in A360 is taught (Figure 3). At this stage, groups are encouraged to access the A360utilities and each student is asked to make at least one comment with the members of their group.
• Session 10: At the end of this experience, each group makes a presentation of the work done.Some groups present additional materials such as 3D printed models, online 3D repositories andmodels in augmented or virtual reality (Figure 4). After that, each group fills the UPDLM scale.
Appl. Sci. 2019, 9, 4559 6 of 11Appl. Sci. 2019, 9, x FOR PEER REVIEW 6 of 11
Figure 3. A360 interface with data management options, calendar and conversations.
(a) (b) (c)
Figure 4. (a) 3D models in Sketchfab; (b) Augmented reality; (c) 3D printed model.
3. Results
Cronbach’s alpha statistic was calculated to assess the reliability of the scale and a high value
was obtained (α = 0.838). Likewise, the reliability of F1 (α = 0.829), F2 (α = 0.782) and F3 (α = 0.714)
have been calculated. Consequently, descriptive analyses of the mean, median and standard
deviation were carried out (Table 2).
Table 2. Mean and standard deviation results.
Factor Item Mean Median Std.
Dev.
Factor Reliability
(Cronbach alpha)
F1
V1 3.85 4.00 0.96
0.829
V2 4.46 5.00 0.64
V3 4.62 5.00 0.49
V4 3.46 4.00 1.01
V5 4.69 5.00 0.61
F2
V6 3.46 4.00 1.22
0.782
V7 2.62 2.00 1.34
V8 2.15 2.00 1.41
V9 2.00 2.00 1.04
V10 2.00 2.00 1.05
F3
V11 4.54 5.00 0.50
0.714 V12 3.92 4.00 1.15
V13 3.69 4.00 1.14
V14 4.5 5.00 0.75
Figure 3. A360 interface with data management options, calendar and conversations.
Appl. Sci. 2019, 9, x FOR PEER REVIEW 6 of 11
Figure 3. A360 interface with data management options, calendar and conversations.
(a) (b) (c)
Figure 4. (a) 3D models in Sketchfab; (b) Augmented reality; (c) 3D printed model.
3. Results
Cronbach’s alpha statistic was calculated to assess the reliability of the scale and a high value
was obtained (α = 0.838). Likewise, the reliability of F1 (α = 0.829), F2 (α = 0.782) and F3 (α = 0.714)
have been calculated. Consequently, descriptive analyses of the mean, median and standard
deviation were carried out (Table 2).
Table 2. Mean and standard deviation results.
Factor Item Mean Median Std.
Dev.
Factor Reliability
(Cronbach alpha)
F1
V1 3.85 4.00 0.96
0.829
V2 4.46 5.00 0.64
V3 4.62 5.00 0.49
V4 3.46 4.00 1.01
V5 4.69 5.00 0.61
F2
V6 3.46 4.00 1.22
0.782
V7 2.62 2.00 1.34
V8 2.15 2.00 1.41
V9 2.00 2.00 1.04
V10 2.00 2.00 1.05
F3
V11 4.54 5.00 0.50
0.714 V12 3.92 4.00 1.15
V13 3.69 4.00 1.14
V14 4.5 5.00 0.75
Figure 4. (a) 3D models in Sketchfab; (b) Augmented reality; (c) 3D printed model.
3. Results
Cronbach’s alpha statistic was calculated to assess the reliability of the scale and a high value wasobtained (α = 0.838). Likewise, the reliability of F1 (α = 0.829), F2 (α = 0.782) and F3 (α = 0.714) havebeen calculated. Consequently, descriptive analyses of the mean, median and standard deviation werecarried out (Table 2).
Table 2. Mean and standard deviation results.
Factor Item Mean Median Std. Dev. Factor Reliability(Cronbach alpha)
F1
V1 3.85 4.00 0.96
0.829V2 4.46 5.00 0.64V3 4.62 5.00 0.49V4 3.46 4.00 1.01V5 4.69 5.00 0.61
F2
V6 3.46 4.00 1.22
0.782V7 2.62 2.00 1.34V8 2.15 2.00 1.41V9 2.00 2.00 1.04
V10 2.00 2.00 1.05
F3
V11 4.54 5.00 0.50
0.714V12 3.92 4.00 1.15V13 3.69 4.00 1.14V14 4.5 5.00 0.75
Appl. Sci. 2019, 9, 4559 7 of 11
Regarding F1 (collaboration and design features), the students scored all the items close to twovalues: 3.60 (coordination, collaboration and communication features) and 4.50 (geometry and designusability and its viability to reduce face-to-face meetings). In terms of PLM features, students scoredvalues close to 2.00 for all the PLM tools. However, they assigned a 3.46 to the effectiveness of theroles to collaborate. Finally, students highly scored the third factor (collaborative engineering); theyscored values close to 3.8 (for the 3D public viewer and the app as a PDLM) and 4.5 (for utility forunderstanding a collaborative engineering environment and the need to add permissions).
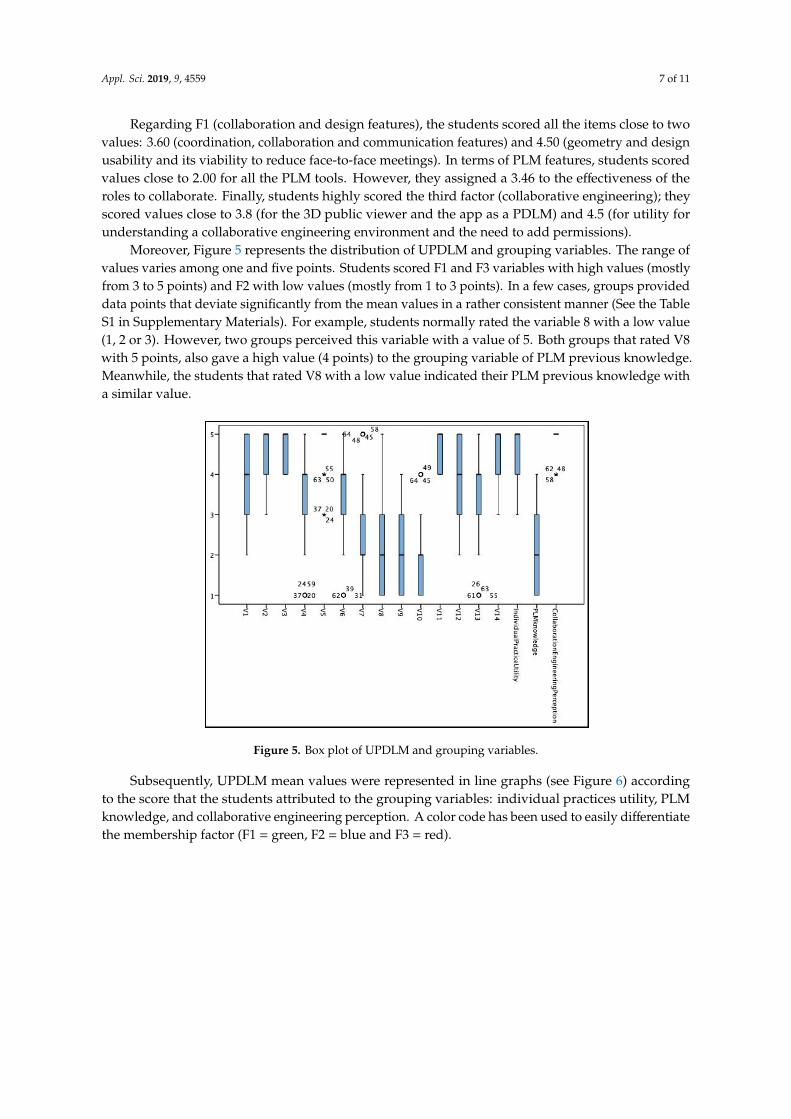
Moreover, Figure 5 represents the distribution of UPDLM and grouping variables. The range ofvalues varies among one and five points. Students scored F1 and F3 variables with high values (mostlyfrom 3 to 5 points) and F2 with low values (mostly from 1 to 3 points). In a few cases, groups provideddata points that deviate significantly from the mean values in a rather consistent manner (See the TableS1 in Supplementary Materials). For example, students normally rated the variable 8 with a low value(1, 2 or 3). However, two groups perceived this variable with a value of 5. Both groups that rated V8with 5 points, also gave a high value (4 points) to the grouping variable of PLM previous knowledge.Meanwhile, the students that rated V8 with a low value indicated their PLM previous knowledge witha similar value.
Appl. Sci. 2019, 9, x FOR PEER REVIEW 7 of 11
Regarding F1 (collaboration and design features), the students scored all the items close to two
values: 3.60 (coordination, collaboration and communication features) and 4.50 (geometry and design
usability and its viability to reduce face-to-face meetings). In terms of PLM features, students scored
values close to 2.00 for all the PLM tools. However, they assigned a 3.46 to the effectiveness of the
roles to collaborate. Finally, students highly scored the third factor (collaborative engineering); they
scored values close to 3.8 (for the 3D public viewer and the app as a PDLM) and 4.5 (for utility for
understanding a collaborative engineering environment and the need to add permissions).
Moreover, Figure 5 represents the distribution of UPDLM and grouping variables. The range of
values varies among one and five points. Students scored F1 and F3 variables with high values
(mostly from 3 to 5 points) and F2 with low values (mostly from 1 to 3 points). In a few cases, groups
provided data points that deviate significantly from the mean values in a rather consistent manner.
For example, students normally rated the variable 8 with a low value (1, 2 or 3). However, two groups
perceived this variable with a value of 5. Both groups that rated V8 with 5 points, also gave a high
value (4 points) to the grouping variable of PLM previous knowledge. Meanwhile, the students that
rated V8 with a low value indicated their PLM previous knowledge with a similar value.
Figure 5. Box plot of UPDLM and grouping variables.
Subsequently, UPDLM mean values were represented in line graphs (see Figure 6) according to
the score that the students attributed to the grouping variables: individual practices utility, PLM
knowledge, and collaborative engineering perception. A color code has been used to easily
differentiate the membership factor (F1 = green, F2 = blue and F3 = red).
On the one hand, the grouping variable PLM knowledge exhibits the following trends. The
variables belonging to F1 oscillate their scores by an average of 1.2 points, F2 variables by 2.04 points
and F3 variables by 1.10 points. Also, there is an inverse trend from the 3-point valuation of the
grouping variable for most variables (except for three variables of F2 and one of the F1). On the other
hand, in the individual practices utility group, the results indicate a direct relationship in all the
variables except one (V12). In this case, the scores range from 0.50, 1.46 and 0.57 average points for
F1, F2 and F3, respectively. Finally, in the collaborative engineering perception grouping, the results
of the scale show an inverse relationship for all the F1 variable and for two variables of the F3. In F2,
V7 remains and the others increase by an average of 0.7 points.
Figure 5. Box plot of UPDLM and grouping variables.
Subsequently, UPDLM mean values were represented in line graphs (see Figure 6) accordingto the score that the students attributed to the grouping variables: individual practices utility, PLMknowledge, and collaborative engineering perception. A color code has been used to easily differentiatethe membership factor (F1 = green, F2 = blue and F3 = red).
Appl. Sci. 2019, 9, 4559 8 of 11Appl. Sci. 2019, 9, x FOR PEER REVIEW 8 of 11
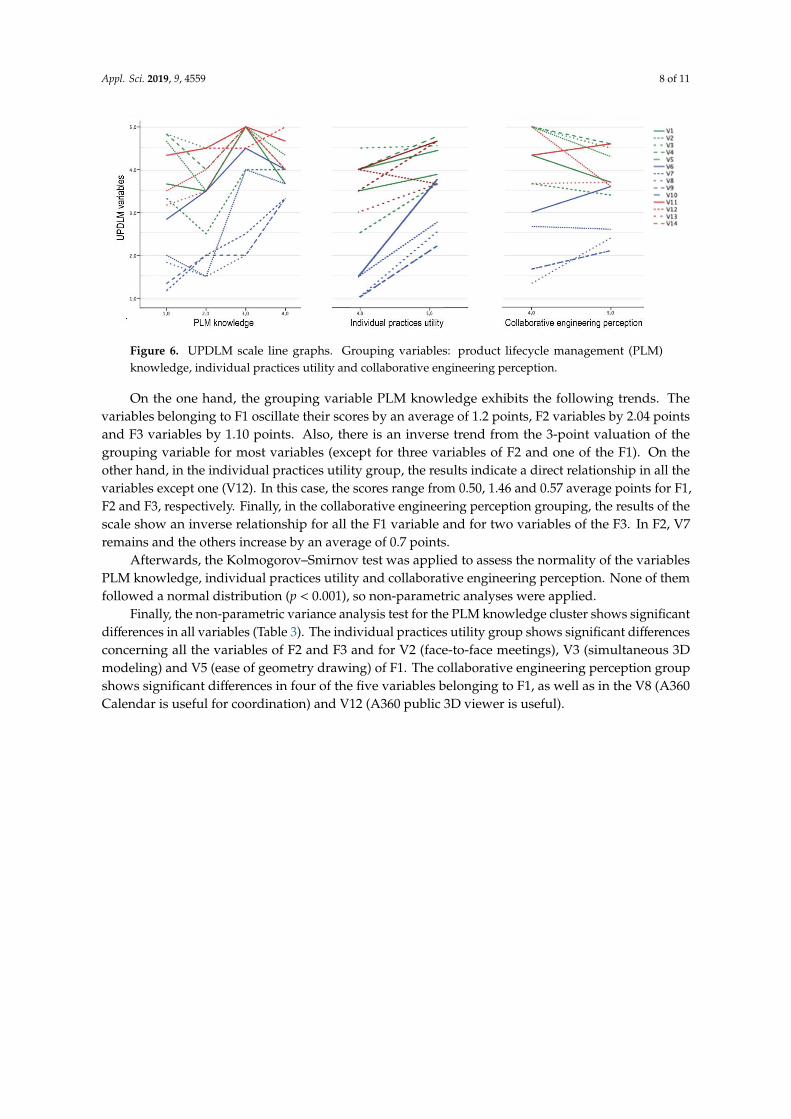
Figure 6. UPDLM scale line graphs. Grouping variables: product lifecycle management (PLM)
knowledge, individual practices utility and collaborative engineering perception.
Afterwards, the Kolmogorov–Smirnov test was applied to assess the normality of the variables
PLM knowledge, individual practices utility and collaborative engineering perception. None of them
followed a normal distribution (p < 0.001), so non-parametric analyses were applied.
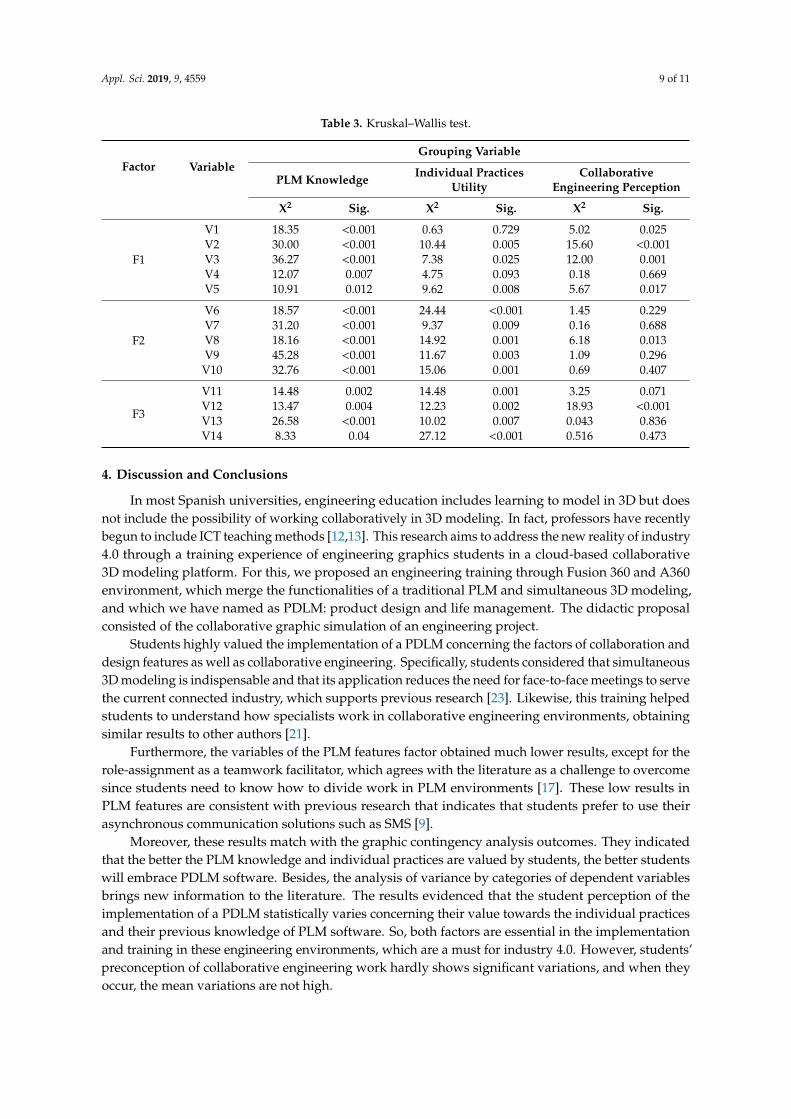
Finally, the non-parametric variance analysis test for the PLM knowledge cluster shows
significant differences in all variables (Table 3). The individual practices utility group shows
significant differences concerning all the variables of F2 and F3 and for V2 (face-to-face meetings), V3
(simultaneous 3D modeling) and V5 (ease of geometry drawing) of F1. The collaborative engineering
perception group shows significant differences in four of the five variables belonging to F1, as well
as in the V8 (A360 Calendar is useful for coordination) and V12 (A360 public 3D viewer is useful).
Table 3. Kruskal–Wallis test.
Factor Variable
Grouping Variable
PLM Knowledge Individual Practices
Utility
Collaborative Engineering
Perception
Χ2 Sig. Χ2 Sig. Χ2 Sig.
F1
V1 18.35 <0.001 0.63 0.729 5.02 0.025
V2 30.00 <0.001 10.44 0.005 15.60 <0.001
V3 36.27 <0.001 7.38 0.025 12.00 0.001
V4 12.07 0.007 4.75 0.093 0.18 0.669
V5 10.91 0.012 9.62 0.008 5.67 0.017
F2
V6 18.57 <0.001 24.44 <0.001 1.45 0.229
V7 31.20 <0.001 9.37 0.009 0.16 0.688
V8 18.16 <0.001 14.92 0.001 6.18 0.013
V9 45.28 <0.001 11.67 0.003 1.09 0.296
V10 32.76 <0.001 15.06 0.001 0.69 0.407
F3
V11 14.48 0.002 14.48 0.001 3.25 0.071
V12 13.47 0.004 12.23 0.002 18.93 <0.001
V13 26.58 <0.001 10.02 0.007 0.043 0.836
V14 8.33 0.04 27.12 <0.001 0.516 0.473
4. Discussion and Conclusions
In most Spanish universities, engineering education includes learning to model in 3D but does
not include the possibility of working collaboratively in 3D modeling. In fact, professors have
recently begun to include ICT teaching methods [12,13]. This research aims to address the new reality
of industry 4.0 through a training experience of engineering graphics students in a cloud-based
Figure 6. UPDLM scale line graphs. Grouping variables: product lifecycle management (PLM)knowledge, individual practices utility and collaborative engineering perception.
On the one hand, the grouping variable PLM knowledge exhibits the following trends. Thevariables belonging to F1 oscillate their scores by an average of 1.2 points, F2 variables by 2.04 pointsand F3 variables by 1.10 points. Also, there is an inverse trend from the 3-point valuation of thegrouping variable for most variables (except for three variables of F2 and one of the F1). On theother hand, in the individual practices utility group, the results indicate a direct relationship in all thevariables except one (V12). In this case, the scores range from 0.50, 1.46 and 0.57 average points for F1,F2 and F3, respectively. Finally, in the collaborative engineering perception grouping, the results of thescale show an inverse relationship for all the F1 variable and for two variables of the F3. In F2, V7remains and the others increase by an average of 0.7 points.
Afterwards, the Kolmogorov–Smirnov test was applied to assess the normality of the variablesPLM knowledge, individual practices utility and collaborative engineering perception. None of themfollowed a normal distribution (p < 0.001), so non-parametric analyses were applied.
Finally, the non-parametric variance analysis test for the PLM knowledge cluster shows significantdifferences in all variables (Table 3). The individual practices utility group shows significant differencesconcerning all the variables of F2 and F3 and for V2 (face-to-face meetings), V3 (simultaneous 3Dmodeling) and V5 (ease of geometry drawing) of F1. The collaborative engineering perception groupshows significant differences in four of the five variables belonging to F1, as well as in the V8 (A360Calendar is useful for coordination) and V12 (A360 public 3D viewer is useful).
Appl. Sci. 2019, 9, 4559 9 of 11
Table 3. Kruskal–Wallis test.
Factor VariableGrouping Variable
PLM Knowledge Individual PracticesUtility
CollaborativeEngineering Perception
X2 Sig. X2 Sig. X2 Sig.
F1
V1 18.35 <0.001 0.63 0.729 5.02 0.025V2 30.00 <0.001 10.44 0.005 15.60 <0.001V3 36.27 <0.001 7.38 0.025 12.00 0.001V4 12.07 0.007 4.75 0.093 0.18 0.669V5 10.91 0.012 9.62 0.008 5.67 0.017
F2
V6 18.57 <0.001 24.44 <0.001 1.45 0.229V7 31.20 <0.001 9.37 0.009 0.16 0.688V8 18.16 <0.001 14.92 0.001 6.18 0.013V9 45.28 <0.001 11.67 0.003 1.09 0.296V10 32.76 <0.001 15.06 0.001 0.69 0.407
F3
V11 14.48 0.002 14.48 0.001 3.25 0.071V12 13.47 0.004 12.23 0.002 18.93 <0.001V13 26.58 <0.001 10.02 0.007 0.043 0.836V14 8.33 0.04 27.12 <0.001 0.516 0.473
4. Discussion and Conclusions
In most Spanish universities, engineering education includes learning to model in 3D but doesnot include the possibility of working collaboratively in 3D modeling. In fact, professors have recentlybegun to include ICT teaching methods [12,13]. This research aims to address the new reality of industry4.0 through a training experience of engineering graphics students in a cloud-based collaborative3D modeling platform. For this, we proposed an engineering training through Fusion 360 and A360environment, which merge the functionalities of a traditional PLM and simultaneous 3D modeling,and which we have named as PDLM: product design and life management. The didactic proposalconsisted of the collaborative graphic simulation of an engineering project.
Students highly valued the implementation of a PDLM concerning the factors of collaboration anddesign features as well as collaborative engineering. Specifically, students considered that simultaneous3D modeling is indispensable and that its application reduces the need for face-to-face meetings to servethe current connected industry, which supports previous research [23]. Likewise, this training helpedstudents to understand how specialists work in collaborative engineering environments, obtainingsimilar results to other authors [21].
Furthermore, the variables of the PLM features factor obtained much lower results, except for therole-assignment as a teamwork facilitator, which agrees with the literature as a challenge to overcomesince students need to know how to divide work in PLM environments [17]. These low results inPLM features are consistent with previous research that indicates that students prefer to use theirasynchronous communication solutions such as SMS [9].
Moreover, these results match with the graphic contingency analysis outcomes. They indicatedthat the better the PLM knowledge and individual practices are valued by students, the better studentswill embrace PDLM software. Besides, the analysis of variance by categories of dependent variablesbrings new information to the literature. The results evidenced that the student perception of theimplementation of a PDLM statistically varies concerning their value towards the individual practicesand their previous knowledge of PLM software. So, both factors are essential in the implementationand training in these engineering environments, which are a must for industry 4.0. However, students’preconception of collaborative engineering work hardly shows significant variations, and when theyoccur, the mean variations are not high.
Appl. Sci. 2019, 9, 4559 10 of 11
To conclude, this research has applied training for future engineers adapted to the needs ofindustry 4.0 through a cloud-based collaborative 3D modeling platform. This has demonstrated a goodreception with statistically significant changes with dependence on PLM knowledge and individualpractices. Likewise, the analysis of relationships carried out shows that different pieces of training canserve to further improve some perceptions of the students and consequently their future application inprofessional practice.
Additionally, it is necessary to emphasize the importance of this type of study in engineering.Literature and companies have evidenced a relationship between the profiles of engineers and theirtraining in the university. Therefore, other authors are encouraged to address the needs of industry4.0 from the university, not only through proposals but also through applied research that generatesknowledge on how to address their training.
Finally, and despite the difficulties of implementing PLM programs in education (due to theircost and difficulty), the results of this research provide some suggestions for making possible PDLMtraining in the first year of engineering studies by using Autodesk Fusion360. Learning must becontinuous and addressed as early as possible. At first, individual practices should focus on learningthe basic tools of the chosen environment (both modeling and management), PLM knowledge andapplicability. Later, the teacher will be vital to monitor and detect weaknesses in time. Likewise, it isessential to organize groups and roles to balance responsibilities and simulate from the beginning ofthe training the experience of a collaborative project.
Supplementary Materials: The following are available online at http://www.mdpi.com/2076-3417/9/21/4559/s1,Table S1: UPDLM ULL database.
Author Contributions: Conceptualization, J.L.S.; methodology, software investigation and resources, J.d.l.T.-C. andD.M.D.; formal analysis, V.L.-C.; original draft preparation of the manuscripts J.d.l.T.-C. and J.L.S.; writing—reviewand editing V.L.-C. and D.M.D.
Funding: This research received no external funding.
Conflicts of Interest: The authors declare no conflict of interest.
References
1. Koehn, E.E. Assessment of communications and collaborative learning in civil engineering education. J. Prof.Issues Eng. Educ. Pract. 2001, 127, 160–165. [CrossRef]
2. McCuen, R.H. Constructivist learning model for ethics education. J. Prof. Issues Eng. Educ. Pract. 1995,120, 273–278. [CrossRef]
3. Rajala, S.A. Beyond 2020: Preparing engineers for the future. Proc. IEEE 2012, 100, 1376–1383. [CrossRef]4. Garetti, M.; Terzi, S.; Bertacci, N.; Brianza, M. Organisational change and knowledge management in PLM
implementation. Int. J. Prod. Lifecycle Manag. 2005, 1, 43–51. [CrossRef]5. Jung, Y.W.; Lim, Y.K.; Kim, M.S. Possibilities and limitations of online document tools for design collaboration:
The case of Google Docs. In Proceedings of the 2017 ACM Conference on Computer Supported CooperativeWork and Social Computing, Portland, OR, USA, 25 February–1 March 2017; pp. 1096–1108.
6. Hadjileontiadou, S.J.; Sakonidis, H.N.; Balafoutas, G.J. Lin2k: A novel web-based collaborativetool-application to engineering education. J. Eng. Educ. 2003, 92, 313–324. [CrossRef]
7. Moreno, L.; Gonzalez, C.; Castilla, I.; Gonzalez, E.; Sigut, J. Applying a constructivist and collaborativemethodological approach in engineering education. Comput. Educ. 2007, 49, 891–915. [CrossRef]
8. do Carmo, B.B.T.; Pontes, R.L.J. Collaborative learning concept implementation through web. 2.0 tools:The case of industrial engineering fundamentals’ discipline. Int. J. Eng. Educ. 2013, 29, 205–214.
9. Gillet, D.; Ngoc, A.V.N.; Rekik, Y. Collaborative web-based experimentation in flexible engineering education.IEEE Trans. Educ. 2005, 48, 696–704. [CrossRef]
10. Al-Samarraie, H.; Saeed, N.A. Systematic review of cloud computing tools for collaborative learning:Opportunities and challenges to the blended-learning environment. Comput. Educ. 2018, 124, 77–91.[CrossRef]
Appl. Sci. 2019, 9, 4559 11 of 11
11. López-Pena, V.; López-Chao, V.A.; López-Chao, A. Analysis of teaching methods in graphic design in theGalician University System (GUS) in Spain. Anthropologist 2016, 25, 214–219. [CrossRef]
12. López-Chao, V.; López-Pena, V.; Ramiro-Aparicio, D. Beyond graphic expression: A diagnosis about the useof ICT teaching methods in engineering and architecture degrees. In Proceedings of the 12th internationaltechnology, education and development conference (INTED), Valencia, Spain, 5–7 March 2016; pp. 9290–9295.
13. Ramiro-Aparicio, D.; López-Pena, V.; López-Chao, V. Comparative study of the acquisition of ICT competencein graphic expression between the UDC and the US. In Proceedings of the 10th International Conference ofEducation, Research and Innovation, Seville, Spain, 16–18 November 2017; pp. 5150–5154.
14. Arri, Z.A.; Mujika, M.G.; Albisua, M.J.B.; Mendez, E.S. El desarrollo de habilidades profesionales en losestudios de ingeniería en la Universidad del País Vasco: ¿Aprendizaje basado en problemas o en proyectos?DYNA 2019, 94, 22–25. [CrossRef]
15. Saorin, J.L.; de La Torre, J.; Martín, N.; Carbonell, C. Education working group management using digitaltablets. Procedia Soc. Behav. Sci. 2013, 93, 1569–1573. [CrossRef]
16. Segonds, F.; Maranzana, N.; Veron, P.; Aoussat, A. Collaborative reverse engineering design experimentusing PLM solutions. Int. J. Eng. Educ. 2011, 27, 1037–1045.
17. Maranzana, N.; Segonds, F.; Buisine, S. Collaborative design tools in engineering education: Insight to choosethe appropriate PLM software. Int. J. Mech. Eng. Educ. 2018. [CrossRef]
18. Saorín, J.L.; Lopez-Chao, V.; de la Torre-Cantero, J.; Díaz-Alemán, M.D. Computer aided design to producehigh-detail models through low cost digital fabrication for the conservation of aerospace heritage. Appl. Sci.2019, 9, 2338. [CrossRef]
19. Vila, C.; Ugarte, D.; Ríos, J.; Abellán, J.V. Project-based collaborative engineering learning to develop Industry4.0 skills within a PLM framework. Procedia Manuf. 2017, 13, 1269–1276. [CrossRef]
20. Autodesk Fusion 360: Fusion 360 for Hobbyist and Makers. Available online: https://www.autodesk.com/
campaigns/fusion-360-for-hobbyists (accessed on 2 September 2019).21. Brozina, C.; Sharma, A. Workshop: Implementing cloud collaboration using fusion 360 into a first-year
engineering design course. In Proceedings of the FYEE Conference, Daytona Beach, FL, USA,6–8 August 2017.
22. Rassovytska, M.; Striuk, A. Mechanical engineers training in using cloud and mobile services in professionalactivity. CEUR Workshop Proc. 2017, 1844, 348–359.
23. Leake, J.M.; Weightman, D.; Batmunkh, B. Digital prototyping by multidisciplinary teams. In Proceedings ofthe ASEE Annual Conference Exposition, Columbus, OH, USA, 25–28 June 2017.
24. Song, P.P.; Qi, Y.M.; Cai, D.C. Research and application of autodesk fusion360 in industrial design. In IOPConference Series: Materials Science and Engineering; IOP Publishing: Bristol, UK, 2018; p. 012037.
© 2019 by the authors. Licensee MDPI, Basel, Switzerland. This article is an open accessarticle distributed under the terms and conditions of the Creative Commons Attribution(CC BY) license (http://creativecommons.org/licenses/by/4.0/).