Embed Size (px)
Citation preview
h
Cloud Subscriptions & Support Revenue
in € millions
IFRS Non-IFRS
1,070 1,072 +18% +18% (+31% cc)
Total Revenue
in € millions
IFRS Non-IFRS
5,261 5,262 0% 0% (+9% cc)
Share of Predictable Revenue
in percent
Q1 2018
71% +2 p.p.
6731,1981,025 1,235
IFRS Non-IFRS
Operating Profitin € millionsQ1/17 Q1/18
+52% +3% (+14% cc)
Cloud Revenue Accelerates, Up 18% (IFRS) and Up 31% (Non-IFRS at Constant Currencies), Exceeding €1 Billion for the First Time in a Quarter
New Cloud Bookings Up 25% at Constant Currencies on Top of an Exceptional Prior Year Quarter
Digital Core Momentum Continues With Over 8,300 S/4HANA Customers, Up 43% Year-over-Year
Full Year Outlook Increased to Reflect Callidus Acquisition and Strong Operational Momentum
SAP Q1 2018 Quarterly Statement
Cloud and Software Revenue Growth Above FY Guidance Double-Digit Operating Profit Growth Drives Operating Margin Increase
Bill McDermott, CEO Luka Mucic, CFO
“SAP’s momentum continues with our latest trifecta, including fast growing cloud, strong software sales, and operating income expansion. Even against the steepest comparisons, S/4HANA led us again to major market share gains for the company. With an increasing share of predictable revenues, our beyond expectations profitability is cause for even greater shareholder confidence. From this position of immense strength, look for SAP to be bolder than ever in markets like CRM.”
“There are two things I am particularly proud of in Q1: We faced a very strong prior year quarter comparison and still delivered cloud & software growth above our full year guidance. Moreover, we increased operating margins while continuing to invest in our people and our portfolio. This gives me great confidence for 2018 and beyond.”
4,328 4,328
4,351 4,353
IFRS Non-IFRS
Cloud & Software Revenuein € millions
Q1/17 Q1/18
+1% (+9% cc)+1%
2 SAP Q1 2018 Quarterly Statement
Walldorf, Germany – April 24, 2018
SAP SE (NYSE: SAP) today announced its financial results for the first quarter ended March 31, 2018.
Business Highlights
Financial Highlights
First Quarter 2018 New cloud bookings1 grew by 14% (25% at constant currencies) in the first quarter and reached €245 million. Cloud subscriptions
and support revenue grew 18% year over year to €1.07 billion (IFRS), up 31% (non-IFRS at constant currencies). Software revenue
was down 10% year over year to €625 million (IFRS), down 2% (non-IFRS at constant currencies). New cloud and software license
order entry2 grew by 10% at constant currencies year over year in the first quarter. Cloud and software revenue grew 1% year over
year to €4.35 billion (IFRS), up 9% (non-IFRS at constant currencies). Total revenue was flat year over year at €5.26 billion (IFRS),
up 9% (non-IFRS at constant currencies).
SAP’s rapidly expanding cloud business together with solid growth in support revenue continued to drive the share of more
predictable revenue. The total of cloud subscriptions & support revenue and software support revenue as a percentage of total
revenue grew 2 percentage points to 71% in the first quarter and thus exceeded 70% for the first time.
First quarter operating profit was up 52% year over year to €1.03 billion (IFRS), up 14% (non-IFRS at constant currencies). As
announced in January 2018, the Company expects a positive revenue and profit impact from the adoption of IFRS 15 in 2018. In the
first quarter, this positive impact on SAP’s operating profit was around €44 million. Earnings per share increased 37% to €0.59
(IFRS) and was down 1% to €0.73 (non-IFRS).
Operating cash flow for the first quarter was €2.58 billion, down 10% year over year. Free cash flow decreased 17% year over year to
€2.15 billion. The decrease in free cash flow was mainly due to higher tax payments and a currency headwind as well as increased
CapEx spending compared to the prior year. At the end of the first quarter, net liquidity was €546 million, an improvement of €1
billion year over year.
SAP S/4HANA
SAP’s next generation ERP S/4HANA sits at the core of the Intelligent Enterprise. With S/4HANA, customers can massively simplify
their IT landscape, turn real-time data into actions and reinvent their business model for the digital economy across every industry.
S/4HANA Cloud brings speed and ease of deployment. It is positioned as a leader in three cloud solution categories by industry
analyst firm IDC: Midmarket ERP, Large Enterprise ERP and Finance & Accounting.
S/4HANA adoption grew to more than 8,300 customers, up 43% year over year. In the first quarter, approximately 400 additional
customers signed up of which approximately 40% were net new. S/4HANA continues to be selected by world-class global
companies, including Swiss Post in the quarter. A growing number of our customers are now adopting S/4HANA in the Cloud.
MacMahon Holdings and Detecon International GmbH were among those who selected S/4HANA Cloud in the first quarter.
Customer Experience
SAP’s next generation customer experience solutions serve both B2C and B2B across a wide range of industries. They enable
businesses to manage their front office across the entire spectrum from marketing to sales to services – seamlessly and in real-
time. Businesses get a single view of their customer – across social, retail or e-commerce. In the age of heightened data privacy
concerns, SAP also offers Gigya, a market leading solution for customer identity and access management. Gigya software manages
customers’ profile, preference and consent, with customers maintaining control of their data at all times. On April 5th, 2018, SAP
closed the acquisition of Callidus Software Inc (CallidusCloud®). SAP will fuse its customer experience solutions and S/4HANA
fulfillment capabilities with CallidusCloud’s best-in-class Sales Performance Management (SPM) and Configure-Price-Quote (CPQ)
solutions to deliver the most complete, end-to-end, fully cloud-based ‘Lead-to-Cash’ offering. This will enable customers to close
deals faster, drive higher volume and bigger deals and accelerate sales productivity.
1 New cloud bookings is the total of all orders received in a given period the revenue from which is expected to be classified as cloud subscription and support revenue and that result from purchases by new customers and
from incremental purchases by existing customers. Consequently, orders to renew existing contracts are not included in this metric. The order amount must be committed. Consequently, due to their pay-per-use nature,
business network transaction fees which do not include a committed minimum consumption are not reflected in the bookings metric (e.g. SAP Ariba and SAP Fieldglass transaction-based fees). Amounts included in the
measures are generally annualized (annualized contract value ACV). 2 New cloud and software license order entry is the total of new cloud order entry and software license order entry. The new cloud order entry metric is identical to the new cloud bookings metric defined above except that it
considers the total contract value (TCV) of the orders where the new cloud bookings metric considers the orders’ annualized contract value (ACV). Software license order entry is the total of all orders received in a given period
the revenue from which is expected to be classified as software license revenue. The support services commonly sold with the software licenses are not included in the software license order entry metric.
SAP Q1 2018 Quarterly Statement 3
In the first quarter, SAP’s customer experience solutions achieved triple digit year-over-year growth in new cloud bookings. Jaguar
Land Rover, Coca-Cola, and Unilever were among those that chose SAP’s customer experience solutions this quarter.
Human Capital Management
With SAP SuccessFactors and SAP Fieldglass, SAP delivers total workforce management across both permanent and contingent
labor. Increasingly, HR is asked to include flexible workers in planning and to effectively establish a total talent supply. The SAP
SuccessFactors suite is localized for 91 countries and 42 languages. SAP SuccessFactors Employee Central, which is the core of
SAP’s HCM offering, ended the quarter with more than 2,400 customers and scored numerous competitive wins including
CaixaBank, Reckitt Benckiser Group plc, HiPP, San Francisco Unified School District. and Intesa Sanpaolo.
SAP Leonardo
SAP Leonardo is about orchestrating innovative capabilities to rapidly create completely new ways of working and new business
models. SAP Leonardo brings together deep process and industry expertise, advanced design thinking methodology and cutting
edge software capabilities such as IoT, Big Data, Machine Learning, Analytics, and Blockchain. All of this is integrated on the SAP
Cloud Platform with new technologies easily added as they emerge.
Airbus, DBS Informatik, and Thyssenkrupp are among many others that adopted SAP Leonardo solutions in the first quarter to
redefine their businesses and become intelligent enterprises.
Business Networks
SAP is fueling the Networked Economy. With more than $1.9 trillion3 in global commerce annually transacted in more than 180
countries, the SAP Business Network is the largest commerce platform in the world. Leveraging the collaborative commerce
capabilities of SAP Ariba, the flexible workforce management capabilities of SAP Fieldglass, effortless travel and expense processing
with SAP Concur and the real-time in memory capabilities of the SAP HANA® platform, the SAP Business Network orchestrates
commerce transactions across an entire value chain. It provides transparency and insight into supply chains that enable companies
to ensure they are acting in ethically responsible ways.
In the first quarter, total revenue in the SAP Business Network segment was up 17% to €663 million at constant currencies year over
year. Migros and Ralph Lauren chose SAP’s Business Network Solutions in the first quarter.
3 SAP Business Network commerce is the total commerce transacted on the Ariba, Concur and Fieldglass Networks in the trailing 12 months. Ariba commerce includes procurement and sourcing spend. Previously we only
included the total commerce transacted on the Ariba Network in this metric.
4 SAP Q1 2018 Quarterly Statement
Regional Revenue Performance in the First Quarter 2018
SAP had a solid performance in the EMEA region with cloud and software revenue increasing 6% (IFRS) and 9% (non-IFRS at
constant currencies). Cloud subscriptions and support revenue was very strong and grew by 40% (IFRS) and 45% (non-IFRS at
constant currencies) with Germany being a highlight. In addition, SAP had double-digit software revenue growth in the UK.
The Company had a strong performance in the Americas region with a significant currency headwind. Cloud and software revenue
decreased by 5% (IFRS) and increased by 10% (non-IFRS at constant currencies). Cloud subscriptions and support revenue
increased by 6% (IFRS) and 22% (non-IFRS at constant currencies) with Brazil being a highlight. In North America, the company had
double digit software revenue growth.
In the APJ region, SAP had a strong performance considering the strong prior year period and currency headwind. Cloud and
software revenue was flat (IFRS) and grew by 10% (non-IFRS at constant currencies). Cloud subscriptions and support revenue was
exceptional and grew by 38% (IFRS) and 53% (non-IFRS at constant currencies) with China and Japan being highlights. For
software revenue, Australia, China and India had an impressive quarter and grew by double digits.
SAP Q1 2018 Quarterly Statement 5
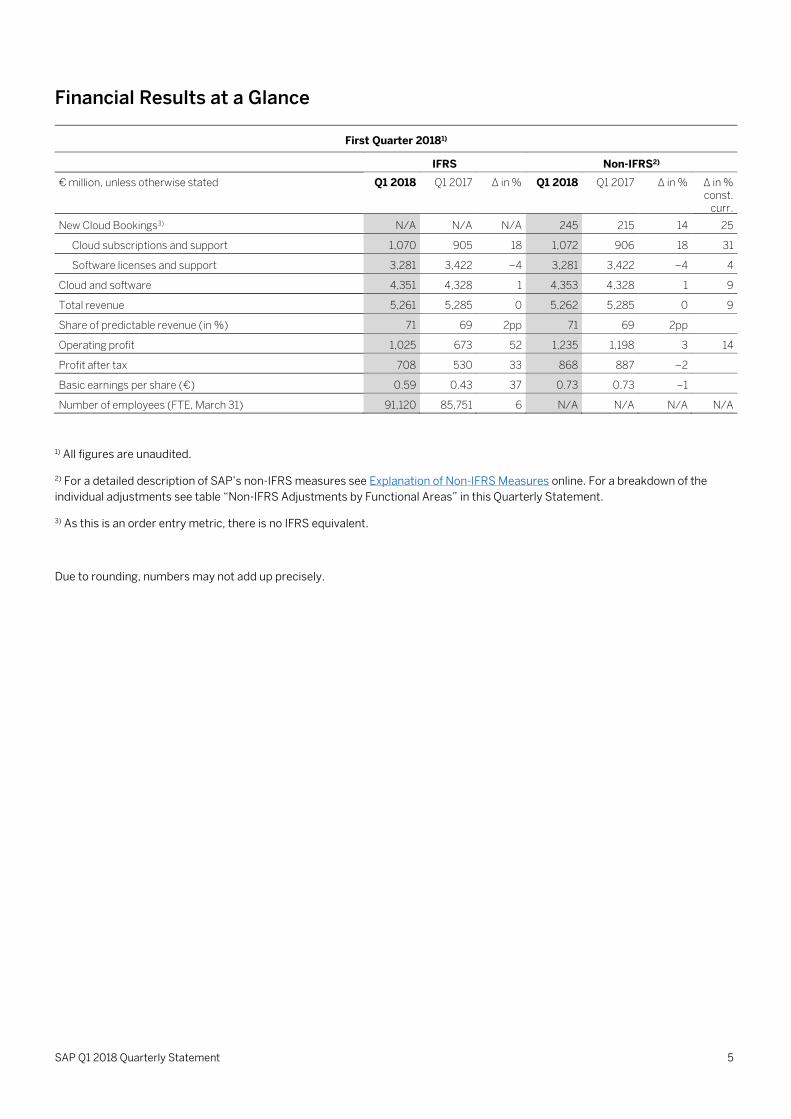
Financial Results at a Glance
First Quarter 20181)
IFRS Non-IFRS2)
€ million, unless otherwise stated Q1 2018 Q1 2017 ∆ in % Q1 2018 Q1 2017 ∆ in % ∆ in % const.
curr.
New Cloud Bookings3) N/A N/A N/A 245 215 14 25
Cloud subscriptions and support 1,070 905 18 1,072 906 18 31
Software licenses and support 3,281 3,422 –4 3,281 3,422 –4 4
Cloud and software 4,351 4,328 1 4,353 4,328 1 9
Total revenue 5,261 5,285 0 5,262 5,285 0 9
Share of predictable revenue (in %) 71 69 2pp 71 69 2pp
Operating profit 1,025 673 52 1,235 1,198 3 14
Profit after tax 708 530 33 868 887 –2
Basic earnings per share (€) 0.59 0.43 37 0.73 0.73 –1
Number of employees (FTE, March 31) 91,120 85,751 6 N/A N/A N/A N/A
1) All figures are unaudited.
2) For a detailed description of SAP’s non-IFRS measures see Explanation of Non-IFRS Measures online. For a breakdown of the
individual adjustments see table “Non-IFRS Adjustments by Functional Areas” in this Quarterly Statement.
3) As this is an order entry metric, there is no IFRS equivalent.
Due to rounding, numbers may not add up precisely.
6 SAP Q1 2018 Quarterly Statement
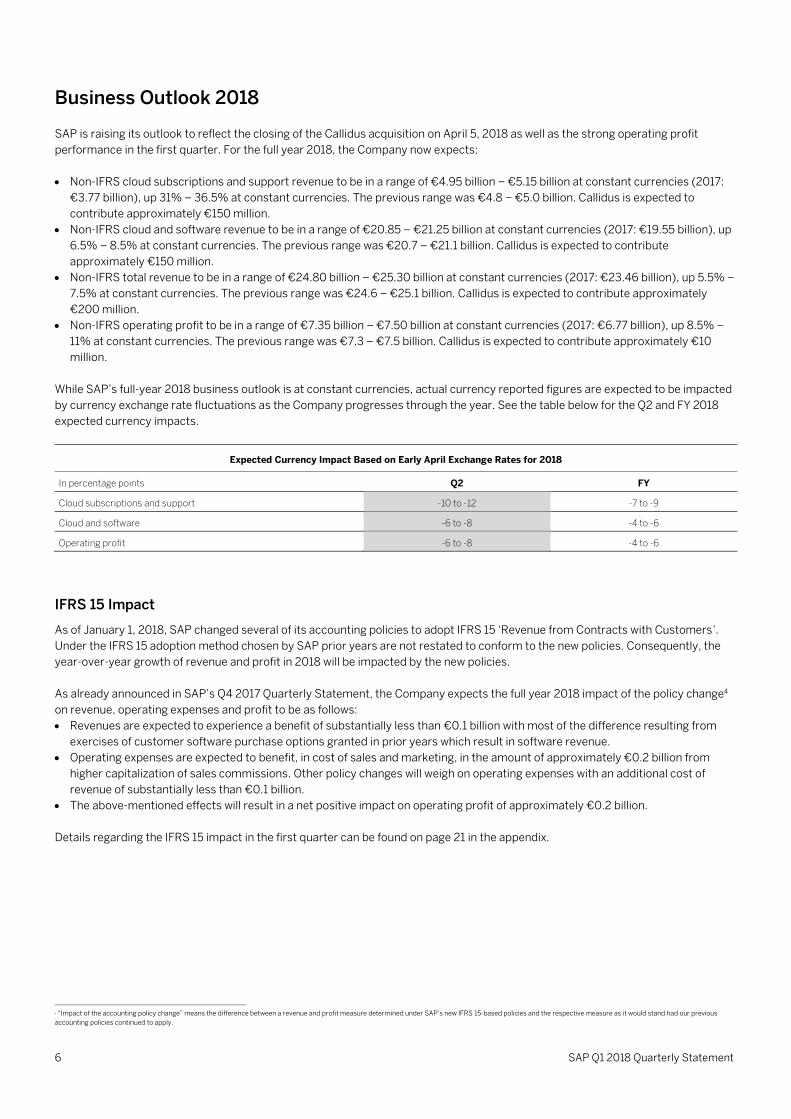
Business Outlook 2018
SAP is raising its outlook to reflect the closing of the Callidus acquisition on April 5, 2018 as well as the strong operating profit
performance in the first quarter. For the full year 2018, the Company now expects:
Non-IFRS cloud subscriptions and support revenue to be in a range of €4.95 billion − €5.15 billion at constant currencies (2017:
€3.77 billion), up 31% – 36.5% at constant currencies. The previous range was €4.8 − €5.0 billion. Callidus is expected to
contribute approximately €150 million.
Non-IFRS cloud and software revenue to be in a range of €20.85 – €21.25 billion at constant currencies (2017: €19.55 billion), up
6.5% – 8.5% at constant currencies. The previous range was €20.7 – €21.1 billion. Callidus is expected to contribute
approximately €150 million.
Non-IFRS total revenue to be in a range of €24.80 billion − €25.30 billion at constant currencies (2017: €23.46 billion), up 5.5% –
7.5% at constant currencies. The previous range was €24.6 – €25.1 billion. Callidus is expected to contribute approximately
€200 million.
Non-IFRS operating profit to be in a range of €7.35 billion − €7.50 billion at constant currencies (2017: €6.77 billion), up 8.5% –
11% at constant currencies. The previous range was €7.3 – €7.5 billion. Callidus is expected to contribute approximately €10
million.
While SAP’s full-year 2018 business outlook is at constant currencies, actual currency reported figures are expected to be impacted
by currency exchange rate fluctuations as the Company progresses through the year. See the table below for the Q2 and FY 2018
expected currency impacts.
Expected Currency Impact Based on Early April Exchange Rates for 2018
In percentage points Q2 FY
Cloud subscriptions and support -10 to -12 -7 to -9
Cloud and software -6 to -8 -4 to -6
Operating profit -6 to -8 -4 to -6
IFRS 15 Impact
As of January 1, 2018, SAP changed several of its accounting policies to adopt IFRS 15 ‘Revenue from Contracts with Customers’.
Under the IFRS 15 adoption method chosen by SAP prior years are not restated to conform to the new policies. Consequently, the
year-over-year growth of revenue and profit in 2018 will be impacted by the new policies.
As already announced in SAP’s Q4 2017 Quarterly Statement, the Company expects the full year 2018 impact of the policy change4
on revenue, operating expenses and profit to be as follows:
Revenues are expected to experience a benefit of substantially less than €0.1 billion with most of the difference resulting from
exercises of customer software purchase options granted in prior years which result in software revenue.
Operating expenses are expected to benefit, in cost of sales and marketing, in the amount of approximately €0.2 billion from
higher capitalization of sales commissions. Other policy changes will weigh on operating expenses with an additional cost of
revenue of substantially less than €0.1 billion.
The above-mentioned effects will result in a net positive impact on operating profit of approximately €0.2 billion.
Details regarding the IFRS 15 impact in the first quarter can be found on page 21 in the appendix.
4 “Impact of the accounting policy change” means the difference between a revenue and profit measure determined under SAP’s new IFRS 15-based policies and the respective measure as it would stand had our previous
accounting policies continued to apply.
SAP Q1 2018 Quarterly Statement 7
Additional Information
For a more detailed description of all of SAP’s non-IFRS measures and their limitations as well as our constant currency and free
cash flow figures see Explanation of Non-IFRS Measures online.
Webcast SAP senior management will host a financial analyst conference call at 2:00 PM (CET) / 1:00 PM (GMT) / 8:00 AM (Eastern) / 5:00 AM (Pacific). The call will be webcast live on the Company’s website at www.sap.com/investor and will be available for replay. Supplementary financial information pertaining to the first quarter results can be found at www.sap.com/investor.
About SAP As market leader in enterprise application software, SAP (NYSE: SAP) helps companies of all sizes and industries run better. From
back office to boardroom, warehouse to storefront, desktop to mobile device – SAP empowers people and organizations to work
together more efficiently and use business insight more effectively to stay ahead of the competition. SAP applications and services
enable more than 388,000 business and public sector customers to operate profitably, adapt continuously, and grow sustainably.
For more information, visit www.sap.com.
For more information, financial community only: Stefan Gruber +49 (6227) 7-44872 [email protected], CET
Follow SAP Investor Relations on Twitter at @sapinvestor.
For more information, press only: Rajiv Sekhri +49 (6227) 7-74871 [email protected], CET
Daniel Reinhardt +49 (6227) 7-40201 [email protected], CET
For customers interested in learning more about SAP products: Global Customer Center: +49 180 534-34-24
United States Only: +1 (800) 872-1SAP (+1-800-872-1727)
Note to editors: To preview and download broadcast-standard stock footage and press photos digitally, please visit www.sap.com/photos. On this
platform, you can find high resolution material for your media channels. To view video stories on diverse topics, visit www.sap-
tv.com. From this site, you can embed videos into your own Web pages, share video via e-mail links and subscribe to RSS feeds from
SAP TV.
8 SAP Q1 2018 Quarterly Statement
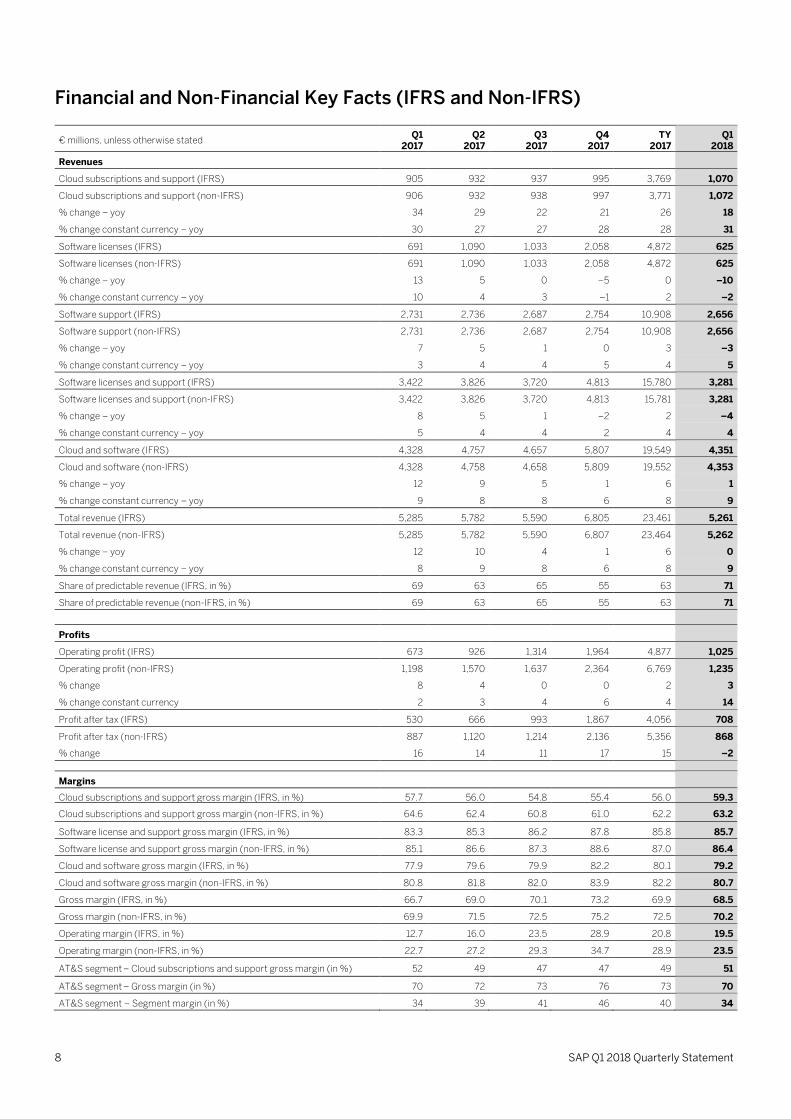
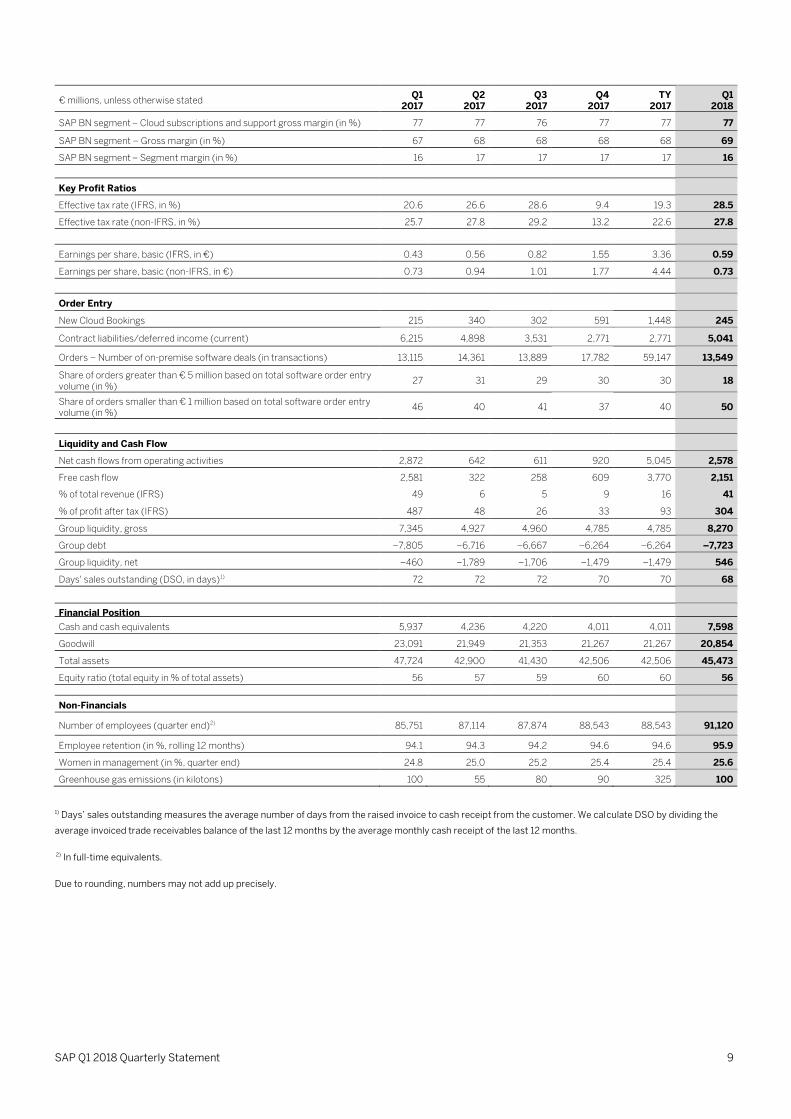
Financial and Non-Financial Key Facts (IFRS and Non-IFRS)
€ millions, unless otherwise stated Q1
2017 Q2
2017 Q3
2017 Q4
2017 TY
2017 Q1
2018
Revenues
Cloud subscriptions and support (IFRS) 905 932 937 995 3,769 1,070
Cloud subscriptions and support (non-IFRS) 906 932 938 997 3,771 1,072
% change – yoy 34 29 22 21 26 18
% change constant currency – yoy 30 27 27 28 28 31
Software licenses (IFRS) 691 1,090 1,033 2,058 4,872 625
Software licenses (non-IFRS) 691 1,090 1,033 2,058 4,872 625
% change – yoy 13 5 0 –5 0 –10
% change constant currency – yoy 10 4 3 –1 2 –2
Software support (IFRS) 2,731 2,736 2,687 2,754 10,908 2,656
Software support (non-IFRS) 2,731 2,736 2,687 2,754 10,908 2,656
% change – yoy 7 5 1 0 3 –3
% change constant currency – yoy 3 4 4 5 4 5
Software licenses and support (IFRS) 3,422 3,826 3,720 4,813 15,780 3,281
Software licenses and support (non-IFRS) 3,422 3,826 3,720 4,813 15,781 3,281
% change – yoy 8 5 1 –2 2 –4
% change constant currency – yoy 5 4 4 2 4 4
Cloud and software (IFRS) 4,328 4,757 4,657 5,807 19,549 4,351
Cloud and software (non-IFRS) 4,328 4,758 4,658 5,809 19,552 4,353
% change – yoy 12 9 5 1 6 1
% change constant currency – yoy 9 8 8 6 8 9
Total revenue (IFRS) 5,285 5,782 5,590 6,805 23,461 5,261
Total revenue (non-IFRS) 5,285 5,782 5,590 6,807 23,464 5,262
% change – yoy 12 10 4 1 6 0
% change constant currency – yoy 8 9 8 6 8 9
Share of predictable revenue (IFRS, in %) 69 63 65 55 63 71
Share of predictable revenue (non-IFRS, in %) 69 63 65 55 63 71
Profits
Operating profit (IFRS) 673 926 1,314 1,964 4,877 1,025
Operating profit (non-IFRS) 1,198 1,570 1,637 2,364 6,769 1,235
% change 8 4 0 0 2 3
% change constant currency 2 3 4 6 4 14
Profit after tax (IFRS) 530 666 993 1,867 4,056 708
Profit after tax (non-IFRS) 887 1,120 1,214 2,136 5,356 868
% change 16 14 11 17 15 –2
Margins
Cloud subscriptions and support gross margin (IFRS, in %) 57.7 56.0 54.8 55.4 56.0 59.3
Cloud subscriptions and support gross margin (non-IFRS, in %) 64.6 62.4 60.8 61.0 62.2 63.2
Software license and support gross margin (IFRS, in %) 83.3 85.3 86.2 87.8 85.8 85.7
Software license and support gross margin (non-IFRS, in %) 85.1 86.6 87.3 88.6 87.0 86.4
Cloud and software gross margin (IFRS, in %) 77.9 79.6 79.9 82.2 80.1 79.2
Cloud and software gross margin (non-IFRS, in %) 80.8 81.8 82.0 83.9 82.2 80.7
Gross margin (IFRS, in %) 66.7 69.0 70.1 73.2 69.9 68.5
Gross margin (non-IFRS, in %) 69.9 71.5 72.5 75.2 72.5 70.2
Operating margin (IFRS, in %) 12.7 16.0 23.5 28.9 20.8 19.5
Operating margin (non-IFRS, in %) 22.7 27.2 29.3 34.7 28.9 23.5
AT&S segment – Cloud subscriptions and support gross margin (in %) 52 49 47 47 49 51
AT&S segment – Gross margin (in %) 70 72 73 76 73 70
AT&S segment – Segment margin (in %) 34 39 41 46 40 34
SAP Q1 2018 Quarterly Statement 9
€ millions, unless otherwise stated Q1
2017 Q2
2017 Q3
2017 Q4
2017 TY
2017 Q1
2018
SAP BN segment – Cloud subscriptions and support gross margin (in %) 77 77 76 77 77 77
SAP BN segment – Gross margin (in %) 67 68 68 68 68 69
SAP BN segment – Segment margin (in %) 16 17 17 17 17 16
Key Profit Ratios
Effective tax rate (IFRS, in %) 20.6 26.6 28.6 9.4 19.3 28.5
Effective tax rate (non-IFRS, in %) 25.7 27.8 29.2 13.2 22.6 27.8
Earnings per share, basic (IFRS, in €) 0.43 0.56 0.82 1.55 3.36 0.59
Earnings per share, basic (non-IFRS, in €) 0.73 0.94 1.01 1.77 4.44 0.73
Order Entry
New Cloud Bookings 215 340 302 591 1,448 245
Contract liabilities/deferred income (current) 6,215 4,898 3,531 2,771 2,771 5,041
Orders – Number of on-premise software deals (in transactions) 13,115 14,361 13,889 17,782 59,147 13,549
Share of orders greater than € 5 million based on total software order entry volume (in %)
27 31 29 30 30 18
Share of orders smaller than € 1 million based on total software order entry volume (in %)
46 40 41 37 40 50
Liquidity and Cash Flow
Net cash flows from operating activities 2,872 642 611 920 5,045 2,578
Free cash flow 2,581 322 258 609 3,770 2,151
% of total revenue (IFRS) 49 6 5 9 16 41
% of profit after tax (IFRS) 487 48 26 33 93 304
Group liquidity, gross 7,345 4,927 4,960 4,785 4,785 8,270
Group debt –7,805 –6,716 –6,667 –6,264 –6,264 –7,723
Group liquidity, net –460 –1,789 –1,706 –1,479 –1,479 546
Days' sales outstanding (DSO, in days)1) 72 72 72 70 70 68
Financial Position
Cash and cash equivalents 5,937 4,236 4,220 4,011 4,011 7,598
Goodwill 23,091 21,949 21,353 21,267 21,267 20,854
Total assets 47,724 42,900 41,430 42,506 42,506 45,473
Equity ratio (total equity in % of total assets) 56 57 59 60 60 56
Non-Financials
Number of employees (quarter end)2) 85,751 87,114 87,874 88,543 88,543 91,120
Employee retention (in %, rolling 12 months) 94.1 94.3 94.2 94.6 94.6 95.9
Women in management (in %, quarter end) 24.8 25.0 25.2 25.4 25.4 25.6
Greenhouse gas emissions (in kilotons) 100 55 80 90 325 100
1) Days’ sales outstanding measures the average number of days from the raised invoice to cash receipt from the customer. We calculate DSO by dividing the
average invoiced trade receivables balance of the last 12 months by the average monthly cash receipt of the last 12 months.
2) In full-time equivalents.
Due to rounding, numbers may not add up precisely.
10 SAP Q1 2018 Quarterly Statement
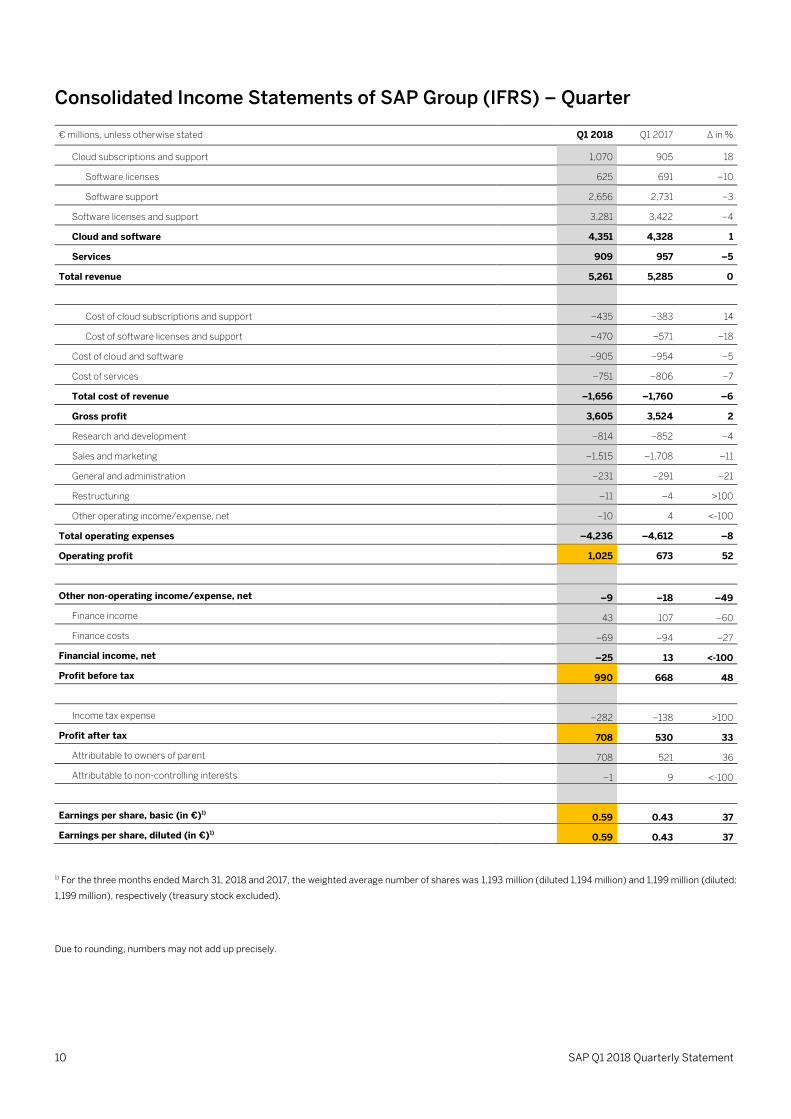
Consolidated Income Statements of SAP Group (IFRS) – Quarter
€ millions, unless otherwise stated Q1 2018 Q1 2017 ∆ in %
Cloud subscriptions and support 1,070 905 18
Software licenses 625 691 –10
Software support 2,656 2,731 –3
Software licenses and support 3,281 3,422 –4
Cloud and software 4,351 4,328 1
Services 909 957 –5
Total revenue 5,261 5,285 0
Cost of cloud subscriptions and support –435 –383 14
Cost of software licenses and support –470 –571 –18
Cost of cloud and software –905 –954 –5
Cost of services –751 –806 –7
Total cost of revenue –1,656 –1,760 –6
Gross profit 3,605 3,524 2
Research and development –814 –852 –4
Sales and marketing –1,515 –1,708 –11
General and administration –231 –291 –21
Restructuring –11 –4 >100
Other operating income/expense, net –10 4 <-100
Total operating expenses –4,236 –4,612 –8
Operating profit 1,025 673 52
Other non-operating income/expense, net –9 –18 –49
Finance income 43 107 –60
Finance costs –69 –94 –27
Financial income, net –25 13 <-100
Profit before tax 990 668 48
Income tax expense –282 –138 >100
Profit after tax 708 530 33
Attributable to owners of parent 708 521 36
Attributable to non-controlling interests –1 9 <-100
Earnings per share, basic (in €)1) 0.59 0.43 37
Earnings per share, diluted (in €)1) 0.59 0.43 37
1) For the three months ended March 31, 2018 and 2017, the weighted average number of shares was 1,193 million (diluted 1,194 million) and 1,199 million (diluted:
1,199 million), respectively (treasury stock excluded).
Due to rounding, numbers may not add up precisely.
SAP Q1 2018 Quarterly Statement 11
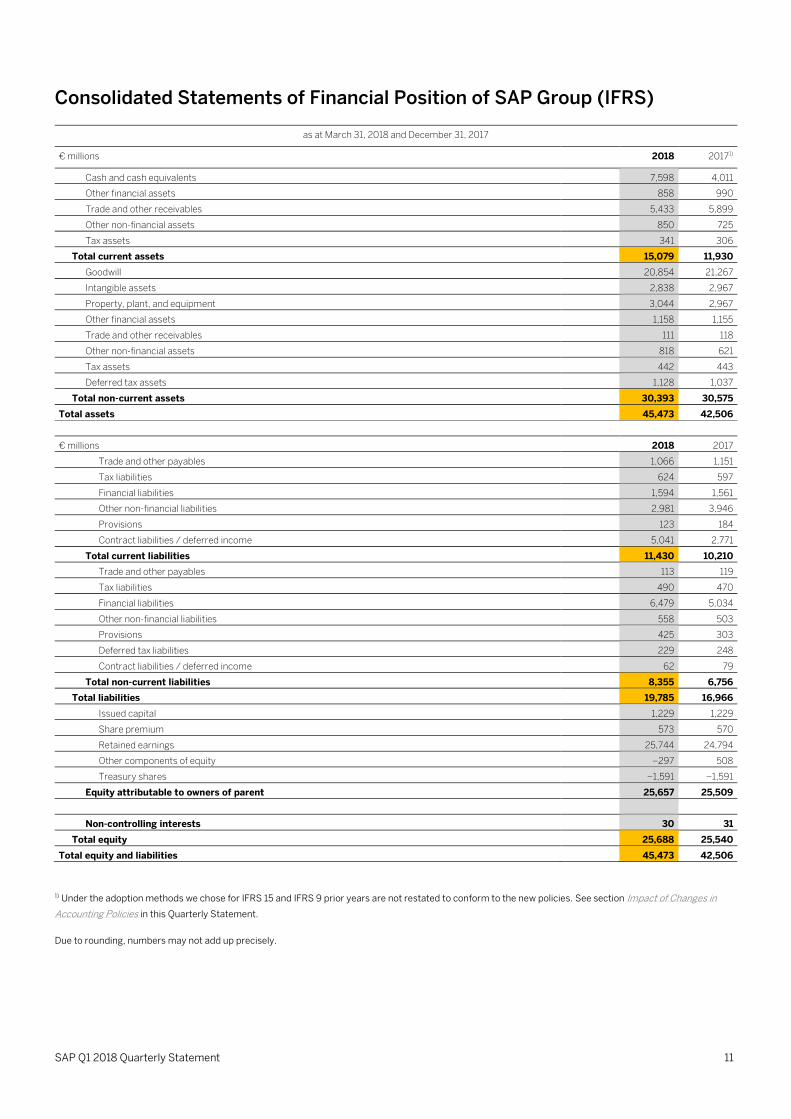
Consolidated Statements of Financial Position of SAP Group (IFRS)
as at March 31, 2018 and December 31, 2017
€ millions 2018 20171)
Cash and cash equivalents 7,598 4,011
Other financial assets 858 990
Trade and other receivables 5,433 5,899
Other non-financial assets 850 725
Tax assets 341 306
Total current assets 15,079 11,930
Goodwill 20,854 21,267
Intangible assets 2,838 2,967
Property, plant, and equipment 3,044 2,967
Other financial assets 1,158 1,155
Trade and other receivables 111 118
Other non-financial assets 818 621
Tax assets 442 443
Deferred tax assets 1,128 1,037
Total non-current assets 30,393 30,575
Total assets 45,473 42,506
€ millions 2018 2017
Trade and other payables 1,066 1,151
Tax liabilities 624 597
Financial liabilities 1,594 1,561
Other non-financial liabilities 2,981 3,946
Provisions 123 184
Contract liabilities / deferred income 5,041 2,771
Total current liabilities 11,430 10,210
Trade and other payables 113 119
Tax liabilities 490 470
Financial liabilities 6,479 5,034
Other non-financial liabilities 558 503
Provisions 425 303
Deferred tax liabilities 229 248
Contract liabilities / deferred income 62 79
Total non-current liabilities 8,355 6,756
Total liabilities 19,785 16,966
Issued capital 1,229 1,229
Share premium 573 570
Retained earnings 25,744 24,794
Other components of equity –297 508
Treasury shares –1,591 –1,591
Equity attributable to owners of parent 25,657 25,509
Non-controlling interests 30 31
Total equity 25,688 25,540
Total equity and liabilities 45,473 42,506
1) Under the adoption methods we chose for IFRS 15 and IFRS 9 prior years are not restated to conform to the new policies. See section Impact of Changes in
Accounting Policies in this Quarterly Statement.
Due to rounding, numbers may not add up precisely.
12 SAP Q1 2018 Quarterly Statement
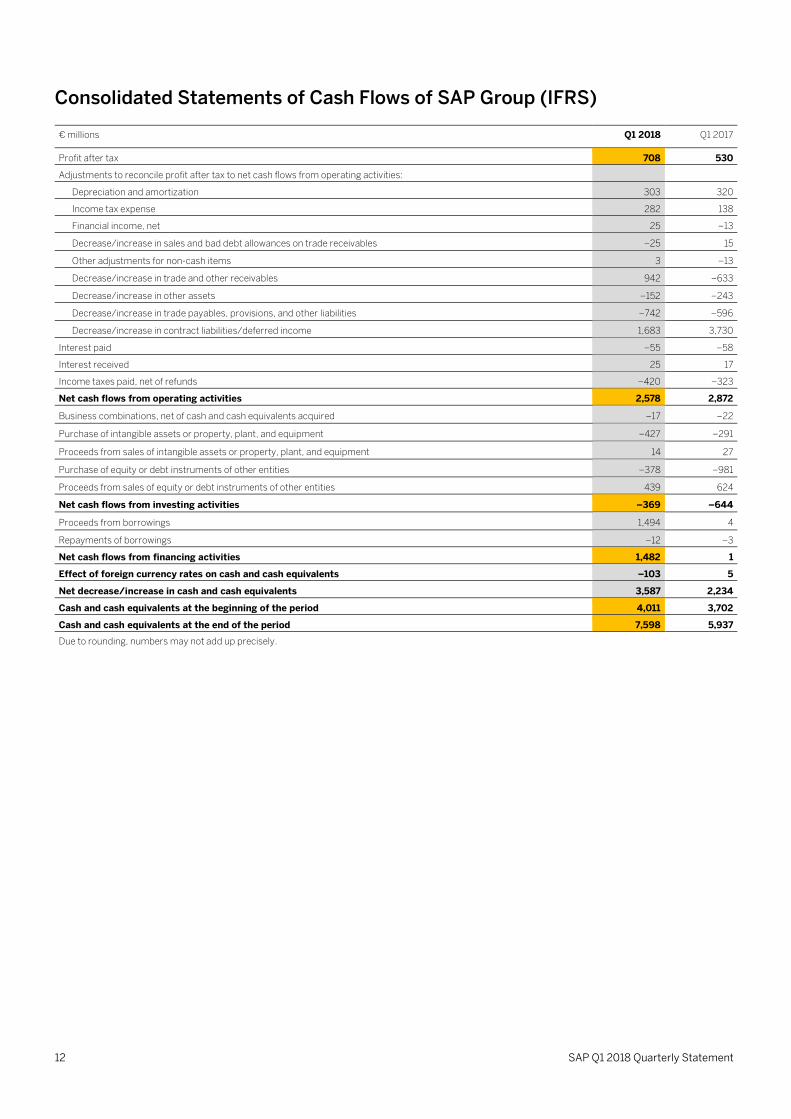
Consolidated Statements of Cash Flows of SAP Group (IFRS)
€ millions Q1 2018 Q1 2017
Profit after tax 708 530
Adjustments to reconcile profit after tax to net cash flows from operating activities:
Depreciation and amortization 303 320
Income tax expense 282 138
Financial income, net 25 –13
Decrease/increase in sales and bad debt allowances on trade receivables –25 15
Other adjustments for non-cash items 3 –13
Decrease/increase in trade and other receivables 942 –633
Decrease/increase in other assets –152 –243
Decrease/increase in trade payables, provisions, and other liabilities –742 –596
Decrease/increase in contract liabilities/deferred income 1,683 3,730
Interest paid –55 –58
Interest received 25 17
Income taxes paid, net of refunds –420 –323
Net cash flows from operating activities 2,578 2,872
Business combinations, net of cash and cash equivalents acquired –17 –22
Purchase of intangible assets or property, plant, and equipment –427 –291
Proceeds from sales of intangible assets or property, plant, and equipment 14 27
Purchase of equity or debt instruments of other entities –378 –981
Proceeds from sales of equity or debt instruments of other entities 439 624
Net cash flows from investing activities –369 –644
Proceeds from borrowings 1,494 4
Repayments of borrowings –12 –3
Net cash flows from financing activities 1,482 1
Effect of foreign currency rates on cash and cash equivalents –103 5
Net decrease/increase in cash and cash equivalents 3,587 2,234
Cash and cash equivalents at the beginning of the period 4,011 3,702
Cash and cash equivalents at the end of the period 7,598 5,937
Due to rounding, numbers may not add up precisely.
SAP Q1 2018 Quarterly Statement 13
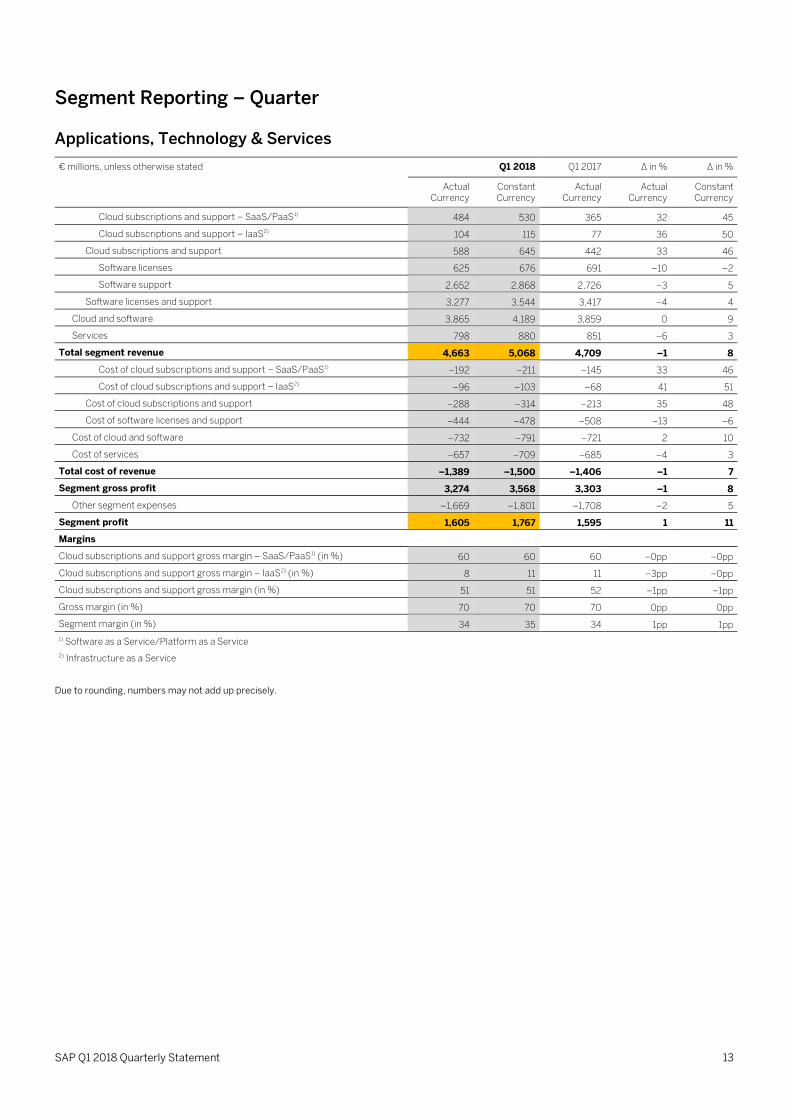
Segment Reporting – Quarter
Applications, Technology & Services
€ millions, unless otherwise stated Q1 2018 Q1 2017 ∆ in % ∆ in %
Actual Currency
Constant Currency
Actual Currency
Actual Currency
Constant Currency
Cloud subscriptions and support – SaaS/PaaS1) 484 530 365 32 45
Cloud subscriptions and support – IaaS2) 104 115 77 36 50
Cloud subscriptions and support 588 645 442 33 46
Software licenses 625 676 691 –10 –2
Software support 2,652 2,868 2,726 –3 5
Software licenses and support 3,277 3,544 3,417 –4 4
Cloud and software 3,865 4,189 3,859 0 9
Services 798 880 851 –6 3
Total segment revenue 4,663 5,068 4,709 –1 8
Cost of cloud subscriptions and support – SaaS/PaaS1) –192 –211 –145 33 46
Cost of cloud subscriptions and support – IaaS2) –96 –103 –68 41 51
Cost of cloud subscriptions and support –288 –314 –213 35 48
Cost of software licenses and support –444 –478 –508 –13 –6
Cost of cloud and software –732 –791 –721 2 10
Cost of services –657 –709 –685 –4 3
Total cost of revenue –1,389 –1,500 –1,406 –1 7
Segment gross profit 3,274 3,568 3,303 –1 8
Other segment expenses –1,669 –1,801 –1,708 –2 5
Segment profit 1,605 1,767 1,595 1 11
Margins
Cloud subscriptions and support gross margin – SaaS/PaaS1) (in %) 60 60 60 –0pp –0pp
Cloud subscriptions and support gross margin – IaaS2) (in %) 8 11 11 –3pp –0pp
Cloud subscriptions and support gross margin (in %) 51 51 52 –1pp –1pp
Gross margin (in %) 70 70 70 0pp 0pp
Segment margin (in %) 34 35 34 1pp 1pp
1) Software as a Service/Platform as a Service 2) Infrastructure as a Service
Due to rounding, numbers may not add up precisely.

14 SAP Q1 2018 Quarterly Statement
SAP Business Network
€ millions, unless otherwise stated Q1 2018 Q1 2017 ∆ in % ∆ in %
Actual Currency
Constant Currency
Actual Currency
Actual Currency
Constant Currency
Cloud subscriptions and support – SaaS/PaaS1) 483 543 464 4 17
Cloud subscriptions and support – IaaS2) 0 0 0 NA NA
Cloud subscriptions and support 483 543 464 4 17
Software licenses 0 0 0 NA NA
Software support 4 4 6 –33 –23
Software licenses and support 4 4 6 –33 –23
Cloud and software 487 548 469 4 17
Services 103 116 98 5 18
Total segment revenue 590 663 567 4 17
Cost of cloud subscriptions and support – SaaS/PaaS1) –110 –123 –107 2 15
Cost of cloud subscriptions and support – IaaS2) 0 0 0 NA NA
Cost of cloud subscriptions and support –110 –123 –107 2 15
Cost of software licenses and support –2 –2 –1 >100 >100
Cost of cloud and software –111 –125 –108 3 16
Cost of services –74 –82 –77 –3 7
Total cost of revenue –186 –207 –184 1 12
Segment gross profit 404 456 383 6 19
Other segment expenses –308 –345 –291 6 18
Segment profit 97 111 92 5 21
Margins
Cloud subscriptions and support gross margin – SaaS/PaaS1) (in %) 77 77 77 0pp 0pp
Cloud subscriptions and support gross margin – IaaS2) (in %) NA NA NA NA NA
Cloud subscriptions and support gross margin (in %) 77 77 77 0pp 0pp
Gross margin (in %) 69 69 67 1pp 1pp
Segment margin (in %) 16 17 16 0pp 1pp
1) Software as a Service/Platform as a Service 2) Infrastructure as a Service
Due to rounding, numbers may not add up precisely.
SAP Q1 2018 Quarterly Statement 15
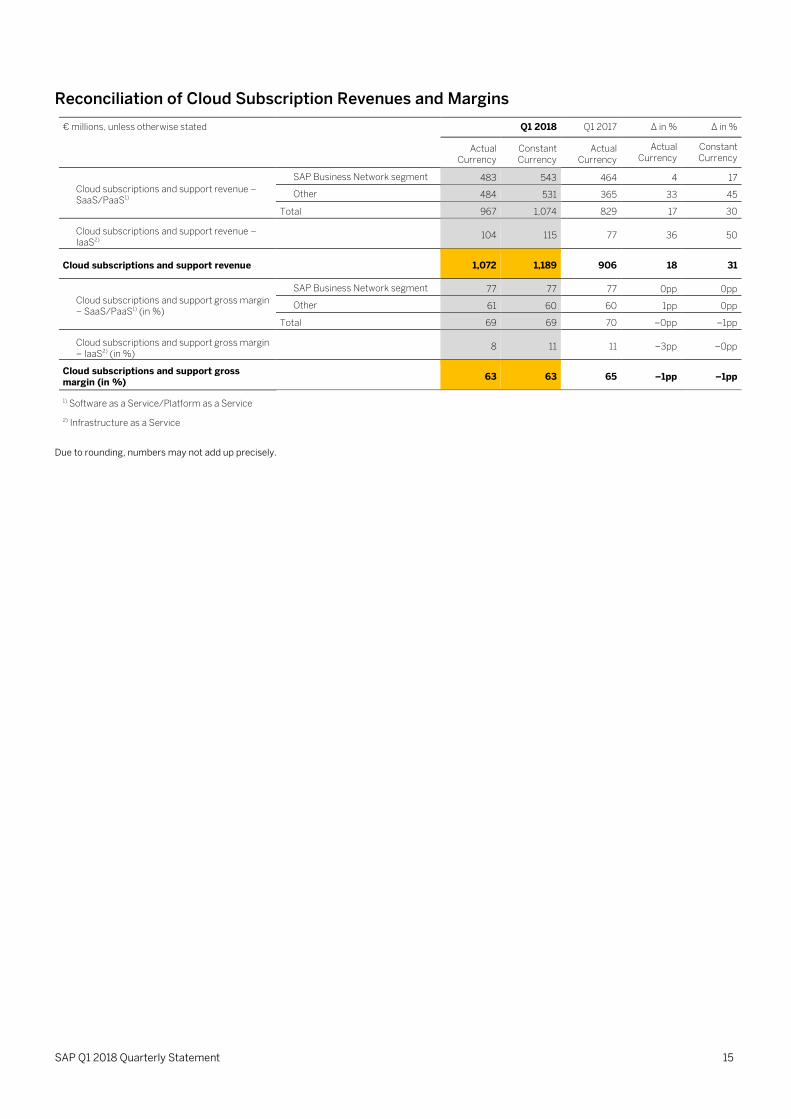
Reconciliation of Cloud Subscription Revenues and Margins
€ millions, unless otherwise stated Q1 2018 Q1 2017 ∆ in % ∆ in %
Actual
Currency Constant Currency
Actual Currency
Actual Currency
Constant Currency
Cloud subscriptions and support revenue – SaaS/PaaS1)
SAP Business Network segment 483 543 464 4 17
Other 484 531 365 33 45
Total 967 1,074 829 17 30
Cloud subscriptions and support revenue – IaaS2)
104 115 77 36 50
Cloud subscriptions and support revenue 1,072 1,189 906 18 31
Cloud subscriptions and support gross margin – SaaS/PaaS1) (in %)
SAP Business Network segment 77 77 77 0pp 0pp
Other 61 60 60 1pp 0pp
Total 69 69 70 –0pp –1pp
Cloud subscriptions and support gross margin – IaaS2) (in %)
8 11 11 –3pp –0pp
Cloud subscriptions and support gross margin (in %)
63 63 65 –1pp –1pp
1) Software as a Service/Platform as a Service 2) Infrastructure as a Service
Due to rounding, numbers may not add up precisely.
16 SAP Q1 2018 Quarterly Statement
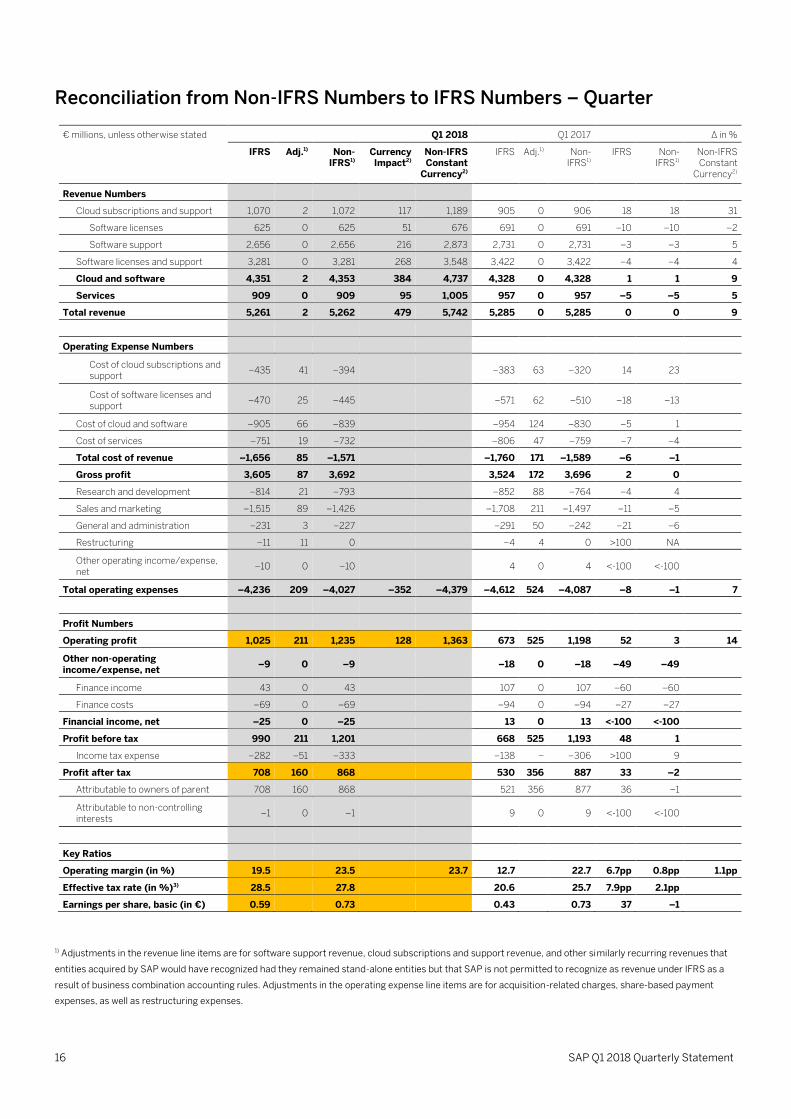
Reconciliation from Non-IFRS Numbers to IFRS Numbers – Quarter
€ millions, unless otherwise stated Q1 2018 Q1 2017 ∆ in %
IFRS Adj.1) Non-IFRS1)
Currency Impact2)
Non-IFRS Constant
Currency2)
IFRS Adj.1) Non-IFRS1)
IFRS Non-IFRS1)
Non-IFRS Constant
Currency2)
Revenue Numbers
Cloud subscriptions and support 1,070 2 1,072 117 1,189 905 0 906 18 18 31
Software licenses 625 0 625 51 676 691 0 691 –10 –10 –2
Software support 2,656 0 2,656 216 2,873 2,731 0 2,731 –3 –3 5
Software licenses and support 3,281 0 3,281 268 3,548 3,422 0 3,422 –4 –4 4
Cloud and software 4,351 2 4,353 384 4,737 4,328 0 4,328 1 1 9
Services 909 0 909 95 1,005 957 0 957 –5 –5 5
Total revenue 5,261 2 5,262 479 5,742 5,285 0 5,285 0 0 9
Operating Expense Numbers
Cost of cloud subscriptions and support
–435 41 –394 –383 63 –320 14 23
Cost of software licenses and support
–470 25 –445 –571 62 –510 –18 –13
Cost of cloud and software –905 66 –839 –954 124 –830 –5 1
Cost of services –751 19 –732 –806 47 –759 –7 –4
Total cost of revenue –1,656 85 –1,571 –1,760 171 –1,589 –6 –1
Gross profit 3,605 87 3,692 3,524 172 3,696 2 0
Research and development –814 21 –793 –852 88 –764 –4 4
Sales and marketing –1,515 89 –1,426 –1,708 211 –1,497 –11 –5
General and administration –231 3 –227 –291 50 –242 –21 –6
Restructuring –11 11 0 –4 4 0 >100 NA
Other operating income/expense, net
–10 0 –10 4 0 4 <-100 <-100
Total operating expenses –4,236 209 –4,027 –352 –4,379 –4,612 524 –4,087 –8 –1 7
Profit Numbers
Operating profit 1,025 211 1,235 128 1,363 673 525 1,198 52 3 14
Other non-operating income/expense, net
–9 0 –9 –18 0 –18 –49 –49
Finance income 43 0 43 107 0 107 –60 –60
Finance costs –69 0 –69 –94 0 –94 –27 –27
Financial income, net –25 0 –25 13 0 13 <-100 <-100
Profit before tax 990 211 1,201 668 525 1,193 48 1
Income tax expense –282 –51 –333 –138 –168
–306 >100 9
Profit after tax 708 160 868 530 356 887 33 –2
Attributable to owners of parent 708 160 868 521 356 877 36 –1
Attributable to non-controlling interests
–1 0 –1 9 0 9 <-100 <-100
Key Ratios
Operating margin (in %) 19.5 23.5 23.7 12.7 22.7 6.7pp 0.8pp 1.1pp
Effective tax rate (in %)3) 28.5 27.8 20.6 25.7 7.9pp 2.1pp
Earnings per share, basic (in €) 0.59 0.73 0.43 0.73 37 –1
1) Adjustments in the revenue line items are for software support revenue, cloud subscriptions and support revenue, and other similarly recurring revenues that
entities acquired by SAP would have recognized had they remained stand-alone entities but that SAP is not permitted to recognize as revenue under IFRS as a
result of business combination accounting rules. Adjustments in the operating expense line items are for acquisition-related charges, share-based payment
expenses, as well as restructuring expenses.
SAP Q1 2018 Quarterly Statement 17
2) Constant currency revenue and operating income figures are calculated by translating revenue and operating income of the current period using the average
exchange rates from the previous year's respective period instead of the current period. Constant currency period-over-period changes are calculated by
comparing the current year's non-IFRS constant currency numbers with the non-IFRS number of the previous year's respective period.
For a more detailed description of these adjustments and their limitations as well as our constant currency figures, see Explanation of Non-IFRS Measures.
3) The difference between our effective tax rate (IFRS) and effective tax rate (non-IFRS) in Q1 2018 and Q1 2017 mainly results from tax effects of acquisition-
related charges and share-based payment expenses.
Due to rounding, numbers may not add up precisely.
18 SAP Q1 2018 Quarterly Statement
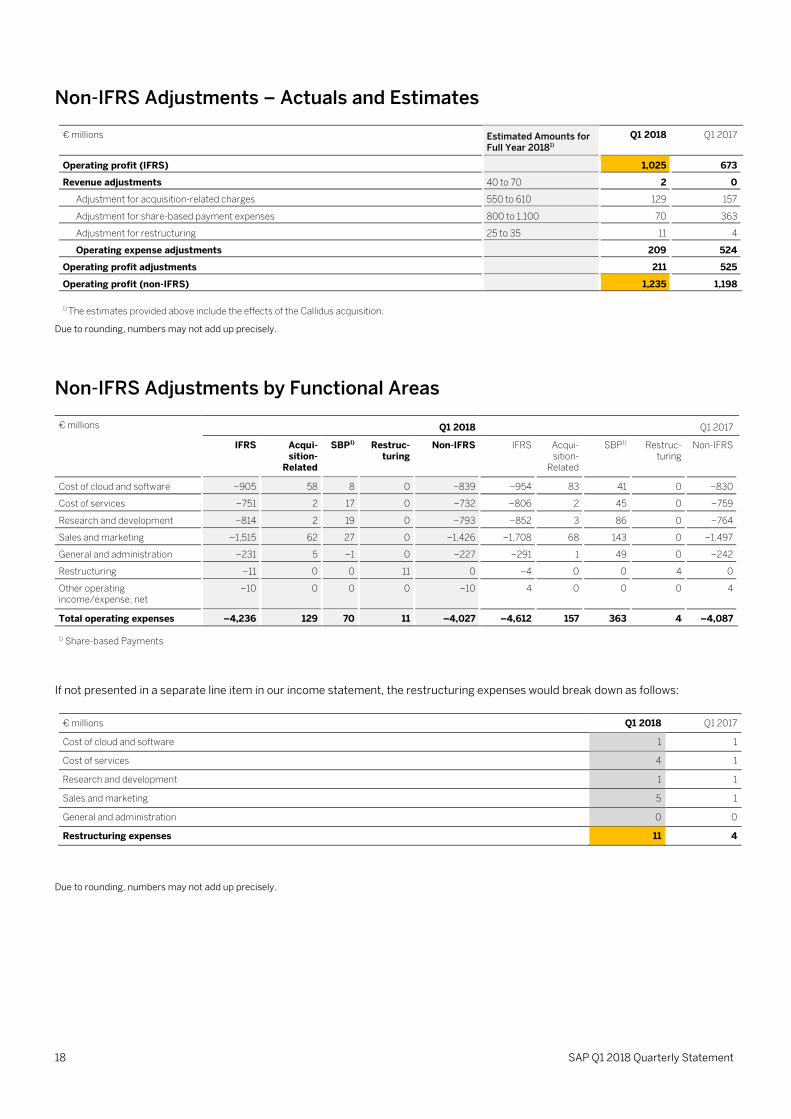
Non-IFRS Adjustments – Actuals and Estimates
€ millions Estimated Amounts for Full Year 20181)
Q1 2018 Q1 2017
Operating profit (IFRS) 1,025 673
Revenue adjustments 40 to 70 2 0
Adjustment for acquisition-related charges 550 to 610 129 157
Adjustment for share-based payment expenses 800 to 1,100 70 363
Adjustment for restructuring 25 to 35 11 4
Operating expense adjustments 209 524
Operating profit adjustments 211 525
Operating profit (non-IFRS) 1,235 1,198
1) The estimates provided above include the effects of the Callidus acquisition.
Due to rounding, numbers may not add up precisely.
Non-IFRS Adjustments by Functional Areas
€ millions Q1 2018 Q1 2017
IFRS Acqui-sition-
Related
SBP1) Restruc-turing
Non-IFRS IFRS Acqui- sition-
Related
SBP1) Restruc-turing
Non-IFRS
Cost of cloud and software –905 58 8 0 –839 –954 83 41 0 –830
Cost of services –751 2 17 0 –732 –806 2 45 0 –759
Research and development –814 2 19 0 –793 –852 3 86 0 –764
Sales and marketing –1,515 62 27 0 –1,426 –1,708 68 143 0 –1,497
General and administration –231 5 –1 0 –227 –291 1 49 0 –242
Restructuring –11 0 0 11 0 –4 0 0 4 0
Other operating income/expense, net
–10 0 0 0 –10 4 0 0 0 4
Total operating expenses –4,236 129 70 11 –4,027 –4,612 157 363 4 –4,087
1) Share-based Payments
If not presented in a separate line item in our income statement, the restructuring expenses would break down as follows:
€ millions Q1 2018 Q1 2017
Cost of cloud and software 1 1
Cost of services 4 1
Research and development 1 1
Sales and marketing 5 1
General and administration 0 0
Restructuring expenses 11 4
Due to rounding, numbers may not add up precisely.
SAP Q1 2018 Quarterly Statement 19
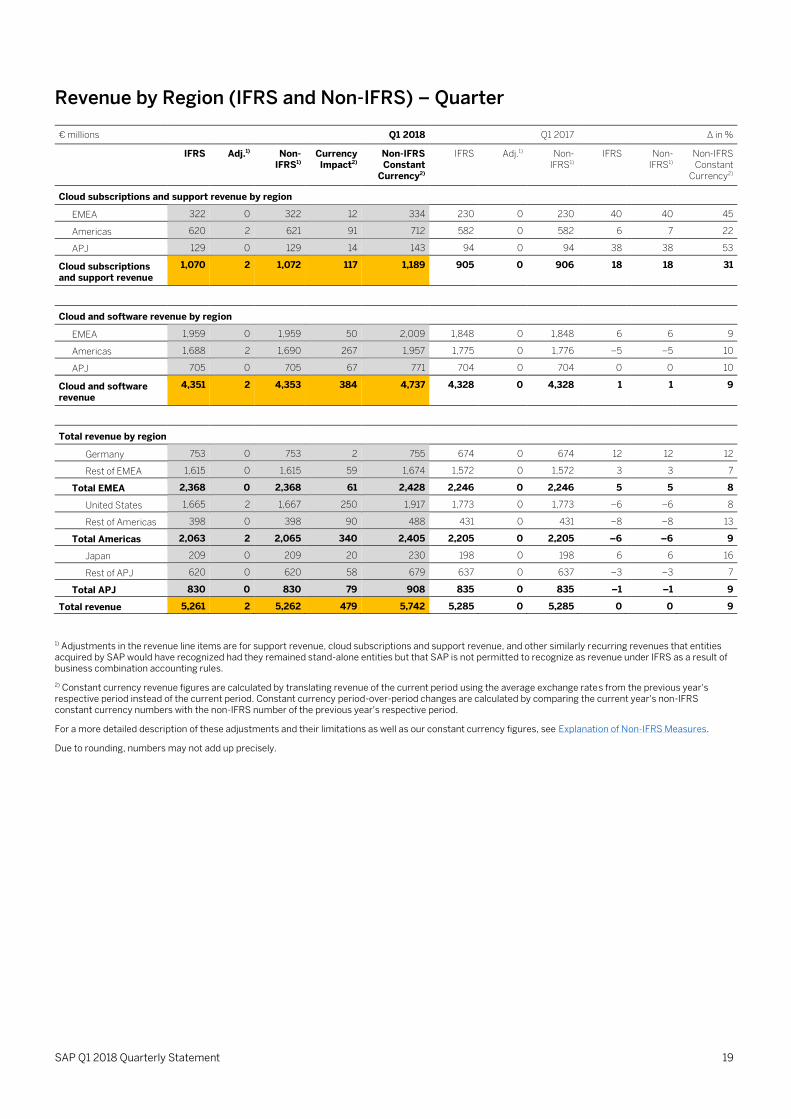
Revenue by Region (IFRS and Non-IFRS) – Quarter
€ millions Q1 2018 Q1 2017 ∆ in %
IFRS Adj.1) Non-IFRS1)
Currency Impact2)
Non-IFRS Constant
Currency2)
IFRS Adj.1) Non-IFRS1)
IFRS Non-IFRS1)
Non-IFRS Constant
Currency2)
Cloud subscriptions and support revenue by region
EMEA 322 0 322 12 334 230 0 230 40 40 45
Americas 620 2 621 91 712 582 0 582 6 7 22
APJ 129 0 129 14 143 94 0 94 38 38 53
Cloud subscriptions and support revenue
1,070 2 1,072 117 1,189 905 0 906 18 18 31
Cloud and software revenue by region
EMEA 1,959 0 1,959 50 2,009 1,848 0 1,848 6 6 9
Americas 1,688 2 1,690 267 1,957 1,775 0 1,776 –5 –5 10
APJ 705 0 705 67 771 704 0 704 0 0 10
Cloud and software revenue
4,351 2 4,353 384 4,737 4,328 0 4,328 1 1 9
Total revenue by region
Germany 753 0 753 2 755 674 0 674 12 12 12
Rest of EMEA 1,615 0 1,615 59 1,674 1,572 0 1,572 3 3 7
Total EMEA 2,368 0 2,368 61 2,428 2,246 0 2,246 5 5 8
United States 1,665 2 1,667 250 1,917 1,773 0 1,773 –6 –6 8
Rest of Americas 398 0 398 90 488 431 0 431 –8 –8 13
Total Americas 2,063 2 2,065 340 2,405 2,205 0 2,205 –6 –6 9
Japan 209 0 209 20 230 198 0 198 6 6 16
Rest of APJ 620 0 620 58 679 637 0 637 –3 –3 7
Total APJ 830 0 830 79 908 835 0 835 –1 –1 9
Total revenue 5,261 2 5,262 479 5,742 5,285 0 5,285 0 0 9
1) Adjustments in the revenue line items are for support revenue, cloud subscriptions and support revenue, and other similarly recurring revenues that entities acquired by SAP would have recognized had they remained stand-alone entities but that SAP is not permitted to recognize as revenue under IFRS as a result of business combination accounting rules.
2) Constant currency revenue figures are calculated by translating revenue of the current period using the average exchange rates from the previous year's respective period instead of the current period. Constant currency period-over-period changes are calculated by comparing the current year's non-IFRS constant currency numbers with the non-IFRS number of the previous year's respective period.
For a more detailed description of these adjustments and their limitations as well as our constant currency figures, see Explanation of Non-IFRS Measures.
Due to rounding, numbers may not add up precisely.
20 SAP Q1 2018 Quarterly Statement
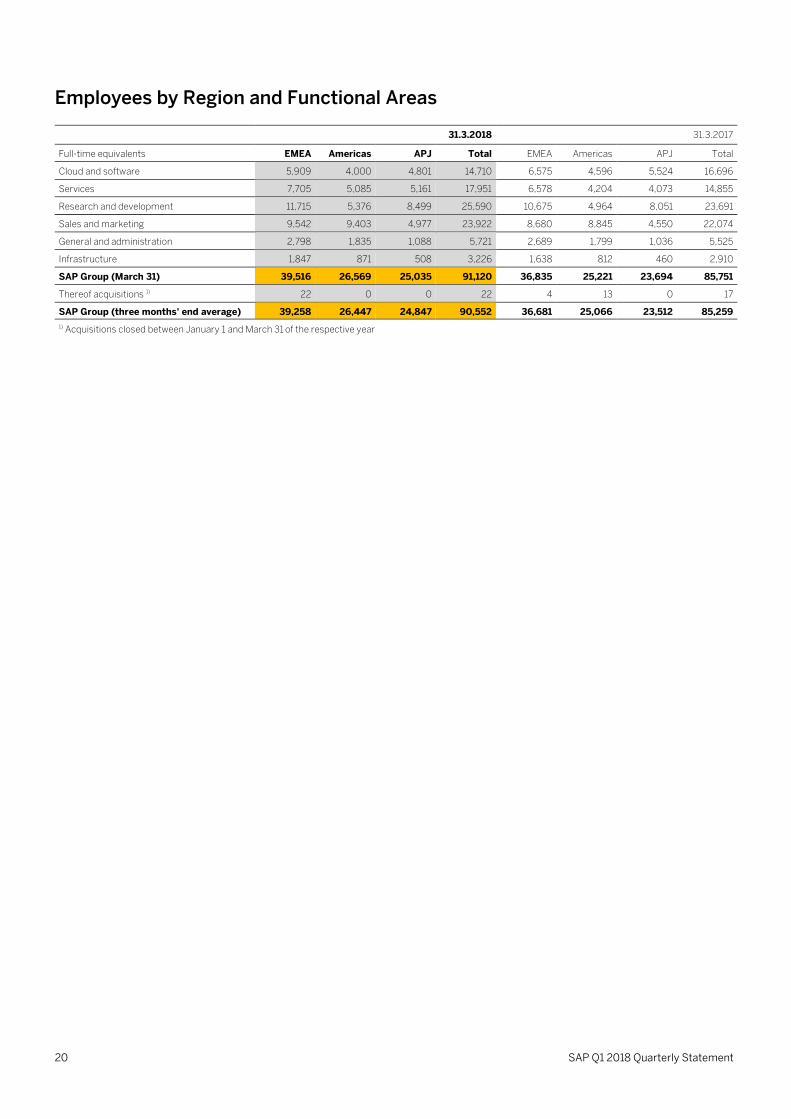
Employees by Region and Functional Areas
31.3.2018 31.3.2017
Full-time equivalents EMEA Americas APJ Total EMEA Americas APJ Total
Cloud and software 5,909 4,000 4,801 14,710 6,575 4,596 5,524 16,696
Services 7,705 5,085 5,161 17,951 6,578 4,204 4,073 14,855
Research and development 11,715 5,376 8,499 25,590 10,675 4,964 8,051 23,691
Sales and marketing 9,542 9,403 4,977 23,922 8,680 8,845 4,550 22,074
General and administration 2,798 1,835 1,088 5,721 2,689 1,799 1,036 5,525
Infrastructure 1,847 871 508 3,226 1,638 812 460 2,910
SAP Group (March 31) 39,516 26,569 25,035 91,120 36,835 25,221 23,694 85,751
Thereof acquisitions 1) 22 0 0 22 4 13 0 17
SAP Group (three months' end average) 39,258 26,447 24,847 90,552 36,681 25,066 23,512 85,259
1) Acquisitions closed between January 1 and March 31 of the respective year
SAP Q1 2018 Quarterly Statement 21
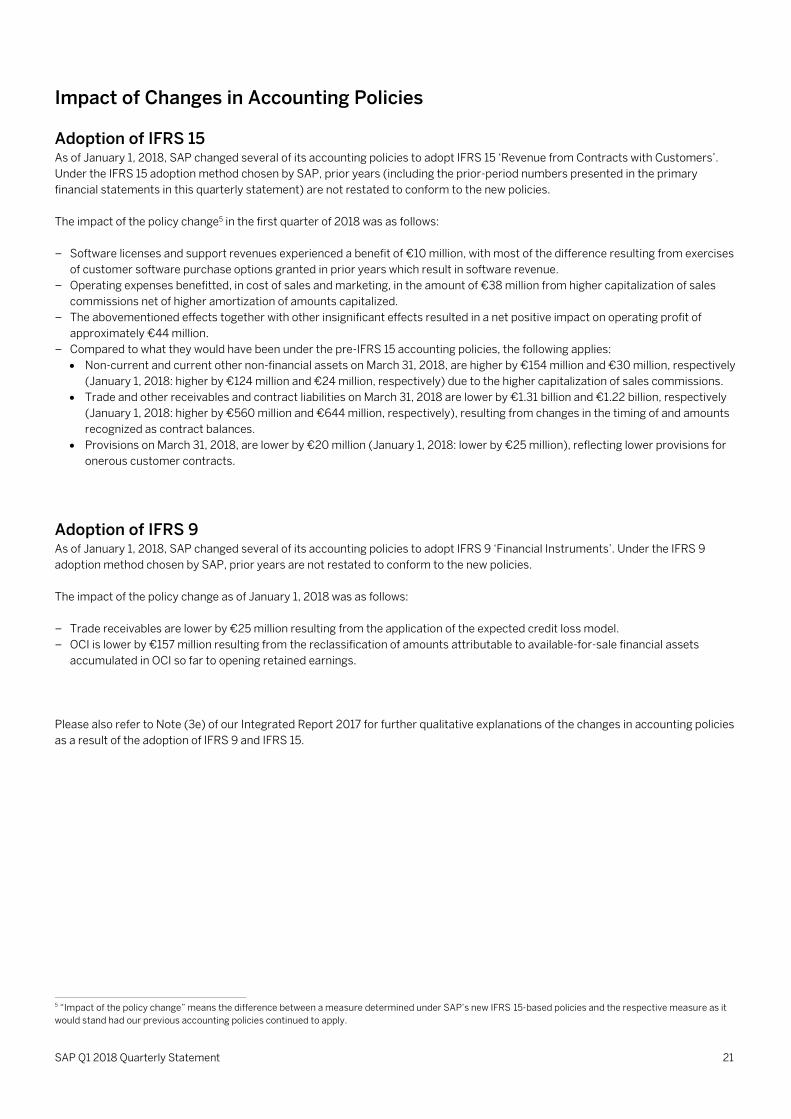
Impact of Changes in Accounting Policies
Adoption of IFRS 15 As of January 1, 2018, SAP changed several of its accounting policies to adopt IFRS 15 ‘Revenue from Contracts with Customers’.
Under the IFRS 15 adoption method chosen by SAP, prior years (including the prior-period numbers presented in the primary
financial statements in this quarterly statement) are not restated to conform to the new policies.
The impact of the policy change5 in the first quarter of 2018 was as follows:
– Software licenses and support revenues experienced a benefit of €10 million, with most of the difference resulting from exercises
of customer software purchase options granted in prior years which result in software revenue.
– Operating expenses benefitted, in cost of sales and marketing, in the amount of €38 million from higher capitalization of sales
commissions net of higher amortization of amounts capitalized.
– The abovementioned effects together with other insignificant effects resulted in a net positive impact on operating profit of
approximately €44 million.
– Compared to what they would have been under the pre-IFRS 15 accounting policies, the following applies:
Non-current and current other non-financial assets on March 31, 2018, are higher by €154 million and €30 million, respectively
(January 1, 2018: higher by €124 million and €24 million, respectively) due to the higher capitalization of sales commissions.
Trade and other receivables and contract liabilities on March 31, 2018 are lower by €1.31 billion and €1.22 billion, respectively
(January 1, 2018: higher by €560 million and €644 million, respectively), resulting from changes in the timing of and amounts
recognized as contract balances.
Provisions on March 31, 2018, are lower by €20 million (January 1, 2018: lower by €25 million), reflecting lower provisions for
onerous customer contracts.
Adoption of IFRS 9 As of January 1, 2018, SAP changed several of its accounting policies to adopt IFRS 9 ‘Financial Instruments’. Under the IFRS 9
adoption method chosen by SAP, prior years are not restated to conform to the new policies.
The impact of the policy change as of January 1, 2018 was as follows:
– Trade receivables are lower by €25 million resulting from the application of the expected credit loss model.
– OCI is lower by €157 million resulting from the reclassification of amounts attributable to available-for-sale financial assets
accumulated in OCI so far to opening retained earnings.
Please also refer to Note (3e) of our Integrated Report 2017 for further qualitative explanations of the changes in accounting policies
as a result of the adoption of IFRS 9 and IFRS 15.
5 “Impact of the policy change” means the difference between a measure determined under SAP’s new IFRS 15-based policies and the respective measure as it
would stand had our previous accounting policies continued to apply.
22 SAP Q1 2018 Quarterly Statement
Any statements contained in this document that are not historical facts are forward-looking statements as defined in the U.S. Private
Securities Litigation Reform Act of 1995. Words such as “anticipate,” “believe,” “estimate,” “expect,” “forecast,” “intend,” “may,”
“plan,” “project,” “predict,” “should” and “will” and similar expressions as they relate to SAP are intended to identify such forward-
looking statements. SAP undertakes no obligation to publicly update or revise any forward-looking statements. All forward-looking
statements are subject to various risks and uncertainties that could cause actual results to differ materially from expectations. The
factors that could affect SAP's future financial results are discussed more fully in SAP's filings with the U.S. Securities and Exchange
Commission ("SEC"), including SAP's most recent Annual Report on Form 20-F filed with the SEC. Readers are cautioned not to
place undue reliance on these forward-looking statements, which speak only as of their dates.
© 2018 SAP SE. All rights reserved.
No part of this publication may be reproduced or transmitted in any form or for any purpose without the express permission of SAP
SE. The information contained herein may be changed without prior notice.
Some software products marketed by SAP SE and its distributors contain proprietary software components of other software
vendors. National product specifications may vary.
These materials are provided by SAP SE and its affiliated companies ("SAP Group") for informational purposes only, without
representation or warranty of any kind, and SAP Group shall not be liable for errors or omissions with respect to the materials. The
only warranties for SAP Group products and services are those that are set forth in the express warranty statements accompanying
such products and services, if any. Nothing herein should be construed as constituting an additional warranty.
SAP and other SAP products and services mentioned herein as well as their respective logos are trademarks or registered
trademarks of SAP SE (or an SAP affiliate company) in Germany and other countries. All other product and service names
mentioned are the trademarks of their respective companies. Please see www.sap.com/about/legal/copyright.html for additional
trademark information and notices.


![tassilo.klein@sap.com arXiv:1809.04344v1 [cs.CV] 12 Sep 2018 · SAP SE, Berlin m.nabi@sap.com Abstract We introduce MASSES, a simple evaluation metric for the task of Visual Question](https://img.pdfslide.us/doc/110x75/60bf5c51c400887765348ca7/sapcom-arxiv180904344v1-cscv-12-sep-2018-sap-se-berlin-mnabisapcom-abstract.jpg)