Embed Size (px)
Citation preview

CLOTHESPINS FROM THE PEOPLE'S REPUBLIC OF CHINA,, THE PPLISH _PEOP~E'S _REPUBLIC, AND THE -SOCIALIST REPUBLIC OF ROMANIA
Re~ort to the President on Investigations Nos. TA-406-2, TA-406-3, and TA-406-4, Under Section 406 of the Trade Act of 1974
USITC PUBLICATION 902
AUGUST 1978
United States International Trade Commission I Washington, D.C. 20436

UNITED STATES INTERNATIONAL TRADE COMMISSION ·
COMMISSIONERS
Joseph 0. Parker, Ct•rairman Bill Alberger, Vice Chairman
George M. Moore Catherine Bedell
ltalo H. Ablondi Daniel Minchew
Kenneth A. Mason, Secretary to the Commission
This report was prepared principally by
William Ira Schechter, Investigator
assisted by
Judith Plows, Investigative Staff
John M. MacHatton, Supervisory Investigator
Address all communications to
Office of the Secretary United States International Trade Commission
Washington, D.C. 20436

FOR RELEASE August 3, 1978
CONTACT: Kenneth R. Mason (202) 523-0161
USITC 78-098
USITC DETERMINES CLOTHESPIN IMPORTS FROM THE PEOPLE'S REPUBLIC OF CHINA ARE CAUSING MARKET DISRUPTION BUT FINDS IN THE
NEGATIVE ON SIMILAR IMPORTS FROM THE POLISH PEOPLE'S REPUBLIC AND THE SOCIALIST REPUBLIC OF ROMANIA
The United States International Trade Commission reported today to the Presjdent that market disruption exists with respect to imports of clothespins from the People's Republic of China. The Commission also advised the President that market disruption does not exist for similar imports from the Polish People.'s Republic and the Socialist Republic of Romania.
The CollJTlission investigations were instituted on May 16, 1978, .under section 406(a) of the Trade Act of 1974, to determine whether increased imports of an article produced in a Communist country are.causing market disruption with respect to sue~ articles produced by a domestic industry.
By a 6-to-O vote, the Commission determined that market disruption exists regarding imports of the products from China. Concerning the articles produced by Poland and Romania, the Commission determined by votes of 5-to-l and 6-to-O that market disruption does not exist with respect to an article produced by a domestic industry. Comni ssi oner Parker determined that market disruption ·
· exists for clothespins imported from Poland, within the meaning of section 406 Qf the. Trade Act of 1974. ·
. The Comnission unanimously recommended to the President quotas on the Chinese clothespins. Chairman Joseph O. Parker and Commissioners George M.
' Moore and Catherine Bedell reconmended a 5-year quota on U.S. imports of clothe~pins from the People's Republic of China. The quota would be admin~ istered on a yearly basis, with the first year established at 431,000 gross, on the basis of the average of the imports of such clothespins from China for the years 1975, 1976, and 1977. Corrmissioner Italo H. Ablondi agreed with this remedy, but only for a 3-year period. Vice Chairman Bill Alberger and Corrmissioner Daniel Minchew recorrmended a 5-year quota to be administered on a quarterly basis, with the first year established at 431,000 gross, on the basis of the average number of imports for the years 1975-77, with the quota amount to be increased by 5 percent each year.
more

USITC DETERMINES CLOTHESPIN IMPORTS FROM THE PEOPLE'S REPUBLIC OF CHINA ARE. CAUSING MARKET DISRUPTION BUT FINDS IN THE NEGATIVE ON SIMILAR IMPORTS FROM THE POLISH PEOPLE'S REPUBLIC AND THE SOCIALIST REPUBLIC OF ROMANIA
2
Wood and plastic spring clothespins imported from China increased in quantity from zero in 1974 to a level higher than that of any other supplying country in 1977. In 1977 the quantity of .imports from China and the ratio of imports from China to apparent U.S. consumption both were nearly double their 1976 levels. Imports from China in 1977 exceeded 828,000 gross and 12 percent of U.S. consumption.
During the period 1975-77~ imports of wood and plastic spring clothespins from Poland increased at only a moderate rate, from 433,000 gross in 1975 to 506,000 gross in 1977, representing a gain of 17 percent, or less than 10 percent a year. The ratio of imports from Poland to U.S. apparent consumption in 1977 was only 7.8 percent compared with 7.7 percent in 1976.
Imports from Romania fluctuated considerably from year to year, with an average annual increase of about 10 percent from 1973 through 1977. In 1977, however, the level of imports from Romania was 21 percent below the level achieved in 1976, and 12 percent below the level of imports from Romania in 1974. In 1977 the ratio of imports from Romania to apparent U.S. consumption was 22 percent below the 1976 level and 25 percent below the 1974 level.
The four major types of clothespins are: spring type of wood, spring type of plastic, round or squarehead nonspring type of wood, and round or squarehead nonspring type of wood that are iron bound. With price often being the determining factor, all of the clothespins types are competitive with each other in the market place.
Five domestic firms manufacture clothespins: Diamond International Corp., with a plant in Peru, Maine; Forster Manufacturing Co. of Wilson, Maine; Penley Corp. of West Paris, Maine; National Clothespin Co. of Montpelier, Vt., and Vermont Plastic, Inc., of Montpelier, Vt .. The domestic industry experienced an extremely low rate of capacity utilization throughout .
. the period of the investigations. The level of capacity utilization for all clothespin production facilities fell from 50 percent in 1973 to 34 percent in 1977; during January-March 1978 the level of capacity utilization was 33 percent. Furthermore, capacity utilization for wood spring clothespins, the staple of the industry, which accounts for virtually all imports from China, declined from 67 percent in 1973 to 42 percent in 1977.
U.S. production of all clothespins dropped sharply from 5.3 million gross in 1973 to 4.2 million gross in 1977, representing a decline of 21 percent. U.S. producers' shipments also declined rapidly, falling from 5.4 million gross in 1973 to 4.1 million gross in 1977, or by 24 percent.
more

USITC DETERMINES CLOTHESPIN IMPORTS FROM THE PEOPLE'S REPUBLIC OF CHINA ARE CAUSING MARKET DISRUPTION BUT FINDS IN THE NEGATIVE ON SIMILAR IMPORTS FROM THE POLISH PEOPLE'S REPUBLIC AND THE SOCIALIST REPUBLIC OF ROMANIA
3
The average number of production and related workers engaged solely in the production of clothespins declined irregularly from 429 employees in 1973 to 387 employees in 1977. The total number of person hours worked in the production of clothespins followed a similar pattern, falling from 820,000 hours in 1973 to 720,000 hours in 1977. The aggregate net operating profits for all clothespins fell sharply from $651,000 in 1975 to $81 ,000 in 1976, and declined further to $54,000 in 1977, repres~nting a decline of 92 percent from the 1975 level. The ratio of net operating profit to net sales dropped from 8.3 percent in 1975 to 0.7 percent in 1977.
The prices of the Chinese wood spring clothespins during 1973-77 were the lowest among all importers for their largest volume sales, and in the last quarter of 1977 and the first quarter of 1978 were approximately $1.13 per gross, or $1 less per gross than those of the largest domestic producers ($1.91-$2.24 per gross). These low prices have prevented U.S. producers from increasing their prices to their customers to cover their increasing unit costs of production. Since 1975, when imports of U.S. clothespins from China began to rapidly increase, U.S. producers• prices have remained steady or have declined, while unit costs of producing clothespins have increased by 8 percent, resulting in deteriorating profitability for the U.S. producers.
The Corrnnission staff was able to verify lost sales di.rectly attributable to China. Many purchasers of clothespins indicated that they purchase their clothespins primarily on a price basis. The bulk of the sales of clothespins from China are to mass merchandisers.
USITC instituted the investigations for import relief under section 406 of the Trade Act of 1974 following receipt of a petition filed on behalf of the Clothespin and Veneer Products Association. A public hearing was held in Portland, Maine, on June 22, 1978.
The Commission's report, Clothespins From the People's Republic of China, the Polish Peo le's Re ublic, and the Socialist Re ublic of Romania (USITC Publication 902 , contains the views of the Conmissioners and information developed in the investigations (Nos. TA-406-2, TA-406-3, and TA-406-4). Copies may be obtained by calling (202) 523-5178 or from the Office of the Secretary, 701 E Street, NW., Washington, D.C. 20436.
oOo


C 0 N T E N T S
Report to the President-----~----------------------------------- 1 Determinations, findings and recommendations of the
Commission: Determinations----------------------------·-------------------- 2 Findings and Recommendations---------------------------------- 3
Statement of reasons for determination of Commissioners George M. Moore, Catherine Bedell, and Italo H. Ablondi with respect to imports from the People's Republic of China (Investigation No. TA-406-2)--~------------------------- 5
Statement of reasons for determinations of Commissioners George M. Moore, Catherine Bedell, and Italo H. Ablondi with respect to imports from the Polish People's Republic (Investigation No. TA-406-3) and the Socialist gepublic of Romania (Investigation No. TA-406-4)----------------------- 10
Additional views of Commissioners George M. Moore, Catherine Hedell, and Italo H. Ablondi on recommendations of remedy with respect to imports from the People's Re~ublic of China (Investi&a-tion No. TA-406-2)--------------------------------------------- 14
Reasons for Determinations of Connnissioner Bill Alberger and Commissioner Daniel Minchew----------------------------------- 16
Views of Vice Chairman Bill Alberger and Commissioner Daniel Minchew on remedy----------------------------~--------- 26
Reasons for Determinations of Chairman Joseph 0. Parker--------- 30 Additional views of Chairman Joseph 0. Parker with respect
to remedy----------------------------------------------------- 37
ii
Contents--Continued
Information obtained in the investigation: Sununary-------------------------------------------------------------lntroduc t ion--------------------------------------------------------Description and uses------------------------------------------------U. S. tariff treatment--------------------~--------------------------U.S. producers------------------------------------------------------U.S. importers------------------------------------------------------U.S. market-----------------------------~----------------------------The question of rapidly increasing imports:
U.S. imports-----------------------------------------------------Imports from nonmarket-economy countries------------------------Imports from market-economy countries----------------------------
Consideration of market disruption: U.S. capacity, production, and capacity utilization------------u.s. consumption, producer's shipments, and foreign trade--------u.s. inventories---------------~--------------------------------Employment-------------------------------------------------------Profit-and-loss experience of domestic producers----------------Prices of wood spring clothespins:
Domestic producers------------~------------------------------Nonmarket-economy countries-------~-------------------------Market-economy countries-------------------------------------
Prices of wood roundhead clothespins: Domestic producers------------------------------------------West Germany-------------------------------------------------
Prices of plastic spring clothespins----------------------------Prices and unit costs for wood spring clothespins---------------Market penetration of imports from China, Poland, and Romania----Loss of sales----------------------------------------------------
Appendix A: U.S. International Trade Commission notice of investigations and hearing--------------------------------------------
Appendix B: Supplementary statistical tables---------------------------Appendix C: Probable economic effects of tariff changes under title I
and title V of the Trade Act of 1974 for Trade Agreement Digest No. 70236, July 1975-------------------------------------------------------
A-1 A-7 A-7 A-8 A-9
A-10 A-u
A-11 A-11 A-20
A-20 A-2n A- 26 A-31 A- 33
A- 39 A- 39 A- 39
A- 42 A- 42 A-.42 A- 44 A- 44 A- 49
A- 51 A- 54
A- 63

Contents--Continued
iii
Figures
1. Imports of wood and plastic spring clothespins, 1973-77-------------- A-13 2. Imports of wood and plastic spring clothe3pins from market economy
countries and nonmarket economy countries, 1973-77----------------- A-15 3. Imports of wood and plastic spring clothespins from certain
nonmarket economy countries, 1973-77------------------------------- A-16 4. Imports of wood and plastic spring clothespins from Taiwan, 1973-77-- A-22 S. Imports of wood and plastic spring clothespins from certain market
economy countries, 1973-77----------------------------------------- A-23 6. Imports of wood and plastic spring clothespins from China, 1973-77--- A-46 7. Imports of wood and plastic spring clothespins from Poland, 1973-77-- A-47 8. Imports of wood and plastic spring clothespins from Romania,
1973-77------------------------------------------------------------ A-48
TABLES
1. Wood and plastic spring clothespins (TSUS item 790.05): U.S. imports for consumption, by country, 1973-77, January-March 1977, and January-March 1978--------------------------------------- A-12
2. Wood and plastic spring clothespins: U.S. imports for consumption, from nonmarket economy countries (Communist countries) and market economy countries, 1973-77, January-March 1977 and January-March 1978--------------------------------------------------------------- A-14
3. Nonspring clothespins of wood (TSUS item 790.08): U.S. imports for consumption, by country, 1973-77, January-March 1977, and January-March 1978------------------------------------------------- A-18
4. Nonspring clothespins of plastic (TSUS item 790.07): U.S. imports for consumption, by country, 1973-77, January-March 1977, and January-March 1978------------------------------------------------- A-19
5. Clothespins: U.S. capacity, production, and capacity utilization, by types, 1973-77, January-March 1977, and January-March 1978------ A-21
6. Clothespins: U.S. production, U.S. production capacity, and ratio of production to capacity, by firm, 1973-77, January-March 1977, and January-March 1978--------------------------------------------- A-24
7. Clothespins: U.S. capacity, based on two shifts per day, 5 days per week, practical capacity, optimum production levels, production, and ratio of production to capacity and optimum production levels, 1977-------------------------------------------- A-25

t_.;.·.:c;:nts--Continued
8. Clothespins~ U.S. p~oduee~s' shipments, imports from market economy countries, import© from nonraarket countries, total imports, and apparent consumption~ 1973-77, January-March 1974 and January-March 1978-------------~-~----------------------------------------------- A-27
9. Clothespinsg U.S. producersc shipments, by types, 1973-77, January-March 1977 9 and January-March 1978----------------------- A-28
10. Clothespinsg UcS• pLoducers 0 shipments, by company and type, 1973-77, January=March 1977 and January-March 1978----------------- A-29
11. Clothespins: U.S. producers' year-end inventories, by firm, 1973-77, March 31 9 1977, and March 31, 1978------------------------ A-30
12. Clothespins~ Average number of employees in U.S. facilities producing clothespins, and production and related workers engaged in the manufacture of all products and clothespins, 1973-77, January-March 1977~ and January-March 1978------------------------- A-32
13. Person-hours worked in establishments producing clothespins, 1973-77, January-March 1977 9 and January-March 1978---------------- A· 32
14. Profit-and-loss experience of the CVPA companies on all their clothespin operations, 1973-77------------------------------------- A-34
15. Profit-and-loss experience of the CVPA companies on their wood spring clothespins operations, 1973-77----------------------------- A-35
16. Profit-and-loss experience of CVPA companies for all products manufactured at their reporting establishments, 1973-77------------ A-36
17. Profit-and-loss experience of two CVPA companies on all their clothespin operations and on all operations of the reporting establishments 9 1973-77-------------------------------------------- A- 37
18. Other factory costs (O.F.C.): Other factory costs and ratio of other factory costs to n~t sales for CVPA companies, 1973-77------- A-·38
19. Selected financial ratios of the CVPA producers, 1977---------------- A-3s 20. Wood spring clothespins: Prices of U.S. producers and importers
on their largest volume sales to their U.S. customers, by quarter 9 January 1973-March 1978---------------------------------- A-40
21. Wood round head clothespins: Prices of U.S. producers and importers on theix largest volume sales to their U.S. customers, by quarter, January 1973-March 1978-------------------------------- A-41
22. Plastic spring clothespins: Prices of U.S. producers and importers on their largest volume sales to their U.S. customers, by quarter, January 1973-March 1978-------------------------------------------- A-43
23. Aggregate average unit cost for wood spring clothespins of CVPA companies, 1~73~77, January-March 1977, and January-March 1978----- A-44
24. Wood and plastic clothespins: U.S. consumption, and U.S. imports from China, Poland, Romania, and all nonmarket countries, 1973-77, January-March 1977, and January-March 1978------------------------- A-45

Contenta--Continued
v
A-1. Wood spring clothespins (TSUSA item 790.0550): U.S. imports for consumption, by country, by month January-April 1978-------------- A-55
A-2. Plastic spring clothespins (TSUSA item 790.0510): U.S. imports for consumption, by country, by month January-April 1978---------- A-57
A-3. Clothespins: Ratio of inventories at period end to U.S. producers' shipments during the preceding 12-month or 4-month period, by firms, 1973-77, January-March 1977, and January-March 1978-------- A-59
A-4. Wood and plastic spring clothespins (TSUS item 790.05): U.S. imports for consumption, by country, 1973-77, January-March 1977, and January-March 1978-------------------------------------------- A-61


To the President:
1
REPORT TO THE PRESIDENT
United States International Trade Commission August 3, 1978
In accordance with section 406(a)(3) of the Trade Act of 1974, the United
States International Trade Commission herein reports the results of 3
investigations relating to clothespins from the People's Republic of China,
the Polish People's Republic and the Socialist Republic of Romania. The
investigations (Nos. TA-406-2, TA-406-3, and TA-406-4) were undertaken to
determine with respect to imports of clothespins provided for in items
790.05, 790.07, and 790.08 of the Tariff Schedules of the United States,
which are the product of the People's Republic of China, Poland and Romania,
whether market disruption exists with respect to an article produced by a
domestic industry.
The Commission instituted the investigations, under the authority of
section 406(a) of the Trade Act, on May 16, 1978, following the receipt of
a petition under section 406 of the Trade Act for relief from clothespins
imported from the People's Republic of China, Poland and Romania filed on
behalf of the Clothespin and Veneer Products Association. The
Commission held a public hearing on this matter in Portland, Maine, on
June 22, 1978. Notice of the institution of the investigation and of the
public hearing was published in the Federal Register of May 22, 1978,
(43 F.R. 21952).
The information in this report was obtained from fieldwork and
interviews by members of the Commission's staff, other Federal agencies,
responses to the Commission's questionnaires, information presented at the
public hearing, briefs submitted by interested parties, and the Commission's
files.
2
A transcript of the hearings and copies of briefs submitted by interested
parties in connection with this investigation are attached. !/
DETERMINATIONS,~INDINGS AND RECOMMENDATIONS OF THE COMMISSION
Determinations
On the basis of information developed during the course of investigation
No. TA-406-2, concerning clothespins provided for in items 790.05, 790.07,
and 790.08 of the Tariff Schedules of the United States, that are products of
the People's Republic of China, the Commission determines that market
disruption exists with respect to an article produced by a domestic industry,
within the meaning of section 406 of the Trade Act of 1974. ]:_/
On the basis of information developed during the course of investigation
No. TA-406-3, concerning clothespins provided for in items 790.05, 790.07,
and 790.08 of the Tariff Schedules of the United States, that are products
of the Polish People's Republic, the Commission determines that market
disruption does not exist, with respect to an article produced by a domestic
industry, within the meaning of section 406 of the Trade Act of 1974. '}_/
On the basis of information developed during the course of investigation
No. TA-406-4, concerning clothespins provided for in item 790.05, 790.07,
and 790.08 of the Tariff Schedules of the United States, that are products of
the Socialist Republic of Romania,the Commission determines that market
disruption does not exist, with respect to an article produced by a domestic
industry, within the meaning of section 406 of the Trade Act of 1974. !!_/
l./ Attached to the original report sent to the President, and except for material submitted in confidence, available for inspection at the U.S. International Trade Commission.
'!:._/ With respect to imports from the People's Republic of China (TA-406-2) the Commission (Chairman Parker, Vice Chairman Alberger, and Commissioners Moore, Bedell, Ablondi, and Minchew) voted unanimously that market disruption does exist within the meaning of section 406.
'}_/ With respect to imports from the Polish People's Republic (TA-406-3) the Commissio.n by a 5-1 vote determined that market disruption does not exist within the meaning of section 406. Vice Chairman Alberger and Commissioners Moore, Bedell, Ablondi, and Minchew determined that market disruption does not exist within the meaning of section 406. Chairman Parker det~rmined that market disruption exists within the meaning of section 406.
!!._/With respect to imports from the Socialist Republic of Romania (TA-406-4), the Commission (Chairman Parker, Vice Chairman Alberger, and Commissioners Moore, Bedell, Ablondi, and Minchew) voted unanimously that market disruption does not exist within the meaning of section 406.
3
Findings and Recommendations
Chairman Parker and Commissioners Moore and Bedell, having determined
that market disruption exists with respect to an article produced by a domestic
industry, find and recommend that, in order to remedy such market disruption,
it is necessary to impose a quota of 5 years' duration on U.S. imports of -0
clothespins from the Peoples' Republic of China provided for in items 790.05,
790.07, and 790.08 of the Tariff Schedules of the United States.
The quota should be administered on an annual basis, with the quota for
each year established at 431,000 gross, based on the average of the imports
of such clothespins from the Peoples' Republic of China for the years 1975,
1976, and 1977. !/
Commissioner Ablondi, having determined that market disruption exists
with respect to an article produced by a domestic industry, findsand recommends
that, in order to remedy such market disruption, it is necessary to impose
a quota of 3 years' duration on U.S. imports of clothespins from the Peoples'
Republic of China provided for in items 790.05, 790.07~ and 790.08 of the
Tariff Schedule:;of the United States.
The quota should be administered on an annual basis, with the quota for
each year established at 431,000 gross, based on tne average of the imports
of such clothespins from the Peoples' Republic of China for the years 1975,
1976, and 1977. '.!:.._/
1/ Pursuant to section 330(d)(2) of the Tariff Act of 1930, as amended (19 U.S.C. 1330(d)(2)), the Commission is deemed to have made a remedy finding if three CoUEJ.issioners agree on a remedy finding.
±_I Connnissioner Ablondi, together with Chairman Parker, and Commissioners Moore and Bedell, agree that during the first 3 years of any remedy, an annual quota of 431,000 gross be established for imports of clothespins from the People's Republic of China.

4
Vice Chairman Alberger and Commissioner Minchew, having determined that
market disruption exists with respect to an article produced by a domestic
industry, find and recommend that, in order to remedy such market disruption,
it is necessary to impose a quota of 5 years' duration on U.S. imports of
clothespins from the Peoples' Republic of China provided for in item 790.05,
790.07, and 790.08 of the Tariff Schedules of the United States.
The quota would be administered on a quarterly basis with the first year
established at 431,000 gross, based on the average of the imports of such
clothespins from the Peoples' Republic of China for the years 1975, 1976,
and 1977.
thereafter, as follows:
Quantity of imEorts to be allowed Year entry Eer calendar guarter
1st year------------- 107,750 gross (an annual rate of 431,000 gross) 2nd year------------- 113,250 gross (an annual rate of 453,000 gross) 3rd year------------- 118, 750 gross (an annual rate of 475,000 gross) 4th year------------- 124,750 gross (an annual rate of 499,000 gross) 5th year------------- 131,000 gross (an annual rate of 524,000 gross)
5
STATEMENT OF REASONS FOR DETERMINATION OF COMMISSIONERS GEORGE M. MOORE, CATHERINE BEDELL, AND ITALO H. ABLONDI WITH RESPECT TO IMPORTS FROM THE
PEOPLE'S REPUBLIC OF CHINA (INVESTIGATION NO. 'I'A-406-2) !/
On May 3, 1978, the United States International Trade Commission received
a petition filed on behalf of the Clothespin and Veneer Products Association
(CVPA), for import relief under section 406 of the Trade Act of 1974. On
May 16, 1978, the Commission instituted investigations under section 406(a)
of the Trade Act of 1974 to determine, with respect to imports of clothes-
pins provided for in items 790.05, 790.07, and 790.08 of the Tariff
Schedules of the United States, which are the products of the People's
Republic of China (China), the Polish People's Republic (Poland), !/and
the Socialist Republic of Romania (Romania), l/ whether market disruption
exists with respect to such articles produced by a domestic industry.
Before the Commission can find market disruption within the meaning
of section 406, the following conditions must be met. The complained-of
imports must be:
1. the product of a Communist country; 2. like or directly competitive with a domestic product; 3. increasing rapidly, either absolutely or relatively; and 4. a significant cause of material injury or the threat thereof
to the domestic industry producing a like or directly competitive product.
Determination
On the basis of information developed during the course of investiga-
tion No. TA-406-2, concerning clothespins provided for in items 790.05,
790.07, and 790.08 of the Tariff Schedules of the United States, that are
products of the People's Republic of China, we determine that market
disruption exists with respect. to an article produced by a domestic
industry, within the meaning of section 406 of the Trade Act of 1974.
ll See our separate statement of reasons for our determinations with respect to imports from Poland and Romania.

6
The Product and the Domestic Industry
There are four major types of clothespins; spring type clothespins
of wood; spring type clothespins of plastic; round or square head non-
spring type clothespins of wood; and round or square head non-spring type
clothespins of wood that are iron bound. With price often being the deter-
mining factor, all of the aforementioned types of clothespins are competitive
with each other in the market place. The imported products like and
directly competitive with the output of this industry, enter the United
States under items 790.05, 790.07 and 790.08 of the Tariff Schedules of
the United States (TSUS), and these items define the scope of the investiga-
tions. The products in question are the products of a Communist country--
the People's Republic of China• The first two criteria for an affirmative
determination are met.
The Question of Rapidly Increasing Imports
In order to make an affirmative determination that market disruption
exists, it must be determined that imports "are increasing rapidly either
absolutely or relatively." The use of the present tense "are increasing"
corroborates a legislative intent for using a current time frame for
determining whether "market disruption exists," which itself is in the
present tense. This interpretation is supported by the legislative historv
contained in the report of the Senate Connnittee on Finance which states:
The increase in imports required by the market disruption criteria must have occurred during a recent period of time, as determined by the Commission taking into account any historical trade levels which may have existed. :!./
1/ Trade Reform Act of 1974: Report of the Connnittee on Finance .•.• , s.-Rept. No. 93-1298 (93d Cong., 2d sess.), 1974, p. 212.

7
This statement clearly indicates that the market disruption criterion
require that the increase in imports must have been in a recent period,
taking into consideration historic trade levels and must involve a quantum
of imports which would be of a weight necessary to meet the injury require-
ment of the statute.
During the period covered by the Conunission's investigation , wood and
plastic spring clothespins imported from China increased in quantity from
zero in 1974 to a level higher than that of any other supplying country in
1977. In 1977 the quantity of imports from China and the ratio of imports
from China to apparent U.S. consumption both were nearly double their 1976
levels. Imports from China in 1977 exceeded 828 thousand gross and 12 per-
cent of U.S. consumption. The conclusion thus is inescapable that imports
of the subject clothespins from China are rising rapidly, both absolutely
and relatively, within the meaning of section 406 of the Trade Act of 1974.
The Question of Significant Cause of Material Injury
Although the Trade Act provides no precise definition of the terminology
"significant cause of material injury", the standard was intended by the
Finance Conunittee to be an easier one to satisfy than the "substantial
cause'requirement of section 201 of the Trade Act. 1../
Capacity Utilization
The domestic industry experienced an extremely low rate of capacity
utilization throughout the period of the investigations. The level of
capacity utilization for all clothespin production facilities fell from
50 percent in 1973 to 34 percent in 1977; during January-March 1978 the
level of capacity utilization was 33 percent. Furthermore, capacity
1_/ !rade Reform Act o~ 1°74: Report of the Committee on Finance .. . . , S. Rept. No. 93-1298 (93d Cong., 2d sess.), 1974 p. 212.

8
utilization for wood spring clothespins, declined from 67 percent in 1973 to
42 percent in 1977. Virtually all clothespins imported from China are
of the wood spring type.
Production and shipments
U.S. production of all clothespins dropped sharply from 5.3 million
gross in 1973 to 4.2 million gross in 1977--a decline of 21 percent. U.S.
producers' shipments also declined rapidly, falling from 5.4 million gross
in 1973 to 4.1 million gross in 1977, a drop of 24 percent.
Employment
The average number of production and related workers
engaged solely in the production of clothespins declined irregularly from
429 employees in 1973 to 387 employees in 1977. The total number of person
hours worked in the production of clothespins followed a similar pattern,
falling from 820 thousand hours in 1973 to 720 thousand hours in 1977.
Profit-and-loss experience
The aggregate net operating profits for all clothespin operations
of the four domestic oroducers of wood spring clothespins fell sharply
from $651 thousand in 1975 to $81 thousand in 1976 and declined further
to $54 thousand in 1977--a decline of 92 percent from the 1975 level.
The ratio of net operating profit to net sales dropped from 8.3 percent
in 1975 to 0.7 percent in 1977.
Prices
The prices of the Chinese wood spring clothespins during 1973-77 were
the lowest among all importers for their largest volume sales and in the
last quarter of 1977 and the first quarter of 1978 were approximately $1.13

9
per gross, or a dollar less per gross than those of the largest domestic
producers ($1.91-$2.24 per gross). These low prices have prevented U.S.
producers from increasing their prices to their customers to cover their
increasing unit costs of production. Since 1975, when imports of U.S.
' . clothespins from China began to rapidly increase, U.S. producers prices
have held steady or have declined, while unit costs of producing clothespins
have increased by 8 percent, resulting in deteriorating profitability for
the U.S. producers.
Lost sales
The Commission staff was able to verify lost sales directly
attributable to China. Many purchasers of clothespins indicated that
they purchase their clothespins primarily on a price basis. The bulk of
the sales of clothespins from China are to mass merchandisers.
Conclusion
On the basis of the information and analysis outlined above, we
determine that all four critieria for a finding of market disruption within
the meaning of section 406 have been satisfied, and that such disruption
exists, caused by rapidly increasing imports of clothespins from China.

10
STATEMENT OF REASONS FOR DETEFJHNATIONS OF COMMISSIONERS GEORGE M. MOORE, CATHERINE BEDELL, AND ITALO H. ABLONDI WITH RESPECT TO IMPORTS FROM
T~E POLISH PEOPLE'S REPUBLIC (INVESTIGATION NO. TA-406-3) AND THE SOCIALIST REPUBLIC OF ROMANIA
(INVESTIGATION NO. TA-406-4) 'l__/
On May 3, 1978, the United States International Trade Commission received a
petition filed on behalf of the Clothespin and Veneer Products Association (CVPA),
for import relief under section 406 of the Trade Act of 1974. On May 16, 1978, the
Commission instituted investigations under section 406(a) of the Trade Act of 1974
to determine, with respect to imports of clothespins provided for in items 790.05,
790.07, and 790.08 of the Tariff Schedules of the United States, which are the
products of the People's Republic of China (China),!/ the Polish People's Republic
(Poland), and the Socialist Republic of Romania (Romania), whether market disruption
exists with respect to such articles produced by a domestic industry.
Before the Commission can find market disruption within the meaning of section
406, the following conditions must be met. The complained-of imports must be:
made.
1. the product of a Communist country; 2. like or directly competitive with a domestic ~roduct; 3. increasing rapidly, either absolutely or relatively; and 4. a significant cause of material injury or the threat
thereof to the domestic industry producing a like or directly competitive product.
If any one of the four criteria are not met, a negative determination must be
±_/ See our separatestatement of reasons for our determination with respect to imports from China.

11
Determinations
On the basis of information developed during the course of investiga
tion No. TA-406-3, concerning clothespins provided for in items 709.05,
790.07, and 790.08 of the Tariff Schedules of the United States, that are
products of the Polish People's Republic, we determine that market
disruption does not exist, with respect to an article produced by a
domestic industry, within the meaning of section 406 of the Trade Act of
1974.
On the basis of information developed during the course of investiga
tion No. TA-406-4, concerning clothespins provided for an item 790.05,
790.07, and 790.08 of the Tariff Schedules of the United States, that are
products of the Socialist Republic of Romania, we determine that market
disruption does not exist, with respect to an article produced by a
domestic industry, within the meaning of section 406 of the Trade Act of
1974.
The Product and the Domestic Industry
There are four major types of clothespins; spring type clothespin:>
of wood; snring type clothespins of plastics; round or square head non
spring type clothespirs of wood; and round or square head non-spring type
clothespins of wood that are iron bound. With price often being the deter
mining factor, all of the aforementioned types of clothespins are competitive
with each other in the market place. The imported products like and
directly competitive with the output of this industry, enter the United
States under items 790.05, 790.07 and 790.08 of the Tariff Schedules of
the United States (TSUS), and these items define the scope of the investiga-

12
tions. The products in question are the products of Communist countries
the Polish People's Republic and the Socialist Republic of Romania. The
first two conditions for an affirmative determination are met.
The Question of Rapidly Increasing Imports
In order to make an affirmative determination that market disruption
exists, it must be determined that imports "are increasing rapidly either
absolutely or relatively." The use of the present tense "are increasing"
corroborates a legislative intent for using a current time frame for
determining whether "market disruption exists, " which itself is in the
present tense. This interpretation is supported by the legislative history
contained in the report of the Senate Committee on Finance which states:
The increase in imports required by the market disruption criteria must have occurred during a recent period of time, as determ±med by the Connnission taking into account any historical trade levels which may have existed. ~/
This statement clearly indicates that the market disruption criterion
require that the increase in imports must have been in a recent period,
taking into consideration historic trade levels and must involve a qua~tum
·of imports which would be of a weight necessary to meet the injury require-
ment of the statute.
1/ Trade Reform Act of 1974: Report of the Committee on Finance ••.. , S. Rept. No. 93-1298 (93d Cong., 2d sess.), 1974 p. 212.

13
Poland
During the period 1975-77, imports from Poland increased at only a
moderate rate, from 453 thousand gross in 1975 to 506 thousand gross in
1977, a gain of only 17 percent,. or less than 10 percent a year. The ratio
of imports from Poland to U.S. apparent consumption in 1977 was only 7.8
percent in comparison to 7.7 percent in 1976. Clearly, the recent trend in
imports from Poland is not "rapidly increasing," either absolutely or
relatively, within the meaning of section 406 of the Trade Act of 1974.
Since the criterion of rapidly increasing imports from Poland has not
been met, market disruption by reason of those imports cannot have occurred
within the meaning of section 406 and a negative determination with respect
to imports from Poland must be made.
Romania
During the period covered by the Commission's investigations, imports
from Romania fluctuated considerably from year to year, with an average
annual increase of about 10 percent from 1973 through 1977. In 1977 however,
the level of imports from Romania was 21 percent below the level achieved
in 1976, and 12 percent below the level of imports from Romania in 1974,
In 1977, the ratio of imports from Romania to apparent U.S. consumption was
22 percent below the 1976 level and 25 percent below the 1974 level. It is
clear therefore that the recent trend in imports from Romania is not "rapidly
increasing," either absolutely or relatively, within the meaning of section
406 of the Trade Act of 1974. Since the criterion of rapidly increasing
imports from Romania has not been met, market disruption by reason of
those imports cannot have occured within the meaning of section 406, and
a negative determination with respect to imports from Romania must be made.

14
ADDITIONAL VIEWS OF COMMISSIONERS GEORGE M. MOORE, CATHERINE BEDELL, AND ITALO H. ABLONDI ON RECOMMENDATIONS OF REMEDY WITH RESPECT TO
IMPORTS FROM THE PEOPLE'S REPUBLIC OF CHINA (INVESTIGATION NO. TA-406-2)
Section 406(a)(3) of the Trade Act requires that if the Commission makes
an affirmative determination of market disruption it must find the amount of the
increase in, or imposition of, any duty or other import restriction which is
necessary to remedy such market disruption. It is our view that the import
restriction which would best remedy the market disruption of clothespins from
the People's Republic of China (China) is a quota. Specifically, we reconnnend
that for a period of five years };/ an annual quota of 431 thousand gross, based
on the average annual quantity of imports during 1975-77, be applied to
cunnnulative imports of clothespins from China classifiable under item 790.05,
790.07, and 790.08 of the TSUS.
Any action taken under section 406 should remedy the market disruption by
the Communist country concerned. A remedy should halt the rapid increases in
imports that are disrupting the U.S. market and should restore trade to more
normal, nondisruptive levels.
Quotas provide the most direct means of regulating imports of clothespins
from China. The quota level can be set at no less than the quantity or value
of the articles imported during the most recent representative period. The 1975-77
period is the most representative period on which to base a quota. Earlier
years are not representative because there were no imports of clothespins from
China prior to 1975. A quota based only on 1976 and 1977 would be weighted too
heavily by the market disrupting years.
};/ Commissioner Ablon i recommends that the quota be applied only for a period of 3 years. He believes that this shorter quota period is of sufficient duration to preclude the rapidly increasing imports into the United States, which leads to market disruption.

15
Using a quota based on the 1975-77 period will reduce imports from China
by approximately one half. This will allow the U.S. industry to regain some
of its market share, particularly in the mass merchandise market segment where
disruption is the most prevalent. The domestic industry will .also benefit from
higher prices.
A reduction in supply of the lowest priced imports, especially those from
China, should induce price levels for domestically produced clothespins which
will reflect increased costs of domestic production. In addition the prices of
clothespins from China should increase. With its market limited to the quota
level there will be no incentive for China to lower prices to gain market share
and it can be expected to raise prices to levels consistent with filling its
quota in order to maximize foreign exchange earnings.

16
REASONS FOR DETERMINATION OF COMMISSIONER BILL ALBERGER AND COMMISSIONER DANIEL MINCHEW
On the basis of the evidence developed during these investigations,
I determine that clothespins from the People's Republic of China (~hina),
but not from the Polish People's Republic (Poland) or the Socialist
Republic of Romania (Romania), are being imported into the United
States in such rapidly increasing quantities that market disruption
exists within the meaning of section 406.
Market disruption has occurred within the meaning of section 406
only if each of the following criteria is met.
The imported articles are--
(1) The product of a Communist country;
(2) Like or directly competitive with a domestically produced article;
(3) Increasing rapidly, either absolutely or relatively; and
(4) A significant cause of material injury or threat thereof, to a domestic industry producing such articles.
The product and the domestic industry
There are four major types of clothespins: spring type clothes-
pins of wood; spring type clo'thespins of plastic; round or square head
non-spring type clothespins of wood; and round or square head non-spring
type clothespins of wood that are iron bound. With price of ten being
the determining factor, all of the aforementioned types of clothespins
are competitive with each other in the market place. The imported
products like and directly competitive with the output of this industry,
enter the United States under items 790.05, 790.07 and 790.08 of the
Tariff Schedules of the United States (TSUS), and these items define

17
the scope of the investigations. The three countries whose imports of
clothespins are under investigation are all clearly "Communist countries"
as that t~rm is used in the statute.
Rapidly increasing
In orde.r to determine, with respect to an article from a communist
country, whe_ther market disruption exists within a domestic industry,
the Commission mt.tst find that imports of that article are "increasing
rapidly, either absolutely or relatively." l/ This "increasing rapidly"
criterion is unique to section 406 cases and, as such, must be defined
in terms of the unique problem that section 406 is intended to address.
That probl~m, as outlined by the Senate Finance Committee Report on
the Trade Act of 1974, is as follows:
... a communist country, through control of the distribution process and the price at which articles are sold ••. could [ direc.t .. exports] so as to flood ! domestic markets within a shorter ·time period than could occur under free market condition. ]:./
Section 406, in short, is designed, to protect domestic industry
from nonmarket-economy countries that may increase expor.ts suddenly
to a very high level. From the language in the Finance Committee Report,
it may thus be inferred that "rapidly increasing" imports are sudden
increases in imports of such quantity, and occurring over such brief
period, as to constitute, or lead to, a flooding of the domestic
market. In addition, a determination of whether imports are increasing
rapidly should include consideration of the following Senate Finance Committee
language:
];/ Public Law 93-618, 88 Stat p. 86 (1974) and 19 U.S.C. 2436 (1974). ~/ U.S. Senate, Trade Reform Act of 1974; Report of the Committee on
Finance, Rept. No. 93-1298 (93rd Cong., 2nd sess.), 1974, p. 210.

18
The increase in imports required by the market disruption criteria must have occurred during a recent peridd of time, as determined by the Commission taking into account any historical trade levels which may have existed. ]/
The statement contains two important points: a) the increase in
imports must have occurred during a recent time period--i.e., the
increase must be proximate in time to the point at which the relevant
information is gathered and the case is decided and b) historical trade
levels are to be considered in deciding whether imports are increasing
rapidly--i.e., the increasing imports must constitute an abnormal
(vis-a-vis previous import-level trends of the country) increase in the
level of imports from the communist country.
Based on this discussion, it is clear that imports of the subject
clothespins from China are "increasing rapidly" within the meaning of
section 406. Over a brief period, 1975-77, imports of wood and plastic
spring clothespins from China suddenly increased by more than 800,000 gross.
China thus increased its share of the imported clothespin market from
a negligible share in 1975 to over 20% in 1977.
It is equally obvious that subject imports from Romania ~ not
"increasing rapidly" within the meaning of section 406. From 1973 to
1977, imports of wood and plastic spring ciliothespins from Romania fluctuated,
increasing irregularly over that time period. Imports from Romania
actually dropped during the most recent year-long period covered by
the investigations--falling by 21%. In 1977, the ratio of imports
from Romania to apparent U.S. consumption was 22% below the 1976 level and
25% below the 1974 level. Such evidence certainly does not warrant a
]_/ U.S. Senate, Trade Reform Act of 1974, Report of the Committee on Finance, Rept. No. 93-1298 (93rd Cong., 2nd sess.), 1974, p. 212.

19
finding of rapidly increasing imports.
The determination with respect to subject imports from Poland
is more difficult. Imports of wood and plastic spring clothespins
from Poland increased from 281,000 gross in 1973 to 506,000 gross in
1977, after falling to 237,000 gross in 1974. The major increase
came from 1974 to 1975, and that jump might be called a rapid increase.
But this rate of increase in imports did not continue--imports have
been increasing only moderately since 1975. Neither of the annual
increases since 1975 was of such a level as to constitute a flooding
of the domestic market. Focusing on the recent increases as suggested
by the Senate Finance Committee, it is obvious that imports for 1976
and 1977 increased gradually--not rapidly--from 433,000 gross in 1975
to 459,000 gross in 1976 to 506,000 gross in 1977. This was a total
increase of only 17%, or less than 10% per year. There has been no
abnormal increase in imports of clothespins from Poland during the
recent period. In fact, imports for the first quarter of 1978 are 14%
below first quarter imports during 1977. On this basis, I determine that
imports of clothespins from Poland are not increasing rapidly within the
meaning of section 406.
Since the criterion of rapidly increasing imports from Romania
and Poland has not been met, market disruption by reason of those
imports cannot have occurred within the meaning of section 406, and
imports from Romania and Poland will not be discussed further in these
views.

20
Material injury
The term "material injury" is not explicitly defined in the Trade
Act. As outlined in its statutory history, however, "material injury"
is intended to represent a lesser degree of injury than the "serious
injury" standard employed in cases under section 201. !!_/ Since the
market disruption definition is formulated along lines similar to the
criteria for import relief in section 201, it is assumed that the economic
factors used to determine "serious injury" are also to be considered
in determining "material injury." However, these factors are to be
analyzed with regard to the fact that they may satisfy the "material
injury" criterion without satisfying the more stringent "serious injury"
standard.
As outlined in section 20l(b)(2) of the Trade Act, the economic
factors to be taken into account when determining injury include
" •.. the significant idling of productive facilities in the industry,
the inability of a significant number of firms to operate at a reason-
able level of profit, and significant unemployment or underemployment
within the industry .••. "
I have also considered and analyzed other economic developments in
the industry to determine whether material injury exists. These include
(1) production and shipments, (2) price levels, (3) inventory levels,
(4) market share of imports, and (5) lost sales.
Capacity utilization.--U.S. producers of clothespins suffered low
levels of capacity utilization during the period of the investigations
(1973-1978). The level of capacity utilization for all domestic
clothespin production facilities fell from 50% in 1973 to 39% in
!!_/ U.S. Senate, Trade Reform Act of 1974, Report of the Committee on Finance, Rept. No. 93-1298 (93rd Cong., 2nd sess.), 1974, p.212.

21
1974 and to 33% in 1975. After an increase to 34% in 1977, the level
of capacity utilization returned to 33% during the first quarter of 1978.
U.S. capacity increased irregularly from 10.6 million gross in 1973
to 12.4 million gross in 1977. Production dropped from 5.3 million gross
in 1973 to 4.2 million gross in 1977 - a decline of 21%. Capacity utilization
for wood spring clothespins - which now account for virtually ail imports
from China - dropped from 67% in 1973 to 42% in 1977.
Profitability.--The four domestic clothespin producers have exper
ienced a dramatic decline in profitability on all their clothespin oper
ations since the peak year of 1975. In that year, the ratio of net
op~rating profit to net sales was 8.3 percent. By 1976 it had dropped
to 1.0 percent and by 1977 the ratio had further declined to 0.7 percent.
Employment.--Employment in the domestic clothespin industry has
fluctuated during the 1973-77 period. The average number of production
and related workers in the clothespin industry declined irregularly
from a peak of 429 workers in 1973 to 387 workers in 1977. The total
number of person-hours worked in clothespin production experienced the
same trend, falling from a high of 820 thousand hours in 1973 to 720
thousand hours in 1977.
Production and shipments.--U.S. producers' shipments of clothespins
declined from 5,366,000 gross in 1973 to 4,126,000_in 1977, a drop of 23%.
U.S. production of all clothespins dropped from 5,301,000 gross in 1973
to 4,153~000 gross in 1977, a drop of 21%.
Inventories.--U.S. producers' inventories of wood spring clothespins
have declined steadily during the 1973-77 period, from a high of 1,037
thousand gross in 1973 to 675 thousand gross in 1977. During the same
period, inventories of non-spring type wood clothespins,declined irreg-

22
ularly from 242 thousand gross in 1973 to 143 thousand gross in 1977.
Total inventories of all clothespins ·have also declined steadily from
19 7 3 to 19 77.
Prices and price suppression.--Since the last quarter of 1974,
prices of domestic clothespins have remained in the $2.00 range (with
the exception of one firm) despite rising production costs. The first
quarter of 1978 saw a decline in the price of wood spring clothespins,
attributed by at least one firm as an effort to compete with imported
clothespins.
The price of Chinese wood spring clothespins for their largest
volume sales to U.S. importers declined gradually from a high of $1.70
in 1975 to $1.04 in the first half of 1977. Although prices have
increased to $1.13 as of the first quarter of 1978, prices -0£ Chjnese
wood spring clothespins are approximately $1.00 less than the three
largest domestic producers' clothespins.
Imports and market share.--Total U.S. imports of wood and plastic
spring clothespins increased from 1,911,000 gross in 1973 to 3,098,000
gross in 1977. Imports fell from 1,911,000 gross in 1973 to 1,661,000
gross in 1974; then increased over the next two years to 3,158,000
gross in 1976. In 1977, U.S. imports fell to the 3,098,000 gross level.
Imports of wood and plastic spting clothespins from nonmarket economy
countries account for 88% of this overall increase in total imports
from 1973-77.
Imports ~f wood and plastic spring clothespins from China, Poland,
and Romania (cumulated) have more than tripled from 477,000 gross in 1973
to 1,643,000 gross in 1977 - an increase of 244%. Imports from these
23
three nonmarket countries increased from 477,000 gross in 1973 to
582,000 gross in 1974 and continued up to 675,000 gross in 1975.
The largest percentage increase during the four-year period covered
by the investigations came in 1976, when aggregate imports from these
three countries jumped 87%--from 675,000 gross in 1975 to 1,264,000 gross
in 1976. Increasing imports from China accounted for most of this single
year increase.
U.S. imports of wood and plastic spring clothespins from China
increased dramatically from 0 in 1974 to a level higher than that of any
other supplying country in 1977. China sharply increased its share of the
imported clothespin market from a nominal percentage in 1975 to over 26%
in 1977.
Total U.S. imports of wood and plastic spring clothespins accounted
for 31% of domestic consumption in 1973 and 47% of domestic consumption
in 1977. Wood and plastic spring clothespins from nonmarket economy
countries accounted for 10% of domestic consumption in 1973 and 25% in
1977.
Wood and plastic spring clothespins from China accounted for 0% of
domestic consumption in 1974, but leaped above 12% in 1977.
Lost sales.--One case of lost sales directly attributable to China
has been verified by the Commission staff. In addition, three lost
sales were partially attributed to imported Chinese clothespins.
Summary.--Considering all these factors, on balance, I believe
that material injury does exist. Capacity utilization has been very low
for some time and is declining, profitability has been very low
for the past two years, employment is down, production and shipments
are down, prices have remained almost constant since 1974 in.·the face of

24
rising costs, market share has been lost to imports, and specific sales
have been verified as lost to lower priced imports from China. Inventories
have fallen, but that is the only trend arguing against injury to the
domestic industry.
Significant cause
The term "significant cause" was intended by the Finance Committee to
be an easier standard to satisfy than the "substantial cause" criterion
in section 201. 21 While "significant cause" requires a direct causal
link between increased imports and injury, 2_/ it does not require that
imports be a cause which is "important and not less than any other cause"
of injury (as would be required under "substantial cause" in section 201).
It is assumed that a determination of "significant cause," like
"substantial cause," "shall take into account all economic factors which
[the Commission] considers relevant, including (but not limited to) .••
an increase in imports (either actual or relative to domestic production)
and a decline in the proportion of the domestic market supplied by
domestic producers." ]_/
In this case, imports from China have gained a larger share of the
U.S. market in the past three years, from a negligible share to well over
12%. There are other factors which may also be contributing aauses
of injury. Clearly, other imports are a factor; and I have some
21 U.S. Senate, Trade Reform Act of 1974, Report of the Committee on Finance, Rept. No. 93-1298 (93rd Cong., 2nd sess.), 1974, p. 212.
6/ Ibid., p. 212. 7 I Ibid.·. p. 35.

25
concern after detailed study by our staff of the financial reports
of the domestic producers, that some management problems and other
non-import related losses have also contributed. However, under this
statute, since I do not have to find a substantial ca.use, it is
clear to me that imports from China do constitute a significant
cause of the material injury to the domestic industry. Thus, I find
that market disruption does exist with respect to imports from China.

26
VIEWS OF VICE CHAIRMAN BILL ALBERGER AND COMMISSIONER DANIEL MINCHEW ON REMEDY
Section 406(a)(3) of the Trade Act requires that if the Connnission
makes an affirmative determination of market disruption it must find
the amount of the increase in, or imposition of, any duty or other import
restriction which is necessary to prevent or remedy such market disrup-
tion. It is our view that the import restriction which would best remedy
the market disruption of ~lothespins from the People's Republic of China
(China) is a quota. Specifically, we reconnnend that in the first year
a quarterly quota equal to one-fourth the average annual quantity of im-
ports during 1975-77 be applied to cumulative imports from China under the
three TSUS categories for clothespins and that the quota amount be
increased by five percent each of the following four years as follows:
Quarterly import quota on clothespins from China classifiable under items 790. 05, 790.07, and 790.08 of the TSUS:
(In thousand gvGJss)
1st 2nd 3rd 4th 5th year year year year year
107,500 113,250 118, 750 124,750 131,000
Any action taken under 406 should remedy the injury caused or threatened
by the market disruption of the Communist country involved. A remedy for
disruption, to be beneficial to the domestic clothespin industry must
allow it to regain its market share and,; and in this case, to raise prices
which have been held down since the peginning of 19_75. However, import re-
strictions imposed

27
on China would benefit other foreign suppliers as well as U.S. producers.
Thus, Taiwan, Poland, Hong Kong, West Germany and other exporters would be
expected to capture a part of any additional market for clothespins created
by a displacement of imports from China as a result of a 406 remedy.
Because of other import competition,such a disruption remedy is unlikely to
completely restore the health of the domestic industry. The Commission has,
in fact, initiated on its own motion, an investigation under section 201 of
the Trade Act of 1974 to determine whether imports of clothespins are
increasing in such quantities as to be a substantial cause of serious
injury to the domestic industry.
Both quotas and tariffs were considered as' possible remedy alternatives.
Because certain drawbacks in applying tariffs exist in this instance
while possible problems of a quota do not, quotas were chosen as the best
remedy. In assessing the probable impact of a tariff increase, it is
usually assumed that foreign suppliers would pass on a significant part of
the increase to importers. This assumption may often be plausible in
the case of market economies, but its validity is questionable in the case
of Communist countries. Stnce prices in China are not known to bear a
direct relation to production costs, it is possible that China would absorb
a large part, or all of a given tariff increase to maintain or expand its
present share of the U.S. clothespin market.
In this instance, quotas provide the most direct means of regulating
imports of clothespins from China. The quotas would apply only to China
and if shortages develop, increased supplies could be obtained from other
exporting countries as well as from U.S. producers. With the U.S. industry
operating at only 34 percent of capacity, it should be able to sharply
increase production.

28
As stated earlier, the quota level can be set at no less than the
quantity or value of the articles imported during the most recent represen
tative period. The 1975-77 period seems to be the most reasonable one on
which to base a quota. Including earlier years would not be representative
because there were no recent imports of clothespins from China prior to
1975. A quota based on 1976-77 would be weighted too heavily by the
market disrupting year.
A quarterly rather than yearly application of the quota was chosen
to prevent excessively large shipments in a single quarter which could
be disruptive. As a nonmarket-economy country, China is able to control
the distribution process and the price at which articles are sold. It is
conceivable, therefore, that China could export its entire yearly quota
(or a large percentage of that quota) to the U.S. during a single quarter;
in which case, the rapid increase in imports might result in market dis
ruption despite China's compliance with the yearly quota level. By
applying the quota on a quarterly basis, this potential disruption of the
market is avoided.
Using a quota based on the 1975-77 period would reduce imports from
China by approximately one half. If the entire displacement was gained
by the U.S. industry, its market share based on 1977 consumption would
increase from 54 percent to slightly below the 62 percent market share
attained in the profitable year of 1975. In fact the displacement would be
partly taken up by other imports. However, the domestic industry would
benefit not only from an increased market share, but also from higher prices.

29
A reduction in supply, especially of the lowest priced imports, those
from China, should induce higher price levels in the U.S. market. In
addition, the prices of clothespins from China should increase. With its
market limited to the quota level there would be no incentive to lower
prices to gain market share and China could be expected to raise prices
to levels consistent with filling its quota in order to maximize foreign
exchange earnings.
Remedy restrictions would be in effect for a five year period. If
quotas were held fixed, in the sixth year when they were lifted, imports
from China might increase markedly, causing market disruption. Increasing
the quota by 5 percent a year during the 5 year remedy period assumes
a growth in consumption over the next five years at a similar level to the
growth in consumption of wood and plastic spring clothespins over the previous
five years, and should help the domestic industry adjust gradually toward the
ensuin$ period of trade unrestricted by quotas.

30
Views of Chairman Joseph O. Parker
Following the receipt of a petition filed on behalf of the Clothespin
and Veneer Products Association, the United States International Trade
Commission, on May 16, 1978, instituted three investigations under section
406(a) of the Trade Act of 1974 to ?etermine, with respect to imports
of clothespins provided for in items 790.05, 790.07, and 790.08 of the
Tariff Schedules of the United States (TSUS) which are the products of
the People's Republic of China, the Polish People's Republic
(Poland), and the Socialist Republic of Romania (Romania), whether market
disruption exists with respect to such articles produced by a domestic
industry. The Counnission has conducted one other investigation under
this section of the Trade Act.!/
Determination
On the basis of information developed during the course of investigations
No. TA-406-2 and TA-406-3 concerning clothespins provided for in items
790.05, 790.07, and 790.08 of the TSUS which are products of the People's
Republic of China and Poland, I determine that market disruption, within the
meaning of section 406, exists with respect to an article produced by a domestic
industry. In investigation No. TA-406-4, with respect to imports of such
clothespins from Romania, I determine that market disruption, within the
meaning of section 406, does not exist with respect to an article produced
by a domestic industry.
The domestic industry
·The imported clothespins which are the subject of these investigations
!/ Certain Gloves from the People's Republic of China, Report to the President on Investigation No. TA-406-1 .•• , USITC Pub. 867, March 1978.

31
are like or directly competitive with various types of clothespins including
spring type clothespins of plastic or wood, nonspring wood clothespins and
nonspring wood clothespins which are iron bound. Presently, there are
five producers of clothespins in the United States. The production
facilities of the three largest producers are located in
Maine. One of these three produces only clothespins, while the other two
produce other articles. Two of the Maine production facilities are located
in Oxford County, which has the highest unemployment rate in Maine. The
two producers located outside of Maine are both located in
Montpelier, Vt., and of the two, one produces only clothespins.
Statutory criteria
In an investigation under section 406(a) of the Trade Act of 1974, the
Commission must determine if there has been "market disruption." That term
is defined in section 406(e)(2) as follows:
Market disruption exists within a domestic industry whenever imports of an article, like or directly competitive with an article produced by such domestic industry, are increasing rapidly, either absolutely or relatively, so as to be a significant cause of material injury, or threat thereof, to such domestic industry.
Are increasing rapidly.--In order to make an affirmative determination
that market disruption exists, it must .be determined that imports "are
increasing rapidly, either absolutely or relatively." As indicated by
the following statement from the report of the Senate Committee on Finance on
section 406, a current time frame is to be used in determining if market
disruption exists:

32
The increase in imports required by the market disruption criteria must have occurred during a recent period of time, as determined by the Commission taking into account any historical trade levels which may have existed. J_/
The increase in imports must also be rapid and must involve a quantum
of imports which would be of a weight necessary to meet the injury
requirement of the statute.
In 1974 there were no imports from the People's Republic of China of the
types of clothespins covered by the Commission's investigation. In 1976, imports
from the People's Republic of China reached over 400,000 gross and in 1977, over
800,000 gross were imported. In 1974, over 230,000 gross of clothespins were
imported from Poland. Such imports increased each year thereafter, and in 1977
totaled over 500,000 gross, an increase of over 100 percent since 1974. There
has been a substantial percentage increase each year over the preceding year's
increasing level of imports. The total of the two countries accounted for
over 20 percent of U.S. consumption in 1977. On the basis of these factors,
imports from the People's Republic of China and Poland are· found to be
increasing rapidly, within the meaning of section 406.
In contrast to the rapidly rising tr~nd in imports from the People's
Republic of China and Poland, imports from Romania have been irregular. In
1977, imports of clothespins from Romania declined to 302,000 gross from 383,000
gross imported in 1976 and were also less than such imports in 1974. In 1977,
imports from Romania were significantly less than imports from either the
People's Republic of China or Poland. In my judgment, imports from Romania are
not increasing rapidly. !:_/
!/Trade Reform Act of 1974: Report·of the Coiillilittee ort·Finance ••• , Report No. 93-1298, Nov. 1974, p. 212.
J:.../ Since imports from Romania are not increasing rapidly, the statutory criteria for an affirmative determination of market disruption with respect to imports from Romania cannot be-: satisfied.

33
Significant cause of material injury.--The statutory phrase "significant
cause of ~aterial injury" is different from that which appears in section 201
of the Trade Act of 1974. In explanation of these differences, the report
of the Senate Committee on Finance states:
This market disruption def ininition contained in the Conunittee bill is formulated along lines similar to the criteria for import relief under section 201 of this bill. However, the market disruption test is intended to be more easily met than the serious injury tests in section 201. While section 20l(b) would require that increased imports of the article be a "substantial cause" of the requisite injury or the threat thereof, to a domestic industry, section 406 would require that the article is being, or is likely to be imported in such increased quantities as to be a "significant cause" of material injury, or the threat thereof. The term "signficant cause" is intended to be an easier standard to satisfy than that of "substantial cause." On the other hand, "significant cause" is meant to require a more direct causal relationship between increased imports and injury than the standard used in the case of worker, firm and community adjustment assistance, i.e., "contribute importantly." In addition, the term "material injury" in section 406 is intended to represent a lesser degree of injury than the term "serious injury" standard employed in section 201. ±./
Although the term "significant cause" is not defined in the statute,
it is clear from the legislative history that it is intended to be an
easier standard to satisfy than the "substantial cause" standard of section
201, which is defined in that section as "a cause which is important and
not less than any other cause." J:j The "significant cause" standard of
section 406 is, however, a higher standard than that required in adjustment
assistance cases. In adjustment assistance cases, the causation standard
"contribute importantly" is defined in the relevant sections of the Trade
Act of 1974 as " a cause which is important but not necessarily more
±./ Trade Reform Act of 1974: !:_I 19 u.s.c. 22Sl(b) (4).
Report of the Committee on Finance • . . , p. 212.

34
important than any other cause." 1/ The causal connection between
the imports of clothespins and any material injury to the domestic industry
must be factually identifiable.
The term "material injury" is also not defined in the statute. The
statutory history indicates, however, that "material injury" is intended to
represent a lesser degree of injury than the "serious injury" standard of
section 201.
Imports of clothespins from the People's Republic of China increased from
negligible in 1975 to over 800,000 gross in 1977. In this 3-year
period, as a percentage of domestic consumption, imports from the People's
Republic of China increased from a negligible level to more than 12 percent.
There were substantial increases each year from 1975 to 1977. Imports from
Poland more than doubled between 1974 and 1977, and in the latter year
captured more than 7 percent of the U.S. market. These imports also
increased substantially each year during the period 1974-77. The two
countries together captured more than 20 percent of U.S. consumption in 1977.
The clothespins imported from both the People's Republic of China and
Poland were sold by U.S. importers at prices well below those of U.S. producers.
The lowest prices charged by U.S. importers on their largest volume sales
of wood spring clothespins '.!:./ imported from the People's Republic of China
dropped sharply in the fourth quarter of 1976 and remained well below those
of all U.S. producers through the first quarter of 1978. These
prices have been as much as SO percent below the prices of U.S. producers.
Similar price comparisons between clothespins imported from Poland
1/ 19 u.s.c. 2272, 2341, 2371. 2/ Wood spring clothespins comprise virtually the only type of clothespin
exported by the countries under examination. This type of clothespin accounted for approximately 80 percent of U.S. production for 1973-77.

35
and those charged by U.S. producers established that in all but one quarter
of 1977, the imported clothespins undersold domestically produced clothespins,
in some cases by margins of over 25 percent.
Lower priced imports from the People's Republic of China and Poland
have resulted in their increased penetration of the U.S. ma~ket, and the domestic
producers' share of the U.S. market has declined. U.S. producers accounted
for over two-thirds~of domestic consumption in 1973. In 1977, their share
was reduced to approximately one-half. U.S. producers' shipments ~f 3.4 million
gross in 1977 were over 500,000 gross less than shipments in 1974, and
almost 800,000 gross less than in 1973. Domestic producers' capacity utilization
decreased from SO percent in 1973 to 33 percent in 1977.
In general, U.S. producers prices have increased only slightly since
1975, and in some cases during 1977 they were lower than in previous years.
However, the average unit cost of producing clothespins of all
domestic producers has increased.
With static sales prices and a declining market share, the domestic
producers have experienced reduced profits. The aggregate net operating profit
for all domestic clothespin operations fell from $651,000 in 1975 to
$54,000 in 1977, a 92 percent decrease. The ratio of net operating profit
to net sales declined from 8.3 percent to 0.7 percent during 1975-77.
Employment in the clothespin industry has followed the above mentioned trends.
The number of workers exclusively engaged in the manufacture of clothespins also
declined irregularly from 429 workers in 1973 to 387 workers in 1977. The
number of hours worked by the remaining workers also diminished.

36
In my judgment the Commission's investigations have established that,
with respect to imports of clothespins from the People's Republic of China
and Poland, market disruption exists with respect to an article produced
by a domestic industry.

37
Additional Views of Chairman Joseph 0. Parker With Respect to Remedy
Pursµant to section 406(a)(3) of the Trade Act, if the Commission makes
an affirmative determination of market disruption, it must find the amount
of the increase in, or imposition of, any duty or other import restriction
which will remedy such market disruption. In my judgment, the imposition
of a quota, as recommended herein, on imports of clothespins from the
People's Republic of China will remedy the market disruption which has been
found to exist. Specifically, I recommend that, for a period of 5 years,
an annual total quota of 431,000 gross, based on the average annual
quantity of imports during 1975-77, be applied to cumulative imports of
clothespins from the People's Republic of China classifiable under items
790.05, 790.07, and 790.08 of the Tariff Schedules of the United States.
A quota provides a direct means of regulating imports of clothespins
from the People's Republic of China. If a quota is imposed by the President,
by statute the quota level can be set at no less than the quantity or value
of the articles imported during the most recent representative period. !/
My reconnnended quota is, therefore, based on my judgment that the 1975-77
period is the most representative period on which to base a quota. Earlier
years are not representative because there were no imports of clothespins from
the People's Republic of China prior to 1975. A quota based only on 1976
and 1977 would be weighted too heavily by the market disrupting years.
!/ 19 u.s.c. 2253(d)(2).

38
A quota based on 1975 alone, as urged by petitioners, would reduce imports
from the People's Republic of China to almost zero. Using a quota based on
the 1975-77 period would reduce imports from China by approximately one
half and would remove the market disruption caused by the imports from
the People's Republic of China.
Whether a reduction in supply of the lower priced imports from the
People's Republic of China will induce higher price levels for domestically
produced clothespins is uncertain because or the supply of clothespins from
other sources and the inability to accurately predict the price at which
imports from the People's Republic of China will be sold. There are several
other foreign suppliers of clothespins to the U.S. market and with the
ease with which production of this product can be increased or transferred
to other countries, it is possible the effect of the quota on imports from
the People's Republic of China may be offset by increased imports from
other countries.

A-1
INFORMATION OBTAINED IN THE INVESTIGATION
Summary
Following receipt of a petition filed on behalf of the Clothespin & Veneer Products Association (CVPA), the U.S. International Trade Commission, on May 16, 1978, instituted investigations under section 406(a) of the Trade Act of 1974 to determine, with respect to imports of clothespins which are the products of the People's Republic of China, !/ the Polish People's Republic, and the Socialist Republic of Romania, whether market disruption exists with respect to such articles produced by a domestic industry.
There are four major types of clothespins: wood spring clothespins, plastic spring clothespins, roundhead or squarehead nonspring clothespins of wood, and nonspring ironbound clothespins of wood.
Clothespins are provided for in items 790.05, 790.07, and 790.08 of the Tariff Schedules of the United States (TSUS). Virtually all U.S. imports of clothespins from China, Poland, and Romania are classified under TSUS item 790.05. The column 1 (most-favored-nation) rate of duty for wood and plastic spring clothespins (TSUS item 790.05) is 10 cents per gross; the column 2 rate is 20 cents per gross. Both Poland and Romania receive most-favored-nation treatment for their products exported to the United States. U.S. imports of clothespins for consumption, by types and by pri~cipal sources are shown in the table on the following page.
Five U.S. firms currently produce clothespins; three have plants in Maine, and two have plants in Vermont. The average number of production and related workers employed in the production of clothespins declined irregularly from 429 workers in 1~73 to 387 workers in 1977. U.S. capacity, production, and capacity utilization are shown in the table on.page A-3.
1/ The People's Republic of China is hereafter referred to in the report as ChTna; the Republic of China is referred to as Taiwan.

A-2
Clothespins: U.S. imports for consumption, by types and principal sources, 1973-77, January-March 1977, and January-March 1978
(In thousands of gross)
Jan.-March Type and source 1973 1974 1975 1976 1977
1977 1978
Wood and plastic spring clothespins: From nonmarket-economy countries:
China--------------------------------: *** *** *** *** *** *** Poland-------------------------------: 281 237 433 459 506 127 Romania------------------------------: *** *** *** *** *** ***
Subtotal---------------------------: 477 582 675 1,264 1,643 301 All other nonmarket-economy
countries------------------------: 136 130 116 146 18 18 Total------------------------------: 613 712 7 91 1,410 1,661 319
From market-economy countries: Taiwan-------------------------------: l 4 342 743 828 245 All other market-economy countries---: 1,2 97 945 1,208 1,005 609 371
Total------------------------------: 1, 2 98 949 1 ,5SO 1,77+8 I,7+37 6Hi Total, all countries---------------: 1, 911 1,661 2,341 3,1S8 3,098 935
Other clothespins: From nonmarket-economy countries:
China--------------------------------: 0 0 3 6 0 0 All other----------------------------: 0 0 0 0 0 0
Total------------------------------: 0 0 J 6 0 0 From market economy countries:
Taiwan-------------------------------: 1/ 0 7 1 25 0 Hong Kong----------------------------: 5 2 10 6 6 2 West Germany-------------------------: 176 151 158 220 299 134 All other market-economy countries---: 22 32 4 16 29 0
Total------------------------------: 203 163 179 21;3 :'}59 136 Total, all countries---------------: 203 163 182 249 359 136
Total: From nonmarket-economy countries:
China--------------------------------: *** *** *** *** *** *** Poland-------------------------------: 281 237 433 459 506 127 Romania------------------------------: *** *** *** *** *** ***
Subtotal---------------------------: 477 582 678 1,270 1,643 301 All other nonmarket-economy
countries------------------------: 136 130 116 146 18 18 Total------------------------------: 613 712 792+ 1,416 1,661 319
From market-economy countries: Taiwan-------------------------------: 1 4 349 744 853 247 All other market-economy countries---: 1,500 1,108 1,380 1,247 943 505
Total------------------------------: 1,501 1,112 1, 729 1, 991 1, 796 1S2 Total, all countries---------------: 2, 114 I ,a24 2,;23 3,407 3, i+s =; 1,071
1/ Less than 500 gross.
Source: Imports from China and Romania compiled from responses to questionnaires of the U.S. International Trade Commission; all other imports, including totals, compiled from official statistics of the U.S. Department of Commerce.
*** 109 *** 310
0 310
201 309 510 820
l/
I/
l 2
63 2
68 68
*'** 109·· *** 310
0 :'310
202 376 578 8!11!

A-3
Clothespins: U.S. capacity, production, and capacity utilization, by types, 1973-77
Type and year Capacity Production Capacity utilization
Wood and plastic spring clothespins: 1973------------------------------------: 1974------------------------------------: 1975------------------------------------: 1976------------------------------------: 1977-------------------------------------
0tber clothespins: 1973------------------------------------: 1974------------------------------------: 1975------------------------------------: 1976------------------------------------: 1977------------------------------------:
Total: 1973------------------------------------: 1974------------------------------------: 1975------------------------------------: 1~76------------------------------------: 1977------------------------------------:
1,000 gross
6,623 8,387 8, 379 8,353 8,432
3, 950 3, 950 3, 950 3, 950 3, 950
10,573 12,337 12' 32 9 12,303 12,382
:1,000 gross Percent
4, 342 3' 9.!+3 3' 198 3,307 3,472 . 0 .
959 898 840 798 681
5,301 4,8.'.+l 4,038 4, 105 4,153
Source: Compiled from data submitted in response to questionnaires of the U.S. International Trade Commission.
Data on U.S. producers' shipments, imports, and apparent consumption of
clothespins are shown in the table or page A-4.
Data on the profit-and-loss experience of the domestic producers on all clothespin operations and pricing data for wood spring clothespins are shown in the tables on pages A-5 and A-6,
66 47 38 40 41
24 23 21 20 17
50 39 33 33 34
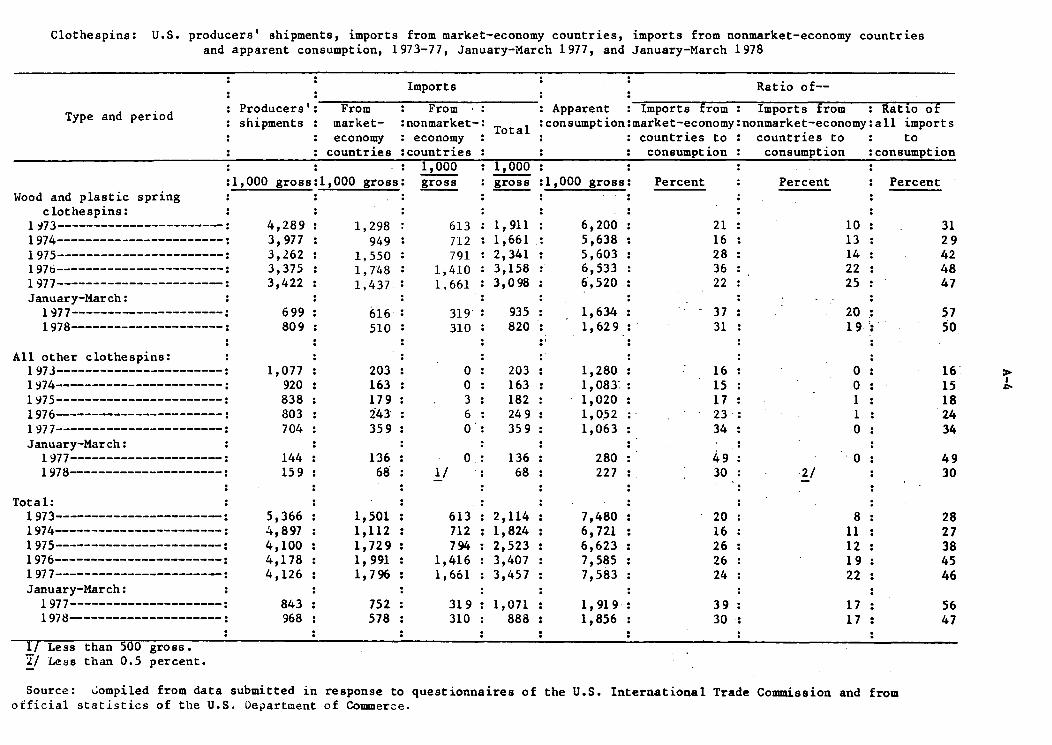
Clothespins: U.S. producers' shipments, imports from market-economy countries, imports from nonmarket-economy countries and apparent consumption, 1973-77, January-March 1977, and January-March 1978
Imports Ratio of--
From : From : : Apparent : --Imports from : fmports from---: RatiOOI Type and period
Producers': shipments market- :nonmarket-: T 1 :consumption:market-economy:nonmarket-economy:all imports ota . . economy : economy : : : countries to : countries to : to
countries :countries : : : consumption : consumption :consumption 1, 000 : 1, 000
:1,000 gross:l,000 gross: gross : gross :1,000 gross: Percent Percent Percent Wood and plastic spring
clothespins: 1~73-----------------------: 4,289 : 1,298 : 613 : 1, 911 : 6,200 : 21 : 10 : 1974-----------------------: 3, 977 : 949 : 712 : 1, 661 : 5,638 : 16 : 13 : 1975-----------------------: 3,262 : 1,550 : 791 : 2,341 : 5,603 : 28 : 14 : 1976-----------------------: 3, 375 : 1, 748 : 1,410 : 3,158 : 6,533 : 36 : 22 : 1977-----------------------: 3,422 : 1.437 : l. 661 : 3, 0 98 : 6,520 : 22 : 25 : January-March:
1977---------------------: 699 : 616 : 319' : 935 : 1,634 : 37 : 20 .: 1978---------------------: 809 : 510 : 310 : 820.: 1, 62 9 : 31 : 19 ': .. .
All other clothespins: : : : : .. 1973-----------------------: 1, 077 : 203 : 0 : 203 : 1,280 : 16 : 0 : 1~74-----------------------: 920 : 163 : 0 : 163 : 1,083'.: 15 : 0 : 1Y75-----------------------: 838 : 17 9 : 3 : 182 : 1,020 : 17 : 1 : 1976-----------------------: 803 : 2°43' : 6 : 24 9 : 1, 0.52 : . 23 : 1 : 1977-----------------------: 704 : 35 9 : 0.: 35 9 : 1,063 : 34 : 0 : January-March: : . : : : . . . . .
1977---------------------: 144 : 136 : 0 • 136 : 280 : 49 : . 0 : .. 1978---------------------: 15 9 : 68' : 1/ .. 68 : 227 : 30 : 2/ : . . : . . . : . . . . .
Total: : . . . . . 1973-----------------------: 5,366 : 1,501 : 613 : 2,114 : 7,480 : 20 : 8 : 1974-----------------------: 4, 897 : 1,112 : 712 : 1, 824 : 6, 721 : 16 : 11 : 1975-----------------------: 4, 100 : 1,729: 794 : 2,523 : 6,623 : 26 : 12 : 1976-----------------------: 4,178 : 1, 991 : 1 '416 : 3 '40 7 : 7,585 : 26 : 19 : 1977-----------------------: 4,126 : 1,796 : 1,661 : 3,457 : 7,583 : 24 : 22 : January-March:
1977---------------------: 843 : 752 : 319 : 1, 071 : 1, 919 : 39 : 17 : 1978---------------------: 968 : 578 : 310 : 888 : 1, 856 : 30 : 17 : . . : . . . . . .
1/ Less than SOO gross. 7./ Less than 0.5 percent.
Source: ~ompiled from data submitted in response to questionnaires of the U.S. International Trade Commission and from official statistics of the U.S. Department of Commerce.
31 29 42 48 47
57 so
16' 15 18 24 34
49 30
28 27 38 45 46
56 47
> I
"'"

A-5
Aggregate profit-and-loss experience of the CVPA companies,on all their clothespin operations, 1973-77
. : Net :Year and firm sales
sales
1973:National-----------:Diamond------------:Forster------------:Penley-------------:
Total------------
19~74:National-----------Diamond------------Forster------------Penley-------------:
Total------------:
1975:National-----------:Diamond------------:Forster------------:Penley-------------:
Total------------
1976:National-----------Diamond------------Forster------------Penley------------:
Total------------:
1977:National 1/--------Diamond------------Forster------------Penley-------------Total------------:
6,473,678
7,898,542
7,862,559
8,199,307
8,030,673
1/ Data are based on the first
Cost of Administrative Net operatinggoods : rofi and selling profit or (loss)sold expenses before taxes
5,380,494 :1,093,184 -1,402,018 : (338,834):
6,244,393 1,654,149 : 1,646,749 7,400
* ***
5,21,205 2,341,354 1,690,019 : 651,335
**:* : *** :**:
6,351,647 :1,847,660 1,820,485 : 81,045
6,301,952 : 1,728,721 : 1,674,851 53,870
months of National's fiscal year.
Ratio of netnet operating
profit or (loss)to net sales
Percent
8.3
1.0
.7
Source: Compiled from data submitted in response to questionnaires of the U.S. International TradeCommission.
-
^

A-6
Wood spring clothespins: Lowest prices of U.S. producers and importers on their largest volume sales to their U.S. customers, by quarters, January 1973-March 1978
(Per gross) Importers of clothespins Weighted average
u.s. producers from nonmarket-economy :price of importers
Period countries :of clothespins fro
Forster ~Diamond~ Penley National Poland China Romania :all market-economy .. countries . 1973:
Jan. -Mar--: *** *** *** *** *** *** *** $1.0 Apr.-June-: *** *** *** *** *** *** *** 1.0 July-Sept--: *** *** *** *** *** *** *** 1.0 Oct.-Dec--: *** *** *** *** *** *** *** 1.1
1974: Jan.-Mar---: *** *** *** *** *** *** *** l.l Apr.-June-: *** *** *** *** *** *** . *** l. l . July-Sept--: *** *** *** *** *** *** *** 1.3 Oct.-Dec--: *** *** *** *** *** *** *** 1.3
1975: Jan.-Mar---: *** *** *** *** *** 1. 70 *** 1.4 Apr. -June- : *** *** *** *** *** -1. 70 *** 1.3 July-Sept-: *** *** *** *** *** 1. 70 *** 1.3 Oct.-Dec---: *** *** *** *** *** l. 70 *** 1.3
1976: Jan.-Mar---: *** *** *** *** *** 1.46 *** 1.3 Apr.-June-: *** *** *** *** *** 1.46 *** 1.2 July-Sept-: *** *** *** *** *** 1.46 *** l. 3 Oct.-Dec---: *** *** *** *** *** 1.18 *** 1.4
1977: Jan.-Mar---: *** *** *** *** *** 1.04 *** 1.4 Apr.-June-: *** *** *** *** *** 1.04 *** 1.4 July-Sept-: *** *** *** *** *** 1.11 *** 1.4 Oct.-Dec--: *** *** *** *** *** 1.13 ***
1.49
1 ~78: Jan.-Mar---: *** *** *** *** *** 1.13 *** 1.5 . . !f Quantity sold at this i less than 1, 000 gross. price was
Source: Compiled from data submitted in response to questionnaires of the U.S. International Trade Commission.

A-7
Introduction
On May 3, 1978, the United States International Trade Commission received a petition filed on behalf of the Clothespin & Veneer Products Association (CVPA), for import relief under section 406 of the Trade Act of 1974. On May 16, 1978, the Commission instituted investigations under section 406(a) of the Trade Act of 1974 to determine, with respect to imports of clothespins provided for in items 790.05, 790.07, and 790.08 of the Tariff Schedules of the United States (TSUS), which are the products of the People's Republic of China, 1/ the Polish People's Republic, and the Socialist Republic of Romania, whether-market disruption exists with respect to such articles produced by a domestic industry. Section 406(e)(2) of the Trade Act defines market disruption to exist within a domestic industry if~
* * * imports of an article, like or directly competitive with an article produced by such domestic industry, are increasing rapidly, either absolutely or relatively, so as to be a significant cause of material injury, or threat thereof, to such domestic industry.
By statute, the Commission must render its determination to the President within 3 months of receipt of the petition or, in this case, by August 3, 1978.
Notice of the institution of the Commission's investigations and of a public hearing to be held in connection therewith was duly given by posting copies of the notice in the Office of the Secretary, United States International Trade Commission, Washington, D.C., and in the Commission's New York Office, and by publishing the notice in the Federal Register of May 22, 1978 (43 F.R. 21952). 2/ In accordance with the notice, a public hearing was held on June 22, 1978,-in Portland, Maine.
Description and Uses
There are four major types of clothespins: spring-type clothespins of wood, spring-type clothespins of plastic, roundhead or squarehead nonspring-
· type clothespins of wood, and round or squarehead non-spring type clothespins of wood that are iron bound. With price often being the determining factor, all the aforementioned types of clothespins are competitive with each other in the marketplace. Other key consumer factors are size, strength, and durability.
U.S.-produced clothespins are manufactured primarily from beech, with maple being substituted if beech is unavailable. Polish clothespins are
1/ For the purposes of this report, the People's Republic of China is referred to as China and the Republic of China is referred to as Taiwan.
2/ A copy of the Commission's notice of investigation and hearing is presented in app. A.

A-8
manufactured from hornbeam or beech, and clothespins from Taiwan, Hong Kong, and China are made of jelutong or ramin. All these woods are hardwood.
In the domestic manufacturing process for wood spring clothespins, the wood is sawed to the length of the prospective clothespins and then grooved. The wood is then sawed or sliced to the required widths. The unassembled clothespin parts are tumble dried for 8 to 10 hours in large dryers, with small amounts of paraffin wax added. This drying process provides the clothespin parts with a smooth, "finished" appearance. Finished unassembled clothespin parts are then fed into an assembly machine, where small galvanized steel wire springs are attached to complete the wood spring clothespins. The galvanized steel wire from which the springs are made is primarily from Belgium.
Unassembled plastic spring clothespin parts are made by the injectionmolding process and then assembled on the dame assembly machines as the wood sp~ing clothespins. The first plastic clothespin was pioneered by Vermont Plastics, Inc., Montpelier, Vt., in 1946. In 1959, Vermont Plastics introduced a hanger-shaped clothespin. However, the cost of producing plastic spring-type clothespins has been rapidly increasing because of rising petroleum prices. Thus, plastic spring clothespins are currently too costly, in relation to the wooden product, to manufacture and sell. Plastic spring-type clothespins accounted for only 6.4 percent of U.S. clothespin consumption during January-March 1978.
Domestic roundhead nonspring clothespins of wood are manufactured from the same hardwoods as wood spring clothespins. However, in the manufacturing process, the wood is sawed and shaped into thin poles, which are then cut to clothespin size. The round head of the clothespin is formed on a wood-molding machine, and the slit is made by a grooving process. Like the unassembled wood spring clothespin parts, the roundhead clothespins are put in large dryers with paraffin wax added to give the clothespins a smooth, finished appearance.
Ironbound wooden clothespins are actually roundhead clothespins with a wrapping of steel wire, which prevents the clothespins from splitting. Currently, only Forster Manufacturing Co., Wilton, Maine, manufactures ironbound clothespins, which cost more per gross than any other type of clothespin.
Besides being used on clotheslines, clothespins may be used in certain agricultural applications and in film developing.
U.S. Tariff Treatment
Clothespins are provided for eo nomine in items 790.05, 790.07, and 790.08 of the Tariff Schedules of the United States. The column 1 (mostfavored-nation) rate of duty for wood and plastic spring-type clothespins (TSUS item 790.05) is 10 cents per gross; the column 2 rate is 20 cents per gross. All nonspring-type clothespins of plastic (TSUS item 790.07) are dutiable at the column 1 rate of 8.5 percent ad valorem and the column 2 rate of 80 percent ad valorem. Wooden roundhead (i.e., nonspring-type) clothespins
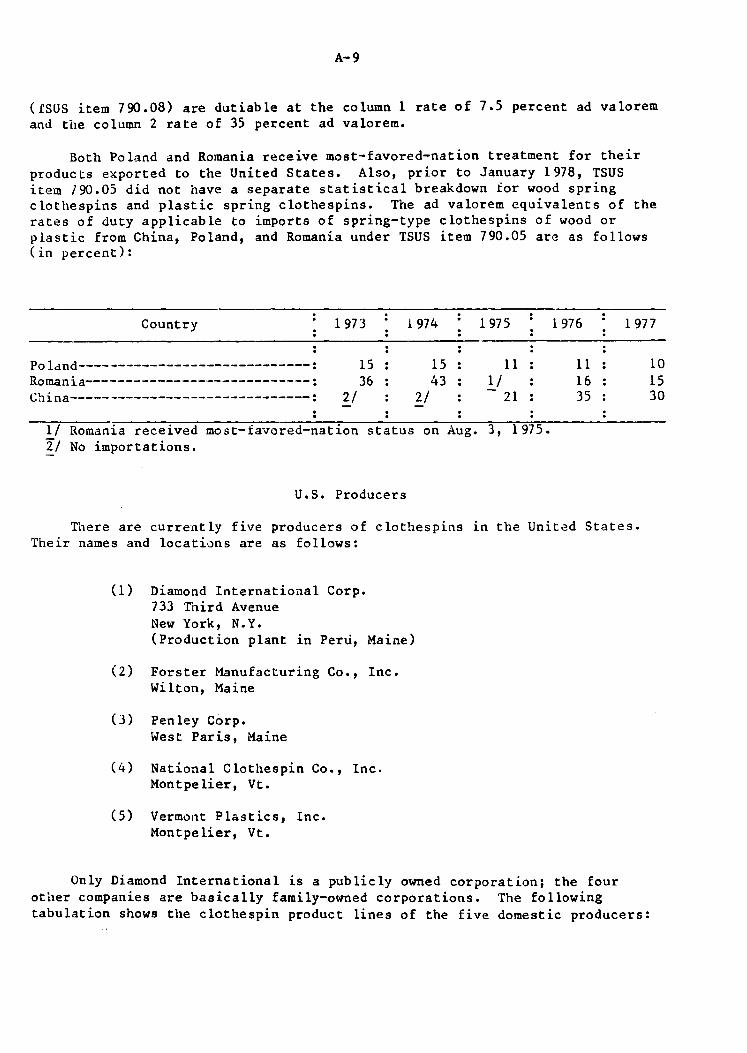
A-9
(£SUS item 790.08) are dutiable at the column 1 rate of 7.5 percent ad valorem and the column 2 rate of 35 percent ad valorem.
Both Poland and Romania receive most-favored-nation treatment for their products exported to the United States. Also, prior to January 1978, TSUS item /90.05 did not have a separate statistical breakdown for wood spring clothespins and plastic spring clothespins. The ad valorem equivalents of the rates of duty applicable to imports of spring-type clothespins of wood or plastic from China, Poland, and Romania under TSUS item 790.05 are as follows (in percent):
Country 1973 1974 1975 1976 1977
Poland-----------------------------: 15 15 11 Romania----------------------------: 36 43 1/ China------------------------------: 2/ 2/ 21
1/ Romania received most-favored-nation status on Aug. 3, 1975. 2! No importations.
U.S. Producers
11 16 35
There are currently five producers of clothespins in the United States. Their names and locations are as follows:
(1) Diamond International Corp. 733 Third Avenue New York, N.Y. (Production plant in Peru, Maine)
(2) Forster Manufacturing Co., Inc. Wilton, Maine
(3) Penley Corp. West Paris, Maine
(4) National Clothespin Co., Inc. Montpelier, Vt.
(5) Vermont Plastics, Inc. Montpelier, Vt.
Only Diamond International is a publicly owned corporation; the four other companies are basically family-owned corporations. The following tabulation shows the clothespin product lines of the five domestic producers:
10 15 30

A-10
Wood Plastic Ironbound
Company
:Roundhead or squarehead
wood clothespins
• spring • ;clothespins;
roundhead • spring • wood :clothespins: • • clothespins
Diamond Inter-national-----:
Forster--------: Penley---------: National
Clothespin---: Vermont
Plastics-----:
1/ *** 2/ ***
* *
x x x
x
*
1/ x x x
2/
*
U.S. Importers
x x
x
*
x
*
Articles :other than ;clothespins
*
x x
x
Approximately 150 firms currently import clothespins. A number of large importers are general housewares importers, with clothespins being only a very ~inor product. A few discount department store chains such as * * * , * * * , and * * *, have become importers of the product. However, * * * still purchases most of its clothespins from a domestic producer. Many of the other importers are primarily small entrepreneurs, usually with only a few employees.
In most cases, importers will switch their import sourcing from country to country in order to secure the lowest price. They will also import clothespins from several countries in order to assure themselves a steady supply of the product. * * * has been importing clothespins from Poland for more than* * * years. * * * six large importers (in alphabetical order) are as follows:
(1) G & S Metal Products Co. Cleveland, Ohio
(2) Metropolitan Housewares Corp. Ozone Park, N.Y.
(3) Nevco, Division of U.S. Industries, Inc. Lyndhurst, N.J.
(4) SAC Imports, Ltd. Chicago, I 11.

A-11
(5) S. S. Kresge Co. Troy, Mich.
(6) Wall Trading Co. Central Islip, N.Y.
U.S. Market
Clothespins are generally sold in supermarkets, hardware stores, and discount, chain, or variety stores. Sales of clothespins are more concentrated in less affluent areas where electric clothes dryers would be luxuries, or in areas, where the climate is favorable for the use of outdoor househ6ld clotheslines.
According to industry sources, clothespins are considered to be an "impulse product." In other words, consumers do not go to the super1narl<et or discount chainstore specifically to buy clothespins, but rather they buy them on impulse after seeing them on a clothespin di~play~ Furthermore, clothespins are usually bought by consumers only once or twice a year. Supermarket or department store managers reportedly decide to place an order for clothespins primarily on the basis of price and availability, with price being the key factor. Thus, a rapid influx of low-priced imports can ca~se severe problems to the domestic industry in a very short period of time, according to the U.S. producers.
The Question of Rapidly Increasing Imports
u .. s. imports
U.S. imports of wood and plastic spring clothespins declined from 1.9 million gross in 1973 to 1.7 million gross in 1974 (tables 1 and 2 and tables A-1 and A-2 in app. B) and then rapidly increased over the next 2 years (fig. 1) to 3.2 million gross in 1976. In 1977, however, imports Jeclined ~lightly to 3.1 million gross. China supplied the largest quantity of U.S. imports of wood and plastic spring clothespins in 1977, w~ile Taiwan and Poland accounted for 27 percent and 16 percent, respectively, in the same year.
I~ports of wooden roundhead clothespins (nonspring type), after declining slightly from 1973 to 1974, almost doubled from 1974 to 1977, rising from 162,000 gross to 305,000 gross (table 3). West Germany accounted for 98 percent of such imports in 1977. Although plastic nonspring clothe spins a.re imported in very small amounts, such imports nevertheless almost tripled from 1 976 to 1 977 (tab le 4).
Imports from nonmarket-economy countries
U.S. imports of wood and plastic spring clothespins from nonmarketeconomy countries almost tripled between 1973 and 1977, rising from 613,000 gross to 1.6 million gross. In contrast, imports from market-economy countries in the same period increased irregularly from 1.3 million gross in 1973 to 1.4 million gross in 1977 (table 2 and fig. 2).
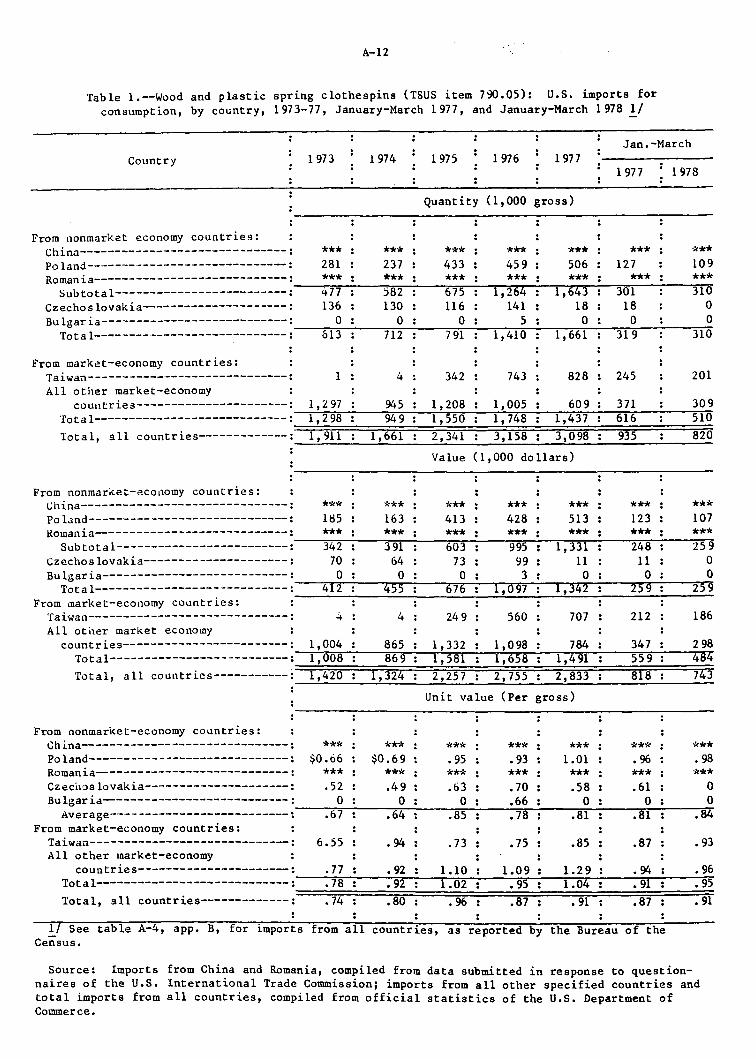
A-12
Table 1.--Wood and plastic spring clothespins (TSUS item 790.05): U.S. imports for consumption, by country, 1973-77, January-March 1977, and January-March 1978 1/
Jan.-March Country 1973 1974 1975 1976 1977
1977 1978
Quantity (1,000 gross)
From nonmarket economy countries: China------------------------------: *** *** *** *** *** *** *** Poland-----------------------------: 281 237 433 459 506 127 109 Romania----------------------------: *** *** *** *** *** *** ***
Subtotal-------------------------: 477 582 675 1,264 1,643 301 310 Czechoslovakia---------------------: 136 130 116 141 18 18 0 Bulgaria---------------------------: 0 0 0 5 0 0 0
Total----------------------------: 613 712 7 91 1,410 1,661 319 310
From market-economy countries: Taiwan-----------------------------: l 4 342 743 828 245 201 All other market-economy
countries----------------------: 1,2 97 945 1,208 1,005 609 371 309 Total----------------------------: 1, 2 98 949 1,550 1, 748 1,437 616 510
Total, all countries-------------: 1, 911 1,661 2,341 3,158 3,098 935 820
Value ( 1,000 dollars)
From nonmari.<et-eco11omy countries: China------------------------------: *** *** *** *** *** *** *** PolJnd-----------------------------: 185 163 413 428 513 123 107 Romania----------------------------: *** *** *** *** *** *** ***
Subtotal-------------------------:----3~4~2::------.,3~9~1:------6~0~3=------~9~95=----71-,~33~1.------~24~8,_.-----~2""59
Czechoslovakia---------------------: 70 64 73 99 11 11 0 Bulgaria---------------------------: 0 0 0 3 0 0 0
Total----------------------------:----4~1~2::------4~5~5.------6~1~6.----TI-,0~97=----Tt-,3~4~2.-------~25,...,..9-----,;-2rn59
From 1narket-economy countries: Taiwan-----------------------------: 4 249 560 707 212 186 All oti1er market econo1ny
countries------------------------: 1,004 865 1,332 1,098 784 347 298 Tota1--------------------------:--1~,~o~o~s=------s~6~9=----~1-,5~8~1----~1-,6~5~8=----~1-,4~9=1.------5~5~9=------4~8~4
Total, all countries-----------: 1,420 1,324 2,257 2,755 2,833 818 743 ---'---------'---------=----------"--------.._------------------~
Unit value (Per gross)
From nonmarket-economy countries: China------------------------------: *** *** *** *** *** *** *** Poland-----------------------------: $0.66 $0.69 .95 .93 1.01 .96 .98 Romania---------------------------: *** *** *** *** *** *** *** CzeciDslovakia---------------------: .52 .49 .63 .70 .58 .61 0 Bulgaria--------------------------: 0 0 O .66 O 0 0
Average--------------------------:----.~6~7::------.~6~4------~.8~5=------~.7~8:------~.8~1:-------.8~1=-------.84~
From market-economy countries: Taiwan-----------------------------: 6.55 • 94 .73 .75 .85 .87 • 93 All other market-economy
countries----------------------: .77 .92 1.10 1.09 1.29 .94 .96 Total----------------------------:----.~7~8,...------.~9~2----71-.0~2=------.~9~5----~1~.~0T4------.~9~1------.9-::-;;-5
Total, all countries-------------: ,74 .80 .96 .87 .91 .87 .91
1/ See table A-4, app. B, for imports from all countries, as reported by the Bureau of the Census.
Source: Imports from China and Romania, compiled from data submitted in response to questionnaires of the U.S. International Trade Commission; imports from all other specified countries and total imports from all countries, compiled from official statistics of the U.S. Department of Commerce.

Million gross
~·Bir 1t7S~
I If.
'f.
3.
* *
Figure 1.--Wood and plastic spring clothespins: U.S. imports for conRumption, 1973-77.
Actual imports
Trend line of imports
l97'i 1975
./ .,,, ,,,,,, ./
..,, ~· ..,, ./ ..... ___ -.~
i!f76
__ _..
_,,, -----
1977 19'78
Source: Derived from data presented in table 1.
=j> ...... w

A-14
Table 2.--Wood and plastic spring clothespins: U.S. imports for consumption from nonmarket-economy countries and market-economy countries, 1973-77, January-March 1977, and January-March 1978
Jan.-March Source 1973 1974 1975 1976 1977
1977 1978
Nonmarket-economy countries-------------:
Market-economy 613 712
Quantity (1,000 gross)
791 1,410 1,661 319 310
countries-------------: 1,298 949 1,550 1,748 1,437 616 510 -=-~~-----:----;...,..:.__;--,,..:..,,...,....,.--........,,~-=::----:::-'-::-=::------:=-::------;~
Total---------------:-=-l~,9~1~1:..._:._::_l~,6~6~1:..._:._2~,~3~4~1---=--3~,~l~5~8---=--3~,~0~9-8 ____ ~9-3~5-----8-2_0
Nonmarket economy countries (Commu-nist countries)-------: 412
Market economy 455
Value (1,000 dollars)
676 1,0 97 1,342 259 259
countries-------------:~l~,~0~0~8-=--=-~8~6~9:__:--;l~,~5~8~1-=-~l~,~6~5~8;......,;--;l~,~4~9~1_;_~~5~5~9:--~-:;-4-;-:;84 Total---------------: 1,420 1,324 2,257 2,755 2,833 818 743 ---'--------'--------'--------'-------__.._ ________________ __
Unit value (per gross)
Nonmarket-economy countries-------------: $0.67 $0.64 $0.85 $0.78 $0.81 $0.81
Market-economy countries-------------: .78 • 92 l.10 1.00 1.29 • 94
Average-------------: .74 .80 • 96 .87 • 91 .87
Source: Compiled from official statistics of the U.S. Department of Commerce and from responses to the questionnairesof the U.S. International Trade Commission.
$0.84
• 96 • 91
Imports of wood and plastic spring clothespins from China rose sharply from a mere*** gross in 1975 to * * * gross in 1977 (fig. 3), and China increased its share of the imports of spring clothespins from * * * percent in 1975 to*** percent in 1977. China also has by far the lowest unit value per gross of imported spring clothespins of any of the large exporting countries (table 1).
According to industry sources, a majority of the clothespin imports from China are first exported from China to independent trading companies in Hong Kong and then exported to the United States. The Hong Kong trading firms (e.g., * * * , * * * , and***) contract for the Chinese clothespins at the Canton Fair, and then resell them to other countries, including the United States. China has only * * * contracted directly with U.S. firms for the sale

1,000 gross
1973
Figure 2.--Wood and plastic spring clothespins: U.S. imports for consumption from market-economy countries and nonmarket-economy countries, 1973-77.
A--Imports from market-economy and trend line
B--Imports from nonmarket-economy countries and trend line
••
....... .. . . . . . //
./' ,/
/'
~ . // ..... =-1-.---------~
---t
I~ 191~
. ·*·
191&
...-A .,.,.,. .,.,.,. + ,,.,,.- ,,.,,.- B
;:::::.-:::;... -- c:::: - - -- - -
. ..
1911 1978
Source: Derived from data presented in table 1.
> I .....
V1

1,000 gross
iii!
Figure 3.--Wood and plastic spring clothespins: U.S. imports for consumption certain nonmarket-economy countries, 1973-77.
China x-·-·~·- Poland -~--- Romania
.... ~ ... ·~ '#':- .... ·~ ~·, *
M----------+--=--·---·-----t-'----·· --·--+-------------! 1973 I !f7tt lf7~ 19/l:i Uf7i
Source: Derived from data presented in table 1.
:r 1--' (J'\

A-17
of clothespins. * * *
In 1976 and 1977 China reported that it had raised its world clothespin prices by more than 60 percent, to levels higher than the prices of most other supplying countries. The prices that Hong ~ong traders charge to their U.S. purchasers, however, apparently do not reflect these price increases, but these traders account for the greatest quantity of U.S. imports from China.
U.S. imports of wood and plastic spring clothespins from Poland declined slig~tly from 1973 to 1974, but then more than doubled, rising from 237,000 gross in 1974 to 506,000 gross in 1977 (fig. 3). A.M.P.A.G. Furniture & Wooden Products Corp., New York, N.Y., has advised the Commission that it is the exclusive U.S. sales agent for P.A.G.E.D., t~e corporation designated by the Polish People's Republic as the sole exporter of Polish clothespins. Furthermore, since January 1, 1972, Metrop0litan Housewares Corp., by contractual rights, has been the only authorized importer of Polish clothespins (for A.M.P.A.G.), although there are other importers of record. It has come to the attention of A.M.P.A.G. and Metropolitan, moreover, that Polish clothespins are being exported to West Germany in bulk and then packaged and reexported to the United States. A.M.P.A.G. stated at the public hearing that it would advise P.A.G.E.D. to take whatever steps are necessary to prevent future transshipments. The following tabulation shows U.S. imports of wood spring clothespins made in Poland, both those shipped directly and those allegedly transshipped,· during 1973-77 and January-March 1978 (in thousands of gross):
Item 1973 1974 1975 1976 1977 Jan.-Mar. . : .. 1978--. . .
Directly shipped: Metropolitan-------------------:* * * :* * * :* * * :* * * :* * * * * *
Allegedly transshipped imports: ·*· '* *--------------------------:* * * :* * * :* * * :* * * :* * * * * * Other--------------------------:* * * :* * * :* * * :* * * :*·* * * * *
Subtotal---------------------:* * * :* * * :*.* * :* * * :* * * * * * Total--------------------~---: 281 237 433 459 506 109
Imports of wood and plastic spring clothespins from Romania increased from*** gross in 1973 to * * *gross in 1974, but dropped sharply to*** gross in 1975 (fig. 3). In 1976 (the year after most-favored-nation status was granted), Romanian imports again increased to * * * gross, but fell to * * * gross in 1977.

A-18
Table 3.--Nonspring clothespins of wood: U.S. imports for consumption, by principal sources, 1973-77, January-March 1977, and January-March 1978
Jan.-Mar.--Source 1973 1974 1975 1976 1977
1977 1978
Quantity (gross)
Nonmarket-economy countries:
Ch~:::~::::::::::::::::::::::;~~~~g~~~~~g,........~~~~:~;~g=;~~-:~:~g~g~g~~~~~g..;__~~~~g...:...:.~~__;.g Market-economy countries:
Belgium----------------------: 9,932 0 0 0 0 0 0 Hong Kong--------------------: 0 1, 200 0 3, 108 0 0 O Switzer land------------------: 0 10, 250 0 0 0 0 0 Ta~wan-----------------------: 0 0 6,750 1,067 6,550 0 1,483 West Germany-----------------: 173,640 150,618 158,028 219,453 298,567 134,261 63,321
Total----------------------:-;..1~83~,5~7~2,........--.-1~62~,o~6~8.---r16~4~,~7~7~8.---.,..22~3~,~6~2~8,..-;..--;<-30~5~,~l~l~7,._;,,.-;..i3r4~,~2~6~l--=--6~4~,~8~0;..;.4
Total, all countries-------: 183,572 l62,068 167,983 229,628 305,117 134,263 64,804 ~~-'-~~~~~~~~_.._~~~~-'-~~~_.:.~..;__..;__~~~___:~__:....:...:.~
Value
Nonmarket-economy countries: China------------------------: 0 0 $1,000 $5,000 0 0 0
Tota1----------------------:~~~~o,........~~~~o,........~~1~.~o~o~o~~~s~.~o~o~o~~~~~o~~~~~o-=-~~__;.o
Market-economy countries: Belgium----------------------: $4, 000 0 0 0 0 0 0 Hong Kong--------------------: 0 $1,000 0 4,000 0 0 0 Switzer land------------------: 0 7, 000 0 0 0 0 0 Taiwan-----------------------: 0 0 2,000 1,000 7,000 0 1,000 West Germany-----------------: 76,000 87,000 109,000 163,000 255,000 105,000 70,000
Tota1----------------------:~8~0~.~o~o~o,........~~95~,~o~o~o~--.-1~11~,~o~o~o~-1~6~8~,~0~0~0~~2~6~2~,~o~o~o-=-~1~0~5~,~o~o~o-=-~1~1~,~o~o~o
Total for all countries----: B0,000 95,000 112,000 173,000 262,000 105,000 71,000 ~..--::...-_;_..;__~;_:...;...;...;........;._..::..~~..,:_..:.._~:..!,..;::..:..:_.:.......::..::.=..!:..:..:..:_.:.....::.:..::.!..::.:..:._:_....:..::..!...:~
Unit value (per gross)
Nonmarket-economy countries: China------------------------: 0 0 $0.44 $0.77 0 0 0
Average----~---------------:~~~~o,........~~~~o,........~~-.~4~4..;__~_:..;~.~7~7.......;.~~~~o-=-~~~~0-=-~~-.;.o
Market-economy countries: Belgium----------------------: $0.43 0 0 0 0 0 0 Hong Kong--------------------: 0 $1. 00 0 1. 41 0 0 0 Switzerland------------------: 0 .63 0 0 0 0 0 Taiwan-----------------------: 0 0 .27 1.29 $1.14 0 $0.55 West Germany-----------------: .44 .58 .69 • 74 .85 O. 78 1.11
Average--------------------:~~-.~4~4--:-~~-.~5~9.-:-~~-.~6~7.--~~~.~7~5...:...:.~~~.~8~6-..:.~--=~.~7~8-..:.~~l~.~l:.:.O =====;::;:::====::::;:;;=::===::;:;=::::==::::;;;:::::::===::::;;====:::::;;;::=:==::;:::;~
Average, all countries-----: .44 .59 .67 .75 .86 .78 1.10
Source: Compiled from official statistics of the U.S. Department of Commerce.

A-19
Table 4.--Nonspring clothespins of plastic: U.S. imports for consumption, by . principal sources, 1973-77 and January-March 1978
1973 1974
China-----~~-~---------------: 0 0 Denmark----------------------: 4,500 0 Netherlands------------------: 5,785 100 France-----------------------: 885 0 West Germany-----------------: 2,750 0 Hong Kong--------------------: 5,110 878 Taiwan-----------------------: 334 0 Japan----------------·--~----: 510 0 Switzerland-------~----------: 0 0 Italy------------------------: 0 0
Total--------------------: 19, 874 978
0 0
$2,000 0 0
3,000 0 0 0 0
5,ooo
0 0
$20.00 0 0
3.33 0 0 0 0
5.51
1/ Less than $500.
1975 1976
Quantity (gross)
0 0 0 0
3,2 90 12, 900 0 0 0 999
10' 25 9 . 3,227 . 84 84 0 0 0 0 0 2,460
13,633 . I 9, 610 . . . Value
0 0 0 0
$6,000 $5,000 0 0 0 1,000
18,000 8,000 1/ I./
u 0 0 . 0 . 0 1,000
24,ooo 15,000
Unit value (per gross)
0 0 0 0
$1. 95 $0.39 0 0 0 1.30
1. 76 2.37 4.69 4.56
0 0 0 . 0 . 0 .60
1.83 • 80
1977
0 0
22,050 684
0 5,654
25,000 0
96 0
'S3,7+S4
0 0
$27,000 2,000
0 13,000 27,000
0 0 0
69, 000
0 0
$1.23 3.25
0 2.39 1.09
0 0
3.81 1.32
:Jan.-Mar. 1978
354 0 0 ()
0 2,375
0 0
35 0
2,7E>4
$1,000 0 0 0 0
1,000 0 0
1/
Source: Compiled from official statistics of the U.S. Department of Commerce.

A-2o
Imports fro~ market-economy countries
As previously stated, imports of wood and plastic spring clothespins from market-economy countries increased slightly from 1973 to 1977. ~i le imports from Taiwan rose from 5)6 gross in 1973 to 828,000 gross in 1977 (fig. 4), imports from most other major market-economy countries declined during the same period (fig. S). Taiwan and China together accounted for over SO percent 0f all U.S. imports of wood and plastic spring clothespins in 1977.
Consideration of Market Disruption
U.S. capacity, production, and capacity utilization
U.S. capacity to prod..ice all types clothespins increased irregularly from 10.6 million gross in 1973 to 12.4 million gross in 1977. Production dropped sharply, however, from 5.3 million gross in 1973 to 4.2 million gross in 1977, or by 21 percent. As a consequence, capacity utilization plummeted to 34 percent in 1977 from SO percent in 1973 (table S).
Of the four types of clot:1espins, the wood spring variety accounts for 65 percent of U.S. capacity and appro~imately 80 percent of total U.S. production. The <1onspring wood clothespins account for 30 percent of U.S. capacity, but onl; 18 percent of U.S. clothespin production. The remaining S percent of U.S. capacity and 2 percent of U.S. production are divided between plastic spring and wood ironbound clothespins.
U.S. capacity, production, and capacity utilization for the five domestic producers of clot~es~ins are set forth in table 6. Forster Manufacturing Co. is * * * . In 1977 Forster accounted for ***percent of U.S. capacity and *** percent of total U.S. production of clothespins; however, in the same year * * * Diamond International is the * * * .
Ti1e capacity Jata shown in tables S and 6 are not precise estimates because of significant differences among the various firms in their operating procedures. Tile figures presented in tile tables wrere based on two shifts a day, 5 days a week, 50 weeks a year.
* * ·:. * *
Capacities of the Eir~s for 1977, bdsed on two shifts per Jay, 5 days a wee:c, the practical capacity levels, the optimum production levels, and the ratio of 19/7 production to capacity ~nd optimum producti0n levels ara ~resented in table 7.

A-21
Table 5.--Clothespins: U.S. capacity, production, and capacity utilization, by types, 1973-77, January-March 1977, and January-March 1978.
. Period and type :capacity . 1/
: . : Capacity Product ion .
1. .
- : :uti. i.zati.o~
1 ':J73:
1,000 gross
Wood spring------------------------------: '6,267 Plastic spring----------------------------: 356 Nonspring wood---------------------------: *** Ironoound---------------------------------: ***
gross Percent
4' 185 67 157 44 *** ·;c** *** ***
Tota 1------- -- ----- - - -------- ----- ---- --- =--.-l~J-,..,,..5..,..7=3----,.--,~.--------== 5,301 50 1 ':J74:
~ood spring-------------------------------: Plastic spring----------------------------: Nonspr.i.ng wood----------------------------:
7' 978 409
Ironbound---------------------------------: ***
3,821 48 122 30 *** *** *** ***
Total-----------------------------------:--.-l~l-,~3~3~7---...,-..,.....,.-.------....,,.-o:-4' 841 39 l '97 5: ~ood spring-------------------------------: Plastic spring----------------------------: Nonspring wood----------------------------:
7' 970 409
*** Ironuound---------------------------------: ***
3' 101 39 97 24
*** *** *** ***
Tota 1--------- -·- -------------- ---- ------- :--...,.1....,.2-,....,.3....,.2-9------------4 ,038 33 1 97 ;j:
Wood spring-------------------------------: 7,993 J,201 40 Plastic spring----------------------------: 360 106 29 Nonspring wood----------------------------: '~** *** *** Ironbound---------------------------------: *** *** ***
Total-----------------------------------:--~l-.,.2-,~3~0~3---...,.--:--:::-=--------.::-.+,105 J3 1977:
Wood spring-------------------------------: Plastic spring----------------------------: Nonspring wood----------------------------:
.3' 0 97 335
Ironbound---------------------------------: ***
3,378 42 94 28
*** ·)<** *** ***
Tota 1-------------- -- -·- ---- --- ---- ----- - :---.,.l-,L,...,-.3'""3:-::2,....----,--:-::,..,...------~ '.+' 15 3 34 J anl.lary-Narc~1:
Wood spring-------------------------------: Plastic spring----------------------------: Nonspring wood----------------------------:
L.,016 8~
Iron~ound---------------------------------: ***
755 37 20 24
*** *** *** ***
Total-----------------------------------=---J-,-0-9_4 ______________ _ ::H..:. JO Jdnuary-~arch 1973:
Wood spring-------------------------------: 2,046 Jl6 40 Plas~ic spring----------------------------: 73 22 29 Nonspriag--------------··------------------: *** *** *** lronJound---------------------------------: *** *** ***
'fot-3.1------- - ------------·------- -- --- - -- :---_-,-,-9-9_5 ____________ ___ 999 n
!7 Capacity data ~ased on two shifts a Jay, S Jays a wee~.
Source: Compiled from data submi~teJ in r~spa~se to questionnaires of th~ i.J.S. international Trade Commission.

Figure q.--Wood and plastic spring clothespins: U.S. imports for consumption from Taiwan, 1973-77.
1 ,000 gross /
gera.ee+
I aee.~~ x .•.•.. x
I '
Actual import&
Trend line
/x .. x·······;>
/
/
.// ".''1lil. e~t
I I
smra. tali!t
I I
~era.2t!t
::lt!B.2Af // I .. X ' .
2ee.0a• / .··
I
I YBl!.m~.,.
I
,,,./
! // . 1euJ / · : ,,/
I /.
l // r!. ~~-·-·-·~ --J"o",,. . • 1973 -~ ·~·..&..!...L'4~-- --
1 t:17!...I ----· -- -- . ·-.. I ·······+--···-197!i -- . ------ -- . ·- - -·-+--· ·-I S7Ei - -- -- -------· ·-·-· t---·
1977
Source: Derived from data presented in table 1.
/ , /''
.,,/
·-----f
1978
> I
N N

Figure 5.--Wood and plastic spring clothespins: U.S. imports from certain market-econoffiy countries, 1973-77.
1,000 gross
11111
711
Sil
au
lfll
211
Ill
Taiwan
--·~-· Hong Kong
---------- Germany Holland
~ ·---·-~ / . .___.:__ ___ ..,."' ,. . ........
./ / . ....... '---.... .,..r / • ...... / -.... .
------ . ---4< / . . ....... ......... ............._. ~ / . ........~ ----~/ . '.,,.
~. . ~
'·-----·· . ...._ . . .----------- . ----------.. --... . ~ ·------..
11-----~----.:-~~~~~~~~~~--;::;--~~~~&; 1913 191't 1m 1976 ISTI
Source: Derived from data presented in table A-4.
~ N w
A-24
Table 6.--Clothespins: U.S. production, production capacity, and capacity utilization, by firm, 1973-77, January-March 1977, and January-March 197~
* * * * * *

Table 7.--Clothespins: U.S. capacity, practical capacity, optimum production levels, and production, by types and by firms, 1/ 1977
l 977 Ratio of 1977 product ion to--:
Article and firm Capacity based on Optimum : Capacity based:
2 shifts per day, : Practical : production
: Production
: on 2 shifts :
5 days a week '!:_/ : -:apacity : l~vei.
: :a day, 5 days : : : : : a week 2/ :
i,ooo gross :1,000 gross:l,000 gross :1,000 gross : Percent : Wood spring clothespins: : :
forster------------------: *** : *** : *** : *** : *** : Diamond~----------------: '~** : *** : *** : *** : *** : Penley-------------------: *** : *** : *** : *** : *** : National-----------------: *** : *** : *** : *** : *** :
Total------------------: 8,097 : 8,553 : 8,553 : 3,378 : 12 : Plastic spring clothespins:: : : : : :
Forster------------------: *** : *** : *** : *** : *** : Penley-------------------: *** : '~** : *** : *** : *** : Vermont------------------: *** : ***· : *** : *** p *** p
Total------------------: Nonspring clothespins of
wood, except iron-bound:
Forster------------------: Penley-------------------:
335
*** ***
: 335
: *** . ***
: 335 .. 94
: *** : *** ' *** . ***
Total------------------:~~~~~~~--,.~.~.~-~~~~-,-.~.~.~~~~~~-~-~.~~~~~~-~-~. ,..~~ : ,..,...,.. : ,...,...,.. : ,...,..,..
Nonspring clothespins of wood, ironbound:
: : :
: : : : : :
*** : *** : *** : *** Forster------------------: ~~~~~~~~~~~~~~~~~~~~~~~~~~~~~...,....,-
Tot al - - - - - - - - - - - - - - - - - - : ""i('"iC"ltr : ,..,..,.. : ,..,...,.. : ')(''W'1f
Total: : : : Forster------------------: *** : *** : *** : *** Diamond~----------------: *** : *** : *** : *** Penley-------------------: *** : *** : *** : *** National-----------------: *** : *** : *** : *** Vermont------------------: *** : *** : *** : ***
11, ~" : 1.L,.DO : l.L,JJO : ~,ill Total------------------:~~~~~~~~-""""-~~~~-~~~~~~~.~-~~~~~~~~
1/ * * *
: 28 :
: *** : . *** . : *** : : : : : : : : *** : : *** : : : : *** : : *** : : *** : : *** : : *** : : 35 :
Optimum Prac t ica 1 : productio'l capicity : level
: Percent .. Percent
*** .. *** *** : *** ....... ** : *** *** : ***
3 9 : 39 :
*** : *** *** : *** *** p ***
28 : 28
·k** : *** *** . *** •!<** : ***
: : :
*** : *** *** : ***
: *** : *** *** : *** *** : *** *** : *** *** : ***
33 : 33
- 2/ The figures in this table have been adjusted to eliminate such clothespin production and capacity data, as reported in-tables 5 and 6.
Source: Compiled from data submitted in response to questionnaires of the U.S. International Trade Counnission.
> I
N V>
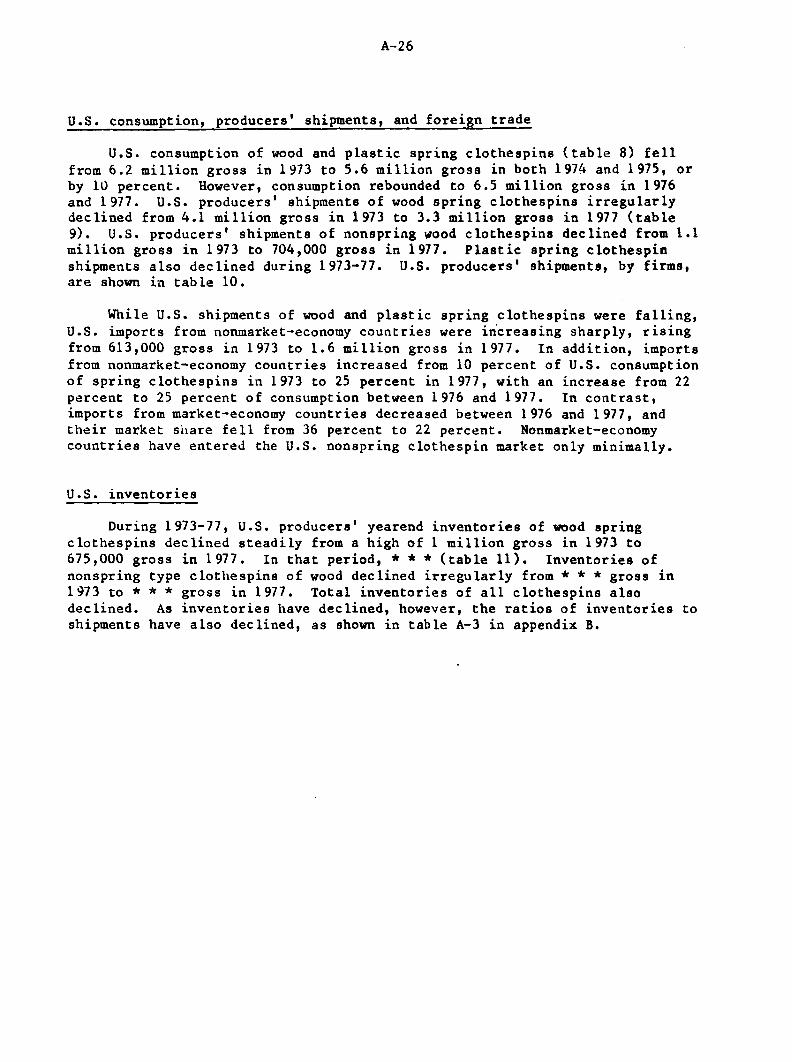
A-26
U.S. consumption, producers' shipments, and foreign trade
U.S. consumption of wood and plastic spring clothespins (table 8) fell from 6.2 million gross in 1973 to 5.6 million gross in both 1974 and 1975, or by 10 percent. However, consumption rebounded to 6.5 million gross in 1976 and 1977. U.S. producers' shipments of wood spring clothespins irregularly declined from 4.1 million gross in 1973 to 3.3 million gross in 1977 (table 9). U.S. producers' shipments of nonspring wood clothespins declined from 1.1 million gross in 1973 to 704,000 gross in 1977. Plastic spring clothespin shipments also declined during 1973-77. U.S. producers' shipments, by firms, are shown in table 10.
While U.S. shipments of wood and plastic spring clothespins were falling, U.S. imports from nonmarket-economy countries were increasing sharply, rising from 613,000 gross in 1973 to 1.6 million gross in 1977. In addition, imports from nonmarket-economy countries increased from 10 percent of U.S. consumption of spring clothespins in 1973 to 25 percent in 1977, with an increase from 22 percent to 25 percent of consumption between 1976 and 1977. In contrast, imports from market-economy countries decreased between 1976 and 1977, and their market share fell from 36 percent to 22 percent. Nonmarket-economy countries have entered the U.S. nonspring clothespin market only minimally.
U.S. inventories
During 1973-77, U.S. producers' yearend inventories of wood spring clothespins declined steadily from a high of 1 million gross in 1973 to 675,000 gross in 1977. In that period, ***(table 11). Inventories of nonspring type clothespins of wood declined irregularly from * * * gross in 1973 to * * * gross in 1977. Total inventories of all clothespins also declined. As inventories have declined, however, the ratios of inventories to shipments have also declined, as shown in table A-3 in appendix B.

Table 8.--Clothespins: U.S. producers' shipments, imports from market-economy countries, imports from nonmarket-economy countries and dpparent consumption, 1973-77, January-March 1977, and January-March 1978
Imports Ratio of--
Type and period Producers' : shipments
From : From market- :nonmarket-: Total economy : economy
Apparent : Imports from : Imports from : Ratio of :consumption:market-economy:nonmarket-economy:all imports
countries to : co~ntrie~ to : .to countries :countries consumption : consumption :consumption
1,000 :1,000 gross:l,000 gross: gross
Wood and plastic spring clothespins:
1973-----------------------: 1974-----------------------: 1~75-----------------------:
1970-----------------------: 1977-----------------------: January-March:
1977---------------------: 1978---------------------:
All other clothespins: 1973-----------------------: 1 974------------------------: 1~75-----------------------: 1976-----------------------: 1977-----------------------: January-March:
1977---------------------: 1978---------------------:
Total: 1973-----------------------: 1974-----------------------: 197j-----------------------: 197ti-----------------------: 1977-----------------------: January-March:
1977---------------------: 1978---------------------:
II Less than 500 gross. Z/ Less than 0.5 percent.
4, 289 3, 977 3,262 3,375 3,422
699 309
1, 077 920 838 303 704
144 15 9
5,366 4,897 4,100 4,178 4, 126
843 %8
1,298 949.
1, jSQ
l, 748 1,437
616 510
203 163 179 243 359
136 68
1,501 1, 112 1, 72 9 1, 991 1, 7 96
752 578
613 712 791
1,410 1,661
1/
319 310
0 0 3 6 0
0
613 712 794
1,416 1,661
319 310
r,ooo gross :1,000 gross:
1, 911 1,661 2,341 3,158 3,0 98
935 820
203 163 182 24 9 35 9
136 68
2, 11.'.+ 1,824 2,523 3,407 3,457
1,071 888
6,LOO 5,638 5,603 6,533 6,520
1,634 1, 62 9
1,280 1, 083 1,020 1,052 1,063
280 227
7,480 6, 721 6,623 7,585 7,583
1, 919 1,856
Percent
21 16 28 26 22
37 31
16 15 17 23 34
49 30
20 16 26 26 24
39 30
Percent
2/
10 13 14 22 25
20 19
0 0 1 1 0
0
8 11 12 19 22
17 17
Percent
Source: Compiled from data submitted in response to questionnaires of the U.S. International Trade Co111111ission and from otficial statistics of the U.S. Department of Commerce.
31 29 42 48 47
57 50
16 15 18 24 34
49 30
28 27· 38 45 46
56 47
> I
N ....,

A-28
Table 9.--Clothespins: U.S. producers' shipments, by types, 1973-77, January-March 1977, and January-March 1978
(In thousands of gross)
Period
1~73-----------------------------:
1974-----------------------------: 197j-----------------------------: 1976-----------------------------: 1~77-----------------------------: January-March--
1~77---------------------------: 1978---------------------------:
Spring type
Of WO•Jd
4' 132 3,854 3,103 3, 271 3,328
:j 7 9 789
Of other materials
l.J7 123
99 104
94
20 20
Nonspr1ng type
:Of wood, :Of wood : except : . ': i.ronbound
*** *** *** ·k**
***
*** ... "**
i.ron-bound
*** ·:C** .... ·,..J,..·* :':** ·.'\**
*·:.:* k**
Tota 1
5,366 .+' 8 97 4, 100 4, 1 78 4, 126
343 968
Source: Compiled from data submitted in response to questionnaires of the U.::>. International Trade Commission.

A-29
Table 10.--Clothespins: U.S. producers' shipments, by companies, and by types, 1973-77, January-March 1977 1 and January-March 1978
Spring type Non spring type Period and time Of wood, Of wood Of Of
wood wood except iron-
ironbound bound
1 ':J7 j: Forster-----------------------: *** *** *** *** Diamond-------'---------------: *** *** *** *** Penley------------------------: *** *** *** II *** National----------------------: *** *** *** *** Vermont-----------------------: *** *** *** ***
Total-------------:---------: 4,132 157 *** *** 1974:
Forster-----------------------: *** *** *** *** Diamond-----------------------: *** *** *** *** Penley-------------------~----: *** *** *** *** National----------------------: *** *** *** *** Vermont-----------------------: *** *** *** ***
Total
*** *** *** *** ***
5,366
*** *** *** *** ***
Total-------~---------------: 3,854 123 *** *** 4,897 1 ':J75:
Forster-----------------------: *** *** -:C** *** *** Diamond-----------------------: *** *** *** *** *** Penley------------------------: *** *** *** *** *** National----------------------: *** **ir *** *** *** Vermont-----------------------: *** *** *** *** ***
Tota 1---------·---------·-----: 3,163 99 *** *** 4,100 l 'J76:
Forster-----------------------: *** *** *** *** *** Dicimond------------------------: *** : *** *** *** *** Penley------------------------: *** *** *** *** *** National----------------------: *** *** *** *** *** Vermont-----------------------: *** *** *** *** ***
Total-----------------------: 3 ,:£71 104 *** *** 4,178 l 977:
Forster-----------------------: *** *** *** *** *** Dia~ond-----------------------: *** *** *** *** *** Penley--------------~---------: *** *** *** *** *** National----------------------: *** *** *** *** *** Vermont-----------------------: *** *** *** *** ***
Total-----------------------: 3,328 94 *** *** 4,126 January-March l ':J77:
Forster-------------~---------: *** *** *** *** *** Diamond-----------------------: *** '*** *** *** *** Penley-----------------------: *** k** *** *** *** National----------------------: *** *** *** *** *** Vermont-----------------------: *** •.. *** *** *** ***
Total-------------~---------: 679 20 *** *** 843 January-March 1978:
Forster-----------------------: *** *** *** *** *** Diamond-----------------------: *** *** *** *** *** Penley------------------------: *·** *** *** *** *** National----------------------: *** *** *** *** *** Vermont-----------------------: *** *** *** *** ***
Total----------------------: 789 :lO *** *** 968
Source: GompLled from data submitted in response to questLonnaires of the U.S. International Trade Commission.

A-30
table 11.--Clothespins: U.S. producers' yearend inventories, by firms, Dec. 31 of 1973-77, Mar. 31, 1977 and Mar. 31, 1978
(In thousands of gross)
Spring type
Date and firm
Dec. 31, 1~73:
Of wood
Forster------------------------: *** Jiamond-------------------·-----: *** Penley-------------------------: *** National-----------------------: ***
Of other materials
*** *** *** ***
Nonspring type
:Of wood, :of wood, : Total except . . .
iron-iron-
bound hound
*** *** *** *** *** *** *** k** *** ..;.:** *•':* ·k·:C*
*** *** *** *** 1<** 1,306
Vermont------------------------: *** Total------------------------:-:-1-,~0~3~7~~~~--:-2~3..--~~--,-.,-:-~~--:--:-:-~~.,.---
***
Dec. 31, 1 974: Forster------------------------: *** Diamond------------------------: *** Penley-------------------------: ***
*** ·:C**
National-----------------------: *** *** Vermont------------------------: *** ***
**"k *** *-A'*
*** ***
Total------------------------:~_,,9~5~8~~~~~-2~5~~~~~-:'-<** Dec. 31, 1 ~7):
Forster------------------------: *** Uiarnonci------ - ·- -- ----- - - -- -----: *"')..·* Penley-------------------------: *** National-----------------------: *** Vermont------------------------·-: ***
fotal------------------------: 837 Dec. 31, 1970:
Foster-------------------------: *** Diamond------------------------: *** Penley-------------------------: *** National-----------------------: *** Vermont----------------------~-: ***
Total------------------------: 720 Dec. 31, 1::177:
Forster------------------------: *** Diamond------------------------: *** Penley-------------------------: *** National-----------------------: ***
*** *-'<* ***
*** 22
*** *** *** ''** ***
18
***
•;c** *--'.,:*
Vermont------------------------: *** ***
*** *** *** *** *** ***
*** *** *** ·k** *** **•k
·k** *'°'* •k** *** ***
*** *** *** ··'"** *** *** -~** *** *** *** *** 1,205
~k*'"1: ·!-~-!-:
*** *** ·kk* *** *** k** *** *** ''c** 1,048
*** *** *** ;°<** *** *k* *** *** *** *** ·-~** 942
*** ·-"<** *** k** ·-<** **k ~'<** k·k*
*** *** *** *** 833 Total----------------- ·------:~~u~7u5:--~~--~--=-1~4~~~-:-:-,-.....:...~--~~-=--~~~

A-31
Table 11.--Clothespins: U.S. producers' yearend inventories, by firms, Dec. 31 of 1973-77, Mar. 31, 1977 and Mar. 31, 1978--Continued
(In thousands of gross)
Spring type Nonspri.ng type
Date and firm Of wood
Of other materials
:Of wood, :0 f d : woo ' Total
Mar. Jl, 1977: Forster------------------------: *** *** Diamond------------------------: *** *** Penley-------------------------: *** *** National-----------------------: *** *** Vermont------------------------: *** ***
except : . : i.ron-ironbound
*** *** *** *** ***
bound
*** *** *** *** ***
*** *** -Jr** k** ***
~otal------------------------: 900 23 *** *** 1,121 Mar. 31, 1 978:
Forster------------------------: *** *** *** *** Diamond------------------------: *** *** *** *** Penley-------------------------: *** *** *** *** National-----------------------: *** *** *** ·k** Vermont------------------------: *** *** *** ***
Total------------------------: 702 13 *** ***
1/ Less than 500 gross.
Source: Compiled from data submitted i.n response to questionnaires of the U.S. International Trade Commission.
Employment
*** l<**
*** *** *** 855
The average number of persons employed by the five domestic producers of clothespins Jeclined irregularly from 731 employees in 1973 to 713 employees in 1977, (table 12). The average number of production and related workers engaged in manufacturing all products at the five domestic establishments declined sharply from 659 in 1973 to 576 in 1976, but then increased to 653 i.n 1 977. There was a similar dee line in the number of workers engaged so le ly i.n the manufacture of clothespins--from 429 in 1973 to 370 in 1975. However, this downward trend was reversed in 1976, and by March 1978 the number of employees engaged solely in the manufacture of clothespins had increased to 421, which was slightly below the 1973 level.

A-32
Table 12.--Average number of employees in U.S. establishments 1/ producing clothespins, and tot&l production and related workers engaged in the manufacture of all products and of clothespins, 1973-77, January-March 1977, and January-March 1978
Jan.-Mar.--. Item 1973 1974 1975 1976 1977 .
1977 1978
All persons-------------------: 731 725 627 639 713 648 790 Production and related
workers engaged in the manufacture of--
All products of the es tab-lishment------------------: 659 657 561 576 653 588 727
Clothespins-----------------: 429 422 370 382 387 354 421
1/ Includes all five domestic producers of clothespins.
Source: Compiled from data submitted in response to questionnaires of the U.S. International Trade Commission.
The total number of person-hours worked by production and related workers in the Production of clothespins ?~ra11P.1Pd thP trPnrl ;n Pm~lnymPnt (!ah!~
13). Total person-hours worked in the production of clothespins declined from a i1igh of 820,000 hours in 1973 to a low of 690,000 hours in 1975, climbed slightly in 1976, and reached 720,000 hours in 1977, which was still below the 1973 and 1974 levels.
Table 13.--Person-hours worked in establishments 1/ producing clothespins, 1973-77, January-March 1977, and January-March 1978
(In thousands of person-hours)
Item
Person-hours worked by production and related workers engaged in the production of--
1973 1974 1975 1976 1977
All products of the establishment------------------:1, 302
Clothespins-----------------: 820 :1,420 :1,163 :1,052 :1,214
811 690 702 720
1/ Does not include Vermont Plastics.
Jan.-Mar.--
1977 1978
296 164
342 223
Source: Compiled from data submitted in response to questionnaires of the U.S. International Trade Commission.

A-33
Profit-and-loss experience of domestic producers
Profit-and-loss data were received from four of the five domestic producers of cl~thespins. l/ These firms accounted for 100 percent of total domestic shipments of wood-spring and wood nonspring clothespins.
The aggregate net operating loss tor all clothespin operations of the four domestic producers in 1973 amounted to $339,000 but a net profit of $7,000 was experienced in 1974. Industry sources blame price controls for the net loss in 1973. l~ 1975 the industry experienced its best year of the period, as the net operating profit shot up to $651,000. Thereafter, the net operating profit fell sharply to $81,000 in 1976 and to $54,000 in 1977, which represents a decline of 92 percent from the 1975 level (table 14).
The ratio of net operating loss to net sales was 5.2 percent Ln 1973, but almost a break-even ratio of 0.1 percent occurred in 1974. In 1975, the ratio of net operating profit to net sales was at its zenith during the period, 8.3 percent; it declined to 1 percent in 1976 and to 0.7 percent in 1977. As shown in table 15, the trends of aggregate net operating profit and of the ratio of .net operating profit to net sales for wood spring clothespin operations paralleled those for all clothespin operations.
In contrast to ti1eir experience on clothes;in operations, the aggregate net operating profit for all operations at the reporting establishments of the domestic producers increased from -1< * >'< in 1973 to . '" >'< '" in 1 974 and then increased again to ,_ .;, '" i.n 1975 (table 16). Net operating profit tumbled to * * 1' in 1976, but then rebounded to '" >'< -1< i.n 1977.
The aggregate ratio of net operating profit to net sales increased from 8. 9 percent in 1973 to 14.5 percent in 1975, fell to 8.1 percent in 1976, and then recovered to 11.5 percent in 1977.
The profit-and-loss experiences of National and Penley are the same for all clothespin operations and for all operations of the reporting establishments, since both manufacture only clothespins. Diamond (plant in Peru, Maine) and Forster (plant in Wilton, Maine) manufacture other prodJcts at their clothespin plants; * * * (table 17).
1/ Vermont Plastics is the only firm n~t to report its profit-and-loss data. Vermont Plastics does not produce clothespins of '.•mod.
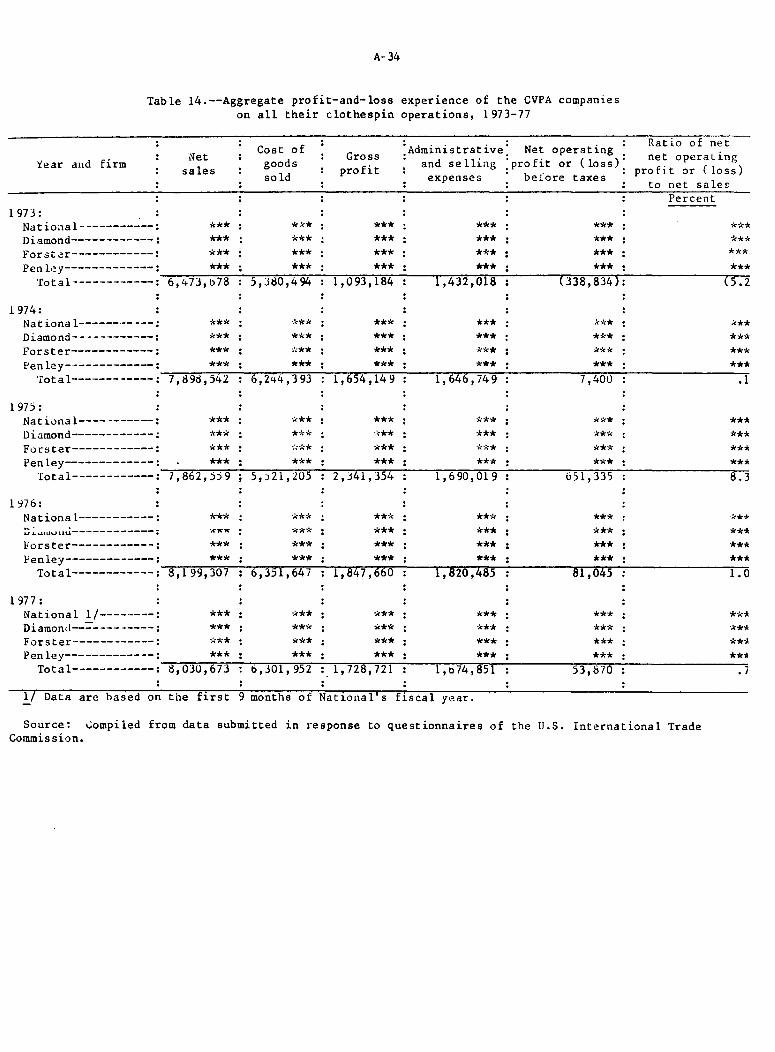
A-34
Table 14.--Aggregate profit-and-loss experience of the CVPA companies on all their clothespin operations, 1973-77
l'.ear and firm
1973: National-----------: Diamond------------: Forster------------: Penley-------------:
Total------------:
1974: National-----------: Diamond------------: Forster------------: Penley-------------:
Total------------:
l 97): National-----------: Diamond------------: Forster------------: Penley-------------:
Total------------:
l ')76: National-----------: ~.:.c .. uuuuU------------: Forster------------: Penley-------------:
Total------------:
1977: National 1 /---------: Diamond--~---------: Forster------------: Penley-------------:
Total------------:
1/ Data are based on
Net sales
*** *** *** ***
6,473,078
*** *** *** ***
7' 89d I 542
*** *** *** ***
7,862,))9
*** -~ww
*** ***
8,199,307
*** *** *** ***
8,030,673
tile first 9
Cost of goods sold
*k* *** *** ***
5,J80,494
·k** *** "'** ***
6,244' 3 93
*** *** '"'** ***
5,J2l,205
·k** *** *** ***
6,351,647
*** *** *** ***
6,301,952
months of
Gross profit
*** *** *** ***
1,093, 184
*** *** *** ***
1,654,149
*** ·.<** *** ***
2,J4l,354
*** *** *** ***
1,847,660
*** *** *** ***
1,728,721
National 1 s
'.Administrative: Net operating , · and selling :profit or (loss):
expenses · beiore taxes ·
*** *** *** *** *** *** *** ***
l ,432,0l8 (338,834):
*** k** *** *** *** •k** *** ***
1,646, 749 7,400
*** *** *** *** *** *** *** ***
1'690' 01 9 651,335
*** *** *** *** *** *** *** ***
1, 820,485 81,045
*** *** *** *** *** *** *** ***
l ,o 74, 851 53,870
fiscal year.
Ratio of net net operaLing
profit or (loss) to net sales
Percent
*** *** *** ***
(S.2
i<** *** *** ***
• l
*** *** *** *** 8.3
·~*-&
*** *** *** 1.0
**-A "k*-A
**-I< **"" . ]
Source: ~ompiled from data submitted in response to questionnaires of the U.S. International Trade Commission.

Year and firm
'J7 j:
A-35
Table 15.--Aggregate profit-and-loss experience of the CVPA companies, on their wood spring clothespin operations, 1973-77
Net sales
1,000 dOITirs
Cost of goods sold
1,000 dOTI'ars
Gross profit (loss)
1,000
:Administrative'. Net operating • • and selling :profit or (loss):
expenses • before taxes •
dOTI'ars :l,000 dollars 1,000 dollars
Ratio of net net operating
profit or (loss) to net sales
Percent
Nat iona 1-----------: *** *** *** *** *** *** Diamond------------: *** *** *** *** *** *** Forster------------: *** *** *** *** *** ***
Penley-------------=~~~-,,*~*~*,.-~~--,,........,*~*~*~~~~~*~9*~3*~3~~~~~~1-,~*1~*2~*7,..-~~~~~---,(~*1~*94~*~)~·.~~~~~~~~(~*3-*.~*7 ...... ) Total------------: 5,177 4,243
j74: National-----------: Diamond------------: Forster------------: Penley-------------:
Total------------:
97'j: National-----------: Diamond------------: Forster------------: Penley-------------:
Total------------:
'Jl6:
*** *** ***
6,2 96
*** *** *** ***
6,251
*** *** *** ***
5,027
*** *** *** ***
*** *** *** ***
1,269
*** *** *** ***
1,866
*** *** *** ***
1,283
*** *** *** ***
l, 313
*** *** ·le** *** (14):
*** *** *** *** 533
*** *** *** *** (. 2)
*** *** *** *** 8.9
National-----------: *** *** *** *** *** *** Diamond------------: ·le** *** *** *** *** *** Forster------------: *** *** *** *** *** ***
Penley-------------=~~~,.--*~*~*~~~~....,,....~*~*~*,,..-~~~~l-,~*4~*1~*1,...-~~~~--.l-,~4*~0*~*8,,.......~~~~~~~*-*-*~3~~~~~~1~/~~-*-*-*-Total------------: 6 1 566 5,156
977: National-----------: *** *** *** *** *** *** Diamond------------: *** *** *** *** *** *** Forster-------------: *** *** *** *** *** *** Penley-------------: *** *** *** *** *** ***
Total------------:~~-6~,~5~-3~6,_...~~-,,-s-,~1~95=--~~.......,.1-,~J~~,~1~~~~.......,.1-,~3~1~5~~~~~~~2~6..-~~~~~~~~.~4-
1/ Less than 0.05 percent.
Source: Compiled from data submitted in response to questionnaires of the U.S. International Trade ;ommission.

A-36
Table 16.--Aggregate profit-and-loss experience of the CVPA companies, on all products manufactured at their reporting establishments, 1973-77
Year and firm
1973:
Net sales
1,000 :dollars
National---------: *** *** Diamond----------:
Cost of goods sold
Gross profit
'.Administrative'. Net operating . · and selling :profit or (loss>:
expenses • before taxes ·
1,000 1,000 dOITars :dOITars :1,000 dollars 1, 000 dollars
*** *** *** *** *** *** *** ***
Forster----------: *** *** *** *** *** Penley-----------: *** *** *** *** ***
Ratio of net net operating
profit or (loss) to net sales
Percent
*** *** *** ***
Tot a 1---------- :--:-13,,.......,, 5,,...,6'""8.---':"'.10"'"","""'2~9""'5--,.-3 ""', 2=-=7'"'4-----=2-1"""067"":'"9------=1-,-=2-=0..,,.5--------=a-.-=9-
1974: National---------: ***
'~**
*** *** *** *** *** Diamond----------: *** *** *** *** ·k** Forster----------: *** *** *** *** *** *** Penley-----------:_,.---*~*~*--------~*~*~*-------*~*--*-------------*~*,_.,.*----------------*~*~*------------------,-*-*_*,,_
Total----------: 17 1 000 12,507 4,493 2,406 2,087 12.3
l ':J75: National---------: Diamond----------:
*** ***
*** *** *** ***' *** *** *** ***
Forster----------: *** *** *** *** *** Penley-----------: *** *** *** *** ***
*** ***
Total----------:--:-15~·...,,2~5,,...,2=---~1~0-,..,,.5~6~8--4~,...,6~8~4---~---,2~,...,4-=7~0-------,,2~,-=2~1~4--------=-1~4-.-=-5
1976: National---------: *** *** *** *** *** ***
*** *** Forster----------: *** *** *** *** *** *** Penley-----------: *** *** *** *** *** ***
Total----------:--:-1=1-,1~1~2=---~1~3-,~1~0=7---,4~,-=0~0~5------,2~,-=6~1~4-------=1-,~3-=9~1--------~8-• ..--1
1 -;77: National---------: *** *** *** *** *** Diamond----------: *** *** *** *** *** Forster----------: *** *** *** *** *** Penley-----------: *** *** *** *** ***
*** *** *** ***
Total----------:~1~8-,~30~1,_.-...,1~3~,~6~1-=7--4~,...,6~8~4-----2~,-=5~7~1-------,2~,-=1-=1~3--------:-l~l-.~5-
Source: Compiled from data submitted in response to questionnaires of the U.S. International Trade Commission.

A-37
Table 17.--Profit-and-loss experience of two CVPA companies on all their clothespin operations and on all operations of the reporting establishments, l ')73-77
All clothespin All operations of the operations reporting establishments
{ear and firm
. Ratio of net N . : Ratio of net • Net operating . . ,et operating . . . . (l ):operating profit: f. (l ):operating profit ,profit or oss or (loss) to pro it or oss (l ) ' 0efore taxes : before taxes : or oss to
net sales net sales
1973: Diamond----: Forster----:
1-37.:+: Diamond----: Forster----:
l 97 5: Diamond----: Forster----:
l ':J76: Diamond----: Forster----:
1977: Diamond----: Forster----:
1, 000 dollars
"'!c**
***
*** ***
*** ***
*** ***
*** ***
Percent
*** ***
*** ***
*** ***
-!<** ***
1, 000 dollars
*** ***
*** ''<**
"'.'<** ***
*** ***
***
Percent
Source: Compiled rrom data submitted in response to questionnaires of the U.S. International Trade Commission.
* * * *
·-'<**

*
A-38
* * * * * *
Table 18.--0ther factory costs for CVPA companies, total and as a share of net sales, 1973-77
Forster Diamond Penley National 'ie3r :Percent: :Percent: :Percent: :Percent Other Other Other Other
of of of fact:ory factory factory : factory
net net costs net . costs costs sales costs sales sales
1973------: *** *** *** *** :'<** *** *** 1974------: *** *•k* *** *** *** *•k* *** 1975------: *** *** *** *** *** *** *** 1 '; 7 6------: *** *** *** *** o<** *** *** 1977------: ''<** *** *** *** *** ·i<** ***
Source; i:;ompiieri from aata submitted in response U.S. International Trade Commission questionnaires.
* * * * * * *
Table 19.--Selected financial ratios for the CVPA companies, 1977
Company
Forster------------------------: Penley------·-------------------: Diamond------------------------: National-----------------------:
(In percent) :Quick ratio: DebtCurrent :("acid test: equitf ratio
~';-1...··}t
*** *<'«k
***
ratio") ratio
*** *** *** ***
*** *** *** ***
Inventory turnover
*** *** *:C* ***
of net
sales
*** *** ·k** k•k*
***
~~~~~~~~~
Industrial a~erage ~/------: 2. 98 1~47 • 71 4.46 (32 days)-
1/ Weighted average based Jn net sales for 1977.
Source: Compiled from data submitted in response to questionnaires of the U.S. International TraJe C,1m.:nission.
* * *

A-39
In summary, the clothespin industry presents a picture of varied levels of financial performance. Although sales increased during the 5-year period, so did expenses. The industry as a whole has managed to control the proportionate growth of these expenses, except for other factory costs. Except for 1913, when all companies experienced losses (attributed by the companies to price controls), the industry's aggregate net losses are attributable to * * *·
Prices of wood spring clothespins
Domestic producers.--In 1973, prices for wood spring clothespins were held down by price controls, but when the wage and price controls were lifted in 1974, the price for Jomestic wood spring clothespins increased rapidly (table 20). I~ 1974 Forster raised its prices by * * * percent; Diamond, by *** percent; Penley, by * * * percent; and National, ~y * * * percent. Prices continued to rise in the first two quarters of 1975, but thereafter declined to about the level experienced at the end of 1974. During 1976, 1977, and January-March 1978, Forster's prices*** •
* * * * * * *
Nonmarket-economy countries.--* * *
* * * * * * *
Market-economy countries-- * * *
* * * * * * *

A-40
Table LO.--Wood spring clot he spins: Lowest prices of U.S. producers and importers on their largest volume sales to their U.S. customers, by quarters, January 1973-March 1978
(Per gross) Importers of clothespins Weighted average
U.S. producers from nonmarket-economy :price of importers
Period countries :of clothespins from
Forster :Diamond; Penley National Po land China Romania :all market-economy countries
1973: Jan.-Mar---: *** *** *** *** *** *** *** $1.06 Apr.-June-: *** *** *** *** *** *** *** 1.05 July-Sept--: *** *** *** *** *** *** *** 1.09 Oct.-Dec---: *** *** *** *** *** *** *** 1.17
1974: Jan. -1•lar---: *** *** *** *** *** *** *** 1.18 Apr.-June--: *** *** *** *** *** *** *** 1.18 July-Sept--: ·:.** *'~* *** *** *** *** *** 1.34 Oct.-Dec---: *** *** *** *** *** *** *** 1.3 9
1975: Jan.-Mar---: *** *** *** *** *** 1. 70 *** 1.41 Apr.-June--: *** *** *** *** *** 1. 70 *** 1.38 July-Sept--: *** *** *** *** *** 1.70 *** 1.36 Oct.-Dec---: *** *** *** *** *** 1. 70 *** 1. 3 9
1976: Jan.-Mar---: *** *** *** *** *** 1.46 *** 1. 3 7 Apr.-June--: *** *** *** *** *** 1.46 *** 1.2 9 July-Sept--: *** *** *** *** *** 1.46 *** 1.37 Oct. -Dec---: *** *** *** *** *** 1.18 *** 1.41
1977: Jan.-Mar---: ·)<** *** ~'<"'-"* *** *** 1.04 *** 1.40 Apr.-June--: *** *** *** *** ·k** 1.04 *** 1.40 July-Sept--: *** *** *** *** *** 1.11 *** 1.49 Oct.-Dec---: *** *** *** *** *** 1.13 ***
1.49
l ':178: Jan.-Mar---: *** *** *** *** *** 1.13 *** 1. 51
~/ Quantity sold at this price was less than 1,000 gross.
Source: Compiled frore data submitted in response to questionnaires of the U.S. International Trade Couunission.

A-41
Table 21.--Wood roundhead clothespins: Prices of U.S. producers and importers on their largest volume sales to their U.S. customers, by quarters, January 1 97 3-March 1 97 8
Period
1 973: January-March---------: April-June------------: July-September--------: October-December------:
l 971 .. : January-March---------: April-June------------: July-September--------: October-December------:
1 975: January-March---------: April-June------------: Ju 11-Se ptember--------: October-December------:
1 976: January-March---------: April-June------------: July-September--------: October-December------:
1 977: January-March---------: April-June------------: July-September--------: October-December------:
1 978: January-March---------:
Forster
*** *** *** ***
*** *** *** ***
*** *** *** ***
*** *** *** ***
*** *** *** ***
***
(Per gross)
U.S. producers
Diamond Penley
*** *** *** *** *** *** *** ***
*** *** *** *** *** *** *** ***
*** *** *** *** *** *** *** ***
*•k* *** *** *** *k* *'le* *** ***
*''\* *** *** ~~**
*·~'<* *''<* -=~** ***
*** -~'"*
National
*** o'<** ''<** ***
*** •k** *** ***
*** *** *** ***
*** *k* *** ''<**
*** *** *** ·k**
*'';*
Importers of clothespins
from West Germany 1/
*** *** *** ***
*** *** *** ***
*** *** *** ***
*** *** *** ***
*** *** -,'(**
1/ There are virtually no imports from nonmark2t-economy countries, and virtually all imports from market-economy countries are from West Germany
Source: Co~piled from data submitted i~ response to questionnaires of the U.S. International Trade Commission.
A-42
Prices of wood roundhead clothespins
Domestic producers.--
* * * * * * *
West Germany.--Virt~ally all imports of wood roundhead clothespins originate in West Germany. The prices for the West German product rose steadily from 1973 through early 1978. The upward revaluation of the German mar'.< may be the maL1 reason for the increase in price.
Prices of plastic spring clothespins
Prices of domestically produced plastic spring clothespins are set forth in table 22..
* * * * * * *

A-43
Table 22.--Plastic spring clothespins: Prices of U.S. producers and importers on ti1eir largest volume sales to their U.S. customers, by quarters, January 1973-March 1 973
Period
1 973: January-March-----------------: April-June--------------------: July-September----------------: October-December--------------:
l ~7.'.t:
January-March-----------------: April-June--------------------: Jul;-September----------------: Octooer-December--------------:
1 97 j: January-March-----------------: April-June--------------------: Jul;-September----------------: Oc to~er-0.:cem·D~r---- --- -------:
1 970: January-March-----------------: April-June--------------------: July-September----------------: October-December--------------:
1977: January-March-----------------: April-June----~---------------:
July-September----------------; October-December--------------:
1 976:
(Per gross)
:.J.S. producers
Forster Penley Vermont
*** *** *** *** *** *''<* *** *** -;<** *** Xk* ***
*** .. *** *** *** *"* ''<** *** *** *k* :(·k·k *~':*
*** *** *** *** *** *** -:!c'** *** *** *k* *** ***
'"** :~:** 1<** ''<** *;''* *'''* -=~** :'<** *** *** *** ... '<**
·'<** *** *** *** *'''* ·::** -:'<** :~*k ·:.C** -:c** '""'* ***
:Weighted average price o [
importers of :clothespins from
market-economy countries 1/
$1. 94 1. 91 1. 96 2.02
1. 88 1.38 1. 87 1. 8 9
2.82 ;_. 77 2.85 2.86
2.80 2.85 2.56 1.87
2.a~
2. at~ 2.83 2.87
*** ·!:** :'~·** Januar1-March-----------------: 2.i37
:>Our·.>~: CompileJ from ..iata submitt~d in respo:ise to the questio!rn.3ir2s :Jf tile li.S. hternuti.·Jnal Tr::ide Commission.

A-44
Prices and unit costs for wood spring clothespins
As shown in table 23, the aggregate unit cost of CVPA companies for producing wood spring clothespins increased rapidly from $1.23 in 1973 to $1.78 in 1977. Thereafter the unit cost continued to creep upward to $1.85 in January-March 1978. While the prices for wood spring clothespins also increased from 1973 through 1975, the domestic producers have not raised their prices very much since 1975, (table 20). In fact, a few have cut their prices, despite rising unit costs, to meet what they allege to be import competition.
Table 23.--Aggregate average unit costs incurred in manufacturing wood spring clothespins of CVPA companies, 1973-77, January-March 1977, and JanuaryMarch 1978
(In cents per gross) . Period Labor Fuel Wood Wire Other :overhead. Total . .
1973-------------: 23.5 2.4 26.0 17. 7 8.7 44.4 122.7 1974-------------: 22.5 2.8 30. 9 27.2 11.6 52.0 153.0 1975-------------: 28.3 5.0 28.0 32.4 12.7 63.4 170.8 1976-------------: 32.7 5 .4 2 9. 8 28.0. 19. 8 65.5 176. 2 1977-------------: 2.).0 .5. 4 33.2 28.6 13.l 72.2 177. 5 January-March:
1')77-----------: 1/ 31. 7 11 5.3 31. l 27.4 9.3 70. 7 : l / 175.5 1978-----------: Tl 25.3 Tl 5.3 35.0 2 9. 5 14. 9 75.3 :Tl 185.3
!f Only partial data available.
s·ource: Compiled from data submitted in response to questionnaires of the u.s. International Trade Commission.
Market penetration of imports from China, Poland, and Romania
U.S. imports of wood and plastic spring clothespins from nonmarketeconomy countries almost tripled between 1973 and 1977, rising from 613,000 gross to 1.6 million gross, and increased their share of the U.S. wood and plastic spring clothespin market from 10 percent in 1973 to 25 percent in 1977, as shown in table 24.
Wood and plastic spring clothespins from China increased their share of the U.S. market from * * * percent in 1975 to * * * perce11t in 1977. Romanian imports increased their share of the U.S. market from*** percent in 1973 to * * * percent in January-March of 1978. Imports of wood and plastic spring clothespins from Poland irregularly increased their share of the U.S. market from 4.5 percent in 1973 to 7.8 percent in 1977. The trends of U.S. imports of wood and plastic spring clothespins from China, Poland and Romania are shown in figures 6, 7, and 8.

A-45
Table 24.--Wood and plastic spring clothespins: U.S. consumption, U.S. imports from China, Poland, Romania, and all nonmarket-countries, 1973-77, January-March 1977, and January-March 1978
Apparent U.S. consumption----: Imports from China-----------: Imports from Poland----------: Imports from Romania---------: All imports from nonmarket
economy countries----------:
Imports from China-----------: Imports from Poland----------: Imports from Romania---------: All imports from nonmarket-
economy countries----------:
1973
6,200 *** 281 ***
613
*** 4.5 ***
9. 9
Source: Compiled from official U.S. response to questionnaires of the u.s.
Jan.-Mar.--1974 1975 1976 1977
1 977 1 978
Quantity (1,000 gross)
5,638 5,603 6,533 6,520 1,634 l 962 9 *** *** *** *** *** *** 237 433 459 506 127 108 *** *** *** *** *** ***
712 7 91 1,410 1,661 319 310 Ratio of imports to consumption
(percent)
*** *** *** *** *** *** 4.2 7.7 7.0 7.8 7.8 6.6 *** *** *** *** *** ***
12.6 14 .1 21.6 25.5 19. 5 19.0
Census statistics and from data submitted in International Trade Commission.

*
Figure 6.--wood and plastic spring clothespins: U.S. imports for consumption from China, 1973-77.
* Actual imports Trend line
* .
/
1.-~~ ..... .......... ·•
/
1913 1971~ l!m 1!11i 1!111
Source: Compiled from data presented in table 1.
/ /
/ /
/
/
1111
:r """ a-

l,f)f)Q gross
981.HI
aae.
781.
688.
see.
i.!U.
18111.
Figure 7.--Wood and plastic spring clothespins: U.S. imports for consumption from Poland, 1973-77.
* * Actual imports Trend line ----
. . . . . . . . * .
* ....... .
-----
e.111 ··------------------ ~--t~----~~~-i
1973 197'i 197S 1916 lg77 1978 Source: Compiled from data presented in table 1.
~ ~ -...J

Figure 8.--Wood and plastic spring clothespin: U.S. imports for consumption from Romania, 1973-77.
*·······* Actual imports
Trend line
.~. ~ . . . . . . . . . . . . . . . . . . . ... . . . . . . . . . . . . . . ··. .·· ... --------. . . . . . . * . . .
• ••• ,.
I.Ill• I I 1913 197'1 Ira I !116 1917 1918
Source: Compiled from data presented in table 1.
=r .i:c:.o

A-49
Loss of sales
The four domestic producers (the CVPA companies) of wood spring clothespins supplied the Commission with a list of 25 firms they had allegedly lost either partially or wholly as customers to imports from nonmarket-economy countries. All 25 of the firms were contacted by the Commission, with actual confirmation of lost sales to imports resulting from 16 of these contacts. In only three instances, however, were the lost sales directly attributable to imports from nonmarket-economy countries. Details of the three cases of lost sales to nonmarket-economy countries are as follows:
Purchasing company
* * * * * *
* * * * * *
* * * * * *
Nonmarket-economy source
Poland
Romania
China
A number of importers have advised the Commission that they have several foreign sources of supply, both market-economy and nonmarket-economy countries. Furthermore, the clothespins are usually imported in packages of SO, 60, or 72 clothespins, which are warehoused according to package size. When a purchaser places an order for 5,000 dozen packages of 60 clothespins, he usually receives whatever the importer has in stock in that package size, a~d thus, receives clothespin packages from several foreign sources. Rarely does the purchaser specify the country of origin of the clothespins he has ordered from the importer. Details of the 13 cases of sales lost to imports from market-economy countries or mixed foreign sources are as follows:
Purchasing
(1) * * * * * *
(2) * * * * * *
(3) * * * * * *
* * * (4) * * *
* * *
company Source
West Germany and Poland
Unknown market economy countries.
Taiwan
Taiwan

(5) * * * * * *
Co) * * * * * *
(7) * * * * * *
(8) * * * * * *
( 9) * * * * * *
(10) * * * * * *
( 11) * * * * * *
(12) * * * * * *
(13) * * * * * *
A-50
Taiwan, Hong Kong, China, and Romania.
Hong Kong
Tai~an and Hong Kong
Houston Light House for the Blind.
China, Taiwan, and Hong Kong.
Hong Kong and Romania
Holland and other market economy countries.
Market-economy countries and China.
Hong Kong and Taiwan
China, the largest nonmarket-economy source of clothespin imports, appears in very few of the lost-sale allegations because most imports from China are accounted for by very few high-volume sales. * * * , sold all its 1977 imports from China(*** gross) to*** • In addition, ***imported ***gross in 1976 and*** gross in 1977, all of which was for its internal consumption. Thus, over half of 1977 imports of wood spring clothespins from China were purchased by * * * · Furthermore, * * * did not purchase clothespins tram any domestLc supplier during the past 5 years. However, * * * has been and still is the largest customer of * * * (a CVPA member company).

A-51
APP.ENDIX A
U.S. INTER~ATIONAL TRADE COMMISSION NOTICE OF INVESTIGATIONS AND HEARING

A-52
UNlTI:l> STATE:. JHTER?:ATJO~L\L Tl~i\DI: co~~ITSSJO~
\fa!;hfnglon, L>.C.
(TA-406-?., TA-406-3, ond TA-406-4)
CLOT!ff.SPINS Fl\O!·{ TllE PEOPLE'S REPUBLIC OF CllINA, THE PC'LISll l'EOl'J.E' S l\l:I'lll\LlC, NW TllE SOCIALIST l:l:l'U!iLIC OF l\Cl'.IA:HA
lnv,,~:tii;<ltjons:inst1tuted. Follo~.·1ng rec(·ipt of a petition on May 3, 1978, fill·d -·---'·---- -·----·--------
by the Clothespin and Veneer Products Associ~tion (CVrA), tl1e U.S. International
Trade Co~rnission on May 16, 1978, instituted invcstications under section 406(a) of
the Tracie Act of 19711 to dctc:naine, with respect to ir.:ports of clothi.::sp:lns prm·ic!Pci
for in items 790.05, 790.07, and 790.08 of the Tariff Schedules of the United State~.
which arc the products of the People's Republic of China, the Polish People's
Republic, and tl1c Socialist Republic of Romania, whether market disruption exists
with respect to such articles produced by a domestic industry. Section 406(e)(2) of
the Trade Act defines market disruption to exist ~ithin a domestic industry if
"imports of an article, like or directly competitive with an article produced by such
domestic industry, arc increasing rapidly, either absolutely or relatively, so as to
be a significant cause of material injury, or threat thereof,. to such domestic
industry.
Public hearing. A public hearing in connection with these investigations will
be held in Portland, Haine, at 9:30 a.m., e.d.t., on Thursday, Jun~ 22, 1978. The
location of the l1caring will be announced later. Requests for appearances at the
h~aring should be received in \.ffiting by the Secretary of the Com.'llission at his
office in Washington, D.C., not later than noon, Thursday, June 15, 1978.

A-53
11.~~'..I'_<'_~t-~~-~..EJ.'. pctftfon. The petition filed in this cn!:e :l.s nvniLlhlc for public ..
in!;pc:ction at lhc Office of the Sl'Crctnry. U.S; Jnternnt i0nal Trnclc f.or.i:".iif.r.icn and
at LhC' ?~c1..• York City office of the Com:nission located nt 6 Wllrld Trade Center.
.J~---r"
d-·"7 Mason
Issued: Hay 16, 1978

A-54
A'PPENDIX B
SUPPLID1ENT.ARY STATISTICAL TABLES
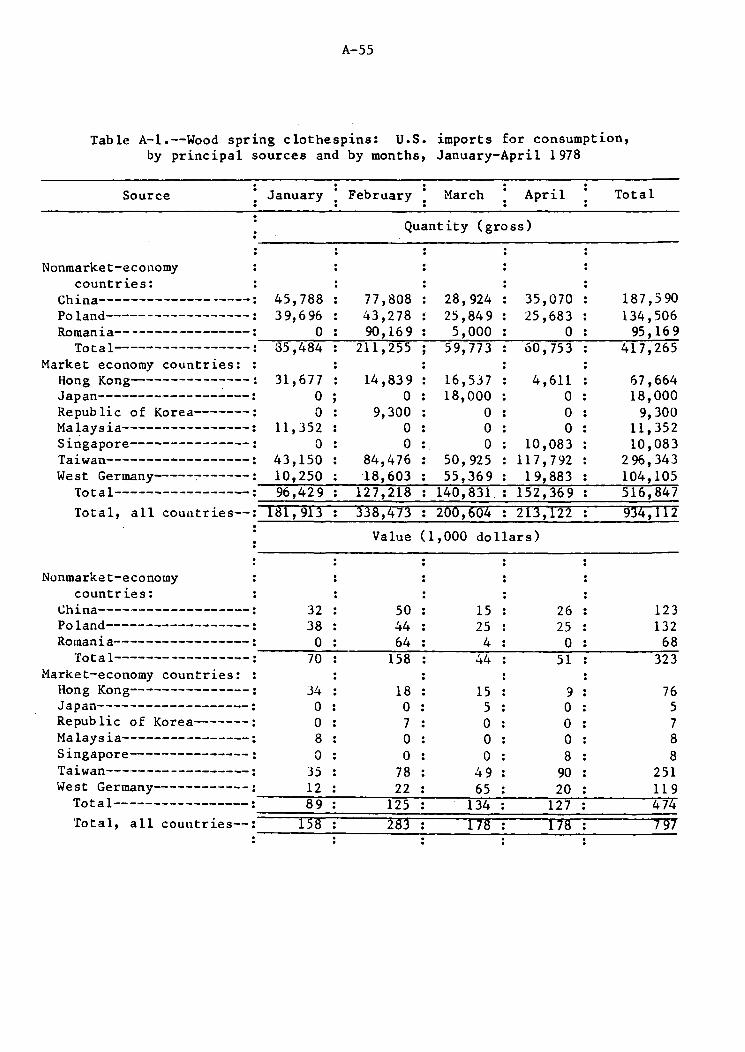
A-55
Table A-1.--Wood spring clothespins: U.S. imports for consumption, by principal sources and by months, January-April 1978
Source January February ~ March April Total
Quantity (gross)
Nonmarket-economy countries:
China-------------------: 45,788 77 '808 28' 924 35,070 187,590 Poland------------------: 39, 696 43,278 25 ,84 9 25,683 134,506 Romania-----------------: 0 90,169 5,000 0 95' 16 9
Total-----------------: 85,484 211, 255 59, 773 60' 753 417,265 Market economy countries: . .
Hong Kong-----------~---: 31, 677 14 '83 9 16,537 4,611 67,664 Japan-------------------: 0 0 18,000 0 18,000 Re pub lie of Korea-------: 0 9, 300 0 0 9, 300 Malaysia---------------~: 11, 352 0 0 0 11,352 Singapore---------------: 0 0 . 0 10,083 10 '083 . Taiwan------------------: 43,150 84,476 50' 925 117' 792 296,343 West Germany-----~------: 10,250 18, 603 55, 36 9 19, 883 104,105
Total-----------------: 96,42 9 127,218 140,831 152,369 516,847 Total, all cout1tries--: I8I, 9B D8,473 200,~04 2B,I22 934, 112
Value (1, 000 dollars)
Nonmarket-economy countries:
China-------------------: 32 50 15 26 123 Poland------------------: 38 44 25 25 132 Romania-----------------: 0 64 4 0 68
Total-----------------: 70 158 44 51 323 Market-economy countries: . .
Hong Kong---------------: 34 18 15 9 76 Japan-------------------: 0 0 5 0 5 Re pub lie of Korea-------: 0 7 0 0 7 Malaysia----------------: 8 0 0 0 8 Singapore---------------: 0 0 0 8 8 Taiwan------------------: 35 78 49 90 251 West Germany------------: 12 22 65 20 119
Total-----------------: 89 125 134 127 474 Tota 1, all countries--: 158 283 178 178 7 97

A-56
Table A-1.--Wood spring clothespins: U.S. imports for consumption, by principal sources and by months, January-April 1978--Continued
Source January February March April Total
Unit value (per gross)
Nonmarket-economy countries:
China-------~-----------: $0.71 $0.64 $0.51 $0.75 $0.66 Po land-----------------: • 94 1. 02 • 98 • 98 • 98 Romania-----------------: 0 .71 .78 0 .71
~~~":::"::"~~~~-:-:.--~~~-=-~~~~~~~~~~-==
Average---------------: • 82 • 75 • 74 • 84 • 77 Market economy countries: :
Hong Kong~-------------: 1.07 1.20 .94 2.02 1.13 Japan-------------------: 0 0 .28 0 .28 Re pub lie of Korea-------.: 0 • 77 O O • 77 Malaysia----------------: .67 0 0 0 .67 Singapore---------------: 0 0 0 .70 .70 Taiwan------------------: • 80 • 92 • 95 • 76 • 85 West Germany------------: 1.17 1.16 ·1.18 1.03 1.14
Average---------------:~~--.~92~~~~-.~9~8-------.~9~5...-~----.8r.3...-~~~~-.~9r2
===================================== Average, all countries-----------: .87 .84 .89 .84
Source: ~ompiled from official statistics of the U.S. Department of Commerce.
• 85

A-57
Table A-2.--Plastic spring clothespins: U.S. imports for consumption, by principal sources and by months, January-April 1978
. January February : March April Total .
Quantity (gross)
Nonmarket-economy countries:
China-------------------: 4, 725 38 0 0 4,763 Romania-----------------: 0 0 0 17,206 17,206
Total-----------------: 4,725 38 0 17,206 21,969 Mar~et-economy countri.es: :
Denmark-----------------: 540 0 900 0 1,440 France------------------: 0 0 277 1,845 2,122 Hong Kong---------------: 4,732 9, 910 5' 777 5' 7 96 26,265 Japan-------------------: 69 0 0 0 69 Netherlands-------------: 10,050 l, 377 25,660 11,670 48' 7 5 7 Taiwan------------------: 12,638 1,000 a,505 21,700 43,843 West Germany------------: 1,800 9,000 2,267 1,800 14,867
Total-----------------: 29,879 21,287 43,386 42 '811 137,363 Total, all countries--: 3z+:' ti04 ZI ,:n5 z+:3,3Sti ti0,017 159,'.112
Value (1, 000 dollars)
Nonmarket-ecOL1omy countries:
China-------------------: 3 2 0 0 5 Romania-----------------: 0 0 0 12 12
Total-----------------: 3 2 0 12 17 i1arket-economy countries: :
Denmark-----------------: 1 0 2 0 3 France------------------: 0 1 7 3 Hong Kong---------------: 9 5 13 7 34 Japan-------------------: 1/ 1/ Netherlands-------------: 13 1 33 16 63 Taiwan------------------: 16 1 9 21 46 West Germany------------: 2 11 3 2 18
Total-----------------: 41 18 60 53 171 Tota 1, all countries--: 44 20 uO •)S 189

A-58
Table A-2.--Plastic spring clothespins: U.S. imports for consumption, by principal sources and by months, January-April 1978--Continued
January February March April Total
Nonmarket-economy countries:
Unit value (per gross)
China-------------------: $0.70 $44.79 0 0 $41.05 Romania-----------------: 0 0 0 $0.72 .72
Average---------------:----~.=7=0------4~4~· ~.7~9~---------,.0---------.=7=2------~--~.7 ..... 7 Market-economy countries: :
Denmark-----------------: 1.72 0 $1.d5 0 1.80 France------------------: 0 0 2.82 3.63 3.53 Hong Kong---------------: 1.95 .47 2.30 1.22 1.31 Japan-------------------: 6.04 0 0 0 6.04 Netherlands-------------: 1.25 1.04 1~28 1.38 1.29 Taiwan------------------: 1. 23 1. 08 1. 02 . 96 1. 06 West Germany------------: 1.24 1.26 1.17 1.20 1.24 -----------------------------------------------------Aver age - - - - - - - - - - - - - - - : 1.37 .85 1.38 1.24 1.24
Average, all =========================================== countries-----------: 1.27 • 94 1.38 1.08
1/ Less than $500.
Source: Compiled from official statistics of the U.S. Department of Coilllllerce.
1.19

A-59
Table A-3.--Clothespins: Ratios of inventories at period end to U.S.producers' shipments during the· preceding 12-month or 4-month period, by firms, 1973-77, January-March 1977, and January-March 1~78
Spring type Nonspring type
Period .. . Of wood Of other
~materials Of wood, : Of th : Total
• t • o er, , • excep . . b d. . iron- oun :iron-bound: :
l ')7 3: Forster------------------: *** *** *** *** *** Diamond------------------: *** *** *** *** *** Penley-------------------: *** *** *** *** *** National-----------------: *** *** *** *** *** Vermont------------------: *** *** *** *** *** Total------------------:----~275-.'i-------1~4~.~6.--;__ ____ ~*~*~*__: ______ ~*~*~*-=-----=-24..--,~3
l 974: Forster-----------------~: *** *** *** *** Diamond------------------: *** *** *** *** Penley-------------------: *** *** *** *** National-----------------: *** *** *** *** Vermont------------------: *** *** *** ***
*** k** *** *** ***
Total------------------=-----2-4--.-9-------2-0-.-3---------.-*-*---------*-** ______ 2_4---.6 197 5:
Forster------------------: *** *** *** Diamond------------------: *** *** ***
*** ***
*** ***
Penley-------------------: *** *** *** *** *** National-----------------: *** *** *** *** *** Vermont------------------: *** *** *** *** ***
Total------------------=----~2'6-.~5--------=2~2,_.~2~------~*~*~*.-:;__----~*~*~*.--:........--2-s~.6 1976:
Forster------------------: *** *** Diamond------------------: *** *** Penley-------------------: *** ***
*** *** ***
*** *** ***
National-----------------: *** *** *** *** Vermont------------------: *** *** *** ***
***
*** *** ***
Total------------------=------..2~2-.~o-------1-7--.3 _________ ** __ * _________ *_*_* ______ 2_2 __ .5 1977:
Forster------------------: *** *** *** *** *** Diamond------------------: *** *** *** *** *** Penley-------------------: *** *** *** *** *** National-----------------: *** *** *** *** *** Vermont------------------: *** *** *** *** ***
Tot a 1------------------ =-----.,,..2.,,,.0-. """3 _______ 1,_..4,_.-9---------*...,.*...,.* __ : _____ *..,...,..**...------2"'"'1.-.-.-4

A-60
Table A-3.--Clothespins: Ratios of inventories at period end to u.s.producers' shipments during the preceding 12-month or 4-month period, by firins, 1973-77, January-March 1977, and January-March 1978--Continued
.. . Spring type Nonspring type
Period Of l ·of wood, : Of th : Total • ot1er o er Of wood : except :. b d': ·.materials . · i.ron- oun • :iron-bound: :
January-March 1977: . .. Forster------------------: *** *** *** *** *** Diamond------------------: *** . *** *** *** *** . . Penley-------------------: *** *** *** *** *** National---------------~-: *** *** *** *** *** Vermont------------------: *** *** *** *** ***
Total------------------: 33.1 2"8.8 *** *** 33.2 January-March 1978:
Forster------------------: *** *** *** *** *** Diamond------------------: *** *** *** *** :r•• Penley-------------------: *** *** *** *** *** National-----------------: *** *** *** *** *** Vermont------------------: *** *** 'It** *** ***
Total------------------: 22.2 16.2 *** -X** 22.l . . 1/ Did not report shipments. 2/ On an annual basis.
Source: Compiled from data submitted in response to questionnaires of the U.S. International Trade Commission.

A-6i
Table A-4. --Wood and plastic spring clothespins (TSUS item 790.05): U.S. imports for consumption, bv country, 1Q73-77
Country
Denmark-------------: Netherlands---------: Belgium-------------: W~st Germany--------: Czechoslovakia------: Poland--------------: Romania-------------: Hong Kong-----------: Taiwan--------------: Sweden--------------: Norway--------------: United Kingdom------: France--------------: Italy---------------: Korea (Republic)----: Japan---------------: Switzerland---------: Portugal------------: Spain---------------: Thailand------------: China---------------: Columbia------------: Bulgaria------------:
1973
221,529 282,400 131,122 355,272 135,800 281,275 20,000
312' 313 556
82,974 4,000 1,998
12,417 52,707
8, 7 50 7 ,650
1974 1975
Quantity (gross)
87,457 170,896
82,977 266,017 130,217 237,177 240,848 352,478
4,200 68,523 1,000
417 10,650
600 6,000 1,327
68,975 167,069
69,402 450,641 116,367 432,557
82,292 508,112 341,721 28,000
934
18,015
10,851 20,000
104 25,675
1976
26,500 220,612
53,635 464,791 141,383 458,623 181,308 505,127 742' 716 155,202
21 1,661
30,668
5,138
1,932 2,400
160,931 100
5,000
1977
1,740 151,788
306,447 18,000
506'116 244,930 353,812 827,687
500
480 5,432
35
2,400
669,009
Dominican Republic--: 1,375 Singapore-----------:~~~~~-'-~~~~~'----~~~~--=-~~~~~-'--~~~8~,~1~7-=-5
Total-----------:~l~,_9_10--"--,7_6~3---'~l~,-6~6~0~,~78~4-'-~2~,~3_4_0~,~7_1~5--'--~3~,~1~5~7~,~7~4~8-'-~3::...!....,0~9~7~,~9~2-=-6
Denmark-------------: Netherlands---------: Belgium-------------: west Germany--------: Czechoslovakia------: Poland--------------: Romania-------------: Hong Kong-----------: Taiwan--------------: Sweden--------------: Norway--------------: United Kingdom------: France--------------: Italy---------------: Korea (Republic)----: Japan---------------: Switzerland---------: Portugal------------: Spain---------------: Thailand------------: China---------------: Columbia------------: Bulgaria------------:
168 230
87 253
70 185
11 261
4 61
4 1
10 63
6 6
Value (1,000 dollars)
91 168
71 207
64 163 112 362
4 56
1
1 15
1 5 3
94 226
79 439
73 413
51 521 249
32
3
11
12 29 1
24
28 250
50 429
99 428 113 504 560 135
2 4
44
9
2 3
92 1 3
3 226
338 11
513 167 394 707
1
* 15
1
3
447
Dominican Republic -- : 2 Singapore-----------:~~-:-----:----'-~~~~~'----~~~~--=-~~~~~-'--~~~~~5
Total-----------: 1,420 1,323 2,257 2,756 2,833

A-62
Table A-4.--Wood and plastic spring clothespins (TSUS item 790.05): U.S. imports for consumption, by country, 1973-77--Continued
Country 1973 1974 1975 1976 1977 -----
Unit value (per gross)
Denmark----------------------: $0 .76 $ 1. 04 $ 1. 36 $ 1.06 $ 1. 60 Netherlands------------------: .81 .98 1.35 1.13 1.49 Belgium----------------------: .66 .85 1.14 .93 West Germany-----------------: .71 .78 .97 .92 1.10 Czechoslovakia---------------: .52 . 49 .63 . 70 .58 Poland-----------------------: .66 . 69 .95 .93 1.01 Romania----------------------: .57 .47 .62 .62 . 68 Hong Kong--------------------: .84 1. 03 1.03 1. 00 l. ll Taiwan-----------------------: 6.55 .94 .73 .75 .85 Sweden-----------------------: .73 .82 1.14 .87 1.18 Norway------------------~----: .94 1. 23 - : United Kingdom---------------: .60 89.57 1.00 France-----------------------: .82 2.15 2.76 2.h 4 2.81 Italy------------------------: 1.19 1. 45 1. 44 Korea (Republic)-------------: • 72 - : Japan------------------------: .72 .98 .62 1. 73 24. ll Switzerland------------------: - : • 77 - : - : Portugal---------------------: 2.05 1.10 1.00 Spain------------------------: 1. 44 1. J3 1.18 Thailand---------------------: 7.80 China------------------------: .95 .57 .67 Columbia---------------------: 7.20 Bulgaria---------------------: .66 Dominican Republic-----------: 2.70 Singapore--------------------: .64
Total--------------------: . 74 .80 .96 .87 .91
Source: Compiled from ofOcial statistics of the U.S. Dep:1rtment of Corr:Merce.

A-63
APPENDIX C
Probable Economic Effects of Tariff Changes Under Title I and Title V of the Trade Act of 1974 for Trade Agreement Digest No. 70236, July 1975

A-64
* * * * * * *

Library Cataloging Data
U.S. International Trade Conunission. Clothespins from the People's Republic of China,
the Polish People's Republic, and the Socialist Republic of Romania. Report to the President on Investigations nos. TA-406-2, TA-406-3, and TA-406-4, under section 406 of the Trade act of 1974. Washington, 1978.
38, A-64 p. 28 cm. (USITC Publication 902)
Bibliographical footnotes. ' '. ,,
1. Clothespins. 2. Clothespins--Tariff.

UNITED STATES
INTERNATIONAL TRADE COMMISSION
WASHINGTON. D.C. 20436
OFFICIAL BUSINESS
ADDRESS CORRECTION REQUESTED
ADDRESS CHANGE O Remcve from list O Change as Shown
Please detach address label and mail to address shown above.
Postage And Fees Paid U.S. International Trade Commission
~-I' IL --··