Embed Size (px)
Citation preview
Clostridium difficile Infection (CDI) Surveillance Report
For the Fiscal Year 2012/2013 (April 1, 2012 to March 31, 2013)
Prepared by:
Provincial Infection Control Network of British Columbia (PICNet)
September 2013
Provincial Infection Control Network of BC (PICNet) 1001 West Broadway, Suite 504 Vancouver, BC, V6H 4B1 www.picnet.ca Tel: 604-875-4844 ext 22983 Fax: 604-875-4373 Email: [email protected] Disclaimer
The purpose of this report is to provide information on Clostridium difficile infections in acute care facilities to healthcare providers, decision-makers, patients, and the public. This report may be used, in whole or in part, as the basis for infection prevention and control practices to improve the quality of healthcare services. PICNet does not warrant or assume any legal liability or responsibility for the accuracy, completeness, or usefulness of any information in the report; neither does it intend to provide specific medical advice. Commercial uses are prohibited without express written permission.
CDI surveillance report 2012/2013
Provincial Infection Control Network of British Columbia (PICNet) i
Table of Contents
Summary ............................................................................................................ 1
Introduction ....................................................................................................... 3
Surveillance results ........................................................................................... 4 Population under surveillance .................................................................................................................. 4 Overview of CDI cases ............................................................................................................................... 5 Provincial rate of new cases of CDI associated with the reporting facility ............................................... 8 Rate of new cases of CDI associated with the reporting facility by health authority ............................... 9 Rate of new cases of CDI associated with the reporting facility by facility type .................................... 10 Rate of new cases of CDI associated with the reporting facility by acute care facility........................... 12 Relapse of healthcare-associated CDI ..................................................................................................... 16 Complications within 30 days of diagnosis ............................................................................................. 17
Discussion ........................................................................................................ 18
About the CDI surveillance program................................................................ 20 Purpose of CDI surveillance .................................................................................................................... 20 Population under surveillance ................................................................................................................ 20 Data collection and reporting ................................................................................................................. 20 Data limitations ....................................................................................................................................... 20
Glossary ........................................................................................................... 23
Surveillance Steering Committee .................................................................... 27
References ....................................................................................................... 28
CDI surveillance report 2012/2013
Provincial Infection Control Network of British Columbia (PICNet) ii
Acronyms
BC British Columbia
CA Community-associated
CDI Clostridium difficile infection
CI Confidence interval
FHA Fraser Health Authority
FY Fiscal year
FQ Fiscal quarter
HA Health authority
HAI Healthcare-associated infection
HCA Healthcare-associated
ICP Infection control practitioner
IHA Interior Health Authority
IPC Infection prevention and control
NHA Northern Health Authority
PHC Providence Health Care
PHSA Provincial Health Services Authority
PICNet Provincial Infection Control Network of British Columbia
PCR Polymerase chain reaction
SSC PICNet’s Surveillance Steering Committee
VCHA Vancouver Coastal Health Authority
VIHA Vancouver Island Health Authority
CDI surveillance report 2012/2013
Provincial Infection Control Network of British Columbia (PICNet) 1
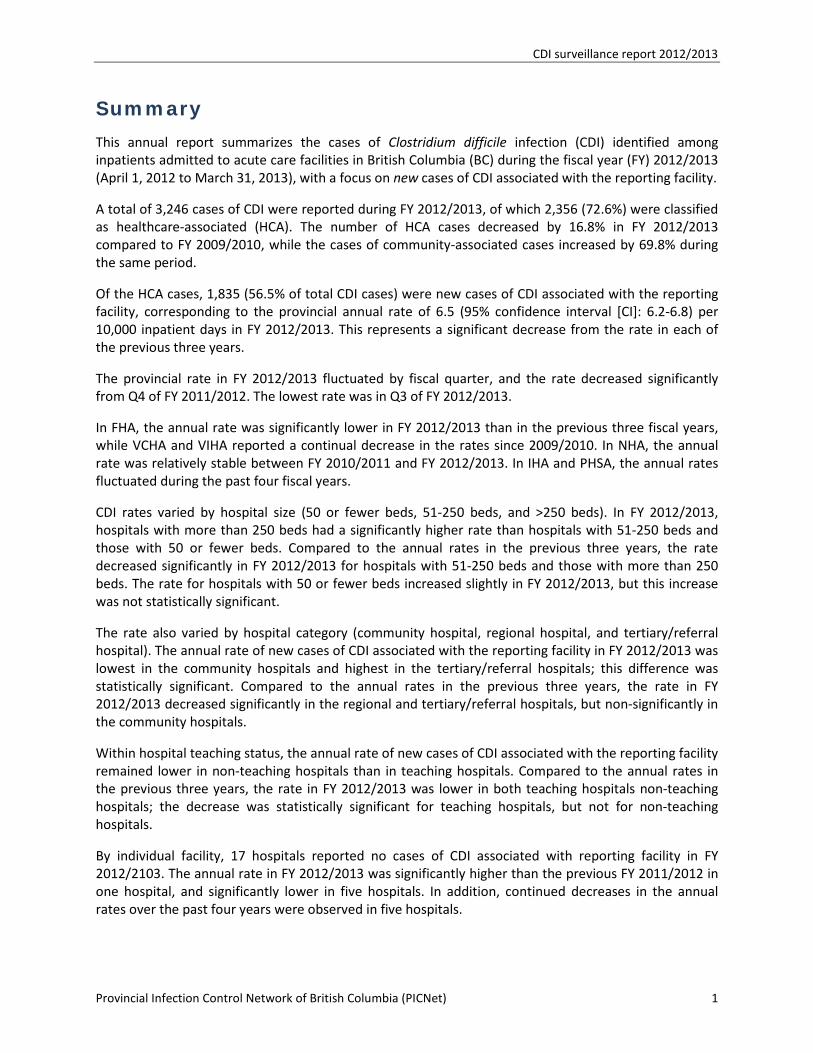
Summary This annual report summarizes the cases of Clostridium difficile infection (CDI) identified among inpatients admitted to acute care facilities in British Columbia (BC) during the fiscal year (FY) 2012/2013 (April 1, 2012 to March 31, 2013), with a focus on new cases of CDI associated with the reporting facility.
A total of 3,246 cases of CDI were reported during FY 2012/2013, of which 2,356 (72.6%) were classified as healthcare-associated (HCA). The number of HCA cases decreased by 16.8% in FY 2012/2013 compared to FY 2009/2010, while the cases of community-associated cases increased by 69.8% during the same period.
Of the HCA cases, 1,835 (56.5% of total CDI cases) were new cases of CDI associated with the reporting facility, corresponding to the provincial annual rate of 6.5 (95% confidence interval [CI]: 6.2-6.8) per 10,000 inpatient days in FY 2012/2013. This represents a significant decrease from the rate in each of the previous three years.
The provincial rate in FY 2012/2013 fluctuated by fiscal quarter, and the rate decreased significantly from Q4 of FY 2011/2012. The lowest rate was in Q3 of FY 2012/2013.
In FHA, the annual rate was significantly lower in FY 2012/2013 than in the previous three fiscal years, while VCHA and VIHA reported a continual decrease in the rates since 2009/2010. In NHA, the annual rate was relatively stable between FY 2010/2011 and FY 2012/2013. In IHA and PHSA, the annual rates fluctuated during the past four fiscal years.
CDI rates varied by hospital size (50 or fewer beds, 51-250 beds, and >250 beds). In FY 2012/2013, hospitals with more than 250 beds had a significantly higher rate than hospitals with 51-250 beds and those with 50 or fewer beds. Compared to the annual rates in the previous three years, the rate decreased significantly in FY 2012/2013 for hospitals with 51-250 beds and those with more than 250 beds. The rate for hospitals with 50 or fewer beds increased slightly in FY 2012/2013, but this increase was not statistically significant.
The rate also varied by hospital category (community hospital, regional hospital, and tertiary/referral hospital). The annual rate of new cases of CDI associated with the reporting facility in FY 2012/2013 was lowest in the community hospitals and highest in the tertiary/referral hospitals; this difference was statistically significant. Compared to the annual rates in the previous three years, the rate in FY 2012/2013 decreased significantly in the regional and tertiary/referral hospitals, but non-significantly in the community hospitals.
Within hospital teaching status, the annual rate of new cases of CDI associated with the reporting facility remained lower in non-teaching hospitals than in teaching hospitals. Compared to the annual rates in the previous three years, the rate in FY 2012/2013 was lower in both teaching hospitals non-teaching hospitals; the decrease was statistically significant for teaching hospitals, but not for non-teaching hospitals.
By individual facility, 17 hospitals reported no cases of CDI associated with reporting facility in FY 2012/2103. The annual rate in FY 2012/2013 was significantly higher than the previous FY 2011/2012 in one hospital, and significantly lower in five hospitals. In addition, continued decreases in the annual rates over the past four years were observed in five hospitals.
CDI surveillance report 2012/2013
Provincial Infection Control Network of British Columbia (PICNet) 2
Relapses accounted for 15.6% of the cases of HCA CDI in FY 2012/2013. There was no statistically significant change in the proportion of relapses at the provincial level compared to the previous years.
All CDI cases are evaluated at 30 days post-diagnosis or up to the point of patient discharge or transfer (whichever comes first) for CDI-associated complications. Of all CDI cases, 146 (4.5%) were admitted to ICU, 23 (0.7%) developed toxic megacolon, and 52 (1.6%) required entire or partial colectomy. The percentage of each complication was not significantly different from previous years at the provincial level.
C. difficile has overtaken Methicillin-resistant Staphylococcus aureus (MRSA) as the most common pathogen of healthcare-associated infections (HAI) in BC acute care facilities. The awareness of CDI has increased and extended beyond healthcare workers to include mainstream media and the public. In response, HAs have enhanced their CDI diagnosis, treatment, and prevention protocols to reduce the spread of infection; this may contribute to the significant decrease in the annual rate of new cases of CDI associated with the reporting facility in FY 2012/2013.
Please note that the rates of CDI in this report are not risk-adjusted, and laboratory testing methodology and at-risk populations differ among HAs. Comparisons of rates between HAs and between healthcare facilities should therefore not be made.
The provincial CDI surveillance program includes all 80 acute care facilities in BC. The surveillance data aggregated by facility are reported to the Provincial Infection Control Network of BC (PICNet) by each health authority (HA) on a quarterly basis.
CDI surveillance report 2012/2013
Provincial Infection Control Network of British Columbia (PICNet) 3
Introduction Clostridium difficile is a Gram-positive, spore-forming, anaerobic bacterium that, when ingested, can cause Clostridium difficile infection (CDI) if it is a toxigenic strain. The symptoms of CDI can vary from mild, self-limited diarrhea to severe diarrhea, pseudomembranous colitis, and toxic megacolon. CDI is a serious healthcare-associated infection (HAI) and a growing healthcare problem1. It has been associated with increased healthcare costs, prolonged hospitalization, and patient morbidity and mortality2,3.
Since 2006, the Provincial Infection Control Network of BC (PICNet), in collaboration with representatives from Interior Health Authority (IHA), Fraser Health Authority (FHA), Vancouver Coastal Health Authority (VCHA), Providence Health Care (PHC), Vancouver Island Health Authority (VIHA), Northern Health Authority (NHA), Provincial Health Services Authority (PHSA), and other relevant organizations, has been developing a standardized CDI surveillance program for British Columbia (BC). The main purposes of this program are to monitor the incidence and trends of CDI in BC acute care facilities, and to provide provincial epidemiological information to assist health authorities (HAs) in the development and evaluation of CDI prevention programs. The provincial CDI surveillance protocol was developed by PICNet’s Surveillance Steering Committee (SSC) to standardize case definitions and minimum surveillance datasets. Based on positive laboratory results, symptom onset, and patients’ encounter history with healthcare facilities, the cases of CDI are classified as either healthcare-associated (HCA) or community-associated (CA) (see Glossary for definitions). The HCA cases are further classified into two categories: those infections associated with the reporting facility, and those infections associated with another facility. Recurrence of CDI within two to eight weeks of previous CDI is defined as a relapse.
All acute care facilities in BC voluntarily participate in this CDI surveillance program. From April 2009, the surveillance data have been submitted to PICNet by all HAs on a quarterly basis, and then reported to the Ministry of Health and the public. This report presents those cases of CDI reported from BC acute care facilities during the fiscal year (FY) 2012/2013 (April 1, 2012 to March 31, 2013) with a focus on new cases of CDI associated with the reporting facility, and compared with previous years. To ensure patient confidentiality, when the number of cases reported by facility or HA is less than 10, it is presented as “<10” in the report.
It is worth noting that the cases referred to as “healthcare-associated” in this report should not be interpreted as the infections acquired directly through healthcare services provided by the reporting facility or other healthcare facilities. Comparison of the numbers of cases and rates between (HAs) and healthcare facilities is not recommended due to the variations in laboratory testing for detection of C. difficile, case classification, and different at-risk populations among HAs and individual facilities. Facilities with small numbers of cases may have unstable rates and percentages; therefore slight changes in the number of cases can dramatically affect the rate and percentage. Please refer to the “Discussion” section and “Limitations” in the “About CDI surveillance program” section for interpretation of the results and limitations of the data.
CDI surveillance report 2012/2013
Provincial Infection Control Network of British Columbia (PICNet) 4
Surveillance results
Population under surveillance
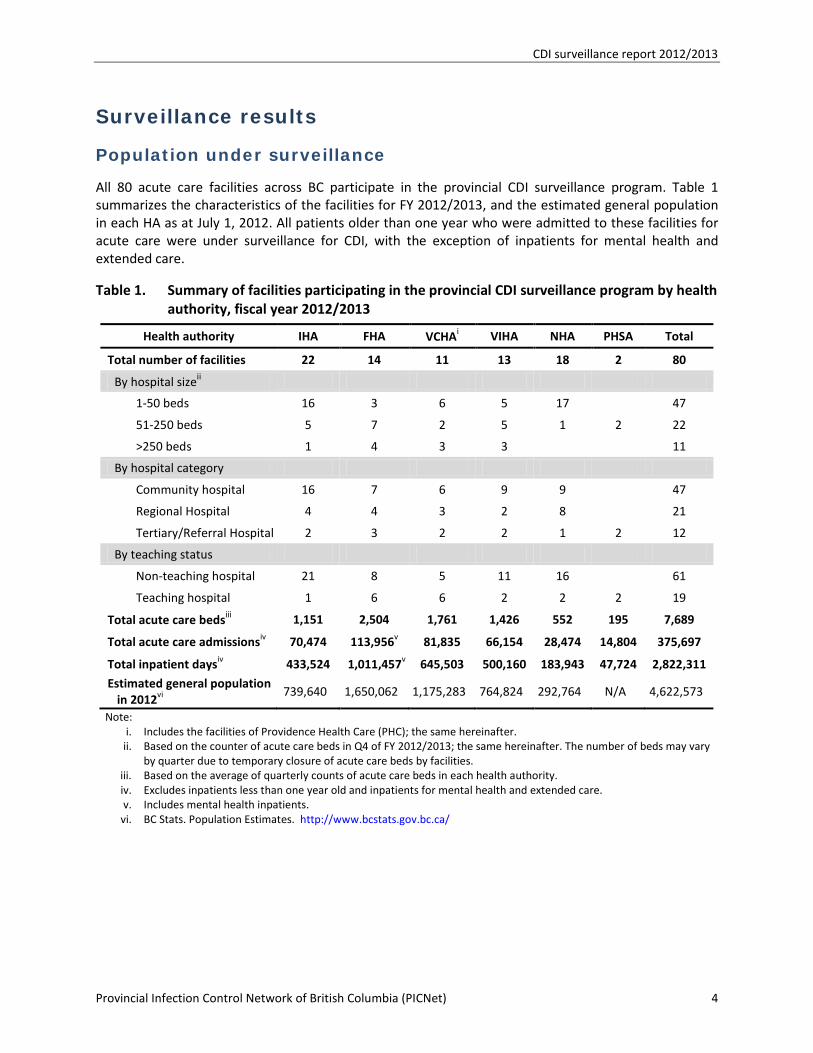
All 80 acute care facilities across BC participate in the provincial CDI surveillance program. Table 1 summarizes the characteristics of the facilities for FY 2012/2013, and the estimated general population in each HA as at July 1, 2012. All patients older than one year who were admitted to these facilities for acute care were under surveillance for CDI, with the exception of inpatients for mental health and extended care.
Table 1. Summary of facilities participating in the provincial CDI surveillance program by health authority, fiscal year 2012/2013
Health authority IHA FHA VCHAi VIHA NHA PHSA Total
Total number of facilities 22 14 11 13 18 2 80
By hospital sizeii
1-50 beds 16 3 6 5 17 47
51-250 beds 5 7 2 5 1 2 22
>250 beds 1 4 3 3 11
By hospital category
Community hospital 16 7 6 9 9 47
Regional Hospital 4 4 3 2 8 21
Tertiary/Referral Hospital 2 3 2 2 1 2 12
By teaching status
Non-teaching hospital 21 8 5 11 16 61
Teaching hospital 1 6 6 2 2 2 19
Total acute care bedsiii 1,151 2,504 1,761 1,426 552 195 7,689
Total acute care admissionsiv 70,474 113,956v 81,835 66,154 28,474 14,804 375,697
Total inpatient daysiv 433,524 1,011,457v 645,503 500,160 183,943 47,724 2,822,311
Estimated general population in 2012vi
739,640 1,650,062 1,175,283 764,824 292,764 N/A 4,622,573
Note: i. Includes the facilities of Providence Health Care (PHC); the same hereinafter. ii. Based on the counter of acute care beds in Q4 of FY 2012/2013; the same hereinafter. The number of beds may vary
by quarter due to temporary closure of acute care beds by facilities. iii. Based on the average of quarterly counts of acute care beds in each health authority. iv. Excludes inpatients less than one year old and inpatients for mental health and extended care. v. Includes mental health inpatients.
vi. BC Stats. Population Estimates. http://www.bcstats.gov.bc.ca/
CDI surveillance report 2012/2013
Provincial Infection Control Network of British Columbia (PICNet) 5
Overview of CDI cases
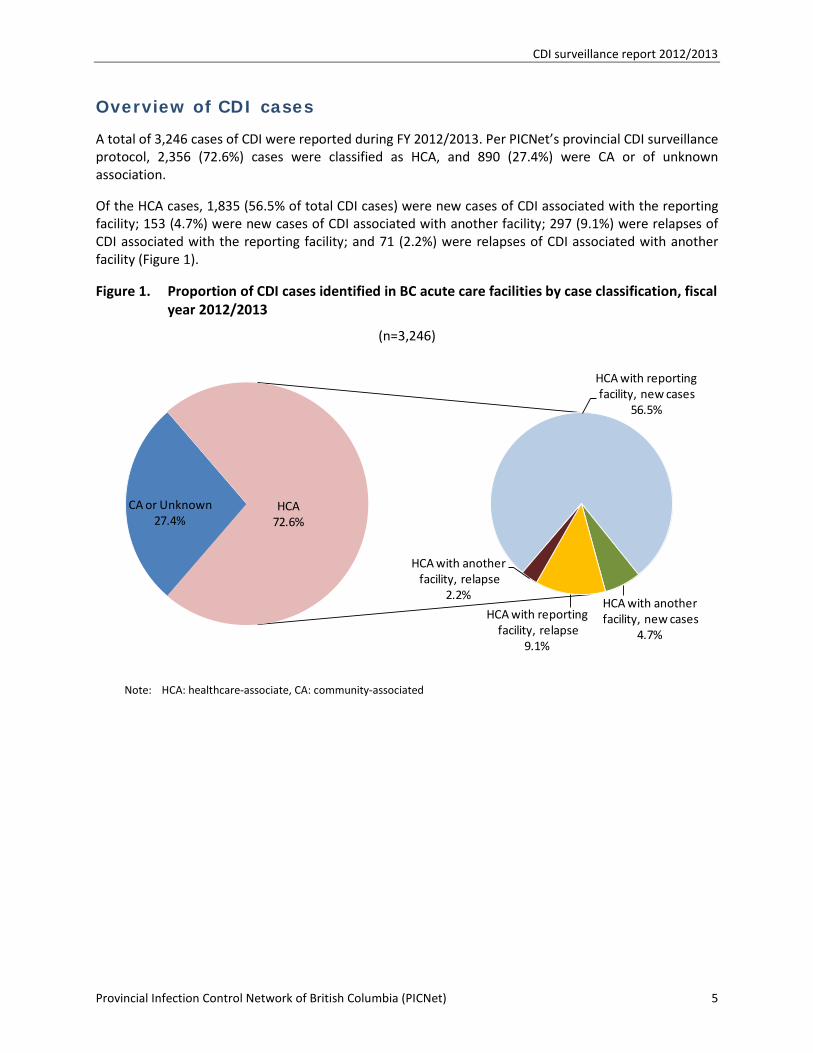
A total of 3,246 cases of CDI were reported during FY 2012/2013. Per PICNet’s provincial CDI surveillance protocol, 2,356 (72.6%) cases were classified as HCA, and 890 (27.4%) were CA or of unknown association.
Of the HCA cases, 1,835 (56.5% of total CDI cases) were new cases of CDI associated with the reporting facility; 153 (4.7%) were new cases of CDI associated with another facility; 297 (9.1%) were relapses of CDI associated with the reporting facility; and 71 (2.2%) were relapses of CDI associated with another facility (Figure 1).
Figure 1. Proportion of CDI cases identified in BC acute care facilities by case classification, fiscal year 2012/2013
(n=3,246)
Note: HCA: healthcare-associate, CA: community-associated
CA or Unknown 27.4%
HCA with reportingfacility, new cases
56.5%
HCA with anotherfacility, new cases
4.7%
HCA with reportingfacility, relapse
9.1%
HCA with anotherfacility, relapse
2.2%
HCA72.6%
CDI surveillance report 2012/2013
Provincial Infection Control Network of British Columbia (PICNet) 6
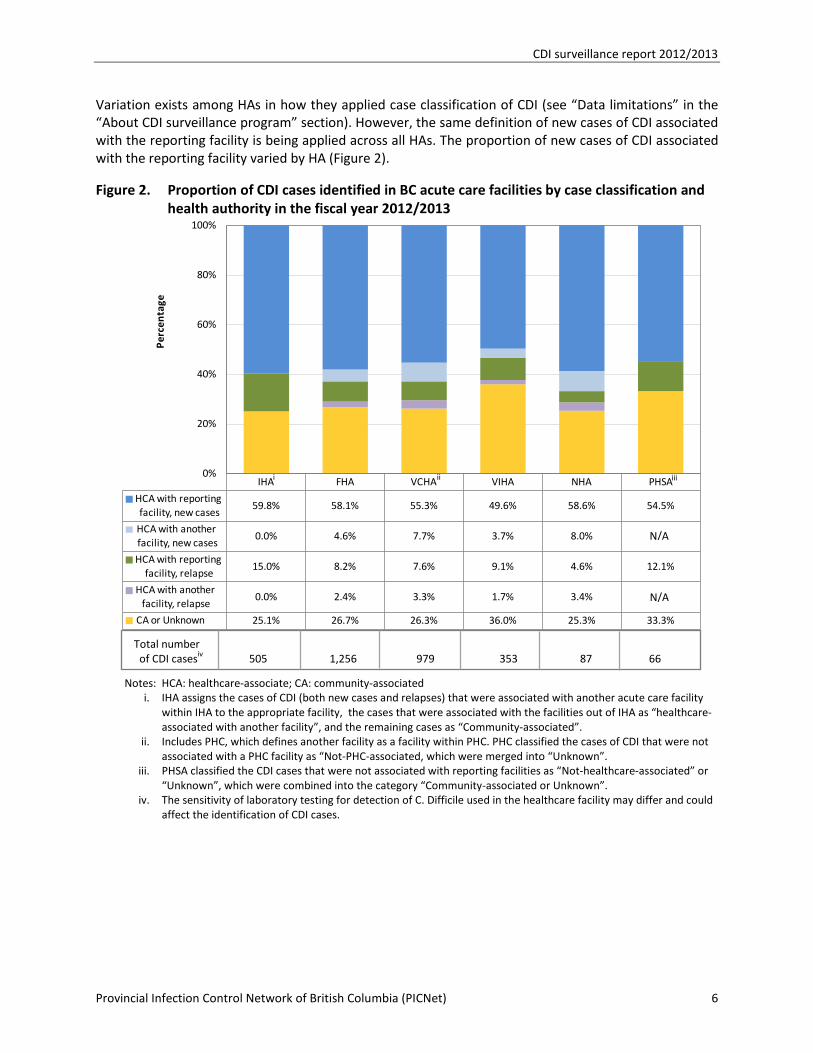
Variation exists among HAs in how they applied case classification of CDI (see “Data limitations” in the “About CDI surveillance program” section). However, the same definition of new cases of CDI associated with the reporting facility is being applied across all HAs. The proportion of new cases of CDI associated with the reporting facility varied by HA (Figure 2).
Figure 2. Proportion of CDI cases identified in BC acute care facilities by case classification and health authority in the fiscal year 2012/2013
Notes: HCA: healthcare-associate; CA: community-associated i. IHA assigns the cases of CDI (both new cases and relapses) that were associated with another acute care facility
within IHA to the appropriate facility, the cases that were associated with the facilities out of IHA as “healthcare-associated with another facility”, and the remaining cases as “Community-associated”.
ii. Includes PHC, which defines another facility as a facility within PHC. PHC classified the cases of CDI that were not associated with a PHC facility as “Not-PHC-associated, which were merged into “Unknown”.
iii. PHSA classified the CDI cases that were not associated with reporting facilities as “Not-healthcare-associated” or “Unknown”, which were combined into the category “Community-associated or Unknown”.
iv. The sensitivity of laboratory testing for detection of C. Difficile used in the healthcare facility may differ and could affect the identification of CDI cases.
IHA FHA VCHA VIHA NHA PHSA
HCA with reportingfacility, new cases
59.8% 58.1% 55.3% 49.6% 58.6% 54.5%
HCA with anotherfacility, new cases
0.0% 4.6% 7.7% 3.7% 8.0%
HCA with reportingfacility, relapse
15.0% 8.2% 7.6% 9.1% 4.6% 12.1%
HCA with anotherfacility, relapse
0.0% 2.4% 3.3% 1.7% 3.4%
CA or Unknown 25.1% 26.7% 26.3% 36.0% 25.3% 33.3%
0%
20%
40%
60%
80%
100%
Perc
enta
ge
N/A
i ii iii
Total number of CDI casesiv 505 1,256 979 353 87 66
N/A
CDI surveillance report 2012/2013
Provincial Infection Control Network of British Columbia (PICNet) 7
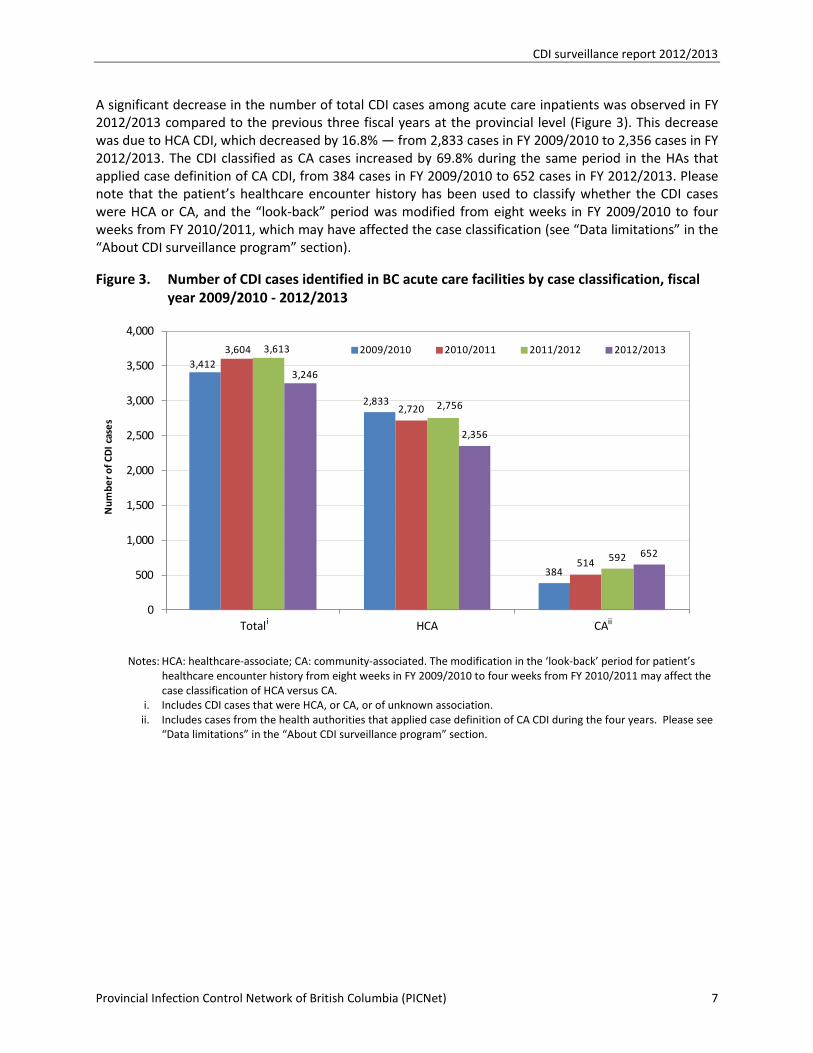
A significant decrease in the number of total CDI cases among acute care inpatients was observed in FY 2012/2013 compared to the previous three fiscal years at the provincial level (Figure 3). This decrease was due to HCA CDI, which decreased by 16.8% — from 2,833 cases in FY 2009/2010 to 2,356 cases in FY 2012/2013. The CDI classified as CA cases increased by 69.8% during the same period in the HAs that applied case definition of CA CDI, from 384 cases in FY 2009/2010 to 652 cases in FY 2012/2013. Please note that the patient’s healthcare encounter history has been used to classify whether the CDI cases were HCA or CA, and the “look-back” period was modified from eight weeks in FY 2009/2010 to four weeks from FY 2010/2011, which may have affected the case classification (see “Data limitations” in the “About CDI surveillance program” section).
Figure 3. Number of CDI cases identified in BC acute care facilities by case classification, fiscal year 2009/2010 - 2012/2013
Notes: HCA: healthcare-associate; CA: community-associated. The modification in the ‘look-back’ period for patient’s
healthcare encounter history from eight weeks in FY 2009/2010 to four weeks from FY 2010/2011 may affect the case classification of HCA versus CA.
i. Includes CDI cases that were HCA, or CA, or of unknown association. ii. Includes cases from the health authorities that applied case definition of CA CDI during the four years. Please see
“Data limitations” in the “About CDI surveillance program” section.
3,412
2,833
384
3,604
2,720
514
3,613
2,756
592
3,246
2,356
652
0
500
1,000
1,500
2,000
2,500
3,000
3,500
4,000
Total HCA CA
Num
ber o
f CD
I cas
es
2009/2010 2010/2011 2011/2012 2012/2013
i ii
CDI surveillance report 2012/2013
Provincial Infection Control Network of British Columbia (PICNet) 8
Provincial rate of new cases of CDI associated with the reporting facility
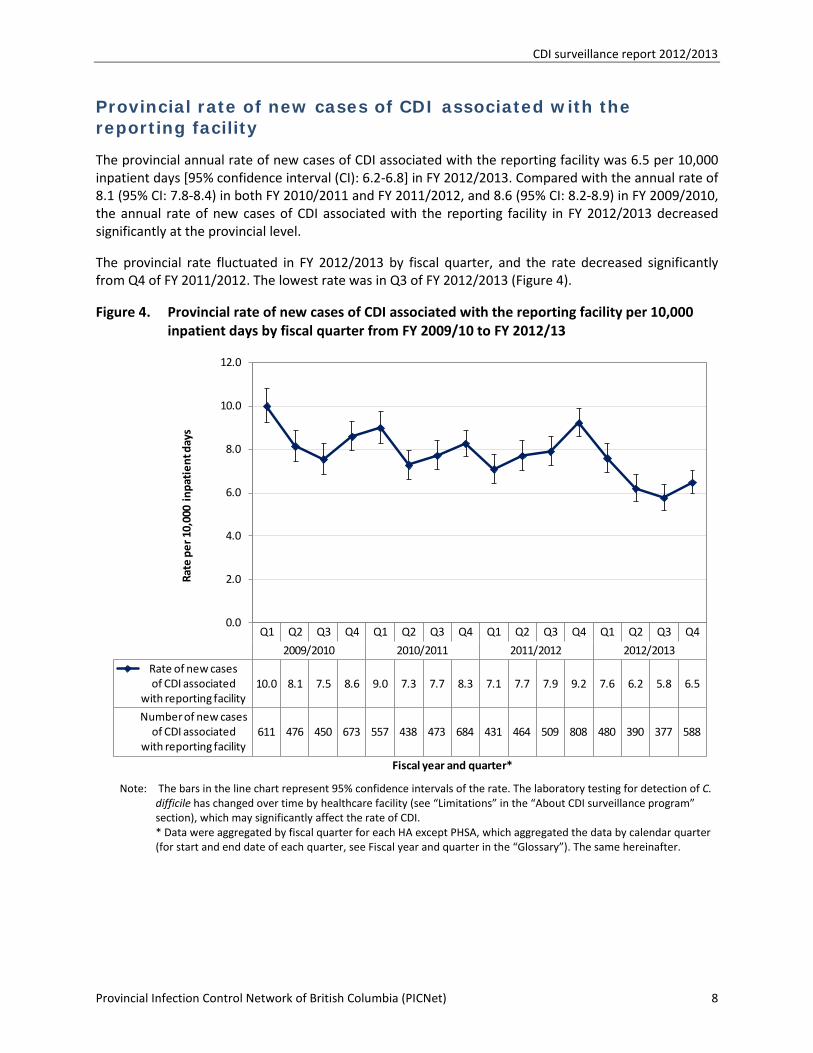
The provincial annual rate of new cases of CDI associated with the reporting facility was 6.5 per 10,000 inpatient days [95% confidence interval (CI): 6.2-6.8] in FY 2012/2013. Compared with the annual rate of 8.1 (95% CI: 7.8-8.4) in both FY 2010/2011 and FY 2011/2012, and 8.6 (95% CI: 8.2-8.9) in FY 2009/2010, the annual rate of new cases of CDI associated with the reporting facility in FY 2012/2013 decreased significantly at the provincial level.
The provincial rate fluctuated in FY 2012/2013 by fiscal quarter, and the rate decreased significantly from Q4 of FY 2011/2012. The lowest rate was in Q3 of FY 2012/2013 (Figure 4).
Figure 4. Provincial rate of new cases of CDI associated with the reporting facility per 10,000 inpatient days by fiscal quarter from FY 2009/10 to FY 2012/13
Note: The bars in the line chart represent 95% confidence intervals of the rate. The laboratory testing for detection of C.
difficile has changed over time by healthcare facility (see “Limitations” in the “About CDI surveillance program” section), which may significantly affect the rate of CDI.
* Data were aggregated by fiscal quarter for each HA except PHSA, which aggregated the data by calendar quarter (for start and end date of each quarter, see Fiscal year and quarter in the “Glossary”). The same hereinafter.
Q1 Q2 Q3 Q4 Q1 Q2 Q3 Q4 Q1 Q2 Q3 Q4 Q1 Q2 Q3 Q4
2009/2010 2010/2011 2011/2012 2012/2013
Rate of new cases of CDI associated
with reporting facility 10.0 8.1 7.5 8.6 9.0 7.3 7.7 8.3 7.1 7.7 7.9 9.2 7.6 6.2 5.8 6.5
Number of new cases of CDI associated
with reporting facility611 476 450 673 557 438 473 684 431 464 509 808 480 390 377 588
0.0
2.0
4.0
6.0
8.0
10.0
12.0
Rate
per
10,
000
inpa
tien
t day
s
Fiscal year and quarter*
CDI surveillance report 2012/2013
Provincial Infection Control Network of British Columbia (PICNet) 9
Rate of new cases of CDI associated with the reporting facility by health authority
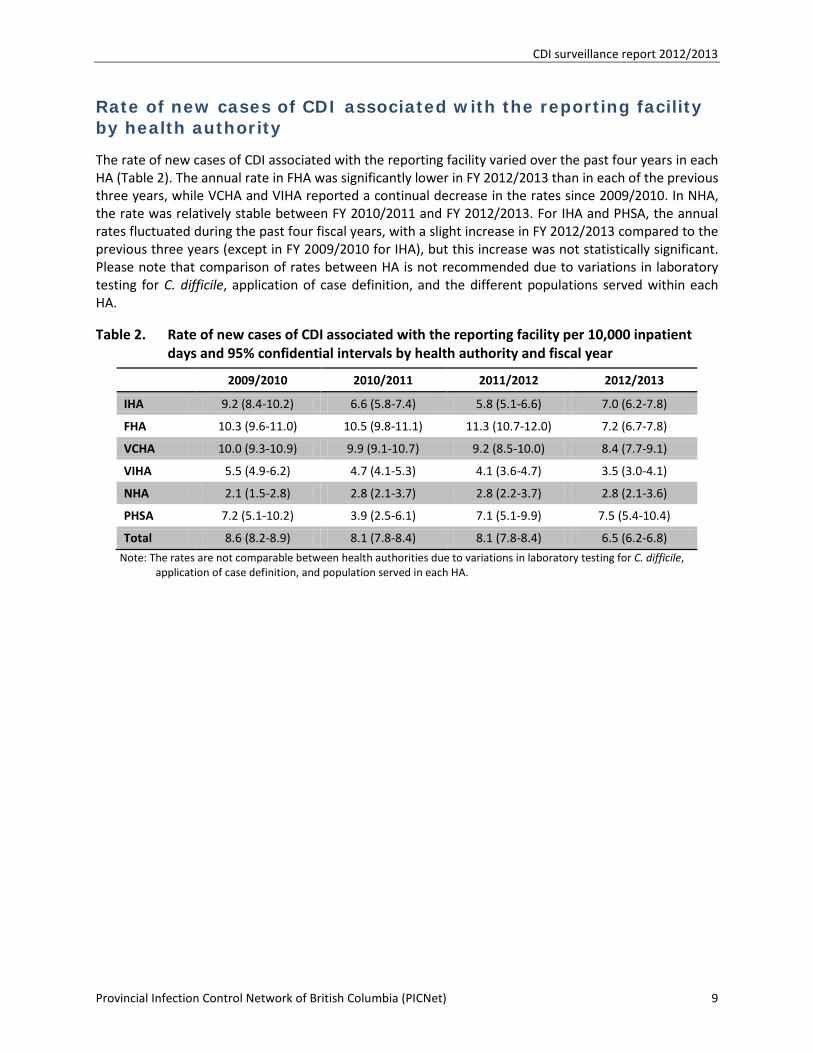
The rate of new cases of CDI associated with the reporting facility varied over the past four years in each HA (Table 2). The annual rate in FHA was significantly lower in FY 2012/2013 than in each of the previous three years, while VCHA and VIHA reported a continual decrease in the rates since 2009/2010. In NHA, the rate was relatively stable between FY 2010/2011 and FY 2012/2013. For IHA and PHSA, the annual rates fluctuated during the past four fiscal years, with a slight increase in FY 2012/2013 compared to the previous three years (except in FY 2009/2010 for IHA), but this increase was not statistically significant. Please note that comparison of rates between HA is not recommended due to variations in laboratory testing for C. difficile, application of case definition, and the different populations served within each HA.
Table 2. Rate of new cases of CDI associated with the reporting facility per 10,000 inpatient days and 95% confidential intervals by health authority and fiscal year
2009/2010 2010/2011 2011/2012 2012/2013
IHA 9.2 (8.4-10.2) 6.6 (5.8-7.4) 5.8 (5.1-6.6) 7.0 (6.2-7.8)
FHA 10.3 (9.6-11.0) 10.5 (9.8-11.1) 11.3 (10.7-12.0) 7.2 (6.7-7.8)
VCHA 10.0 (9.3-10.9) 9.9 (9.1-10.7) 9.2 (8.5-10.0) 8.4 (7.7-9.1)
VIHA 5.5 (4.9-6.2) 4.7 (4.1-5.3) 4.1 (3.6-4.7) 3.5 (3.0-4.1)
NHA 2.1 (1.5-2.8) 2.8 (2.1-3.7) 2.8 (2.2-3.7) 2.8 (2.1-3.6)
PHSA 7.2 (5.1-10.2) 3.9 (2.5-6.1) 7.1 (5.1-9.9) 7.5 (5.4-10.4)
Total 8.6 (8.2-8.9) 8.1 (7.8-8.4) 8.1 (7.8-8.4) 6.5 (6.2-6.8)
Note: The rates are not comparable between health authorities due to variations in laboratory testing for C. difficile, application of case definition, and population served in each HA.
CDI surveillance report 2012/2013
Provincial Infection Control Network of British Columbia (PICNet) 10
Rate of new cases of CDI associated with the reporting facility by facility type
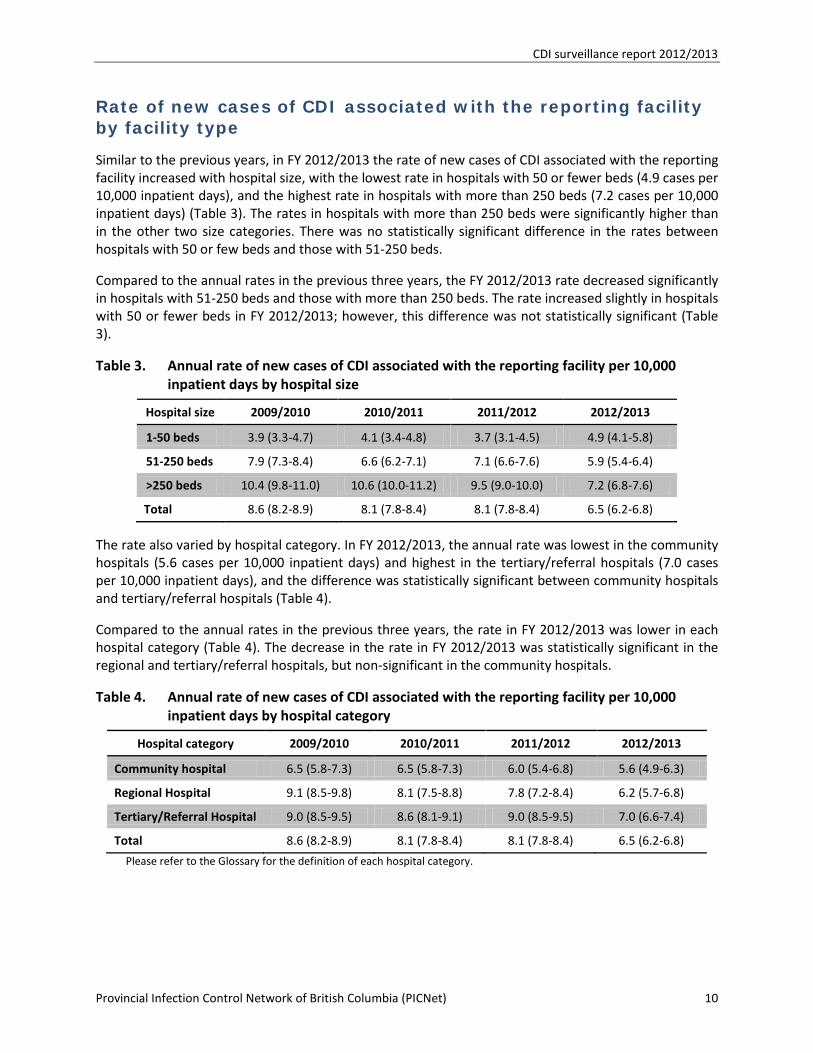
Similar to the previous years, in FY 2012/2013 the rate of new cases of CDI associated with the reporting facility increased with hospital size, with the lowest rate in hospitals with 50 or fewer beds (4.9 cases per 10,000 inpatient days), and the highest rate in hospitals with more than 250 beds (7.2 cases per 10,000 inpatient days) (Table 3). The rates in hospitals with more than 250 beds were significantly higher than in the other two size categories. There was no statistically significant difference in the rates between hospitals with 50 or few beds and those with 51-250 beds.
Compared to the annual rates in the previous three years, the FY 2012/2013 rate decreased significantly in hospitals with 51-250 beds and those with more than 250 beds. The rate increased slightly in hospitals with 50 or fewer beds in FY 2012/2013; however, this difference was not statistically significant (Table 3).
Table 3. Annual rate of new cases of CDI associated with the reporting facility per 10,000 inpatient days by hospital size
Hospital size 2009/2010 2010/2011 2011/2012 2012/2013
1-50 beds 3.9 (3.3-4.7) 4.1 (3.4-4.8) 3.7 (3.1-4.5) 4.9 (4.1-5.8)
51-250 beds 7.9 (7.3-8.4) 6.6 (6.2-7.1) 7.1 (6.6-7.6) 5.9 (5.4-6.4)
>250 beds 10.4 (9.8-11.0) 10.6 (10.0-11.2) 9.5 (9.0-10.0) 7.2 (6.8-7.6)
Total 8.6 (8.2-8.9) 8.1 (7.8-8.4) 8.1 (7.8-8.4) 6.5 (6.2-6.8)
The rate also varied by hospital category. In FY 2012/2013, the annual rate was lowest in the community hospitals (5.6 cases per 10,000 inpatient days) and highest in the tertiary/referral hospitals (7.0 cases per 10,000 inpatient days), and the difference was statistically significant between community hospitals and tertiary/referral hospitals (Table 4).
Compared to the annual rates in the previous three years, the rate in FY 2012/2013 was lower in each hospital category (Table 4). The decrease in the rate in FY 2012/2013 was statistically significant in the regional and tertiary/referral hospitals, but non-significant in the community hospitals.
Table 4. Annual rate of new cases of CDI associated with the reporting facility per 10,000 inpatient days by hospital category
Hospital category 2009/2010 2010/2011 2011/2012 2012/2013
Community hospital 6.5 (5.8-7.3) 6.5 (5.8-7.3) 6.0 (5.4-6.8) 5.6 (4.9-6.3)
Regional Hospital 9.1 (8.5-9.8) 8.1 (7.5-8.8) 7.8 (7.2-8.4) 6.2 (5.7-6.8)
Tertiary/Referral Hospital 9.0 (8.5-9.5) 8.6 (8.1-9.1) 9.0 (8.5-9.5) 7.0 (6.6-7.4)
Total 8.6 (8.2-8.9) 8.1 (7.8-8.4) 8.1 (7.8-8.4) 6.5 (6.2-6.8)
Please refer to the Glossary for the definition of each hospital category.
CDI surveillance report 2012/2013
Provincial Infection Control Network of British Columbia (PICNet) 11
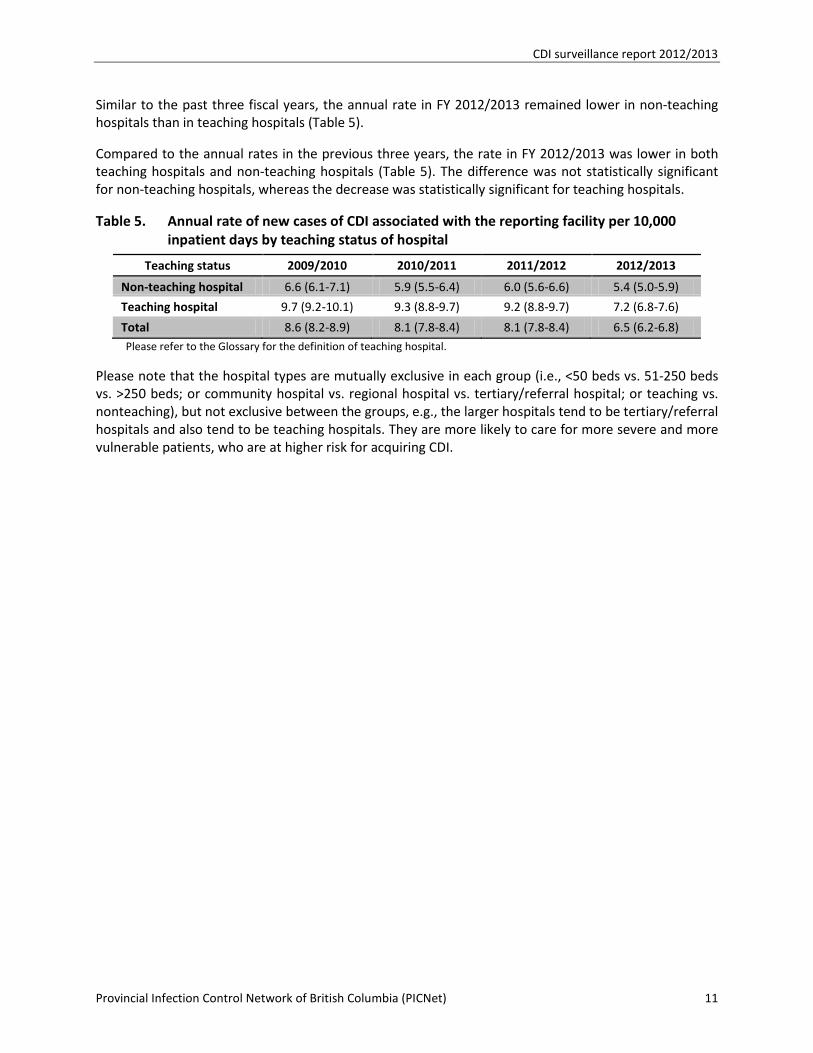
Similar to the past three fiscal years, the annual rate in FY 2012/2013 remained lower in non-teaching hospitals than in teaching hospitals (Table 5).
Compared to the annual rates in the previous three years, the rate in FY 2012/2013 was lower in both teaching hospitals and non-teaching hospitals (Table 5). The difference was not statistically significant for non-teaching hospitals, whereas the decrease was statistically significant for teaching hospitals.
Table 5. Annual rate of new cases of CDI associated with the reporting facility per 10,000 inpatient days by teaching status of hospital
Teaching status 2009/2010 2010/2011 2011/2012 2012/2013
Non-teaching hospital 6.6 (6.1-7.1) 5.9 (5.5-6.4) 6.0 (5.6-6.6) 5.4 (5.0-5.9)
Teaching hospital 9.7 (9.2-10.1) 9.3 (8.8-9.7) 9.2 (8.8-9.7) 7.2 (6.8-7.6)
Total 8.6 (8.2-8.9) 8.1 (7.8-8.4) 8.1 (7.8-8.4) 6.5 (6.2-6.8) Please refer to the Glossary for the definition of teaching hospital.
Please note that the hospital types are mutually exclusive in each group (i.e., <50 beds vs. 51-250 beds vs. >250 beds; or community hospital vs. regional hospital vs. tertiary/referral hospital; or teaching vs. nonteaching), but not exclusive between the groups, e.g., the larger hospitals tend to be tertiary/referral hospitals and also tend to be teaching hospitals. They are more likely to care for more severe and more vulnerable patients, who are at higher risk for acquiring CDI.
CDI surveillance report 2012/2013
Provincial Infection Control Network of British Columbia (PICNet) 12
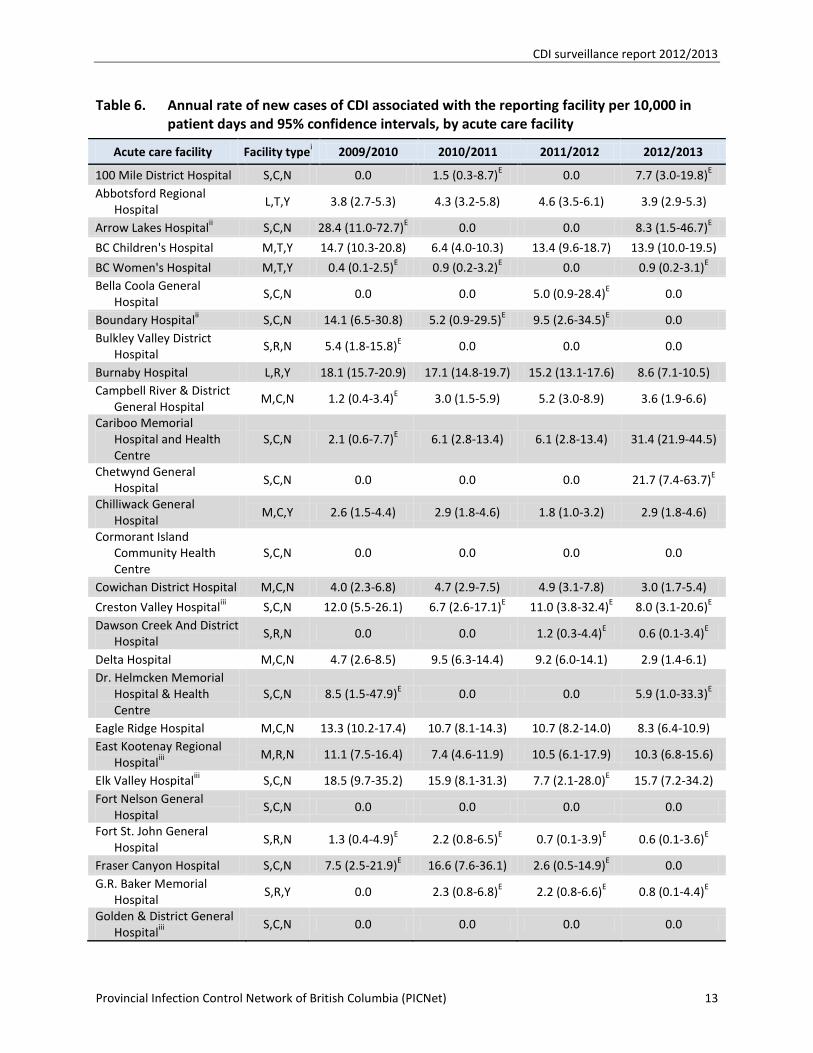
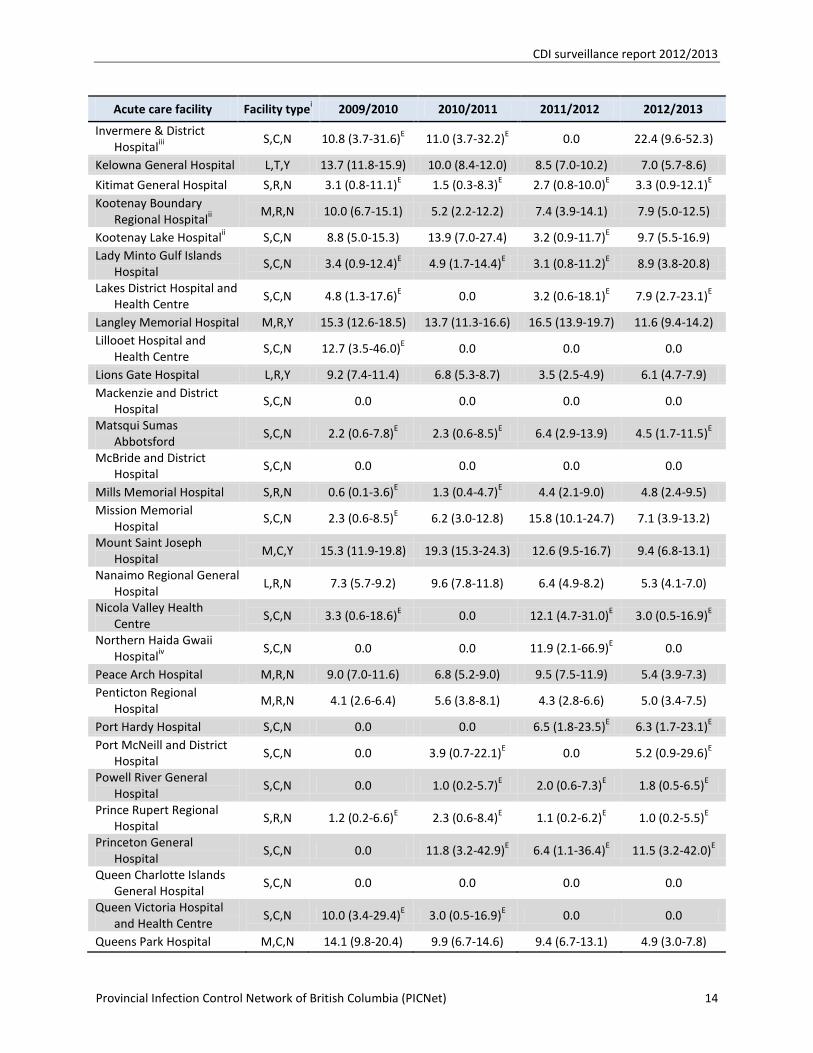
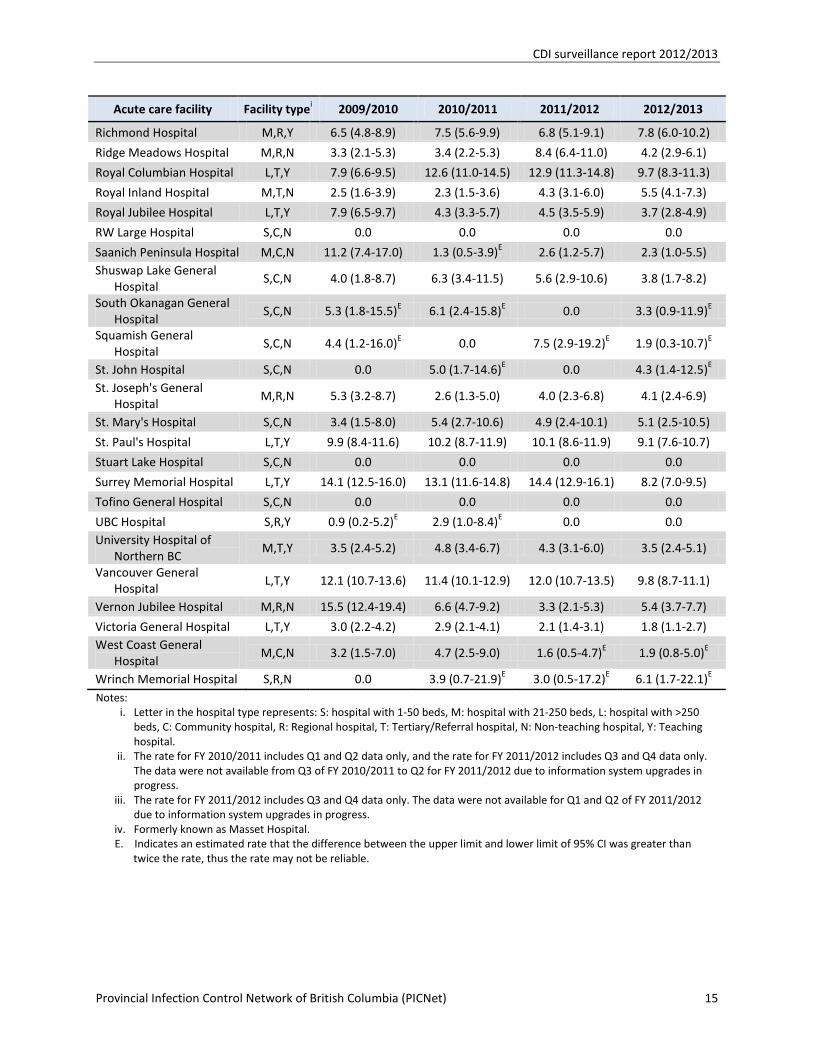
Rate of new cases of CDI associated with the reporting facility by acute care facility
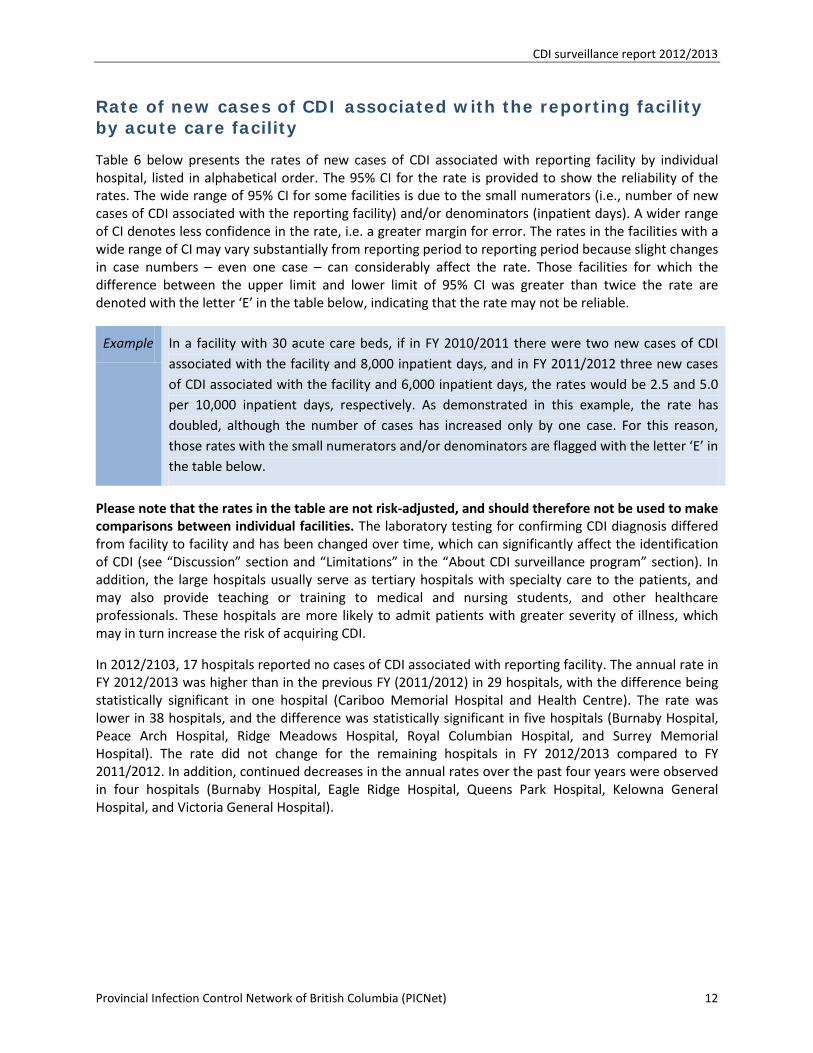
Table 6 below presents the rates of new cases of CDI associated with reporting facility by individual hospital, listed in alphabetical order. The 95% CI for the rate is provided to show the reliability of the rates. The wide range of 95% CI for some facilities is due to the small numerators (i.e., number of new cases of CDI associated with the reporting facility) and/or denominators (inpatient days). A wider range of CI denotes less confidence in the rate, i.e. a greater margin for error. The rates in the facilities with a wide range of CI may vary substantially from reporting period to reporting period because slight changes in case numbers – even one case – can considerably affect the rate. Those facilities for which the difference between the upper limit and lower limit of 95% CI was greater than twice the rate are denoted with the letter ‘E’ in the table below, indicating that the rate may not be reliable.
Example In a facility with 30 acute care beds, if in FY 2010/2011 there were two new cases of CDI associated with the facility and 8,000 inpatient days, and in FY 2011/2012 three new cases of CDI associated with the facility and 6,000 inpatient days, the rates would be 2.5 and 5.0 per 10,000 inpatient days, respectively. As demonstrated in this example, the rate has doubled, although the number of cases has increased only by one case. For this reason, those rates with the small numerators and/or denominators are flagged with the letter ‘E’ in the table below.
Please note that the rates in the table are not risk-adjusted, and should therefore not be used to make comparisons between individual facilities. The laboratory testing for confirming CDI diagnosis differed from facility to facility and has been changed over time, which can significantly affect the identification of CDI (see “Discussion” section and “Limitations” in the “About CDI surveillance program” section). In addition, the large hospitals usually serve as tertiary hospitals with specialty care to the patients, and may also provide teaching or training to medical and nursing students, and other healthcare professionals. These hospitals are more likely to admit patients with greater severity of illness, which may in turn increase the risk of acquiring CDI.
In 2012/2103, 17 hospitals reported no cases of CDI associated with reporting facility. The annual rate in FY 2012/2013 was higher than in the previous FY (2011/2012) in 29 hospitals, with the difference being statistically significant in one hospital (Cariboo Memorial Hospital and Health Centre). The rate was lower in 38 hospitals, and the difference was statistically significant in five hospitals (Burnaby Hospital, Peace Arch Hospital, Ridge Meadows Hospital, Royal Columbian Hospital, and Surrey Memorial Hospital). The rate did not change for the remaining hospitals in FY 2012/2013 compared to FY 2011/2012. In addition, continued decreases in the annual rates over the past four years were observed in four hospitals (Burnaby Hospital, Eagle Ridge Hospital, Queens Park Hospital, Kelowna General Hospital, and Victoria General Hospital).
CDI surveillance report 2012/2013
Provincial Infection Control Network of British Columbia (PICNet) 13
Table 6. Annual rate of new cases of CDI associated with the reporting facility per 10,000 in patient days and 95% confidence intervals, by acute care facility
Acute care facility Facility typei 2009/2010 2010/2011 2011/2012 2012/2013
100 Mile District Hospital S,C,N 0.0 1.5 (0.3-8.7)E 0.0 7.7 (3.0-19.8)E Abbotsford Regional
Hospital L,T,Y 3.8 (2.7-5.3) 4.3 (3.2-5.8) 4.6 (3.5-6.1) 3.9 (2.9-5.3)
Arrow Lakes Hospitalii S,C,N 28.4 (11.0-72.7)E 0.0 0.0 8.3 (1.5-46.7)E
BC Children's Hospital M,T,Y 14.7 (10.3-20.8) 6.4 (4.0-10.3) 13.4 (9.6-18.7) 13.9 (10.0-19.5)
BC Women's Hospital M,T,Y 0.4 (0.1-2.5)E 0.9 (0.2-3.2)E 0.0 0.9 (0.2-3.1)E Bella Coola General
Hospital S,C,N 0.0 0.0 5.0 (0.9-28.4)E 0.0
Boundary Hospitalii S,C,N 14.1 (6.5-30.8) 5.2 (0.9-29.5)E 9.5 (2.6-34.5)E 0.0 Bulkley Valley District
Hospital S,R,N 5.4 (1.8-15.8)E 0.0 0.0 0.0
Burnaby Hospital L,R,Y 18.1 (15.7-20.9) 17.1 (14.8-19.7) 15.2 (13.1-17.6) 8.6 (7.1-10.5) Campbell River & District
General Hospital M,C,N 1.2 (0.4-3.4)E 3.0 (1.5-5.9) 5.2 (3.0-8.9) 3.6 (1.9-6.6)
Cariboo Memorial Hospital and Health Centre
S,C,N 2.1 (0.6-7.7)E 6.1 (2.8-13.4) 6.1 (2.8-13.4) 31.4 (21.9-44.5)
Chetwynd General Hospital
S,C,N 0.0 0.0 0.0 21.7 (7.4-63.7)E
Chilliwack General Hospital
M,C,Y 2.6 (1.5-4.4) 2.9 (1.8-4.6) 1.8 (1.0-3.2) 2.9 (1.8-4.6)
Cormorant Island Community Health Centre
S,C,N 0.0 0.0 0.0 0.0
Cowichan District Hospital M,C,N 4.0 (2.3-6.8) 4.7 (2.9-7.5) 4.9 (3.1-7.8) 3.0 (1.7-5.4)
Creston Valley Hospitaliii S,C,N 12.0 (5.5-26.1) 6.7 (2.6-17.1)E 11.0 (3.8-32.4)E 8.0 (3.1-20.6)E Dawson Creek And District
Hospital S,R,N 0.0 0.0 1.2 (0.3-4.4)E 0.6 (0.1-3.4)E
Delta Hospital M,C,N 4.7 (2.6-8.5) 9.5 (6.3-14.4) 9.2 (6.0-14.1) 2.9 (1.4-6.1) Dr. Helmcken Memorial
Hospital & Health Centre
S,C,N 8.5 (1.5-47.9)E 0.0 0.0 5.9 (1.0-33.3)E
Eagle Ridge Hospital M,C,N 13.3 (10.2-17.4) 10.7 (8.1-14.3) 10.7 (8.2-14.0) 8.3 (6.4-10.9) East Kootenay Regional
Hospitaliii M,R,N 11.1 (7.5-16.4) 7.4 (4.6-11.9) 10.5 (6.1-17.9) 10.3 (6.8-15.6)
Elk Valley Hospitaliii S,C,N 18.5 (9.7-35.2) 15.9 (8.1-31.3) 7.7 (2.1-28.0)E 15.7 (7.2-34.2) Fort Nelson General
Hospital S,C,N 0.0 0.0 0.0 0.0
Fort St. John General Hospital
S,R,N 1.3 (0.4-4.9)E 2.2 (0.8-6.5)E 0.7 (0.1-3.9)E 0.6 (0.1-3.6)E
Fraser Canyon Hospital S,C,N 7.5 (2.5-21.9)E 16.6 (7.6-36.1) 2.6 (0.5-14.9)E 0.0 G.R. Baker Memorial
Hospital S,R,Y 0.0 2.3 (0.8-6.8)E 2.2 (0.8-6.6)E 0.8 (0.1-4.4)E
Golden & District General Hospitaliii
S,C,N 0.0 0.0 0.0 0.0
CDI surveillance report 2012/2013
Provincial Infection Control Network of British Columbia (PICNet) 14
Acute care facility Facility typei 2009/2010 2010/2011 2011/2012 2012/2013
Invermere & District Hospitaliii
S,C,N 10.8 (3.7-31.6)E 11.0 (3.7-32.2)E 0.0 22.4 (9.6-52.3)
Kelowna General Hospital L,T,Y 13.7 (11.8-15.9) 10.0 (8.4-12.0) 8.5 (7.0-10.2) 7.0 (5.7-8.6)
Kitimat General Hospital S,R,N 3.1 (0.8-11.1)E 1.5 (0.3-8.3)E 2.7 (0.8-10.0)E 3.3 (0.9-12.1)E Kootenay Boundary
Regional Hospitalii M,R,N 10.0 (6.7-15.1) 5.2 (2.2-12.2) 7.4 (3.9-14.1) 7.9 (5.0-12.5)
Kootenay Lake Hospitalii S,C,N 8.8 (5.0-15.3) 13.9 (7.0-27.4) 3.2 (0.9-11.7)E 9.7 (5.5-16.9) Lady Minto Gulf Islands
Hospital S,C,N 3.4 (0.9-12.4)E 4.9 (1.7-14.4)E 3.1 (0.8-11.2)E 8.9 (3.8-20.8)
Lakes District Hospital and Health Centre
S,C,N 4.8 (1.3-17.6)E 0.0 3.2 (0.6-18.1)E 7.9 (2.7-23.1)E
Langley Memorial Hospital M,R,Y 15.3 (12.6-18.5) 13.7 (11.3-16.6) 16.5 (13.9-19.7) 11.6 (9.4-14.2) Lillooet Hospital and
Health Centre S,C,N 12.7 (3.5-46.0)E 0.0 0.0 0.0
Lions Gate Hospital L,R,Y 9.2 (7.4-11.4) 6.8 (5.3-8.7) 3.5 (2.5-4.9) 6.1 (4.7-7.9) Mackenzie and District
Hospital S,C,N 0.0 0.0 0.0 0.0
Matsqui Sumas Abbotsford
S,C,N 2.2 (0.6-7.8)E 2.3 (0.6-8.5)E 6.4 (2.9-13.9) 4.5 (1.7-11.5)E
McBride and District Hospital
S,C,N 0.0 0.0 0.0 0.0
Mills Memorial Hospital S,R,N 0.6 (0.1-3.6)E 1.3 (0.4-4.7)E 4.4 (2.1-9.0) 4.8 (2.4-9.5) Mission Memorial
Hospital S,C,N 2.3 (0.6-8.5)E 6.2 (3.0-12.8) 15.8 (10.1-24.7) 7.1 (3.9-13.2)
Mount Saint Joseph Hospital
M,C,Y 15.3 (11.9-19.8) 19.3 (15.3-24.3) 12.6 (9.5-16.7) 9.4 (6.8-13.1)
Nanaimo Regional General Hospital
L,R,N 7.3 (5.7-9.2) 9.6 (7.8-11.8) 6.4 (4.9-8.2) 5.3 (4.1-7.0)
Nicola Valley Health Centre
S,C,N 3.3 (0.6-18.6)E 0.0 12.1 (4.7-31.0)E 3.0 (0.5-16.9)E
Northern Haida Gwaii Hospitaliv
S,C,N 0.0 0.0 11.9 (2.1-66.9)E 0.0
Peace Arch Hospital M,R,N 9.0 (7.0-11.6) 6.8 (5.2-9.0) 9.5 (7.5-11.9) 5.4 (3.9-7.3) Penticton Regional
Hospital M,R,N 4.1 (2.6-6.4) 5.6 (3.8-8.1) 4.3 (2.8-6.6) 5.0 (3.4-7.5)
Port Hardy Hospital S,C,N 0.0 0.0 6.5 (1.8-23.5)E 6.3 (1.7-23.1)E Port McNeill and District
Hospital S,C,N 0.0 3.9 (0.7-22.1)E 0.0 5.2 (0.9-29.6)E
Powell River General Hospital
S,C,N 0.0 1.0 (0.2-5.7)E 2.0 (0.6-7.3)E 1.8 (0.5-6.5)E
Prince Rupert Regional Hospital
S,R,N 1.2 (0.2-6.6)E 2.3 (0.6-8.4)E 1.1 (0.2-6.2)E 1.0 (0.2-5.5)E
Princeton General Hospital
S,C,N 0.0 11.8 (3.2-42.9)E 6.4 (1.1-36.4)E 11.5 (3.2-42.0)E
Queen Charlotte Islands General Hospital
S,C,N 0.0 0.0 0.0 0.0
Queen Victoria Hospital and Health Centre
S,C,N 10.0 (3.4-29.4)E 3.0 (0.5-16.9)E 0.0 0.0
Queens Park Hospital M,C,N 14.1 (9.8-20.4) 9.9 (6.7-14.6) 9.4 (6.7-13.1) 4.9 (3.0-7.8)
CDI surveillance report 2012/2013
Provincial Infection Control Network of British Columbia (PICNet) 15
Acute care facility Facility typei 2009/2010 2010/2011 2011/2012 2012/2013
Richmond Hospital M,R,Y 6.5 (4.8-8.9) 7.5 (5.6-9.9) 6.8 (5.1-9.1) 7.8 (6.0-10.2)
Ridge Meadows Hospital M,R,N 3.3 (2.1-5.3) 3.4 (2.2-5.3) 8.4 (6.4-11.0) 4.2 (2.9-6.1)
Royal Columbian Hospital L,T,Y 7.9 (6.6-9.5) 12.6 (11.0-14.5) 12.9 (11.3-14.8) 9.7 (8.3-11.3)
Royal Inland Hospital M,T,N 2.5 (1.6-3.9) 2.3 (1.5-3.6) 4.3 (3.1-6.0) 5.5 (4.1-7.3)
Royal Jubilee Hospital L,T,Y 7.9 (6.5-9.7) 4.3 (3.3-5.7) 4.5 (3.5-5.9) 3.7 (2.8-4.9)
RW Large Hospital S,C,N 0.0 0.0 0.0 0.0
Saanich Peninsula Hospital M,C,N 11.2 (7.4-17.0) 1.3 (0.5-3.9)E 2.6 (1.2-5.7) 2.3 (1.0-5.5) Shuswap Lake General
Hospital S,C,N 4.0 (1.8-8.7) 6.3 (3.4-11.5) 5.6 (2.9-10.6) 3.8 (1.7-8.2)
South Okanagan General Hospital
S,C,N 5.3 (1.8-15.5)E 6.1 (2.4-15.8)E 0.0 3.3 (0.9-11.9)E
Squamish General Hospital
S,C,N 4.4 (1.2-16.0)E 0.0 7.5 (2.9-19.2)E 1.9 (0.3-10.7)E
St. John Hospital S,C,N 0.0 5.0 (1.7-14.6)E 0.0 4.3 (1.4-12.5)E St. Joseph's General
Hospital M,R,N 5.3 (3.2-8.7) 2.6 (1.3-5.0) 4.0 (2.3-6.8) 4.1 (2.4-6.9)
St. Mary's Hospital S,C,N 3.4 (1.5-8.0) 5.4 (2.7-10.6) 4.9 (2.4-10.1) 5.1 (2.5-10.5)
St. Paul's Hospital L,T,Y 9.9 (8.4-11.6) 10.2 (8.7-11.9) 10.1 (8.6-11.9) 9.1 (7.6-10.7)
Stuart Lake Hospital S,C,N 0.0 0.0 0.0 0.0
Surrey Memorial Hospital L,T,Y 14.1 (12.5-16.0) 13.1 (11.6-14.8) 14.4 (12.9-16.1) 8.2 (7.0-9.5)
Tofino General Hospital S,C,N 0.0 0.0 0.0 0.0
UBC Hospital S,R,Y 0.9 (0.2-5.2)E 2.9 (1.0-8.4)E 0.0 0.0 University Hospital of
Northern BC M,T,Y 3.5 (2.4-5.2) 4.8 (3.4-6.7) 4.3 (3.1-6.0) 3.5 (2.4-5.1)
Vancouver General Hospital
L,T,Y 12.1 (10.7-13.6) 11.4 (10.1-12.9) 12.0 (10.7-13.5) 9.8 (8.7-11.1)
Vernon Jubilee Hospital M,R,N 15.5 (12.4-19.4) 6.6 (4.7-9.2) 3.3 (2.1-5.3) 5.4 (3.7-7.7)
Victoria General Hospital L,T,Y 3.0 (2.2-4.2) 2.9 (2.1-4.1) 2.1 (1.4-3.1) 1.8 (1.1-2.7) West Coast General
Hospital M,C,N 3.2 (1.5-7.0) 4.7 (2.5-9.0) 1.6 (0.5-4.7)E 1.9 (0.8-5.0)E
Wrinch Memorial Hospital S,R,N 0.0 3.9 (0.7-21.9)E 3.0 (0.5-17.2)E 6.1 (1.7-22.1)E Notes:
i. Letter in the hospital type represents: S: hospital with 1-50 beds, M: hospital with 21-250 beds, L: hospital with >250 beds, C: Community hospital, R: Regional hospital, T: Tertiary/Referral hospital, N: Non-teaching hospital, Y: Teaching hospital.
ii. The rate for FY 2010/2011 includes Q1 and Q2 data only, and the rate for FY 2011/2012 includes Q3 and Q4 data only. The data were not available from Q3 of FY 2010/2011 to Q2 for FY 2011/2012 due to information system upgrades in progress.
iii. The rate for FY 2011/2012 includes Q3 and Q4 data only. The data were not available for Q1 and Q2 of FY 2011/2012 due to information system upgrades in progress.
iv. Formerly known as Masset Hospital. E. Indicates an estimated rate that the difference between the upper limit and lower limit of 95% CI was greater than
twice the rate, thus the rate may not be reliable.
CDI surveillance report 2012/2013
Provincial Infection Control Network of British Columbia (PICNet) 16
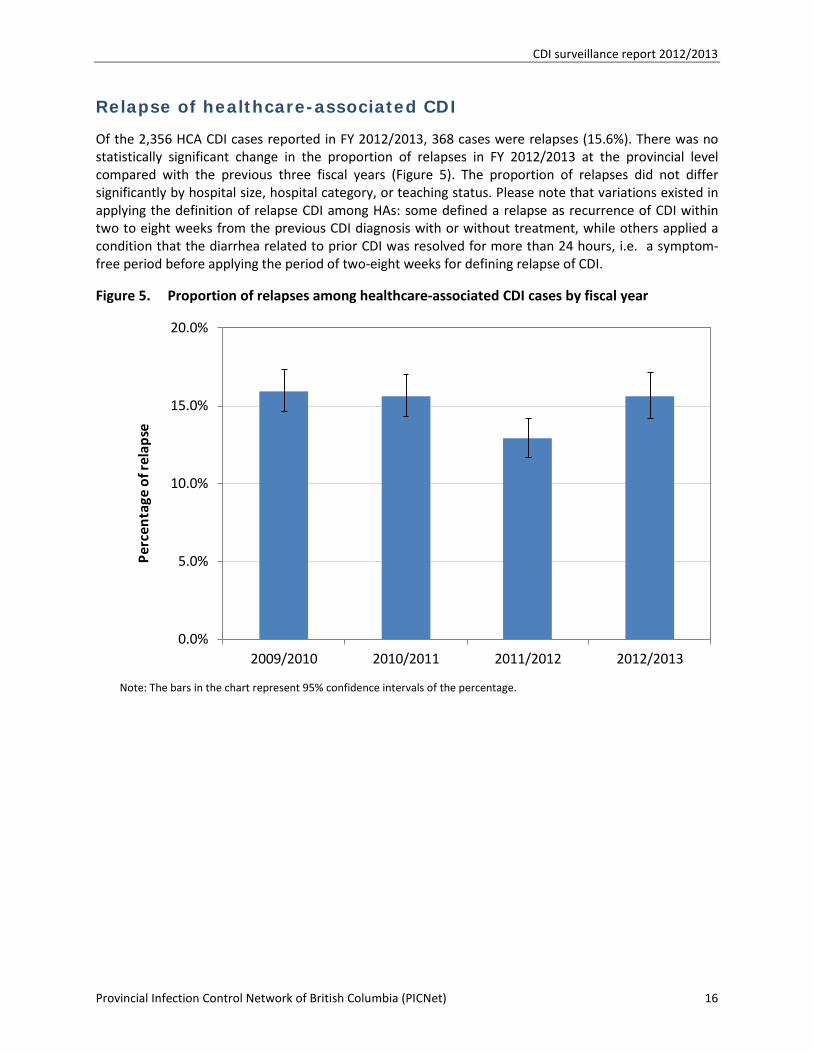
Relapse of healthcare-associated CDI
Of the 2,356 HCA CDI cases reported in FY 2012/2013, 368 cases were relapses (15.6%). There was no statistically significant change in the proportion of relapses in FY 2012/2013 at the provincial level compared with the previous three fiscal years (Figure 5). The proportion of relapses did not differ significantly by hospital size, hospital category, or teaching status. Please note that variations existed in applying the definition of relapse CDI among HAs: some defined a relapse as recurrence of CDI within two to eight weeks from the previous CDI diagnosis with or without treatment, while others applied a condition that the diarrhea related to prior CDI was resolved for more than 24 hours, i.e. a symptom-free period before applying the period of two-eight weeks for defining relapse of CDI.
Figure 5. Proportion of relapses among healthcare-associated CDI cases by fiscal year
Note: The bars in the chart represent 95% confidence intervals of the percentage.
0.0%
5.0%
10.0%
15.0%
20.0%
2009/2010 2010/2011 2011/2012 2012/2013
Perc
enta
ge o
f rel
apse
CDI surveillance report 2012/2013
Provincial Infection Control Network of British Columbia (PICNet) 17
Complications within 30 days of diagnosis
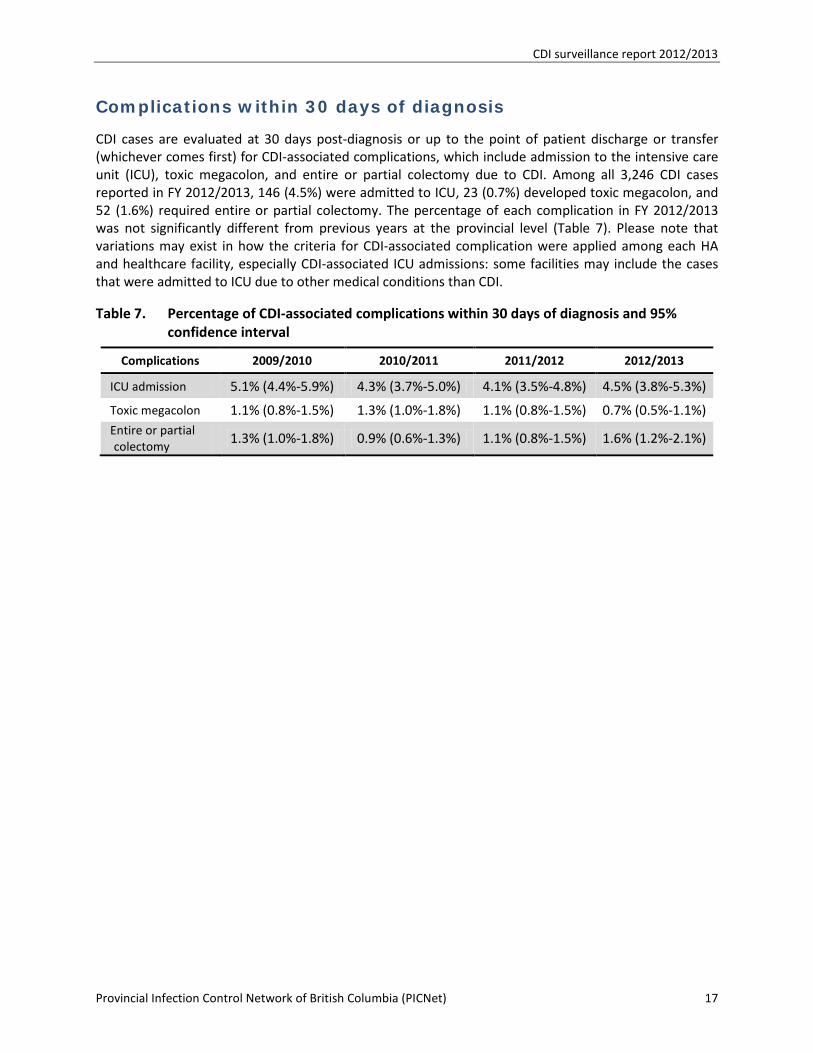
CDI cases are evaluated at 30 days post-diagnosis or up to the point of patient discharge or transfer (whichever comes first) for CDI-associated complications, which include admission to the intensive care unit (ICU), toxic megacolon, and entire or partial colectomy due to CDI. Among all 3,246 CDI cases reported in FY 2012/2013, 146 (4.5%) were admitted to ICU, 23 (0.7%) developed toxic megacolon, and 52 (1.6%) required entire or partial colectomy. The percentage of each complication in FY 2012/2013 was not significantly different from previous years at the provincial level (Table 7). Please note that variations may exist in how the criteria for CDI-associated complication were applied among each HA and healthcare facility, especially CDI-associated ICU admissions: some facilities may include the cases that were admitted to ICU due to other medical conditions than CDI.
Table 7. Percentage of CDI-associated complications within 30 days of diagnosis and 95% confidence interval
Complications 2009/2010 2010/2011 2011/2012 2012/2013
ICU admission 5.1% (4.4%-5.9%) 4.3% (3.7%-5.0%) 4.1% (3.5%-4.8%) 4.5% (3.8%-5.3%)
Toxic megacolon 1.1% (0.8%-1.5%) 1.3% (1.0%-1.8%) 1.1% (0.8%-1.5%) 0.7% (0.5%-1.1%) Entire or partial colectomy
1.3% (1.0%-1.8%) 0.9% (0.6%-1.3%) 1.1% (0.8%-1.5%) 1.6% (1.2%-2.1%)
CDI surveillance report 2012/2013
Provincial Infection Control Network of British Columbia (PICNet) 18
Discussion Since C. difficile has been recognized as the leading cause of healthcare-associated diarrhea, as well as being responsible for outbreaks in hospitals all over the world3 (including recent outbreaks in BC hospitals), the increasing awareness of CDI has extended beyond healthcare workers to include mainstream media and the public. In response, HAs in BC have enhanced their CDI diagnosis, treatment, and prevention protocols to reduce the spread of infection. These enhancements include introducing polymerase chain reaction (PCR) testing, which is more sensitive and timely in detecting toxic C. difficile; more judicious use of antibiotics; stringent environmental cleaning/disinfection; enhanced terminal cleaning; and the promotion of hand hygiene, etc. In addition, a CDI toolkit and clinical management algorithm was developed by the CDI working groups of BC4. Some hospitals have also developed antimicrobial stewardship initiatives. The provincial hand cleaning compliance among healthcare workers increased significantly in FY 2012/20135. These combined strategies may be contributing to the significant decrease in the provincial rate of CDI associated with the reporting facility in FY 2012/2013.
The provincial CDI surveillance protocol, as well as surveillance practices within each HA, are reviewed annually. Slight modifications in case definition and classification have been made over time (see data limitations in the “About CDI surveillance program”) to ensure consistency with international and national standards, and to reflect scientific advances in CDI epidemiology. There was some variation in how strictly the case definitions were applied among the HAs. From the beginning of 2012, some HAs began to impose rigorous application of the frequency of documented episodes of diarrhea in defining CDI cases. This may potentially reduce the identification of CDI cases.
When PCR testing was introduced by the HAs in 2011 and 2012 (except hospitals in VCH, which had implemented PCR testing in 2008; see “Data Limitations” in the “About CDI surveillance program”), an increase in the CDI cases was expected due to its higher sensitivity than conventional testing methods. However, no significant increase was observed in the past two years among those HAs after the implementation of PCR testing.
C. difficile has overtaken Methicillin-resistant Staphylococcus aureus (MRSA) as the most common pathogen in HAI in BC healthcare facilities. While a significant decrease in the provincial rate of CDI associated with the reporting facility was observed in FY 2012/2013, it is of increasing concern that the number of CDI cases defined as community-associated (CA) has increased in BC acute care facilities over the past four years. Modification in the “look-back” period for patient’s healthcare encounter history may have contributed to some of the increase in CA CDI from FY 2010/2011, but the increase continued afterwards. Research has shown that CDI has been increasingly reported among young, healthy individuals residing in the community6. A recent study suggested that CA CDI represents one-third of all CDI cases7. Another study report that 36% of cases of CA CDI did not receive antibiotics, 18% had no outpatient health care exposure, and 41% had low-level outpatient healthcare exposure8. However, the source of the C. difficile organisms responsible for cases of CDI in the community is not well understood1, suggesting that additional investigation is needed to increase understanding of C. difficile in the community, and to develop prevention strategies.
The rates of CDI in this report were not risk adjusted. Laboratory testing methodology and at-risk population also varied by HA. Comparisons between HAs and between healthcare facilities should therefore not be made. This report is also subject to the data limitations described below in the “About CDI surveillance program” section. Due to the unique circumstances and challenges faced, each HA is in the best position to respond to the incidence of CDI in its region and in its affiliated healthcare facilities.
CDI surveillance report 2012/2013
Provincial Infection Control Network of British Columbia (PICNet) 19
Acknowledgements
PICNet wishes to thank the participants in each HA and their affiliated healthcare facilities for their ongoing support and participation in the provincial HAI surveillance program.
PICNet recognizes important contributions from the members of PICNet’s Surveillance Steering Committee on development of the provincial CDI surveillance program and associated reports, especially Dr. Guanghong Han, PICNet’s epidemiologist, for compiling this report.
CDI surveillance report 2012/2013
Provincial Infection Control Network of British Columbia (PICNet) 20
About the CDI surveillance program
Purpose of CDI surveillance
The provincial Clostridium difficile infection (CDI) surveillance program is a collaboration between PICNet and all the health authorities (HAs) in BC, and involves the voluntary participation of all 80 acute care facilities across the province. The main purpose of this CDI surveillance program is to collect data on CDI incidence for monitoring the rates and trends of healthcare-associated CDI in BC acute care facilities, and providing the baseline information for CDI intervention programs in BC.
Population under surveillance
The population under CDI surveillance includes inpatients admitted to BC acute care facilities for acute care. This includes patients admitted to the emergency department awaiting placement (e.g. patients admitted to a service who are waiting for a bed), patients in alternative level of care beds, and patients in labour and delivery beds.
Outpatient visits to acute care facilities, patients in extended care and psychiatric beds housed in the acute care facilities, and short-term emergency room admissions are excluded. Patients under one year of age are also excluded from this surveillance.
Data collection and reporting
The definitions of CDI cases and core data elements for provincial surveillance were developed by PICNet’s Surveillance Steering Committee (SSC) based on the surveillance protocol for CDI within healthcare institutes developed by the Canadian Nosocomial Infection Surveillance program (CNISP). The protocol is reviewed annually. Each HA incorporated the core data elements into their CDI surveillance form and database to standardize data collection. Data on individual cases of CDI are collected daily by infection control practitioners (ICP) and managed at the HA level. After the end of each fiscal quarter, HAs aggregate their CDI cases by facility and CDI classification, and submit the data to PICNet, along with facility-specific denominators. PICNet then consolidates the aggregated data for provincial analysis and reporting. At the end of each fiscal year (FY), the HAs provide updates on their quarterly data submission. The data is analyzed quarterly and annually for public reporting. Data updated after the data submission due dates may not be reflected in each quarterly report, but will be presented in the next report.
Data limitations
Although the standard surveillance protocol was developed by the SSC, variations exist in the methodologies of CDI identification and inclusion criteria for case definition and classification among the acute care facilities and HAs.
Laboratory detection of C. difficile: Various laboratory testing methods have been used by BC laboratories to confirm CDI diagnosis, including enzyme immunoassay (EIA), cell culture cytotoxicity, toxigenic culture, and polymerase chain reaction (PCR). The sensitivity and specificity of these methods varies greatly, from <50% to >99%9. In particular, the recently developed PCR testing, which has sensitivity as much as twice the toxin EIA for detection of C. difficile, was introduced into BC laboratories by the HAs to enhance CDI diagnosis. The start date of implementing PCR testing or
CDI surveillance report 2012/2013
Provincial Infection Control Network of British Columbia (PICNet) 21
including PCR testing as part of a two-step testing algorithm varied by HA and facility: VCHA implemented PCR testing on June 27, 2008; PHC on August 2, 2010; FHA on October 26, 2011 in four facilities and on March 19, 2012 for the remaining facilities; and PHSA in November 2011. IHA introduced PCR testing to one facility in September 2009 and the two-step algorithm to the remaining facilities next year. VIHA introduced the two-step algorithm on April 1, 2011. NHA started two-step algorithm in October 5, 2012. Shifting to PCR testing or including PCR as part of a two-step algorithm testing from conventional toxin EIA may result in more specimens being identified positive with C. difficile by the laboratory, and thus more CDI cases diagnosed.
Case definition and classification: Review of medical charts is required to confirm CDI cases and apply classification, which is based on the symptom onset of CDI and patient’s healthcare encounter history. The quality of the medical chart documentation varies by facility and by healthcare provider, and the ability to determine healthcare encounter history depends on the availability and accessibility of the patient information system used in each hospital or HA, which will affect classification of the case as either healthcare-associated or community-associated.
The “look-back” period for healthcare encounter history was eight weeks in FY 2009/2010 with all HAs with the exception of PHC, which used a four-week period. From FY 2010/2011, the look-back period was modified to four weeks, in alignment with the changes made by the Canadian Nosocomial Infection Surveillance Program (CNISP), for all HAs except IHA, which continues to use an eight-week period. FHA applied the four-week look-back period retrospectively to their cases in FY 2009/2010. The change in the “look-back” period from eight weeks to four weeks may result in a decrease in the number of cases classified as HCA and an increase in CA. An evaluation in one HA found that change may affect about 2% of cases in their classification.
There are variations among HAs in how strictly CDI case definitions are applied, especially the frequency of episodes of diarrhea, which was defined as three or more loose stools within a 24-hour period. It was assumed that any stool sent to the laboratory for C. difficile testing was from a patient that has had at least three episodes of loose stools in a 24-hour period. From 2012, FHA and PHSA began to apply the frequency of documented diarrheal episodes stringently with chart review in defining their cases. In addition, IHA and FHA require resolution of diarrhea from previous CDI episode for more than 24 hours before applying the period of two to eight weeks for defining a relapse of CDI.
Variation also exists in CDI case classification. IHA put all CDI cases (both new cases and relapses) that were not associated with the reporting facility under the category “Community-associated” before 2010/11. From 2011/2012, IHA began to assign the cases of healthcare-associated CDI that were associated with another acute care facility within IHA to the appropriate facility, the cases that were associated with the facilities out of IHA as “healthcare-associated with another facility”, and the remaining cases as “Community-associated”. FHA includes CDI cases identified among mental health inpatients occupying acute care beds, while the other HAs exclude these. PHC defines another facility as a facility that is within PHC, and classifies the cases of CDI that were not associated with PHC facilities as “Not-PHC-associated”; the latter were merged into the “Unknown” category in this report. PHSA classifies all CDI cases other than those associated with the reporting facility as “Community-associated” or “Unknown”, including the cases which may be associated with another healthcare facility. In addition, the community-associated (termed as not-healthcare-associated in FY 2010/2011) CDI cases are no longer further classified into new cases or relapses since FY 2011/2012.
CDI surveillance report 2012/2013
Provincial Infection Control Network of British Columbia (PICNet) 22
Denominator data: Acute care inpatient days are used as the denominator to calculate the CDI rates at the provincial, HA, and healthcare facility level. These data are collected by each HA from their information systems. There was some variation in what was included in the inpatient days due to the inability of some HAs to separate the patients under surveillance from other patients in their denominator dataset. In addition, FHA and VCHA (except PHC) include patients less than one year of age in their inpatient days, and FHA also includes psychiatric inpatient days in their denominator.
Variations may also exist in the clinical practice and healthcare services provided by each healthcare facility, as well as population served, which may affect the incidence of CDI in the facility.
CDI surveillance report 2012/2013
Provincial Infection Control Network of British Columbia (PICNet) 23
Glossary
Acute care facility
Acute care facilities are care facilities in which patients are treated for brief but severe episodes of illness, for the sequelae of an accident or other trauma, or during recovery from surgery. In this report, acute care facility refers to acute care hospitals in BC.
Clostridium difficile Infection (CDI)
CDI, under PICNet CDI surveillance, is defined as:
• Acute onset of diarrhea (e.g. three or more loose stools within a 24-hour period) without another etiology (loose stool is defined as that which takes the shape of the container that holds it).
AND one or more of the following:
• Laboratory confirmation (positive toxin, or culture with evidence of toxin production, or detection of toxin genes)
OR • Diagnosis of typical pseudo-membranes on sigmoidoscopy or colonoscopy or
histological/pathological diagnosis of CDI
OR
• Diagnosis of toxic megacolon.
Community-associated (CA) CDI
A CDI case (as defined above) with symptom onset in the community or three calendar days or less after admission to a healthcare facility, provided that symptom onset was more than four weeks after the last discharge from a healthcare facility.
Complications
Complications under PICNet’s CDI surveillance include ICU admission, toxic megacolon, and total or partial colectomy due to CDI. Other complications associated with CDI are excluded from the surveillance. Relapses are included in the CDI surveillance, but are reported separately.
Confidence Interval (CI)
A confidence interval gives an estimated range of values which is likely to include an unknown population parameter to indicate the reliability of an estimate. The 95% CI of the rate and proportion in this report are calculated using Wilson score intervals10.
Fiscal and Calendar Quarter
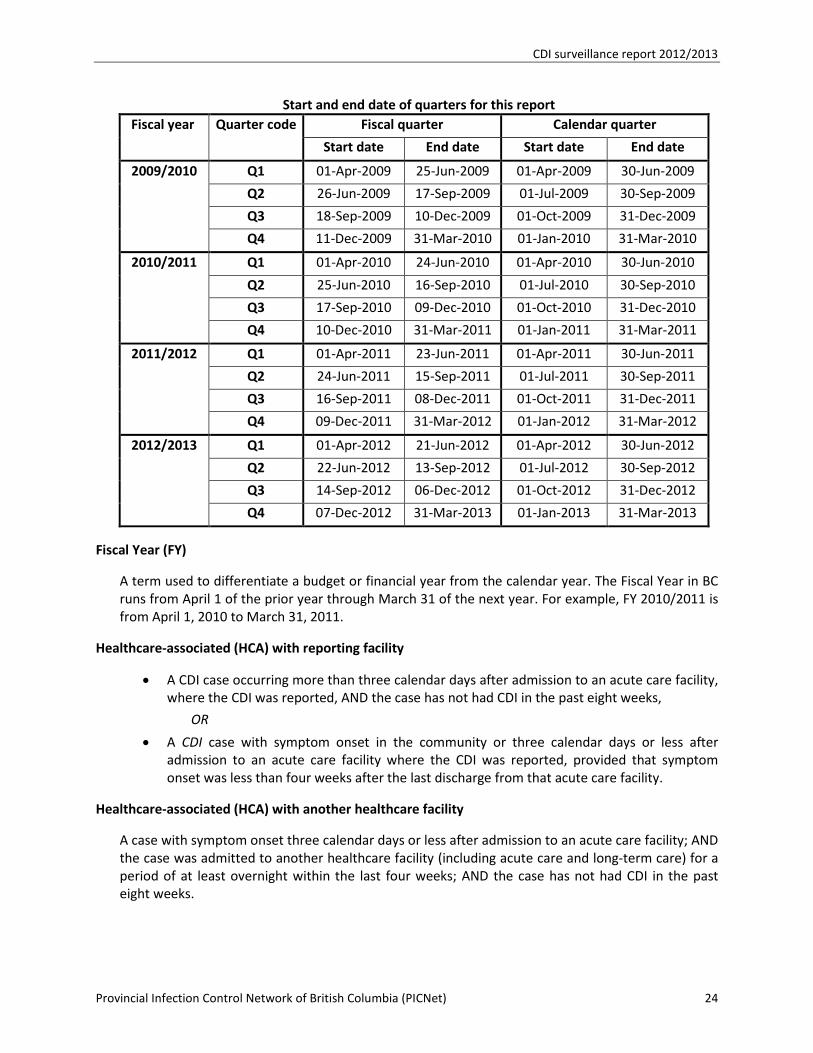
Fiscal quarter (FQ) is a specified period within a budget or financial year. There are four FQs in a fiscal year. Start and end dates of each FQ vary from year to year. Calendar Quarter is a period of three consecutive months starting on the first day of January, April, July or October. Below is the start and end date of each quarter for the fiscal year from 2009/2010 to 2011/2012:
CDI surveillance report 2012/2013
Provincial Infection Control Network of British Columbia (PICNet) 24
Start and end date of quarters for this report Fiscal year Quarter code Fiscal quarter Calendar quarter
Start date End date Start date End date
2009/2010 Q1 01-Apr-2009 25-Jun-2009 01-Apr-2009 30-Jun-2009
Q2 26-Jun-2009 17-Sep-2009 01-Jul-2009 30-Sep-2009
Q3 18-Sep-2009 10-Dec-2009 01-Oct-2009 31-Dec-2009
Q4 11-Dec-2009 31-Mar-2010 01-Jan-2010 31-Mar-2010
2010/2011 Q1 01-Apr-2010 24-Jun-2010 01-Apr-2010 30-Jun-2010
Q2 25-Jun-2010 16-Sep-2010 01-Jul-2010 30-Sep-2010
Q3 17-Sep-2010 09-Dec-2010 01-Oct-2010 31-Dec-2010
Q4 10-Dec-2010 31-Mar-2011 01-Jan-2011 31-Mar-2011
2011/2012 Q1 01-Apr-2011 23-Jun-2011 01-Apr-2011 30-Jun-2011
Q2 24-Jun-2011 15-Sep-2011 01-Jul-2011 30-Sep-2011
Q3 16-Sep-2011 08-Dec-2011 01-Oct-2011 31-Dec-2011
Q4 09-Dec-2011 31-Mar-2012 01-Jan-2012 31-Mar-2012
2012/2013 Q1 01-Apr-2012 21-Jun-2012 01-Apr-2012 30-Jun-2012
Q2 22-Jun-2012 13-Sep-2012 01-Jul-2012 30-Sep-2012
Q3 14-Sep-2012 06-Dec-2012 01-Oct-2012 31-Dec-2012
Q4 07-Dec-2012 31-Mar-2013 01-Jan-2013 31-Mar-2013
Fiscal Year (FY)
A term used to differentiate a budget or financial year from the calendar year. The Fiscal Year in BC runs from April 1 of the prior year through March 31 of the next year. For example, FY 2010/2011 is from April 1, 2010 to March 31, 2011.
Healthcare-associated (HCA) with reporting facility
• A CDI case occurring more than three calendar days after admission to an acute care facility, where the CDI was reported, AND the case has not had CDI in the past eight weeks,
OR
• A CDI case with symptom onset in the community or three calendar days or less after admission to an acute care facility where the CDI was reported, provided that symptom onset was less than four weeks after the last discharge from that acute care facility.
Healthcare-associated (HCA) with another healthcare facility
A case with symptom onset three calendar days or less after admission to an acute care facility; AND the case was admitted to another healthcare facility (including acute care and long-term care) for a period of at least overnight within the last four weeks; AND the case has not had CDI in the past eight weeks.
CDI surveillance report 2012/2013
Provincial Infection Control Network of British Columbia (PICNet) 25
Health authority (HA)
A health authority manages and delivers healthcare services. There are five regional Health Authorities in BC which govern, plan, and coordinate services regionally within sixteen health service delivery areas, and the Provincial Health Services Authority, which coordinates and/or provides provincial programs and specialized services.
The six HAs in BC are:
• Interior Health Authority (IHA)
• Fraser Health Authority (FHA)
• Northern Health Authority (NHA)
• Vancouver Coastal Health Authority (VCHA) [includes Providence Health Care (PHC)]
• Vancouver Island Health Authority (VIHA)
• Provincial Health Services Authority (PHSA)
Hospital category
The hospital category in this report is based on the healthcare services that the hospital provides and the population to be served, including:
• Tertiary/referral hospital refers to a major hospital that provides a wide range of acute in-patient and out-patient specialist services together with the necessary support systems for the patients across the health authority, and in some cases, across the province. Patients will often be referred from smaller hospitals for major operations, consultations with specialist and sub-specialists and when sophisticated intensive care facilities are required.
• Regional hospitals typically provide health care services to the patients in its region, with large numbers of beds for intensive care and long-term care, providing specialist and sub-specialist services, such as surgery, plastic surgery, childbirth, bioassay laboratories, and so forth.
• Community hospitals offer an appropriate range of integrated health and social care designed to meet the needs of the local people. Medical care is predominantly provided by general practitioners working with consultant medical colleagues.
Inpatient day
An accounting unit used by healthcare facilities and healthcare planners. Each day represents a unit of time during which the services of the institution or facility are used by a patient; thus 50 patients in a hospital for 1 day would represent 50 inpatient days. The report uses the inpatient days as denominator to calculate the rate of CDI.
New cases of CDI
• A CDI case without previous history of CDI
OR
• A CDI case that has not had an episode of CDI in the previous eight weeks
CDI surveillance report 2012/2013
Provincial Infection Control Network of British Columbia (PICNet) 26
Nosocomial infection
Infection associated with admission to the reporting healthcare facility.
Polymerase chain reaction (PCR)
A laboratory testing method used to detect C. difficile toxin genes from the samples.
Rate per 10,000 inpatient days
Rate per 10,000 inpatient days = Number of CDI cases in a defined period x 10,000 Total inpatient days during the same period
A defined period can be a quarter or several quarters, or a year (annual rate).
Relapse of CDI
A CDI case with recurrence of diarrhea within two to eight weeks of a previous CDI episode (as determined by the date of a previous lab test, chart note or diagnosis by endoscopy or pathological specimen) provided that CDI symptoms from the earlier episode resolved with or without treatment. A relapse is to be attributed to the association of the original infection (i.e., healthcare-associated or community-associated).
Note: a case with recurrence of diarrhea less than two weeks from the previous episode is considered to be a continuation of the previous episode, and not a relapse.
Statistical significance
In statistics, a result is called statistically significant if it is unlikely to have occurred by chance. In this report, the difference between the rates or percentages is considered as statistically significant if the 95% confidence intervals (CI) of the two rates or percentages do not overlap (i.e., the lower limit of 95% CI of one rate or percentage is greater than the upper limit of 95% CI of the other one).
Teaching hospital
A teaching hospital combines assistance to patients with the training/education of medical students, nursing students, and other healthcare professionals, and is often linked to a medical school, nursing school or university. A teaching hospital can be a community hospital, or regional hospital, or tertiary/referral hospital.
Trend test
A trend test is an aspect of statistical analysis that tries to determine whether there is a statistically significant trend upwards or downwards over a period of time or among specific ordinal categories. This report uses Mantel-Haenszel Chi-square test for linear trend at a statistically significant level of p < 0.05 of a two-tailed test.
Unknown association
A CDI case where there is insufficient information on healthcare admission and/or discharge to classify whether it is healthcare-associated or not.
CDI surveillance report 2012/2013
Provincial Infection Control Network of British Columbia (PICNet) 27
Surveillance Steering Committee The Provincial Infection Control Network of British Columbia (PICNet) is a provincially supported professional collaborative that provides guidance and advice on healthcare-associated infection prevention and control in British Columbia. Under the aegis and accountability framework of the Provincial Health Services Authority, PICNet connects health care professionals from across the province to develop and create guidelines and tools, with a focus on surveillance, education, and evidence-based practice.
PICNet’s Surveillance Steering Committee provides guidance to PICNet’s surveillance programs and assists the PICNet Management Office in implementation within the participating Health Authorities.
• Jun Chen Collet, Provincial Health Services Authority
• Tara Donovan, Fraser Health Authority
• Leslie Forrester, Vancouver Coastal Health Authority
• Bruce Gamage (Co-Chair), Provincial Infection Control Network of BC
• Dr. Guanghong Han (Co-chair), Provincial Infection Control Network of BC
• Deanna Hembroff, Northern Health Authority
• Dr. Bonnie Henry, Provincial Health Services Authority
• Dr. Linda Hoang, BC Association of Medical Microbiologists
• Anthony Leamon, Vancouver Island Health Authority
• Dr. Julie Mori, Interior Health Authority
• Dr. Elisa Lloyd-Smith, Providence Health Care
CDI surveillance report 2012/2013
Provincial Infection Control Network of British Columbia (PICNet) 28
References 1. Butler M, Bliss D, Drekonja D, Filice G, Rector T, MacDonald R, Wilt T. Effectiveness of Early
Diagnosis, Prevention, and Treatment of Clostridium difficile Infection. Comparative Effectiveness Review No. 31 (Prepared by the Minnesota Evidence-based Practice Center under Contract No. 290-02-0009.) AHRQ Publication No. 11(12)-EHC051-EF. Rockville, MD. Agency for Healthcare Research and Quality. December 2011. www.effectivehealthcare.ahrq.gov/reports/final.cfm.
2. Bouza E. Consequences of Clostridium difficile infection: understanding the healthcare burden. Clin Microbiol Infect 2012 Dec;18 Suppl 6:5-12. doi: 10.1111/1469-0691.12064. Accessed on July 30, 2013
3. Lessa FC, Gould CV, and McDonald LC. Current Status of Clostridium difficile Infection Epidemiology. Clinical Infectious Diseases 2012;55(S2):S65–70
4. British Columbia Clostridium difficile Infection (CDI) Toolkit and Clinical Management Algorithm. http://www.picnet.ca. Accessed on May 22, 2013
5. Provincial Infection Control Network of British Columbia (PICNet). Hand Cleaning Compliance in BC Acute Care Facilities: Fiscal year 2012/2013. http://www.picnet.ca. Accessed on July 23, 2013
6. Kuntz JL, Chrischilles EA, Pendergast JF, Herwaldt LA, Polgreen PM. Incidence of and risk factors for community-associated Clostridium difficile infection: a nested case-control study. BMC Infect Dis. 2011;11:194. http://www.ncbi.nlm.nih.gov/pmc/articles/PMC3154181/. Accessed on April 27, 2013.
7. Lessa FC. Community-associated Clostridium difficile infection: How real is it?. Anaerobe 2013; http://dx.doi.org/10.1016/j.anaerobe.2013.01.006. Accessed on July 26, 2013
8. Chitnis AS, Holzbauer SM, Belflower RM, Winston LG, Bamberg WD, Lyons C, et al. Epidemiology of Community-Associated Clostridium difficile Infection, 2009 Through 2011. JAMA Intern Med. doi:10.1001/jamainternmed.2013.7056. Accessed on July 17, 2013
9. Burnham CD and Carroll KC. Diagnosis of Clostridium difficile infection: an ongoing conundrum for clinicians and for clinical Laboratories. Clin Microbio Rev 2013; 26:604–630
10. Agresti A and Coull BA. Approximate is better than “exact” for interval estimation of binomial proportions. Am Stat 1998;52:119-126