Embed Size (px)
Citation preview

Modern Merchant Banking
Close Brothers Group plcAnnual Report 2017
Close B
rothers Group p
lc Annual R
eport 2017

Championing the innovators, risk-takers, the doers and makers of things.This is Modern Merchant Banking.
Close Brothers is a leading UK merchant banking group providing lending, deposit taking, wealth management services and securities trading.
Our clients play an important role in driving growth in the British economy. Our role is to help them as they grow – providing financial support and advice to small businesses and individuals across the UK.
The photography within this Annual Report was photographed on location at our clients’ businesses. We would like to thank them for their generous support and cooperation.
Photographed on location at Castle Air Ltd.

Timeless values and a
Modern attitude
Throughout our history, we have focused on delivering the highest levels of service and integrity.
Our commitment to our business model has allowed us to navigate the financial crises of recent years. When others have been over-adventurous we have stood firm with a more prudent approach – putting emphasis on preserving our clients’ capital, while prioritising relationships and consistency of lending throughout the economic cycle.
We continue to invest our time, energy and money in looking towards the future – ensuring our people, products and systems evolve with the market, to exceed our clients’ expectations and diversify our offerings, today and for years to come.

Close Brothers Group plc Annual Report 2017
Strategic Report
4 Our Businesses6 Chairman’s Statement8 Chief Executive’s Statement
10 Business Model14 Strategy and Key Performance
Indicators16 Principal Risks and Uncertainties20 Financial Overview26 Banking32 Securities34 Asset Management36 Sustainability Report
Governance
46 Board of Directors48 Executive Committee50 Directors’ Report54 Corporate Governance
Report62 Risk Committee Report64 Audit Committee
Report67 Nomination and
Governance Committee Report
69 Directors’ Remuneration Report
Financial Statements
98 Independent Auditor’s Report to the Members of Close Brothers Group plc
102 Consolidated Income Statement103 Consolidated Statement of
Comprehensive Income104 Consolidated Balance Sheet105 Consolidated Statement of Changes in Equity106 Consolidated Cash Flow Statement107 Company Balance Sheet108 Company Statement of Changes in Equity109 The Notes150 Glossary152 Investor Relations/Cautionary Statement

Close Brothers Group plc Annual Report 2017
2017
2016
2015
2014
2013
£264.8m
£233.6m
£224.9m
£193.7m
£167.2m
2017
2016
2015
2014
2013
131.7p
128.4p
120.5p
101.0p
83.5p
2017
2016
2015
2014
2013
18.9%
19.5%
17.9%
15.8%
17.9% 2017
2016
2015
2014
2013
57.0p
53.5p
49.0p
44.5p
60.0p
Strateg
ic Rep
ort
1
Modern Merchant Banking is about using specialist financial expertise to help commercial enterprises and private clients thrive.At Close Brothers we provide financial support and advice to small businesses and individuals throughout the UK. Our clients are the makers of things, the wealth creators, the investors and the savers. They are playing an important role driving growth in the British economy and we are supporting them as they grow.
Throughout our history, we have remained focused on upholding our traditional values of service, expertise and relationships. At the same time, we encourage innovation and support enterprise, reflecting how our clients do business.
In all market conditions we remain focused on providing straightforward products and services, maintaining a prudent approach and strong financial position, and building relationships that stand the test of time.
Financial Highlightsfor the year ended 31 July 2017
Adjusted1 operating profit
£264.8m(2016: £233.6m)
Return on opening equity3
17.9%(2016: 18.9%)
Operating profit before tax
£258.6m(2016: £228.5m)
Profit attributable to shareholders
£191.2m(2016: £186.5m)
Adjusted2 basic earnings per share
131.7p(2016: 128.4p)
Ordinary dividend per share4
60.0p(2016: 57.0p)
Basic earnings per share
128.3p(2016: 125.7p)
Front cover:Photographed on location at The Morgan Motor Company Ltd.
1 Adjusted operating profit/(loss) is stated before amortisation of intangible assets on acquisition, profit on disposal of discontinued operations and tax.
2 Stated before amortisation of intangible assets on acquisition and the tax effect of such adjustment.
3 Return on opening equity calculated as adjusted operating profit after tax and non-controlling interests on opening equity less non-controlling interests.
4 Represents the final dividend proposed for the respective years together with the interim dividend declared and paid in those years.

Across all our businesses we uphold traditional service values of honesty and integrity. We understand that business is about people, so we empower our teams to go above and beyond for their customers and to act with speed and efficiency when time is short.
Close Brothers Group plc Annual Report 20172
Photographed on location at Matsuura Machinery Ltd.

Strategic Report4 Our Businesses6 Chairman’s Statement8 Chief Executive’s Statement
10 Business Model14 Strategy and Key Performance Indicators16 Principal Risks and Uncertainties20 Financial Overview26 Banking32 Securities34 Asset Management36 Sustainability Report
Close Brothers Group plc Annual Report 2017S
trategic R
epo
rt3

Close Brothers Group plc Annual Report 20174
Our Businesses
Photographed on location at Matsuura Machinery Ltd.
Banking
Retail Finance
£78.9mAdjusted operating profit
The Retail Finance segment provides loans to predominantly retail customers, through a network of intermediaries.
The motor finance business provides point of sale finance for the acquisition of predominantly used cars, motorcycles and light commercial vehicles. It operates through a network of c.7,000 independent motor dealers and has approximately 270,000 customers in the UK and Ireland.
Loan book: £1.8 billionAverage loan size: c.£6,500
The premium finance business finances insurance payments for over two million companies and individuals, via a network of 1,700 insurance brokers, allowing their customers to spread the cost of insurance premiums over a number of instalments.
Loan book: £941 millionAverage loan size: c.£600
Commercial Finance
£72.6mAdjusted operating profit
The Commercial Finance segment lends principally to SMEs, both through its direct sales force and via brokers.
The asset finance business has 27,000 customers and provides commercial asset financing, hire-purchase and leasing solutions for a diverse range of assets and sectors, including the financing of commercial vehicles, machine tools, contractors’ plant, printing equipment, aircraft and medical equipment. Our highly specialist sales force operates through 16 offices throughout the UK and Ireland.
Loan book: £2.0 billionAverage loan size: c.£41,500
The invoice finance business provides debt factoring, invoice discounting and asset based lending to 1,700 small businesses.
Loan book: £536 millionAverage loan size: c.£360,000
Property Finance
£92.0mOperating profit
The Property Finance segment specialises in short-term residential development finance, refurbishment and bridging loans in London, the South East and selected regional locations. We lend to c.800 professional property developers with a focus on small to medium-sized residential developments.
Loan book: £1.6 billionAverage loan size: c.£1.2 million
Read more about Banking See pages 26 to 31
SpecialistBusinesses

Close Brothers Group plc Annual Report 2017S
trategic R
epo
rt5
Close Brothers is a leading UK merchant banking group providing lending, securities trading and wealth management services. We operate principally in the UK and employ over 3,000 people.
Our approach generates high levels of repeat business through our long-term relationships and customer- focused values. We typically operate in markets which are under-served by larger banks, where our expertise and superior customer service are critical.
Securities
Winterflood
£28.1mOperating profit
Our Securities division comprises Winterflood, a leading UK market-maker for retail stock brokers and institutions. Winterflood deals in c.15,000 securities in the UK and overseas, and trades with over 600 retail stockbrokers, wealth managers, platforms, institutional asset managers and other market counterparties, providing continuous liquidity through our market-leading execution services, supported by our strong proprietary technology. Our traders have extensive experience of executing orders in a range of market conditions, enabling us to trade successfully and profitably over many years.
Average bargains per day: c.65,000Total counterparties: c.600
Read more about Securities See pages 32 and 33
Asset Management
Asset Management
£17.4mAdjusted operating profit
Close Brothers Asset Management provides financial advice and investment management services to private clients in the UK. We offer financial planning advice with over 110 professional advisers across the country. We also provide a range of investment management services including full bespoke management, managed portfolios and funds.
Total client assets: £11.2 billionManaged assets: £8.9 billion
Read more about Asset Management See pages 34 and 35

Close Brothers Group plc Annual Report 20176
Chairman’s Statement
Mike Biggs, Chairman
As the new chairman of the board, I am delighted to introduce this year’s Annual Report, in what has been another successful year for Close Brothers.
Building deep
Relationships
Close Brothers takes a highly differentiated approach to banking, focused on consistent and sustainable performance through the cycle, supported by the prudent and disciplined management of both our lending and market-facing businesses. Since joining the company I have been thoroughly impressed by the commitment and expertise of our management team and employees, the quality of service they deliver to our customers, and the strength and depth of relationships with clients and intermediaries.
We have a clear strategy to protect, improve and extend this successful model, and I look forward to working with the board and management team to ensure that we continue to deliver value to our clients, employees and shareholders in years to come.
Good Performance and Dividend GrowthIn 2017 we delivered another good performance, with statutory and adjusted operating profit both up 13% year on year. All of our businesses have performed well: the Banking division achieved a 9% increase in operating profit, with continued strong returns across all three operating segments. Winterflood and Asset Management both achieved higher full-year profits, supported by favourable financial market conditions.
We are pleased to propose a final dividend of 40.0p per share. If approved at the Annual General Meeting (“AGM”), this will take the full-year dividend per share to 60.0p, an increase of 5% on last year. This is in line with our progressive dividend policy, which aims to grow the dividend year on year whilst maintaining a prudent level of dividend cover, and builds on our long track record of sustainable dividend growth.
Board Changes and SuccessionIn May, Strone Macpherson retired after 13 years as a director, of which the last nine were as chairman. The group has made considerable progress during this period, and on behalf of the board I want to thank Strone for his very significant contribution over many years.
We have also seen the successful transition of leadership within the Banking division, following the retirement of Stephen Hodges after over 30 years with Close Brothers.

Close Brothers Group plc Annual Report 2017S
trategic R
epo
rt7
Photographed on location at Castle Air Ltd.
This has demonstrated the effectiveness of our succession planning, particularly in ensuring that we maintain our deeply embedded culture and business model through any transition.
We continue to run a number of programmes to recruit and develop talent, and ensure robust succession plans are in place for the senior management team and other key roles throughout the organisation.
In the last year we have also reviewed our executive Remuneration Policy to ensure that it continues to promote adherence to our successful model over the long-term, and the proposed changes will be subject to shareholder approval at the forthcoming AGM.
Well Placed in an Evolving MarketAs a financial services institution, regulation is an ever present factor in our markets. Close Brothers has historically taken a prudent approach to managing its business and its regulatory responsibilities, which together with a deeply embedded client focus has allowed us to navigate a changing regulatory environment without significant impact on our business. Nonetheless, managing regulatory and operational change, in particular evolving capital regulations, remains an ongoing area of focus.
We also note increasing caution on the outlook for the UK economy and credit markets from regulators and other commentators. I am confident that Close Brothers’ disciplined and long established model leaves us well positioned to manage a range of different market conditions, and to make the most of any opportunities which may arise.
I look forward to being part of the group’s next stage of development, and continuing to build on our strong franchise and track record for the long-term.
Lastly, I would like to thank all our employees for their hard work and commitment. Through their expertise, dedication and relentless customer focus we continue to deliver both excellent client service and strong financial performance, and remain well positioned for the future.
Michael N. BiggsChairman
26 September 2017
60.0pDividend per share

Close Brothers Group plc Annual Report 20178
Chief Executive’s Statement
Preben Prebensen, Chief Executive
I am pleased to report another good performance for the group in the 2017 financial year, with higher profits across all three divisions.
The value of Consistency
consistently high levels of service, building deep and sustainable relationships with clients and intermediaries. This client-focused approach is supported by a prudent funding, liquidity and capital position, which ensures we can continue to support our clients and deliver returns to shareholders through all stages of the financial cycle.
Market EnvironmentDespite the ongoing uncertainty around the economic and political outlook in the UK, market conditions for our businesses have remained benign overall, with continued low impairment levels in the Banking division and supportive trading conditions for both Winterflood and Asset Management.
Competition in many of our markets remains significant, reflecting the current favourable lending environment with low impairments and low cost of funding. Accordingly, our growth rate has slowed in parts of the Banking business, notably asset and motor finance, as we continue to prioritise our prudent underwriting, strong margins and good returns.
To date, we have seen minimal impact on the group from the UK referendum vote to leave the European Union. With over 90% of our business in the UK, our direct exposure to European markets is limited. However, we are mindful of the potential longer-term impact on the wider UK economy and our customers, and continue to monitor developments carefully.
Protecting the ModelOur strategic priority is always to protect our established and successful business model. This means maintaining the prudent underwriting, strong margins and conservative financial position which have supported our business through the years, and ensuring that we manage our risks effectively.
In the current more competitive environment it is particularly important to maintain the prudence and discipline of our lending. In the last year, the net interest margin has remained strong and well ahead of the industry at just over 8%, and we have maintained prudent and consistent loan to value ratios across all our businesses. As a result, we remain confident in the quality of our loan book, and the sustainability of our lending.
Overall, both statutory and adjusted operating profit increased 13%. Earnings per share grew 2% to 128.3p (2016: 125.7p), and 3% to 131.7p (2016: 128.4p) on an adjusted basis, reflecting the first full-year impact of the bank corporation tax surcharge this year. Despite the surcharge, return on opening equity has remained strong at 17.9% (2016: 18.9%).
The Banking division has continued its good performance, with adjusted operating profit up 9% and continued strong returns. Property Finance had a particularly good year with operating profit up 24%, supported by continued demand and low bad debts. Commercial Finance increased adjusted operating
profit by 4% and Retail Finance was broadly flat, consistent with the current stage in the cycle.
Winterflood’s operating profit increased nearly 50% to £28.1 million (2016: £19.0 million), supported by active retail investor trading throughout the year. Asset Management made good progress, with significant growth in client assets and a 21% increase in adjusted operating profit.
In an evolving and often challenging market and regulatory environment, we remain committed to our established business model, which builds on the expertise of our people to deliver
zz_397126 close bros.indb 8 29/09/2017 15:30:18

Close Brothers Group plc Annual Report 2017S
trategic R
epo
rt9
We note increased market focus on the motor finance market, particularly around the recent growth in new car financing and personal contract plans (“PCPs”). Our strong focus on credit quality and relatively small proportion of PCPs leave us well positioned in this market, but we continue to monitor developments closely.
We are equally committed to maintaining prudent funding, capital and liquidity, particularly in light of ongoing regulatory change. In the last year, we have experienced several regulatory changes impacting the group’s capital requirements, including a significant increase in risk weighted assets in our property finance business. Our strong capital position has enabled us to successfully absorb these changes while maintaining headroom to regulatory requirements.
We apply the same conservative risk appetite and disciplined risk management processes across our market-facing business. This is reflected in the consistent trading profitability of Winterflood, which had a particularly successful year with only one trading loss day.
Across all of our businesses we have reviewed processes and systems to enhance our protection against cyber risk, and we are well positioned to meet the requirements of MiFID 2 and the General Data Protection Regulation which come into effect in 2018.
Improving the ModelThe strong profitability of our business allows us to invest through the cycle, and we continue to make significant investment in our client offering, in our operating efficiency, and in training and developing our people. At the same time, we are strongly focused on maintaining cost control in the underlying business, and despite a number of ongoing investment initiatives the expense/income ratio in the Banking division has remained stable at 49% (2016: 49%).
This year we completed the first phase of investment in our premium finance business, where we have significantly enhanced our service to insurance brokers supported by a new contact centre and customer portal. This investment has already resulted in significant new business.
We are now initiating a programme of investment to enhance our offering and operations in the motor finance business. We are also in the early stages of implementing a new treasury system, which will allow us to improve functionality for customers and extend our range of deposit products.
In Asset Management, we have completed the successful migration of clients to a single technology platform, which will allow us to further improve both client experience and operating efficiency. We are also looking at ways to optimise adviser productivity while maintaining our excellent levels of client service.
Extending the ModelFinally, we are always looking for ways to extend our business model, both in existing markets and by entering new, specialist segments.
As expected, we are seeing stronger growth in those businesses which are less exposed to competition, such as premium and property finance, and we have continued to see good growth in Ireland. As a result, the loan book increased 7% overall to £6.9 billion (31 July 2016: £6.4 billion), despite ongoing competition in other parts of the business.
We are progressing our early stage initiatives, including the launch this year of our technology services business within Commercial Finance. In May we also completed the acquisition of Novitas Loans, a specialist business focused on loans to law firms and their clients.
We are now in the early stages of exploring opportunities for asset finance in Germany, where we have recently obtained regulatory approval, but will proceed cautiously to ensure that any lending fits with our strict risk and return criteria.
Winterflood has continued to make the most of existing trading opportunities and delivered a good result driven by higher trading income. We have also made good progress with Winterflood Business Services, which provides outsourced dealing, custody and settlement services to institutions.
In Asset Management, we remain focused on driving growth organically and through the selective acquisition of teams and businesses which fit with our strategy. In the last year we achieved good organic growth, with net inflows at 9% and good momentum in all our distribution channels. Overall, managed assets grew 11% to £8.9 billion. Total client assets increased 13% to £11.2 billion, following the completion of two small IFA acquisitions in the year.
OutlookAlthough current market conditions remain stable overall, the longer-term economic outlook and impact of Brexit on our customers and wider markets remain uncertain. Against this backdrop, we are fully committed to our proven business model and we remain confident in our ability to trade successfully through the cycle.
In Banking we remain focused on maintaining our underwriting discipline and strong margins. The competitive environment remains challenging for some of our businesses, and we continue to monitor market conditions carefully for any change in demand or credit performance.
Winterflood’s good performance has continued but as a daily trading business it remains sensitive to any change in trading conditions.
In Asset Management we have made further progress in the last year and remain focused on growing the business for the long-term.
Overall, while market conditions will clearly vary, our businesses remain well positioned.
Preben PrebensenChief Executive
26 September 2017

Close Brothers Group plc Annual Report 2017
1 2
4 3
Build leading positions inspecialist markets
Generate strongand sustainablereturns
Reinvest in the business to enhance our customer proposition
Maintain a sound financial position and support our clients through the cycle
ExpertiseOur people are
experts in their fields
RelationshipsBuilding long-term
relationships with clientsand intermediaries
ServiceAllowing us to provide
excellent service
10
Business Model
Our long established and distinctive business model is focused on taking a sustainable approach to managing our business for the long-term. We call this approach “Modern Merchant Banking”, which reflects how we apply our traditional values of service, expertise and relationships to meet the evolving needs of our clients.

Close Brothers Group plc Annual Report 2017
How we are different
Strateg
ic Rep
ort
11
This approach supports our strong and sustainable profitability, which has allowed us to support our clients, invest in the business and generate returns to shareholders over many years.
• We focus on our core values of service, expertise and relationships, which drive strong employee engagement and customer loyalty and are at the heart of our Modern Merchant Banking approach.
• We build leading positions in specialist markets, which are typically not well served by larger, more traditional banking groups.
• We consistently apply our lending criteria at all stages in the financial cycle – ensuring sustainability of our lending and continuity for our clients.
• Our lending is predominantly secured, with conservative loan to value ratios, and high margin.
• We take a prudent approach to the management of our financial resources. We borrow long and lend short, with diverse sources of funding, and seek to maintain a conservative capital position throughout the cycle.
Business Model continued
Close Brothers Group plc Annual Report 201712
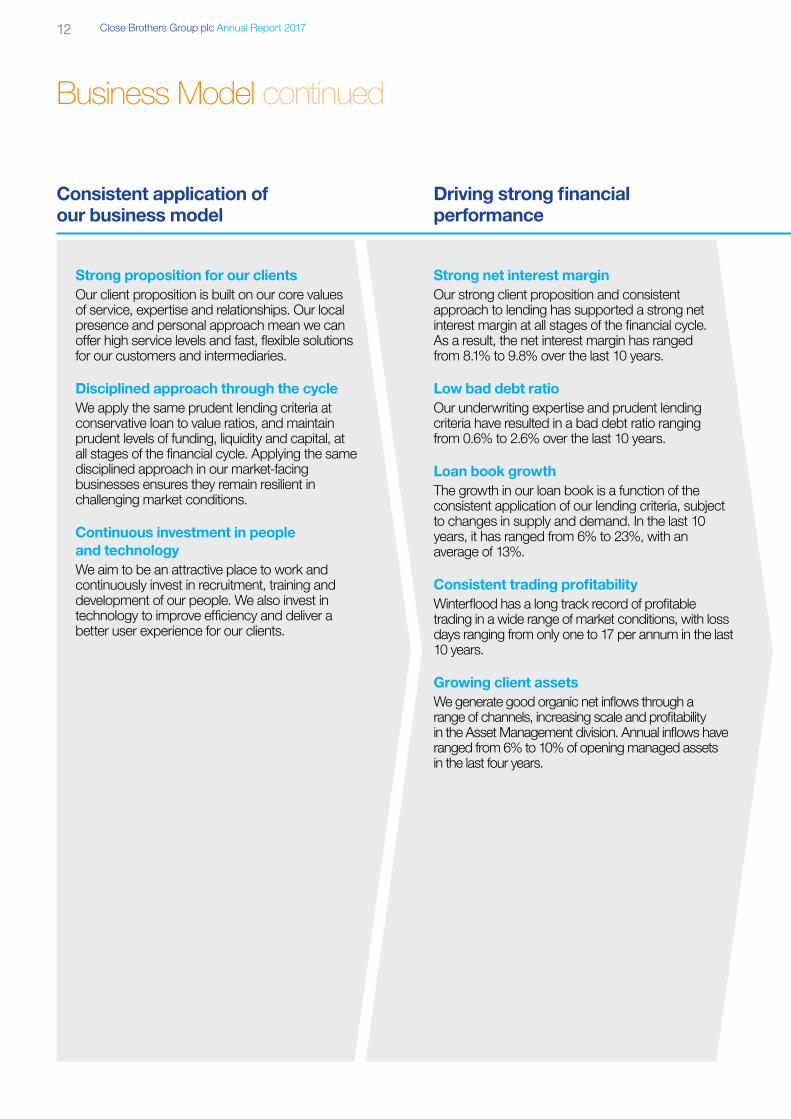
Consistent application of our business model
Driving strong financial performance
Strong proposition for our clientsOur client proposition is built on our core values of service, expertise and relationships. Our local presence and personal approach mean we can offer high service levels and fast, flexible solutions for our customers and intermediaries.
Disciplined approach through the cycleWe apply the same prudent lending criteria at conservative loan to value ratios, and maintain prudent levels of funding, liquidity and capital, at all stages of the financial cycle. Applying the same disciplined approach in our market-facing businesses ensures they remain resilient in challenging market conditions.
Continuous investment in people and technologyWe aim to be an attractive place to work and continuously invest in recruitment, training and development of our people. We also invest in technology to improve efficiency and deliver a better user experience for our clients.
Strong net interest marginOur strong client proposition and consistent approach to lending has supported a strong net interest margin at all stages of the financial cycle. As a result, the net interest margin has ranged from 8.1% to 9.8% over the last 10 years.
Low bad debt ratioOur underwriting expertise and prudent lending criteria have resulted in a bad debt ratio ranging from 0.6% to 2.6% over the last 10 years.
Loan book growthThe growth in our loan book is a function of the consistent application of our lending criteria, subject to changes in supply and demand. In the last 10 years, it has ranged from 6% to 23%, with an average of 13%.
Consistent trading profitabilityWinterflood has a long track record of profitable trading in a wide range of market conditions, with loss days ranging from only one to 17 per annum in the last 10 years.
Growing client assetsWe generate good organic net inflows through a range of channels, increasing scale and profitability in the Asset Management division. Annual inflows have ranged from 6% to 10% of opening managed assets in the last four years.

Close Brothers Group plc Annual Report 2017S
trategic R
epo
rt13
Resulting in good outcomes for clients, employees and investors
Support for our clients in all market conditionsOur robust financial position and strong profitability mean that we can continue to support our clients in all market conditions, even when others may pull back. We are there for our clients when they need us most, and this has contributed to high repeat business and strong net promoter scores across our businesses.
Engaged employeesWe now have over 3,000 employees across 60 offices in the UK and Ireland. Our staff value the support and development opportunities we offer and the positive impact we make on our clients and the communities we operate in.
Strong returns for shareholdersOur prudent approach and consistent profitability ensure that we achieve strong returns for shareholders in a range of market conditions. These strong returns support our progressive dividend policy, which has delivered a sustainable dividend to our shareholders over many years.
£6.9bnOver the last 10 years, our lending to small businesses and individuals in the UK and Ireland has more than tripled to £6.9 billion.
£11.2bnWe now manage or advise over £11 billion of private client assets.
90%Our latest employee survey once again demonstrates strong employee satisfaction across our businesses, with an overall score of 90%.
17.9%Over the last 10 years, return on opening equity has ranged from 10% to 20%.
60.0pSince listing in 1984, our dividend has grown progressively to 60.0p in 2017.

Close Brothers Group plc Annual Report 201714
Strategy and Key Performance Indicators
Our overriding strategic objectives are to protect, improve and extend our established business model to maximise its potential for the long-term. This in turn allows us to deliver excellent outcomes for clients, engaged and productive employees and strong returns for our shareholders in a wide range of market conditions.
Strategic objectives 2017 progress Future priorities Key performance indicators1
Protect1. Maintain the prudent
underwriting and strong margins of our lending
2. Maintain a sound level of funding, liquidity and capital
3. Effectively monitor and mitigate our risks
• Maintained disciplined underwriting, prudent loan to value ratios and strong margin in a competitive lending environment.
• Maintained prudent capital position with good headroom to regulatory requirements despite one-off increase in risk weighted assets.
• Further strengthened and diversified funding position with issue of senior unsecured bond and subordinated debt.
• Consistent trading profitability at Winterflood, with only one loss day.
• Maintain disciplined underwriting and margin in a competitive market.
• Maintain capital flexibility in an evolving regulatory environment.
• Leverage investment in new technology platform to further develop our deposit offering.
• Ensure our compliance with ongoing regulatory change, including transition to MiFID 2 and GDPR.
Read more about our risks and how we manage them overleaf
2017
2016
2015
12.6
13.5
13.7
Common equity tier 1 capital ratioper cent
2017
2016
20152
8.1
8.2
8.6
Net interest marginper cent
2017
2016
2015
127
127
131
Funding %loan bookper cent
2017
2016
2015
0.6
0.6
0.7
Bad debt ratioper cent
Improve4. Invest in technology to
strengthen our customer proposition and improve operating efficiency
5. Maintain a disciplined approach to cost management
6. Recruit, develop and retain high calibre employees
• Continued high repeat business across the group.
• Investment in premium finance delivering improved customer service and strong new business generation.
• Successful migration to single technology platform in Asset Management.
• Continued strong employee engagement.
• Further optimise operational processes to increase efficiency, improve customer experience and free up resource for investment.
• Invest in our customer propositions and technology to improve product offering, increase customer retention and generate new income streams.
• Monitor and respond to evolving market structures, use of technology and customer preferences.
2017
2016
20152
49
49
48
Bankingexpense/income ratioper cent
2017
2015
90
88
Employeesatisfaction3
per cent
Extend7. Maximise the
opportunity in each of our markets, within the boundaries of the model
8. Identify new products and adjacent market opportunities
• Strong net inflows and two small acquisitions in Asset Management.
• Launched technology finance service and obtained regulatory approval in Germany.
• Completed acquisition of specialist provider of loans to law firms and their clients.
• Good progress with Winterflood Business Services.
• Maximise the lending opportunity while maintaining disciplined approach.
• Continue growing client assets, and making incremental acquisitions in Asset Management.
• Continue to identify and explore new business areas that fit with our specialist business model and generate strong returns.
• Further develop offering to institutions via Winterflood Business Services.
2017
2016
2015
7
12
8
Loan book growthper cent
2017
2016
2015
9
6
10
per cent

Close Brothers Group plc Annual Report 2017
2017
2016
2015
17.9
18.9
19.5
Group return on opening equityper cent
2017
2016
2015
60.0
57.0
53.5
Dividend per sharepence
2017
2016
2015
131.7
128.4
120.5
Adjusted basicearnings per sharepence
Strateg
ic Rep
ort
15
Strategic objectives 2017 progress Future priorities Key performance indicators1
Protect1. Maintain the prudent
underwriting and strong margins of our lending
2. Maintain a sound level of funding, liquidity and capital
3. Effectively monitor and mitigate our risks
• Maintained disciplined underwriting, prudent loan to value ratios and strong margin in a competitive lending environment.
• Maintained prudent capital position with good headroom to regulatory requirements despite one-off increase in risk weighted assets.
• Further strengthened and diversified funding position with issue of senior unsecured bond and subordinated debt.
• Consistent trading profitability at Winterflood, with only one loss day.
• Maintain disciplined underwriting and margin in a competitive market.
• Maintain capital flexibility in an evolving regulatory environment.
• Leverage investment in new technology platform to further develop our deposit offering.
• Ensure our compliance with ongoing regulatory change, including transition to MiFID 2 and GDPR.
Read more about our risks and how we manage them overleaf
2017
2016
2015
12.6
13.5
13.7
Common equity tier 1 capital ratioper cent
2017
2016
20152
8.1
8.2
8.6
Net interest marginper cent
2017
2016
2015
127
127
131
Funding %loan bookper cent
2017
2016
2015
0.6
0.6
0.7
Bad debt ratioper cent
Improve4. Invest in technology to
strengthen our customer proposition and improve operating efficiency
5. Maintain a disciplined approach to cost management
6. Recruit, develop and retain high calibre employees
• Continued high repeat business across the group.
• Investment in premium finance delivering improved customer service and strong new business generation.
• Successful migration to single technology platform in Asset Management.
• Continued strong employee engagement.
• Further optimise operational processes to increase efficiency, improve customer experience and free up resource for investment.
• Invest in our customer propositions and technology to improve product offering, increase customer retention and generate new income streams.
• Monitor and respond to evolving market structures, use of technology and customer preferences.
2017
2016
20152
49
49
48
Bankingexpense/income ratioper cent
2017
2015
90
88
Employeesatisfaction3
per cent
Extend7. Maximise the
opportunity in each of our markets, within the boundaries of the model
8. Identify new products and adjacent market opportunities
• Strong net inflows and two small acquisitions in Asset Management.
• Launched technology finance service and obtained regulatory approval in Germany.
• Completed acquisition of specialist provider of loans to law firms and their clients.
• Good progress with Winterflood Business Services.
• Maximise the lending opportunity while maintaining disciplined approach.
• Continue growing client assets, and making incremental acquisitions in Asset Management.
• Continue to identify and explore new business areas that fit with our specialist business model and generate strong returns.
• Further develop offering to institutions via Winterflood Business Services.
2017
2016
2015
7
12
8
Loan book growthper cent
2017
2016
2015
9
6
10
per cent
Creating long-term shareholder value
1 See glossary on pages 150 and 151 for definitions.2 2015 re-presented for change in treatment of operating lease assets, as announced on 13 September 2016. 3 Employee survey is run every two years.

Close Brothers Group plc Annual Report 201716
Principal Risks and Uncertainties
Risk ManagementThe group faces a number of risks in the normal course of business providing lending, deposit taking, wealth management services and securities trading.
As set out in the strategy section on the previous pages, the protection of our established business model is a key strategic objective. As a result the management of the risks we face is central to everything we do. The key elements to the way we manage risk are as follows:• Adhering to our established and
proven business model outlined on pages 10 to 13;
• Implementing an integrated risk management approach based on the concept of “three lines of defence”; and
• Setting and operating within clearly defined risk appetites monitored with defined metrics and set limits.
Further details on our approach to risk management are set out on pages 59 and 60. Risk management is overseen by the Board Risk Committee and its key areas of focus over the last year are set out on pages 62 and 63. We believe the key risks facing the group now are how current economic uncertainty, including that arising from the departure of the UK from the EU, will impact our customers and in particular their ability to repay loans, the regulatory landscape and how it may impact some or all of our businesses, the competitive environment and maintaining operational resilience particularly given growing cyber threats.
Risks and uncertaintiesThe following pages set out the principal risks and uncertainties which may impact the group’s ability to deliver its strategy, how we seek to mitigate these risks and the change in the perceived level of risk over the year. While we constantly monitor emerging risks, the
group’s activities, business model and strategy are unchanged as set out on the previous pages. As a result the principal risks and uncertainties the group faces and our approach to mitigating them remain broadly unchanged. The consistency of both our business model and risk management approach has underpinned the group’s track record of trading successfully and supporting our clients in all market conditions.
The summary below should not be regarded as a complete and comprehensive statement of all potential risks and uncertainties faced by the group but rather those which the group currently believes may have a significant impact on its performance and future prospects.
Risk/uncertainty Mitigation Change
Credit lossesAs a lender to small businesses and individuals, the group is exposed to credit losses if customers are unable to repay loans and outstanding interest and fees. At 31 July 2017 the group had loans and advances to customers amounting to £6.9 billion.
The group also has exposure to counterparties with which it places deposits or trades, and also has a small number of derivative contracts to hedge interest rate and foreign exchange exposures.
We seek to minimise our exposure to credit losses from our lending by:• Applying strict lending criteria when
testing the credit quality and covenant of the borrower;
• Maintaining consistent and conservative loan to value ratios with low average loan size and short-term tenors;
• Lending on a predominantly secured basis against identifiable and accessible assets;
• Maintaining rigorous and timely collections and arrears management processes; and
• Operating strong control and governance both within our lending businesses and with oversight by a central credit risk team.
Our exposures to counterparties are mitigated by:• Conservative management of our
liquidity requirements and surplus funding with £0.8 billion placed with the Bank of England;
• Continuous monitoring of the credit quality of our counterparties within approved set limits; and
• Winterflood’s trading relating to exchange traded cash securities and being settled on a delivery versus payment basis. Counterparty exposure and settlement failure monitoring controls are also in place.
Bad debts have remained low during the year to 31 July 2017 and our other counterparty exposures are broadly unchanged with the majority of our liquidity requirements and surplus funding placed with the Bank of England.
However, we are monitoring the uncertainty over Brexit combined with rising consumer debt levels and potential increases in interest rates closely. This uncertainty, combined with the low level of current credit losses, increases the risk of higher credit losses.
Further commentary on the credit quality of our loan book is outlined on pages 26 to 31. Further details on loans and advances to customers and debt securities held are in notes 10 and 11 on pages 120 and 121 of the Financial Statements.
Our approach to credit risk management and monitoring is outlined in more detail in note 27 on page 142.
Key: No change Risk decreased Risk increased

Close Brothers Group plc Annual Report 2017S
trategic R
epo
rt17
Risk/uncertainty Mitigation Change
Economic environmentAny downturn in economic conditions may impact the group’s performance through:• Lower demand for the group’s
products and services;• Lower investor risk appetite as a result
of financial markets instability;• Higher credit losses as a result of
customers inability to service debt and lower asset values on which loans are secured; and
• Increased volatility in funding markets.
The group’s business model aims to ensure that we are able to trade successfully and support our clients in all economic conditions. By maintaining a strong financial position we aim to be able to absorb short-term economic downturns, continuing to lend when others pull back and hence build long-term relationships by supporting our clients when it really matters.
We test the robustness of our financial position by carrying out regular stress testing on our performance and financial position in the event of adverse economic conditions.
Economic uncertainty remains elevated in our view. While the performance of the UK economy has been resilient following the 2016 referendum, the current period of uncertainty is likely to continue reflecting both the outcome of Brexit negotiations and wider global events.
Further commentary on the attributes and resilience of the group’s business model is shown on pages 10 to 13.
Legal and regulatory Changes to the existing legal, regulatory and tax environments and failure to comply with existing requirements may materially impact the group.
Failing to treat customers fairly, to safeguard client assets or to provide advice and products which are in clients’ best interests has the potential to damage our reputation and may lead to legal or regulatory sanctions including litigation and customer redress. This applies to current, past and future business.
Similarly changes to regulation and taxation can impact our financial performance, capital and liquidity and the markets in which we operate.
The group seeks to manage these risks by:• Providing straightforward and
transparent products and services to our clients;
• Governance and control processes to review and approve new products and services;
• Maintaining a prudent capital position with headroom to minimum capital requirements;
• Investing in training for all staff including anti-money laundering, bribery and corruption, conduct risk, data protection and information security. Additional tailored training for relevant employees is provided in key areas such as complaint handling;
• Continuous monitoring of key legal, regulatory and tax developments to anticipate their potential impact; and
• Maintaining constructive and positive relationships and dialogue with regulatory bodies and tax authorities.
Financial services businesses remain the subject of significant regulatory scrutiny. Minimum capital requirements are increasing as regulatory buffers are phased in while global consultations over capital levels continue. There has also been growing regulatory focus on consumer borrowing, particularly around motor finance, and also on the Asset Management industry. For further details on this and our response please see page 22.
Further information on our approach to conduct risk can be found in the Sustainability Report on page 39.
CompetitionThe group operates in highly competitive markets and we expect to see continued high levels of competition particularly within our asset and motor finance businesses in the Banking division.
Elevated levels of competition may impact demand for the group’s products and services.
The group has a long track record of trading successfully in all types of competitive environment.
We value our clients and build long-term relationships offering a differentiated proposition based on:• Speed and flexibility of service;• Local presence;• Experienced and expert people; and• Tailored, client driven product
offerings.
This differentiated proposition combined with the consistent application of our business model helps build long-term relationships and generate high levels of repeat business.
We continue to experience high levels of competition across each of our businesses, particularly in certain areas of the Banking division. Our approach remains unchanged as we focus on supporting our clients, maintaining underwriting standards and investing in our business.
Further commentary on the market environment of the Banking division is outlined on page 26. Our business model is set out on pages 10 to 13.

Close Brothers Group plc Annual Report 201718
Risk/uncertainty Mitigation Change
Technology and operational resilienceProviding robust, contemporary and secure IT services is fundamental to enabling the group to:• Provide a high quality customer
experience across our businesses;• Respond to new technology;• Protect client and company data; and• Counter the evolving cyber threat.
Failure to keep up with changing customer expectations or provide reliable, secure IT services has the potential to impact group performance.
The group continues to invest in its IT services. Currently there are major investment projects across a number of our businesses to enhance our customer offering. Asset Management has recently successfully completed the conversion of our clients on to a single technology platform to enhance the customer experience and increase operating efficiency. The group has strong governance in place to oversee its major projects.
We also continue to invest in strengthening our cyber capabilities including the appointment of a new chief information security officer. We conducted a test scenario with the senior executive team during the year.
We have in place, and regularly test, operational resilience capabilities, including crisis management, business continuity and disaster recovery plans.
Operational resilience remains a key area of focus for the group, particularly as the rate of technology-driven disruption, including the impact and severity of cyber attacks, within the financial services industry continues to increase. We continue to invest and upgrade our IT infrastructure to improve our customer proposition, simplify our technology architecture and enhance resilience to cyber attacks.
For further information on our response to cyber threats see page 63 of the Risk Committee Report.
EmployeesThe quality and expertise of our employees is critical to the success of the group. The loss of key individuals or teams may have an adverse impact on the group’s operations and ability to deliver its strategy.
The group seeks to attract, retain and develop staff by:• Operating remuneration structures
which are competitive and recognise and reward performance;
• Implementing succession planning for key roles;
• Improving our talent pipeline via our graduate and school leavers programmes, and training academy in asset finance;
• Investing in training and development for all staff; and
• Delivering leadership development programmes to develop current and future leaders for the group.
Our highly skilled people are likely to be targeted but we are confident we are able to retain key employees.
Further detail on the employee survey and our investment in our people is outlined in the Sustainability Report on pages 36 to 39.
Principal Risks and Uncertainties continued

Close Brothers Group plc Annual Report 2017S
trategic R
epo
rt19
Risk/uncertainty Mitigation Change
Funding and liquidityThe Banking division’s access to funding remains key to support our lending activities and the liquidity requirements of the group.
Our funding approach is conservative based on the principle of “borrow long, lend short”. The average maturity of funding allocated to the loan book was21 months at 31 July 2017. This compares to our weighted average loan maturity of 14 months.
Our funding is well diversified both by source and channel, and by type and tenor. Liquidity in our Banking division is assessed on a daily basis to ensure adequate liquidity is held and remains readily accessible in stressed conditions.
At 31 July 2017 the group’s funding position was strong with total available funding equal to 127% of the loan book. This provides a prudent level of liquidity to support our lending activities.
While economic uncertainty has the potential to impact funding markets, overall the group remains well funded and continues to have good access to a wide range of funding sources.
We have further diversified our funding during the year. The diversity of funding combined with relatively long tenor when compared to the average duration of our lending means we are well placed.
Further commentary on funding and liquidity is provided on pages 24 and 25. Further financial analysis of our funding is shown in note 18 on page 127 of the Financial Statements.
Market riskMarket volatility impacting equity and fixed income exposures, and/or changes in interest and exchange rates have the potential to impact the group’s performance.
Our policy is to minimise interest rate risk by matching fixed and variable interest rate assets and liabilities using swaps where appropriate. The group’s capital and reserves are not hedged.
Similarly foreign exchange exposures are generally hedged using foreign exchange forwards or currency swaps with exposures monitored daily against approved limits.
Winterflood is a market maker providing liquidity to its clients. Our trading is predominantly short-term with most transactions settling within three days. Trading positions are monitored on a real time basis and both individual and trading book limits are set to control exposure. Trading exposures on foreign securities are also hedged and monitored against limits.
The group’s approach and the underlying risks are unchanged.Further detail on the group’s exposure to market risk is outlined in note 27 on pages 145 to 147 of the Financial Statements.
The sensitivity analysis on interest rate exposures shown in note 27 on page 145 demonstrates the limited level of exposure to interest rate and foreign exchange movements.

Close Brothers Group plc Annual Report 201720
Financial Overview
Close Brothers delivered a good performance in the year with profit growth across all three divisions.
Supporting our clients, whatever the climate
Photographed on location at Cosworth Ltd.
Adjusted and statutory operating profit both increased 13% to £264.8 million (2016: £233.6 million) and £258.6 million (2016: £228.5 million) respectively, driven by income growth across all businesses and resulting in an operating margin of 35% (2016: 34%).
The Banking division continued to perform well, with adjusted operating profit up 9% to £243.5 million (2016: £223.0 million). Winterflood delivered a strong result, with operating profit of £28.1 million (2016: £19.0 million), up 48% on the prior year. Asset Management continued to progress well achieving good net inflows and
benefiting from positive market conditions, with adjusted operating profit of £17.4 million (2016: £14.4 million). Group net expenses, which include the central functions such as finance, legal and compliance, risk and human resources, were marginally higher at £24.2 million (2016: £22.8 million).
Operating income increased 11% to £765.6 million (2016: £687.4 million), with good income growth at strong net interest margin in the Banking businesses. Income in both Securities and Asset Management was also higher, driven by improved trading and favourable market conditions.

Close Brothers Group plc Annual Report 2017S
trategic R
epo
rt21
Adjusted operating expenses increased 11% to £460.6 million (2016: £415.9 million). Nearly half of the uplift relates to Banking, where we are investing to protect and improve our existing business model, and ensure our infrastructure is able to meet the evolving needs of the business. Winterflood’s variable costs also increased, reflecting improved trading performance compared to the prior year. Overall, both the expense/income and compensation ratios were broadly stable at 60% (2016: 61%) and 37% (2016: 37%) respectively.
Bad debt remained low with a ratio of 0.6% (2016: 0.6%), benefiting from one-off provision releases of £7.5 million in the year, as well as continued strong underlying credit performance.
The tax charge in the period was £67.7 million (2016: £42.2 million), which corresponds to an effective tax rate of 26% (2016: 18%). This is above the corporation tax rate of 20%, reflecting the first full-year impact of the bank corporation tax surcharge. The prior year tax rate included a favourable one-off impact of the revaluation of deferred tax assets.
Group Income Statement2017
£ million2016
£ millionChange
%
Operating income 765.6 687.4 11Adjusted operating expenses (460.6) (415.9) 11Impairment losses on loans and advances (40.2) (37.9) 6
Adjusted operating profit 264.8 233.6 13Banking 243.5 223.0 9
Retail Finance 78.9 79.1 (0)Commercial Finance 72.6 69.6 4Property Finance 92.0 74.3 24
Securities 28.1 19.0 48Asset Management 17.4 14.4 21Group (24.2) (22.8) 6
Amortisation of intangible assets on acquisition (6.2) (5.1) 22
Operating profit before tax 258.6 228.5 13Tax (67.7) (42.2) 60Profit after tax 190.9 186.3 2Non-controlling interest (0.3) (0.2) 50
Profit attributable to shareholders 191.2 186.5 3Adjusted basic earnings per share 131.7p 128.4p 3Basic earnings per share 128.3p 125.7p 2Dividend per share 60.0p 57.0p 5Return on opening equity 17.9% 18.9%
17.9%Return on opening equity
60.0pDividend per share
As a result, adjusted basic earnings per share (“EPS”) increased 3% to 131.7p (2016: 128.4p), generating a strong return on opening equity (“RoE”) of 17.9% (2016: 18.9%). Basic EPS increased 2% to 128.3p (2016: 125.7p).
Results are presented both on a statutory and adjusted basis. The adjusted basis excludes exceptional items and amortisation of intangible assets on acquisition. Adjusted operating profit is reported on a basis consistent with prior periods and is used by management for internal management reporting purposes. Amortisation of intangible assets on acquisition of £6.2 million (2016: £5.1 million) is excluded from adjusted operating profit to present the performance of the group’s acquired businesses consistent with its other businesses. Exceptional items such as significant non-recurring items relating to acquisitions and disposals of businesses are excluded from adjusted operating profit as they are non-recurring and do not reflect the trading performance of the group. There were no exceptional items in the current or prior period.
The board is proposing a final dividend per share of 40.0p (2016: 38.0p), resulting in a full-year dividend per share of 60.0p (2016: 57.0p), an increase of 5% on the prior year. This reflects our progressive dividend policy, while maintaining a prudent level of dividend cover. Subject to shareholder approval at the Annual General Meeting, the final dividend will be paid on 21 November 2017 to shareholders on the register at 13 October 2017.

Close Brothers Group plc Annual Report 201722
Balance SheetOur prudent approach to management of capital, funding and liquidity remains unchanged. This is reflected in our simple and transparent balance sheet, where the majority of assets and liabilities relate to our lending activities. Assets are made up predominantly of loans and advances to customers, which are mostly secured and short-term with an average maturity of approximately 14 months. Also included in the balance sheet are treasury assets held for liquidity purposes and settlement balances in our Securities division. Other assets principally comprise intangibles, property, plant and equipment, and prepayments. Liabilities are predominantly made up of customer deposits and both secured and unsecured borrowings to fund the loan book.
In the year, total assets increased by £537.0 million to £9.3 billion (31 July 2016: £8.7 billion), driven by an increase of £453.1 million in the loan book to £6.9 billion (31 July 2016: £6.4 billion). Total liabilities increased £397.9 million to £8.0 billion (31 July 2016: £7.7 billion), driven predominantly by higher customer deposits. Settlement balances also increased reflecting increased trading activity in Winterflood.
Total equity increased to over £1.2 billion (31 July 2016: £1.1 billion), principally reflecting profit in the period, partially offset by dividend payments of £85.6 million. The group’s return on assets remained stable at 2.1% (31 July 2016: 2.1%).
Financial Overview continued
Photographed on location at Biggin Hill Heritage Hangar Ltd.
12.6%Common equity tier 1 capital ratio
CapitalA prudent capital position is a core part of our business model and supports our ability to lend through the cycle. The strong profitability of our business and resulting organic capital generation have allowed us to grow the loan book, pay a progressive dividend and invest in our business, while meeting increasing regulatory requirements in recent years.
In the year to 31 July 2017, we generated £89.2 million of capital, reflecting £191.2 million of profit in the year, dividends paid and foreseen of £89.3 million, and other movements in reserves and intangibles. Common equity tier 1 (“CET1”) capital increased to £990.6 million (31 July 2016: £901.4 million).

Close Brothers Group plc Annual Report 2017S
trategic R
epo
rt23
Group Balance Sheet 31 July
2017£ million
31 July2016
£ million
Loans and advances to customers 6,884.7 6,431.6Treasury assets1 1,029.0 1,048.4Market-making assets2 643.4 576.9Other assets 728.1 691.3
Total assets 9,285.2 8,748.2
Deposits by customers 5,113.1 4,894.6Borrowings 2,041.2 1,938.3Market-making liabilities2 556.9 505.6Other liabilities 338.0 312.8
Total liabilities 8,049.2 7,651.3
Equity 1,236.0 1,096.9
Total liabilities and equity 9,285.2 8,748.2
1 Treasury assets comprise cash and balances at central banks and debt securities held to support lending in the Banking division.2 Market-making assets and liabilities comprise settlement balances, long and short trading positions and loans to or from money brokers.
Group Capital Position 31 July
2017£ million
31 July2016
£ million
Common equity tier 1 capital 990.6 901.4Total capital 1,196.2 925.4Risk weighted assets 7,859.0 6,682.5Common equity tier 1 capital ratio 12.6% 13.5%Total capital ratio 15.2% 13.8%Leverage ratio 10.7% 10.2%
Risk weighted assets increased 18% to £7.9 billion (31 July 2016: £6.7 billion), reflecting continued loan book growth and an increase in risk weighting of the property finance loan book. This reflects new guidance from the European Banking Authority, which mandates the risk weighting of all property development loans at 150% under the standardised approach.
As a result, the CET1 capital ratio reduced from 13.5% to 12.6%. The total capital ratio increased to 15.2% (31 July 2016: 13.8%), reflecting the issue of £175 million of subordinated debt qualifying as tier 2 capital.
These ratios reflect the conservative risk weighting of our loan book under the standardised approach, which is now over 90% despite the secured nature of our lending and long track record of strong credit performance. We are in early discussions with the PRA with regards to a potential move to an Internal Ratings Based (“IRB”) approach, which we believe would more accurately reflect the risk profile of our lending longer-term.
Our leverage ratio, which is a transparent measure of capital strength not affected by risk weightings, remains very strong at 10.7% (31 July 2016: 10.2%).
Our capital ratios remain comfortably ahead of minimum regulatory requirements. During the year, we received updated individual capital guidance from the PRA, confirming our total pillar 2 add-on at 1.9%, of which 56% or 1.1% needs to be met with CET1 capital. The Bank of England also announced an increase in the counter-cyclical buffer for all UK banks to 0.5%, effective June 2018, and plans for a further increase to 1.0% effective November 2018. This results in a fully loaded minimum CET1 capital requirement, effective 2019, of 9.1% with a total capital requirement of 13.4%. Accordingly, we maintain good headroom of 350bps in our CET1 capital ratio, and 180bps in the total capital ratio, and our strong profitability gives us continued flexibility.

Close Brothers Group plc Annual Report 201724
Financial Overview continued
£8.8bnTotal funding
£1.0bnTreasury assets
FundingThe primary purpose of our treasury function is to manage funding and liquidity to support the lending businesses. We maintain a conservative approach, with diverse funding sources and a prudent maturity profile.
Our funding remains diverse with a wide range of retail and corporate deposits, wholesale facilities, senior unsecured debt and most recently a subordinated debt issue. Furthermore, we have a range of secured funding facilities including securitisations of our premium and motor finance loan books. This diversity increases resilience by reducing reliance on any individual source of funding.
We also continue to have access to both the Funding for Lending and the Term Funding Schemes, although combined these represent only c.5% of our total funding.
The loan book growth in the year was funded by an increase in both wholesale funding and deposits. Unsecured funding increased £254.3 million to £1.1 billion (31 July 2016: £0.9 billion), following the issuance of £250 million of senior unsecured debt and £175 million of subordinated debt. These were partly offset by the maturity of a previous £200 million debt issue in February 2017.
Deposits increased 4% to £5.1 billion (31 July 2016: £4.9 billion), driven by an increase in corporate deposits which account for around two thirds of the deposit base. As a result, total funding increased to £8.8 billion (31 July 2016: £8.2 billion) and accounted for 127% (31 July 2016: 127%) of the loan book.
Term funding, with a residual maturity over one year, increased significantly in the last year and now covers 69% (31 July 2016: 67%) of the loan book as a result of new debt issues and the renewal of wholesale facilities.
Photographed on location at Barfoots of Botley Ltd.
The average maturity of this term funding increased to 38 months (31 July 2016: 31 months), while the average maturity of funding allocated to the loan book was 21 months (31 July 2016: 19 months), reinforcing our “borrow long, lend short” approach.
The funding environment remains favourable and our average cost of funding reduced to 1.7% (2016: 2.0%). This reflects a lower base rate, with a corresponding reduction in deposit rates, and our continued pricing discipline.
In the year, both Moody’s Investors Services (“Moody’s”) and Fitch Ratings (“Fitch”) reaffirmed our credit ratings. Moody’s rates Close Brothers Group (“CBG”) A3/P2 and Close Brothers Limited (“CBL”) Aa3/P1, with stable outlook. Fitch rates both CBG and CBL A/F1 with stable outlook.

Close Brothers Group plc Annual Report 2017S
trategic R
epo
rt25
Group Funding131 July
2017£ million
31 July2016
£ million
Customer deposits 5,113.1 4,894.6Secured funding2 1,297.3 1,296.3Unsecured funding3 1,120.3 866.0Equity 1,236.0 1,096.9
Total available funding 8,766.7 8,153.8
Of which term funding (>1 year) 4,766.2 4,315.7Total funding as % of loan book 127% 127%Term funding as % of loan book 69% 67%Average maturity of term funding (excluding equity) 38 months 31 monthsAverage maturity of funding allocated to loan book4 21 months 19 months
1 Numbers relate to core funding and exclude working capital facilities at the business level. 2 Includes £97.5 million (31 July 2016: £nil) of Treasury Bills drawn under the Funding for Lending Scheme but not currently in repurchase agreements.3 Unsecured funding excludes £16.1 million (2016: £21.0 million) of non-facility overdrafts included in borrowings and includes £295.0 million (2016: £245.0 million) of
undrawn facilities.4 Average maturity of total funding excluding equity and funding held for liquidity purposes.
Group Liquidity31 July
2017£ million
31 July2016
£ million
Bank of England deposits 805.1 847.4Sovereign and central bank debt 43.6 –High quality liquid assets1 848.7 847.4Certificates of deposit 180.3 201.0
Treasury assets 1,029.0 1,048.4
1 In addition to and not included in the above, at 31 July 2017 the group held £97.5 million (31 July 2016: £nil) of Treasury Bills drawn under the Funding for Lending Scheme but not currently in repurchase agreements which are classified as high quality liquid assets.
LiquidityThe group maintains a strong liquidity position, ensuring it is comfortably ahead of both internal risk appetite and regulatory requirements. The majority of our liquidity requirements and surplus funding are held in the form of high quality liquid assets. We regularly assess and stress test our liquidity requirements and continue to comfortably meet the liquidity coverage ratio requirements under CRD IV.
Treasury assets were broadly stable at £1.0 billion (31 July 2016: £1.0 billion) and were predominantly held on deposit with the Bank of England.
IFRS 9The provisions of IFRS 9 Financial Instruments will apply to the group for the year ended 31 July 2019. The transition to IFRS 9 will fundamentally change the accounting for credit losses, moving from an “incurred” to an “expected” basis. This requires the development of extensive models to estimate expected credit losses taking into account both the composition of the loan book and macroeconomic outlook at each point in time.
Our preparation for the transition to IFRS 9 is progressing well. We have completed our initial model build and will be conducting a parallel run for the duration of the current financial year, which will allow us to validate and refine models and assumptions ahead of implementation at 1 August 2018.
The implementation of IFRS 9 will result in an initial increase in impairment provisions on the group’s balance sheet, and may increase volatility in the income statement going forward. We will provide further detail on the expected financial impact of the transition once we have sufficiently reliable estimates. Further qualitative information on the provisions of IFRS 9 and progress towards implementation is set out in the Significant accounting policies note on page 109.

Close Brothers Group plc Annual Report 201726
Banking
The Banking division delivered another year of good returns, driven by higher income and continued low impairments.
Banking adjusted operating profit was up 9% to £243.5 million (2016: £223.0 million), driven by growth of 9% in operating income to £555.3 million (2016: £511.2 million) and continued low impairments. Statutory operating profit also increased 9% to £242.6 million (2016: £222.5 million).
The loan book grew 7.0% (2016: 12.1%) with strong growth in both the property finance and premium finance businesses. The return on net loan book remained at 3.6% (2016: 3.6%) reflecting our disciplined approach to lending.
The net interest margin remained strong at 8.1% (2016: 8.2%) as we continue to prioritise margins across all of our businesses, despite significant competition in some of our markets. A slight reduction in yield, attributable to the business mix and ongoing price competition in the asset and motor finance businesses, was largely offset by lower cost of funds.
Adjusted operating expenses at £271.6 million (2016: £250.3 million) increased 9% year on year, in line with income. Investment in infrastructure in premium finance and treasury, as well as new business initiatives across Retail Finance and Commercial Finance account for nearly half of the uplift in costs. Staff related expenses, which represent the majority of the cost base, also increased reflecting continued investment in both front office and support functions. Despite this, both the expense/income and compensation ratios remained in line with last year, at 49% and 29% respectively.
The bad debt ratio was stable on the prior year at 0.6% (2016: 0.6%), reflecting the ongoing benign credit environment and one-off provision releases of £7.5 million in the year. The underlying bad debt ratio remained well below historical levels at 0.7% and arrears across the businesses remain low.
Return on opening equity remained strong at 23% (2016: 26%), despite the first full-year impact of the bank corporation tax surcharge.
Helping businessesUnlockpotential
Photographed on location at Alicat Workboats Ltd.

Close Brothers Group plc Annual Report 2017
2017
2016
2015
8.1
8.2
8.6
Net interest marginper cent
2017
2016
2015
0.6
0.6
0.7
Bad debt ratioper cent
2017
2016
2015
23
26
27
Return on opening equityper cent
2017
2016
2015
3.6
3.6
3.7
Return on net loan bookper cent
Key Performance Indicators
Key Financials2017
£ million2016
£ millionChange
%
Operating income 555.3 511.2 9Adjusted operating expenses (271.6) (250.3) 9Impairment losses on loans and advances (40.2) (37.9) 6
Adjusted operating profit 243.5 223.0 9
Average loan book and operating lease assets 6,827.0 6,226.4 10
Loan Book Analysis31 July
2017 £ million
31 July20161
£ millionChange
%
Retail Finance 2,702.8 2,511.0 7.6Motor finance 1,761.9 1,704.8 3.3Premium finance 940.9 806.2 16.7Commercial Finance 2,552.6 2,463.4 3.6Asset finance 2,017.0 2,020.0 (0.1)Invoice finance 535.6 443.4 20.8Property Finance 1,629.3 1,457.2 11.8
Closing loan book 6,884.7 6,431.6 7.0
1 Minor differences compared to previously reported numbers at 31 July 2016 reflect re-presentation relating to the transfer of the rentals loan book of £15.1 million from asset finance into invoice finance, and the consumer point of sale loan book of £35.7 million from motor finance into premium finance, in line with internal management reporting.
Strateg
ic Rep
ort
27
8.1% Net interest margin
23% Return on opening equity
Loan BookWe consider growth to be an output of our business model. The diversity of our loan book provides resilience to changes in demand and competition, with diverging growth rates across our businesses at different points in the cycle. The loan book growth of 7.0% in the year to £6.9 billion (31 July 2016: £6.4 billion) was driven predominantly by property and premium finance, both of which have been resilient to competitive pressure. Invoice finance also grew strongly and benefited from a small acquisition in the period. Motor and asset finance were broadly flat, as we prioritise our strict lending criteria in the face of continued competition in these markets.
We continue to see good growth in the Irish market, where we provide motor, premium, asset and invoice finance. Ireland now accounts for c.10% of the overall Banking loan book and continues to support growth, particularly in the motor and asset finance businesses.

Close Brothers Group plc Annual Report 201728
Banking continued
Our Banking division remains well positioned for the future and we remain confident in our ability to lend in a wide range of market conditions.
Photographed on location at Close Brothers Brewery Rentals.

Close Brothers Group plc Annual Report 2017S
trategic R
epo
rt29
recent strong growth in new car sales and PCP products. Our core product is hire-purchase contracts for second hand vehicles, with PCP being a relatively new offering and accounting for only c.15% of the motor finance loan book at 31 July 2017. We apply the same prudent and consistent underwriting in PCP products as in the rest of our lending, with conservative loan to value ratios, typically ranging from 75% to 85%. Overall, we believe our business is well positioned but we continue to monitor developments carefully.
Overall, adjusted operating profit for the Retail Finance segment of £78.9 million (2016: £79.1 million) was broadly in line with the prior year. Statutory operating profit was also broadly flat at £78.5 million (2016: £78.8 million).
Operating income was up 9% year on year at £222.4 million (2016: £204.6 million) with the net interest margin broadly stable at 8.5% (2016: 8.6%).
Adjusted operating expenses increased 9%, in line with income growth, to £117.7 million (2016: £107.7 million), as our multi-year investment in infrastructure in the premium finance business continues.
Banking: Retail Finance2017
£ million2016
£ millionChange
%
Operating income 222.4 204.6 9Adjusted operating expenses (117.7) (107.7) 9Impairment losses on loans and advances (25.8) (17.8) 45
Adjusted operating profit 78.9 79.1 (0)
Net interest margin 8.5% 8.6%Expense/income ratio 53% 53%Bad debt ratio 1.0% 0.7%
Average loan book 2,606.9 2,388.5 9
£78.9mRetail Finance Adjusted operating profit
Retail FinanceRetail Finance provides intermediated finance, principally to individuals, through motor dealers, insurance brokers and retailers and incorporates our premium and motor finance businesses.
The Retail Finance loan book grew 8% to £2.7 billion (31 July 2016: £2.5 billion). Premium finance accounted for most of this increase with new broker wins, increasing volumes from existing brokers and premium inflation all contributing to loan book growth of 17% to £0.9 billion (31 July 2016: £0.8 billion). Premium finance continues to be well positioned competitively, benefiting from the multi-year investment programme in its infrastructure aimed at improving both broker and end customer experience. Motor finance delivered modest growth of 3% in the year, with the loan book currently at £1.8 billion (31 July 2016: £1.7 billion) and most of the growth coming from Ireland. The UK motor finance market remains highly competitive and we continue to prioritise margin and credit quality.
There has been increased market focus on growth in consumer credit and the motor finance industry, in particular the
During 2017 we also initiated an investment programme in our motor finance business, in order to improve the service proposition, streamline operational processes and improve sales effectiveness. Despite this investment, the expense/income ratio remained in line with the prior year at 53% (2016: 53%).
The bad debt ratio of 1.0% (2016: 0.7%) was higher than the prior year, reflecting increases in both motor and premium finance relative to the exceptionally low bad debts in the prior year. Overall, we remain comfortable with the credit quality in both businesses.
Retail Finance remains well positioned long-term. In motor finance, we are focused on protecting our margins and maintaining credit quality, while in premium finance we continue to invest to further improve business performance.

Close Brothers Group plc Annual Report 201730
Banking continued
Commercial FinanceCommercial Finance focuses on specialist, secured lending principally to the SME market and includes the asset and invoice finance businesses.
The asset finance loan book remained flat in the year, reflecting strong competition from both new and existing lenders, as we focus on protecting the margin at the current point in the cycle. Overall, the Commercial Finance loan book increased 4% to £2.6 billion (31 July 2016: £2.5 billion), driven by growth in invoice finance as well as the acquisition of Novitas Loans, a specialist provider of finance to the legal profession, which completed in the second half of the year and contributed £38.2 million to the loan book growth.
Adjusted operating profit of £72.6 million (2016: £69.6 million) was up 4%, driven by good income and lower bad debt. Statutory operating profit also increased 4% to £72.1 million (2016: £69.4 million).
Operating income of £213.3 million (2016: £202.3 million) was 5% higher than the prior year, reflecting loan book growth. Despite ongoing pricing pressure in the asset finance market, we
have maintained a strong net interest margin of 8.0% (2016: 8.2%), which remains ahead of the industry.
Cost growth was slightly ahead of income growth for the year at £125.2 million (2016: £116.2 million), driven by ongoing investment in new initiatives. These include the launch of our technology services business, where we offer financing solutions for IT infrastructure, the expansion of our asset finance offering into Germany, where we have recently obtained regulatory approval to operate, and the acquisition of Novitas Loans. As a result the expense/income ratio increased slightly to 59% (2016: 57%).
The bad debt ratio reduced marginally to 0.6% (2016: 0.7%), with continued good credit performance, as the credit environment remains benign and we maintain our strict lending criteria.
Overall, Commercial Finance performed well in a challenging competitive environment. Our focus remains on protecting the margin and maintaining our prudent underwriting to ensure sustainability of the business through the cycle.
Photographed on location at Mark Priestley SDT Ltd.
Property FinanceProperty Finance is focused on specialist residential development finance to established professional developers in the UK. We do not lend to the buy-to-let sector, or provide residential or commercial mortgages.
The Property Finance segment had a very successful year, delivering growth of 24% in profits and 12% in loan book, which is now at £1.6 billion (31 July 2016: £1.5 billion). This was driven by solid demand for residential property development finance and low impairments. Our long track record, expertise and quality of service ensure the business remains resilient to competitive pressures and continues to generate high levels of repeat business. London and the South East represent c.70% of the loan book and we concentrate on new build family homes, where structural demand remains strong. We also continue to successfully expand into selected regional locations across the UK.
£72.6 m Commercial Finance Adjusted operating profit
£92.0m Property Finance Operating profit

Close Brothers Group plc Annual Report 2017S
trategic R
epo
rt31
Banking: Commercial Finance2017
£ million2016
£ millionChange
%
Operating income 213.3 202.3 5Adjusted operating expenses (125.2) (116.2) 8Impairment losses on loans and advances (15.5) (16.5) (6)
Adjusted operating profit 72.6 69.6 4
Net interest margin 8.0% 8.2%Expense/income ratio 59% 57%Bad debt ratio 0.6% 0.7%
Average loan book and operating leases 2,676.8 2,459.8 9
Banking: Property Finance2017
£ million2016
£ millionChange
%
Operating income 119.6 104.3 15Operating expenses (28.7) (26.4) 9Impairment losses on loans and advances 1.1 (3.6)
Operating profit 92.0 74.3 24
Net interest margin 7.7% 7.6%Expense/income ratio 24% 25%Bad debt ratio (0.1%) 0.3%
Average loan book 1,543.3 1,378.1 12
The business delivered an operating profit of £92.0 million (2016: £74.3 million), with an improved net interest margin of 7.7% (2016: 7.6%). Provision releases relating to a number of legacy properties also contributed to the higher profit. As a result, the bad debt ratio of (0.1%) (2016: 0.3%) represents a net recovery in the period, with underlying credit quality also remaining strong.
Operating expenses of £28.7 million (2016: £26.4 million) were up 9%, and the expense/income ratio remained low at 24% (2016: 25%), reflecting the lower operational requirements of the business with larger transaction sizes at lower volumes.
Our long track record of successful lending in property finance through the cycle is based on the same principles of prudent underwriting and margin prioritisation as in all of our businesses. We lend at consistently low loan to value ratios, which reflect our conservative approach to lending, and remain confident in the resilience and quality of our business.
Well Positioned to Lend Through the Cycle Overall our Banking division remains well positioned for the future and we remain confident in our ability to lend in a wide range of market conditions. Although some of our businesses continue to operate in highly competitive environments, the overall portfolio benefits from the diversity of the businesses and their differing growth profiles through the cycle. Our focus remains on protecting our margins, maintaining our prudent underwriting, and investing to improve and extend the model in new and existing markets.

Close Brothers Group plc Annual Report 201732
Securities
Winterflood, the leading UK market-maker, achieved a significant improvement in performance over the year, maximising revenue opportunities in a favourable market environment.
The business benefited from rising markets and political and market events, which attracted higher levels of retail investor trading activity. Operating income increased 30% to £106.7 million (2016: £82.3 million), reflecting higher income across all trading sectors and particularly in AIM and investment trusts.
Average daily bargains increased 26% to 65,286 (2016: 51,864), reflecting the increased trading activity. Winterflood incurred only one loss day (2016: 17), notwithstanding periods of increased market volatility, demonstrating the expertise of its traders.
Keeping the marketsMoving
Photographed on location at Winterflood Securities Limited.

Close Brothers Group plc Annual Report 2017
2017
2016
2015
106.7
82.3
94.6
Income£ million
2017
2016
2015
65
52
60
Bargains per day’000
2017
2016
2015
26
23
26
Operating marginper cent
2017
2016
2015
29
21
26
Return on opening equityper cent
Strateg
ic Rep
ort
33
Key Performance Indicators
Key Financials2017
£ million2016
£ millionChange
%
Operating income 106.7 82.31 30Operating expenses (78.6) (63.3) 24Operating profit 28.1 19.01 48
1 2016 operating income and operating profit include £3.8 million and £1.9 million respectively relating to the disposal of Euroclear shares.
Operating expenses increased 24%, reflecting higher variable costs as a result of improved trading performance, as well as higher settlement fees, reflecting increased trading activity. Winterflood Business Services, which provides outsourced dealing, custody and settlement services to institutional clients, also invested in a new platform and increased its headcount to support its growing client base. The expense/income ratio reduced to 74% (2016: 77%), reflecting higher revenues, while the compensation ratio remained flat at 48% (2016: 48%).
Overall, Winterflood’s operating profit increased 48% to £28.1 million (2016: £19.0 million).
Well Positioned in a Range of Market ConditionsWinterflood has a long track record of providing continuous liquidity and trading profitably in a wide range of market conditions. The trading environment since the year end has remained favourable but Winterflood remains sensitive to changes in market sentiment and in particular retail investor activity.
Winterflood has a long track record of providing continuous liquidity and trading profitably in a wide range of market conditions.
£28.1m Operating profit
29% Return on opening equity

Close Brothers Group plc Annual Report 201734
Asset Management continued
The division delivered £17.4 million (2016: £14.4 million) adjusted operating profit with positive net flows of £757 million (31 July 2016: £508 million), or 9% (2016: 6%) of opening managed assets. Statutory operating profit increased 23% to £12.1 million (2016: £9.8 million).
Operating income increased 11% to £102.9 million (2016: £92.3 million), driven by higher client assets from both net inflows and rising markets. The revenue margin increased to 96bps (2016: 86bps) following the disposal of our corporate business in 2016.
Adjusted operating expenses increased 10% to £85.5 million (2016: £77.9 million), although the expense/income ratio reduced to 83% (2016: 84%). Growth in expenses was predominantly driven by staff costs, as headcount increased by 12% reflecting our decision to grow the number of advisers through both hiring and acquisitions to support long-term growth. The compensation ratio increased slightly, to 55% (2016: 54%), reflecting the higher headcount and increased variable compensation.
In the year we disposed of OLIM Investment Managers (“OLIM”), which contributed £2.3 million (2016: £2.5 million) of income and £1.9 million (2016: £0.9 million) operating profit for the year, including a £1.6 million profit on disposal.
Excluding OLIM, and the corporate business sold in 2016, the adjusted operating profit increased 36% to £15.5 million (2016: £11.4 million), with an underlying operating margin of 15% (2016: 13%). The underlying revenue margin increased to 97bps (2016: 93bps) reflecting the higher proportion of managed assets within our integrated wealth management offering.
Net Inflows Across All Channels Following modest growth in the first half, market conditions and net inflows improved significantly in the second, resulting in 11% growth in managed assets to £8.9 billion (31 July 2016: £8.0 billion). For the full year, organic net inflows increased 49% to £757 million, with strong flows from our own advisers and investment managers, and through third party IFAs. Positive market
movements contributed a further £588 million, more than offsetting the sale of OLIM, which had £492 million of managed assets at the time of disposal.
During 2017, we also completed acquisitions of EOS Wealth Management and Adrian Smith & Partners. The two high net worth independent financial advisory businesses strengthen our presence in London and the Midlands, adding c.£450 million of advised client assets and over 800 new clients.
As a result, advised assets under third party management increased by 22% to £2.3 billion (31 July 2016: £1.9 billion), bringing total client assets to £11.2 billion (31 July 2016: £9.9 billion), an increase of 13% over the year.
Solid Fund PerformanceWe provide an integrated wealth management offering, combining financial planning advice and investment management, directly to private clients through our own advisers. We also offer our investment management solutions to third party advisers and through our
Photographed on location at The Morgan Motor Company Ltd.
Planning for the
FutureAsset Management made further progress in the year, delivering strong net inflows and higher profit, benefiting from favourable market conditions and continued good demand for our integrated advice and investment management services.
We continue to see significant long-term growth potential for our Asset Management business, and it remains well positioned to benefit from continuing high demand for our integrated advice and investment management services.

Close Brothers Group plc Annual Report 2017
2017
2016
2015
11.2
9.9
10.8
Total client assets£ billion
2017
2016
2015
96
86
88
Revenue marginbps
2017
2016
2015
17
16
19
Operating marginper cent
2017
2016
2015
26
25
39
Return on opening equityper cent
Strateg
ic Rep
ort
35
Key Performance Indicators
Key Financials2017
£ million2016
£ millionChange
%
Investment management 63.7 57.4 11Advice and other services1 37.1 32.1 16Other income 2.1 2.8 (25)Operating income 102.9 92.3 11Adjusted operating expenses (85.5) (77.9) 10
Adjusted operating profit 17.4 14.4 21
1 Income from advice and self-directed services, excluding investment management income.
Movement in Client Assets31 July
2017 £ million
31 July 2016
£ million
Opening managed assets 8,047 7,996Inflows 1,884 1,238Outflows (1,127) (730)Net inflows 757 508Market movements 588 196Disposals (492) (653)Total managed assets 8,900 8,047Advised only assets 2,257 1,854
Total client assets1 11,157 9,901
Net flows as % of opening managed assets 9% 6%
1 Total client assets include £3.7 billion (31 July 2016: £3.0 billion) of assets that are both advised and managed.
bespoke portfolio managers. Our investment strategy focuses on delivering long-term returns to clients using a conservative, collaborative approach tailored to an individual client’s risk profile.
Our funds and segregated bespoke portfolios are designed to provide attractive risk adjusted returns for our clients in line with their long-term goals and investment objectives. Over the 12 month period to 30 June 2017, all our funds and segregated strategies have delivered positive risk adjusted returns. Relative to their peer group, 8 of our 13 unitised funds have outperformed their respective Investment Association sectors. Our segregated bespoke investment strategies have all outperformed their ARC peer group average returns over the same period. Well Positioned for Future Growth During the year we successfully completed the migration of client accounts onto a single technology platform, which allows us to consolidate custody, trading and administration, improve client experience and create operating efficiencies. In addition, we are
looking at ways to optimise our adviser productivity, while continuing to provide excellent service to our clients.
We continue to see significant long-term growth potential for this business and remain well positioned to benefit from continuing high demand for our integrated advice and investment management services, through organic inflows, select hiring of advisers and investment managers, and incremental acquisitions.
£17.4m Adjusted operating profit
11% Growth in managed assets

Close Brothers Group plc Annual Report 201736
Sustainability Report
Photographed on location at JAH Plant Hire Ltd.
Close Brothers has a strong reputation as a responsible lender, founded on a prudent approach to managing our business and commitment to our employees, clients and communities. We seek to provide the highest level of support and service by applying the same responsible approach across all our businesses and focusing on areas that matter to our stakeholders.
Committed to making a Positive impact

Close Brothers Group plc Annual Report 2017S
trategic R
epo
rt37
A sustainable approachOur long-standing reputation as a leading merchant banking group is built on the consistent application of our prudent business model, underpinned by core values of service, expertise and relationships. We apply these values in our interaction with employees, customers and our communities. We share a strong commitment to acting responsibly, ethically and with integrity when interacting with all our stakeholders.
Management of sustainability issues across our organisation and the consideration of environmental issues and ethical standards are an important part of our corporate culture and are reflected throughout our group-wide policies and procedures. Our employees are involved in a range of community initiatives and responsible finance matters regularly appear on group and divisional risk committee agendas.
Focus on our employeesThe contribution of our people is critical to the ongoing success of our business. We are committed to creating an environment where our employees are supported and motivated by providing them with opportunities to realise their full potential. We continuously review the ways we engage, reward and develop our people to ensure Close Brothers remains an attractive place to work.
Engaging our peopleEngaged employees are more committed to their work and their organisation and we believe they are likely to perform better and stay with the firm longer if they feel valued and supported. We monitor the engagement of our staff through an externally run group-wide Employee Opinion Survey, which we last conducted in January 2017.
The results showed that we have continued to build on the strengths highlighted in surveys from previous years, with 90% of employees who completed the survey indicating that they are satisfied with working at Close Brothers, an improvement on our previously strong score of 88%. In line with our previous surveys, areas of strength across the group continue to be our strong customer focus and our team working culture. As in previous years, we had a high overall response rate of 85% which gives credibility to these results.
90% Employee satisfaction
Our Employee Opinion Survey is run every two years to ensure that the businesses have sufficient time to analyse the results and to agree and implement meaningful action plans which focus not only on what we could improve, but also on maintaining those areas of strength that our employees value the most. Developing our peopleDuring the year we implemented a number of initiatives to promote training across the group as well as further programmes designed to attract and to develop talent.
All our employees have access to a new online learning portal offering a wide range of practical tools, workshops and e-learning on a range of topics. By simplifying and centralising training for all our employees we expanded the number of training hours across the group and on average, our employees completed 8.4 continuing professional development hours over the past year, an increase of 11%.
We continue to support the development of a new talent pipeline by running a number of structured programmes designed to attract school leavers and graduates, provide on the job learning and support studies towards a professional qualification. We also focus on supporting internal career mobility by advertising the majority of our roles internally and identifying internal successors through regular talent forums across the organisation.
Our Training Academy, which launched in 2015 to develop our own sales professionals in asset finance, has made good progress with 20 of the initial candidates becoming qualified sales managers in August 2017.
Close Brothers Asset Management also continues to run its Adviser Academy which is designed to develop skills and provide career advancement opportunities for our financial advisers. We have expanded the programme with more of our advisers encouraged to study towards a professional qualification to support further their career development.
In addition to the existing programmes, we have launched a new ‘Guru’ Network designed to capture and share the knowledge of our internal experts who will be invited to facilitate internal learning and knowledge sharing sessions.
To ensure we keep developing and enhancing our pool of future leaders, we continue to run our annual Emerging Leaders programme. The programme focuses on individual leadership development, management and coaching skills in order to build a strong network of up and coming leaders.
We have also developed a new programme to build leadership capability across the organisation in line with our bespoke leadership framework.
Remuneration and benefitsWe believe in rewarding our staff fairly and transparently, ensuring that remuneration across the group is linked to clear objectives. This year, we have undertaken an extensive review of our executive Remuneration Policy to ensure it remains fit for purpose and aligned to both our distinctive business model and the long-term interests of our shareholders.
We also conducted a comprehensive review of our benefits package, introducing new and enhanced benefits, to support further our people in the areas that are most important to them. We assessed the impact of the benefits review as part of the latest employee survey and we are pleased that 80% of our employees reported their satisfaction with the enhanced benefits package.
To encourage our staff to save for the future and build long-term share ownership, we offer a Save As You Earn scheme as well as a Buy As You Earn share incentive plan allowing employees to acquire shares on a monthly basis out of pre-tax earnings. Currently 48% of our employees are participating in at least one of these schemes.
Diversity and equalityOur latest employee survey indicated that 89% of our people believe that Close Brothers treats their employees fairly regardless of gender, ethnicity or for any other diversity reasons.

Photographed on location at Piling Equipment Ltd.
Close Brothers Group plc Annual Report 201738
Sustainability Report continued
Our Equal Opportunity and Dignity at Work policy is in place to ensure equal and respectful treatment for all our employees. This includes additional support to disabled employees and their needs. We aim to make reasonable adjustments to the working environment to minimise potential difficulties and provide suitable training or offer alternative solutions where possible. This reflects our strong commitment to creating and promoting a diverse workforce, with focus on supporting all individuals irrespective of their gender, race, age, disability, sexual orientation or religion. We apply this approach
44% Female employees
38% Female board representation
• Leadership team leading by example, with our chief executive being a member of the 30% Club, an institution focused on promoting good gender balance at all levels in organisations. We participate in their cross-company mentoring scheme aimed at helping to develop a broader pipeline of women at all levels.
• Workshops aimed at raising awareness about unconscious bias and the benefits of supporting female talent.
• Implementing a new recruitment system which allows us to monitor the diversity of job applicants, to ensure that we are attracting potential candidates from a variety of backgrounds.
• Aiming for a 50:50 gender split at assessment centre for all entry-level roles across the group to broaden further the diversity of our talent pool.
Our workforce remains diverse, with 44% female employees, and we already meet the voluntary target set by the “Women on Boards Davies Review” and the Hampton-Alexander Review published in November 2016, which recommend a minimum of 33% female directors for FTSE 350 companies by 2020. Our 38% female representation significantly exceeds the current average female representation on FTSE 250 boards of 21%.
We also have a broad age range of employees with 26% of our employees being under 30 years old and 15% over 50.
Focus on our CustomersOur customers are typically small to medium-sized enterprises and individuals with whom we build lasting relationships. They know they can rely on our commitment to provide them with consistently high levels of service and in
across all our people related activities, including compensation review, talent and succession planning, leadership programmes, the development of our benefits package, recruitment, training and development.
Further initiatives that we have in place to support diversity include:• Enhanced maternity, adoption and
shared parental leave.• Promoting flexible working where
possible and providing emergency back up care.
Close Brothers Group plc Annual Report 201738
Sustainability Report continued

Close Brothers Group plc Annual Report 2017S
trategic R
epo
rt39
Gender Diversity Male Female
Number of board directors1 5 3Number of directors of subsidiaries2 46 8Number of senior employees, other than board directors3 47 8Number of employees, other than board directors and senior employees 1,655 1,3841 Includes non-executive directors, excluded from group headcount calculations. Figures as at 31 July 2017.2 Includes subsidiary directors who are excluded from group headcount calculations.3 Senior employees identified as Material Risk Takers who are not directors or subsidiary directors.
return they reward us with consistently high levels of repeat business.
We want to remain a trusted partner, by behaving ethically and responsibly in all our dealings with customers. We continuously listen to their feedback and are committed to improving their experience and expectations.
To this end we continue to run customer forums and surveys at both a divisional and business unit level so we understand and manage the changing needs and expectations of our customers. This is reflected in consistently high satisfaction levels amongst our Asset Management clients. In addition, we have built Centres of Excellence across the Banking division which focus on improving internal processes and enhancing customer experience.
Responsible financeWithin the Banking division, we focus on five key customer principles:• We are responsible lenders and
deposit takers.• We seek to ensure the right outcomes
for our customers.• We endeavour to ensure our pricing is
fair and appropriate.• We are clear and consistent in the way
we communicate with customers.• We expect our standards to be upheld
by our partners.
We regularly collect feedback on how we perform against these principles via customer and staff surveys, targeted research, complaints analysis and mystery shopping exercises.
In support of these customer principles we have a wide range of policies in place across all our divisions to ensure that our staff and management are aware of their responsibilities towards our customers. We promote best practice and strict compliance with relevant rules and regulations supported by a range of compulsory training for all employees.
Our conduct risk framework continues to include monthly management information that provides senior management with a broad view of conduct related behaviours. This management information is analysed and assessed each month to provide assurance that we treat customers fairly and continue to operate in line with our customer principles.
Our privacy policy ensures the protection and correct treatment of client data in accordance with the Data Protection Act 1998. During the year, we commenced our GDPR programme to ensure that we continue to meet high standards of protection and handling of personal data in line with the new regulatory requirements for May 2018.
We strive to ensure that our complaints handling process is as fair as possible and we continuously review and improve internal processes to deliver fast and satisfactory outcomes for our customers. We take all complaints seriously, with each division monitoring customer complaints separately, to ensure they are dealt with efficiently and promptly and that actions are taken to address issues at their root cause.
We have policies and training in place to ensure our staff can identify vulnerable customers and that they are treated fairly in our interaction with them. This remains an area of focus for our Customer Forums, through regular thematic reviews of our conduct.
We continue to monitor and enhance our systems and controls to safeguard customers’ data and protect our business and have invested over the year in expertise and technology to further strengthen our internal capabilities. We also remain a member of government’s Cyber Security Information Sharing Partnership, which provides early warning of potential system failure or cyber-attack and allows intelligence sharing across the industry.
Customer experienceAs we strive to maintain the highest standards in all our dealings with clients and partners, we continue to improve customer experience across all our businesses whether direct to customer or intermediated.
Over the year we developed capabilities within the Banking division which focus on data and analytics, customer insight and experience, and operational excellence, by recruiting small teams of experts, who operate across our businesses and help to improve and deliver changes to the way we operate. Over the year, they helped re-design customer journeys and corresponding operational processes in a number of areas.
As a recent example, we have reviewed the way in which our premium finance customers interact with our brokers through a programme of primary research and customer journey mapping. The data we gathered helped us develop new digital capabilities that will better serve both our customers and our brokers as they transact with us every day.
Our operational excellence team has worked closely with the businesses to identify areas of operations that can be easily improved to enhance customer experience. Through introduction of selective process automation we have proved that we can quickly and cost effectively address points of friction for customers while improving levels of consistency and control.
In addition we developed a comprehensive training programme designed to create a culture of continuous improvement across our organisation and recognise our people as they seek out ways to improve experience for customers, intermediaries and colleagues alike.
Close Brothers Group plc Annual Report 2017 39

Photographed on location at Alicat Workboats Ltd.
Close Brothers Asset Finance
Winner of the ‘Finance Provider of the Year’ at the Commercial Motor Dealer Awards.
Close Brothers Motor Finance
Winner of the ‘Bank owned Finance Provider of the year’ at the Motor Finance Europe Awards.
Close Brothers Asset Management
Winner of the ‘Investment Performance: Cautious Portfolios’ award for high net worth individuals.
Close Brothers Invoice Finance
Named the ‘UK’s Best Factoring & Invoice Discounting Provider’ at the Business Moneyfacts Awards, for the 4th year.
Close Brothers Retail Finance
Winner of the ‘New Product/Product Improvement’ category – Loving the customer.
Close Brothers Asset Management
Winner of the ‘Client Service Quality’ award for high net worth individuals.
Close Brothers Group plc Annual Report 201740
Sustainability Report continued
Our continued focus on improving customer experience is also reflected in consistently high customer survey results across our Asset Management division with 100% of customers across Bespoke Investment Management and 94% of customers across financial planning and advice expressing satisfaction with the services received. In addition, over 96% of our clients remain satisfied that their investment manager or financial adviser understands their needs.
The strong focus on our customers is further reflected in our many awards won during the year, some of which are presented on the left.
Social responsibilityCompliance with regulatory requirements is essential not only from the relevant regulator’s perspective but also to maintain the trust of our customers.
We have a wide range of policies in place across all of our divisions to ensure that our staff and management comply with all regulatory requirements and adhere to the highest professional and ethical standards in dealing with our customers, suppliers and each other. We require all staff to complete the relevant regulatory training on an annual basis with further training offered when required. Some of the group wide policies and regulations include:

Close Brothers Group plc Annual Report 2017S
trategic R
epo
rt41
We have introduced an online risk assessment process in order to manage site specific risks as appropriate and have implemented a new online Display Screen Equipment training and assessment process to assist our employees in effectively managing the hazards and risks associated with computer use.
Focus on our CommunitiesCommunity engagement is important to our people and their care and contribution to charitable matters is reflected in our active corporate and social responsibility (“CSR”) programme. To this end, we continue to invest in a number of community based initiatives and support the charitable causes that our employees are passionate about.
The group CSR Committee is chaired by our group head of human resources and supported by employees across the group. The CSR committee meets regularly to discuss and propose new initiatives with an oversight from risk and compliance when required. We also have a number of local CSR committees which run initiatives to raise funds for local charities.
Community initiativesThe Close Brothers SME Apprentice Programme continued the success of its first two years by launching phase three of the initiative. To date we have contributed to the funding of 40 new apprentices within the manufacturing sector in and around the Sheffield and Birmingham areas. This year, we are proud to be working with the Road Haulage Association (“RHA”) to launch a new initiative that addresses the skills gap within the transport sector by funding 20 SME members of the RHA, who might otherwise be unable to take on a new apprentice. This new partnership with the RHA cements our long established and continued commitment to help SMEs secure the skills they need for future growth.
Close Brothers Asset Management continues to run our Trustee Leadership Programme in partnership with social enterprise Cause 4. This programme provides a fulfilling and career enriching opportunity for young professionals to take on a board level role within a charity while also providing the charities themselves with a fresh and diverse pool of potential board members. The programme is open to Close Brothers employees as well as to external professionals. During the year we expanded the programme to Manchester and Bristol, following the successful launch in London in 2014.
Charitable activitiesOur employees are directly involved with choosing their favourite community and health charity partners as part of the regular employee survey. For the first time the NSPCC was selected as our community charity partner, while Cancer Research UK remained our health charity partner for the fifth year. Funds raised from group-wide activities is equally split between these two charities.
The group’s charitable donations reached £257,264 during the 2017 financial year.
£257,264Raised for charity in 2017
Our annual group-wide charity week, which consisted of a number of locally organised events for staff, as well as some group-wide initiatives, was the most successful ever. We have also collectively raised over £100,000 for Cancer Research in calendar year 2016, which has never been achieved by our group in just one year before. We are proud of this achievement as only a few of Cancer Research UK’s corporate partners reach this amount. Close Brothers is also the exclusive sponsor of a “Dogs for Good” assistance puppy, supporting the initial training for a future assistance dog.
In order to encourage further our staff to fundraise and volunteer for the charities they support, the Close Brothers Matched Giving Scheme matches 50% of funds raised or donates £8 per hour of voluntary time given by employees. We also match funds raised by other local, organised fundraising activities, encouraging employees to work together to raise money for causes that are close to their hearts. This year we matched over £100,000, an increase of nearly 50% compared to last year.
In addition, we match contributions under our Payroll Giving scheme, which allows employee donations to be made directly from pre-tax salary. Around 13% of employees across the group are signed up to Payroll Giving, allowing us to maintain our Payroll Giving Quality Mark Gold Award for the seventh consecutive year.
Anti-money laundering regulationsWe have implemented policies and procedures in accordance with anti-money laundering regulations and have dedicated money laundering reporting officers where required.
Anti-bribery and corruption policyWe operate a zero tolerance approach to bribery and corruption, ensuring compliance with all applicable anti-bribery and corruption laws and regulations, including the UK Bribery Act 2010.
Whistle-blowing policyWe encourage our employees to report any activity that may constitute a violation of laws, regulations or internal policy and reporting channels are provided to staff for this purpose within the framework of a whistle-blowing policy.
Our comprehensive whistle-blowing procedures comply with the new rules that came into effect in September 2016. We have enhanced the existing policies by an appointment of a whistle-blowers’ champion and a confidential telephone whistle-blowing service, operated by a third party provider.
Human rights and Modern Slavery ActThe board gives due regard to human rights considerations, as defined under the European Convention on Human Rights and the UK Human Rights Act 1998.
We are aware of our responsibilities and obligations under the Modern Slavery Act with the appropriate policies and training in place to ensure compliance across the organisation.
Employee health and safety policyOur health and safety policy ensures the provision of a safe and healthy working environment for our employees and visitors in accordance with The Management of Health and Safety at Work Regulations 1999.
The Health and Safety Committee continues to meet on a quarterly basis and we are proud of the progress made over the year in successfully raising the health and safety profile across the business. This year we recorded 31 incidents across all of our sites, of which the majority relate to low risk slip, trip or fall, with only two reportable accidents in the year.

Photographed on location at BCW Engineering Ltd.
Close Brothers Group plc Annual Report 201742
Sustainability Report continued
Focus on our EnvironmentAs a financial services company we require limited natural resources to operate and therefore have limited environmental impact. Notwithstanding this, we care about the environment we operate in and are aware of our responsibility to protect natural resources and to behave sustainably.
We also remain a significant provider of finance to the green energy sector by providing finance for wind, solar and hydro power developments.
Energy consumptionThe majority of our environmental impact is driven by staff travel, our supply chain and our office network. We continue to monitor ways to reduce our impact by lowering our energy consumption and reducing emissions. Each of our businesses manages its resources and recycling locally and we work closely with all of our business locations to encourage the implementation of additional ways to reduce energy use.
We continue to monitor our energy consumption and greenhouse gas emissions across the business via a third party provider. Our head office also participated in the CDP (formerly the “Carbon Disclosure Project”), which involves disclosure of our greenhouse gas emissions on a voluntary basis.
Our employees are encouraged to reduce their individual environmental impact by leasing of low emission cars and participating in the cycle to work scheme.
Consideration of environmental risks and ethical standards is explicitly required as part of any credit underwriting proposal under our bank Credit Policy. We only lend against asset types defined in our credit policies and don’t finance arms or onshore oil development, or lend internationally outside narrowly defined areas.
Waste reduction and recyclingWe have reduced water and electricity consumption at our head office for the second year and continue to monitor waste production via a third party provider. Waste recycling is encouraged in all our offices and in 2017 at our head office we achieved a recycling rate of 91%, avoiding 251 cubic metres of landfill and saving 195 trees.
Greenhouse gas (“GHG”) emissionsIn line with the GHG Protocol framework, we have calculated the GHG emissions associated with our Scope 1 and 2 operations. Scope 1 includes fuel emissions from buildings and company vehicles and Scope 2 includes our emissions from electricity.
We do not currently report our Scope 3 emissions as they form a small proportion (3%) of our total emissions and are not deemed to be material to our footprint. We do collect some Scope 3 data for water, waste and non-company vehicles (grey fleet) and we will continue to collect the data for Scope 3 emissions with the intention of reporting them in the future.

Close Brothers Group plc Annual Report 2017S
trategic R
epo
rt43
GHG Emissions Summary (tCO2e)Scope GHG emissions source 2017 2016
Scope 1 Fuel (Buildings) 172 160Fuel (Owned vehicles) 3,199 3,229
Scope 2 Electricity 3,269 3,341Total GHG emissions 6,640 6,730Average number of employees 3,114 2,946Total per employee 2.13 2.28
In 2017, our total GHG emissions were 6,640 tonnes of carbon dioxide equivalent (“tCO2e”), equating to 2.13 tCO2e per employee, down 1.3% overall and 6.7% per employee since 2016. We were pleased to achieve a reduction across both Scope 1 and Scope 2 emissions in 2017. The largest source of GHG emissions remains our Scope 2 electricity consumption, albeit this is lower than the previous year. The reduction in electricity emissions reflects energy efficiency improvements to our offices and a reduction in the emissions factor used to calculate electricity emissions.
Given its relative size our Banking division continues to account for the majority of our GHG emissions.
A full breakdown of our 2017 GHG emissions, together with corresponding data for 2016, is shown in the table above.
GHG Scope 1 and 2 Emissions by Division (tCO2e)
Banking AssetManagement
Group Securities
2017 2016
817
4,035 4,088
878811 977787 977
Note: “Group” reflects the group headquarters which includes some Banking division businesses.
CalculationWe have continued to gather data working with an independent third party GHG emissions reporting company. This verifies the accuracy of our data and enables us to monitor our performance.
Our total GHG emissions are reported as tCO2e and are calculated in line with the GHG Protocol framework. In addition to reporting our total Scope 1 and 2 emissions, we have also disclosed the emissions per employee as an intensity metric to enable a comparable analysis in future disclosures.
OutlookWe will continue to monitor and report our GHG emissions, working to improve our energy efficiency across our businesses.
We encourage our offices to report their Scope 3 emissions for water and waste each quarter, where this information is available, to facilitate continued performance monitoring.
The Strategic Report was approved by the board and signed on its behalf by:
Preben PrebensenChief Executive
26 September 2017
2.13tCO2e per employee, reduction of 7%

Close Brothers Group plc Annual Report 201744
Photographed on location at The Morgan Motor Company Ltd.
Because we operate in diverse business areas, our teams comprise of industry specialists, not just generalists. Many of our team have first-hand experience of working within their industry – this specialist knowledge helps us make fast, firm decisions.

Close Brothers Group plc Annual Report 2017G
overnance45
Governance46 Board of Directors48 Executive Committee50 Directors’ Report54 Corporate Governance Report62 Risk Committee Report64 Audit Committee Report67 Nomination and Governance
Committee Report69 Directors’ Remuneration Report

Close Brothers Group plc Annual Report 201746
Geoffrey HoweSenior Independent DirectorGeoffrey was appointed a director in January 2011 and is senior independent director. Geoffrey is chairman of Jardine Lloyd Thompson Group plc. He was previously chairman of Railtrack plc and of Nationwide Building Society, a non-executive director of Investec plc and of JP Morgan Overseas Investment Trust plc, a director of Robert Fleming Holdings Limited and managing partner of Clifford Chance.
Board of Directors
Mike BiggsChairmanMike was appointed a director on 14 March 2017 and chairman from 1 May 2017. He is chairman of the Nomination and Governance Committee. He has over 40 years’ experience of the financial services industry. He was previously chairman of Resolution Limited, the FTSE 100 UK life assurance business, and has acted as both chief executive officer and group finance director of Resolution plc. Prior to that he was group finance director of Aviva plc. Mike is also chairman of Direct Line Insurance Group plc. Elizabeth Lee
Group Head of Legal and Regulatory AffairsElizabeth was appointed a director in August 2012 with responsibility for legal and regulatory affairs. Elizabeth joined Close Brothers as general counsel in September 2009. She was previously with Lehman Brothers and General Electric’s financial services businesses and prior to that she was a partner at the law firm Richards Butler (now Reed Smith).
Jonathan Howell Group Finance DirectorJonathan was appointed to the board as group finance director in February 2008 when he joined Close Brothers. Jonathan was previously group finance director of London Stock Exchange Group plc from 1999. Prior to that he was at Price Waterhouse where he qualified as a chartered accountant. He is also a non-executive director of The Sage Group plc, where he is chairman of the audit committee.

Governance
Close Brothers Group plc Annual Report 2017 47
Preben PrebensenChief ExecutivePreben was appointed to the board as chief executive in April 2009 when he joined Close Brothers. Preben previously spent his career in a number of senior positions at JP Morgan over 23 years, as well as being chief executive of Wellington Underwriting plc from 2004 to 2006, and then chief investment officer and a member of the group executive committee at Catlin Group Limited. Preben is also a non-executive director of The British Land Company PLC.
Lesley JonesIndependent Non-executive DirectorLesley was appointed a director in December 2013 and is chairman of the Risk Committee. Lesley has extensive banking experience, having previously held several line management positions within Citigroup and was group chief credit officer of Royal Bank of Scotland plc from 2008 to 2014. Lesley is also a non-executive director of Northern Bank Limited and N Brown Group plc.
Oliver CorbettIndependent Non-executive DirectorOliver was appointed a director in June 2014 and is chairman of the Audit Committee. Oliver is chief financial officer of Hyperion Insurance Group Limited and was formerly finance director of LCH, Clearnet Group Limited and of Novae Group plc. He is a chartered accountant and previously worked for KPMG, SG Warburg, Phoenix Securities (later Donaldson Lufkin Jenrette) and Dresdner Kleinwort Wasserstein, where he was managing director of investment banking. Oliver was also a non-executive director of Rathbone Brothers plc.
Bridget Macaskill Independent Non-executive DirectorBridget was appointed a director in November 2013 and is chairman of the Remuneration Committee. Bridget is chairman of First Eagle Holdings LLC and senior adviser to First Eagle Investment Management LLC in New York City, of which she was president and chief executive officer until March 2016. She is also a trustee of the TIAA-CREF funds and a non-executive director of Jupiter Fund Management plc and of Jones Lang LaSalle Incorporated. Bridget was previously a non-executive director of Prudential plc, Scottish & Newcastle plc, J Sainsbury plc, Hillsdown Holdings plc and of the Federal National Mortgage Association in the US.

Close Brothers Group plc Annual Report 201748
Executive Committee
Preben PrebensenChief Executive
Elizabeth LeeGroup Head of Legal and Regulatory Affairs
Jonathan HowellGroup Finance Director
Martin AndrewAsset Management Chief Executive
Rebekah EtheringtonGroup Head of Human Resources

Close Brothers Group plc Annual Report 2017G
overnance49
Adrian SainsburyBanking division Managing Director
Tazim EssaniGroup Head of Corporate Development
Robert SackGroup Chief Risk Officer
Philip YarrowWinterflood Chief Executive
Mike MorganBanking division Chief Financial Officer

Close Brothers Group plc Annual Report 201750
Directors’ Report
The directors of the company present their report for the year ended 31 July 2017.
The Strategic Report set out on pages 3 to 43 of this Annual Report, and Corporate Governance Report, committee reports and the Directors’ Remuneration Report set out on pages 54 to 95 of this Annual Report include information that would otherwise need to be included in this Directors’ Report. Relevant items are referred to below and incorporated by reference into this report. Readers are also referred to the cautionary statement on page 152 of this Annual Report.
Results and DividendsThe consolidated results for the year are shown on page 102 of the Financial Statements. The directors recommend a final dividend for the year of 40p (2016: 38p) on each ordinary share which, together with the interim dividend of 20p (2016: 19p), makes an ordinary distribution for the year of 60p (2016: 57p) per share. The final dividend, if approved by shareholders at the 2017 Annual General Meeting (“AGM”), will be paid on 21 November 2017 to shareholders on the register at 13 October 2017.
DirectorsThe names of the directors of the company at the date of this report, together with biographical details, are given on pages 46 and 47 of this Annual Report. In accordance with the UK Corporate Governance Code, all directors will retire at the 2017 AGM and offer themselves for reappointment at that meeting.
All the directors listed on pages 46 and 47 were the directors of the company throughout the year apart from Mike Biggs, who was appointed as a director on 14 March 2017, and Strone Macpherson and Stephen Hodges, who retired as directors on 30 April 2017 and 17 November 2016, respectively.
Further details on the directors’ remuneration and service contracts or appointment letters (as applicable) can be found in the Directors’ Remuneration Report on pages 80 and 81 of this Annual Report.
Directors’ interestsThe directors’ interests in the share capital and listed debt instruments of the company as at 31 July and 16 September 2017 are set out on pages 92 and 94 of the Directors’ Remuneration Report.
Powers and appointment of directors The company’s articles of association set out the powers of the directors, and rules governing the appointment and removal of directors. The articles of association can be viewed at www.closebrothers.com. Further details on the powers, and appointment and removal of directors are set out in the Corporate Governance Report on page 57 of this Annual Report.
Directors’ indemnities and insuranceIn accordance with its articles of association, the company has granted a deed of indemnity to each of its directors on terms consistent with the applicable statutory provisions. The deeds indemnify the directors in respect of liabilities (and associated costs and expenses) incurred in connection with the performance of their duties as a director of the company or any associated company. Qualifying third party indemnity provisions for the purposes of section 234 of the Companies Act 2006 were accordingly in force during the course of the year, and remain in force at the date of this report. The
company also maintains directors’ and officers’ liability insurance for its directors and officers.
Share CapitalThe company’s share capital comprises one class of ordinary share with a nominal value of 25p per share. At 31 July 2017, 152,060,290 ordinary shares were in issue.
Under section 551 of the Companies Act 2006, the directors may allot equity securities only with the express authorisation of shareholders which may be given in general meeting, but which cannot last more than five years. Under section 561 of the Companies Act, the board may not allot shares for cash (otherwise than pursuant to an employee share scheme) without first making an offer to existing shareholders to allot such shares to them on the same or more favourable terms in proportion to their respective shareholdings, unless this requirement is waived by a special resolution of the shareholders.
At the company’s 2016 AGM, the directors were authorised to:• allot shares in the company or grant rights to subscribe for,
or convert, any security into shares up to an aggregate nominal amount of £12,497,366;
• allot shares up to an aggregate nominal amount of £24,994,732, for the purposes of a rights issue;
• allot shares having a nominal amount not exceeding in aggregate £1,874,604 for cash without offering the shares first to existing shareholders in proportion to their holdings;
• allot shares having a nominal amount not exceeding £3,749,209 for the purpose of financing a transaction determined by the directors to be an acquisition or other capital investment as defined by the Statement of Principles on Disapplying Pre-Emption Rights published by the Pre-Emption Group; and
• make market purchases of up to 14,996,836 of the company’s ordinary shares, representing 10% of the company’s issued share capital at the time.
The existing authorities given to the company at the last AGM to allot and purchase shares will expire at the conclusion of the forthcoming AGM. Details of the resolutions to be proposed renewing these authorities will be included in the Notice of AGM.
New issues of share capitalDuring the year the company’s issued share capital increased by 1,416,562 ordinary shares of 25p each. This increase occurred through the allotment and issue of 1,416,562 ordinary shares in connection with the acquisition of Novitas Loans Limited (“Novitas”), as previously announced by the company on 4 May 2017. The shares were allotted and issued on 4 May 2017 at the market price on a non-pre-emptive basis to the sellers of Novitas pursuant to authorities granted to the directors of the company at the company’s 2016 AGM. As a result of the issue, the company’s issued share capital increased by 0.94%. In the three year period prior to the issue, the company did not issue any other shares for cash on a non-pre-emptive basis pursuant to disapplications of pre-emption rights approved by shareholders.
No ordinary shares were allotted and issued to satisfy option exercises. Full details of options exercised, the weighted average option exercise price and the weighted average market price at the date of exercise can be found in note 25 on page 134 of the Financial Statements.

Close Brothers Group plc Annual Report 2017G
overnance51
Proposed cancellation of the company’s share premium accountAt the forthcoming AGM, the board intends to ask shareholders to approve a special resolution to cancel the company’s share premium account in order to increase the company’s distributable reserves. This will provide greater flexibility for the paying of ordinary course dividends which the board may in the future wish to make or recommend in accordance with the company’s established dividend policy. The cancellation will, subject to approval by shareholders and confirmation by the High Court, increase the company’s distributable reserves by around £307 million. The cancellation itself will not involve any return of capital to shareholders. Further details will be set out in the Notice of AGM sent to the company’s shareholders.
Rights attaching to sharesThe company’s articles of association set out the rights and obligations attaching to the company’s ordinary shares. All of the ordinary shares rank equally in all respects.
On a show of hands, each member has the right to one vote at general meetings of the company. On a poll, each member would be entitled to one vote for every share held. The shares carry no rights to fixed income. No person has any special rights of control over the company’s share capital and all shares are fully paid.
The articles of association and applicable legislation provide that the company can decide to restrict the rights attaching to ordinary shares in certain circumstances (such as the right to attend or vote at a shareholders’ meeting), including where a person has failed to comply with a notice issued by the company under section 793 of the Companies Act 2006.
Deadline for voting rights Full details of the deadlines for exercising voting rights in respect of the resolutions to be considered at the AGM, to be held on 16 November 2017, will be set out in the Notice of AGM.
Restrictions on the transfer of sharesThere are no specific restrictions on the transfer of the company’s shares which are governed by the general provisions of the articles of association and prevailing legislation. The articles of association set out certain circumstances in which the directors of the company can refuse to register a transfer of ordinary shares.
Directors and employees of the group are required to comply with applicable legislation relating to dealing in the company’s shares as well as the company’s share dealing rules. These rules restrict employees’ and directors’ ability to deal in ordinary shares at certain times, and require the employee or director to obtain permission prior to dealing. Some of the group’s employee share plans also contain restrictions on the transfer of shares held within those plans.
The company is not aware of any arrangements between its shareholders that may result in restrictions on the transfer of shares and/or voting rights.
Purchase of Own SharesUnder section 724 of the Companies Act 2006 a company may purchase its own shares to be held in treasury (“Treasury Shares”).
The existing authority given to the company at the last AGM to purchase Treasury Shares of up to 10% of its issued share capital will expire at the conclusion of the next AGM.
The board considers it would be appropriate to renew this authority and intends to seek shareholder approval to purchase Treasury Shares of up to 10% of its issued share capital at the forthcoming AGM in line with current investor sentiment.
Details of the resolution renewing the authority will be included in the Notice of AGM.
Awards under the company’s employee share plans are met from a combination of shares purchased in the market (and held either in treasury or in the employee share trust) as well as by newly issued shares.
During the year the company made no market purchases of Treasury Shares. It transferred 374,583 shares out of treasury, to satisfy share option awards, for a total consideration of £3.7 million. The maximum number of Treasury Shares held at any time during the year was 677,826, with a nominal value of £0.2 million.
Employee Share TrustOcorian Trustees (Jersey) Limited is the trustee of the Close Brothers Group Employee Share Trust, an independent trust, which holds shares for the benefit of employees and former employees of the group. The trustee has agreed to satisfy a number of awards under the employee share plans. As part of these arrangements the company funds the trust, from time to time, to enable the trustee to acquire shares to satisfy these awards, details of which are set out in note 25 on pages 134 and 135 of the Financial Statements. The trustee has waived its right to dividends on all shares held within the trust.
During the year, the employee share trust made market purchases of 918,141 ordinary shares.
Substantial ShareholdingsDetails on substantial shareholdings in the company are set out on in the Corporate Governance Report on page 61 of this Annual Report.
Articles of AssociationThe company’s articles of association were last amended in November 2009. They may only be amended by a special resolution of the company’s shareholders. The articles of association can be viewed at www.closebrothers.com.
Corporate Governance StatementThe company is required by the Disclosure Guidance and Transparency Rules to prepare a corporate governance statement including certain specified information. Information fulfilling the requirements of the corporate governance statement can be found in this Directors’ Report, and the Corporate Governance Report, committee reports and Directors’ Remuneration Report on pages 54 to 95 of this Annual Report. This information is incorporated by reference into this Directors’ Report.
Strategic ReportThe company’s Strategic Report can be found on pages 3 to 43 of this Annual Report.

Close Brothers Group plc Annual Report 201752
Business activitiesThe group’s business activities, together with a description of future developments (including the factors likely to affect future development and performance) and its summarised financial position, are set out in the Strategic Report.
Employment practices and greenhouse gas emissionsInformation on the company’s employment practices (including with respect to disabled employees and employee involvement) and greenhouse gas emissions is set out in the Sustainability Report on pages 36 to 43 of the Strategic Report.
Significant Agreements Affected by a Change of ControlA change of control of the company, following a takeover bid, may cause a number of agreements to which the company is party to take effect, alter or terminate. These include certain insurance policies, bank facility agreements and employee share plans.
The group had committed facilities totalling £1.4 billion at 31 July 2017, which contain clauses which require lender consent for any change of control. Should consent not be given, a change of control would trigger mandatory repayment of those facilities.
All of the company’s employee share plans contain provisions relating to a change of control. Outstanding awards and options may vest and become exercisable on a change of control, subject where appropriate to the satisfaction of any performance conditions at that time and pro-rating of awards.
Financial InstrumentsDetails of the group’s financial instruments can be found in notes 10 to 13, 17 to 19 and 27 to the financial statements. The notes begin on page 109.
Financial Risk ManagementThe group has procedures in place to identify, monitor and evaluate the significant risks it faces. The group’s risk management objectives and policies are described on pages 59 and 60, and the risks associated with the group’s financial instruments are analysed in note 27 on pages 137 to 148 of the Financial Statements.
Post-Balance Sheet EventsThere were no material post-balance sheet events.
Political DonationsNo political donations were made during the year (2016: £nil).
Disclosure of Information Under Listing Rule 9.8.4RAs required by Listing Rule 9.8.4CR, the table below sets out the location of information required to be disclosed under Listing Rule 9.8.4R:
Subject Page
Non-pro rata allotments for cash
See the section headed “New issues of share capital” on page 50
Details of shareholder dividend waivers
See the section headed “Employee Share Trust” on page 51
Resolutions at the 2017 AGMThe company’s AGM will be held on 16 November 2017. Resolutions to be proposed at the AGM include the renewal of the directors’ authority to allot shares, the disapplication of pre-emption rights, authority for the company to purchase its own shares, the reappointment of the directors and the appointment of PricewaterhouseCoopers LLP (“PwC”) as the auditor of the group. As described further on page 51, the directors intend to ask shareholders to approve a special resolution to cancel the company’s share premium account.
The full text of each of the resolutions to be proposed at the 2017 AGM will be set out in the Notice of AGM sent to the company’s shareholders. A letter from the chairman and explanatory notes will accompany the Notice of AGM.
AuditorFollowing a competitive tender process, the board (following a recommendation from the Audit Committee) has recommended that PwC be appointed as the group’s auditor with effect from the 2017 AGM, at which resolutions concerning PwC’s appointment and authorising the directors to set their remuneration will be proposed. Further information on the tender process can be found in the Audit Committee Report on page 66. The full text of the relevant resolutions will be set out in the Notice of AGM sent to the company’s shareholders.
Disclosure of Information to the AuditorEach of the persons who are directors at the date of approval of this Annual Report confirms that:• so far as the director is aware, there is no relevant audit
information of which the company’s auditor is unaware; and• they have taken all the steps that they ought to have taken as
a director in order to make themselves aware of any relevant audit information and to establish that the company’s auditor is aware of that information.
This confirmation is given and should be interpreted in accordance with the provisions of section 418 of the Companies Act 2006.
Going ConcernThe group has a strong, proven and conservative business model and has traded profitably during the year. It is well positioned in each of its core businesses, well capitalised, soundly funded and has adequate access to liquidity.
After making enquiries, the directors have a reasonable expectation that the company and the group have adequate resources to continue in operational existence for the foreseeable future. Accordingly, they continue to adopt the going concern basis in preparing the Annual Report.
Viability StatementIn accordance with provision C.2.2 of the UK Corporate Governance Code, the board confirms that it has a reasonable expectation that the group will continue to operate and meet its liabilities, as they fall due, for the three year period up to 31 July 2020. A three year timeframe has been chosen because it is the period covered by the group’s strategic planning cycle. It is also the period covered by the Internal Capital Adequacy Assessment Process (“ICAAP”), which forecasts key capital requirements and other group-wide internal stress testing.
Directors’ Report continued

Close Brothers Group plc Annual Report 2017G
overnance53
The directors’ assessment has been made with reference to:• the group’s current position and prospects – please see the
Financial Overview on pages 20 to 25;• the group’s business model and strategy – please see
Business Model, and Strategy and Key Performance Indicators on pages 10 to 15; and
• the board’s risk appetite, and the robust assessment of the group’s principal risks and how these are managed, including the results of the ICAAP – please see Risk and Control Framework on page 59.
The directors review the group’s strategy and three year plan on an annual basis. The plan considers the group’s future projections of profitability, cash flows, capital requirements and resources and other key financial and regulatory ratios over the period.
The directors also review the group’s principal risks and ICAAP on an annual basis, including the results of two separate ICAAP stress scenarios.
Directors’ responsibility statementThe directors, who are named on pages 46 and 47, are responsible for preparing the Annual Report and the financial statements in accordance with applicable law and regulations.
Company law requires the directors to prepare financial statements for each financial year. Under that law the directors are required to prepare the group financial statements in accordance with International Financial Reporting Standards (“IFRSs”) as adopted by the European Union and Article 4 of the IAS Regulation. The directors have elected to prepare the parent company financial statements in accordance with United Kingdom Generally Accepted Accounting Practice (United Kingdom Accounting Standards and applicable law), including FRS 102 “The Financial Reporting Standard applicable in the UK and Republic of Ireland”. Under company law the directors must not approve the accounts unless they are satisfied that they give a true and fair view of the state of affairs of the company and of the profit or loss of the company for that period.
In preparing the parent company financial statements, the directors are required to:• select suitable accounting policies and then apply them
consistently;• make judgements and accounting estimates that are
reasonable and prudent;• state whether applicable UK Accounting Standards have
been followed, subject to any material departures disclosed and explained in the financial statements; and
• prepare the financial statements on the going concern basis unless it is inappropriate to presume that the company will continue in business.
In preparing the group financial statements, International Accounting Standard 1 requires that directors:• properly select and apply accounting policies;• present information, including accounting policies, in a
manner that provides relevant, reliable, comparable and understandable information;
• provide additional disclosures when compliance with the specific requirements in IFRSs are insufficient to enable users to understand the impact of particular transactions, other events and conditions on the entity’s financial position and financial performance; and
• make an assessment of the company’s ability to continue as a going concern.
The directors are responsible for keeping adequate accounting records that are sufficient to show and explain the company’s transactions and disclose with reasonable accuracy at any time the financial position of the company and enable them to ensure that the financial statements comply with the Companies Act 2006. They are also responsible for safeguarding the assets of the company and hence for taking reasonable steps for the prevention and detection of fraud and other irregularities.
The directors are responsible for the maintenance and integrity of the corporate and financial information included on the company’s website. Legislation in the UK governing the preparation and dissemination of financial statements may differ from legislation in other jurisdictions.
Each of the directors confirms that to the best of their knowledge:• the financial statements, prepared in accordance with the
relevant financial reporting framework, give a true and fair view of the assets, liabilities, financial position and profit or loss of the company and the undertakings included in the consolidation taken as a whole;
• the Strategic Report, together with the Directors’ Report and the Corporate Governance Report, include a fair review of the development and performance of the business and the position of the company and the undertakings included in the consolidation taken as a whole, together with a description of the principal risks and uncertainties that they face; and
• the Annual Report and financial statements, taken as a whole, are fair, balanced and understandable and provide the information necessary for shareholders to assess the group’s performance, business model and strategy.
By order of the Board
Alex DunnCompany Secretary
26 September 2017

Close Brothers Group plc Annual Report 201754
Corporate Governance Report
In my first year as Chairman and on behalf of the board, I am pleased to introduce the Corporate Governance section of this Annual Report. The pages that follow provide detail on the group’s governance structure and activities undertaken during the year to ensure effective board decision-making and oversight of the group.
Chairman’s IntroductionAn important part of my role as Chairman is to oversee the governance of the group. I firmly believe that high standards of governance and effective board oversight are important to the group’s performance, the successful delivery of its strategy and the creation of long-term value for the company’s stakeholders.
The board is committed to the principles set out in the UK Corporate Governance Code and I am pleased to report that, once again, the company has complied with the principles and provisions of the Code. Further details are set out in the Corporate Governance Report that follows this introduction.
The board oversees the strategy and business model of the group, and directors have the opportunity to challenge group and divisional executives on performance and the implementation of strategy at each board meeting. The board also spends considerable time throughout the year assessing and discussing external challenges facing the group, including regulatory, economic and political developments.
There were seven regular meetings of the board during the year. Strategic matters were discussed as part of these meetings and, in addition, the board once again attended separate strategy sessions with executive management focused on considering and reviewing the group’s long-term strategy.
The board’s four committees have continued to play an important role in the governance and oversight of the group. Reports from each of the committees, describing their activities during the year, are set out later in this section of the Annual Report.
The board saw a number of changes to its composition in the year with the retirements of Stephen Hodges in November 2016 and Strone Macpherson in April 2017. Once again, I would like to thank Stephen and Strone for their significant contributions to the development of the group over many
years. During the year, the Nomination and Governance Committee oversaw the process which resulted in my appointment as a director and then chairman of the company. Further details on that process are set out in the report of the Nomination and Governance Committee.
Also in this section of the Annual Report you will find the Directors’ Remuneration Report, setting out various disclosures required by statute, regulation or corporate governance best practice. Following a review by the Remuneration Committee during the year and after wide consultation with our larger shareholders and institutional investor bodies, we also set out the new Remuneration Policy, for which we will be seeking shareholder approval at this year’s Annual General Meeting.
During the year, the board carried out an internal evaluation of its effectiveness and performance. The results found that the board and its four committees continue to function effectively and make a strong contribution to the leadership and development of the group. Further details of this evaluation can be found on page 58.
The company’s 2017 Annual General Meeting will take place on 16 November 2017. The board regards this as an important opportunity for shareholders to raise questions. This will be my first AGM as Chairman and I look forward to discussing the group and the work of the board with shareholders at that meeting.
Michael N. BiggsChairman
26 September 2017
Mike Biggs, Chairman

Close Brothers Group plc Annual Report 2017G
overnance55
UK Corporate Governance CodeIn April 2016, the Financial Reporting Council (“FRC”) published a revised version of the UK Corporate Governance Code (the “Code”) which applies to accounting periods beginning on or after 17 June 2016. The financial year ending 31 July 2017 is therefore the first year for which the new version of the Code has applied to the company.
The Code sets out guidance on best practice in the form of principles and provisions on how companies should be directed and controlled to follow good governance practice. The Financial Conduct Authority (“FCA”) requires companies with a premium listing in the UK to disclose, in relation to the Code, how they have applied its principles and whether they have complied with its provisions throughout the financial year. Where the provisions have not been complied with, companies must provide an explanation.
It is the board’s view that throughout the financial year the company has complied with the principles and provisions set out in the Code. Further detail as to how the company has complied with the Code is set out in the remainder of this Corporate Governance Report.
A copy of the Code can be found on the FRC’s website: www.frc.org.uk.
The BoardLeadership of the boardThe board’s primary role is to provide leadership, and ensure that the company is appropriately managed and delivers long-term shareholder value. It sets the group’s strategic objectives, monitors management’s performance against those objectives and provides direction for the group as a whole. The board supervises the group’s operations, with the aim of ensuring that it maintains a framework of prudent and effective controls which enables risks to be properly assessed and appropriately managed.
Board size and compositionThe board has eight members: the chairman, three executive directors and four independent non-executive directors.
The structure of the board ensures that no individual or group of individuals is able to dominate the decision-making process and no undue reliance is placed on any individual. The board comprises five male and three female members. This means that more than a third of the directors are women. The company is committed to ensuring that any vacancies that may arise are filled by the most qualified candidates and recognises the value of diversity in the composition of the board. When board positions become available as a result of retirement, resignation or otherwise, it is focused on ensuring that a diverse pool of candidates is considered.
Details of the individual directors and their biographies are set out on pages 46 and 47.
Non-executive directors’ independenceThe board has assessed the independence of each of the non-executive directors and is of the opinion that each acts in an independent and objective manner and therefore, under the Code, is independent and free from any relationship that could affect their judgement. The board’s opinion was determined by considering for each non-executive director, among other things:
• whether they are independent in character and judgement;• how they conduct themselves in board and committee
meetings;• whether they have any interests which may give rise to an
actual or perceived conflict of interest; and• whether they act in the best interests of the company and of
all its shareholders at all times.
The company has therefore complied with the Code provision that at least half the board, excluding the chairman, should comprise independent non-executive directors. Each non-executive director is required to confirm at least annually whether any circumstances exist which could impair their independence.
Matters Reserved to the BoardA number of key matters are reserved for consideration and decision by the board. The matters and decisions reserved for the board are set out in a formal schedule, which enables the board and executive management to operate within a clear governance framework. The schedule of matters reserved to the board is reviewed annually and is published on the company’s website. The matters and decisions specifically reserved for the board include:• responsibility for the overall direction of the group and
oversight of the group’s management;• approval of the group’s strategic aims and objectives;• oversight of risk management, regulatory compliance and
internal control;• approving the group’s Recovery and Resolution Plans, and
the Internal Capital Adequacy Assessment Process (“ICAAP”);
• changes to the group’s dividend policy and significant changes in accounting policies;
• approving acquisitions, disposals, other transactions and expenditure over certain thresholds;
• changes to the capital structure of the group;• approval of communications to shareholders;• changes to the structure, size and composition of the board,
following recommendations from the Nomination and Governance Committee; and
• approval of corporate governance matters, including the evaluation of the performance of the board and its committees.
Board and committee meeting attendance 2016/2017During the year the board held seven scheduled meetings.
The annual schedule of board meetings is decided a substantial time in advance in order to ensure, so far as possible, the availability of each of the directors. In the event that directors are unable to attend meetings, they receive papers in the normal manner and have the opportunity to relay their comments and questions in advance of the meeting, as well as follow up with the chairman if necessary. The same process applies in respect of the various board committees.
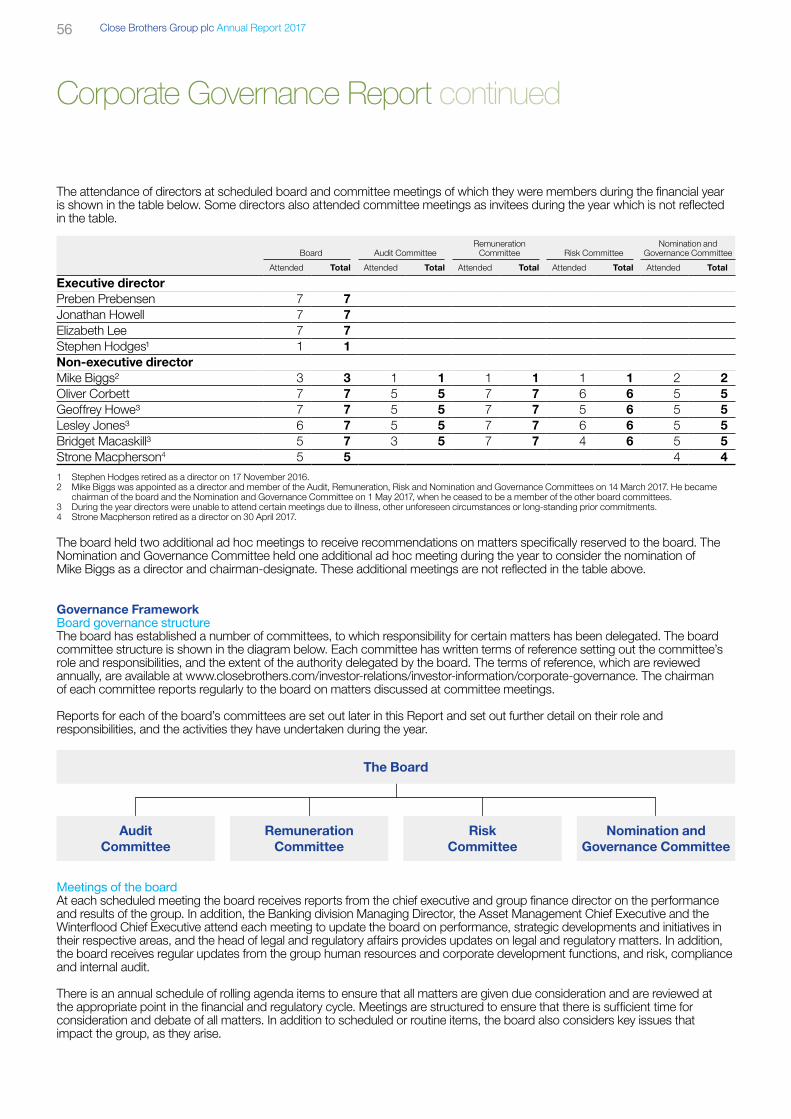
Close Brothers Group plc Annual Report 201756
Corporate Governance Report continued
Governance FrameworkBoard governance structureThe board has established a number of committees, to which responsibility for certain matters has been delegated. The board committee structure is shown in the diagram below. Each committee has written terms of reference setting out the committee’s role and responsibilities, and the extent of the authority delegated by the board. The terms of reference, which are reviewed annually, are available at www.closebrothers.com/investor-relations/investor-information/corporate-governance. The chairman of each committee reports regularly to the board on matters discussed at committee meetings.
Reports for each of the board’s committees are set out later in this Report and set out further detail on their role and responsibilities, and the activities they have undertaken during the year.
The Board
Audit Committee
Remuneration Committee
Risk Committee
Nomination and Governance Committee
The attendance of directors at scheduled board and committee meetings of which they were members during the financial year is shown in the table below. Some directors also attended committee meetings as invitees during the year which is not reflected in the table.
Board Audit CommitteeRemuneration
Committee Risk CommitteeNomination and
Governance Committee
Attended Total Attended Total Attended Total Attended Total Attended Total
Executive directorPreben Prebensen 7 7Jonathan Howell 7 7Elizabeth Lee 7 7Stephen Hodges1 1 1Non-executive directorMike Biggs2 3 3 1 1 1 1 1 1 2 2Oliver Corbett 7 7 5 5 7 7 6 6 5 5Geoffrey Howe3 7 7 5 5 7 7 5 6 5 5Lesley Jones3 6 7 5 5 7 7 6 6 5 5Bridget Macaskill3 5 7 3 5 7 7 4 6 5 5Strone Macpherson4 5 5 4 4
1 Stephen Hodges retired as a director on 17 November 2016. 2 Mike Biggs was appointed as a director and member of the Audit, Remuneration, Risk and Nomination and Governance Committees on 14 March 2017. He became
chairman of the board and the Nomination and Governance Committee on 1 May 2017, when he ceased to be a member of the other board committees.3 During the year directors were unable to attend certain meetings due to illness, other unforeseen circumstances or long-standing prior commitments.4 Strone Macpherson retired as a director on 30 April 2017.
The board held two additional ad hoc meetings to receive recommendations on matters specifically reserved to the board. The Nomination and Governance Committee held one additional ad hoc meeting during the year to consider the nomination of Mike Biggs as a director and chairman-designate. These additional meetings are not reflected in the table above.
Meetings of the boardAt each scheduled meeting the board receives reports from the chief executive and group finance director on the performance and results of the group. In addition, the Banking division Managing Director, the Asset Management Chief Executive and the Winterflood Chief Executive attend each meeting to update the board on performance, strategic developments and initiatives in their respective areas, and the head of legal and regulatory affairs provides updates on legal and regulatory matters. In addition, the board receives regular updates from the group human resources and corporate development functions, and risk, compliance and internal audit.
There is an annual schedule of rolling agenda items to ensure that all matters are given due consideration and are reviewed at the appropriate point in the financial and regulatory cycle. Meetings are structured to ensure that there is sufficient time for consideration and debate of all matters. In addition to scheduled or routine items, the board also considers key issues that impact the group, as they arise.

Close Brothers Group plc Annual Report 2017G
overnance57
The directors receive detailed papers in advance of each board meeting. The board agenda is carefully structured by the chairman in consultation with the chief executive and the company secretary. Each director may review the agenda and propose items for discussion with the chairman’s agreement. Additional information is also circulated to directors between meetings, including relevant updates on business and regulatory announcements.
Each board meeting includes time for discussion between the chairman and non-executive directors without the executive directors.
Key board activities during the yearDuring the year, the board has spent time particularly on:• considering the strategic aims of businesses across the
Banking division and the Asset Management division and Winterflood;
• IT strategy and associated transformation projects;• capital planning and the implications of regulatory changes
during the year;• consideration and approval of the company’s issue of
callable dated subordinated notes (tier 2 capital);• reviewing the competitive landscape;• engagement with regulators;• consideration of employee survey results;• the review of the group’s Recovery and Resolution Plans;• the annual review of group risk appetite statements;• approval of the ICAAP; and• the annual board and committee effectiveness evaluation.
Chairman and chief executiveThe roles of the chairman and chief executive are separate and there is a clear division of responsibilities between the two roles. The chairman is Mike Biggs. His other significant commitments are set out in his biography on page 46. The board is satisfied that his other commitments do not restrict him from carrying out his duties effectively.
As chairman, Mike Biggs is primarily responsible for leading the board and ensuring the effective engagement and contribution of all the directors. His other responsibilities include setting the agenda for board meetings, providing the directors with information in an accurate, clear and timely manner and the promotion of effective decision-making. The chairman is also charged with ensuring that the directors continually update their skills and knowledge and that the performance of the board, its committees and the individual directors is evaluated on an annual basis.
The chief executive is Preben Prebensen, who is primarily responsible for the day-to-day management of the group’s business. His other responsibilities include proposing and developing strategic objectives for the group, managing the group’s risk exposures in line with board policies, implementing the decisions of the board and facilitating appropriate and effective communication with shareholders and regulatory bodies.
Preben Prebensen chairs the Executive Committee, the forum that exercises management oversight of the group, including through the monitoring and implementation of strategy and budgetary objectives, as determined by the board. The members of the Executive Committee are shown on pages 48 and 49.
Independent non-executive directorsThe company’s independent non-executive directors are Geoffrey Howe, Oliver Corbett, Lesley Jones and Bridget Macaskill. Within the board’s overall risk and governance structure, the independent non-executive directors are responsible for contributing sound judgement and objectivity to the board’s deliberations and the decision-making process. They also provide constructive challenge and oversight, and monitor the executive directors’ delivery of the company’s strategy.
Senior independent directorThe senior independent director is Geoffrey Howe. In addition to the existing channels for shareholder communications, shareholders may discuss any issues or concerns they may have with the senior independent director. The senior independent director leads the annual performance evaluation of the chairman’s performance. During the last year, Geoffrey led the Nomination and Governance Committee’s process to identify a replacement for Strone Macpherson as chairman of the board. Further details on that process are included in the Nomination and Governance Committee’s report on page 67.
Powers of directorsThe directors are responsible for the management of the company. They may exercise all powers of the company, subject to any directions given by special resolution and the articles of association. The directors have been authorised to allot and issue ordinary shares and to make market purchases of the company’s ordinary shares by virtue of resolutions passed at the company’s 2016 AGM. Further detail regarding these authorisations is set out on page 50.
Appointment and removal of directorsThe appointment of directors is governed by the company’s articles of association, the Companies Act 2006 and other applicable regulations and policies. Directors may be elected by shareholders in general meeting or appointed by the board of directors in accordance with the provisions of the articles of association.
In accordance with the Code, all directors retire and submit themselves for reappointment at each AGM. The board will only recommend to shareholders that executive and non-executive directors be proposed for reappointment at an AGM after evaluating the performance of the individual directors.
Letters of appointment for individual directors are available for inspection by shareholders at each AGM and during normal business hours at the company’s registered office.
The articles of association provide that in addition to any power to remove directors conferred by the Companies Act 2006, the company’s shareholders can pass a special resolution to remove a director from office.
Reappointment of directors at the 2017 AGMFollowing performance evaluations undertaken during the year, the board has confirmed that each director continues to be effective and demonstrate commitment to their role. On the recommendation of the Nomination and Governance Committee, the board will therefore be recommending that all serving directors be reappointed by shareholders at the 2017 AGM.

Close Brothers Group plc Annual Report 201758
Corporate Governance Report continued
Induction and professional developmentOn appointment, all new directors receive a comprehensive and personalised induction programme to familiarise them with the group and to meet their specific requirements. The company also provides bespoke inductions for directors when they are appointed as a committee chairman. Induction programmes are tailored to a director’s particular requirements, but would typically include site visits, one-to-one meetings with executive directors, the company secretary, senior management for the business areas and support functions and a confidential meeting with the external auditor. Directors also receive guidance on directors’ liabilities and responsibilities.
Mike Biggs has undertaken a tailored induction following his appointment as a director and then chairman of the board in order to provide a comprehensive insight into the group and the regulatory framework within which it operates. This has included meetings and briefings with members of the Executive Committee and other management on a range of topics, including the group’s businesses, the risk management framework, regulatory and compliance issues and the group’s internal audit function.
There is a central training programme in place for the directors, which is reviewed and considered by the board. In addition, the chairman discusses and agrees any specific requirements as part of each non-executive director’s regular reviews. During the year, training and development activities took a number of forms, including informal meetings with senior management within the businesses and control functions, lunches with emerging leaders and with members of the group’s graduate and Aspire programmes, in-depth business reviews, attendance at external seminars and briefings from management and external advisers covering topics such as corporate governance updates, regulatory developments, changes in remuneration regulation and practice, accounting changes and risk modelling.
Training and development records are maintained by the company secretary and reviewed annually by the chairman and each individual director.
Company secretaryThe company secretary is responsible for ensuring that board procedures and applicable rules and regulations are observed. He is responsible for advising the board, through the chairman, on all governance matters. All directors have direct access to the services and advice of the company secretary, who also acts as secretary to each of the board committees. Directors are able to take independent external professional advice to assist with the performance of their duties at the company’s expense.
Conflicts of InterestThe articles of association include provisions giving the directors authority to approve conflicts of interest and potential conflicts of interest as permitted under the Companies Act 2006.
A procedure has been established, whereby actual and potential conflicts of interest are regularly reviewed and appropriate authorisation sought, prior to the appointment of any new director or if a new conflict arises. The decision to authorise a conflict of interest can only be made by non-conflicted directors
and in making such a decision the directors must act in a way they consider, in good faith, will be most likely to promote the success of the company. The board believes this procedure operated effectively throughout the year.
Board and Committee EffectivenessAnnual board and committee evaluationIn April 2017, the Nomination and Governance Committee recommended that the evaluation for the 2016/17 financial year be undertaken internally, as permitted by the Code. The evaluation took the form of online, self-assessment questionnaires completed by directors (other than the chairman), assessing the performance and effectiveness of the board and each of its committees in a broad range of areas.
The questions in the assessment were set to develop the themes explored in previous years’ evaluations and to assess the progress of the board and its committees compared with previous years. The assessment consisted of two main parts. The first assessed the operation, performance and effectiveness of the board. It included a range of questions in three broad areas: (i) process and structure; (ii) profiles and competencies; and (iii) culture and behaviours. This part of the assessment was completed by all directors (other than the chairman). The second part of the assessment considered the operation, performance and effectiveness of the board’s four committees. It included a mixture of general questions and specific questions on each committee. This part of the assessment was completed by the four independent non-executive directors only. In each part of the assessment, directors were invited to give general comments and observations in addition to responding to specific questions.
The feedback from the assessments was collated by the company secretary, reviewed with the chairman and presented to the board for discussion in June 2017.
The results of the evaluation were broadly similar to the assessment undertaken in the previous year, with positive scores recorded across the different areas covered in the assessment. Among other things, there was agreement that the board possesses an appropriate mix of competencies, that time at board and committee meetings is used effectively and that the committees improve the overall effectiveness of the board. The observations made by directors in their responses and the verbal feedback provided at the board meeting were insightful. In their discussion of the results, the directors considered, among other things, the positive impact of changes made during the year to the way in which the board discusses strategy, suggestions for areas where additional periodic technical updates could be provided to directors, and developments in the papers provided to directors for meetings.
The overall conclusion of the evaluation was that the board and its committees continue to operate effectively.
The last externally facilitated review of the board and its committees took place in 2015. In accordance with the Code, in the 2017/18 financial year, the board intends to carry out an externally facilitated review of its effectiveness and that of its committees. Details of the review will be provided in next year’s Annual Report.

Close Brothers Group plc Annual Report 2017G
overnance59
Directors’ performanceDuring the financial year, the chairman holds regular meetings with individual directors at which, among other things, their individual performance is discussed. These discussions form part of the basis for recommending the reappointment of directors at the company’s AGM. These discussions include consideration of the director’s performance and contribution to the board and its committees, their time commitment and the board’s composition.
Chairman’s performanceIt is the board’s practice for the senior independent director to lead an annual performance assessment in respect of the chairman, which involves a review with the other non-executive directors, without the chairman being present, and separate consultation with the chief executive. The senior independent director subsequently provides feedback to the chairman. Given the recent appointment of Mike Biggs as chairman, a review of his performance has not yet been undertaken and this will be done prior to 31 July 2018.
Directors’ fitness and proprietyIn line with its regulatory obligations, the group undertakes annual reviews of the fitness and propriety of all those in Senior Manager Functions, including all of the company’s directors and a number of other senior executives. This process comprises assessments of individuals’ honesty, integrity and reputation; financial soundness; competence and capability; and continuing professional development. This year’s reviews have confirmed the fitness and propriety of all of the company’s directors and other senior executives who perform Senior Manager Functions.
Risk and Control FrameworkThe board has overall responsibility for maintaining a system of internal control to ensure that an effective risk management and oversight process operates across the group. The risk management framework and associated governance arrangements are designed to ensure that there is a clear organisational structure with well defined, transparent and consistent lines of responsibility and effective processes to identify, manage, monitor and report the risks to which the group is, or might become, exposed. The board has a well defined risk appetite with risk appetite measures which are integrated into decision-making, monitoring and reporting processes, with early warning trigger levels set to drive the required corrective action before overall tolerance levels are reached. The risk framework, through key committees, including the Risk Committee and Audit Committee, is the mechanism that ensures the board receives comprehensive risk information in a timely manner.
Identification, measurement and management of risk are fundamental to the success of the group. Over the past 12 months the group has continued to strengthen its risk management framework and further develop the organisation’s risk committees, at both a group and business level, and these continue to work efficiently and effectively.
The group’s risk and control framework is designed to allow the capture of business opportunities while maintaining an appropriate balance of risk and reward within the group’s agreed risk appetite. It further ensures that the risks to which the group is, or may become, exposed are appropriately identified, and that those which the group chooses to take are managed, controlled and, where necessary, mitigated, so that the group is not subject to material unexpected loss.
The group reviews and adjusts its risk appetite annually as part of the strategy setting process. This aligns risk-taking with the achievement of strategic objectives. Adherence to appetite is monitored by the group’s risk committees.
Throughout the year the Risk Committee undertakes a robust assessment of the principal risks facing the group, and reviews reports from the risk function on the processes that support the management and mitigation of those risks. A summary of the group’s principal risks and uncertainties is provided on page 16.
On an ongoing basis the Risk Committee, along with the Audit Committee, also reviews the adequacy and effectiveness of the group’s risk management and internal control arrangements in relation to the group’s strategy and risk profile for the financial year. This covers all material controls, including financial, operational and compliance controls. On the basis of its own review, the board considers that it has in place adequate systems and controls with regard to the group’s profile and strategy.
The risk management framework is based on the concept of “three lines of defence”, as set out in the table on page 60, and the key principles underlying risk management in the group are:• business management own all the risks assumed throughout
the group and are responsible for their management on a day-to-day basis to ensure that risk and return are balanced;
• the board and business management promote a culture in which risks are identified, assessed and reported in an open, transparent and objective manner;
• the overriding priority is to protect the group’s long-term viability and produce sustainable medium to long-term revenue streams;
• risk functions are independent of the businesses and provide oversight of and advice on the management of risk across the group;
• risk management activities across the group are proportionate to the scale and complexity of the group’s individual businesses;
• risk mitigation and control activities are commensurate with the degree of risk; and
• risk management and control supports decision-making.

Close Brothers Group plc Annual Report 201760
Risk Management FrameworkFirst line of defence Second line of defence Third line of defence
The BusinessesGroup Risk and Compliance Committee(Reports to the Risk Committee)
Chief executive delegates to divisional and operating business heads day-to- day responsibility for risk management, regulatory compliance, internal control and conduct in running their divisions or businesses.
Business management has day-to-day ownership, responsibility and accountability for risks:• identifying and assessing risks;• managing and controlling risks;• measuring risk (key risk indicators/early
warning indicators);• mitigating risks; • reporting risks; and• committee structure and reporting.
Key Features• Promotes a strong risk culture and
focus on sustainable risk-adjusted returns;
• Implements the risk framework;• Promotes a culture of adhering to limits
and managing risk exposures;• Promotes a culture of customer focus
and appropriate behaviours;• Ongoing monitoring of positions and
management and control of risks;• Portfolio optimisation; and• Self-assessment.
Risk and ComplianceRisk Committee(Reports to the board)
Risk Committee delegates to the group chief risk officer day-to-day responsibility for oversight and challenge on risk related issues.
Risk functions (including compliance) provide support and independent challenge on:• the design and operation of the risk
framework;• risk assessment;• risk appetite and strategy;• performance management;• risk reporting;• adequacy of mitigation plans;• group risk profile; and• committee governance and challenge.
Key Features• Overarching “risk oversight unit” takes
an integrated view of risk (qualitative and quantitative);
• Supports through developing and advising on risk strategies;
• Facilitates constructive check and challenge – “critical friend”/“trusted adviser”; and
• Oversight of business conduct.
Internal AuditAudit Committee(Reports to the board)
Audit Committee mandates the head of group internal audit with day-to-day responsibility for independent assurance.
Internal audit provides independent assurance on:• the first and second lines of defence;• appropriateness/effectiveness of
internal controls; and• effectiveness of policy implementation.
Key Features• Draws on deep knowledge of the group
and its businesses;• Independent assurance on the activities
of the firm, including the risk management framework;
• Assesses the appropriateness and effectiveness of internal controls; and
• Incorporates review of culture and conduct.
Corporate Governance Report continued

Close Brothers Group plc Annual Report 2017G
overnance61
Substantial Shareholdings16 September 2017 31 July 2017
Voting rights
%
Voting rights
%
Standard Life Investments1 – 12.31Aberdeen Asset Managers1 – 4.95Standard Life Aberdeen1 17.29 –M&G Investment Management 5.77 5.77Blackrock, Inc. 5.04 5.04Royal London Asset Management 4.96 4.96Norges Bank 3.00 3.11
1 Following the merger of Standard Life plc and Aberdeen Asset Management PLC , the company was notified on 16 August 2017 of the aggregated interest of the combined Standard Life Aberdeen plc group in the company’s ordinary shares. This notification, which remained in place at 16 September 2017, is reflected in the table above at 16 September 2017 and effectively replaced the separate notifications made previously by Standard Life Investments and Aberdeen Asset Managers.
The board is regularly updated on the IR programme. An IR report, summarising share price performance, share register composition and feedback from any investor meetings, is produced for each board meeting.
From time to time, the group runs seminars covering different parts of its business to provide additional detail to investors and analysts. Relevant presentations, together with all results announcements, annual reports, regulatory news announcements and other relevant documents, are available on the IR section of the company’s website (www.closebrothers.com/investor-relations).
Annual General MeetingThe board regards the company’s AGM as an important opportunity for private shareholders to discuss the group directly with the board. All shareholders have the opportunity to raise questions with the board at the AGM, either in person or by submitting written questions in advance. The chairman of each of the board committees attends the AGM and all other directors are expected to attend the meeting. All directors attended the company’s AGM in 2016.
By order of the board
Alex DunnCompany Secretary
26 September 2017
The table above sets out details of the interests in voting rights notified to the company under the provisions of the FCA’s Disclosure Guidance and Transparency Rules. Information provided by the company pursuant to the Disclosure Guidance and Transparency Rules is publicly available via the regulatory information services and on the company’s website.
Substantial shareholders do not have different voting rights from those of other shareholders.
Engagement with ShareholdersInvestor relationsThe group has a comprehensive investor relations (“IR”) programme to ensure that current and potential shareholders, as well as financial analysts, are kept informed of the group’s performance and have appropriate access to management to understand the company’s business and strategy.
The board believes it is important to maintain open and constructive relationships with all shareholders. The group’s IR team, reporting to the group finance director, are responsible for managing a structured programme of meetings, calls and presentations around the financial reporting calendar, as well as throughout the year. The team regularly seeks investor feedback, directly and via the group’s corporate brokers, which is communicated to the board and management. The chief executive and group finance director meet with the group’s major institutional shareholders on a regular basis. In addition, the chairman arranges to meet with major institutional shareholders to discuss matters such as strategy, corporate governance and succession planning. Separately, the senior independent director is available, should shareholders wish to discuss any concerns they may have. As discussed further in the Directors’ Remuneration Report, the chairman of the Remuneration Committee takes part in consultations with major institutional shareholders on remuneration issues from time to time.

Close Brothers Group plc Annual Report 201762
Lesley Jones, Chairman of the Risk Committee
The Risk Committee’s principal roles and responsibilities are to support the board in its oversight of risk management across the group. The identification, management and mitigation of risk is fundamental to the success of the group. The following sections set out the Committee’s membership, its key responsibilities and the principal areas of risk upon which we have focused during the year. The Committee plays an important role in setting the tone and culture that promotes effective risk management across the group.
Risk CommitteeChairman’s overviewThe evolution of the macroeconomic environment and political landscape and a demanding regulatory agenda aimed at bolstering the strength and conduct of the banking industry have again kept the Risk Committee fully occupied throughout the year.
I am pleased to report that enhancements to our risk management framework, and a consistent and prudent risk appetite, have each helped to reinforce the group’s strong credit performance again this year. We continue to build out our risk capabilities and are satisfied that we have both retained and recruited the skills and talent that we need to meet the challenges and opportunities that lie ahead.
As in previous years, the Committee apportions its time between the planned periodic review of key portfolio risks and the close scrutiny of new business risks as they develop. This approach allows us to ensure that emerging risks are identified and debated and that management’s plans for risk mitigation are well understood and appropriately resourced.
Committee roles and responsibilitiesThe Committee’s key roles and responsibilities are to:• oversee the maintenance and development of a supportive
culture in relation to the management of risk;• review and set risk appetite, which is the level of risk the
group is willing to take in pursuit of its strategic objectives;• monitor the group’s risk profile against the prescribed
appetite;• review the effectiveness of the risk framework to ensure that
key risks are identified and appropriately managed; and• provide input from a risk perspective into the alignment of
remuneration with performance against risk appetite (through the Remuneration Committee).
Membership and meetingsThe Committee comprises each of the independent non-executive directors, with me as chairman. Six scheduled meetings were held during the year.
Full details of attendance by the non-executive directors at these meetings during the year are set out on page 56.
In addition to the members of the Committee, standing invitations are extended to the group chairman, the executive directors, the chief risk officer, the head of compliance and the head of internal audit. All attend our Committee meetings as a matter of course and have supported and informed the Committee’s discussions.
Other executives, subject matter experts, risk team members and external advisers are invited to attend the Committee from time to time as required, to present and advise on reports commissioned.
I meet frequently with the chief risk officer and his risk team in a combination of formal and informal sessions, and with senior management across all divisions of the group to discuss the business environment and to gather their views of emerging risks, business performance and the competitive environment.
Committee effectivenessAs described in more detail on page 58, a formal and rigorous evaluation of the Committee’s effectiveness was undertaken during the year as part of the broader evaluation of the effectiveness of the board and its committees. The Committee is satisfied that it has access to sufficient resources to enable it to carry out its duties and continues to perform effectively.
Risk Committee Report

Close Brothers Group plc Annual Report 2017G
overnance63
Activity in the 2017 financial yearThe risk function has continued to evolve in 2017. The three lines of defence model is fully embedded, while the governance structure has been improved to facilitate more effective oversight of risk, both at a Group and business level. The risk organisational design has also been further strengthened through the identification and use of additional specialist resource, for example with cyber risk expertise. These actions have continued to improve the flow of management information to the Committee, increasing the effectiveness of its challenge and oversight and enhancing visibility on risk and compliance issues identified at all levels across the group.
The risk appetite framework has been supplemented by the use of additional quantitative analysis, supporting the group’s risk management capabilities particularly in response to market events. This has allowed us to adopt and refine risk appetite measures at a more granular level within portfolio management, individual credit-decisioning and risk reporting. The specific portfolio review approach has continued with particular attention given to the property and motor portfolios, which have both benefited from deep dives by the Risk Committee.
Management of emerging risks has also been strengthened, improving organisational readiness for external volatility. Emerging risk assessment remains a standing agenda item for the Committee’s discussion (and indeed, all risk committees within the group) while stress testing capabilities have continued to evolve to support what if analysis for one-off events. A new group-wide forum has been established to manage the potential impacts of Brexit which, given the group’s footprint, are likely to be secondary in nature but which nevertheless merit regular review. Outputs from this forum, including the development of appropriate contingency plans, have been subject to regular challenge by the Committee, and we are satisfied that the group is currently well-positioned to address any foreseeable outcome.
The group’s use of finance and risk models has evolved over the year as our IFRS 9 models have developed and advanced our overall model inventory. In addition, we have seen the introduction of a new model risk framework and governance structure, which has embedded well. The board and the Committee have assessed various options for advancing our future modelling approach with the aim of enhancing our risk management capabilities.
The Committee has also overseen the introduction of new asset and liability management methodologies, resulting specifically in a refresh of our management of interest rate risk in the banking book. The introduction of a new asset and liability management system is proceeding to plan and when fully operational later this year will support more sophisticated stress testing techniques.
Operational risk continues to develop in its complexity and we have responded by investing in further systems and process enhancements to support the early identification of negative trends. Operational resilience has been augmented, leveraging off a continuous self-assessment of our capabilities and supported by the recruitment of a new head of business resilience.
Our focus on cyber crime has heightened during 2017, as repeated industry attacks reinforced the need for strong cyber defences to protect our systems and customer data. As a result our cyber detection and monitoring capabilities have continued to improve. A new chief information security officer (“CISO”) has been appointed and the cyber security strategy is constantly under review by the Board and this Committee to ensure that we are keeping pace with, and responding to, the latest industry developments.
Ensuring that we remain fully compliant with the numerous and ever-changing regulatory requirements for financial services firms remains challenging and we continue to engage actively with regulators and industry bodies to ensure that our compliance framework remains appropriate and relevant for all of our businesses. The Compliance team works closely with first and second line colleagues, providing regulatory advice in support of divisional business strategies, as well as shaping policies, delivering training and conducting assurance reviews.
RemunerationThe linkage between culture, risk and compensation is an important one and the Risk Committee and the chief risk officer have provided input to the Remuneration Committee again this year to ensure that risk behaviours and the management of operational risk incidents over the course of the financial year were appropriately reflected in decisions taken about performance and reward.
Looking ahead to 2018Key priorities for the coming year include:• Effective management of emerging risks, specifically key
impacts associated with the UK’s exit from the EU, as well as any other material developing concerns.
• Continued review and assessment of the group’s modelling capabilities, including the development of a wider models strategy as appropriate.
• Advancement and embedding of the group’s cyber security strategy.
• Launch and subsequent optimisation of the new asset and liability management system.
• Preparations for continued regulatory change (including MiFID II, the extension of the Senior Manager and Certified Persons Regime and GDPR).
• Continued focus on combating the threat of financial crime, including in relation to tax evasion.
Lesley JonesChairman of the Risk Committee
26 September 2017

Close Brothers Group plc Annual Report 201764
Audit CommitteeChairman’s overviewIt has again been a busy year for the Committee. The majority of the Committee’s time has been spent on its principal roles and responsibilities which are to:• assess the integrity of the group’s external financial reporting;• review the effectiveness of the group’s internal controls; and• monitor and review the activities and performance of both
internal and external audit.
In particular this year the Committee has overseen the external audit tender process and continued to monitor progress in management’s preparation for the revised impairment approach required by IFRS 9. The sections below discuss the activities in the year in more detail including a separate review of the audit tender process.
Looking forward, the Committee’s agenda will continue to be focused on the key responsibilities listed above and in particular oversight of the further development of the group’s IFRS 9 approach and the transition to the new external auditor.
Membership and meetingsThe Committee comprises each of the independent non-executive directors and met five times during the year with the meetings scheduled to coincide with the financial reporting cycle of the group. Attendance details of each of the Committee members is shown in the table on page 56. The qualifications of each of the members are outlined in the biographies on pages 46 and 47. The board considers that I have the appropriate recent and relevant experience.
As well as the non-executive members of the Committee, standing invitations are extended to the chairman of the board and the executive directors. The heads of internal audit, risk and compliance as well as the group financial controller also attend meetings by invitation. I meet with this group along with the group finance director in advance of each meeting to agree
the agenda and receive full briefing on all relevant issues. Invitations to attend are extended to other members of management to brief the Committee on specific issues under review as necessary. The external auditor also attends each meeting and I have regular contact with the lead audit partner throughout the year. The Committee met with both internal and external audit privately at each meeting held during the year.
Committee effectivenessAs described in more detail on page 58, a formal and rigorous evaluation of the Committee’s effectiveness was undertaken during the year as part of the broader evaluation of the effectiveness of the board and its committees. The Committee considers that it has access to sufficient resources to enable it to carry out its duties and has continued to perform effectively.
Activity in the 2017 Financial YearKey accounting judgementsAs part of its role in assessing the integrity of the group’s external reporting, the Committee has continued to pay particular attention to the key areas of management judgement underpinning the financial statements. Given the stable nature of the group’s business model the key areas of judgement were again unchanged this year but the Committee specifically considered the following:
Credit provisioningThe Committee considers that credit provisioning is the most material area of accounting judgement in the group’s financial statements. As a result the Committee requested and received presentations from management explaining the provisioning methodology across the group’s lending operations ahead of the full year results. The Committee challenged both management and the external auditor over the level of provisioning and the consistency of the approach. The Committee concluded that the provisioning approach and judgements made were reasonable.
Oliver Corbett, Chairman of the Audit Committee.
This report sets out the principal responsibilities of the Audit Committee, its membership and meetings as well as the key activities under review during the year.
Audit Committee Report

Close Brothers Group plc Annual Report 2017G
overnance65
As noted earlier the Committee also received regular updates through the year on management’s progress in preparation for the introduction of IFRS 9 which will require provisioning methodology to take into account future expected losses. The Committee has noted the considerable progress made during the year while also recognising the extent of the work still required to deliver this significant accounting change. As the group enters the parallel run stage of the IFRS 9 project during the 2018 financial year, the Committee will continue to monitor progress closely. Further disclosure around the group’s progress is outlined on pages 109 and 110 of the Annual Report.
Revenue recognitionThe Committee reviewed a paper outlining the group’s approach to revenue recognition, highlighting the key areas where management judgement is required particularly around interest, fee and commission income. The Committee challenged management on the consistency of approach and ultimately was satisfied that the approach taken continued to be appropriate.
GoodwillThe external auditor has concluded that the risk of goodwill impairment is not significant this year and therefore that goodwill is no longer an area of significant audit risk. While the Committee agreed with that conclusion, it continued to consider whether any indications of impairment had arisen during the year and received an update on the assessment of the carrying value of goodwill. This reflects the level of assumptions and management judgement underlying the calculations. Following review and challenge of the key assumptions driving the group’s value in use calculations the Committee agreed with management’s conclusion that the carrying value of goodwill across the group was reasonably stated.
Other financial reportingViability statementIn order to support the board’s approval of the statement on pages 52 and 53 as to the longer-term viability of the group, the Committee reviewed papers from management supporting the viability statement including the group’s three year plan and the results of stress testing.
Fair, balanced and understandableThe Committee continues to consider on behalf of the board whether the group’s reporting is fair, balanced and understandable. This included discussing the disclosures as a whole with the executive directors and considering the views of the external auditor and ensuring that undue prominence was not given to non-GAAP measures in the Annual Report.
Policy oversight and reviewWhistle-blowingThe Committee oversees the group’s whistle-blowing policy and I, as Audit Committee chair, act as the group’s whistle-blowing champion. The group places a high level of importance on all employees’ understanding of the process to enable them to speak out when appropriate and the Committee has monitored reports during the year.
Other policiesThe Committee also completed annual reviews of the group’s recovery and resolution plan, tax position and policy, approach to hedging for share awards and the policy for the provision of non-audit services by the external auditor to reflect updated rules and guidance.
Internal AuditThe Committee reviewed and agreed the internal audit plan as well as pre-approving any changes to the plan throughout the year. At each meeting the Committee receives a report from the head of internal audit summarising audits completed as well as monitoring progress on agreed actions from previous audits. The report also details key themes, audits planned and in progress, as well as commentary on internal audit related business culture. During the year 41 audits were completed including one thematic review requested by the group’s regulators.
The group carries out an annual effectiveness review of internal audit. The review this year was carried out internally and after noting the strong feedback from the business and other key stakeholders the Committee considers that the internal audit function continues to be effective. The Committee’s policy is to carry out an external review of internal audit at least every five years. The next such review will take place not later than the 2020 financial year.
The Committee continues to keep the level of resources of the internal audit team under review. The group operates a co-source arrangement to ensure the function has sufficient access to expertise to cover the internal audit across all of the group’s business areas. The group carried out a tender for this arrangement during the 2017 financial year and has appointed Ernst & Young LLP as its new co-source provider from 1 August 2017.
External AuditThe Committee assesses the independence and objectivity, qualifications and effectiveness of the external auditor on an annual basis.
Our evaluation which was consistent with prior years focused on the following key areas:• the quality of audit expertise, judgement and dialogue with
the Committee and senior management;• the independence and objectivity demonstrated by the audit
team; and• the quality of service including consistency of approach and
responsiveness.
This process was facilitated by a group-wide survey of finance teams, a survey of the Deloitte LLP senior audit team’s view on the group and a review of audit and non-audit fees.
Overall the Committee has concluded that Deloitte LLP remain independent and that their audit is effective.
The Committee oversees the group’s policy on the provision of non-audit services by the external auditor. The policy was revised during the year to reflect revised ethical guidance on auditor independence issued by the FRC. The main impact of the new guidance for the group is that tax compliance services will no longer be provided by the external auditor and the group appointed new advisers during the year. However, while the key principle of our policy remains that permission to engage the external auditor will always be refused when a threat to independence and/or objectivity is perceived, the Committee continues to see benefits for the group in engaging the external auditor where:• work is closely related to the audit;• a detailed understanding of the group is required; and• the external auditor is able to provide a higher quality and/or
better value service.

Close Brothers Group plc Annual Report 201766
Audit Committee Report continued
Oliver CorbettChairman of the Audit Committee
26 September 2017
The firms were contacted in advance of the process and asked to confirm their intention to tender as well as their ability to accept an appointment based on the FRC’s Revised Ethical Standard 2016. Contingency plans were put in place to relieve the firms from certain engagements should they be successful in their tender.
The processThe firms were invited to tender and given access to a data room during March 2017 and were also invited to our head office for a day to meet certain members of senior management from across the group. These sessions provided the firms with an opportunity to understand our business in greater depth. Following these sessions the firms were invited back to meet the finance director and me to seek any further points of clarification in advance of their proposal submissions.
Each firm returned in May 2017 to present their proposals to the selection panel and to answer the panel’s questions. The panel assessed each proposal against the Committee’s selection criteria as well as reviewing the firm’s AQR scores following which all panel members were unanimous in their choice of PricewaterhouseCoopers LLP (“PwC”) as their preferred firm to recommend for appointment to the Committee. The Committee reviewed the panel’s recommendation, as well as its second choice, and subsequently approved the panel’s recommendation.
ConclusionFollowing the Committee’s recommendation, the board has resolved to recommend the appointment of PwC as auditor of the group and its subsidiaries to shareholders at the 2017 AGM.
We are now working with Deloitte and PwC to ensure an orderly transition of the audit while ensuring minimal disruption to the business.
Audit TenderIntroductionAs indicated in last year’s Annual Report, the Committee undertook an external audit tender in 2017 with a view to replacing Deloitte LLP as our external audit firm from the 2018 financial year. The tender was carried out in order to conform with the new EU rules on mandatory firm rotation. As such, Deloitte LLP was not invited to tender the appointment.
GovernanceThe Committee’s objectives were to carry out a fair, transparent and robust process to ensure all applicants had an equal chance of success. The process was also designed to be proportionate recognising the straightforward nature of the group’s activities.
The Committee further designed selection criteria covering the following areas: strength and experience of the team and lead partner, technical expertise and industry knowledge, quality of audit plan, approach to tender process, quality of communication and cultural fit. The Committee also specified that each participating firm should provide its FRC Audit Quality Review (“AQR”) scores for the last three years.
A selection panel was appointed to oversee the process and to make a recommendation to the Committee based on the Committee’s approved selection criteria. I was the chair of the panel which also included the senior independent director, the group finance director and the group financial controller.
Participating firmsThree firms were invited to participate in the tender process. The firms were selected based on their experience of auditing firms of our size and in our sector. The Committee was also committed to considering applications from any audit firm which requested to participate in the process. No other applications were received.
During the year non-audit fees amounted to £0.8 million and were 62% of the overall audit fee (2016: 59%). Non-audit fees in the year were:
£ million
Assurance work on:Systems and controls 0.6Funding 0.2
The Committee concluded that all of these fees fell within its criteria for engaging Deloitte LLP and does not believe they pose a threat to the auditor’s independence or objectivity.
Finally I would like to place on record our thanks to Deloitte LLP at the end of its tenure as group auditor for their contribution to the success of the group.

Close Brothers Group plc Annual Report 2017G
overnance67
Nomination and Governance CommitteeChairman’s overviewThis is the first annual report of the activities of the Nomination and Governance Committee following my appointment as chairman of the Committee on 1 May 2017. I have succeeded Strone Macpherson as chairman of the Committee and would like to thank Strone for his leadership of the Committee since 2008, during which time he oversaw a number of changes to the board and its committees.
An important area of focus for the Committee in the year was the search for, and a recommendation of, a successor to Strone as chairman of the board. The process was overseen by the Committee and led by Geoffrey Howe, the senior independent director, and culminated in my appointment as a director on 14 March 2017 and my appointment as chairman of the board on 1 May 2017.
The Committee has continued to play an active role in overseeing talent management and succession planning for the group, including through making sure that appropriate activities and initiatives are undertaken to develop the group’s talent pipeline. This will continue to be a key area for the Committee in the next year.
An overview of the Committee’s roles and responsibilities, and its key activities during the year, is set out in the report below.
Committee roles and responsibilitiesThe Committee’s key roles and responsibilities are:• regularly reviewing the structure, size and composition of the
board, and making recommendations to the board with regard to any changes;
• considering the leadership needs of the group and considering succession planning for directors and senior executives;
• considering the appointment or retirement of directors;• reviewing the continued independence of the non-executive
directors;• assessing the board’s balance of skills, knowledge and
experience;• evaluating the skills, knowledge and experience required for
a particular appointment, normally with the assistance of external advisers used to facilitate the search for suitable candidates; and
• assessing the contribution of the non-executive directors.
The Committee’s role and responsibilities are set out in written terms of reference and are available at www.closebrothers.com.
Key activities in the 2017 financial yearIn addition to overseeing the process to appoint a new chairman of the board and other activities described below, during the year the Committee focused on:• board composition and succession;• talent review and executive management succession
planning;• the annual board evaluation; • reviewing the non-executive directors’ letters of appointment;
and• assessing the non-executive directors’ skill sets, knowledge
and experience to ensure that an appropriate balance of skills, knowledge and experience has been maintained.
Membership and meetingsThe Committee comprises Geoffrey Howe, the senior independent director, and Oliver Corbett, Lesley Jones and Bridget Macaskill who chair the Audit, Risk and Remuneration Committees, respectively, and me as chairman. The composition of the Committee satisfies the relevant requirements of the UK Corporate Governance Code. Prior to his retirement as a director on 30 April 2017, Strone Macpherson served on the Committee as its chairman.
In addition, the chief executive attends meetings by invitation, as does the group head of human resources when presenting a review of talent and executive management succession planning.
Five scheduled meetings of the Committee were held during the year and details of members’ attendance are set out on page 56. In addition, one ad hoc meeting was held to consider my nomination as a director and chairman-designate.
Changes to the boardStephen Hodges retired as a director on 17 November 2016 and Strone Macpherson retired as a director and chairman of the board on 30 April 2017.
Following a recommendation from the Committee, I was appointed by the board as an independent non-executive director with effect from 14 March 2017, and as chairman of the board with effect from 1 May 2017. Further details of the search process that culminated in my appointment are set out below.
Chairman’s successionThe Committee, led by the senior independent director, Geoffrey Howe, oversaw the process that led to my appointment as a non-executive director of the company and then, following the retirement of Strone Macpherson, as chairman of the board. The Committee engaged external search consultancy firm, The Zygos Partnership (“Zygos”), to find appropriate candidates for the role. Zygos is not connected to the company in any way.
The Committee spent time considering the key skills, experience, time commitment and other attributes required of the successful candidate, and approved the profile and criteria to be used in the search. A long list of candidates was prepared by Zygos for consideration by the senior independent director and the non-executive directors. A short list of candidates was agreed, and the senior independent director and the other non-executive directors then held interviews with the candidates. Following the interviews and a reference process, I was identified as the preferred candidate. Once regulatory approval for my appointment had been received from the PRA, the Committee recommended to the board that I be appointed as an independent non-executive director and as a member of the Committee from 14 March 2017, as a member of the Audit, Risk and Remuneration Committees from 14 March until 1 May 2017, and as chairman of the board and of the Committee with effect from 1 May 2017. As I was appointed as a director during the year, I will submit myself for election as a director of the company for the first time at the 2017 AGM. The board considered me to be independent on my appointment as a director and as chairman of the board.
Nomination and Governance Committee Report

Close Brothers Group plc Annual Report 201768
Nomination and Governance Committee Report continued
The outgoing chairman, Strone Macpherson, was not involved in the process for the selection and appointment of his successor.
Non-executive directors’ skill setsDuring the year, the Committee considered and reaffirmed the skill sets and experience of the company’s four independent non-executive directors, including their extensive experience within financial services. Geoffrey Howe is the senior independent director and has extensive experience within the industry, including as a chairman. Oliver Corbett has strong financial skills and a track record of audit committee experience, including as a finance director. Lesley Jones has familiarity with FCA/PRA and EU risk regulations, and experience as a committee chairman and non-executive director within the financial services sector. Bridget Macaskill has significant remuneration committee credentials and familiarity with FCA/PRA and EU remuneration regulations. Further information on the background and experience of each of the non-executive directors can be found in their biographies on pages 46 and 47.
Succession planning – board and managementThe Committee spent considerable time during the year reviewing talent and considering the group’s succession planning at board and senior management level. This included a formal review by the Committee of senior management succession planning, looking at the capability and potential of incumbents in key roles, and the succession pipeline, emergency cover arrangements and external market for those roles.
DiversityDiversity continues to be a key focus of the Committee and the board. The Committee considers that the board remains diverse, drawing on the knowledge, skills and experience of directors from a range of backgrounds. Currently, three of the company’s eight directors are women, meaning that the representation of women on the board exceeds the minimum percentage set out in the recommendations of the Hampton-Alexander Review published in November 2016. The group continuously endeavours to make Close Brothers appealing to a diverse population, and its commitment to equal, respectful and dignified treatment throughout recruitment processes and through all stages of the employee cycle is underpinned by the group’s Equal Opportunity and Dignity at Work policy. More detail on the group’s approach to diversity can be found in the Sustainability Report on page 36.
Reappointment of directorsPrior to the Company’s AGM each year, the Committee considers, and makes recommendations to the board concerning, the reappointment of directors having regard to their performance and ability to continue to contribute to the board. Following this year’s review in advance of the 2017 AGM, the Committee has recommended to the board that all serving directors be reappointed at the AGM.
Geoffrey Howe has served as a non-executive director of the company since January 2011. As it is now more than six years since his appointment as a director and as required by the UK Corporate Governance Code, the Committee has undertaken a particularly rigorous review of Geoffrey’s performance and independence. It has concluded that he remains independent and continues to make a significant contribution to the board and its committees. The Committee and the board have also noted the valuable contribution that Geoffrey makes as the company’s senior independent director, as demonstrated by his leadership of the process to find a new chairman of the board. The Committee and the board value the continuity that Geoffrey’s continued appointment as a director would bring.
Committee effectivenessAs described in more detail on page 58, a formal and rigorous evaluation of the Committee’s effectiveness was undertaken during the year, as part of the broader evaluation of the effectiveness of the board and its committees. The Committee considers that it has access to sufficient resources to enable it to carry out its duties and has continued to perform effectively.
Michael N. BiggsChairman of the Nomination and Governance Committee
26 September 2017

Close Brothers Group plc Annual Report 2017G
overnance69
Report of the Board on Directors’ Remuneration continuedDirectors’ Remuneration Report
Bridget Macaskill, Chairman of the Remuneration Committee.
This report sets out our approach to remuneration for the group’s employees and directors for the 2017 financial year.
Annual Statement from the Remuneration Committee ChairOn behalf of the Remuneration Committee, I am pleased to present the report on directors’ remuneration for the 2017 financial year.
2017 has been a busy year for the Committee. In addition to our routine activities, we have undertaken an extensive review of our Directors’ Remuneration Policy to ensure that this remains appropriate and aligned to our distinctive business model and the interests of our shareholders.
Our revised Remuneration PolicyIn reviewing the Policy we have consulted widely with our larger shareholders and institutional investor bodies and I would like to thank all of them for their time and insightful input. We have also sought to take account of both external developments in the executive remuneration environment, the regulatory landscape and broader market practice and internal factors including talent progression and the remuneration arrangements for our broader employee population.
Following the review of our Remuneration Policy, we will be seeking approval from our shareholders for a new Policy at our AGM in November 2017.
We believe that the existing Remuneration Policy, approved by our shareholders in 2014 but largely unchanged since 2009, has worked well to date in incentivising strong business and financial performance and in aligning the interests of Executive Directors (“EDs”) with the group’s shareholders. This has been reflected in strong performance and returns to shareholders over this period. However, the review this year identified that looking forward, the scheme for the next three years could be improved to increase alignment with our business model, market best practice and shareholder interests.
The new Policy therefore combines those elements that work well for our business and are also seen favourably by our shareholders, with a number of amendments aimed at increasing alignment with our business model, simplifying our arrangements and bringing our structures into line with evolving best practice. The key changes to our Policy are summarised as follows:
1. Simplification of long-term variable remuneration by moving to a single long-term plan The current LTIP and Share Matching Plan will be replaced with a single LTIP award.
The aggregate maximum opportunity under the current LTIP and Share Matching Plan is 400% of salary for the group chief executive and group finance director, with a maximum of 200% under each component. The proposed single LTIP award will have a maximum opportunity of 350% of salary for the group chief executive and group finance director.
The increase in the maximum award from the LTIP component compensates the EDs for the removal of the Share Matching Plan but represents an overall 12.5% reduction in maximum opportunity compared with the value of the existing long-term arrangements. We have noted the small resulting impact that this has on the balance between short and long-term incentives and are comfortable that this remains appropriate. In particular, the focus of our executives on the long-term is reinforced by their very high levels of shareholding as set out on page 73, and we are also introducing a post-vesting retention period on the LTIP and stronger deferral provisions on the bonus.

Close Brothers Group plc Annual Report 201770
Directors’ Remuneration Report continued
We are also making a minor adjustment to the bonus opportunity for our group head of legal and regulatory affairs to reflect market levels and bring the package more into line with peers whilst reflecting the nature of the role. The maximum bonus opportunity from this year onwards will increase from 100% to 120% of salary.
Further detail on these proposals are set out on pages 75 and 76.
Subject to shareholder approval the policy will be effective from the date of the AGM, which is due to be held on 16 November 2017.
Key external developmentsA key external development during the year, the PRA and the FCA both confirmed that they would not comply with certain provisions of the European Banking Authority’s remuneration guidelines, in particular, the elements that would require Close Brothers to apply a cap on variable remuneration of all Material Risk Takers. The Committee considers that the approach adopted by the UK regulators is pragmatic and will continue to allow Close Brothers to deliver competitive levels of remuneration, structured in a way that is more closely aligned to our business model and the interests of our shareholders.
How the group performedThe Committee’s approach to remuneration continues to be centred around our business model and the performance we are delivering to our shareholders. Close Brothers has a long established model which delivers consistency and resilience through the cycle and is strongly aligned with shareholder interests – the group has been consistently profitable and increased or maintained its dividend in every year since listing in 1984.
Our model is focused on sustainable lending, with a strong net interest margin and conservative underwriting, supported by a clearly defined risk appetite and a prudent approach to managing our business and financial resources.
The group achieved another good performance in the 2017 financial year, with higher profits across all three of our divisions and an overall increase of 13% in adjusted operating profit to £264.8 million (2016: £233.6 million). Adjusted EPS increased 3% to 131.7p (2016: 128.4p), reflecting the first full-year impact of the banking tax surcharge which came into effect in January 2016.
Notwithstanding the impact of the tax surcharge, return on opening equity remained strong and towards the higher end of its long-term range at 17.9% (2016: 18.9%) and well ahead of the group’s cost of capital.
As part of the review the Committee considered an even greater degree of simplification, through the replacement of both long-term awards with a single Restricted Stock Unit (“RSU”) award and a further reduced maximum opportunity for management to reflect the increased certainty this type of award would provide. We felt that there were material benefits to this approach given its simplicity and the alignment it provided with the business model. As such, we had initial discussions with some of our very largest shareholders on this potential approach. A number of our shareholders indicated strong support for this model, while others do not currently believe this approach is appropriate for the majority of businesses. Therefore the Committee has decided not to pursue this approach at this stage but will continue to monitor market views on RSUs and may reconsider this approach at some point in the future.
2. Changes to the performance measures on the annual bonus and long-term incentive awardThis will create greater alignment to the business model and the interests of our shareholders.
Within the annual bonus we are replacing the personal objectives element with a common strategic scorecard in order to ensure a more consistent and transparent assessment of performance against key strategic objectives for the group.
Within the LTIP we are replacing the absolute TSR performance condition (which a number of shareholders have raised concerns about in the past) with an RoE performance condition. While this is also a measure used in the annual bonus, its use in a long-term context will create a greater focus on the creation of long-term sustainable returns for shareholders and adherence to the business model, which is distinct from and complements its additional use as a short-term measure. The Committee considered a number of alternatives, however none of these were able to create the same alignment to the business model or the interests of our shareholders. Adjusted EPS will remain the other key financial measure. Risk and capital will also continue to be a key component, reflecting the need to incentivise continued discipline in the delivery of the business model. This is common practice across financial services given regulatory expectations and is subject to a robust assessment of performance by the Committee.
3. Introduction of a two year post-vesting holding period on the LTIPThis will increase alignment of EDs remuneration to industry best practice and shareholder interests.
4. Changes to the deferral on the annual bonusThe entire bonus will be subject to a fixed rate of bonus deferral (60% for the group chief executive and group finance director and 40% for the group head of legal and regulatory affairs) to further align with industry and regulatory best practice and increase alignment with shareholder interests.

Close Brothers Group plc Annual Report 2017G
overnance71
The table below sets out an overview of our performance for the 2017 financial year and the context for the Remuneration Committee decisions taken this year with respect to remuneration.
Key performance indicator 2017 2016
Return on opening equity 17.9% 18.9%Adjusted operating profit
(£ million) 264.8 233.6Adjusted earnings per share growth1 26.5% 53.8%Total shareholder return
per annum2 10.1% 10.0%Distributions to shareholders £89.4 million £84.0 million
1 For the three year periods ended 31 July 2017 and 31 July 2016.2 For the three year periods ended 31 July 2017 and 31 July 2016 based on the average three month share price prior to that date.
Adjusted operating profit in the Banking division increased 9% to £243.5 million (2016: £223.0 million), as we continued to grow the loan book while importantly maintaining our strong net interest margin at 8.1% (2016: 8.2%) and prudent underwriting. Winterflood’s profits increased significantly to £28.1 million (2016: £19.0 million) benefiting from a strong retail trading environment. Asset Management achieved both good organic growth with 9% net inflows of managed assets, and higher adjusted operating profit at £17.4 million (2016: £14.4 million).
We also maintained our strong and diverse funding position, with total funding covering 127% (31 July 2016: 127%) of the loan book at 31 July 2017. Despite a significant increase in risk weightings as a result of new guidance from the European Banking Authority, our capital position remains well ahead of regulatory requirements with a CET1 capital ratio of 12.6% (31 July 2016: 13.5%).
Remuneration outcomesAll our EDs achieved strong performance against their individual objectives within their balanced scorecard. As we are intending to move to a fully shared scorecard next year we have set out those objectives that are common to all EDs, with detailed disclosure for this year in the shared scorecard format. A summary of the EDs’ objectives and achievements is set out on pages 85 and 86.
There have been no significant changes to the pay or benefits structures for other groups of employees during the course of the year. The average salary increase awarded across the group was 3%. Average total compensation for employees across the group increased by 7%, primarily reflecting increased bonuses in Winterflood as a result of a strong trading performance.
Changes to the board of directors during the yearIn April Strone Macpherson retired after 13 years as a director, of which nine were as chairman.
Senior management succession planning is a key focus of the directors, and following the retirement of Stephen Hodges this has been demonstrated through the successful transition of leadership within the banking division.
In line with our policy, the bonus award for Stephen Hodges followed the same approach as the other EDs but has been pro-rated to reflect his contribution to the business prior to his retirement at the AGM in November 2016, see page 72 for details.
Finally I would like to thank my fellow members of the Remuneration Committee for their commitment and engagement in what has been a very busy year for the Committee. I hope that you will find this report on the directors’ remuneration useful, understandable and clear.
Bridget MacaskillChairman of the Remuneration Committee
26 September 2017

Close Brothers Group plc Annual Report 201772
Directors’ Remuneration Report continued
At a GlanceChanges from the prior Remuneration Policy The new Policy contains a number of amendments aimed at increasing alignment with our business model, simplifying our arrangements and bringing our structures into line with evolving best practice. The table below highlights the main changes from the prior Remuneration Policy.
Element Aspect Existing policy Changes to policy Rationale for changes
Annual bonus Amount of deferral
Amounts exceeding 100% of base salary deferred
60% of entire bonus deferred for the group chief executive and group finance director. 40% of entire bonus deferred for the group head of legal and regulatory affairs.
To ensure a significant proportion of the annual bonus is always deferred, irrespective of amount awarded. This will create greater alignment to long-term sustainable business performance and greater consistency with regulatory best practice.
Non-financial performance measures
Based on performance against personal objectives
Based on performance against strategic scorecard.
To ensure all EDs are working collectively towards goals that support business strategy while maintaining the ability to reflect differences in group/functional roles. This will also provide for greater clarity to shareholders in terms of how performance is assessed and linked to annual bonus outcomes.
SMP Inclusion in policy
200% of base salary Removed from policy. To create greater simplification within the Remuneration Policy, in response to shareholder feedback.
LTIP Maximum opportunity
200% of base salary 350% of base salary for group chief executive and group finance director.275% for group head of legal and regulatory affairs.
To reflect the removal of the SMP. This represents a reduction in quantum of long-term remuneration from 400% to 350% for the group chief executive and group finance director, and 325% to 275% for the group head of legal and regulatory affairs.
Balance of financial and non-financial measures
Financial – 80%Non-financial – 20%
Financial – 70%Non-financial – 30%
The weighting of measures has been amended to ensure increased alignment to both the business model and regulatory expectations.
Post-vesting retention period
No retention period Two year post-vesting retention period introduced.
To meet increasing shareholder expectations and best practice in this area.
Executive pay for 2017Set out in the table below is an overview of the key decisions taken on remuneration in the financial year.
Chief executive Managing director and
Banking chief executive Group finance director Group head of legal
and regulatory affairs
Preben Prebensen Stephen Hodges Jonathan Howell Elizabeth Lee1
Previous salary £540,000 £485,000 £408,000 £330,750Salary with effect from 1 August 2017 £550,000 – £415,000 £337,500Percentage salary increase 1.9% – 1.7% 2.0%2017 bonus2 £1,474,200 £444,260 £1,096,704 £292,383Percentage change in bonus from 2016 (4.6)% (68.2)% (2.6)% (12.8)%2017 bonus as a per cent of 2017 salary 273% 92% 269% 88%2017 LTIP award3 £1,890,000 – £1,362,000 £700,000Percentage change in LTIP award from 20164 (12.5)% – (13.0)% (12.5)%2017 LTIP award as a per cent of 2017 salary 350% – 334% 212%
1 Elizabeth Lee’s full time equivalent salary in 2018 increases from £367,500 to £375,000. Her working pattern changed on 1 August 2016 to 90% of the full time equivalent.
2 Stephen Hodges’ 2017 bonus is a four month pro-ration following his retirement in November 2016. His annualised bonus is £1,332,780.3 Subject to approval of the revised Remuneration Policy at the AGM in November 2017.4 2016 LTIP Award includes the matched share award under the discontinued SMP.

Close Brothers Group plc Annual Report 2017G
overnance73
The key measures that formed the Committee’s determination of the EDs’ remuneration are shown on pages 84 to 88.
The 2017 LTIP Award will be made under the new policy and as such, the awards are subject to shareholders approving the proposed policy.
EDs’ single total remuneration figures and shareholdingsThe charts below compare the EDs’ single total remuneration figures for 2016 and 2017 and the EDs’ shareholding versus shareholding policy1, as a percentage of salary.
Single total remuneration
4,000
3,000
2,000
1,000
0
Fixed remuneration Annual bonus Performance awards
Preben Prebensen£’000
Jonathan Howell£’000
Elizabeth Lee£’000
FY16
£3,955
17%
39%
44%
FY17
20%
43%
37%
£3,4064,000
3,000
2,000
1,000
0FY16
£2,969
38%
45%
FY17
43%
37%
£2,551
2,000
1,750
1,500
1,250
1,000
750
250
500
0FY16
£1,273
FY17
£1,206
17% 20%35%
27%
38%
35%
41%
24%
Shareholding versus policy
Preben Prebensenper cent
Jonathan Howellper cent
Elizabeth Leeper cent
0
300
600
900
1,200
1,500
1,800
2,100
2,400
Policy Actual
200
2,116
0
300
600
900
1,200
1,500
1,800
2,100
2,400
200
757
0
200
400
600
800
1,000
100188
Policy Actual Policy Actual
1 See ED’s Shareholding and Share Interests table on page 92 for details.

Close Brothers Group plc Annual Report 201774
Directors’ Remuneration Report continued
Directors’ Remuneration PolicyThis section of the Report sets out the group’s proposed Remuneration Policy for directors and explains each element and how it operates. This section of the Report will be subject to a binding shareholder vote at our AGM in November 2017.
The reward structure aims to:• attract, motivate and retain high calibre employees across the group;• reward good performance;• promote the achievement of the group’s annual plans and its long-term strategic objectives;• align the interests of employees with those of all key stakeholders, in particular our shareholders, clients and regulators; and• support effective risk management and promote a positive client conduct culture.
Remuneration Policy for Executive Directors
Element and how it supports the group’s short-term and long-term strategic objectives Operation and maximum payable Performance framework, recovery and withholding
Base salaryAttracts and retains high calibre employees.
Reflects the employee’s role and experience.
Set annually based on the individual’s role and experience, pay for the broader employee population and external factors, where applicable.
Increases normally take effect from 1 August.
Paid monthly in cash.
Increases will generally not exceed those for the broader employee population unless there is a change in role or responsibility.
None.
BenefitsEnables the EDs to perform their roles effectively by contributing to their wellbeing and security.
Provides competitive benefits consistent with the role.
Private medical cover.
Health screening.
Life assurance cover.
Income protection cover.
Allowance in lieu of a company car.
The maximum allowance in lieu of a company car is £18,000 for the chief executive and £12,000 for the other EDs.
Other benefits provided to individuals in certain circumstances, such as relocation.
None.
PensionProvides an appropriate and competitive level of personal and dependant retirement benefits.
For existing EDs a cash allowance in lieu of employer pension contributions equal to 22.5% of base salary.
The maximum is 22.5% of base salary and the absolute values will only increase in line with any base salary increases.
New EDs promoted to the Board will receive pension contributions that are in line with the general employee benefit.
None.

Close Brothers Group plc Annual Report 2017G
overnance75
Element and how it supports the company’s short-term and long-term strategic objectives Operation and maximum payable Performance framework, recovery and withholding
Annual bonusRewards good performance.
Motivates employees to support the group’s goals, strategies and values over both the medium and long-term.
Aligns the interests of senior employees and executives with those of key stakeholders, including shareholders and increases retention for senior employees, through the use of deferrals.
Chief executive and group finance director60% of the annual bonus will be deferred into group shares vesting in equal tranches over three years. The remaining annual bonus will be delivered immediately in cash.
The annual bonus is capped at 300% of base salary.
Group head of legal and regulatory affairs40% of the annual bonus will be deferred into group shares vesting in equal tranches over three years. The remaining annual bonus will be delivered immediately in cash.
The annual bonus is capped at 120% of base salary. The lower maximum opportunity reflects the nature of this role.
DividendsShares may be called for at any time up to 12 months from the date of vesting. When the shares are called for, the ED is entitled to the gross value of accumulated dividends in respect of the shares held under the deferred awards prior to calling.
Individual bonuses are determined based on both financial and non-financial performance measured in the financial year, including adherence to relevant risk and control frameworks.
WeightingsChief executive director and group finance director – 60% of the annual bonus will be based on financial performance.
Group head of legal and regulatory affairs – 40% of the annual bonus will be based on financial performance.
The non-financial performance for all EDs will be determined based on performance measured against a balanced scorecard, including (but not limited to):• strategic objectives;• people and customer metrics; and• risk, conduct and compliance measures.
The Committee maintains discretion to vary the measures and their respective weightings within each category.
The actual performance objectives will be set at the beginning of each financial year but will not be disclosed prospectively due to commercial sensitivity reasons. They will be designed to align the interests of EDs with the key stakeholders over the medium term, be challenging and also provide an effective incentive for the EDs.
Performance against the objectives that comprise the balanced scorecard and their weightings will be disclosed retrospectively on an annual basis as part of the Annual Report on Remuneration.
Amount payable for threshold performanceNo more than one third of maximum.
Recovery and withholdingDeferred awards will be forfeited if the ED leaves employment in certain circumstances or is dismissed for cause before the relevant vesting date.
The cash element is subject to clawback and the deferred element is subject to malus and clawback conditions, as outlined on page 78.

Close Brothers Group plc Annual Report 201776
Directors’ Remuneration Report continued
Element and how it supports the company’s short-term and long-term strategic objectives Operation and maximum payable Performance framework, recovery and withholding
Long Term Incentive PlanMotivates executives to achieve the group’s longer-term strategic objectives.
Aids the attraction and retention of key staff.
Aligns executive interests with those of shareholders.
Awards are made in the form of nil cost options or conditional shares and vest after three years subject to achieving performance conditions.
On vesting, awards will be subject to a further two year post-vesting retention period before being paid to EDs.
At the end of the retention period, EDs receive an amount (in cash or shares) equal to the dividends which would have been paid on vested shares during the performance period (plus any additional time until the ED calls for the award in the case of nil-cost options).
Chief executive and group finance directorEligible to receive an annual award of shares with a face value of up to 350% of base salary, excluding dividend equivalents.
Group head of legal and regulatory affairsEligible to receive an annual award of shares with a face value of up to 275% of base salary, excluding dividend equivalents. The lower maximum opportunity reflects the nature of this role, which should have a higher percentage of total compensation in fixed compensation.
Measures and weightingsIndividual awards vest after three years based on performance against both financial and non-financial performance measures.
70% of the award will be based on performance against financial measures. The remainder will be based on non-financial performance.
The Committee maintains discretion to vary the measures and their respective weightings within each category.
The choice of measures and their respective weightings will be disclosed annually as part of the Annual Report on Remuneration.
Amount payable for threshold performanceFor each element of the award, vesting starts at 25% for threshold performance, rising on a straight line basis to 100% for maximum performance.
The target ranges set for the financial measures in each grant and performance against the targets at vesting will be reported in the Annual Report on Remuneration for the relevant financial years.
Recovery and withholdingThe LTIP awards are subject to malus and clawback conditions, as outlined on page 78.
The LTIP awards will be forfeited if the ED leaves employment in certain circumstances or is dismissed for cause before the relevant vesting date.
Save As You Earn (“SAYE”)Aligns the interests of executives with those of shareholders through building a shareholding.
EDs have the option to save a fixed amount per month over a three or five year timeframe.
At the end of the period employees can withdraw all of their savings, or use some or all of their savings to buy shares at the guaranteed option price.
The option price is set at the beginning of the participation period and is usually set at a 20% discount to the share price at invitation.
EDs can make total maximum contributions of £6,000 per annum, in line with HMRC rules.
The Committee reserves the discretion to increase the maximum contributions in line with any HMRC rule changes during the period of the Policy.
None, as this is a voluntary scheme where EDs have invested their own earnings.

Close Brothers Group plc Annual Report 2017G
overnance77
Element and how it supports the company’s short-term and long-term strategic objectives Operation and maximum payable Performance framework, recovery and withholding
Share Incentive Plan (“SIP”)Aligns the interests of executives with those of shareholders through building a shareholding.
EDs are able to contribute up to a maximum of £1,800 per year from pre-income tax and national insurance earnings to buy Partnership Shares.
At present the Committee has determined that EDs have the ability to buy Partnership Shares. Currently there is no match but the Committee retains the discretion to offer Matching Shares of up to twice the number of Partnership Shares. This will be on the same basis for all employees should the Committee exercise this discretion.
Dividends paid on shares held in the SIP are reinvested to acquire further Dividend Shares.
The Committee reserves the discretion to increase the maximum contributions in line with any HMRC rule changes during the period of the policy.
None, as this is a voluntary scheme where EDs have invested their own earnings.
Shareholding requirementAligns the interests of executives with those of shareholders.
Group chief executive and group finance director:Required to build and maintain a shareholding of 200% of base salary over a reasonable timeframe.
Group head of legal and regulatory affairs: Required to build and maintain a shareholding of 100% of base salary over a reasonable timeframe.
None.
Other The group will pay legal, training and other reasonable and appropriate fees, including any relevant tax liabilities, incurred by the EDs as a result of doing their job.
None.
Legacy arrangements Historical LTIP and SMP awards granted under the previous executive Remuneration Policy (approved at at the 2014 AGM) will continue to operate in line with that policy.
The Committee reserves the right to allow awards to vest or make payments subject to arrangements that were granted or agreed before the individual became a director and not in contemplation of becoming a director.
Refer to previous Remuneration Policy.
Please refer to the at a glance section on page 72 for a table which summarises the changes to the Remuneration Policy from the prior year.
Additional details on the Remuneration PolicyRationale for choice of performance conditionsThe Committee selects financial and non-financial performance measures that strengthen the alignment of the remuneration arrangements to the business model and the interests of our shareholders.
With respect to the annual bonus, the Committee considers the balance between financial and non-financial measures to be appropriate. Non-financial performance will be measured against a strategic scorecard (a change from personal objectives), the purpose of this is to ensure that all EDs are working collectively towards goals in key areas (strategy, people and customers and risk, conduct and compliance) that support the business while maintaining the ability to reflect differences in group/functional roles by varying the weighting of the scorecard components.
The actual performance targets will be set at the beginning of each financial year based on prior year performance, expected performance, strategic priorities for the year and other internal and external factors as appropriate. All targets will be set at levels that are stretching but remain achievable within the context of this model and the broader external environment.

Close Brothers Group plc Annual Report 201778
Directors’ Remuneration Report continued
The Committee can also make adjustments to performance targets to reflect significant one-off items which occur during the measurement period (for example a major transaction), where it is deemed appropriate and reasonable to do so. The Committee will make full and clear disclosure of any such adjustments within the Annual Report on Remuneration for the relevant financial year.
At maximum performance, the ratio of financial to non-financial measures for the group chief executive and group finance director across the annual bonus and LTIP is approximately two thirds. The Committee believes this combination provides a good balance of financial and non-financial measures, supports the medium and long-term strategic objectives of the group and provides alignment with shareholders’ interests.
Malus and clawbackThe cash element of the annual bonus is subject to clawback for a period of three years from award. The deferred element vests in equal tranches over three years, and is subject to malus prior to vesting and clawback for three years from the date of grant.
The LTIP and the previously awarded Matched SMP shares are subject to malus for the three year period to the point of vesting and are subject to clawback for four years from the date of grant. Previously Invested SMP shares are subject to malus until vesting and to clawback for three years from the date of grant.
Malus Circumstances where it may apply The ED’s employment is terminated for misconduct or the ED is issued with a formal disciplinary warning for misconduct under the firm’s disciplinary policy
The firm suffers a material loss where the ED has operated outside the risk parameters or risk profile applicable to their position and as such the Committee considers a material failure in risk management has occurred
The level of the award is not sustainable when assessing the overall financial viability of the firm
In the event that one of these is triggered, the Committee may, at its discretion, defer and/or reduce, in whole or in part any unvested award.
Clawback Circumstances where it may apply Discovery of a material mis-statement resulting in an adjustment in the audited consolidated accounts of the group, or the audited accounts of any material subsidiary
The assessment of any performance target or condition in respect of an award was based on material error, or materially inaccurate or misleading information
The discovery that any information used to determine the bonus and number of shares subject to an award was based on material error, or materially inaccurate or misleading information
Action or conduct of a participant which, in the reasonable opinion of the board, amounts to fraud or gross misconduct
In the event that one of these is triggered, the Committee may require the ED to repay all or part of a relevant award and any associated dividend equivalents.
Consistency of executive remuneration across the groupThe pay and employment conditions of employees within the group were taken into consideration when setting the policy and pay of the EDs. The Committee does not formally consult with employees when setting the policy, although the employee opinion survey conducted every two years includes remuneration as one of the topics surveyed.
The principles of remuneration are applied throughout the group and are designed to support the group’s key attributes across our businesses, which are expertise, service and relationships. Remuneration structures and arrangements for employees other than the EDs are based on the individual’s role, experience, performance and relevant market practice.
Annual bonuses for those other than EDs are based on role, business performance, market conditions and individual performance. These bonuses are not capped, although highly remunerated employees have a portion of their bonuses deferred.
A limited group of senior employees receive LTIP awards, generally on the same basis as the EDs, but the maximum face value of these awards is generally materially lower as a percentage of base salary.
Members of the group Executive Committee who are not EDs are required to build and maintain shareholdings of at least one times base salary.
All UK employees are eligible to participate in the SAYE and SIP plans.

Close Brothers Group plc Annual Report 2017G
overnance79
Illustrations of application of Remuneration Policy for EDs The scenario charts below provide illustrations of potential remuneration outcomes for our EDs, in accordance with our new Policy, based on the assumptions provided in the table below.
Fixed remuneration Annual bonus Performance awards
0
1,000
2,000
3,000
4,000
5,000
Minimum On target Maximum
Jonathan Howell£’000
100% 22%
34%
44%
45%
39%
16%£527
£2,416
£3,224
0
1,000
2,000
3,000
4,000
5,000
Minimum On target Maximum
Elizabeth Lee1
£’000
100% 31%
48%22% 23%
53%
14%£432
£1,324£1,765
0
1,000
2,000
3,000
4,000
5,000
Minimum On target Maximum
Preben Prebensen£’000
100% 22%
34%
44%
45%
39%
16%
£698
£3,202
£4,273
1 Elizabeth Lee’s working pattern changed on 1 August 2016 to 90% of the full time equivalent.
Element Assumptions used
Fixed remuneration Consists of 2018 base salary, 2018 benefits and 2018 pension allowance.Minimum No variable elements are awarded.On target Annual bonus: Awarded at 200% of base salary for the group chief executive and
group finance director and 90% of base salary for the group head of legal and regulatory affairs.LTIP: Awards with face value of 350% for the group chief executive and group finance director and 275% for the group head of legal and regulatory affairs, and vesting at 73% (average level of vesting for the five years up to and including 2016).
Maximum Annual bonus: Awarded at policy maximum 300% for the group chief executive and group finance director and 120% for the group head of legal and regulatory affairs.LTIP: Maximum award with face value equal to 350% for the group chief executive and group finance director and 275% for the group head of legal and regulatory affairs. Assumes 100% vesting.
Other No adjustment for share price growth or dividends paid.
Approach to recruitment remunerationThe remuneration package for new EDs will comply with the Remuneration Policy for EDs outlined on pages 74 to 77. The Committee will seek to pay no more than is necessary to secure the right candidate. The Committee may seek to “buy out” remuneration that the director forfeits as a result of joining the group. In such cases, the Committee will seek to replace this with awards that match the quantum and terms of the forfeited awards as closely as possible. There may be situations where a new director has to relocate in order to take up the post with the group. In such situations reasonable financial and/or practical support will be provided to enable the relocation. This may include the cost of any tax that is incurred as a result of the move.

Close Brothers Group plc Annual Report 201780
Directors’ Remuneration Report continued
Service contracts and policy for payment on loss of office
Standard provision Policy Details
Notice period 12 month’s notice from the company.12 month’s notice from the ED.
EDs may be required to work during the notice period, may be placed on garden leave or may be provided with pay in lieu of notice if not required to work the full period.All EDs are subject to annual re-election by shareholders.
Compensation for loss of office in service contracts
No more than 12 months’ salary, pension allowance and benefits.
Payment will be commensurate with the company’s legal obligations and we will seek appropriate mitigation of loss by the ED.
Treatment of annual bonus on termination
The standard approach is no payment unless employed on date of payment.
The Committee may award a pro-rated bonus to EDs who work for part of the year or are “good leavers” (as determined by the Committee) in certain circumstances, although there is no automatic entitlement. “Good leaver” status may be granted in cases such as death, disability or retirement. The Committee has discretion to reduce the entitlement of a “good leaver” in line with performance, the circumstances of the termination, and the malus conditions outlined in the policy table. The Committee also has the ability to recover annual bonuses in line with the clawback conditions outlined in the policy table.
Treatment of unvested deferred awards under the annual bonus plan and any previous Invested SMP Shares
The Committee has the discretion under the relevant plan rules to determine whether “good leaver” status should be applied on termination.The current approach provides that discretion may be afforded in cases such as death, disability, retirement, redundancy or mutual separation.
Where the director is designated a “good leaver”, awards vest in full over the original schedule and remain subject to the malus conditions.The deferred shares are released in full in the event of a change in control.Awards lapse in the event the employee is declared bankrupt, joins another financial services company within 12 months of termination (unless this condition is waived under “good leaver” status), or leaves and is not designated a “good leaver”. These are also subject to the clawback conditions.
Treatment of the LTIP and any previous Matched SMP Shares
All awards lapse except for “good leavers”.The Committee has the discretion under the relevant plan rules to determine how “good leaver” status should be applied on termination.The current approach provides that discretion may be afforded in cases such as death, disability, retirement, redundancy or mutual separation.
For “good leavers”, vesting is pro-rated for the period of employment during the performance period.Vesting is subject to the achievement over the original performance period against the performance targets and is on the original schedule.Awards remain subject to the malus and clawback conditions.In the event of a change in control, the awards will vest subject to the service factor and the achievement against the performance targets at that point. However, the Committee retains the discretion to increase the amount vesting depending on the circumstances of the change in control.
Outside appointments EDs may accept external appointments. Board approval must be sought before accepting the appointment.The fees may be retained by the director.
Chairman and non-executive directors
Engaged under letters of appointment for terms not exceeding three years.Renewable by mutual agreement and can be terminated on one month’s notice.
All non-executive directors are subject to annual re-election.No compensation is payable if required to stand down.
Other The company may pay settlement payments, legal, training and outplacement fees incurred on exit, if appropriate.
Other notable provisions in service contracts
There are no other notable provisions in the service contracts.
Copies of the directors’ service contracts and letters of appointment are available for inspection at the group’s registered office.

Close Brothers Group plc Annual Report 2017G
overnance81
Dates of EDs’ service contracts
Name Date of service contract
Preben Prebensen 9 February 2009Jonathan Howell 8 October 2007Elizabeth Lee 1 August 2012
Remuneration Policy for the chairman and independent non-executive directors
Element and how it supports the group’s short-term and long-term strategic objectives Operation and maximum payable
FeesAttract and retain a chairman and independent non-executive directors who have the requisite skills and experience to determine the strategy of the group and oversee its implementation.
Fees are paid in cash and are reviewed periodically.Fees for the chairman and non-executive directors are set by the board. The non-executivedirectors do not participate in decisions to set their remuneration.The chairman of the board receives a fee as chairman but receives no other fees forchairmanship or membership of any committees.Non-executive directors receive a base fee.The senior independent director receives an additional fee for this role.Additional fees are paid for chairmanship of each of the Audit, Remuneration and RiskCommittees.Additional fees are paid for membership of committees, with the exception of the Nominationand Governance Committee, for which no additional fees are payable.The chairman and non-executive directors are entitled to claim reimbursement for reasonableexpenses and associated tax liabilities incurred in connection with the performance of their duties for the company, including travel expenses.Overall aggregate fees will remain within the £1 million authorised by our articles ofassociation.There is no performance framework, recovery or withholding.
Non-executive directors’ appointment letters
Name Date of appointment Current letter of appointment start date
Oliver Corbett 3 June 2014 17 November 2016Geoffrey Howe 4 January 2011 17 November 2016Lesley Jones 23 December 2013 17 November 2016Bridget Macaskill 21 November 2013 17 November 2016Mike Biggs 14 March 2017 14 March 2017
Consideration of shareholders’ viewsThe chairman of the board consults our major shareholders on a regular basis on key issues, including remuneration. The Committee took issues of concern raised by shareholders in prior years into account when determining the Policy.

Close Brothers Group plc Annual Report 201782
Directors’ Remuneration Report continued
Annual Report on Remuneration
Remuneration CommitteeCommittee roles and responsibilitiesThe Committee’s key objectives are to:• determine the overarching principles and parameters of the Remuneration Policy on a group-wide basis;• establish and maintain a competitive remuneration package to attract, motivate and retain high calibre EDs and senior
management across the group;• promote the achievement of the group’s annual plans and strategic objectives by providing a remuneration package that
contains appropriately motivating targets that are consistent with the group’s risk appetite; and• align senior executives’ remuneration with the interests of shareholders.
The Committee’s main responsibilities are to:• review and determine the total remuneration packages of EDs and other senior executives in consultation with the chairman
and chief executive and within the terms of the agreed Policy;• approve the design and targets of any performance related pay schemes operated by the group;• review the design of all employee share incentive plans;• ensure that contractual terms on termination and any payments made are fair to the individual and the group, that failure is not
rewarded and that a duty to mitigate risk is fully recognised;• review any major changes in employee benefits structures throughout the group;• select, appoint and determine terms of reference for independent remuneration consultants to advise the Committee on
Remuneration Policy and levels of remuneration;• ensure that the remuneration structures in the group are compliant with the rules and requirements of regulators, and all
relevant legislation;• ensure that provisions regarding disclosure of remuneration are fulfilled; and• seek advice from group control functions to ensure remuneration structures and annual bonuses are appropriately aligned to
the group’s risk appetite.
MembershipThe Committee comprises Bridget Macaskill as chairman, together with each of the other independent non-executive directors. Seven meetings were held during the year and a record of attendance at meetings is set out on page 56.
The chairman of the board, group chief executive, group head of human resources and the head of reward and HR operations also attend meetings by invitation.
Activity in the 2017 financial yearThe Committee has a standing calendar of items within its remit, and these were addressed during the year. In addition to these standing items, the main focus of the Committee was developing the new executive Remuneration Policy, however other significant issues that the Committee discussed during the year were as follows:• the review of the annual bonus targets and objectives for EDs;• assessment of the vesting of Long Term Incentive Plan (“LTIP”) and Share Matched Plan (“SMP”) awards;• regular reviews of regulatory and legislative changes and developments;• review of the monitoring and management information for employee sales incentive schemes in the group; and• the annual performance, salary and variable remuneration review.
Implementation of new PolicyWe have set out below the implementation of the Policy as it relates to the 2018 financial year.
Base salary
Salary effective from 1 August 2017 Percentage Increase
Group Chief Executive £550,000 1.9%Group Finance Director £415,000 1.7%Group Head of Legal and Regulatory Affairs £337,500 2.0%
These were determined with reference to the ED’s role and experience, increases for the broader population and external factors. The Committee determined that it was appropriate for the EDs’ salary increases to be lower than the average for the general employee population of approximately 3%.
The EDs will receive benefits in line with those outlined in the Remuneration Policy table on page 74. There will be no increases to the allowances for benefits other than any potential increase of providing them.
The EDs will continue to receive a cash allowance in lieu of a pension equivalent to 22.5% of base salary.

Close Brothers Group plc Annual Report 2017G
overnance83
2018 Annual bonus (i.e. bonus awarded in respect of the 2018 performance year)
Weightings Vesting ranges
Nature of measures Choice of measures Targets
Group chief executive and group
finance directorGroup head of legal
and regulatory affairs All
Financial RoE 12 to 20% 60% 40% Threshold – 33%1Maximum – 100%
Non-financial Strategic scorecard:• Strategic objectives• People and customer• Risk, conduct and
compliance
Discretionary assessment
40% 60% Minimum – 0%Maximum – 100%
1 Performance below threshold on the RoE measure would result in zero vesting of the financial measure.
The annual bonuses will be subject to the caps and based on assessment against the performance measures outlined in the Remuneration Policy table on page 75. Because of commercial sensitivity, the details of the performance targets and achievement against those will be outlined in the 2018 Annual Report on Remuneration.
2017 LTIP (i.e. LTIP awarded in respect of the 2018 to 2020 cycle)
Nature of measures Choice of measures Targets Weightings Vesting ranges
Financial Adjusted EPS growth 10 to 30% over 3 years 35% Threshold – 25%Maximum – 100%
RoE 12 to 20%1 35% Threshold – 25%Maximum – 100%
Non-financial Risk management objectives Discretionary assessment against detailed goals
30% Threshold – 25%Maximum – 100%
1 Average over three year performance period.
The LTIP awards will be subject to the caps outlined in the Remuneration Policy table on page 76 and determined in line with the targets shown in the table above.
The Committee believes these targets are appropriately stretching and effectively align the EDs’ interests with those of shareholders. Because of commercial sensitivity, the details of the performance targets and achievement against those for the risk management objectives will be outlined in the 2018 Annual Report on Remuneration.
Implementation of the existing PolicySingle total figure of remuneration for EDs 2017 (Audited)
Salary Benefits Annual bonus1Performance
awards2,3 Pension Total
2017 2016 2017 2016 2017 2016 2017 2016 2017 2016 2017 2016
Name £’000 £’000 £’000 £’000 £’000 £’000 £’000 £’000 £’000 £’000 £’000 £’000
Preben Prebensen 540 540 24 20 1,474 1,545 1,246 1,728 122 122 3,406 3,955
Stephen Hodges4 485 485 14 13 444 1,397 1,091 1,482 109 109 2,143 3,486
Jonathan Howell 408 408 13 13 1,097 1,126 941 1,330 92 92 2,551 2,969
Elizabeth Lee 331 353 16 14 292 336 492 488 75 82 1,206 1,273
1 Any amount of annual bonus above 100% of base salary is deferred into group shares.2 The figures for the performance awards for 2016 have been re-calculated using the actual share price on the dates of vesting for the LTIP and Matched SMP shares
of £13.74. The three month average to 31 July 2016 was used for the 2016 report given that the awards were vesting after publication of the report.3 The figures for the performance award for 2017 have been calculated using the three month average to 31 July 2017.4 Stephen Hodges retired from the board in November 2016 and his bonus has been pro-rated accordingly. He has continued to receive salary and benefits during his
notice period.
Link between reward and performanceThe group’s financial results have been good this year, and over the past three years. Adjusted operating profit has increased 13% in the year to £264.8 million, and it has grown 32% or 10% per annum compounded over the last three financial years on a reported basis. Notwithstanding the increase in the tax rate, RoE remains strong at 17.9% compared to 18.5% in 2014. Dividend growth was 5% this year, with dividend cover remaining at 2.2 times up from 2.1 times in 2014.

Close Brothers Group plc Annual Report 201784
Directors’ Remuneration Report continued
The strong RoE has been reflected in the EDs’ bonuses, with the element of the bonus determined based on RoE being 86% of the potential maximum. The adjusted EPS growth of 26.5% over the last three years has resulted in the EPS element of the LTIP vesting at 55.8%. The compounded TSR of 10.1% per annum has met the threshold target under the LTIP and vested at 25.6%. The continued prudent approach to capital management combined with a good performance in risk, compliance and controls mean that the risk management objectives element vested at 92.1%. As a result, the LTIP will vest at 51.0% this year (see page 89 for further details).
Additional disclosures on the single total remuneration figure for EDs table (Audited)SalaryThe per annum salaries paid during the year are as shown in the single total remuneration figure table shown on page 83. There were no increases between 2016 and 2017. When reviewing salary levels, the Committee takes into account the individual’s role and experience, pay for the broader employee population and external factors, where applicable. The salary increases awarded to EDs for the 2018 financial year are lower than the average increase for the general employee population which is 3%.
BenefitsThe EDs each received an allowance in lieu of a company car. Preben Prebensen received £18,000 while the others received £12,000. These allowances have not been increased since 2012. They also received private health cover. The discount to the share price on grant of SAYE options is included in the year of grant.
PensionThe EDs all received a monthly cash pension allowance equivalent to 22.5% of base salary. They do not receive any additional pension provision.
Annual bonus: Achievement against targets The bonuses for EDs were determined with reference to RoE targets and stretching personal goals relevant to each ED’s role and business accountabilities. The RoE for the 2017 financial year was 17.9% against a maximum target of 20%, warranting an award of 86.0% of the potential maximum bonus for this element. Any annual bonus above the level of the 2017 base salary was deferred into group shares vesting in equal tranches over three years in line with the 2014 Remuneration Policy.
Achievement against annual bonus targets
Financial target (RoE) Personal objectives
Name Weighting
Threshold (33.33% of
potential maximum)
Target (66.67% of
potential maximum)
Potential maximum (100% of potential
maximum)
Actual RoE(86.0% of potential
maximum)
Actual amount
awarded (£’000s) Weighting
Potential maximum
(£’000s)
Actual per cent awarded
Actual amount
awarded (£’000s)
Total bonus
awarded (£’000s)
Preben Prebensen 60% 12% 15% 20% 17.9% 836 40% 648 98.5% 638 1,474Stephen Hodges 60% 12% 15% 20% 17.9% 250 40% 194 100.0% 194 444Jonathan Howell 60% 12% 15% 20% 17.9% 632 40% 490 95.0% 465 1,097Elizabeth Lee 40% 12% 15% 20% 17.9% 114 60% 198 90.0% 178 292
Annual bonus: Personal goals for the 2017 financial yearUnder the current policy, performance for each individual is assessed against a range of personal objectives. These objectives are agreed with the Committee at the start of each financial year and are designed to be stretching for the individual and the business, while maintaining consistency and stability in the group’s strategy, business model and performance.
The Committee undertakes a rigorous assessment of each individual’s contribution against these objectives in determining the outcomes for the annual bonus.
Shareholders will note that the Committee is proposing to replace the personal objectives with a shared strategic scorecard, which includes measures relating to strategy; people and customers; and risk, compliance and conduct and which will be common to all EDs. This remains subject to shareholder approval.
The table on page 86 sets out examples of the personal objectives which were in place in 2017, performance against these objectives and an overview of the factors that the Committee has taken into account when assessing the performance of the executives. For reasons of commercial sensitivity, not all performance criteria can be disclosed.
Where the objectives are common to EDs, they have been shown under the headings of the new proposed strategic scorecard. These disclosures have been further supplemented by an additional table providing further assessment against the individual ED’s objectives.

Close Brothers Group plc Annual Report 2017G
overnance85
Performance against group-wide ED objectives
Element Objective Performance Extent to which target has been met
Strategic Adherence to the lending model
Strong NIM of 8.1%Bad debt 0.6% – ten year range of 0.6% to 2.6%Return on net loan book at 3.6% (typical range 3.0% to 3.7%)Underwriting criteria maintained (e.g. average motor LTVs remained within range of 75% to 85%)Moderating loan book growth of 7% (ten year range of 6% to 23%)
The group has demonstrated strong adherence to the lending model despite competitive pressures with all key metrics within range in particular clear discipline on underwriting criteria and a very strong return on net loan book
Maintain prudent levels of capital funding and liquidity
CET1 capital ratio 12.6% vs fully loaded regulatory requirement of 9.1%Average duration of funding allocated to loan book at 21 months vs loan book at 14Continue to comfortably meet the liquidity coverage ratio requirements
Prudent position maintained with CET1 capital ratio remaining comfortably ahead of regulatory requirements notwithstanding regulatory increase in RWA. Borrow long lend short funding approach and diversity of funding position maintained
Maintain investment while controlling costs
Group expense/income ratio 60% (2016: 61%)Banking division expense/income ratio 49% (2016: 49%)
Excellent performance maintaining a stable expense/income ratio whilst executing multiple investment programmes
Identify new products and adjacent market opportunities
Good progress has been made across the group, notably the launch of technology leasing services, acquisition of Novitas, a specialist provider of loans to the legal sector, and regulatory approval to operate a branch in Ireland and a further subsidiary in Germany
People and customer
Maintain strong employee engagement
In 2017 90% of employees were satisfied working for the group (2015: 88%)
Very high levels of employee engagement have been maintained
Achieve high customer satisfaction
Strong Net Promoter Scores (e.g. NPS Treasury +72, Motor +58.7). High levels of repeat business from our Commercial Finance customers (e.g. asset finance 72%) and Property Finance 75%. Continued low levels of customer complaints. Extensive primary research conducted with significant numbers of intermediaries and customers, beyond that covered by standard customer surveys
Strong levels of customer satisfaction has been maintained
Risk conduct and compliance
Preserved strong compliance with risk appetite, legal and regulatory obligations across the group
The group has operated within its risk appetiteNo material negative issues identified by Risk or Audit Committee during the year Brexit forum established General Data Projection Regulation (“GDPR”) project initiated100% of relevant staff completing mandatory regulatory training
Group continues to operate within its risk appetite and has maintained a strong culture of good conduct and regulatory awareness
Performance objective has been achieved
Satisfactory outcome, further progress to be made
Performance objective has not been met

Close Brothers Group plc Annual Report 201786
Directors’ Remuneration Report continued
Performance against individual ED objectives
Executive Director Objective Performance in 2016 and extent to which the Committee judged performance criteria had been met
Preben Prebensen Overall performance of the group
Strong overall performance with adjusted operating profit growth of 13% to £264.8 million including increases of 24% in the Property Finance segment and strong loan book growth rates in premium finance. Significant progress in Asset Management with net inflows of 9% and a 21% increase in AOP. Strong trading performance at Winterflood with operating profit up almost 50% and only one loss day.
Progress key investment projects
Strong performance, with multiple material investment projects progressing on time and within budget including delivery of new contact centre, customer portal and e-signature capability in premium finance; design work complete for new treasury deposit platform and customer relationships management system in the Banking division; successful migration to a single platform in Asset Management and successful launch of new technology platform in Winterflood Business Services.
Conduct strategic review of the motor finance business
Successfully completed a strategic review of the motor finance business and initiated an investment programme to improve the service proposition, streamline operational processes and improve sales effectiveness.
Ensure the smooth transition of leadership in the Banking division
The transition to the new board and management structure in the Banking division was successfully executed with regulatory approvals and management of key individuals. Senior Managers Regime responsibilities have been transferred to the group chief executive and organisation is operating very effectively with the new structure.
Jonathan Howell Accurate, appropriate, clear and timely reporting
Consistently high quality, clear and accurate reporting with significant enhancements to segmental reporting made during the year. Positive feedback received from the Audit Committee, external auditor, analysts and shareholders.
Assume oversight responsibility for the treasury function
Achieved smooth and effective transition of treasury function, establishing a strong working relationship with group treasurer and wider team, and successful oversight of tier 2 issuance with effective collaboration between finance, investor relations and treasury functions.
Execute effective audit tender
Oversaw effective tender process, resulting in unanimous decision to recommend appointment of PwC. Positive feedback from Audit Committee throughout the process.
Manage group capital Robust capital planning ensuring continued sound capital position, absorbing impact of RWA increase during the year, and continuing to meet expectations of regulators, shareholders, creditors and rating agencies.
Elizabeth Lee Provide leadership on key legal and regulatory issues
Provided strong and effective leadership and support to the business on all legal and regulatory issues, in particular on regulatory and governance aspects of the chairman and Banking chief executive succession, extension of the Senior Managers Regime to Asset Management and establishment of the GDPR project.
Strengthen capability and succession in key control and support functions
Achieved a smooth and effective restructuring of the compliance, company secretarial and group legal functions to improve capability and succession.
Ensure the group’s insurance provision remains appropriate
Delivered extension of insurance to cover data breaches and cyber crime.
Stephen Hodges Overall performance of the Banking division
Delivered effective and consistent leadership of the Banking division, overseeing strong performance in the first quarter of the year.
Ensure the smooth transition of the Banking chief executive role
The transition of responsibility to Preben Prebensen for direct oversight of the Banking division, to Adrian Sainsbury for the lending businesses and to Jonathan Howell for treasury was completed successfully.
Performance objective has been achieved
Satisfactory outcome, further progress to be made
Performance objective has not been met

Close Brothers Group plc Annual Report 2017G
overnance87
Performance awardsThe performance awards in the single total figure of remuneration include the 2014 LTIP grant and the 2014 Matched SMP Shares. Both of these will vest on 30 September 2017.
The performance targets for the 2014 awards vesting in 2017 were weighted 40% adjusted EPS, 40% absolute TSR and 20% risk management objectives. The adjusted EPS targets were RPI +3% per annum to RPI +10% per annum and the absolute TSR targets were +10% per annum to +20% per annum. Compounded adjusted EPS growth over the three year period to 2017 was a good 8.2% per annum, while the TSR was 10.1% per annum, meaning the EPS element will vest at 55.8% and the TSR element will vest at 25.6%. The risk management objectives of the 2014 LTIP and Matched SMP Shares were assessed at 92.1% by the Committee. More details on the rationale for the assessment are provided in the table on page 88. Accordingly, the 2014 LTIP and Matched SMP Shares will vest at 51.0%. The LTIP and SMP awards vested at 67.9% in 2016.
The share price for the LTIP and Matched SMP Shares increased by 7% over the three year period from the date of grant to the end of the performance period. The average share price used to value the awards due to vest in October 2017 was 1,560.5p (from 2 May 2017 to 31 July 2017, which was the performance measurement period). The 2014 LTIP and SMP awards were originally granted at 1,429.4p. While the increase in share price remains positive over the performance period, the single total figures of remuneration for the EDs are down from the previous year, primarily due to the slowdown in share price growth.
The performance awards also include the amount (in cash or shares) equal to the dividends which would have been paid during the period from the beginning of the performance period to the time that the awards vest.
The Committee assessed performance against the risk management objectives after each of the three years of the LTIP performance period. The results of each assessment are shown in the table below.
Details of the assessment of the risk management objectives for the LTIP and SMPThe Committee considers it to be of critical importance to ensure that remuneration arrangements continue to incentivise discipline in the management of the firm’s capital and balance sheet and in the delivery of the business model.
The Committee undertakes a robust assessment of performance against the risk management objectives to ensure that payments to EDs are fair and appropriate with consideration for individual and corporate performance. In doing so, the Committee assesses performance against a number of key measures in making its determination.
Performance was assessed after each of the three years of the LTIP performance period, with each year’s review carrying a weighting of one third towards the overall vesting for the award, ensuring a fair assessment of progress over the three year period.
The results of each assessment are shown in the table below and we have also set out examples of the risk management objectives for year three including enhanced disclosure on how the Committee applied its judgement to determine year three’s vesting outcome on page 88.
Element Year one assessment Year two assessment Year three assessment Overall vesting
Capital and balance sheet management 100% 100% 100% 100%Risk, compliance and controls 80% 85% 87.5% 84.2%Overall vesting 92.1%

Close Brothers Group plc Annual Report 201788
Directors’ Remuneration Report continued
Year three performance assessment
Element Measure Extent to which the Committee determined the target has been met
Capital and balance sheet management
Capital requirements CET1 capital ratio of 12.6% remains significantly ahead of fully-loaded minimum requirement of 9.1%. Successful issue of £175 million of tier 2 capital increasing total capital ratio to 15.2%.
Dividend payout Full year dividend increased 5% with strong dividend cover at 2.2x, consistent with the group’s progressive dividend policy.
Funding Term funding increased to £4.8 billion which will cover c.70% of the loan book and we continue to have access to a wide range of funding sources.
Liquidity Continue to comfortably meet the Liquidity Coverage Ratio requirements.
Risk, compliance and controls
Regulatory relationship Continued good regulatory relationship with both the PRA and FCA. Successful completion of ILAAP discussions with PRA. BaFin approval of a license application for an Asset Finance business in Germany. Ireland branch application approved.
Risk management governance
Three lines of defence model complete and in place.
Risk management information
Improved flow of management information to the Risk Committee, increasing the continued effectiveness of its challenge and oversight and enhancing visibility on risk and compliance issues across the group.
Risk appetite framework Enhancement of the risk appetite framework with additional quantitative overlays to support the group’s risk management.
Cyber detection and monitoring
Improvements in cyber detection and monitoring capabilities have been made and a new chief information security officer has been appointed to increase our capability in this area. Cyber security continues to be an important focus for the group in the forthcoming year as cyber threats continue to increase and evolve.
Conduct risk Enhanced conduct risk dashboards established at divisional and group level. Strong engagement from management during the year.
Emerging risk monitoring
Enhancement of stress testing capabilities and establishment of a group-wide forum to manage the potential impacts of Brexit. Completion of deep dive reviews of the property and motor portfolios.
Asset and liability management
Implementation of new asset and liability management system to support more sophisticated stress testing approach.
Interest rate, FX and market risk
Interest rate, FX and market risk methodologies enhanced.
Performance objective has been achieved
Satisfactory outcome, further progress to be made
Performance objective has not been met

Close Brothers Group plc Annual Report 2017G
overnance89
Details of the overall vesting for the LTIP and SMP
Performance measure Threshold target Maximum target Actual achieved Overall vesting
Adjusted EPS growth RPI +3% p.a. RPI +10% p.a. 8.2% p.a. 55.8%TSR +10% p.a. +20% p.a. 10.1% p.a. 25.6%
Risk management objectives n/a n/a
As per thetable onpage 88 92.1%
Overall vesting 51.0%
Historical vesting of LTIP awards compared to adjusted EPS and absolute TSRThe following graph and table show the level of LTIP vesting following performance testing for the last eight years.
LTIP vesting %Adjusted EPS and TSR growth
0 0
20
40
60
80
100
50
100
150
200
350
300
250
33% 33% 25%
79%
51%
68%
97%95%
LTIP vestingAEPSTSR
2014awardvested20173
2007awardvested20101
2008awardvested20111
2009awardvested20122
2010awardvested20132
2011awardvested20142
2012awardvested20153
2013awardvested20163
1 Vesting was subject to two thirds adjusted EPS and one third TSR for awards granted in 2007 and 2008.2 Vesting was subject to one third adjusted EPS, one third absolute TSR and one third strategic goals for all awards granted between 2009 and 2011, inclusive.3 Vesting was subject to 40% adjusted EPS, 40% absolute TSR and 20% risk management objectives for the 2012 to 2014 awards.
Note: This graph shows the vesting percentage of the LTIP compared with the adjusted EPS rebased to 100 at 31 July 2011, and the TSR based on £100 invested in Close Brothers Group plc on 31 July 2011.
LTIP vesting for the last five years
Vesting percentage
Year awarded Year vested Adjusted EPS TSR Goals Total
20101 2013 66% 92% 80% 79% 20111 2014 100% 100% 85% 95% 20121 2015 100% 100% 87% 97%20132 2016 100% 25% 89% 68% 20142 2017 56% 26% 92% 51%
1 Vesting was subject to one third adjusted EPS, one third absolute TSR and one third strategic goals for all awards granted between 2010 and 2011, inclusive.2 Vesting was subject to 40% adjusted EPS, 40% absolute TSR and 20% risk management objectives for the 2012 to 2014 awards.

Close Brothers Group plc Annual Report 201790
Directors’ Remuneration Report continued
Performance graphThe graph below shows a comparison of TSR for the company’s shares for the eight years ended 31 July 2017 against the TSR for the companies comprising the FTSE 250 Index.
July 2009 July 2010 July 2011 July 2012 July 2013 July 2015 July 2017 July 2016
0
50
100
150
200
250
300
350
FTSE 250
July 2014
Close BrothersSource: Thomson Reuters Datastream.
Note: This graph shows the value, by 31 July 2017, of £100 invested in Close Brothers Group plc on 31 July 2009 compared with the value of £100 invested in the FTSE 250 Index. The other points plotted are the intervening financial year ends. TSR has been calculated assuming that all dividends are reinvested on their ex-dividend date. The index has been selected because the company has been a constituent of the index throughout the period. The closing mid-market price of the company’s shares on 31 July 2017 was 1,540p and the range during the year was 1,242p to 1,715p.
Chief executive: historical information
2010 2011 2012 2013 2014 20152 20161 2017
Preben PrebensenSingle figure of total
remuneration (’000)2 £1,890 £2,187 £2,496 £5,748 £7,411 £5,962 £3,995 £3,406Annual bonus against maximum
opportunity 90% 95% 90% 100% 100% 98% 95% 91%LTIP, SMP and Matching Share
Award vesting 33% 33% 25% 79% 95% 97% 68% 51%
1 The figures for the performance awards for 2016 have been re-calculated using the actual share price on the dates of vesting for the LTIP and Matched SMP shares of £13.74. In the 2016 report, the three month average to 31 July 2016 was used given that the awards were vesting after publication of the report.
2 The figures for 2011 to 2014 include the Matching Share Awards that were granted in 2009 at the time of Preben Prebensen’s appointment as chief executive.

Close Brothers Group plc Annual Report 2017G
overnance91
Change in remuneration of the chief executiveThe following table shows how the remuneration of the chief executive increased compared to the general employee population for the 2017 financial year. The Committee deemed it appropriate for Preben Prebensen to receive a salary increase below that received by the general employee population. The change in bonus for Preben Prebensen reflects the achievement against the RoE and personal goals targets, outlined on pages 85 and 86. The increase in average bonus for the general employee population primarily reflects improved business performance as shown on page 1 and the improvement in trading income in Winterflood, leading to an increase in bonuses in that division. The average increase in bonus for the general employee population excluding Winterflood was 3%.
Average change in salary for 2017
(from 1 August 2016)1
Average change in benefits for 2017
(from 1 August 2016)2
Average change in annual bonus
for 20173
Preben Prebensen – – (4.6%)All employee population 3% 3% 13%
1 Calculated as the average percentage increase in salary for those eligible for an increase at 1 August 2016.2 Calculated as the average percentage increase in benefits for those eligible for a salary increase at 1 August 2016.3 The percentage increase in the average bonus calculated as the total bonus spend divided by the average headcount for financial years 2016 and 2017.
Relative importance of spend on payThe following table shows the total remuneration paid compared to the total distributions to shareholders.
2017 £ million
2016 £ million
Remuneration paid 286.6 257.1Distributions to shareholders1 89.4 84.0
1 Interim dividend paid and final dividend proposed for the financial year.
Scheme interests awarded during the year (Audited)The face value and key details of the share awards granted in the 2017 financial year are shown in the table below. These were all delivered as nil cost options. The Deferred Share Award (“DSA”) is a mandatory deferral of a portion of the annual bonus. The share price used to calculate the number of shares awarded was £13.786, the average mid-market closing price for the five days prior to grant.
Name Award type1 Vesting periodPerformance
conditionsFace value
‘000
Percentage vesting at threshold
Number ofshares
Vesting/performance
period end date
Preben Prebensen DSA2 1–3 years No £465 n/a 33,765 04-Oct-19LTIP 3 years Yes £1,080 25% 78,341 04-Oct-19SMP – Invested 3 years No £540 n/a 39,171 04-Oct-19SMP – Matching 3 years Yes £1,080 25% 78,342 04-Oct-19
Stephen Hodges DSA2 1–3 years No £912 n/a 66,140 04-Oct-19LTIP 3 years Yes – n/a – 04-Oct-19SMP – Invested 3 years No – n/a – 04-Oct-19SMP – Matching 3 years Yes – n/a – 04-Oct-19
Jonathan Howell DSA2 1–3 years No £310 n/a 22,493 04-Oct-19LTIP 3 years Yes £750 25% 54,404 04-Oct-19SMP – Invested 3 years No £408 n/a 29,596 04-Oct-19SMP – Matching 3 years Yes £816 25% 59,192 04-Oct-19
Elizabeth Lee DSA2 1–3 years No – n/a – 04-Oct-19LTIP 3 years Yes £400 25% 29,015 04-Oct-19SMP – Invested 3 years No £200 n/a 14,508 04-Oct-19SMP – Matching 3 years Yes £400 25% 29,016 04-Oct-19
1 The awards are all delivered as nil cost options.2 The DSA vests in equal tranches over three years.
External appointmentsJonathan Howell received £77,000 in fees (2016: £77,000) from The Sage Group plc during the Close Brothers 2017 financial year. None of the other EDs held any external directorships during the year.
Since 1 September 2017 Preben Prebensen has been a non-executive director of The British Land Company PLC, but did not receive any fees during the Close Brothers 2017 financial year.

Close Brothers Group plc Annual Report 201792
Directors’ Remuneration Report continued
Payments to past directors (Audited)There were no payments to past directors after they had left office during the year.
Payments for loss of office (Audited)There were no payments made to directors for loss of office during the year.
Changes to the boardFollowing Stephen Hodges’ retirement in November 2016 and as disclosed in the Annual Report 2016, Stephen did not receive a 2016 LTIP award. For 2017 Stephen was awarded a bonus that has been pro-rated to reflect the length of his service as an ED in the year, and has continued to receive his salary and benefits during his notice period. No LTIP award is proposed for 2017. Stephen will be treated as a good leaver in line with the current Remuneration Policy for previous DSA, LTIP and SMP awards.
Statement of voting on the Remuneration Policy at the 2014 AGM
For AgainstNumber of
abstentions
Directors’ Remuneration Policy 92.5% 7.5% 5,247,011
Statement of voting on the Remuneration Report at the 2016 AGM
For AgainstNumber of
abstentions
Annual Report on Remuneration 93.4% 6.6% 7,038,220
The primary reasons cited for the votes against and actions taken in response are as follows:
Reason Action taken by the Committee
Concern raised regarding the presence of the share matching plan
Following the review of Remuneration Policy the current LTIP and Share Matching Plan will be replaced with a single LTIP award.
Lack of five year deferral within the LTIP Following the review of the Remuneration Policy a two year holding period post vesting on the LTIP has been introduced, increasing the deferral period to five years which in turn will increase alignment of EDs’ remuneration to industry best practice and shareholder interests.
EDs’ shareholding and share interests (Audited)The interests of the directors in the ordinary shares of the group as at 31 July 2017 are set out below:
Name
Shareholding
requirement at 31 July
20171
Number of shares
owned outright2
2017
Outstanding share
awards not subject to performance conditions3
Outstanding share awards subject to
performance conditions4 Outstanding options5
2017 2016 2017 2016 2017 2016
Preben Prebensen 70,130 742,045 160,522 173,521 436,096 446,337 2,237 1,745Jonathan Howell6 52,988 200,577 115,685 125,752 324,426 339,234 – –Elizabeth Lee 21,478 40,378 41,893 35,946 167,570 156,622 2,321 1,745
1 Based on the closing mid-market share price of 1,540p on 31 July 2017.2 This includes shares owned outright by closely associated persons.3 This includes DSA and SMP Invested Shares.4 This includes LTIP awards and Matched SMP Shares.5 This comprises SAYE options.6 At 31 July and 16 September 2017, Jonathan Howell held 500,000 of the company’s subordinated loan notes due 2027.
No EDs held shares that were vested but unexercised at 31 July 2017. There were no changes in notifiable interests between 1 August 2017 and 16 September 2017, other than the purchase of shares by Preben Prebensen within the SIP which increased his shareholdings to 742,065 shares.

Close Brothers Group plc Annual Report 2017G
overnance93
Details of EDs’ share exercises during the year (Audited)
Name Award type
Held at 1 August
2016 Called1 Lapsed
Market price on award
p
Market price on calling
p
Total value on calling1
£
Dividends paid on
vested shares£
Preben Prebensen 2013 DSA 14,297 14,297 – 1,168.2 1,378.0 197,007 23,6852014 DSA 11,964 5,981 – 1,429.4 1,378.0 82,416 6,8522015 DSA 33,213 22,856 – 1,493.4 1,378.0 314,947 13,3582013 LTIP 81,322 55,186 26,136 1,168.2 1,378.0 760,441 91,4252013 SMP – Invested 42,801 42,801 – 1,168.2 1,378.0 589,781 70,9072013 SMP – Matched 85,602 58,090 27,512 1,168.2 1,378.0 800,457 96,236
Stephen Hodges 2013 DSA 24,876 24,876 – 1,168.2 1,392.6 346,423 50,6642014 DSA 10,775 5,386 – 1,429.4 1,392.6 75,005 8,2172015 DSA 31,338 20,758 – 1,493.4 1,392.6 289,076 20,0202013 LTIP 66,085 44,846 21,239 1,168.2 1,392.6 624,525 91,3362013 SMP – Invested 38,521 38,521 – 1,168.2 1,392.6 536,443 78,4542013 SMP – Matched 77,042 52,281 24,761 1,168.2 1,392.6 728,065 106,479
Jonathan Howell 2013 DSA 9,723 9,723 – 1,168.2 1,378.0 133,979 16,1082014 DSA 6,997 3,498 – 1,429.4 1,378.0 48,201 4,0072015 DSA 22,433 16,406 – 1,493.4 1,378.0 226,068 9,5882013 LTIP 63,346 42,987 20,359 1,168.2 1,378.0 592,344 71,2152013 SMP – Invested 32,529 32,529 – 1,168.2 1,378.0 448,237 53,8902013 SMP – Matched 65,058 44,149 20,909 1,168.2 1,378.0 608,356 73,140
Elizabeth Lee 2013 LTIP 29,961 20,332 9,629 1,168.2 1,374.4 279,445 33,6832013 SMP – Invested 8,561 8,561 – 1,168.2 1,374.4 117,663 14,1832013 SMP – Matched 17,122 11,619 5,503 1,168.2 1,374.4 159,693 19,249
1 These are the actual number of shares and values realised on calling and may not sum due to rounding.
Notes to the details of directors’ share exercises during the yearThe DSA is a mandatory deferral of a portion of the annual bonus.
The DSA, LTIP and SMP consist of the right for EDs to call for shares in the company from the employee benefit trust or Treasury Shares, at nil cost, together with a cash amount representing accrued notional dividends thereon. The DSA, LTIP and SMP awards may be forfeited if the ED leaves employment in certain circumstances preceding the vesting date. They may be called for at any time up to 12 months from the date of vesting. The value of the awards is charged to the group’s income statement in the year to which the award relates for the DSA and Invested SMP Shares, and spread over the vesting period for the LTIP and Matched SMP Share awards.
The LTIP awards are held under the 2009 LTIP and are subject to the performance criteria described in the Remuneration Policy on page 89. The Matched SMP Shares are subject to the same performance criteria.
Details of EDs’ option exercises during the year (Audited)
Name Award type
Held at 1 August
2015 Exercised LapsedExercise price
p
Market price on exercise
p
Gain on calling
£
Preben Prebensen 2013 SAYE 966 966 – 931.0 1,440.0 4,917Stephen Hodges – – – – – – –Jonathan Howell – – – – – – –Elizabeth Lee 2013 SAYE 966 966 – 931.0 1,435.0 4,869

Close Brothers Group plc Annual Report 201794
Directors’ Remuneration Report continued
Single total figure of Remuneration for non-executive directors (Audited)
Fees1 Benefits2 Fees1 Benefits2
2017 2016
Name £’000 £’000 £’000 £’000
Oliver Corbett 100 – 100 –Geoffrey Howe 95 – 95 –Lesley Jones 100 2 100 3Bridget Macaskill 100 13 100 7Strone Macpherson3 165 – 220 –Mike Biggs4 86 1 – –
1 Non-executive director fees were increased with effect from 1 August 2015.2 Benefits include travel related expenses in respect of attendance at board meetings which are taxable. Amounts disclosed have been grossed up using the appropriate
tax rate as the company pays the NEDs’ tax.3 Strone Macpherson retired on 30 April 2017.4 Mike Biggs was appointed a director on 14 March 2017 and chairman from 1 May 2017.
Notes to the single total figure of remuneration for non-executive directorsThe fees payable to non-executive directors for the 2017 and 2018 financial years are as follows:
Role 2018 2017
Chairman1 £300,000 £220,000Non-executive director £67,000 £65,000Supplements Senior independent director £20,000 £15,000Chairman of Audit Committee £30,000 £25,000Chairman of Remuneration Committee £30,000 £25,000Chairman of Risk Committee £30,000 £25,000Committee membership2 £5,000 £5,000
1 The chairman receives no other fees for chairmanship or membership of board committees.2 No fees are payable to the chairman, or for membership, of the Nomination and Governance Committee.
Non-executive directors’ share interests (Audited)The interests of the directors in the ordinary shares of the company are set out below:
Name
Shares held beneficially at
31 July 20171
Shares held beneficially at
31 July20162
Oliver Corbett – –Geoffrey Howe 5,000 5,000Lesley Jones – –Bridget Macaskill 2,500 2,500Strone Macpherson 13,300 13,300Mike Biggs – –
1 Or date of retirement, if earlier.2 Or date of appointment, if later.
There were no changes in notifiable interests between 1 August 2017 and 16 September 2017.

Close Brothers Group plc Annual Report 2017G
overnance95
AdviceDuring the year under review and up to the date of this report, the Committee consulted and took advice from the following advisers and executives:• PwC;• Chairman of the board;• Group chief executive;• Group head of HR;• Head of reward and HR operations;• Group chief risk officer; and• Company secretary.
Where the Committee seeks advice from employees this never relates to their own remuneration.
PwC provided consultancy services to the group during the financial year and were originally engaged to advise on remuneration in 2008. PwC are a member of, and adhere to, the Remuneration Consultants Group Voluntary Code of Conduct. PwC were paid £284,016 in fees for remuneration services related to the 2017 financial year. The Committee has satisfied themselves that the advice received from all parties named above was objective and independent.
This report was approved by the board of directors on 26 September 2017 and signed on its behalf by:
Bridget MacaskillChairman of the Remuneration Committee

Close Brothers Group plc Annual Report 201796
Photographed on location at Matsuura Machinery Ltd.
In today’s increasingly impersonal world, we recognise the value of building long-term relationships with our customers, many of which span decades and generations. Staying close to our clients helps us understand their particular needs and tailor our solutions accordingly.

Close Brothers Group plc Annual Report 2017F
inancial State
ments
97
Financial Statements98 Independent Auditor’s Report to the
Members of Close Brothers Group plc102 Consolidated Income Statement103 Consolidated Statement of
Comprehensive Income104 Consolidated Balance Sheet105 Consolidated Statement of Changes in Equity106 Consolidated Cash Flow Statement107 Company Balance Sheet108 Company Statement of Changes in Equity109 The Notes150 Glossary152 Investor Relations/Cautionary Statement

Close Brothers Group plc Annual Report 201798
Report on the Audit of the Financial Statements
OpinionIn our opinion:• the financial statements give a true and fair view of the state of
the group’s and of the parent company’s affairs as at 31 July 2017 and of the group’s profit for the year then ended;
• the group financial statements have been properly prepared in accordance with International Financial Reporting Standards (“IFRSs”) as adopted by the European Union;
• the parent company financial statements have been properly prepared in accordance with United Kingdom Generally Accepted Accounting Practice including Financial Reporting Standard 102 “The Financial Reporting Standard applicable in the UK and Republic of Ireland”; and
• the financial statements have been prepared in accordance with the requirements of the Companies Act 2006 and, as regards the group financial statements, Article 4 of the International Accounting Standards (“IAS”) Regulation.
We have audited the financial statements of Close Brothers Group plc (the ‘parent company’) and its subsidiaries (the ‘group’) which comprise: • the Consolidated Income Statement; • the Consolidated Statement of Comprehensive Income; • the Consolidated Balance Sheet; • the Consolidated Statement of Changes in Equity; • the Consolidated Cash Flow Statement;• the Company Balance Sheet; • the Company Statement of Changes in Equity; and• the related notes 1 to 29.
The financial reporting framework that has been applied in the preparation of the group financial statements is applicable law and IFRSs as adopted by the European Union. The financial reporting framework that has been applied in the preparation of the parent company financial statements is applicable law and United Kingdom Accounting Standards including Financial Reporting Standard 102 “The Financial Reporting Standard applicable in the UK and Republic of Ireland” (United Kingdom Generally Accepted Accounting Practice).
Basis for opinionWe conducted our audit in accordance with International Standards on Auditing (UK) (ISAs (UK)) and applicable law. Our responsibilities under those standards are further described in the auditor’s responsibilities for the audit of the financial statements section of our report.
We are independent of the group and the parent company in accordance with the ethical requirements that are relevant to our audit of the financial statements in the UK, including the FRC’s Ethical Standard as applied to listed public interest entities, and we have fulfilled our other ethical responsibilities in accordance with these requirements. We confirm that the non-audit services prohibited by the FRC’s Ethical Standard were not provided to the group or the parent company.
We believe that the audit evidence we have obtained is sufficient and appropriate to provide a basis for our opinion.
Summary of our audit approachKey audit mattersThe key audit matters that we identified in the current year were:• Loan impairment provisions; and• Revenue recognition.
Independent Auditor’s Report to the Members of Close Brothers Group plc
MaterialityThe materiality that we used in the current year was £12.9 million, which was determined on the basis of 5% of operating profit before tax.
Scoping Each of the four components of the group, Banking (comprising Retail Finance, Commercial Finance and Property), Asset Management, Securities and the Group central functions, were subject to a full scope audit.
Significant changes in our approachThere have been no significant changes in our approach, reflecting the stability in the business year-on-year.
Conclusions relating to principal risks, going concern and viability statementWe have reviewed the directors’ statement regarding the appropriateness of the going concern basis of accounting contained within note 1 to the financial statements and the directors’ statement on the longer-term viability of the group contained within the strategic report on pages 52 and 53.
We are required to state whether we have anything material to add or draw attention to in relation to:• the disclosures on pages 16 to 19 that describe the principal
risks and explain how they are being managed or mitigated;• the directors’ confirmation on pages 53 and 59 that they have
carried out a robust assessment of the principal risks facing the group, including those that would threaten its business model, future performance, solvency or liquidity;
• the directors’ statement in note 1 to the financial statements about whether they considered it appropriate to adopt the going concern basis of accounting in preparing them and their identification of any material uncertainties to the group and the parent company’s ability to continue to do so over a period of at least twelve months from the date of approval of the financial statements;
• the directors’ explanation on page 52 as to how they have assessed the prospects of the group, over what period they have done so and why they consider that period to be appropriate, and their statement as to whether they have a reasonable expectation that the group will be able to continue in operation and meet its liabilities as they fall due over the period of their assessment, including any related disclosures drawing attention to any necessary qualifications or assumptions; or
• whether the directors’ statements relating to going concern and the prospects of the company required in accordance with Listing Rule 9.8.6R(3) are materially inconsistent with our knowledge obtained in the audit.
We confirm that we have nothing material to add or draw attention to in respect of these matters.
We agreed with the directors’ adoption of the going concern basis of accounting and we did not identify any such material uncertainties. However, because not all future events or conditions can be predicted, this statement is not a guarantee as to the group’s ability to continue as a going concern.
Key audit mattersKey audit matters, which are similar to the matters as identified in the prior year, are those matters that, in our professional judgement, were of most significance in our audit of the financial statements of the current period and include the most significant assessed risks of material misstatement (whether

Close Brothers Group plc Annual Report 2017F
inancial State
ments
99
due to fraud or error) that we identified. These matters included those which had the greatest effect on: the overall audit strategy, the allocation of resources in the audit and directing the efforts of the engagement team.
These matters were addressed in the context of our audit of the financial statements as a whole, and in forming our opinion thereon, and we do not provide a separate opinion on these matters.
Key audit matter How the scope of our audit responded to the key audit matter Key observations
Loan impairment provisions As detailed in note 2, critical accounting estimates and judgements on page 114 and the key accounting judgements section of the Audit Committee Report on pages 64 and 65, loan impairment provisions in the Commercial Finance, Retail Finance and Property Finance divisions reflect estimates of the amount and timing of future recoveries which require an assessment of matters such as future economic conditions and the value of collateral. Estimates, by their nature, give rise to a higher risk of material misstatement due to error or fraud. Loan impairment provisions of £52.4 million represented approximately 0.76% of loans and advances to customers. The income statement charge for the year was £40.2 million.
Our procedures included understanding and testing the controls in respect of the group’s loan impairment process such as the timely recognition of impairment provisions, the completeness and accuracy of reports used in the loan impairment process and management review processes over the calculation of collective and specific provisions.
We tested the inputs used in collective impairment models and considered whether those inputs reflected default and recovery experience across each of the divisions’ portfolios appropriately adjusted to reflect current experience and economic conditions where relevant.
We audited a sample of specific provisions against individually significant impaired loans including challenging collateral values and discount rates assumed in the provisions and, where relevant, with the assistance of our property valuation specialists.
We determined that the provisioning methodologies used and the assumptions management have made are appropriate and the loan impairment provision at year end is reasonable.
Revenue recognitionInterest income and fee and commission income is detailed in note 2, critical accounting estimates and judgements on page 114 and is included in the key accounting judgements section of the Audit Committee Report on pages 64 and 65. The group’s revenue recognition policy is detailed in note 1, significant accounting policies on pages 110 and 111.• Interest income
Interest income on loans and advances made by the group is recognised using the effective interest rate method and any fees and direct transaction costs that form an integral part of the yield are included in the effective interest rate. The identification of applicable fees and direct costs to be included in the effective interest rate can be judgemental and therefore there is a higher risk of material misstatement due to error or fraud. The group’s net interest income was £461.6 million.
• Fee and commission incomeThis primarily arises in the Banking and Asset Management divisions. The group’s fee and commission income was £206.5 million.
The timing of recognition of fees can be judgemental as fees may be recognised immediately or over a period depending on the nature of the service provided and determining accrued fees can involve the use of estimates.
Interest incomeWe audited the effective interest rate models by testing controls, challenging the assumptions used to estimate the effective interest rates used in determining interest income and re-performing a sample of effective interest rate calculations. This included using our computer audit specialists to test the extraction of data used in the calculations. We audited a sample of lending arrangements by agreeing them to loan agreements and cash receipts and we assessed whether the appropriate fees and costs had been reflected in the effective interest rate.
Fee and commission incomeWe obtained a sample of Asset Management client agreements and checked that accrued fees had been calculated in accordance with the agreements, recognised appropriately and challenged related estimates.
We tested controls over revenue recognition in the Commercial Finance and Retail Finance divisions. We audited a sample of lending fees receivable in the Commercial Finance, Retail Finance and Property Finance divisions by agreeing them to loan agreements and cash receipts; and we assessed the accounting treatment and timing of recognition of the fee.
We determined that the income recognition policy for each fee income stream tested is appropriate and was correctly applied.
We determined that the effective interest rate models used and the assumptions management have made are appropriate and that interest income is not materially misstated at year end.
The principal change to the key audit matters that were identified in the prior year is that we do not consider the impairment of goodwill to be a key audit matter in the current year. In the prior year, we particularly focused on the Securities and Asset Management divisions given their relative performance. In the current year, the performance of each division has been strong and the group’s impairment tests demonstrate that there is significant headroom in each of the group’s cash generating units which is insensitive to reasonably possible changes in assumptions.

Close Brothers Group plc Annual Report 2017100
Independent Auditor’s Report to the Members of Close Brothers Group plc continued
Our application of materialityWe define materiality as the magnitude of misstatement in the financial statements that makes it probable that the economic decisions of a reasonably knowledgeable person would be changed or influenced. We use materiality both in planning the scope of our audit work and in evaluating the results of our work.
Based on our professional judgement we determined materiality for the group financial statements as a whole as follows:
Group materiality£12,900,000 (2016: £11,000,000)
Basis for determining materiality5% of operating profit before tax (2016: 5% of operating profit before tax). Materiality has increased in line with increases in the group’s profits.
Rationale for the benchmark appliedOperating profit before tax was used as the basis for determining materiality as we believe it is the key metric used by members of the company in assessing financial performance. We agreed with the Audit Committee that we would report to the Committee all audit differences in excess of £258,000 (2016: £220,000), as well as differences below that threshold that, in our view, warranted reporting on qualitative grounds. We also report to the Audit Committee on disclosure matters that we identified when assessing the overall presentation of the financial statements.
An overview of the scope of our auditOur group audit scope focused on each of the divisions of the group, all of which comprise subsidiaries which are subject to full scope audits for the year ended 31 July 2017. Our audits of each subsidiary were planned using levels of materiality appropriate for each subsidiary on a standalone basis, up to a maximum of £11.6 million (2016: £9.9 million). Together with the group’s and the banking central functions, which were also subject to a full scope audit, our audit scope covered the entire group.
The group audit team works closely with the divisional and subsidiary audit teams throughout the audit and the Senior Statutory Auditor met with divisional senior management during the year.
Other informationThe directors are responsible for the other information. The other information comprises the information included in the annual report, other than the financial statements and our auditor’s report thereon. Our opinion on the financial statements does not cover the other information and, except to the extent otherwise explicitly stated in our auditor’s report, we do not express any form of assurance conclusion thereon.
In connection with our audit of the financial statements, our responsibility is to read the other information and, in doing so, consider whether the other information is materially inconsistent with the financial statements or our knowledge obtained in the audit or otherwise appears to be materially misstated.
If we identify such material inconsistencies or apparent material misstatements, we are required to determine whether there is a material misstatement in the financial statements or a material misstatement of other information. If, based on the work we have performed, we conclude that there is a material misstatement of this other information, we are required to report that fact.
In this context, matters that we are specifically required to report to you as uncorrected material misstatements of the other information include where we conclude that:• the statement given by the directors that they consider the
annual report and financial statements taken as a whole is fair, balanced and understandable and provides the information necessary for shareholders to assess the group’s performance, business model and strategy, is materially inconsistent with our knowledge obtained in the audit; or
• the section describing the work of the audit committee does not appropriately address matters communicated by us to the audit committee; or
• the parts of the directors’ statement required under the Listing Rules relating to the company’s compliance with the UK Corporate Governance Code containing provisions specified for review by the auditor in accordance with Listing Rule 9.8.10R(2) do not properly disclose a departure from a relevant provision of the UK Corporate Governance Code.
We have nothing to report in respect of these matters.
Responsibilities of directorsAs explained more fully in the directors’ responsibilities statement, the directors are responsible for the preparation of the financial statements and for being satisfied that they give a true and fair view, and for such internal control as the directors determine is necessary to enable the preparation of financial statements that are free from material misstatement, whether due to fraud or error.
In preparing the financial statements, the directors are responsible for assessing the group’s and the parent company’s ability to continue as a going concern, disclosing as applicable, matters related to going concern and using the going concern basis of accounting unless the directors either intend to liquidate the group or the parent company or to cease operations, or have no realistic alternative but to do so.
Auditor’s responsibilities for the audit of the financial statementsOur objectives are to obtain reasonable assurance about whether the financial statements as a whole are free from material misstatement, whether due to fraud or error, and to issue an auditor’s report that includes our opinion. Reasonable assurance is a high level of assurance, but is not a guarantee that an audit conducted in accordance with ISAs (UK) will always detect a material misstatement when it exists. Misstatements can arise from fraud or error and are considered material if, individually or in the aggregate, they could reasonably be expected to influence the economic decisions of users taken on the basis of these financial statements.
A further description of our responsibilities for the audit of the financial statements is located on the Financial Reporting Council’s website at: www.frc.org.uk/auditorsresponsibilities. This description forms part of our auditor’s report.

Close Brothers Group plc Annual Report 2017F
inancial State
ments
101
Use of our reportThis report is made solely to the company’s members, as a body, in accordance with Chapter 3 of Part 16 of the Companies Act 2006. Our audit work has been undertaken so that we might state to the company’s members those matters we are required to state to them in an auditor’s report and for no other purpose. To the fullest extent permitted by law, we do not accept or assume responsibility to anyone other than the company and the company’s members as a body, for our audit work, for this report, or for the opinions we have formed.
Report on Other Legal and Regulatory RequirementsOpinions on other matters prescribed by the Companies Act 2006In our opinion the part of the Directors’ Remuneration Report to be audited has been properly prepared in accordance with the Companies Act 2006.
In our opinion, based on the work undertaken in the course of the audit: • the information given in the Strategic Report and the
Directors’ Report for the financial year for which the financial statements are prepared is consistent with the financial statements; and
• the strategic report and the directors’ report have been prepared in accordance with applicable legal requirements.
In the light of the knowledge and understanding of the group and of the parent company and their environment obtained in the course of the audit, we have not identified any material misstatements in the Strategic Report or the Directors’ Report.
Matters on which we are required to report by exceptionAdequacy of explanations received and accounting recordsUnder the Companies Act 2006 we are required to report to you if, in our opinion:• we have not received all the information and explanations we
require for our audit; or• adequate accounting records have not been kept by the
parent company, or returns adequate for our audit have not been received from branches not visited by us; or
• the parent company financial statements are not in agreement with the accounting records and returns.
We have nothing to report in respect of these matters.
Directors’ remunerationUnder the Companies Act 2006 we are also required to report if in our opinion certain disclosures of directors’ remuneration have not been made or the part of the Directors’ Remuneration Report to be audited is not in agreement with the accounting records and returns.
We have nothing to report arising from these matters.
Other mattersAuditor tenure Following the recommendation of the audit committee, we were appointed at the Annual General Meeting on 6 November 1984 to audit the financial statements for the year ended 31 July 1985 and subsequent financial periods. The period of total uninterrupted engagement including previous renewals and reappointments of the firm is 33 years, covering the years ended 31 July 1985 to 31 July 2017.
Consistency of the audit report with the additional report to the audit committeeOur audit opinion is consistent with the additional report to the audit committee we are required to provide in accordance with ISAs (UK).
Robert Topley (Senior statutory auditor)For and on behalf of Deloitte LLPStatutory AuditorLondon, United Kingdom
26 September 2017

Close Brothers Group plc Annual Report 2017102
Consolidated Income Statementfor the year ended 31 July 2017
Note2017
£ million2016
£ million
Interest income 4 578.9 550.1Interest expense 4 (117.3) (127.5)
Net interest income 461.6 422.6
Fee and commission income 4 206.5 189.2Fee and commission expense 4 (29.0) (28.5)Gains less losses arising from dealing in securities 94.2 67.9Other income 57.3 55.8Depreciation of operating lease assets 15 (25.0) (19.6)
Non-interest income 304.0 264.8
Operating income 765.6 687.4
Administrative expenses 4 (460.6) (415.9)Impairment losses on loans and advances 10 (40.2) (37.9)Total operating expenses before amortisation of intangible assets on acquisition (500.8) (453.8)Operating profit before amortisation of intangible assets on acquisition 264.8 233.6Amortisation of intangible assets on acquisition 14 (6.2) (5.1)
Operating profit before tax 258.6 228.5Tax 6 (67.7) (42.2)Profit after tax 190.9 186.3Profit attributable to non-controlling interests (0.3) (0.2)
Profit attributable to shareholders 191.2 186.5
Basic earnings per share 7 128.3p 125.7pDiluted earnings per share 7 127.5p 124.3p
Interim dividend per share paid 8 20.0p 19.0pFinal dividend per share 8 40.0p 38.0p

Close Brothers Group plc Annual Report 2017F
inancial State
ments
103
Consolidated Statement of Comprehensive Incomefor the year ended 31 July 2017
2017 £ million
2016£ million
Profit after tax 190.9 186.3
Other comprehensive income/(expense) that may be reclassified to income statement Currency translation gains 0.4 3.2Gains/(losses) on cash flow hedging 4.7 (6.1)Gains on financial instruments classified as available for sale:
Sovereign and central bank debt 0.7 –Equity shares – 0.2Contingent consideration 0.3 –
Available for sale investment gains transferred to income statement on disposal – (4.2)Tax relating to items that may be reclassified (2.3) 0.9
3.8 (6.0)
Other comprehensive income/(expense) that will not be reclassified to income statementDefined benefit pension scheme gains/(losses) 2.7 (1.9)Tax relating to items that will not be reclassified (0.5) 0.3
2.2 (1.6)
Other comprehensive income/(expense), net of tax 6.0 (7.6)
Total comprehensive income 196.9 178.7
Attributable toNon-controlling interests (0.3) (0.2)Shareholders 197.2 178.9
196.9 178.7

Close Brothers Group plc Annual Report 2017104
Note2017
£ million2016
£ million
AssetsCash and balances at central banks 805.1 847.4Settlement balances 546.7 478.1Loans and advances to banks 9 99.8 121.5Loans and advances to customers 10 6,884.7 6,431.6Debt securities 11 240.1 221.3Equity shares 12 32.7 28.2Loans to money brokers against stock advanced 48.6 52.4Derivative financial instruments 13 27.0 44.7Intangible assets 14 191.7 147.9Property, plant and equipment 15 202.7 185.8Deferred tax assets 6 47.4 55.2Prepayments, accrued income and other assets 16 158.7 134.1
Total assets 9,285.2 8,748.2
LiabilitiesSettlement balances and short positions 17 552.6 475.6Deposits by banks 18 72.0 71.1Deposits by customers 18 5,113.1 4,894.6Loans and overdrafts from banks 18 330.9 469.1Debt securities in issue 18 1,489.6 1,422.8Loans from money brokers against stock advanced 4.3 30.0Derivative financial instruments 13 11.5 16.3Current tax liabilities 21.4 20.0Accruals, deferred income and other liabilities 16 233.1 205.4Subordinated loan capital 19 220.7 46.4
Total liabilities 8,049.2 7,651.3
EquityCalled up share capital 20 38.0 37.7Share premium account 307.8 284.0Retained earnings 906.6 797.5Other reserves (15.9) (22.1)
Total shareholders’ equity 1,236.5 1,097.1
Non-controlling interests (0.5) (0.2)
Total equity 1,236.0 1,096.9
Total liabilities and equity 9,285.2 8,748.2
Approved and authorised for issue by the Board of Directors on 26 September 2017 and signed on its behalf by:
Michael N. Biggs P. PrebensenChairman Chief Executive
Registered number: 520241
Consolidated Balance Sheetat 31 July 2017

Close Brothers Group plc Annual Report 2017F
inancial State
ments
105
Other reserves
Called up share capital
£ million
Share premium account £ million
Retained earnings £ million
Available for sale
movements reserve
£ million
Share- based
payments reserve
£ million
Exchange movements
reserve £ million
Cash flow hedging reserve
£ million
Total attributable
to equity holders £ million
Non- controlling
interests £ million
Total equity
£ million
At 1 August 2015 37.7 284.0 694.4 3.3 (4.5) (2.8) (2.3) 1,009.8 0.1 1,009.9
Profit for the year – – 186.5 – – – – 186.5 (0.2) 186.3Other comprehensive
(expense)/income – – (1.6) (3.3) – 1.7 (4.4) (7.6) – (7.6)Total comprehensive
income/(expense) for the year – – 184.9 (3.3) – 1.7 (4.4) 178.9 (0.2) 178.7
Exercise of options – – – – – – – – – –Dividends paid – – (80.3) – – – – (80.3) – (80.3)Shares purchased – – – – (24.4) – – (24.4) – (24.4)Shares issued – – – – – – – – – –Shares released – – – – 12.8 – – 12.8 – 12.8Other movements – – (2.5) – 1.8 – – (0.7) (0.1) (0.8)Income tax – – 1.0 – – – – 1.0 – 1.0
At 31 July 2016 37.7 284.0 797.5 – (14.3) (1.1) (6.7) 1,097.1 (0.2) 1,096.9
Profit for the year – – 191.2 – – – – 191.2 (0.3) 190.9Other comprehensive
income/(expense) – – 2.2 0.7 – (0.4) 3.5 6.0 – 6.0Total comprehensive
income/(expense) for the year – – 193.4 0.7 – (0.4) 3.5 197.2 (0.3) 196.9
Exercise of options – 0.1 – – – – – 0.1 – 0.1Dividends paid – – (85.6) – – – – (85.6) – (85.6)Shares purchased – – – – (12.7) – – (12.7) – (12.7)Shares issued 0.3 23.7 – – – – – 24.0 – 24.0Shares released – – – – 15.8 – – 15.8 – 15.8Other movements – – 0.2 – (0.7) – – (0.5) – (0.5)Income tax – – 1.1 – – – – 1.1 – 1.1
At 31 July 2017 38.0 307.8 906.6 0.7 (11.9) (1.5) (3.2) 1,236.5 (0.5) 1,236.0
Consolidated Statement of Changes in Equityfor the year ended 31 July 2017

Close Brothers Group plc Annual Report 2017106
Note2017
£ million2016
£ million
Net cash inflow/(outflow) from operating activities 26(a) 120.0 (18.8)
Net cash (outflow)/inflow from investing activitiesPurchase of:Property, plant and equipment (7.1) (13.6)Intangible assets – software (33.1) (21.7)Subsidiaries and non-controlling interest 26(b) (6.3) (3.6)Sale of:Property, plant and equipment – 0.1Equity shares held for investment 1.3 7.6Subsidiary 26(c) (0.3) 2.3
(45.5) (28.9)
Net cash inflow/(outflow) before financing activities 74.5 (47.7)
Financing activitiesPurchase of own shares for employee share award schemes (12.7) (24.4)Equity dividends paid (85.6) (80.3)Interest paid on subordinated loan capital and debt financing (13.6) (28.0)Redemption of group bond (200.0) –Issuance of subordinated loan capital, net of transaction costs 173.7 –
Net decrease in cash (63.7) (180.4)Cash and cash equivalents at beginning of year 923.3 1,103.7
Cash and cash equivalents at end of year 26(e) 859.6 923.3
Consolidated Cash Flow Statementfor the year ended 31 July 2017

Close Brothers Group plc Annual Report 2017F
inancial State
ments
107
Company Balance Sheetat 31 July 2017
Note2017
£ million2016
£ million
Fixed assetsIntangible assets 14 – –Property, plant and equipment 15 – –Investments in subsidiaries 29 287.0 287.0
287.0 287.0
Current assetsAmounts owed by subsidiaries 520.9 559.8Corporation tax receivable 5.4 6.3Deferred tax assets 6 2.6 3.5Other debtors 5.3 2.6Other investments 0.5 1.7Cash at bank 0.2 0.2
534.9 574.1Creditors: amounts falling due within one yearDebt securities in issue 18 – 205.9Provisions 16 2.1 2.9Other creditors 0.7 1.0Accruals 8.8 8.3
11.6 218.1
Net current assets 523.3 356.0
Total assets less current liabilities 810.3 643.0
Creditors: amounts falling due after more than one yearSubordinated loan capital 173.8 –Provisions 16 4.0 4.1
Net assets 632.5 638.9
Capital and reservesShare capital 20 38.0 37.7Share premium account 20 307.8 284.0Profit and loss account 20 298.6 331.4Other reserves (11.9) (14.2)
Shareholders’ funds 632.5 638.9
The Company reported a profit for the financial year ended 31 July 2017 of £50.7 million (2016: £106.2 million).
Approved and authorised for issue by the Board of Directors on 26 September 2017 and signed on its behalf by:
Michael N. Biggs P. PrebensenChairman Chief Executive

Close Brothers Group plc Annual Report 2017108
Other reserves
Share capital
£ million
Share premium account £ million
Profit and loss account £ million
Share- based
payments reserve
£ million
Exchange movements
reserve £ million
Shareholders’ funds
£ million
At 1 August 2015 37.7 284.0 309.8 (4.5) 3.1 630.1
Profit for the year – – 106.2 – – 106.2Other comprehensive expense – – (1.6) – (3.0) (4.6)Total comprehensive income/(expense) for the year – – 104.6 – (3.0) 101.6Exercise of options – – – – – –Dividends paid – – (80.3) – – (80.3)Shares purchased – – – (24.4) – (24.4)Shares issued – – – – – –Shares released – – – 12.8 – 12.8Other movements – – (2.7) 1.8 – (0.9)
At 31 July 2016 37.7 284.0 331.4 (14.3) 0.1 638.9
Profit for the year – – 50.7 – – 50.7Other comprehensive income/(expense) – – 2.2 – (0.1) 2.1Total comprehensive income/(expense) for the year – – 52.9 – (0.1) 52.8Exercise of options – 0.1 – – – 0.1Dividends paid – – (85.6) – – (85.6)Shares purchased – – – (12.7) – (12.7)Shares issued 0.3 23.7 – – – 24.0Shares released – – – 15.8 – 15.8Other movements – – (0.1) (0.7) – (0.8)
At 31 July 2017 38.0 307.8 298.6 (11.9) – 632.5
Company Statement of Changes in Equityfor the year ended 31 July 2017

Close Brothers Group plc Annual Report 2017F
inancial State
ments
109
The Notes
1. Significant accounting policies(a) Reporting entityClose Brothers Group plc (“the company”), a public limited company incorporated and domiciled in the UK, together with its subsidiaries (collectively, “the group”), operates through five (2016: three) operating segments: Commercial Finance, Retail Finance, Property Finance (previously all Banking), Securities and Asset Management, and is primarily located within the UK.
The company financial statements (“the company accounts”) have been prepared in compliance with United Kingdom Accounting Standards, including Financial Reporting Standard 102 ‘‘The Financial Reporting Standard applicable in the United Kingdom and the Republic of Ireland’’ (‘‘FRS 102’’) and the Companies Act 2006, under the provision of the Large and Medium-sized Companies and Groups (Accounts and Reports) Regulations 2008 (SI 2008/410).
As permitted by FRS 102, the company has chosen to adopt IAS 39 Financial Instruments where applicable and taken advantage of the disclosure exemptions available under that standard in relation to the presentation of a cash flow statement, share-based payments and related party transactions. Where required, equivalent disclosures are given in the consolidated financial statements of the group. The company has also taken advantage of the exemption in Section 408 of the Companies Act 2006 not to present its company income statement and related notes.
(b) Compliance with International Financial Reporting StandardsThe consolidated financial statements (“the consolidated accounts”) have been prepared and approved by the directors in accordance with all relevant IFRSs as issued by the International Accounting Standards Board and interpretations issued by the IFRS Interpretations Committee endorsed by the EU.
Standards adopted during the yearThere were no new standards adopted during the year ended 31 July 2017. The accounting policies adopted are consistent with those of the previous financial year.
Standards issued with effective dates, subject to EU endorsement, which do not impact on these financial statementsIFRS 9 Financial InstrumentsIFRS 9 replaces IAS 39 Financial Instruments: Recognition and Measurement and is effective for the group from 1 August 2018. IFRS 9 will lead to significant changes in the accounting for financial instruments, in particular, the impairment requirements.
The group does not intend to restate comparatives on initial application of IFRS 9. Instead the classification and measurement and impairment requirements will be applied retrospectively by adjusting the opening balance sheet on 1 August 2018. Transitional disclosures will be provided in accordance with IFRS 7 Financial Instruments: Disclosures.
Impairment Currently under IAS 39, a provision is only recognised when a loss event has been incurred. When this is separately identified, an individual provision is recognised. Where this is not the case, a collective provision is recognised based on past experience of losses that have been incurred at the balance sheet date.
IFRS 9 replaces the incurred loss impairment approach with an Expected Credit Loss (“ECL”) model. This will result in impairment provisions which are recognised earlier as it is no longer necessary for a loss event to be incurred before a provision is recognised.
Under IFRS 9, expected credit losses are the unbiased probability weighted average credit losses determined by evaluating a range of possible outcomes and future economic conditions. The ECL model has three stages:
Stage 1: when a significant increase in credit risk since initial recognition has not occurred, 12 month expected credit losses are recognised meaning a provision will be recognised for all stage 1 financial assets. This requirement does not exist under IAS 39 and therefore is likely to result in an increased provision.
Stage 2: when a significant increase in credit risk since initial recognition has occurred, lifetime expected credit losses are recognised. This concept does not exist under IAS 39 and therefore it is likely to result in increased provisions as a result of recognising a lifetime ECL for loans that are not considered to be credit impaired.
Stage 3: when objective evidence exists that an asset is credit-impaired, lifetime expected credit losses are recognised. This is broadly consistent with the incurred loss approach in IAS 39.
IFRS 9 impairment modelsThe group has developed new initial models to meet the requirements of IFRS 9. The group’s IFRS 9 models will use three key input parameters for the calculation of expected credit loss, being probability of default (“PD”), loss given default and exposure at default. Discounting will be performed using the effective interest rate at the balance sheet reporting date.
In assessing whether a significant increase in credit risk has occurred the group will apply a multifactor approach using quantitative measures (e.g. changes in PD or credit score since origination) and qualitative factors (e.g. watch list processes). As a backstop, all financial assets that are 30 days past due will be considered to have experienced a significant increase in credit risk.
A financial asset will only be considered credit impaired if there is objective evidence of impairment. This will include financial assets that are defaulted or 90 days past due.
IFRS 9 requires the incorporation of forward looking macro-economic information that is reasonable and supportable. The group is developing the capability to model a number of economic scenarios to ensure the overall ECL represents a range of economic outcomes.
Impact of IFRS 9 impairment on the groupThe group continues to assess the impact of IFRS 9 and refine ECL methodologies and models. At this stage it is not yet possible to provide a reliable estimate of the quantitative impact of adopting IFRS 9. The group will disclose financial impact estimates when it is reliably able to do so, which will be no later than the 2018 financial statements. The extent of any increase in provisions will depend upon a number of factors including the portfolio mix and macro-economic conditions at the date of implementation.

The Notes continued
Close Brothers Group plc Annual Report 2017110
1. Significant accounting policies continued IFRS 16 LeasesEffective for the group from 1 August 2019, the standard replaces IAS 17 and introduces a new recognition model that recognises all leases on a lessee’s balance sheet (subject to certain exemptions). Lessor accounting is largely unchanged. The standard is not anticipated to have a material impact on the group.
(c) Basis of preparationThe consolidated and company accounts have been prepared under the historical cost convention, except for the revaluation of financial assets and liabilities held at fair value through profit or loss, available for sale financial assets and all derivative financial instruments (“derivatives”).
The financial statements are prepared on a going concern basis as disclosed in the Report of the Directors.
(d) ConsolidationSubsidiariesSubsidiaries are all entities over which the group has control. The group controls an entity when it is exposed to, or has rights to variable returns from its involvement with the entity and has the ability to affect those returns through its power over the entity. Such power generally accompanies a shareholding of more than one half of the voting rights. Subsidiaries are fully consolidated from the date on which the group effectively obtains control. They are de-consolidated from the date that control ceases.
The acquisition method of accounting is used to account for the acquisition of subsidiaries. Under the acquisition method of accounting, with some limited exceptions, the assets, liabilities and contingent liabilities of a subsidiary are measured at their fair values at the date of acquisition. Any non-controlling interest is measured either at fair value or at the non-controlling interest’s proportion of the net assets acquired. Acquisition related costs are accounted for as expenses when incurred, unless directly related to the issue of debt or equity securities. Any excess of the cost of acquisition over net assets is capitalised as goodwill. All intra-group balances, transactions, income and expenses are eliminated.
(e) Foreign currency translationFor the company and those subsidiaries whose balance sheets are denominated in sterling, which is the company’s functional and presentation currency, monetary assets and liabilities denominated in foreign currencies are translated into sterling at the closing rates of exchange at the balance sheet date. Foreign currency transactions are translated into sterling at the average rates of exchange over the year and exchange differences arising are taken to the consolidated income statement.
The balance sheets of subsidiaries denominated in foreign currencies are translated into sterling at the closing rates. The income statements for these subsidiaries are translated at the average rates and exchange differences arising are taken to equity. Such exchange differences are reclassified to the consolidated income statement in the period in which the subsidiary is disposed of.
(f) Revenue recognitionInterest incomeInterest on loans and advances made by the group, and fee income and expense and other direct costs relating to loan origination, restructuring or commitments are recognised in the consolidated income statement using the effective interest rate method.
The ongoing impact of IFRS 9 on the financial results will be driven by the transfer of assets between stages, as well as changing macro-economic assumptions. This may result in impairment charges being more volatile when compared to the current IAS 39 impairment model.
Due to the reduction in reserves at the implementation date, IFRS 9 is likely to have an impact on the group’s regulatory capital position and ratios. The group continues to monitor guidance issued by the Basel Committee on Banking Supervision which proposes arrangements which spread the transitional impact of IFRS 9 over time.
Classification and measurement Under IFRS 9, financial assets will be classified on the basis of the business model within which they are managed and their contractual cash flow characteristics. These factors determine whether the financial assets are measured at amortised cost, fair value through other comprehensive income or fair value through profit or loss. The accounting for financial liabilities is largely unchanged.
The group has performed a transition assessment to determine the potential impact of changes to classification and measurement of financial assets. Based on this analysis it is expected that the adoption of IFRS 9 is unlikely to result in material changes to the existing measurement of financial assets. The group will continue to monitor the final impact as this will be dependent on the business models and contractual cash flow characteristics that exist at the transition date.
Hedge accountingIFRS 9 contains revised requirements which aim to simplify hedge accounting. The standard does not yet address macro hedge accounting strategies, which are being considered in a separate project. Until such time as that project is complete, IFRS 9 includes an accounting policy choice to remain with IAS 39 hedge accounting. During this time the group expects to continue applying IAS 39, although it will implement the amended IFRS 7 hedge accounting disclosure requirements.
Implementation of IFRS 9The group has a full-time implementation team and a jointly accountable finance and risk steering committee which reports into the Audit Committee.
The build and testing phase of impairment models, processes, controls and governance is progressing well. Initial models have been developed for all material portfolios. A 12-month parallel run has commenced to gain a better understanding of the potential effect of the new standard, to validate IFRS 9 ECL models and embed the governance framework.
IFRS 15 Revenue from Contracts with CustomersEffective for the group from 1 August 2018, this standard replaces IAS 18 and IAS 11 and does not apply to financial instruments, lease contracts or insurance contracts which fall under the scope of other IFRSs. The standard introduces a new revenue recognition model which features a contract-based five-step analysis of transactions to determine whether, how much, and when revenue is recognised. The adoption of the standard is not anticipated to have a material impact on the group.
Close Brothers Group plc Annual Report 2017F
inancial State
ments
111
The effective interest rate method applies a rate that discounts estimated future cash payments or receipts relating to a financial instrument to its net carrying amount. The cash flows take into account all contractual terms of the financial instrument including transaction costs and all other premiums or discounts but not future credit losses.
Fees and commissionsWhere fees that have not been included within the effective interest rate method are earned on the execution of a significant act, such as fees arising from negotiating or arranging a transaction for a third party, they are recognised as revenue when that act has been completed. Fees and corresponding expenses in respect of other services are recognised in the consolidated income statement as the right to consideration or payment accrues through performance of services. In particular, upfront commissions paid in respect of managing, as opposed to originating, fund products are initially included within “accruals and deferred income” and then recognised as revenue as the services are provided. To the extent that fees and commissions are recognised in advance of billing they are included as accrued income or expense.
DividendsDividend income is recognised when the right to receive payment is established.
Gains less losses arising from dealing in securitiesNet gains arising from both buying and selling securities and from positions held in securities, including related interest income and dividends.
(g) Exceptional itemsItems of income and expense that are material by size and/or nature and are non-recurring are classified as exceptional items on the face of the consolidated income statement. The separate reporting of these items helps give an indication of the group’s underlying performance.
(h) Financial assets and liabilities (excluding derivatives)ClassificationThe group classifies its financial assets into the following measurement categories: (i) financial assets held at fair value through profit or loss; (ii) loans and receivables; and (iii) available for sale. Financial liabilities are classified as either held at fair value through profit or loss, or at amortised cost using the effective interest method.
Management determines the classification of its financial assets and liabilities at initial recognition.
Financial assets and liabilities held at fair value through profit or lossThis category has two sub-categories: Financial assets and liabilities held for trading, and those designated at fair value through profit or loss at inception.
A financial asset or liability is classified as trading if acquired principally for the purpose of selling in the short-term, which for the group relates to Winterflood, or are derivatives (not in qualifying hedge relationships).
Financial assets and liabilities may be designated at fair value through profit or loss when:• the designation eliminates or significantly reduces a
measurement or recognition inconsistency that would otherwise arise from measuring assets or liabilities on a different basis;
• a group of financial assets and/or liabilities is managed and its performance evaluated on a fair value basis; or
• the assets or liabilities include embedded derivatives and such derivatives are required to be recognised separately.
Financial assets and liabilities held at fair value through profit or loss are subsequently carried at fair value, with gains and losses arising from changes in fair value taken directly to the consolidated income statement.
Loans and receivablesLoans and receivables are non-derivative financial assets with fixed or determinable payments that are not quoted in an active market and it is expected that substantially all of the initial investment will be recovered, other than because of credit deterioration. Loans and receivables are subsequently carried at amortised cost using the effective interest method and recorded net of provisions for impairment losses.
Available for saleAvailable for sale assets are those non-derivative financial assets intended to be held for an indefinite period of time, which may be sold in response to liquidity requirements or changes in interest rates, exchange rates or equity prices. Available for sale financial assets are subsequently carried at fair value, with gains and losses arising from changes in fair value taken to a separate component of equity until the asset is sold, or is impaired, when the cumulative gain or loss is transferred to the consolidated income statement.
The fair values of quoted financial assets or financial liabilities in active markets are based on current prices. If the market for a financial asset or financial liability is not active, or they relate to unlisted securities, the group establishes fair value by using valuation techniques. These include the use of recent arm’s length transactions, discounted cash flow analysis and other valuation techniques commonly used by market participants.
DerecognitionFinancial assets are derecognised when the rights to receive cash flows from the financial assets have expired or where the group has transferred substantially all risks and rewards of ownership. If substantially all the risks and rewards have been neither retained nor transferred and the group has retained control, the assets continue to be recognised to the extent of the group’s continuing involvement. Financial liabilities are derecognised when they are extinguished.
(i) Impairment of financial assetsThe group assesses at each balance sheet date whether there is any objective evidence that a financial asset or group of financial assets classified as available for sale or loans and receivables is impaired. A financial asset or group of financial assets is impaired and an impairment loss incurred if there is objective evidence that an event or events since initial recognition of the asset have adversely affected the amount or timing of future cash flows from the asset.

The Notes continued
Close Brothers Group plc Annual Report 2017112
Financial assets at amortised costIf there is objective evidence that an impairment loss on a financial asset or group of financial assets classified as loans and receivables has been incurred, the group measures the amount of the loss as the difference between the carrying amount of the asset or group of assets and the present value of estimated future cash flows from the asset or group of assets discounted at the effective interest rate of the instrument at initial recognition. Impairment losses are assessed individually for financial assets that are individually significant and individually or collectively for assets that are not individually significant. In making collective assessment of impairment, financial assets are grouped into portfolios on the basis of similar risk characteristics.
For loans and receivables, the amount of the loss is measured as the difference between the loan’s carrying amount and the present value of estimated future cash flows, excluding future credit losses that have not been incurred, discounted at the original effective interest rate. As the loan amortises over its life, the impairment loss may amortise. All impairment losses are reviewed at least at each reporting date. If subsequently the amount of the loss decreases as a result of a new event, the relevant element of the outstanding impairment loss is reversed. Interest on impaired financial assets is recognised at the original effective interest rate applied to the carrying amount as reduced by an allowance for impairment.
For loans that are not considered individually significant, the group adopts a formulaic approach which allocates a loss rate dependent on the overdue period. Loss rates are based on the discounted expected future cash flows and are regularly benchmarked against actual outcomes to ensure they remain appropriate.
Financial assets carried at fair valueWhen a decline in the fair value of a financial asset classified as available for sale has been recognised directly in equity and there is objective evidence that the asset is impaired, the cumulative loss is removed from equity and recognised in the consolidated income statement. The loss is measured as the difference between the amortised cost of the financial asset and its current fair value. Impairment losses on available for sale equity instruments are not reversed through the consolidated income statement but those on available for sale debt instruments are reversed if there is an increase in fair value that is objectively related to a subsequent event.
(j) Settlement accountsSettlement balance debtors and creditors are the amounts due to and from counterparties in respect of the group’s market-making activities and are carried at amortised cost. The balances are short-term in nature, do not earn interest and are recorded at the amount receivable or payable.
(k) Loans to and from money brokers against stock advancedLoans to money brokers against stock advanced is the cash collateral provided to these institutions for stock borrowing by the group’s market-making activities and is carried at amortised cost. Interest is paid on the stock borrowed and earned on the cash deposits advanced. The stock borrowing to which the cash deposits relate is short-term in nature and is recorded at the amount receivable. Loans from money brokers against stock collateral provided is recorded at the amount payable. Interest is paid on the loans.
(l) Finance leases, operating leases and hire purchase contractsA finance lease is a lease or hire purchase contract that transfers substantially all the risks and rewards incidental to ownership of an asset to the lessee. Finance leases are recognised as loans at an amount equal to the gross investment in the lease discounted at its implicit interest rate. Finance charges on finance leases are taken to income in proportion to the net funds invested.
Rental costs under operating leases and hire purchase contracts are charged to the consolidated income statement in equal instalments over the period of the leases. Rental income from operating leases is recognised in equal instalments over the period of the leases and included in other income in the consolidated income statement.
(m) Sale and repurchase agreements and other secured lending and borrowingsSecurities may be sold subject to a commitment to repurchase them. Such securities are retained on the consolidated balance sheet when substantially all the risks and rewards of ownership remain with the group. The transactions are treated as collateralised borrowing and the counterparty liability is included within loans and overdrafts from banks. Similar secured borrowing transactions, including securities lending transactions and collateralised short-term notes, are treated and presented in the same way. These secured financing transactions are initially recognised at fair value, and subsequently valued at amortised cost, using the effective interest rate method.
(n) Securitisation transactionsWhere the group securitises its own financial assets, this is achieved via the sale of these assets to special purpose entities, which in turn issue securities to investors. All financial assets continue to be held on the group’s consolidated balance sheet together with debt securities in issue recognised for the funding – see derecognition policy (h).
(o) Offsetting financial instrumentsFinancial assets and financial liabilities are offset and the net amount presented on the consolidated balance sheet if, and only if, there is a legally enforceable right to set off the recognised amounts and there is an intention to settle on a net basis, or to realise an asset and settle the liability simultaneously.
(p) Derivatives and hedge accountingIn general, derivatives are used to minimise the impact of interest, currency rate and equity price changes to the group’s financial instruments. They are carried on the consolidated balance sheet at fair value which is obtained from quoted market prices in active markets, including recent market transactions and discounted cash flow models.
On acquisition, certain derivatives are designated as a hedge and the group formally documents the relationship between these derivatives and the hedged item. The group also documents its assessment, both at hedge inception and on an ongoing basis, of whether the derivative is highly effective in offsetting changes in fair values or cash flows of hedged items. If a hedge was deemed partially ineffective but continues to qualify for hedge accounting, the amount of the ineffectiveness, taking into account the timing of the expected cash flows where relevant, would be recorded in the consolidated income statement. If the hedge is not, or has ceased to be, highly effective, the group discontinues hedge accounting.
1. Significant accounting policies continued

Close Brothers Group plc Annual Report 2017F
inancial State
ments
113
For fair value hedges, changes in the fair value are recognised in the consolidated income statement, together with changes in the fair value of the hedged item. For cash flow hedges, the fair value gain or loss associated with the effective proportion of the cash flow hedge is recognised initially directly in equity and recycled to the consolidated income statement in the period when the hedged item affects income.
(q) Intangible assetsComputer software (acquired and costs associated with development) and intangible assets on acquisition (excluding goodwill) are stated at cost less accumulated amortisation and provisions for impairment which are reviewed at least annually. Amortisation is calculated to write off their cost on a straight-line basis over the estimated useful lives as follows:
Computer software 3 to 5 yearsIntangible assets on acquisition 8 to 20 years
Goodwill on acquisitions of subsidiaries is included in intangible assets. Goodwill is assessed annually for impairment and carried at cost less any accumulated impairment.
(r) Property, plant and equipmentProperty, plant and equipment is stated at cost less accumulated depreciation and provisions for impairment which are reviewed at least annually. Depreciation is calculated to write off their cost on a straight-line basis over their estimated useful lives as follows:
Long leasehold property 40 yearsShort leasehold property Over the length of the leaseFixtures, fittings and equipment 3 to 5 yearsAssets held under operating leases 1 to 15 yearsMotor vehicles 5 years
(s) Share capitalShare issue costsIncremental costs directly attributable to the issue of new shares or options, including those issued on the acquisition of a business, are shown in equity as a deduction, net of tax, from the proceeds.
Dividends on ordinary sharesDividends on ordinary shares are recognised in equity in the period in which they are paid or, if earlier, approved by shareholders.
Treasury sharesWhere the company or any member of the group purchases the company’s share capital, the consideration paid is deducted from shareholders’ equity as treasury shares until they are cancelled. Where such shares are subsequently sold or reissued, any consideration received is included in shareholders’ equity.
(t) Employee benefitsThe group operates defined contribution pension schemes for eligible employees as well as a defined benefit pension scheme which is closed to new members and further accrual.
Under the defined contribution scheme the group pays fixed contributions into a fund separate from the group’s assets. Contributions are charged in the consolidated income statement when they become payable.
The expected cost of providing pensions within the funded defined benefit scheme, determined on the basis of annual valuations using the projected unit method, is charged to the consolidated income statement. Actuarial gains and losses are recognised in full in the period in which they occur and recognised in other comprehensive income.
The retirement benefit obligation recognised in the balance sheet represents the present value of the defined benefit obligation, as adjusted for unrecognised past service cost, and as reduced by the fair value of scheme assets at the balance sheet date. Both the return on investment expected in the period and the expected financing cost of the liability, as estimated at the beginning of the period, are recognised in the results for the period. Any variances against these estimates in the year form part of the actuarial gain or loss.
The assets of the scheme are held separately from those of the group in an independently managed fund.
(u) Share-based payments to employeesAt 31 July 2017, the group operates four share-based award schemes: an annual bonus plan and three long-term incentive schemes (“Incentive Schemes”); the Share Matching Plan (“SMP”), the 2009 Long Term Incentive Plan (“LTIP”), and the Inland Revenue approved Save As You Earn scheme.
The costs of the awards granted under the annual bonus plan are based on the salary of the individual at the time the award is made. The value of the share award at the grant date is charged to the group’s consolidated income statement in the year to which the award relates.
The cost of the Incentive Schemes is based on the fair value of awards on the date of grant. Fair values for market-based performance conditions are determined using a stochastic (Monte Carlo simulation) pricing model for the SMP and LTIP and the Black-Scholes pricing model for the other schemes. Both models take into account the exercise price of the option, the current share price, the risk-free interest rate, the expected volatility of the company’s share price over the life of the option award and other relevant factors. For non-market-based performance conditions, vesting conditions are not taken into account when measuring fair value, but are reflected by adjusting the number of shares in each award such that the amount recognised reflects the number that are expected to, and then actually do, vest. The fair value is expensed in the consolidated income statement on a straight-line basis over the vesting period, with a corresponding credit to the share-based payments reserve. At the end of the vesting period, or upon exercise, lapse or forfeit if earlier, this credit is transferred to retained earnings. Further information on the group’s schemes is provided in note 25 and in the Directors’ Remuneration Report.
(v) Provisions and contingent liabilitiesProvisions are recognised in respect of present obligations arising from past events where it is probable that outflows of resources will be required to settle the obligations and they can be reliably estimated.
Contingent liabilities are possible obligations whose existence depends on the outcome of uncertain future events or those present obligations where the outflows of resources are uncertain or cannot be measured reliably. Contingent liabilities are not recognised in the financial statements but are disclosed unless they are deemed remote.

The Notes continued
Close Brothers Group plc Annual Report 2017114
(w) Taxes, including deferred taxesCurrent tax is the expected tax payable on the taxable profit for the year. Taxable profit differs from net profit as reported in the consolidated income statement because it excludes items of income and expense that are taxable or deductible in other years and items that are never taxable or deductible. The group’s liability for current tax is calculated using tax rates that have been enacted or substantively enacted by the balance sheet date.
To enable the tax charge to be based on the profit for the year, deferred tax is provided in full on temporary timing differences, at the rates of tax expected to apply when these differences crystallise. Deferred tax assets are recognised only to the extent that it is probable that sufficient taxable profits will be available against which temporary differences can be set. All deferred tax liabilities are offset against deferred tax assets in accordance with the provisions of IAS 12 Income taxes.
(x) Cash and cash equivalentsFor the purposes of the cash flow statement, cash and cash equivalents comprises cash and demand deposits with banks, together with short-term highly liquid investments that are readily convertible to known amounts of cash.
(y) Segmental reportingOperating segments are reported in a manner consistent with the internal reporting provided to the Executive Committee, which is considered the group’s chief operating decision maker. All transactions between business segments are conducted on an arm’s length basis, with intra-segment revenue and costs being eliminated on consolidation. Income and expenses directly associated with each segment are included in determining business segment performance.
2. Critical accounting estimates and judgementsThe reported results of the group are sensitive to the accounting policies, assumptions and estimates that underlie the preparation of its financial statements. UK company law and IFRS require the directors, in preparing the group’s financial statements, to select suitable accounting policies, apply them consistently and make judgements and estimates that are reasonable. The group’s estimates and assumptions are based on historical experience and expectations of future events and are reviewed on an ongoing basis.
Critical accounting judgementsIn the application of the group’s accounting policies, which are described in note 1, judgements that are considered by the board to have the most significant effect on the amounts in the financial statements are as follows.
Revenue recognitionInterest income is recognised using the effective interest rate method, which applies a rate that discounts estimated future cash payments or receipts relating to a financial instrument to their net carrying amount. The estimated future cash flows take into account all contractual terms and expected behavioural life of the financial instrument including transaction fees and costs and all other premiums or discounts but not future credit losses. Other fees and commissions are recognised as services are provided or on completion of the execution of a significant act. Judgement is required in determining the fees and costs which are integral to the yield and should be recognised as interest income, in the estimate of the expected
behavioural life of financial assets, and in determining the period over which to recognise non-interest income.
Loan impairment provisionsLoan impairment provisions are made if there is objective evidence of impairment as a result of one or more subsequent events regarding a significant loan or a portfolio of loans. Determining whether such objective evidence has arisen requires judgement.
GoodwillThe directors review goodwill for impairment at least annually or when events or changes in economic circumstances indicate that impairment may have taken place. The recoverable amounts of relevant CGUs are based on value in use calculations using management’s best estimate of future cash flows and performance, discounted at a rate which the directors estimate to be the return appropriate to the business.
Key sources of estimation uncertaintyLoan impairment provisionsAs at the balance sheet date, the directors consider that loan impairment provisions are a key source of estimation uncertainty which, depending on a range of factors such as changes in the economic environment in the UK, could result in a material adjustment to the carrying amounts of assets and liabilities in the next financial year.
Loan impairment provisions represent management’s estimate of the losses incurred in the loan portfolios at the balance sheet date. Individual impairment losses are determined as the difference between the carrying value and the present value of estimated future cash flows, discounted at the loans’ original effective interest rate. Impairment losses determined on a portfolio basis are calculated using a formulaic approach which allocates a loss rate dependent on the overdue period. Loss rates are based on the discounted expected future cash flows and are regularly benchmarked against actual outcomes to ensure they remain appropriate.
Estimating the amount and timing of future recoveries involves significant judgement, and considers the level of arrears as well as the assessment of matters such as future economic conditions and the value of collateral. As at 31 July 2017, gross impaired loans were £135.8 million (31 July 2016: £158.5 million) against which a £52.4 million (31 July 2016: £59.7 million) provision was recorded. A 10% increase or decrease in expected future recoveries in respect of these impaired loans would decrease or increase provisions respectively by £8.3 million (31 July 2016: £9.9 million).
1. Significant accounting policies continued

Close Brothers Group plc Annual Report 2017F
inancial State
ments
115
3. Segmental analysisThe directors manage the group by class of business and we present the segmental analysis on that basis. As announced on 20 February 2017, following the growth of the group and particularly the Banking division in recent years, the group’s activities are now presented in five (2016: three) operating segments: Retail Finance, Commercial Finance, Property Finance (previously all Banking), Securities and Asset Management. The day-to-day operations of these businesses remain unchanged. Prior periods have been re-presented for comparability.
In the segmental reporting information that follows, Group consists of central functions as well as various non-trading head office companies and consolidation adjustments and is presented in order that the information presented reconciles to the consolidated income statement. The Group balance sheet primarily includes treasury assets and liabilities comprising cash and balances at central banks, debt securities, customer deposits and other borrowings.
Divisions continue to charge market prices for the limited services rendered to other parts of the group. Funding charges between segments take into account commercial demands. More than 90% of the group’s activities, revenue and assets are located in the UK.
Banking
Retail Finance £ million
Commercial Finance £ million
Property Finance £ million
Securities£ million
AssetManagement
£ millionGroup
£ millionTotal
£ million
Summary income statement for the year ended 31 July 2017
Net interest income/(expense) 195.9 146.4 119.8 (0.9) (0.1) 0.5 461.6Non-interest income 26.5 66.9 (0.2) 107.6 103.0 0.2 304.0
Operating income 222.4 213.3 119.6 106.7 102.9 0.7 765.6
Administrative expenses (106.7) (117.4) (24.9) (76.7) (83.7) (24.9) (434.3)Depreciation and amortisation (11.0) (7.8) (3.8) (1.9) (1.8) – (26.3)Impairment losses on loans and advances (25.8) (15.5) 1.1 – – – (40.2)
Total operating expenses (143.5) (140.7) (27.6) (78.6) (85.5) (24.9) (500.8)
Adjusted operating profit/(loss)1 78.9 72.6 92.0 28.1 17.4 (24.2) 264.8Amortisation of intangible assets on acquisition (0.4) (0.5) – – (5.3) – (6.2)
Operating profit/(loss) before tax 78.5 72.1 92.0 28.1 12.1 (24.2) 258.6
External operating income/(expense) 266.2 260.9 141.8 106.7 103.2 (113.2) 765.6Inter segment operating (expense)/income (43.8) (47.6) (22.2) – (0.3) 113.9 –
Segment operating income 222.4 213.3 119.6 106.7 102.9 0.7 765.6
1 Adjusted operating profit/(loss) is stated before amortisation of intangible assets on acquisition and tax.
Banking
Retail Finance £ million
Commercial Finance £ million
Property Finance £ million
Securities£ million
AssetManagement
£ millionGroup2
£ millionTotal
£ million
Balance sheet information at 31 July 2017Total assets1 2,702.8 2,730.4 1,629.3 699.5 113.2 1,410.0 9,285.2Total liabilities – – – 628.8 57.7 7,362.7 8,049.2
1 Total assets for the Banking operating segments comprise the loan book and operating lease assets only.2 Balance sheet includes £1,402.7 million assets and £7,490.9 million liabilities attributable to the Banking division primarily comprising the treasury balances described in
the second paragraph of this note.
Equity is allocated across the group as set out below with equity managed for the Banking division as a whole rather than on a segmental basis. Equity for the Banking division is inclusive of the loan book and operating lease assets of £7,062.5 million, as well as assets and liabilities of £1,402.7 million and £7,490.9 million respectively primarily comprising treasury balances which are included within the Group column above.
Banking£ million
Securities£ million
AssetManagement
£ millionGroup
£ millionTotal
£ million
Equity 974.3 70.7 55.5 135.5 1,236.0

The Notes continued
Close Brothers Group plc Annual Report 2017116
3. Segmental analysis continuedBanking
Retail Finance
Commercial Finance
Property Finance Securities
AssetManagement Group Total
Other segmental information for the year ended 31 July 2017
Employees (average number)1 1,055 1,013 139 246 600 61 3,114
1 Banking segments are inclusive of a central function headcount allocation.
Banking
Retail Finance £ million
Commercial Finance £ million
Property Finance £ million
Securities£ million
AssetManagement
£ millionGroup
£ millionTotal
£ million
Summary income statement for the year ended 31 July 2016
Net interest income/(expense) 181.1 139.2 101.9 (0.6) 0.4 0.6 422.6Non-interest income 23.5 63.1 2.4 82.9 91.9 1.0 264.8
Operating income 204.6 202.3 104.3 82.3 92.3 1.6 687.4
Administrative expenses (95.5) (110.3) (23.9) (61.7) (75.9) (24.2) (391.5)Depreciation and amortisation (12.2) (5.9) (2.5) (1.6) (2.0) (0.2) (24.4)Impairment losses on loans and advances (17.8) (16.5) (3.6) – – – (37.9)
Total operating expenses (125.5) (132.7) (30.0) (63.3) (77.9) (24.4) (453.8)
Adjusted operating profit/(loss)1 79.1 69.6 74.3 19.0 14.4 (22.8) 233.6Amortisation of intangible assets on acquisition (0.3) (0.2) – – (4.6) – (5.1)
Operating profit/(loss) before tax 78.8 69.4 74.3 19.0 9.8 (22.8) 228.5
External operating income/(expense) 251.9 272.1 128.3 82.3 92.9 (140.1) 687.4Inter segment operating (expense)/income (47.3) (69.8) (24.0) – (0.6) 141.7 –
Segment operating income 204.6 202.3 104.3 82.3 92.3 1.6 687.4
1 Adjusted operating profit/(loss) is stated before amortisation of intangible assets on acquisition and tax.
Banking
Retail Finance £ million
Commercial Finance £ million
Property Finance £ million
Securities£ million
AssetManagement
£ millionGroup2
£ millionTotal
£ million
Balance sheet information at 31 July 2016Total assets1 2,511.0 2,623.2 1,457.2 647.5 104.8 1,404.5 8,748.2Total liabilities – – – 577.8 49.1 7,024.4 7,651.3
1 Total assets for the Banking operating segments comprise the loan book and operating lease assets only.2 Balance sheet includes £1,400.0 million assets and £7,198.2 million liabilities attributable to the Banking division primarily comprising the treasury balances described in
the second paragraph of this note.
Banking£ million
Securities£ million
AssetManagement
£ millionGroup
£ millionTotal
£ million
Equity1 793.2 69.7 55.7 178.3 1,096.9
1 Equity for the Banking division is inclusive of the loan book and operating lease assets of £6,591.4 million, as well as assets and liabilities of £1,400.0 million and £7,198.2 million respectively primarily comprising treasury balances which are included within the Group column in the balance sheet information above.
Banking
Retail Finance
Commercial Finance
Property Finance Securities
AssetManagement Group Total
Other segmental information for the year ended 31 July 2016
Employees (average number)1 986 959 132 238 570 61 2,946
1 Banking segments are inclusive of a central function headcount allocation.

Close Brothers Group plc Annual Report 2017F
inancial State
ments
117
4. Operating profit before tax2017
£ million2016
£ million
Interest incomeCash and balances at central banks 2.0 4.1Loans and advances to banks 0.1 0.5Loans and advances to customers 574.6 542.9Other interest income 2.2 2.6
578.9 550.1
Interest expenseDeposits by banks 0.4 0.4Deposits by customers 70.2 79.1Borrowings 40.4 37.4Other interest expense 6.3 10.6
117.3 127.5
Net interest income 461.6 422.6
2017£ million
2016£ million
Fee and commission incomeBanking 89.9 85.4Asset Management 102.8 92.4Securities 13.8 11.4
206.5 189.2
Fee and commission expense (29.0) (28.5)
Net fee and commission income 177.5 160.7
Fee income and expense (other than amounts calculated using the effective interest rate method) on financial instruments that are not at fair value through profit or loss were £89.9 million (2016: £85.4 million) and £26.3 million (2016: £24.8 million) respectively.
Fee income and expense arising from trust and other fiduciary activities amounted to £102.8 million (2016: £92.4 million) and £2.2 million (2016: £3.3 million) respectively.
2017£ million
2016£ million
Administrative expensesStaff costs:Wages and salaries 236.8 211.8Social security costs 33.4 29.0Share-based awards 6.0 6.2Pension costs 10.4 10.1
286.6 257.1Depreciation and amortisation 26.3 24.4Other administrative expenses 147.7 134.4
460.6 415.9

The Notes continued
Close Brothers Group plc Annual Report 2017118
5. Information regarding the auditor2017
£ million2016
£ million
Fees payableAudit of the company’s annual accounts 0.3 0.3Audit of the company’s subsidiaries pursuant to legislation 1.0 0.9Other services pursuant to legislation 0.4 0.3Tax services – 0.2Other services 0.4 0.2
2.1 1.9
The auditor of the group was Deloitte LLP.
6. Taxation2017
£ million2016
£ million
Tax charged/(credited) to the income statementCurrent tax:UK corporation tax 64.8 56.5Foreign tax 2.1 2.5Adjustments in respect of previous years (0.6) (1.1)
66.3 57.9Deferred tax:Deferred tax charge/(credit) for the current year 0.5 (16.5)Adjustments in respect of previous years 0.9 0.8
67.7 42.2
Tax on items not charged/(credited) to the income statementCurrent tax relating to:Financial instruments classified as available for sale 0.2 –Share-based payments (1.0) (2.1)Deferred tax relating to:Cash flow hedging 1.2 (1.7)Defined benefit pension scheme 0.5 (0.3)Financial instruments classified as available for sale 0.1 (0.7)Share-based payments (0.1) 1.1Currency translation gains 0.8 1.5
1.7 (2.2)
Reconciliation to tax expenseUK corporation tax for the year at 19.7% (2016: 20.0%) on operating profit 50.9 45.7Gain on sale of subsidiaries and available for sale investment (0.3) (0.5)Effect of different tax rates in other jurisdictions (0.4) (0.6)Disallowable items and other permanent differences 0.9 1.5Banking surcharge 14.2 8.2Deferred tax impact of decreased/(increased) tax rates 2.1 (11.8)Prior year tax provision 0.3 (0.3)
67.7 42.2
The standard UK corporation tax rate for the financial year is 19.7% (2016: 20.0%). However, an additional 8% surcharge applies to banking company profits as defined in legislation. The effective tax rate of 26.2% (2016: 18.5%) is above the UK corporation tax rate primarily due to the surcharge applying to most of the group’s profits and a write down of deferred tax assets due to a 1% cut in the standard corporation tax rate applying from April 2020, which was passed into law in the period.

Close Brothers Group plc Annual Report 2017F
inancial State
ments
119
Movements in deferred tax assets and liabilities were as follows:
Capital allowances
Pension scheme
Share-based payments
and deferred compensation
Available forsale assets
Cash flow hedging
Intangible assets Other Total
£ million £ million £ million £ million £ million £ million £ million £ million
GroupAt 1 August 2015 33.1 (0.6) 10.2 (0.7) 0.6 (3.6) 0.4 39.4Credit to the income statement 13.3 – 1.1 – – 1.0 0.3 15.7(Charge)/credit to other comprehensive
income (1.5) 0.3 – 0.7 1.7 – – 1.2Charge to equity – – (1.1) – – – – (1.1)Acquisitions – – – – – – – –At 31 July 2016 44.9 (0.3) 10.2 – 2.3 (2.6) 0.7 55.2(Charge)/credit to the income statement (1.5) – (0.8) – – 1.1 (0.2) (1.4)Charge to other comprehensive income (0.8) (0.5) – (0.1) (1.2) – – (2.6)Credit to equity – – 0.1 – – – – 0.1Acquisitions – – – – – (3.9) – (3.9)
At 31 July 2017 42.6 (0.8) 9.5 (0.1) 1.1 (5.4) 0.5 47.4
Capital allowances
Pension scheme
Share-based payments
and deferred compensation Total
£ million £ million £ million £ million
CompanyAt 1 August 2015 0.3 (0.6) 3.6 3.3Charge to the income statement – – (0.1) (0.1)Credit to statement of recognised gains and losses – 0.3 – 0.3At 31 July 2016 0.3 (0.3) 3.5 3.5Charge to the income statement (0.1) – (0.5) (0.6)(Charge)/credit to statement of recognised gains and losses – (0.5) 0.2 (0.3)
At 31 July 2017 0.2 (0.8) 3.2 2.6
As the group has been and is expected to continue to be consistently profitable, it is appropriate to recognise the full deferred tax assets.
7. Earnings per shareThe calculation of basic earnings per share is based on the profit attributable to shareholders and the number of basic weighted average shares. When calculating the diluted earnings per share, the weighted average number of shares in issue is adjusted for the effects of all dilutive share options and awards.
2017 2016
Basic 128.3p 125.7pDiluted 127.5p 124.3pAdjusted basic1 131.7p 128.4pAdjusted diluted1 130.8p 127.0p
1 Excludes amortisation of intangible assets on acquisition and their tax effects.
2017£ million
2016£ million
Profit attributable to shareholders 191.2 186.5Adjustments:Amortisation of intangible assets on acquisition 6.2 5.1Tax effect of adjustments (1.2) (1.0)
Adjusted profit attributable to shareholders 196.2 190.6

The Notes continued
Close Brothers Group plc Annual Report 2017120
2017million
2016million
Average number of sharesBasic weighted 149.0 148.4Effect of dilutive share options and awards 1.0 1.7
Diluted weighted 150.0 150.1
8. Dividends2017
£ million2016
£ million
For each ordinary shareFinal dividend for previous financial year paid in November 2016: 38.0p (2015: 35.5p) 56.0 52.3Interim dividend for current financial year paid in April 2017: 20.0p (2016: 19.0p) 29.6 28.0
85.6 80.3
A final dividend relating to the year ended 31 July 2017 of 40.0p, amounting to an estimated £59.8 million, is proposed. This final dividend, which is due to be paid on 21 November 2017 to shareholders on the register at 13 October 2017, is not reflected in these financial statements.
9. Loans and advances to banks
On demand£ million
Within three months£ million
Between three months
and one year
£ million
Between one and
two years£ million
Between two and
five years £ million
Total£ million
At 31 July 2017 71.8 8.8 1.7 8.7 8.8 99.8At 31 July 2016 97.5 7.2 4.0 9.6 3.2 121.5
10. Loans and advances to customers
On demand£ million
Within three months£ million
Between three months
and one year
£ million
Between one and
two years£ million
Between two and
five years£ million
After more than five years£ million
Impairment provisions
£ millionTotal
£ million
At 31 July 2017 59.3 1,914.3 2,115.2 1,340.7 1,431.6 76.0 (52.4) 6,884.7At 31 July 2016 58.1 1,746.0 2,014.4 1,279.3 1,328.2 65.3 (59.7) 6,431.6
2017£ million
2016£ million
Impairment provisions on loans and advances to customersAt 1 August 59.7 56.1Charge for the year 40.2 37.9Amounts written off net of recoveries (47.5) (34.3)
At 31 July 52.4 59.7
Loans and advances to customers compriseHire purchase agreement receivables 2,842.9 2,782.4Finance lease receivables 418.9 440.1Other loans and advances 3,622.9 3,209.1
At 31 July 6,884.7 6,431.6
At 31 July 2017, gross impaired loans were £135.8 million (31 July 2016: £158.5 million) and equate to 2% (31 July 2016: 2%) of the gross loan book before impairment provisions. The majority of the group’s lending is secured and therefore the gross impaired loans quoted do not reflect the expected loss.
7. Earnings per share continued

Close Brothers Group plc Annual Report 2017F
inancial State
ments
121
The following table shows a reconciliation between gross investment in finance lease and hire purchase agreement receivables to present value of minimum lease and hire purchase payments:
2017£ million
2016£ million
Gross investment in finance leases and hire purchase agreement receivables due:Within one year 1,356.1 1,377.5Between one and five years 2,396.9 2,354.6After more than five years 26.1 26.8
3,779.1 3,758.9Unearned finance income (501.6) (512.4)
Present value of minimum lease and hire purchase agreement payments 3,277.5 3,246.5
Of which due:Within one year 1,174.2 1,190.3Between one and five years 2,080.9 2,033.3After more than five years 22.4 22.9
3,277.5 3,246.5
The aggregate cost of assets acquired for the purpose of letting under finance leases and hire purchase agreements was £5,738.6 million (2016: £5,602.9 million). The average effective interest rate on finance leases approximates to 10.0% (2016: 10.3%). The present value of minimum lease and hire purchase agreement payments reflects the fair value of finance lease and hire purchase agreement receivables before deduction of impairment provisions.
11. Debt securitiesHeld for trading
£ million
Available for sale
£ million
Loans and receivables
£ millionTotal
£ million
Long trading positions in debt securities 16.2 – – 16.2Certificates of deposit – – 180.3 180.3Sovereign and central bank debt – 43.6 – 43.6
At 31 July 2017 16.2 43.6 180.3 240.1
Held for trading
£ million
Available for sale
£ million
Loans and receivables
£ millionTotal
£ million
Long trading positions in debt securities 20.3 – – 20.3Certificates of deposit – – 201.0 201.0Sovereign and central bank debt – – – –
At 31 July 2016 20.3 – 201.0 221.3
Movements on the book value of sovereign and central bank debt comprise:
£ million
At 1 August 2015 20.1Additions –Redemptions at maturity (20.0)Currency translation differences –Movement in value (0.1)
At 31 July 2016 –
Additions 41.6Redemptions at maturity –Currency translation differences 1.7Movement in value 0.3
At 31 July 2017 43.6

The Notes continued
Close Brothers Group plc Annual Report 2017122
12. Equity shares31 July
2017£ million
31 July2016
£ million
Long trading positions 31.9 26.1Other equity shares 0.8 2.1
32.7 28.2
Movements on the book value of other equity shares comprise:
Available for sale
£ million
Fair value through
profit or loss£ million
Total£ million
At 1 August 2015 10.0 0.1 10.1Disposals (7.7) – (7.7)Currency translation differences 0.4 – 0.4Movement in value of:Equity shares classified as available for sale (0.7) – (0.7)
At 31 July 2016 2.0 0.1 2.1
Disposals (1.3) (0.1) (1.4)Currency translation differences 0.1 – 0.1Movement in value of:Equity shares classified as available for sale – – –
At 31 July 2017 0.8 – 0.8
13. Derivative financial instrumentsThe group enters into derivative contracts with a number of financial institutions to minimise the impact of interest and currency rate changes to its financial instruments. The group’s total derivative asset and liability position as reported on the consolidated balance sheet is as follows:
31 July 2017 31 July 2016
Notionalvalue
£ millionAssets
£ millionLiabilities
£ million
Notionalvalue
£ millionAssets
£ millionLiabilities£ million
Exchange rate contracts 118.9 0.1 0.7 97.3 0.9 0.7Interest rate contracts 3,661.6 26.9 10.8 4,076.1 43.8 15.6
3,780.5 27.0 11.5 4,173.4 44.7 16.3
Notional amounts of interest rate contracts totalling £2,513.1 million (31 July 2016: £2,966.2 million) and exchange rate contracts totalling £nil (31 July 2016: £nil) have a residual maturity of more than one year.
Included in the derivatives above are the following cash flow and fair value hedges:
31 July 2017 31 July 2016
Notionalvalue
£ millionAssets
£ millionLiabilities
£ million
Notionalvalue
£ millionAssets
£ millionLiabilities£ million
Cash flow hedgesInterest rate contracts 781.7 0.5 4.7 1,228.5 0.8 10.1Fair value hedgesInterest rate contracts 1,225.1 24.6 4.1 1,070.7 30.0 –
The cash flow hedges relate to exposure to future interest payments or receipts on recognised financial instruments and on forecast transactions for periods of up to seven (2016: eight) years; there was immaterial ineffectiveness. The cash flow hedge amounts that were removed from equity and included in the consolidated income statement for the years ended 31 July 2017 and 2016 were immaterial. The gain recognised in equity for cash flow hedges during the year was £3.5 million (2016: £4.4 million loss).
The fair value hedges seek to mitigate the interest rate risk in recognised financial instruments; the gain on the hedged items was £19.1 million (2016: £23.7 million loss) which was offset by a loss of £19.5 million (2016: £23.8 million gain) on the hedging instrument.

Close Brothers Group plc Annual Report 2017F
inancial State
ments
123
14. Intangible assets
Goodwill£ million
Software£ million
Intangibleassets on
acquisition£ million
Group total£ million
Companysoftware£ million
CostAt 1 August 2015 146.0 81.0 43.9 270.9 0.4Additions 1.7 24.1 0.4 26.2 –Disposals (6.9) (0.5) – (7.4) –
At 31 July 2016 140.8 104.6 44.3 289.7 0.4Additions 16.9 31.1 22.7 70.7 –Disposals (7.0) (4.1) – (11.1) –
At 31 July 2017 150.7 131.6 67.0 349.3 0.4
Amortisation and impairmentAt 1 August 2015 61.8 42.2 22.7 126.7 0.3Amortisation charge for the year – 17.2 5.1 22.3 0.1Disposals (6.9) (0.3) – (7.2) –
At 31 July 2016 54.9 59.1 27.8 141.8 0.4Amortisation charge for the year – 17.2 6.2 23.4 –Disposals (7.0) (0.6) – (7.6) –
At 31 July 2017 47.9 75.7 34.0 157.6 0.4
Net book value at 31 July 2017 102.8 55.9 33.0 191.7 –
Net book value at 31 July 2016 85.9 45.5 16.5 147.9 –
Net book value at 1 August 2015 84.2 38.8 21.2 144.2 0.1
Additions in goodwill in 2017 of £12.1 million, £3.9 million and £0.9 million and intangible assets on acquisition of £15.9 million, £5.1 million and £1.7 million relate to the 100% acquisitions of Novitas Loans Limited (“Novitas”), EOS Wealth Management Limited (“EOS”) and Adrian Smith & Partners Limited (“ASPL”) respectively. Novitas is a specialist provider of secured finance to law firms and their clients and EOS and ASPL are independent financial advisers. Additions in goodwill in 2016 of £1.7 million and intangible assets on acquisition of £0.4 million relates to the 100% acquisition of Finance for Industry Group. These acquisitions are not regarded as material in the context of the group’s financial statements and therefore information required for material acquisitions by IFRS 3 has not been disclosed.
The £7.0 million disposal of goodwill in 2017 relates to the sale of Asset Management’s OLIM Limited business. The £6.9 million disposal of goodwill in 2016 relates to the sale of Asset Management’s corporate advice and investment management activities.
Intangible assets on acquisition relate to broker and customer relationships and are amortised over a period of eight to 20 years.
In the 2017 financial year, £6.2 million (2016: £5.1 million) of the amortisation charge is included in amortisation of intangible assets on acquisition and £17.2 million (2016: £17.2 million) of the amortisation charge is included in administrative expenses shown in the consolidated income statement.
Impairment tests for goodwillAt 31 July 2017, goodwill has been allocated to nine individual CGUs, of which seven are within the Banking division, one is the Securities division and the remaining one is the Asset Management division. Goodwill impairment reviews are carried out annually by assessing the recoverable amount of the group’s CGUs, which is the higher of fair value less costs to sell and value in use. The recoverable amounts for all CGUs were measured based on value in use.
A value in use calculation uses discounted cash flow projections based on the most recent board approved budgets and three year plans to determine the recoverable amount of each CGU. The key assumptions underlying management’s three year plans, which are based on past experience and forecast market conditions, are expected market-making conditions in the Securities CGU, expected total client asset growth rate and revenue margin in the Asset Management CGU and expected loan book growth rates and net return on loan book in the Banking CGUs.

The Notes continued
Close Brothers Group plc Annual Report 2017124
14. Intangible assets continuedFor cash flows beyond the group’s three year planning horizon, a terminal value was calculated using a prudent annual growth rate of 0% (2016: 0%). The cash flows are discounted using a pre-tax estimated weighted average cost of capital that reflects current market rates appropriate to the CGU as set out in the table below.
At 31 July 2017, the results of the review indicate there is no goodwill impairment. The inputs used in the value in use calculations are sensitive, primarily to the impact of changes in the assumptions for future cash flows, discount rates and long-term growth rates. Having performed stress tested value in use calculations, the group believes that any reasonably possible change in the key assumptions which have been used would not lead the carrying value of any CGU to exceed its recoverable amount.
Details of the CGUs in which the goodwill carrying amount is significant in comparison with total goodwill, together with the pre-tax discount rate used in determining value in use, are disclosed separately in the table below:
31 July 2017 31 July 2016
Cash generating unitGoodwill £ million
Pre-tax discount rate
%Goodwill £ million
Pre-tax discount rate
%
Winterflood Securities 23.3 13.7 23.3 15.3Close Brothers Asset Management 38.5 9.5 33.7 11.0Novitas 12.1 11.1 – –Other 28.9 11.1-12.3 28.9 11.7-13.0
102.8 85.9
15. Property, plant and equipment
Leasehold property£ million
Fixtures,fittings andequipment
£ million
Assetsheld underoperating
leases£ million
Motorvehicles£ million
Total£ million
GroupCostAt 1 August 2015 17.4 34.6 165.1 0.8 217.9Additions 4.3 9.2 61.6 0.1 75.2Disposals (0.2) (3.6) (25.3) (0.5) (29.6)
At 31 July 2016 21.5 40.2 201.4 0.4 263.5Additions 1.6 5.4 56.2 – 63.2Disposals (0.7) (0.5) (26.8) (0.1) (28.1)
At 31 July 2017 22.4 45.1 230.8 0.3 298.6
DepreciationAt 1 August 2015 7.2 23.7 38.1 0.5 69.5Charge for the year 2.5 4.6 19.6 0.1 26.8Disposals – (2.2) (16.1) (0.3) (18.6)
At 31 July 2016 9.7 26.1 41.6 0.3 77.7Charge for the year 2.0 7.1 25.0 – 34.1Disposals (0.6) (1.5) (13.6) (0.2) (15.9)
At 31 July 2017 11.1 31.7 53.0 0.1 95.9
Net book value at 31 July 2017 11.3 13.4 177.8 0.2 202.7
Net book value at 31 July 2016 11.8 14.1 159.8 0.1 185.8
Net book value at 1 August 2015 10.2 10.9 127.0 0.3 148.4
The loss from the sale of assets held under operating leases for the year ended 31 July 2017 was £0.1 million (2016: £0.1 million gain).

Close Brothers Group plc Annual Report 2017F
inancial State
ments
125
31 July2017
£ million
31 July2016
£ million
Future minimum lease rentals receivable under non-cancellable operating leasesWithin one year 39.1 28.6Between one and five years 84.9 59.5After more than five years 0.9 0.3
124.9 88.4
Leasehold property£ million
Fixtures,fittings andequipment
£ millionTotal
£ million
CompanyCostAt 1 August 2015 3.2 1.4 4.6Disposals (0.5) (0.1) (0.6)
At 31 July 2016 2.7 1.3 4.0Disposals – (0.2) (0.2)
At 31 July 2017 2.7 1.1 3.8
DepreciationAt 1 August 2015 2.8 1.3 4.1Charge for the year 0.1 – 0.1Disposals (0.2) – (0.2)
At 31 July 2016 2.7 1.3 4.0Charge for the year – – –Disposals – (0.2) (0.2)
At 31 July 2017 2.7 1.1 3.8
Net book value at 31 July 2017 – – –
Net book value at 31 July 2016 – – –
Net book value at 1 August 2015 0.4 0.1 0.5
The net book value of leasehold property comprises:
Group Company
31 July2017
£ million
31 July2016
£ million
31 July2017
£ million
31 July2016
£ million
Long leasehold property 1.6 1.1 – –Short leasehold property 9.7 10.7 – –
11.3 11.8 – –

The Notes continued
Close Brothers Group plc Annual Report 2017126
16. Other assets and other liabilities31 July
2017£ million
31 July2016
£ million
Prepayments, accrued income and other assetsPrepayments and accrued income 117.6 99.5Trade and other receivables 41.1 34.6
158.7 134.1
Accruals, deferred income and other liabilitiesAccruals and deferred income 138.6 119.5Trade and other payables 71.8 70.2Provisions 22.7 15.7
233.1 205.4
Provisions movement in the year:
Claims £ million
Property £ million
Other £ million
Total £ million
GroupAt 1 August 2015 0.4 11.2 9.8 21.4Additions 0.2 1.4 3.5 5.1Utilised (0.2) (1.7) (5.5) (7.4)Released (0.3) (2.6) (0.5) (3.4)
At 31 July 2016 0.1 8.3 7.3 15.7Additions 0.3 0.6 11.3 12.2Utilised – (0.5) (2.3) (2.8)Released (0.2) (0.5) (1.7) (2.4)
At 31 July 2017 0.2 7.9 14.6 22.7
Property £ million
Other £ million
Total £ million
CompanyAt 1 August 2015 2.2 7.5 9.7Additions – 2.4 2.4Utilised – (4.5) (4.5)Released (0.3) (0.3) (0.6)
At 31 July 2016 1.9 5.1 7.0Additions – 1.9 1.9Utilised – (1.4) (1.4)Released 0.1 (1.5) (1.4)
At 31 July 2017 2.0 4.1 6.1
Claims and other items for which provisions are made arise in the normal course of business and include those related to employee benefits. The timing and outcome of these claims and other items are uncertain. Property provisions are in respect of leaseholds where rents payable exceed the value to the group, potential dilapidations and onerous leases. These property provisions will be utilised and released over the remaining lives of the leases which range from one to nine years.

Close Brothers Group plc Annual Report 2017F
inancial State
ments
127
17. Settlement balances and short positions31 July
2017 £ million
31 July2016
£ million
Settlement balances 524.9 456.3Short positions held for trading:Debt securities 11.5 5.8Equity shares 16.2 13.5
27.7 19.3
552.6 475.6
18. Financial liabilities
On demand£ million
Within three
months£ million
Betweenthree
months andone year£ million
Betweenone and
two years£ million
Betweentwo and
five years£ million
Aftermore thanfive years
£ millionTotal
£ million
Deposits by banks 18.4 15.4 37.5 0.7 – – 72.0Deposits by customers 123.4 956.6 2,528.2 991.3 513.6 – 5,113.1Loans and overdrafts from banks 12.3 74.9 – 20.5 223.2 – 330.9Debt securities in issue 13.6 22.8 108.4 516.0 540.9 287.9 1,489.6
At 31 July 2017 167.7 1,069.7 2,674.1 1,528.5 1,277.7 287.9 7,005.6
On demand£ million
Within threemonths£ million
Betweenthree monthsand one year
£ million
Betweenone and
two years£ million
Betweentwo and
five years£ million
Aftermore thanfive years£ million
Total£ million
Deposits by banks 31.9 1.9 26.5 10.1 0.7 – 71.1Deposits by customers 130.8 918.0 2,117.3 1,233.4 495.1 – 4,894.6Loans and overdrafts from banks 11.0 207.8 160.1 90.2 – – 469.1Debt securities in issue 30.2 7.1 557.1 201.5 589.1 37.8 1,422.8
At 31 July 2016 203.9 1,134.8 2,861.0 1,535.2 1,084.9 37.8 6,857.6
At 31 July 2017, the company held £nil (31 July 2016: £205.9 million) debt securities in issue.
As discussed in note 27(c) the group has accessed £224.4 million (31 July 2016: £nil) cash under the Term Funding Scheme and £197.5 million (31 July 2016: £451.0 million) UK Treasury Bills under the Funding for Lending Scheme. The UK Treasury Bills are not recorded on the group’s consolidated balance sheet as ownership remains with the Bank of England. £197.5 million (31 July 2016: £451.0 million) UK Treasury Bills have been drawn under the Funding for Lending Scheme, of which £100.0 million (31 July 2016: £451.0 million) have been lent in exchange for cash. Cash from the repurchase agreements and Term Funding Scheme is included within bank loans and overdrafts. Residual maturities of the repurchase agreements and Term Funding Scheme are as follows:
On demand£ million
Within threemonths£ million
Betweenthree monthsand one year
£ million
Betweenone and
two years£ million
Betweentwo and
five years£ million
Aftermore thanfive years£ million
Total£ million
At 31 July 2017 1.2 69.9 – 20.5 223.2 – 314.8At 31 July 2016 – 197.8 160.1 90.2 – – 448.1
19. Subordinated loan capital
Prepaymentdate
Initial interest
rate
31 July2017
£ million
31 July2016
£ million
Final maturity date2026 2021 7.42% 15.5 15.52026 2021 7.62% 30.9 30.92027 2022 4.25% 174.3 –
220.7 46.4
If the option to prepay the subordinated loan capital at prepayment date is not taken, the interest rate is reset to a margin over the yield on five year UK Treasury securities.

The Notes continued
Close Brothers Group plc Annual Report 2017128
20. Share capital and reserves31 July 2017 31 July 2016
million £ million million £ million
Group and companyAllotted, issued and fully paidOrdinary shares of 25p each 151.8 38.0 150.6 37.7
Further analysis of the group’s and company’s share capital and reserves is shown on pages 105 and 108. At 31 July 2017 £152.4 million (31 July 2016: £185.7 million) of the company’s reserves were distributable. As noted in the directors’ report on page 51, at the forthcoming AGM, the board intends to ask shareholders to approve a special resolution to cancel the company’s share premium account. If it becomes effective, the cancellation will increase the company’s distributable reserves by £307.8 million.
21. CapitalThe group’s policy is to be well capitalised and its approach to capital management is driven by strategic and organisational requirements, while also taking into account the regulatory and commercial environments in which it operates.
The Prudential Regulation Authority (“PRA”) supervises the group on a consolidated basis and receives information on the capital adequacy of, and sets capital requirements for, the group as a whole. In addition, a number of subsidiaries are regulated for prudential purposes by either the PRA or the Financial Conduct Authority (“FCA”). The aim of the capital adequacy regime is to promote safety and soundness in the financial system. It is structured around three “pillars”: Pillar 1 on minimum capital requirements; Pillar 2 on the supervisory review process; and Pillar 3 on market discipline. The group’s Pillar 1 information is presented below. Under Pillar 2, the group completes an annual self assessment of risks known as the “Internal Capital Adequacy Assessment Process” (“ICAAP”). The ICAAP is reviewed by the PRA which culminates in the PRA setting “Individual Capital Guidance” (“ICG”) on the level of capital the group and its regulated subsidiaries are required to hold, which is currently set at a total capital add-on of 1.9%, of which 1.1% needs to be met with common equity tier 1 (“CET1”) capital. Pillar 3 requires firms to publish a set of disclosures which allow market participants to assess information on that group’s capital, risk exposures and risk assessment process. The group’s Pillar 3 disclosures can be found on the group’s website www.closebrothers.com/investor-relations/investor-information/results-reports-and-presentations.
The group maintains a strong capital base to support the development of the business and to ensure the group meets the Pillar 1 capital requirements, ICG and additional Capital Requirements Directive buffers at all times. As a result, the group maintains capital adequacy ratios above minimum regulatory requirements, which are currently set at a minimum CET1 capital ratio of 6.8% and a minimum total capital ratio of 11.2%, both inclusive of ICG and the capital conservation buffer (currently 1.25% for both CET1 capital and total capital). No countercyclical buffer is applicable at present, though in the UK this will increase to 0.5% for both CET1 capital and total capital with effect from 27 June 2018. The group’s individual regulated entities complied with all of the externally imposed capital requirements to which they are subject for the years ended 31 July 2017 and 2016.
A full analysis of the composition of regulatory capital and Pillar 1 risk weighted assets (“RWAs”), a reconciliation between equity and CET1 capital after deductions and a table showing the movement in CET1 capital during the year are shown on the following pages.
At 31 July 2017, the group’s CET1 capital ratio was 12.6% (31 July 2016: 13.5%). CET1 capital increased to £990.6 million (31 July 2016: £901.4 million) primarily due to growth in profit attributable to shareholders. The increase in share capital in connection with the acquisition of Novitas has been broadly offset by a deduction for goodwill recognised as part of the transaction.
RWAs, calculated using the standardised approaches, increased to £7,859.0 million (31 July 2016: £6,682.5 million) as a result of growth in credit and counterparty risk associated with the loan book and due to European Banking Authority guidance which mandates 150% risk weighting for property development loans. Notional RWAs for operational risk also increased reflecting increased performance over recent years.
During the year, the group issued £175 million of tier 2 capital. This changed the composition of capital with 82.8% (31 July 2016: 97.4%) of the total capital consisting of CET1 capital.

Close Brothers Group plc Annual Report 2017F
inancial State
ments
129
31 July2017
£ million
31 July2016
£ million
CET1 capitalCalled up share capital 38.0 37.7Share premium account 307.8 284.0Retained earnings 906.6 797.5Other reserves recognised for CET1 capital 21.4 21.8Deductions from CET1 capitalIntangible assets, net of associated deferred tax liabilities (186.3) (145.3)Foreseeable dividend1 (59.8) (56.1)Investment in own shares (34.1) (37.2)Pension asset, net of associated deferred tax liabilities (2.8) (0.9)Prudent valuation adjustment (0.2) (0.1)
CET1 capital 990.6 901.4
Tier 2 capital – subordinated debt2 205.6 24.0
Total regulatory capital 1,196.2 925.4
RWAs (notional) – unauditedCredit and counterparty credit risk 6,967.6 5,824.9Operational risk3 806.8 784.9Market risk3 84.6 72.7
7,859.0 6,682.5
CET1 capital ratio 12.6% 13.5%Total capital ratio 15.2% 13.8%
1 Under the Regulatory Technical Standard on own funds, a deduction has been recognised at 31 July 2017 and 31 July 2016 for a foreseeable dividend being the proposed final dividend as set out in note 8.
2 Shown after applying the Capital Requirements Regulations transitional and qualifying own funds arrangements.3 Operational and market risk include a notional adjustment at 8% in order to determine notional RWAs.
The following table shows a reconciliation between equity and CET1 capital after deductions:
31 July2017
£ million
31 July2016
£ million
Equity 1,236.0 1,096.9Regulatory deductions from equity:Intangible assets, net of associated deferred tax liabilities (186.3) (145.3)Foreseeable dividend1 (59.8) (56.1)Pension asset, net of associated deferred tax liabilities (2.8) (0.9)Prudent valuation adjustment (0.2) (0.1)Other reserves not recognised for CET1 capital:Cash flow hedging reserve 3.2 6.7Non-controlling interests 0.5 0.2
CET1 capital 990.6 901.4
1 Under the Regulatory Technical Standard on own funds, a deduction has been recognised at 31 July 2017 and 31 July 2016 for a foreseeable dividend being the proposed final dividend as set out in note 8.

The Notes continued
Close Brothers Group plc Annual Report 2017130
21. Capital continued
The following table shows the movement in CET1 capital during the year:£ million
CET1 capital at 31 July 2016 901.4Profit in the period attributable to shareholders 191.2Shares issued in the period 24.1Dividends paid and foreseen (89.3)Increase in intangible assets, net of associated deferred tax liabilities (41.0)Other movements in reserves recognised for CET1 capital 6.2Other movements in deductions from CET1 capital (2.0)
CET1 capital at 31 July 2017 990.6
22. Contingent liabilities, guarantees and commitmentsContingent liabilitiesFinancial Services Compensation Scheme (“FSCS”)A principal subsidiary of the group, CBL, by virtue of being a regulated deposit-taker, contributes to the FSCS which provides compensation to customers of financial institutions in the event that an institution is unable, or is likely to be unable, to pay claims against it.
Compensation has previously been paid out by the FSCS funded by loan facilities provided by HM Treasury to FSCS in support of the FSCS’s obligations to the depositors of banks declared in default. The facilities are expected to be repaid wholly from recoveries from the failed deposit-takers. In the event of a shortfall, the FSCS will recover the shortfall by raising levies on the industry. The amount of future levies payable by the group depends on a number of factors including the potential recoveries of assets by the FSCS, the group’s participation in the deposit-taking market at 31 December, the level of protected deposits and the population of FSCS members.
GuaranteesGroup Company
31 July2017
£ million
31 July2016
£ million
31 July2017
£ million
31 July2016
£ million
Guarantees and irrevocable letters of credit 175.8 143.2 161.7 156.2
Where the group undertakes to make a payment on behalf of its subsidiaries for guarantees issued, such as bank facilities or property leases or as irrevocable letters of credit for which an obligation to make a payment to a third party has not arisen at the reporting date, they are included in these consolidated financial statements as contingent liabilities.
CommitmentsUndrawn facilities, credit lines and other commitments to lend
31 July2017
£ million
31 July2016
£ million
Within one year 1,088.9 934.2After more than one year 102.7 28.5
1,191.6 962.7

Close Brothers Group plc Annual Report 2017F
inancial State
ments
131
Operating lease commitmentsMinimum operating lease payments recognised in the consolidated income statement amounted to £8.9 million (2016: £8.6 million).
The group had outstanding commitments for future minimum lease rentals payable under non-cancellable operating leases, which fall due as follows:
31 July 2017 31 July 2016
Premises£ million
Other£ million
Premises£ million
Other£ million
Within one year 11.5 3.1 10.8 2.8Between one and five years 34.2 4.9 39.1 3.9After more than five years 9.7 – 12.2 –
55.4 8.0 62.1 6.7
Other commitmentsSubsidiaries had contracted capital commitments relating to capital expenditure of £17.7 million (2016: £12.1 million).
23. Related party transactionsTransactions with key managementDetails of directors’ remuneration and interests in shares are disclosed in the Directors’ Remuneration Report on pages 69 to 95.
Key management personnel are those persons having authority and responsibility for planning, directing and controlling the activities of an entity; the group’s key management are the members of the group’s Executive Committee, which includes all executive directors, together with its non-executive directors.
The table below details, on an aggregated basis, key management personnel emoluments:
2017£ million
2016£ million
EmolumentsSalaries and fees 4.6 3.9Benefits and allowances 0.7 0.7Performance related awards in respect of the current year:Cash 4.6 3.4Deferred 2.5 2.9
12.4 10.9Share-based awards 4.2 4.5
16.6 15.4
Gains upon exercise of options by key management personnel, expensed to the income statement in previous years, totalled £10.3 million (2016: £14.8 million).
Key management have banking and asset management relationships with group entities which are entered into in the normal course of business. Amounts included in deposits by customers at 31 July 2017 attributable, in aggregate, to key management were £0.1 million (31 July 2016: £1.8 million). A member of key management has a holding of 500,000 of the company’s 4.25% subordinated loan notes.

The Notes continued
Close Brothers Group plc Annual Report 2017132
24. PensionsThe group operates defined contribution pension schemes for eligible employees as well as a defined benefit pension scheme which is closed to new members and further accrual. Assets of all schemes are held separately from those of the group.
Defined contribution schemesDuring the year the charge to the consolidated income statement for the group’s defined contribution pension schemes was £10.2 million (2016: £10.0 million), representing contributions payable by the group and is included in administrative expenses.
Defined benefit pension schemeThe group’s only defined benefit pension scheme (“the scheme”) is a final salary scheme which operates under trust law. The scheme is managed and administered in accordance with the scheme’s Trust Deed and Rules and all relevant legislation by a trustee board made up of trustees nominated by both the company and the members.
The scheme was closed to new entrants in August 1996 and closed to further accrual during 2012. At 31 July 2017 this scheme had 47 (31 July 2016: 50) deferred members and 45 (31 July 2016: 44) pensioners and dependants.
Funding positionThe scheme’s most recent triennial actuarial valuation at 31 July 2015 showed that the scheme was fully funded. As such, no further contributions are scheduled.
IAS 19 (Revised) valuationThe following disclosures are reported in accordance with IAS 19 (Revised). Significant actuarial assumptions are as follows:
2017%
2016%
Inflation rate (Retail Price Index) 3.4 2.9Inflation rate (Consumer Price Index) 2.4 1.9Discount rate for scheme liabilities1 2.5 2.4Expected interest/expected long-term return on plan assets 2.5 2.4Mortality assumptions2:Existing pensioners from age 65, life expectancy (years):Men 24.2 24.3Women 25.8 25.8Non-retired members currently aged 50, life expectancy from age 65 (years):Men 25.0 25.0Women 27.9 27.8
1 Based on market yields at 31 July 2017 and 2016 on high quality sterling-denominated corporate bonds, adjusted to be consistent with the estimated term of the post-employment benefit obligation, using the Willis Towers Watson model “Global RATE:Link”.
2 Based on standard tables SAPS S1 Light produced by the CMI Bureau of the Institute and Faculty of Actuaries with adjusted mortality multipliers for pensioners and non-pensioners, together with projected future improvements in line with the CMI 2014 core projection model with a long-term trend of 1.5% per annum.
The surplus of the scheme disclosed below has been accounted for as an asset of the group within note 16 Other assets and other liabilities.
The group has the unconditional right to any surpluses that arise within the scheme once all benefits have been secured in full. As such no asset ceiling has been applied, and accordingly the scheme surplus is recognised on the consolidated balance sheet.
2017£ million
2016£ million
2015£ million
2014£ million
2013£ million
Fair value of scheme assets1:Equities 20.9 35.9 33.0 31.8 30.7Bonds 20.6 8.7 8.5 7.9 7.4Cash 0.3 0.2 0.2 0.2 –Total fair value of scheme assets 41.8 44.8 41.7 39.9 38.1Present value of scheme liabilities (38.2) (43.6) (38.6) (35.0) (31.9)
Surplus 3.6 1.2 3.1 4.9 6.2
1 There are no amounts included within the fair value of scheme assets relating to the financial instruments of Close Brothers Group plc.

Close Brothers Group plc Annual Report 2017F
inancial State
ments
133
Movement in the present value of scheme liabilities during the year:
2017£ million
2016£ million
Carrying amount at 1 August (43.6) (38.6)Interest expense (0.9) (1.4)Benefits paid 7.3 1.9Actuarial losses (1.0) (5.5)
Carrying amount at 31 July (38.2) (43.6)
Movement in the fair value of scheme assets during the year:
2017£ million
2016£ million
Carrying amount at 1 August 44.7 41.7Interest income 0.9 1.5Benefits paid (7.3) (1.9)Administrative costs paid (0.2) (0.2)Return on scheme assets, excluding interest income 3.7 3.6
Carrying amount at 31 July 41.8 44.7
Historical experience of actuarial gains/(losses) are shown below:
2017£ million
2016£ million
2015£ million
2014£ million
2013£ million
Experience gains on scheme assets 3.7 3.6 2.9 1.7 4.6Experience gains/(losses) on scheme liabilities – 1.3 – (0.1) 0.5Impact of changes in assumptions on scheme liabilities (1.0) (6.8) (4.9) (3.2) (2.7)Total actuarial losses on scheme liabilities (1.0) (5.5) (4.9) (3.3) (2.2)
Total actuarial gains/(losses) 2.7 (1.9) (2.0) (1.6) 2.4
Total actuarial gains have been recognised in other comprehensive income. Income of £nil (2016: £0.1 million) from the interest on the scheme surplus has been recognised within administrative expenses in the consolidated income statement. The group does not have a policy for allocating the net defined benefit cost between group entities participating in the scheme.
The valuation of the scheme’s liabilities is sensitive to the key assumptions used in the valuation. The effect of a change in those assumptions in 2017 and 2016 is set out below. The analysis reflects the variation of the individual assumptions. The variation in price inflation includes all inflation-linked pension increases in deferment and in payment.
Impact on defined benefit obligation increase/(decrease)
2017 2016
Key assumption Sensitivity % £ million % £ million
Discount rate 0.25% increase (5.0) (1.9) (5.0) (2.2)Price inflation (RPI and CPI) 0.25% increase 2.0 0.8 2.0 0.9Mortality Increase in life expectancy at age 65 by one year 3.0 1.1 3.0 1.3
Changes in the assumptions used in the valuation due to external factors would affect the carrying value of the scheme. The most significant risks are:• Market factors (movements in equity and bond markets): The scheme’s assets are invested 50% in global equities and 49% in
bonds (with the remaining 1% held in cash) and the scheme’s liabilities are measured with reference to corporate bond yields. The performance of these asset classes can be volatile. Underperformance of either of these markets would have an adverse impact on the carrying value of the scheme.
• Inflation: Deferred pensions and pensions in payment increase at specified periods in line with inflation, subject to certain caps and floors in place. Changes in inflation may impact scheme liabilities.
• Life expectancy: Change in the life expectancy of the scheme’s members may impact scheme liabilities.
The weighted average duration of the benefit payments reflected in the scheme liabilities is 20 years.

The Notes continued
Close Brothers Group plc Annual Report 2017134
25. Share-based awardsThe Save As You Earn (“SAYE”) scheme, 2009 Long Term Incentive Plan (“LTIP”), Deferred Share Awards (“DSA”) and Share Matching Plan (“SMP”) share-based awards have been granted under the group’s share schemes. The general terms and conditions for these share-based awards are described in the Directors’ Remuneration Report on pages 69 to 95.
In order to satisfy a number of the awards below the company has purchased company shares into Treasury and the Close Brothers Group Employee Share Trust has purchased company shares. At 31 July 2017, 0.3 million (31 July 2016: 0.7 million) and 2.4 million (31 July 2016: 2.4 million) of these shares were held respectively and in total £34.1 million (2016: £37.2 million) was recognised within the share-based payments reserve. During the year £15.8 million (2016: £12.9 million) of these shares were released to satisfy share-based awards to employees. The share-based payments reserve as shown in the consolidated statement of changes in equity also includes the cumulative position in relation to unvested share-based awards charged to the consolidated income statement of £22.2 million (2016: £22.9 million). The share-based awards charge of £6.0 million (2016: £6.2 million) is included in administrative expenses shown in the consolidated income statement.
Movements in the number of share-based awards outstanding and their weighted average share prices are as follows:
SAYE LTIP DSA1 SMP
Number
Weightedaverageexercise
price Number
Weightedaverageexercise
price Number
Weightedaverageexercise
price Number
Weightedaverageexercise
price
At 1 August 2015 1,078,724 – 1,708,819 – 553,880 – 1,110,033 –Granted 282,824 1,197.0p 458,171 – 288,188 – 368,967 –Exercised (170,580) 683.0p (664,198) – (294,066) – (337,322) –Forfeited (152,374) 1,103.0p (908) – (9,367) – – –Lapsed (5,124) 1,064.8p (38,429) – – – (5,855) –
At 31 July 2016 1,033,470 – 1,463,455 – 538,635 – 1,135,823 –
Granted 505,229 1,160.6p 422,325 – 313,375 – 395,813 –Exercised (372,823) 997.5p (322,097) – (291,664) – (310,106) –Forfeited (91,100) 1,135.6p (11,413) – – – – –Lapsed (5,207) 1,049.4p (174,787) – – – (82,812) –
At 31 July 2017 1,069,569 – 1,377,483 – 560,346 – 1,138,718 –
Exercisable at:31 July 2017 20,711 1,154.2p – – 13,169 – – –31 July 2016 – – – – 11,461 – – –
1 Includes all awards made under the group’s DSA scheme and recruitment awards granted to new employees on commencement of employment with the group.
The table below shows the weighted average market price at the date of exercise:
2017 2016
SAYE 1,484.6p 1,356.9pLTIP 1,387.5p 1,453.6pDSA 1,403.4p 1,481.2pSMP 1,382.3p 1,539.7p

Close Brothers Group plc Annual Report 2017F
inancial State
ments
135
The range of exercise prices and weighted average remaining contractual life of awards and options outstanding are as follows:
2017 Options outstanding
2016 Options outstanding
Numberoutstanding
Weightedaverage
remainingcontractual
lifeYears
Numberoutstanding
Weightedaverage
remainingcontractual
lifeYears
SAYEBetween £5 and £6 – – 31,635 0.8Between £6 and £7 18,741 0.8 18,919 1.8Between £9 and £10 79,618 1.8 266,807 1.5Between £11 and £12 758,178 2.2 716,109 2.4Between £12 and £13 213,032 3.5 – –LTIPNil 1,377,483 2.2 1,463,455 2.2DSANil 560,346 1.7 538,635 1.6SMPNil 1,138,718 2.2 1,135,823 2.1
Total 4,146,116 2.2 4,171,383 2.1
For the share-based awards granted during the year, the weighted average fair value of those options at 31 July 2017 was 788.1p (2016: 937.1p). The main assumptions for the valuation of these share-based awards comprised:
Exercise periodShare price
at issueExercise
priceExpected
volatility
Expectedoption life
YearsDividend
yieldRisk free
interest rate
SAYE1 Dec 2019 to 31 May 2020 1,383.0p 1,107.0p 25.0% 3 4.1% 0.3%1 Dec 2021 to 31 May 2022 1,383.0p 1,107.0p 23.0% 5 4.1% 0.5%1 Jun 2020 to 30 Nov 2020 1,541.0p 1,234.0p 24.0% 3 4.1% 0.5%1 Jun 2022 to 31 Dec 2022 1,541.0p 1,234.0p 22.0% 5 4.1% 0.5%LTIP4 Oct 2019 to 3 Oct 2020 1,386.0p – 24.1% 3 4.1% 0.1%DSA4 Oct 2017 to 3 Oct 2018 1,378.6p – – – – –4 Oct 2018 to 3 Oct 2019 1,378.6p – – – – –4 Oct 2019 to 3 Oct 2020 1,378.6p – – – – –11 Mar 2017 to 10 Mar 2018 1,371.0p – – – – –19 Jan 2018 to 18 Jan 2019 1,371.0p – – – – –11 Mar 2018 to 10 Mar 2019 1,371.0p – – – – –19 Jan 2019 to 18 Jan 2020 1,371.0p – – – – –19 Jan 2020 to 18 Jan 2021 1,386.0p – – – – –SMP4 Oct 2019 to 3 Oct 2020 1,386.0p – 24.1% 3 4.1% 0.1%
Expected volatility was determined mainly by reviewing share price volatility for the expected life of each option up to the date of grant.

The Notes continued
Close Brothers Group plc Annual Report 2017136
26. Consolidated cash flow statement reconciliation31 July
2017 £ million
31 July2016
£ million
(a) Reconciliation of operating profit before tax to net cash inflow from operating activities Operating profit before tax 258.6 228.5Tax paid (63.6) (53.7)Depreciation and amortisation 57.5 49.1(Increase)/decrease in:Interest receivable and prepaid expenses (18.1) (16.0)Net settlement balances and trading positions 6.7 (9.7)Net loans to/from money brokers against stock advanced (21.9) 16.0Interest payable and accrued expenses 19.1 3.2
Net cash inflow from trading activities 238.3 217.4Decrease/(increase) in:Loans and advances to banks not repayable on demand 0.3 (26.7)Loans and advances to customers (453.1) (693.8)Assets let under operating leases (43.2) (51.9)Certificates of deposit 20.7 (85.7)Sovereign and central bank debt (44.5) 20.0Other assets less other liabilities 22.5 28.9Increase/(decrease) in:Deposits by banks 0.9 36.0Deposits by customers 218.5 413.2Loans and overdrafts from banks (138.2) 87.9Issuance of debt securities, net of transaction costs 297.8 35.9
Net cash inflow/(outflow) from operating activities 120.0 (18.8)
(b) Analysis of net cash outflow in respect of the purchase of subsidiaries and non-controlling interests
Cash consideration paid (6.3) (3.6)
(c) Analysis of net cash (outflow)/inflow in respect of the sale of a subsidiaryCash consideration received 0.3 2.4Cash and cash equivalents disposed of (0.6) (0.1)
(0.3) 2.3
(d) Analysis of changes in financing activitiesShare capital (including premium), group bond and subordinated loan capital1:Opening balance 566.6 566.6Redemption of group bond (200.0) –Issuance of subordinated loan capital, net of transaction costs 173.7 –
540.3 566.6
(e) Analysis of cash and cash equivalents2
Cash and balances at central banks 798.2 840.6Loans and advances to banks repayable on demand 61.4 82.7
859.6 923.3
1 Excludes accrued interest.2 Excludes Bank of England cash reserve account, amounts held as collateral and settlement money held in accordance with Financial Conduct Authority Client Asset
Rules.

Close Brothers Group plc Annual Report 2017F
inancial State
ments
137
27. Financial risk managementAs a financial services group, financial instruments are central to the group’s activities. The risk associated with financial instruments represents a significant component of those faced by the group and is analysed in more detail below.
The group’s financial risk management objectives are summarised within the Risk and Control Framework in Corporate Governance on pages 59 and 60. Details of the significant accounting policies and methods adopted, including the criteria for recognition, the basis of measurement and the basis on which income and expenses are recognised, in respect of each class of financial asset, financial liability and equity instrument are disclosed in note 1.
(a) ClassificationThe following tables analyse the group’s assets and liabilities in accordance with the categories of financial instruments in IAS 39.
Held for trading
£ million
Designated at fair value
through profit or
loss £ million
Available for sale
£ million
Loans and receivables
£ million
Held at amortised
cost £ million
Derivatives held for hedging £ million
Total £ million
At 31 July 2017AssetsCash and balances at central banks – – – 805.1 – – 805.1Settlement balances – – – 546.7 – – 546.7Loans and advances to banks – – – 99.8 – – 99.8Loans and advances to customers – – – 6,884.7 – – 6,884.7Debt securities 16.2 – 43.6 180.3 – – 240.1Equity shares 31.9 – 0.8 – – – 32.7Loans to money brokers against stock advanced – – – 48.6 – – 48.6Derivative financial instruments 1.8 0.1 – – – 25.1 27.0Other financial assets – – 2.7 66.3 – – 69.0
49.9 0.1 47.1 8,631.5 – 25.1 8,753.7
LiabilitiesSettlement balances and short positions 27.7 – – – 524.9 – 552.6Deposits by banks – – – – 72.0 – 72.0Deposits by customers – – – – 5,113.1 – 5,113.1Loans and overdrafts from banks – – – – 330.9 – 330.9Debt securities in issue – – – – 1,489.6 – 1,489.6Loans from money brokers against stock advanced – – – – 4.3 – 4.3Subordinated loan capital – – – – 220.7 – 220.7Derivative financial instruments 2.6 0.1 – – – 8.8 11.5Other financial liabilities – 4.8 – – 114.8 – 119.6
30.3 4.9 – – 7,870.3 8.8 7,914.3

The Notes continued
Close Brothers Group plc Annual Report 2017138
27. Financial risk management continued
Held for trading
£ million
Designated at fair value
through profit or loss
£ million
Available for sale
£ million
Loans and receivables
£ million
Held at amortised
cost £ million
Derivatives held for
hedging £ million
Total £ million
At 31 July 2016AssetsCash and balances at central banks – – – 847.4 – – 847.4Settlement balances – – – 478.1 – – 478.1Loans and advances to banks – – – 121.5 – – 121.5Loans and advances to customers – – – 6,431.6 – – 6,431.6Debt securities 20.3 – – 201.0 – – 221.3Equity shares 26.1 0.1 2.0 – – – 28.2Loans to money brokers against stock advanced – – – 52.4 – – 52.4Derivative financial instruments 4.8 – – – – 39.9 44.7Other financial assets – – – 42.3 – – 42.3
51.2 0.1 2.0 8,174.3 – 39.9 8,267.5
LiabilitiesSettlement balances and short positions 19.3 – – – 456.3 – 475.6Deposits by banks – – – – 71.1 – 71.1Deposits by customers – – – – 4,894.6 – 4,894.6Loans and overdrafts from banks – – – – 469.1 – 469.1Debt securities in issue – – – – 1,422.8 – 1,422.8Loans from money brokers against stock advanced – – – – 30.0 – 30.0Subordinated loan capital – – – – 46.4 – 46.4Derivative financial instruments 6.1 0.1 – – – 10.1 16.3Other financial liabilities – – – – 124.8 – 124.8
25.4 0.1 – – 7,515.1 10.1 7,550.7
(b) ValuationThe fair values of the group’s financial assets and liabilities are not materially different from their carrying values. The main differences are as follows:
31 July 2017 31 July 2016
Fair value
£ million
Carrying value
£ million
Fair value
£ million
Carrying value
£ million
Subordinated loan capital 242.0 220.7 52.4 46.4Debt securities in issue 1,522.8 1,489.6 1,432.2 1,422.8
Valuation hierarchyThe group holds financial instruments that are measured at fair value subsequent to initial recognition. Each instrument has been categorised within one of three levels using a fair value hierarchy that reflects the significance of the inputs used in making the measurements. These levels are based on the degree to which the fair value is observable and are defined as follows:• Level 1 fair value measurements are those derived from quoted prices (unadjusted) in active markets for identical assets or
liabilities where prices are readily available and represent actual and regularly occurring market transactions on an arm’s length basis. An active market is one in which transactions occur with sufficient frequency to provide ongoing pricing information;
• Level 2 fair value measurements are those derived from quoted prices in less active markets for identical assets or liabilities or those derived from inputs other than quoted prices that are observable for the asset or liability, either directly as prices or indirectly derived from prices; and
• Level 3 fair value measurements are those derived from valuation techniques that include inputs for the asset or liability that are not based on observable market data (“unobservable inputs”).
Investments classified as Level 1 predominantly comprise sovereign and central bank debt and liquid listed equity shares.
Investments classified as Level 2 predominantly comprise less liquid listed equity shares, investment grade corporate bonds and over-the-counter derivatives.

Close Brothers Group plc Annual Report 2017F
inancial State
ments
139
At 31 July 2017, investments classified as Level 3 predominantly comprise a legacy investment property fund and contingent consideration payable and receivable in relation to the acquisitions and the disposal of a subsidiary.
The valuation of the legacy investment is determined using its net asset value which is updated quarterly. The valuation of contingent consideration is determined on a discounted expected cash flow basis. The group believes that there is no reasonably possible change to the inputs used in the valuation of these positions which would have a material effect on the group’s consolidated income statement.
In 2017 and 2016 a number of listed equity shares have been classified as Level 2 (classified as Level 1 in 2015) following an assessment of the frequency of transactions in these shares. Aside from this there were no significant transfers between Level 1, 2 and 3 in 2017 and 2016.
The tables below show the classification of financial instruments held at fair value into the valuation hierarchy.
Level 1 £ million
Level 2 £ million
Level 3 £ million
Total £ million
At 31 July 2017AssetsDebt securities:Long positions in debt securities held for trading 13.7 2.5 – 16.2Sovereign and central bank debt classified as available for sale 43.6 – – 43.6Equity shares:Held for trading 5.4 26.5 – 31.9Fair value through profit or loss – – – –Available for sale – – 0.8 0.8Derivative financial instruments – 27.0 – 27.0Contingent consideration – – 2.7 2.7
62.7 56.0 3.5 122.2
LiabilitiesShort positions held for trading:Debt securities 8.0 3.5 – 11.5Equity shares 4.7 11.5 – 16.2Derivative financial instruments – 11.5 – 11.5Contingent consideration – – 6.6 6.6
12.7 26.5 6.6 45.8

The Notes continued
Close Brothers Group plc Annual Report 2017140
27. Financial risk management continuedLevel 1
£ millionLevel 2
£ millionLevel 3
£ millionTotal
£ million
At 31 July 2016AssetsDebt securities:Long positions in debt securities held for trading 16.1 4.2 – 20.3Sovereign and central bank debt classified as available for sale – – – –Equity shares:Held for trading 3.4 22.7 – 26.1Fair value through profit or loss – 0.1 – 0.1Available for sale – – 2.0 2.0Derivative financial instruments – 44.7 – 44.7Contingent consideration – – – –
19.5 71.7 2.0 93.2
LiabilitiesShort positions held for trading:Debt securities 3.0 2.8 – 5.8Equity shares 3.7 9.8 – 13.5Derivative financial instruments – 16.3 – 16.3Contingent consideration – – – –
6.7 28.9 – 35.6
Movements in financial assets categorised as Level 3 were:
Equity shares
availablefor sale
£ million
Contingent consideration
£ million
At 1 August 2015 10.0 –Total gains recognised in the consolidated income statement (0.3) –Total gains recognised in other comprehensive income – –Purchases and issuesSales and settlements (7.7) –
At 31 July 2016 2.0 –Total losses recognised in the consolidated income statement 0.1 –Total losses recognised in other comprehensive income – –Purchases and issues – (6.6)Sales and settlements (1.3) 2.7
At 31 July 2017 0.8 (3.9)
The losses recognised in the consolidated income statement relating to instruments held at the year end amounted to £nil (2016: £0.3 million).

Close Brothers Group plc Annual Report 2017F
inancial State
ments
141
(c) Credit riskCredit risk is the risk of a reduction in earnings and/or value, as a result of the failure of a counterparty or associated party with whom the group has contracted to meet its obligations as they fall due. Credit risk across the group mainly arises through the lending and treasury activities of the Banking division.
The Banking division applies consistent and prudent lending criteria to mitigate credit risk. Its lending activities are predominantly secured across a diverse range of asset classes and are generally short-term in nature with low average loan size. This ensures concentration risk is controlled in both the loan book and associated collateral.
The group has established limits for all counterparties with whom it places deposits, enters into derivative contracts or whose debt securities are held and the credit quality of the counterparties is monitored. While these amounts may be material, the counterparties are all regulated institutions with high credit ratings assigned by international credit rating agencies and fall within the large exposure limits set by regulatory requirements.
Credit risk in the Securities division is limited as Winterflood trade in the cash markets with regulated counterparties on a delivery versus payment basis such that any counterparty risk is limited to price movements in the underlying securities. Counterparty exposure and settlement failure monitoring controls are in place.
Maximum exposure to credit riskThe table below presents the group’s maximum exposure to credit risk, before taking account of any collateral and credit risk mitigation, arising from its on balance sheet and off balance sheet financial instruments. For off balance sheet instruments, the maximum exposure to credit risk represents the contractual nominal amounts.
31 July2017
£ million
31 July2016
£ million
On balance sheetCash and balances at central banks 805.1 847.4Settlement balances 546.7 478.1Loans and advances to banks 99.8 121.5Loans and advances to customers 6,884.7 6,431.6Debt securities 240.1 221.3Loans to money brokers against stock advanced 48.6 52.4Derivative financial instruments 27.0 44.7Other financial assets 69.0 42.3
8,721.0 8,239.3Off balance sheetUndrawn commitments 1,191.6 962.7
Total maximum exposure to credit risk 9,912.6 9,202.0
Assets pledged and received as collateralThe group pledges assets for repurchase agreements and securities borrowing agreements which are generally conducted under terms that are customary to standard borrowing contracts.
At 31 July 2017, asset finance loan receivables of £525.1 million (31 July 2016: £737.4 million) and £10.0 million (31 July 2016: £nil) UK Treasury Bills, part of the £157.3 million (31 July 2016: £168.1 million) asset-backed securities in issue retained for liquidity purposes were positioned with the Bank of England. These loan receivables, asset-backed securities and UK Treasury Bills were used as collateral within the Bank of England’s Funding for Lending Scheme and Term Funding Scheme, against which £197.5 million of UK Treasury Bills (31 July 2016: £451.0 million) and £224.4 million cash (31 July 2016: £nil) had been drawn at the reporting date. The term of these transactions is four years from the date of each drawdown but the group may choose to repay earlier at its discretion.
The group also pledged £90.0 million (31 July 2016: £451.0 million) UK Treasury Bills in the form of a repurchase agreement from a total of £197.5 million drawn (31 July 2016: £451.0 million). This was exchanged for cash and included within loans and overdrafts from banks. The Treasury Bills are not recorded on the group’s consolidated balance sheet as ownership remains with the Bank of England. The risk and rewards of the loans and advances to customers remain with the group and continue to be recognised in the consolidated balance sheet.
The group has securitised without recourse and restrictions £1,486.3 million (31 July 2016: £1,443.9 million) of its insurance premium and motor loan receivables in return for cash and asset-backed securities in issue of £1,046.9 million (31 July 2016: £1,015.9 million). This includes £157.3 million (31 July 2016: £168.1 million) asset-backed securities in issue retained for liquidity purposes. As the group has retained exposure to substantially all the credit risk and rewards of the residual benefit of the underlying assets it continues to recognise these assets in loans and advances to customers in its consolidated balance sheet.

The Notes continued
Close Brothers Group plc Annual Report 2017142
Loans to money brokers against stock advanced of £48.6 million (31 July 2016: £52.4 million) is the cash collateral provided to these institutions for stock borrowing by Winterflood. The stock borrowing to which the cash deposits relate is short-term in nature and is recorded at the amount payable.
The majority of loans and advances to customers are secured against specific assets. The security will correspond to the type of lending as detailed in the segmental loan book analysis on page 27 of the Strategic Report. Consistent and prudent lending criteria are applied across the whole loan book with emphasis on the quality of the security provided.
Financial assets: Loans and advances to customersCredit risk management and monitoringThe overall credit risk appetite is set by the group board. The monitoring of credit policy is the responsibility of the Banking division’s risk and compliance committees. All large loans are subject to approval by the Banking division’s credit committees. Retail, Commercial and Property Finance each use credit underwriting and monitoring measures appropriate to the diverse and specialised nature of their lending.
The Banking division has a dual approach to mitigating credit risk by:• lending on a secured basis with emphasis on both the customer’s ability to repay and the quality of the underlying security to
minimise any loss should the customer not be able to repay; and• where the security collateralising a loan is less tangible, or in cases of higher loan to valuation (“LTV”), greater scrutiny is applied
both analytically and in terms of escalation of sanctioning authority.
The Banking division’s collections and recoveries processes are designed to provide a fair, consistent and effective operation for arrears management. The Banking division seeks to engage in early communication with borrowers experiencing difficulty in meeting their repayments, to obtain their commitment to maintaining or re-establishing a regular payment plan.
ForbearanceForbearance occurs when a customer is experiencing difficulty in meeting their financial commitments and the Banking division grants a concession, by changing the terms of the financial arrangement, which it would not otherwise consider. This arrangement can be temporary or permanent depending on the customers’ circumstances.
The Banking division maintains a forbearance policy to ensure the necessary processes are in place to enable consistently fair treatment of each customer and that they are managed based on their individual circumstances. The arrangements agreed with customers will aim to create a sustainable and affordable financial position. The Banking division periodically reviews its forbearance policy and approach to ensure it is still effective.
The Banking division offers a range of assistance to support customers which vary depending on the product and the customer’s status. Such concessions could involve changing the terms and conditions of a loan, for example by extending its term, amending the type of loan, deferring interest or by capitalising arrears.
The Banking division seeks to ensure that any forbearance results in a fair outcome for the customer and will not repossess an asset unless all other reasonable attempts to resolve the position have failed.
Loans are classified as forborne at the time a customer in financial difficulty is granted a concession. Where forbearance has been granted, the customer will remain treated and recorded as forborne until the following exit conditions are met:
1. When all due payments, as per the amended contractual terms, have been made in a timely manner over a continuous repayment period (loan is considered as performing);
2. A minimum two year probation period has passed from the date the forborne exposure was considered as performing; and
3. None of the customer’s exposures with the Banking division are more than 30 days past due at the end of the probation period.
The loan loss provision takes account of the credit risk that arises from forbearance. At 31 July 2017, the gross carrying amount of exposures with forbearance measures was £120.4 million (31 July 2016: £123.5 million).
Analysis of forborne accounts is shown in the table below.
Gross loans and advances to customers
£ million
Forborne loans
£ million
Forborne loans as a percentage
of gross loans and advances to
customers£ million
Provision onforborne loans
£ million
31 July 2017 6,937.1 120.4 1.7% 23.631 July 2016 6,491.3 123.5 1.9% 30.2
27. Financial risk management continued

Close Brothers Group plc Annual Report 2017F
inancial State
ments
143
Divisional credit riskRetail Finance is predominantly high volume secured lending with a small average loan size. Credit issues are identified early via largely automated tracking processes. Remedial actions are implemented promptly to restore customers to a performing status or recovery methods are applied to minimise potential loss.
Commercial Finance is a combination of several niche lending businesses with a diverse mix of loans in terms of assets financed, and average loan size and LTV percentage. Credit quality is predominately assessed on an individual loan by loan basis. Recovery activity is executed promptly by experts in the specialised assets. This approach allows remedial action to be implemented at the appropriate time to minimise potential loss.
Property Finance is a portfolio of higher value, low volume lending with credit quality assessed on an individual loan by loan basis. Loans are continually monitored to determine whether they are performing satisfactorily.
In Property and Commercial Finance performing loans with elevated levels of credit risk may be placed on watch lists depending on the perceived severity of the credit risk.
Much of the Banking division’s lending is short-term and the average loan size is small with the result that individual loans have little capacity to materially impact the group’s earnings.
Credit risk reportingLoans and advances to customers, as disclosed in note 10, are analysed between the following categories for credit risk reporting:
(i) Neither past due nor impairedThese loans and advances to customers reflect the application of consistent and conservative lending criteria on inception and the quality and level of security held. The contractual repayments are monitored to ensure that classification as neither past due nor impaired remains appropriate and also demonstrates the short-term nature of the lending, with £3.8 billion (2016: £3.5 billion) having a contractual maturity of less than 12 months.
The following table shows the ageing of loans and advances to customers split by credit assessment method which are neither past due nor impaired.
31 July 2017 Loans and advances to customers
31 July 2016 Loans and advances to customers
Individuallyassessed
£ million
Collectivelyassessed
£ millionTotal
£ million
Individuallyassessed
£ million
Collectivelyassessed
£ millionTotal
£ million
Within one month 601.4 362.0 963.4 454.7 279.6 734.3Between one and three months 363.5 440.2 803.7 441.1 422.0 863.1Between three months and one year 968.9 1,091.6 2,060.5 894.9 1,054.9 1,949.8Over one year 943.3 1,786.3 2,729.6 813.0 1,776.8 2,589.8
2,877.1 3,680.1 6,557.2 2,603.7 3,533.3 6,137.0
(ii) Past due but not impairedLoans and advances to customers are classified as past due but not impaired when the customer has failed to make a payment when contractually due but there is no evidence of impairment. This includes loans which are individually assessed for impairment but where the value of security is sufficient to meet the required repayments. This also includes loans to customers which are past due for technical reasons such as delays in payment processing or rescheduling of payment terms.
The following table shows the ageing of loans and advances to customers split by credit assessment method which are past due but for which no impairment provision has been raised.
31 July 2017 Loans and advances to customers
31 July 2016 Loans and advances to customers
Individuallyassessed
£ million
Collectivelyassessed
£ millionTotal
£ million
Individuallyassessed
£ million
Collectivelyassessed
£ millionTotal
£ million
Within one month 50.3 8.2 58.5 19.4 7.6 27.0Between one and three months 35.9 4.7 40.6 62.4 9.1 71.5Between three months and one year 29.9 29.3 59.2 42.2 17.4 59.6Over one year 52.9 32.9 85.8 22.2 15.5 37.7
169.0 75.1 244.1 146.2 49.6 195.8

The Notes continued
Close Brothers Group plc Annual Report 2017144
(iii) ImpairedThe factors considered in determining whether assets are impaired are outlined in the accounting policies in note 1(i). Impaired loans and advances to customers are analysed according to whether the impairment provisions are individually or collectively assessed.
Individually assessed provisions are determined on a case by case basis, taking into account the financial condition of the customer and an estimate of potential recovery from the realisation of security. Typically this methodology is applied by the Property Finance business and by the invoice finance business within Commercial Finance.
Collectively assessed provisions are considered on a portfolio basis, to reflect the homogeneous nature of the assets. A percentage of the portfolio is impaired by evaluating the ageing of missed payments combined with the historical recovery rates for that particular portfolio. Typically this methodology is applied by the Retail Finance businesses and the asset finance business within Commercial Finance.
The gross impaired loans are quoted without taking account of any collateral or security held, which could reduce the potential loss. The application of conservative LTV ratios on inception and the emphasis on the quality of the security provided are reflected in the low provision to gross impaired balance ratio (“coverage ratio”) of 39% (2016: 38%).
The following table shows gross impaired loans and advances to customers and the provision thereon split by assessment method.
31 July 2017 Loans and advances to customers
31 July 2016 Loans and advances to customers
Individuallyassessed
£ million
Collectivelyassessed
£ millionTotal
£ million
Individuallyassessed
£ million
Collectivelyassessed
£ millionTotal
£ million
Gross impaired loans 62.9 72.9 135.8 75.4 83.1 158.5Provisions (30.5) (21.9) (52.4) (37.4) (22.3) (59.7)
Net impaired loans 32.4 51.0 83.4 38.0 60.8 98.8
The amount of interest income accrued on impaired loans and advances to customers was £12.9 million (31 July 2016: £16.2 million).
The group holds collateral against loans and advances to customers in the form of residential and commercial property and charges over business assets such as equipment, inventory and accounts receivable. Analysis by LTV ratio is provided below based on the group’s lending facilities to customers where the exposure at origination exceeded £1.0 million, excluding Property Finance facilities written pre 2009. Lending below this threshold has greater homogeneity predominately in the motor and premium finance businesses with typical LTV ratio between 80% and 90%. The value of collateral used in determining the LTV ratio is based upon data captured at loan origination, or where available, a more recent updated valuation.
Gross loans and advances to customers where exposure at origination exceeded £1.0 million:
Retail£ million
Commercial£ million
Property£ million
Total£ million
LTVLess than 70% – 212.1 1,331.3 1,543.470% to 90% 4.6 352.0 9.1 365.7Greater than 90% 16.3 138.6 – 154.9
At 31 July 2017 20.9 702.7 1,340.4 2,064.0
Retail£ million
Commercial£ million
Property£ million
Total£ million
LTVLess than 70% – 203.1 1,228.1 1,431.270% to 90% – 298.2 25.1 323.3Greater than 90% – 143.3 – 143.3
At 31 July 2016 – 644.6 1,253.2 1,897.8
27. Financial risk management continued

Close Brothers Group plc Annual Report 2017F
inancial State
ments
145
Financial assets: Settlement balancesCredit risk management and monitoringThe credit risk presented by settlement balances in the Securities division is limited, as such balances represent delivery versus payment transactions where delivery of securities occurs simultaneously with payment. The credit risk is therefore limited to the change in market price of a security between trade date and settlement date and not the absolute value of the trade. Winterflood is a market-maker and trades on a principal-only basis with regulated counterparties including stockbrokers, wealth managers, institutions and hedge funds who are either authorised and regulated by the PRA and/or FCA or equivalent regulator in the respective country.
Credit risk reportingSettlement balances are classified as neither past due nor impaired when the respective trades have not yet reached their settlement date. Settlement balances are classified as past due but not impaired when trades fail to be settled on their contractual settlement date. The credit risk presented by settlement balances which are past due is mitigated by the delivery versus payment mechanism, as well as by Winterflood trading only with regulated counterparties. Counterparty exposure and settlement failure monitoring controls are in place as part of an overall risk management framework and settlement balances past due are actively managed.
The following table shows the ageing of settlement balances:
31 July 2017 31 July 2016
Neither pastdue nor
impaired£ million
Past duebut not
impaired£ million
Total£ million
Neither pastdue nor
impaired£ million
Past duebut not
impaired£ million
Total£ million
Within one month 523.7 20.0 543.7 449.9 25.8 475.7Between one and three months – 1.8 1.8 – 1.0 1.0Between three months and one year – 0.6 0.6 – 0.6 0.6Over one year – 0.6 0.6 – 0.8 0.8
523.7 23.0 546.7 449.9 28.2 478.1
(d) Market riskMarket risk is the risk that a change in the value of an underlying market variable, such as interest or foreign exchange rates, will give rise to an adverse movement in the value of the group’s assets and arises primarily in the Securities division.
Interest rate riskThe group’s exposure to interest rate risk arises in the Banking division and the remainder of this section relates to the Banking division accordingly. Interest rate risk in the group’s other divisions is considered to be immaterial.
The group has a simple and transparent balance sheet and a low appetite for interest rate risk which is limited to that required to operate efficiently.
The group’s policy is to match repricing characteristics of assets and liabilities naturally where possible or by using interest rate swaps where necessary to secure the margin on its loans and advances to customers. These interest rate swaps are disclosed in note 13.
The Asset and Liability Committee (“ALCO”) monitors the interest rate risk exposure across the balance sheet. There are three main sources of interest rate risk recognised, which could adversely impact future income or the value of the balance sheet:
• repricing risk – occurs when assets and liabilities reprice at different times;• embedded optionality risk – occurs as a result of special conditions attached to contract terms embedded in some loans; and• basis risk – occurs where there is a mismatch in the interest rate reference rate for assets and liabilities.
We have amended our methodology for the sensitivity analysis calculations to interest rate risk exposure in line with industry practice and standards. This corresponds with the way the ALCO monitors this exposure. The results below therefore differ to those reported in 2016.

The Notes continued
Close Brothers Group plc Annual Report 2017146
The table below sets out the assessed impact on our base case earnings at risk (“EaR”) due to a parallel shift in interest rates as at 31 July 2017:
2017£ million
2016£ million
0.5% increase (8.7) (7.1)0.5% decrease 6.2 5.1
The table below sets out the assessed impact on our base case economic value of equity (“EVE”) due to a shift in interest rates at 31 July 2017:
2017£ million
2016£ million
0.5% increase 0.2 0.10.5% decrease (0.1) –
Foreign currency riskThe group has limited exposure to foreign currency risk which derives from the equity balances of its overseas operations, which are not hedged. These balances are predominantly in euros. Foreign exchange differences which arise from the translation of these operations are recognised directly in equity.
A change in the euro exchange rate would decrease the group’s equity by the following amounts:
2017£ million
2016£ million
20% strengthening of sterling against the euro (3.4) (2.6)
The group has additional material currency assets and liabilities primarily as a result of treasury operations in the Banking division. These assets and liabilities are matched by currency, using exchange rate derivative contracts where necessary. Details of these contracts are disclosed in note 13. Other potential group exposures arise from share trading settled in foreign currency in the Securities division, and foreign currency equity investments. The group has policies and processes in place to manage foreign currency risk, and as such the impact of any reasonably expected exchange rate fluctuations would not be material.
Market price risksTrading financial instruments: Equity shares and debt securitiesThe group’s trading activities relate to Winterflood. The following table shows the group’s trading book exposure to market price risk.
Highestexposure£ million
Lowestexposure£ million
Averageexposure£ million
Exposureat 31 July£ million
For the year ended 31 July 2017Equity sharesLong 42.4 22.3 31.6 31.9Short 24.6 9.7 15.7 16.2
15.9 15.7
Debt securitiesLong 20.6 10.4 14.8 16.2Short 13.4 5.3 9.0 11.5
5.8 4.7
27. Financial risk management continued

Close Brothers Group plc Annual Report 2017F
inancial State
ments
147
Highestexposure£ million
Lowestexposure£ million
Averageexposure£ million
Exposureat 31 July
£ million
For the year ended 31 July 2016Equity sharesLong 55.6 25.2 35.0 26.1Short 25.3 7.1 12.6 13.5
22.4 12.6
Debt securitiesLong 27.3 10.6 15.0 20.3Short 14.1 7.0 10.3 5.8
4.7 14.5
With respect to the long and short positions on debt securities £3.5 million and £1.4 million (2016: £1.7 million and £0.1 million) were due to mature within one year respectively.
The average exposure has been calculated on a daily basis. The highest and lowest exposures occurred on different dates and therefore a net position of these exposures does not reflect a spread of the trading book.
Based upon the trading book exposure given above, a hypothetical fall of 10% in market prices would result in a £1.6 million decrease (2016: £1.3 million decrease) in the group’s income and net assets on the equity trading book and a £0.5 million decrease (2016: £1.5 million decrease) on the debt securities trading book. However, the group’s trading activity is mainly market-making where positions are managed throughout the day on a continuous basis. Accordingly, the sensitivity referred to above is purely hypothetical.
Non-trading financial instrumentsNet gains and losses on non-trading financial instruments are disclosed in notes 11 and 12.
(e) Liquidity riskLiquidity risk is the risk that liabilities cannot be met when they fall due or can only be met at an uneconomic price and arises mainly in the Banking division.
The group has a prudent liquidity position with total available funding at 31 July 2017 of £8.8 billion (31 July 2016: £8.2 billion). This funding is significantly in excess of its loans and advances to customers at 31 July 2017 of £6.9 billion (31 July 2016: £6.4 billion). The group has a large portfolio of high quality liquid assets principally including cash placed on deposit with the Bank of England. The group measures liquidity risk with a variety of measures including regular stress testing and cash flow monitoring, and reporting to both the group and divisional boards.
The following table analyses the contractual maturities of the group’s on balance sheet financial liabilities on an undiscounted cash flow basis.
Ondemand£ million
In lessthan three
months£ million
In more than three
months but not more
than six months
£ million
In more than six
months but not more than one
year£ million
In more than
one year but not
more than five years
£ million
In morethan five
years£ million
Total£ million
At 31 July 2017Settlement balances – 524.9 – – – – 524.9Deposits by banks 18.5 15.4 30.0 7.6 0.7 – 72.2Deposits by customers 117.5 961.4 923.3 1,634.6 1,550.1 – 5,186.9Loans and overdrafts from banks 12.3 75.1 0.1 21.0 224.6 – 333.1Debt securities in issue – 26.7 28.0 102.3 1,133.9 324.8 1,615.7Loans from money brokers against stock advanced 4.3 – – – – – 4.3Subordinated loan capital – 1.7 3.7 5.4 36.2 274.2 321.2Derivative financial instruments 0.1 5.2 2.7 6.4 44.7 19.8 78.9Other financial liabilities 12.5 97.0 1.1 1.2 7.8 – 119.6
Total 165.2 1,707.4 988.9 1,778.5 2,998.0 618.8 8,256.8

The Notes continued
Close Brothers Group plc Annual Report 2017148
27. Financial risk management continued
Ondemand£ million
In lessthan three
months£ million
In more than three months but not more
than six months£ million
In more than six months
but not more than one
year£ million
In more than one year but
not more than five
years£ million
In morethan five
years£ million
Total£ million
At 31 July 2016Settlement balances – 456.3 – – – – 456.3Deposits by banks 31.8 1.9 15.8 11.0 10.9 – 71.4Deposits by customers 124.7 925.6 741.3 1,419.8 1,765.1 – 4,976.5Loans and overdrafts from banks 11.0 208.0 75.2 86.1 90.9 – 471.2Debt securities in issue – 10.1 9.0 572.5 851.7 42.2 1,485.5Loans from money brokers against stock advanced 30.0 – – – – – 30.0Subordinated loan capital – 1.7 – 1.7 13.6 62.0 79.0Derivative financial instruments 0.2 4.3 2.1 4.3 20.8 1.9 33.6Other financial liabilities 37.2 82.9 2.6 1.0 1.1 – 124.8
Total 234.9 1,690.8 846.0 2,096.4 2,754.1 106.1 7,728.3
Derivative financial instruments in the table above includes net currency swaps. The following table shows the currency swaps on a gross basis:
On demand £ million
In less than three
months £ million
In more than three months but not more
than six months £ million
In more than six months
but not more than one
year £ million
In more than one year but
not more than five
years £ million
In more than five
years £ million
Total £ million
At 31 July 2017 19.8 74.6 2.7 6.4 44.7 19.8 168.0At 31 July 2016 19.5 62.2 2.1 4.3 20.8 1.9 110.8
28. Interest in unconsolidated structured entitiesStructured entities are those entities that have been designed so that voting or similar rights are not the dominant factor in deciding who has control, such as when any voting rights relate to administrative tasks only, or when the relevant activities are directed by means of contractual arrangements.
The group has interests in structured entities as a result of contractual arrangements arising from the management of assets on behalf of its clients as part of its Asset Management division. These structured entities consist of unitised vehicles such as Authorised Unit Trusts (“AUTs”) and Open Ended Investment Companies (“OEICs”) which entitle investors to a percentage of the vehicle’s net asset value. The structured entities are financed by the purchase of units or shares by investors. The group does not hold direct investments in its structured entities.
As fund manager, the group does not guarantee returns on its funds or commit to financially support its funds. The business activity of all structured entities is the management of assets in order to maximise investment returns for investors from capital appreciation and/or investment income. The group earns a management fee from its structured entities, based on a percentage of the entity’s net asset value.
The main risk the group faces from its interest in assets under management on behalf of external investors is the loss of fee income as a result of the withdrawal of funds by clients. Outflows from funds are dependent on market sentiment, asset performance and investor considerations. The assets under management of unconsolidated structured entities managed by the group were £3,830 million as at 31 July 2017 (31 July 2016: £3,273 million). Included in revenue on the consolidated income statement is management fee income of £22.8 million (2016: £20.8 million) from unconsolidated structured entities managed by the group.

Close Brothers Group plc Annual Report 2017F
inancial State
ments
149
GroupClose Brothers Holdings Limited1
BankingAir and General Finance Limited2
Armed Services Finance Limited5
Arrow Audit Services Limited11, 20
Brook Funding (No.1) Limited14, 20
CBM Holdings Limited1
CLL I Limited16
Close Asset Finance Limited2
Close Brewery Rentals Limited6
Close Brothers Asset Finance GmbH (Germany)18
Close Brothers Factoring GmbH (Germany)18
Close Brothers Finance plc1
Close Brothers Limited1
Close Brothers Military Services Limited5
Close Brothers Technology Services Limited (85% shareholding)1
Close Business Finance Limited2
Close Credit Management (Holdings) Limited1
Close Finance (CI) Limited (Jersey)19
Close International Bank Holdings Limited (Guernsey)4
Close Invoice Finance Limited1
Close Leasing Limited16
Close Motor Finance Limited5
Close PF Funding I Limited13, 20
Close Trust Nominees Limited1
Commercial Acceptances Limited7
Commercial Finance Credit Limited2
Close Brothers Vehicle Hire Limited17
Ecasks Limited6
Finance for Industry Limited1
Banking continuedFinance for Industry Services Limited1
Kingston Asset Finance Limited2
Kingston Asset Leasing Limited2
Metropolitan Factors Limited1
Micgate Holdings (UK) Limited1
Novitas Loans Limited15
Novitas (Salisbury) Limited15
Orbita Funding 2016-1 plc14, 20
Surrey Asset Finance Limited2
SecuritiesW.S. (Nominees) Limited3
Winterflood Client Nominees Limited3
Winterflood Gilts Limited3
Winterflood Securities Holdings Limited3
Winterflood Securities Limited3
Asset ManagementAcre 1172 Limited1
Adrian Smith & Partners Limited1
Cavanagh Financial Management Limited8
CBF Wealth Management Limited1
CFSL Management Limited1
Chartwell Private Client Limited1
Close Asset Management Holdings Limited1
Close Asset Management Limited1
Close Asset Management (UK) Limited1
Close Brothers Properties Guernsey Limited (Guernsey)4
Close International Asset Management Holdings Limited (Guernsey)4
Close Investments Limited1
Close Portfolio Management Limited1
Close Properties Jersey Limited (Jersey)9
EOS Wealth Management Limited1
Lion Nominees Limited1
Mackay Stewart and Brown Limited10
Place Campbell Close Brothers Limited (50% shareholding)12
Registered offices: 1 10 Crown Place, London EC2A 4FT, United Kingdom. 2 Wimbledon Bridge House, Hartfield Road, Wimbledon, London SW19 3RU, United Kingdom. 3 The Atrium Building Cannon Bridge, 25 Dowgate Hill, London EC4R 2GA, United Kingdom. 4 1st and 2nd Floors, Elizabeth House, Les Ruettes Brayes, St Peter Port, GY1 1EW, Guernsey. 5 Roman House, Roman Road, Doncaster, South Yorkshire DN4 5EZ, United Kingdom. 6 Unit 1, Kingfisher Park, Headlands Business Park, Ringwood, Hampshire BH24 3NX, United Kingdom. 7 100 George Street, London W1U 8NU, United Kingdom. 8 4th Floor, The Athenaeum Building, 8 Nelson Mandela Place, Glasgow, G2 1BT, United Kingdom. 9 47 Esplanade, St Helier JE1 0BD, Jersey.10 Saltire Court, 3rd Floor, West Wing, 20 Castle Terrace, Edinburgh, Scotland EH1 2EN, United Kingdom.11 6 Coldbath Square, London, EC1R 5HL, United Kingdom.12 Wilmington House, High Street, East Grinstead, West Sussex RH19 3AU, United Kingdom.13 Wilmington Trust Sp Services (London) Limited, Third Floor, 1 King’s Arms Yard, London EC2R 7AF, United Kingdom.14 35 Great St. Helen’s, London EC3A 6AP, United Kingdom.15 27 Barnack Business Centre, Salisbury, Wiltshire, SP1 2LP, United Kingdom.16 Olympic Court Third Avenue, Trafford Park Village, Manchester M17 1AP, United Kingdom.17 Lows Lane, Stanton-By-Dale, Ilkeston, Derbyshire DE7 4QU, United Kingdom.18 Grosse Bleiche 35-39, 55116, Mainz, Germany.19 Conway House, Conway Street, St Helier, JE4 5SR, Jersey.
Subsidiaries by virtue of control:20 The related undertakings are included in the consolidated financial statements as they are controlled by the group.
29. Investments in subsidiariesIn accordance with section 409 of the Companies Act 2006, the following is a list of the group’s subsidiaries at 31 July 2017 which are all wholly-owned and incorporated in the UK unless otherwise stated.

Close Brothers Group plc Annual Report 2017150
Glossary
Adjusted Adjusted measures are used to increase comparability between periods and exclude amortisation of intangible assets on acquisition, and any exceptional items
Adjusted operating profit (“AOP”)
Operating income less adjusted operating expenses and impairment losses
Asset Risk Consultants (“ARC”)
Independent investment management consultant providing manager research and benchmarking for private client investment managers, charities, trustees and family offices
Bad debt ratio Impairment losses as a percentage of average net loans and advances to customers and operating lease assets
Bargains per day Average number of Winterflood’s trades with third parties
Buy-as-you-earn (“BAYE”) The HM Revenue & Customs approved Share Incentive Plan that gives all employees the opportunity to become shareholders in the group
Capital Requirements Directive IV (“CRD IV”)
European Union regulation implementing the Basel III requirements in Europe, alongside CRR
Capital Requirements Regulation (“CRR”)
European Union regulation implementing the Basel III requirements in Europe, alongside CRD IV
CET1 capital ratio Measure of the group’s CET1 capital as a percentage of risk weighted assets, as required by CRR
Common equity tier 1 (“CET1”) capital
Consists of highest quality capital including ordinary shares, share premium account, retained earnings and other reserves
Compensation ratio Total staff costs as a percentage of operating income
Dividend per share (“DPS”) Comprises the final dividend proposed for the respective year together with the interim dividend declared and paid in the year
Earnings per share (“EPS”) Profit attributable to shareholders divided by number of basic shares
Effective tax rate Tax on operating profit/(loss) as a percentage of profit/(loss) on ordinary activities before tax
Expense/income ratio Total adjusted operating expenses divided by operating income
Financial Conduct Authority (“FCA”)
A financial regulatory body in the UK, responsible for regulating financial firms and maintaining integrity of the UK’s financial market
Financial Reporting Council (“FRC”)
An independent regulatory body responsible for promoting high quality corporate governance and reporting amongst UK companies
Funding allocated to loan book
Total funding excluding equity and funding held for liquidity purposes
Funding % loan book Total funding divided by net loans and advances to customers
General Data Protection Regulation (“GDPR”)
Regulation intended to strengthen and unify data protection for all individuals within the European Union
High quality liquid assets (“HQLAs”)
Assets which qualify for regulatory liquidity purposes, including Bank of England deposits and sovereign and central bank debt, including funds drawn under the Funding for Lending Scheme
Hire purchase loan In a hire purchase agreement, the customer fully pays down the loan over its life. Once all payments have been made, the customer has the option to simply hand back the vehicle or to pay a final option fee and take the ownership of the vehicle
Independent Financial Adviser (“IFA”)
Professional offering independent, whole of market advice to clients including investments, pensions, protection and mortgages
Internal Capital Adequacy Assessment Process (“ICAAP”)
An annual self-assessment of a bank’s material risks and the associated level of capital needed to be held, and undertaking appropriate stress testing to test capital adequacy
Internal Ratings Based (“IRB”) approach
A supervisor approved method using internal, rather than supervisory, risk parameters to calculate credit risk regulatory capital requirements
International Accounting Standards (“IAS”)
Older set of standards issued by the International Accounting Standards Council setting up accounting principles and rules for preparation of financial statements. IAS are being superseded by IFRS
International Financial Reporting Standards (“IFRS”)
Globally accepted accounting standards issued by the IFRS Foundation and the International Accounting Standards Board

Close Brothers Group plc Annual Report 2017F
inancial State
ments
151
Leverage ratio Tier 1 capital as a percentage of total balance sheet assets, adjusted for certain capital deductions, including intangible assets, and off balance sheet exposures
Liquidity coverage ratio Measure of the group’s HQLAs as a percentage of expected net cash outflows over the next 30 days in a stressed scenario
Loan-to-value ratio (“LTV”) For a secured loan, the loan balance as a percentage of the total value of the asset
Managed assets Total market value of assets which are managed by Close Brothers in one of our investment solutions
Market abuse regulation (“MAR”)
European regulation aimed at increasing market integrity and investor protection
MiFID 2 The Markets in Financial Instruments Directive is the EU legislation that regulates firms who provide services to clients linked to financial instruments, and the venues where those instruments are traded. MiFID 2 is revised regulation, which takes effect from 3 January 2018
Net interest margin (“NIM”) Net income generated by lending activities, including net interest income, net fees and commissions and net operating lease income less depreciation on operating lease assets, divided by average net loans and advances to customers and operating lease assets
Operating margin Adjusted operating profit divided by operating income
Personal Contract Plan (“PCP”)
PCP is an alternative form of car finance, where the customer pays smaller monthly instalments. At the end of the loan period, a customer can decide whether to a) pay a balloon payment and take the ownership of the vehicle; b) return the car with no additional payment; or c) use the value of the car paid to negotiate a deal on another car
Prudential Regulation Authority (“PRA”)
A financial regulatory body, responsible for regulating and supervising banks and other financial institutions in the UK
Return on net loan book (“RoNLB”)
Adjusted operating profit from lending activities divided by average net loans and advances to customers and operating lease assets
Return on opening equity (“RoE”)
Adjusted operating profit after tax and non-controlling interests divided by opening equity, excluding non-controlling interests
Revenue margin Income from advice, investment management and related services divided by average total client assets
Risk weighted assets (“RWA”) A measure of a bank’s assets, adjusted for risk. It is used in determining the capital requirement for a financial institution
Save-as-you-earn (“SAYE”) Scheme intended to encourage saving and build long-term share ownership in the group
Secured debt Debt backed or secured by collateral
Senior debt Represents the type of debt that takes priority over other unsecured or more junior debt owed by the issuer. Senior debt is first to be repaid ahead of other lenders or creditors
Standardised approach Generic term for regulator defined approaches for calculating credit, operational and market risk capital requirements as set out in the CRR
Term funding Funding with a remaining maturity greater than 12 months
Tier 2 capital Additional regulatory capital that along with tier 1 capital makes up a bank’s total regulatory capital. Includes qualifying subordinated debt
Total client assets Total market value of all client assets including both managed assets and assets under advice and/or administration
Total shareholder return (“TSR”)
Measure of shareholder return including share price appreciation and dividends, which are assumed to be re-invested in the company’s shares

Close Brothers Group plc Annual Report 2017152
Financial calendar (provisional)Event Date
First quarter trading update November 2017Annual General Meeting 16 November 2017Final dividend payment 21 November 2017Pre-close trading update January 2018Half year end 31 January 2018Interim results March 2018Third quarter trading update May 2018Pre-close trading update July 2018Financial year end 31 July 2018Preliminary results September 2018
The financial calendar is updated on a regular basis throughout the year. Please refer to our website www.closebrothers.com for up-to-date details.
Cautionary StatementCertain statements included or incorporated by reference within this report may constitute “forward-looking statements” in respect of the group’s operations, performance, prospects and/or financial condition. Forward-looking statements are sometimes, but not always, identified by their use of a date in the future or such words as “anticipates”, “aims”, “due”, “could”, “may”, “will”, “should”, “expects”, “believes”, “intends”, “plans”, “potential”, “targets”, “goal” or “estimates”. By their nature, forward-looking statements involve a number of risks, uncertainties and assumptions and actual results or events may differ materially from those expressed or implied by those statements. Accordingly, no assurance can be given that any particular expectation will be met and reliance should not be placed on any forward-looking statement. Additionally, forward-looking statements regarding past trends or activities should not be taken as a representation that such trends or activities will continue in the future. No responsibility or obligation is accepted to update or revise any forward-looking statement resulting from new information, future events or otherwise. Nothing in this report should be construed as a profit forecast. Past performance is no guide to future performance and persons needing advice should consult an independent financial adviser.
This report does not constitute or form part of any offer or invitation to sell, or any solicitation of any offer to subscribe for or purchase any shares or other securities in the company or any of its group members, nor shall it or any part of it or the fact of its distribution form the basis of, or be relied on in connection with, any contract or commitment or investment decisions relating thereto, nor does it constitute a recommendation regarding the shares or other securities of the company or any of its group members. Past performance cannot be relied upon as a guide to future performance and persons needing advice should consult an independent financial adviser. Statements in this report reflect the knowledge and information available at the time of its preparation. Liability arising from anything in this report shall be governed by English law. Nothing in this report shall exclude any liability under applicable laws that cannot be excluded in accordance with such laws.
Investor Relations

Printed by Park Communications on FSC® certified paper.
Park is EMAS certified; its Environmental Management System is certified to ISO14001.
100% of the inks used are vegetable oil based, 95% of press chemicals are recycled for further use and, on average 99% of any waste associated with this production will be recycled.
This document is printed on Carbon Balanced Regency Satin; a paper made from 10% recycled fibre and 90% virgin fibre sourced from responsibly managed forests, certified in accordance with the Forest Stewardship Council®.
The unavoidable carbon emissions generated during the manufacture and delivery of this document, have been reduced to net zero through a verified carbon offsetting project.
Designed by Emperor Design Consultants Limited.
Typeset by Donnelley Financial Solutions.
Photography by Richard Davies.
AuditorDeloitte LLP
SolicitorSlaughter and May
Corporate BrokersJ.P. Morgan CazenoveUBS Investment Bank
RegistrarCapita Asset ServicesThe Registry34 Beckenham RoadBeckenhamKent BR3 4TU
Shareholder helpline: 0871 664 0300 (Calls cost 12p per minute plus your phone company’s access charge) From overseas: +44 (0)20 8639 3399Lines are open from 9.00 am to 5.30 pm Monday to Friday, excluding UK public holidaysEmail: [email protected]: www.signalshares.com
Registered OfficeClose Brothers Group plc10 Crown PlaceLondon EC2A 4FT
Telephone: +44 (0)333 321 6100Email: [email protected]: www.closebrothers.com
Company No. 520241

Close Brothers Group plc10 Crown PlaceLondon EC2A 4FTTel: +44 (0)333 321 6100
www.closebrothers.com
LENDING | DEPOSITS | WEALTH MANAGEMENT | SECURITIES
Close B
rothers Group p
lc Annual R
eport 2017