Embed Size (px)
Citation preview

CLO Separate Account ProposalJune 2, 2021
For the Employees' Retirement System of Rhode Island Use Only
Joe Lynch
Managing Director, Head of Global Non-Investment Grade Credit and Senior Portfolio Manager Bank Loans
Pim van Schie
Managing Director, Senior Portfolio Manager CLO Strategies
Chris Crevier
Managing Director, Client Advisor

2
Table of Contents
I. EXECUTIVE SUMMARY
II. NEUBERGER BERMAN CLO PLATFORM
III. CLO EQUITY PERFORMANCE SUMMARY
IV. CLO DEBT AND OPPORTUNISTIC INVESTMENTS AND PERFORMANCE SUMMARY
V. DISCLOSURES AND RISK CONSIDERATIONS

Executive Summary

4For the Employees' Retirement System of Rhode Island Use Only
Executive Summary: CLO Equity & Mezzanine Debt Separate Account Proposal
Neuberger Berman is pleased to present our proposal to the Employees’ Retirement System of Rhode Island
Programmatic purchases of NB CLO Equity alongside Neuberger Berman, targeting 60% account exposure
Initial deployment of capital into third-party CLO Mezzanine Debt; partially sold in stages to fund CLO Equity
Portion of capital can be deployed opportunistically in third-party CLO Equity and Debt
Cost-Effective: No account-level fees on NB CLO Equity exposure; discounted fees on CLO Mezzanine Debt
Income: Account seeks to generate an attractive yield upfront through the CLO Mezzanine Debt allocation
Vintage Diversification: Programmatic purchases of CLO Equity over several years
Customized: Separate Account is structured based upon ERSRI’s constraints and objectives
Partnership: Investing with a long-standing and experienced CLO platform with leading credit analysis resources
Experience: $16bn CLO platform with experience managing CLOs and CLO markets since 2004
Quality: Neuberger Berman CLO performance in 2020 was near the top of the market across several metrics;
invest in larger, more liquid loans and seek avoidance of default
Research-Driven: Our CLO business is an integral component of our $45+bn non-Investment Grade platform, which
is supported by one of the largest fundamental research teams in the industry
Proposal Highlights
Potential Benefits to ERSRI
Why Neuberger Berman?
Objective: Efficient partnership for investments in higher-quality CLO Equity and CLO Mezzanine Debt
Past performance is not indicative of future results. As with any investment, there is the possibility of profit as well as the risk of loss. Please see the Additional Disclosures at the end of this presentation.
Preliminary terms. Subject to change.

5For the Employees' Retirement System of Rhode Island Use Only
Neuberger Berman Investment Platform
We are a 100% independent, employee-owned firm investing $429bn for clients globally to achieve their unique objectives
1. As of March 31, 2021.
Global Investment Grade
Global Non-Investment Grade
Emerging Markets
Municipals
Multi-Sector
Currency
Global
U.S.
EAFE / Japan
Emerging Markets
- China
Thematic Strategies
MLPs
PUBLIC
MARKETS
PRIVATE
MARKETS
Global
U.S.
Emerging Markets
Custom Beta
F U N D A M E N T A L Q U A N T I T A T I V E
Private Debt
Credit Opportunities
Special Situations
Residential Loans
Specialty Finance
European Private Loans
F U N D A M E N T A L Q U A N T I T A T I V E
Commodities
Options
Global Macro
Risk Parity
Risk Premia
EQUITIES FIXED INCOME HEDGE FUNDS & LIQUID ALTERNATIVES
$123bn
$77bn
$184bn
$11bn
$23bn
$3bn
Insurance-Linked Strategies
Late Stage Pre-IPO
SPACs
GLOBAL ASSET CLASS SOLUTIONS
$333bn
$96bn
Global
U.S.
Long/Short – Almanac
Private Real Estate – Almanac
Real Estate Secondaries
REAL ESTATE
$2bn
$4bn
PRIVATE EQUITY PRIVATE CREDIT SPECIALTY ALTERNATIVES PRIVATE REAL ESTATE
GLOBAL RESEARCH CAPABILITIESESG INTEGRATION DATA SCIENCE
Hedge Funds
Liquid Alternatives
Primaries
Co-Investments
Secondaries
Specialty Strategies
Alternative Asset Manager Stakes – Dyal

6For the Employees' Retirement System of Rhode Island Use Only
A Distinct Approach to ESG Investing
Continuous innovation across four key pillars, focused on material investment results and delivering solutions
1. For illustrative and discussion purposes only. PRI grades are based on information reported directly by PRI signatories, of which investment managers totaled 1,924 for 2020, 1,119 for 2019, 1,120 for 2018 and 935 for 2017.
Please see Principles for Responsible Investment (PRI) Scores and end of this material for information regarding PRI scores shown. 2. Data reported as of year-end 2020. 3. Major defined as AUM $100B or greater. 4. ESG Aware
is defined as investment teams having access to ESG resources across the firm. As of December 31, 2020, across equities and fixed income. 5. Based on AUM as of December 31, 2020 including strategies in late or final stages of
approval by firm’s ESG committee.
Member of the PRI 2020
Leaders’ Group, awarded to
only 20 of 2,100+ PRI
investment manager signatories
A+ Integral to
Our Firm 150+
scores for ESG approach by UN-supported
Principles for Responsible Investment (PRI)1
Assets managed with consistent and
demonstrable ESG integration5~80% Assets that are ESG aware4100% Sustainable and
Impact Innovations
Range of ESG-integrated investment strategies across public and private markets, including custom solutions
Proprietary, Research-
Driven Approach>1,100 Proprietary NB ESG Quotient™ Credit Ratings2
>5,000 Proprietary NB ESG Quotient™ Equity Ratings2
Assess climate
risk for all public
equity and fixed
income holdings +
seek to mitigate
investment professionals with formal
ESG responsibility2
Active Engagement
Drives Value
Engagement meetings with
corporate management teams
across equities and credit23,666 First major asset management firm to disclose in advance
a number of key proxy votes3
Leverage data science
Investment-led integration
NB

7For the Employees' Retirement System of Rhode Island Use Only
Our Commitment to Equity, Inclusion & Diversity
We believe firms perform better when there is a true equitable and inclusive environment, which in turn drives diversity
EQUITY
To be “equitable” is to level
the playing field for all
INCLUSION
An environment where
everyone can flourish and be
their best selves
DIVERSITY
We look for a breadth of
diversity across many
characteristics
+
SENIOR LEADERSHIP + EMPLOYEE ENGAGEMENT
Operating Committee Diversity Council
How closely employee survey
scores of NB’s diverse population
compare to our highest scoring
population across (1) enablement,
training, mentoring, (2) fair
meritocracy and (3) culture
inclusion.
ACCOUNTABILITY THROUGH MEASUREMENT
Business-level dashboards as well as the custom NB EID Index
NB EQUITY, INCLUSION & DIVERSITY (NB EID) INDEX
overall score = 70%
NB EQUITY & INCLUSION INDEX
score = 90%
EMPLOYEE-INITIATED RESOURCE GROUPS (ERGs)
TO
P D
OW
NB
OT
TO
M-U
P
1
2
How closely NB reflects the
college educated population
across gender and ethnicity, by
corporate title.
NB DIVERSITY INDEX
score = 50%
Senior Equity, Inclusion & Diversity Leader
Dedicated Recruiting & Human Capital Support3
Board of Directors Engagement4

8For the Employees' Retirement System of Rhode Island Use Only
Global Non-Investment Grade Credit Team
Experienced team of over 50 investment professionals managing $45+ billion in non-investment grade assets
Employee data as of March 31, 2021. AUM data as of March 31, 2021. AUM represents assets under management of Neuberger Berman Investment Advisers LLC, Neuberger Berman Loan Advisers LLC, and Neuberger Berman
Loan Advisers II LLC. Includes Alternative capabilities and Non-Investment Grade Credit assets managed within sleeves of Multi-sector & Opportunistic mandates for both separate accounts and pooled funds. U.S. High Yield AUM
includes assets managed within Short Duration High Yield and Quality Bias High Yield. Years of experience are shown in parentheses for Portfolio Management, Research, Traders and Portfolio Analysts, Special Situations, and
Client Portfolio Specialists.
Joe Lynch
Global Head of Non-Investment Grade Credit
SENIOR
PORTFOLIO MANAGERS
9 Portfolio Managers
(24 years of exp. avg.)
RESEARCH
25 Analysts
(14 years of exp. avg.)
TRADERS & PORTFOLIO
ANALYSTS
6 Team Members
(16 years exp. avg.)
Investment Professionals
SPECIAL SITUATIONS
6 Team Members
(20 years exp. avg.)
CLIENT PORTFOLIO
SPECIALISTS
5 Team Members
(15 years exp. avg.)
Global Non-Investment Grade Strategies & AUM ($bn)
U.S. High Yield$19.3
Global High Yield$4.9
Neuberger Berrman CLOs
$13.8
Loan SMAs and Funds$4.5
Third-Party CLOs$2.2

9For the Employees' Retirement System of Rhode Island Use Only
Summary of Proposed Mandate Terms
Please see the Additional Disclosures at the end of this presentation. Subject to change.
INVESTMENT FORMAT Separate Account
TARGET INITIAL PORTFOLIO SIZE $125mm initially, at the direction of ERSRI
STRATEGY Combination of direct investments in Neuberger Berman CLO Equity and Third-Party CLO Mezzanine Debt (target rating BB)
INVESTMENT MIX Long-term allocation target of 60% CLO Equity and 40% CLO Mezzanine Debt, with capital held back for Opportunistic Investing
PORTFOLIO RAMP-UP
Initial investment in $100mm of Third-Party CLO BB-rated debt, to be sold down to 40% long-term target allocation
Ramp portfolio to long-term target allocations of 60% CLO Equity / 40% CLO Debt over 2.5-year initial investment period
Programmatic allocations to CLO Equity in CLOs managed by Neuberger Berman
INVESTMENT FEES
No management fees on Neuberger Berman CLO Equity (underlying CLOs charge standard fees)
No management fees on first $25mm of CLO Mezzanine Debt
50bps per annum on CLO Mezzanine Debt (over $25mm)
No management fees on Opportunistic Investments; 20% incentive fee after 12% IRR (no catch-up) on Opportunistic Investments
INVESTMENT CRITERIA CLO Equity and Mezzanine Debt
LIQUIDITY As directed by ERSRI
EXPECTED LIFE Indefinite Tenor, as determined by ERSRI
DISTRIBUTIONS Distributions assumed reinvested at long-term target allocation unless directed otherwise by ERSRI

10For the Employees' Retirement System of Rhode Island Use Only
Allocation Deployment Model
Ramp portfolio to long-term target allocations of 60% NB CLO Equity / 40% CLO Debt over 2.5-year initial period
1 Source: Neuberger Berman. As of May 18, 2021.
Limitations of Illustrative Returns: Illustrative returns are based on statistical analysis of information including but not limited to information about default rates, recovery rates and re-investment spreads. The Illustrative returns
presented are the views of Neuberger Berman as to how they will manage the portfolio to seek to achieve the illustrative return as of the date hereof and are subject to change; they are not a suggestion, projection or guarantee that
the Illustrative returns will be realized or achieved or that an investment strategy will be successful. Investors should keep in mind that the securities markets are volatile and unpredictable. Actual results may be significantly different
than any Illustrative results and the team’s history of achieving returns has no impact on the likelihood of a team achieving Illustrative statistics in the future. There are no guarantees that the historical or Illustrative performance of an
investment, portfolio, or asset class will have a direct correlation with its future performance. Neuberger Berman does not make any representation as to the reasonableness of the assumptions or that all the assumptions used in
calculating the illustrative returns have been stated or fully considered. Additional information on these assumptions is available upon request. Changes in the assumptions may have a material impact on the illustrative returns
presented. Past performance is not indicative of future results. As with any investment, there is the possibility of profit as well as the risk of loss. Please see the Additional Disclosures at the end of this presentation, which
include important disclosures relating to these illustrative returns. Preliminary terms. Subject to change.
Model Highlights
2.5 yrs
Initial Modeled
Ramp-up Period
$125mm
Initial Target
Portfolio Size
60% / 40%
NB CLO Equity /
CLO Debt Allocation
13%
Illustrative Annual
Distribution at Target
Portfolio Mix
0%
10%
20%
30%
40%
50%
60%
70%
80%
90%
100%
$0
$25
$50
$75
$100
$125
$150
$175
$200
Q3-2021 Q3-2022 Q3-2023 Q3-2024 Q3-2025 Q3-2026
Uncalled Opportunistic ($m) CLO Equity ($m)
CLO Mezzanine BB ($m) CLO Equity Pct. (RHS)
Target Allocation
Reached Q4-23

Neuberger Berman CLO Platform

12For the Employees' Retirement System of Rhode Island Use Only
Neuberger Berman CLO Platform Advantages
Long-standing CLO platform driven by fundamental credit philosophy has demonstrated focus on long-term returns
• Collateral Manager on 43 CLOs since 2004
• Current AUM of $13.8bn
• Focused on downside risk mitigation with
upside potential
• Over $1bn of CLO Equity Risk Retention
funds under management
CLO Collateral Manager
• Current AUM of $2.2bn
• Invests across the entire capital structure
• Focus on underlying portfolio quality with
bottom-up investment process
• Uses same credit research team and
investment philosophy
CLO Tranche Investing
Individual Loan Credit Analysis
Deal Structuring and Covenants
Knowledge of active CLO Investors
Market Technicals & Loan Supply/Demand
Relationships with CLO Arrangers
Manager and Platform Evaluation
Neuberger Berman’s CLO Team Brings Integrated CLO Equity and Debt Leadership
Long-Term Record
of Performance
Managing CLOs since 2004
across all credit cycles
One of the Largest
CLO Platforms
Success of the platform has
enabled growth; remains nimble
Higher-Quality Focus
in Leveraged Loans
Seek risk-adjusted returns
through downside protection
Leading Credit
Research Capabilities
25 credit analysts dedicated to
Non-Investment Grade credit
Employee data as of March 31, 2021. AUM data as of March 31, 2021.. This material is intended as a broad overview of the portfolio managers' style, philosophy and investment process and is subject to change without notice.
Portfolio managers' views may differ from those of other portfolio managers as well as the views of Neuberger Berman. Please see the Disclosures and Risk Considerations section of this presentation.

13For the Employees' Retirement System of Rhode Island Use Only
Neuberger Berman US CLOs – Outstanding
NB currently manages 28 US CLOs with approximately $13.5 billion assets under management1,2
¹ Performance Data as of April 30, 2021 and AUM as of April 30, 2021.² Neuberger Berman branded CLOs based on highest subordinated note syndicated price at issuance as provided by the underwriter, excluding subordinated notes packaged with non-CLO securities. NB XVI-S, XVII, XXII, XXIII, and 32 includes subordinated fee notes obtained by initial equity investors on closing.³ Includes historical performance of Neuberger Berman CLO XVI, Ltd. which was redeemed in January 2018 and sold all of its underlying loan positions to Neuberger Berman CLO XVI-S, Ltd. Subordinated note holders the same.The performance presented is supplemental to the GIPS-compliant presentation included as part of this presentation in the back. Preliminary returns, based on unreconciled data.Past performance is not indicative of future results. As with any investment, there is the possibility of profit as well as the risk of loss. Please see Disclosures, Index Definitions and Risk Factors at the end of this presentation.
Outstanding CLOs
Closing Date Initial AUM Current AUM Status
Reinvest Cash on Cash Returns
End Date Cumulative Annualized
Neuberger Berman CLO XIV, Ltd. May-13 $400,000,000 $393,056,977 Reinvesting Jan-22 117.5% 14.8%
Neuberger Berman CLO XV, Ltd. Oct-13 $400,000,000 $392,496,266 Reinvesting Oct-22 109.6% 14.4%
Neuberger Berman CLO XVI-S, Ltd. Jan-18 $450,000,000 $451,131,969 Reinvesting Apr-26 98.5%3 14.0%3
Neuberger Berman CLO XVII, Ltd. Jul-14 $550,000,000 $538,257,516 Reinvesting Apr-22 86.5% 12.8%
Neuberger Berman CLO XVIII, Ltd. Dec-14 $500,000,000 $495,874,706 Reinvesting Oct-23 84.4% 13.3%
Neuberger Berman CLO XX, Ltd. Nov-15 $500,000,000 $381,899,012 Amortizing Jan-20 117.5% 21.7%
Neuberger Berman CLO XXI, Ltd. Mar-16 $400,000,000 $339,278,029 Amortizing Apr-20 108.6% 22.5%
Neuberger Berman CLO XXII, Ltd. Sep-16 $400,000,000 $395,729,351 Reinvesting Oct-23 73.1% 16.1%
Neuberger Berman CLO XXIII, Ltd. Nov-16 $400,000,000 $396,783,193 Reinvesting Jul-21 67.0% 15.3%
NB Loan Advisers CLO 24, Ltd. (NBLA) May-17 $500,000,000 $496,183,008 Reinvesting Apr-22 56.3% 14.3%
NB Loan Advisers CLO 25, Ltd. (NBLA) Sep-17 $500,000,000 $498,238,739 Reinvesting Oct-22 52.7% 14.6%
NB Loan Advisers CLO 26, Ltd. (NBLA) Nov-17 $550,000,000 $548,272,722 Reinvesting Oct-22 52.0% 15.3%
NB Loan Advisers CLO 27, Ltd. (NBLA) Mar-18 $500,000,000 $498,838,152 Reinvesting Jan-23 53.9% 17.3%
NB Loan Advisers CLO 28, Ltd. (NBLA) Jun-18 $500,000,000 $497,992,303 Reinvesting Apr-23 46.2% 16.1%
NB Loan Advisers CLO 29, Ltd. (NBLA) Sep-18 $500,000,000 $498,770,359 Reinvesting Oct-23 38.6% 15.1%
NB Loan Advisers CLO 30, Ltd. (NBLA) Jan-19 $500,000,000 $498,831,731 Reinvesting Jan-24 39.2% 17.5%
NB Loan Advisers CLO 32, Ltd. (NBLA) Mar-19 $600,000,000 $600,377,787 Reinvesting Jan-24 48.6% 21.7%
NB Loan Advisers CLO 31, Ltd. (NBLA) May-19 $500,000,000 $500,000,000 Reinvesting Apr-24 31.9% 16.7%
NB Loan Advisers CLO 33, Ltd. (NBLA) Sep-19 $600,000,000 $600,715,874 Reinvesting Oct-24 26.6% 16.9%
NB Loan Advisers CLO 34, Ltd. (NBLA) Dec-19 $500,000,000 $501,080,999 Reinvesting Jan-25 15.5% 11.3%
NB Loan Advisers CLO 35, Ltd. (NBLA) Dec-19 $500,000,000 $499,960,751 Reinvesting Jan-25 19.5% 14.6%
NB Loan Advisers CLO 36, Ltd. (NBLA) Apr-20 $500,000,000 $500,357,487 Reinvesting Jan-25 50.5% 49.9%
NB Loan Advisers CLO 37, Ltd. (NBLA II) Jun-20 $400,000,000 $400,343,419 Reinvesting Jul-23 17.7% 21.6%
NB Loan Advisers CLO 38, Ltd. (NBLA II) Oct-20 $500,000,000 $500,000,774 Reinvesting Oct-23 14.9% 18.2%
NB Loan Advisers CLO 39, Ltd. (NBLA II) Dec-20 $500,000,000 $503,058,410 Reinvesting Jan-24 13.2% 40.3%
NB Loan Advisers CLO 40, Ltd. (NBLA II) Mar-21 $500,000,000 $501,903,756 Reinvesting Apr-24 n/a n/a
NB Loan Advisers CLO 41, Ltd. (NBLA II) Apr-21 $500,000,000 $500,000,000 Reinvesting Apr-26 n/a n/a
NB Loan Advisers CLO 42, Ltd. (NBLA II) Jun-21 $600,000,000 $600,000,000 Reinvesting Jul-26 n/a n/a

14For the Employees' Retirement System of Rhode Island Use Only
Neuberger Berman US CLOs – Redeemed
Investment philosophy of high quality portfolios and minimizing credit losses demonstrated through credit cycles1,2
¹ Performance Data and AUM as of April 15, 2021.².‘Lightpoint’ CLOs based on subordinated notes issuance price of par.³ LP III, LP IV, and LP VIII were non-traditional structures which resulted in cashflows to equity being more back-ended, known as Wachovia APEX and Lehman Par structures.The performance presented is supplemental to the GIPS-compliant presentation included as part of this presentation in the back. Preliminary returns, based on unreconciled data.Past performance is not indicative of future results. As with any investment, there is the possibility of profit as well as the risk of loss. Please see Disclosures, Index Definitions and Risk Factors at the end of this presentation.
Closing Date Initial AUM Redemption Date
Cumulative
Cash on
Cash Return
Annualized
Net Credit
Gains / -Losses IRR Notes
LightPoint CLO III, Ltd. July 2005 $447,500,000 Mar 2014 183% 0.12% 10.8%3 Non-Standard Structure3
LightPoint CLO IV, Ltd. April 2006 $350,000,000 Jan 2015 191% 0.11% 11.6%3 Non-Standard Structure3
LightPoint CLO V, Ltd. August 2006 $600,000,000 Nov 2015 216% -0.26% 19.6%
LightPoint CLO VII, Ltd. May 2007 $450,000,000 Feb 2017 225% -0.53% 20.2%
LightPoint CLO VIII, Ltd. August 2007 $485,400,000 Jul 2014 170% -0.11% 13.0%3 Non-Standard Structure3
Neuberger Berman CLO XII, Ltd. August 2012 $384,500,000 Jan 2017 154% -0.05% 14.9%
Neuberger Berman CLO XIII, Ltd. December 2012 $394,000,000 Jul 2017 131% -0.08% 11.4%
Neuberger Berman CLO XIX, Ltd. July 2015 $400,000,000 Mar 2021 166% Pending 17.1%
Redeemed CLOs
15For the Employees' Retirement System of Rhode Island Use Only
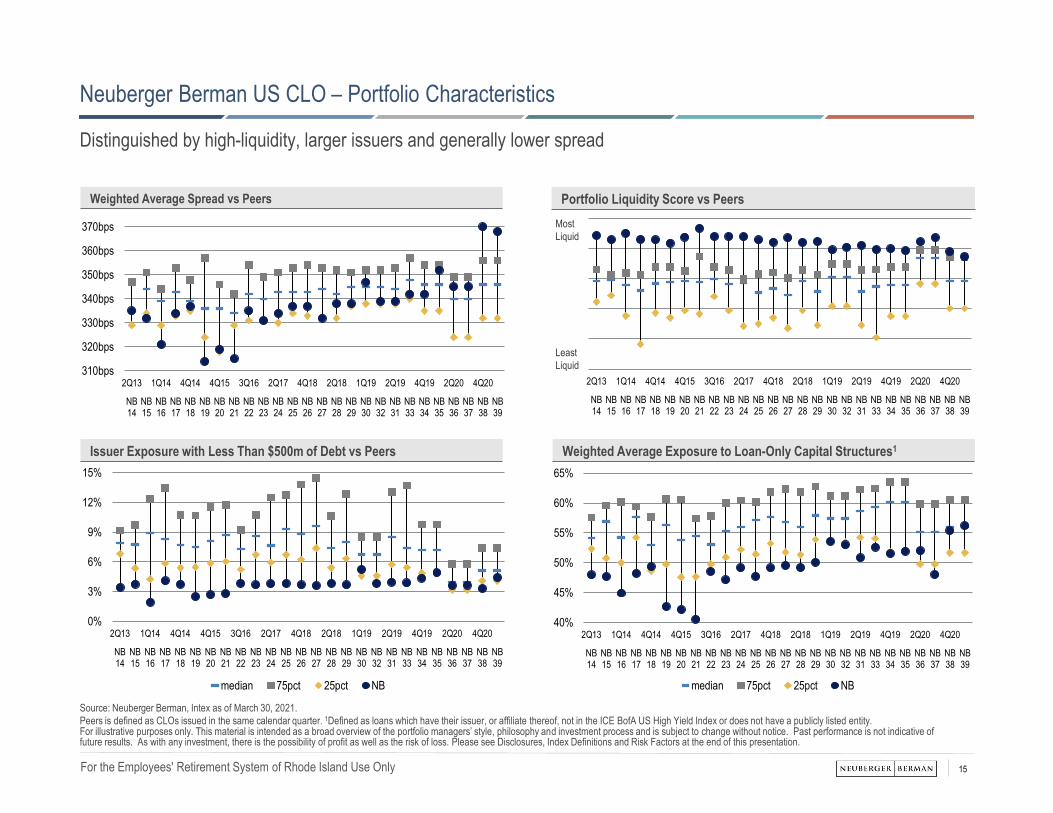
Neuberger Berman US CLO – Portfolio Characteristics
Source: Neuberger Berman, Intex as of March 30, 2021.
Peers is defined as CLOs issued in the same calendar quarter. 1Defined as loans which have their issuer, or affiliate thereof, not in the ICE BofA US High Yield Index or does not have a publicly listed entity.For illustrative purposes only. This material is intended as a broad overview of the portfolio managers’ style, philosophy and investment process and is subject to change without notice. Past performance is not indicative of future results. As with any investment, there is the possibility of profit as well as the risk of loss. Please see Disclosures, Index Definitions and Risk Factors at the end of this presentation.
Portfolio Liquidity Score vs Peers
Least
Liquid
Most
Liquid
Issuer Exposure with Less Than $500m of Debt vs Peers
2Q13 1Q14 4Q14 4Q15 3Q16 2Q17 4Q18 2Q18 1Q19 2Q19 4Q19 2Q20 4Q20
NB14
NB15
NB16
NB17
NB18
NB19
NB20
NB21
NB22
NB23
NB24
NB25
NB26
NB27
NB28
NB29
NB30
NB32
NB31
NB33
NB34
NB35
NB36
NB37
NB38
NB39
Distinguished by high-liquidity, larger issuers and generally lower spread
Weighted Average Spread vs Peers
310bps
320bps
330bps
340bps
350bps
360bps
370bps
2Q13 1Q14 4Q14 4Q15 3Q16 2Q17 4Q18 2Q18 1Q19 2Q19 4Q19 2Q20 4Q20
NB14
NB15
NB16
NB17
NB18
NB19
NB20
NB21
NB22
NB23
NB24
NB25
NB26
NB27
NB28
NB29
NB30
NB32
NB31
NB33
NB34
NB35
NB36
NB37
NB38
NB39
Weighted Average Exposure to Loan-Only Capital Structures1
0%
3%
6%
9%
12%
15%
2Q13 1Q14 4Q14 4Q15 3Q16 2Q17 4Q18 2Q18 1Q19 2Q19 4Q19 2Q20 4Q20
NB14
NB15
NB16
NB17
NB18
NB19
NB20
NB21
NB22
NB23
NB24
NB25
NB26
NB27
NB28
NB29
NB30
NB32
NB31
NB33
NB34
NB35
NB36
NB37
NB38
NB39
median 75pct 25pct NB
40%
45%
50%
55%
60%
65%
2Q13 1Q14 4Q14 4Q15 3Q16 2Q17 4Q18 2Q18 1Q19 2Q19 4Q19 2Q20 4Q20
NB14
NB15
NB16
NB17
NB18
NB19
NB20
NB21
NB22
NB23
NB24
NB25
NB26
NB27
NB28
NB29
NB30
NB32
NB31
NB33
NB34
NB35
NB36
NB37
NB38
NB39
median 75pct 25pct NB
16For the Employees' Retirement System of Rhode Island Use Only
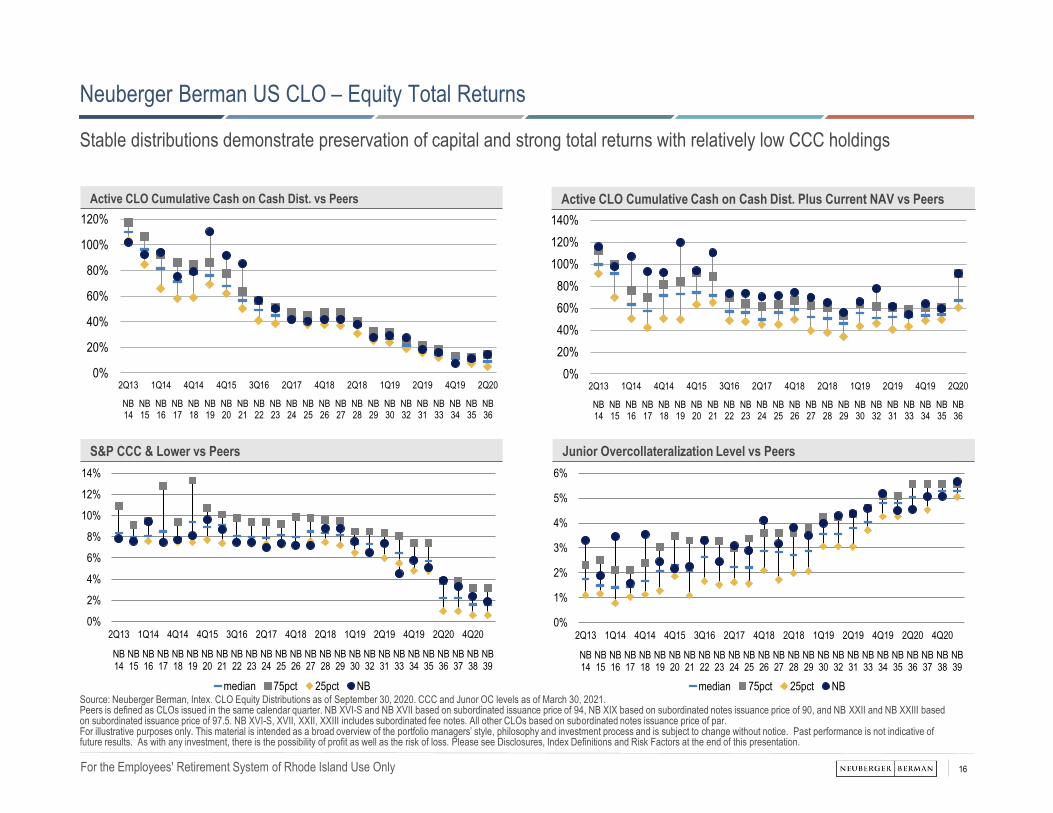
Neuberger Berman US CLO – Equity Total Returns
Source: Neuberger Berman, Intex. CLO Equity Distributions as of September 30, 2020. CCC and Junor OC levels as of March 30, 2021.Peers is defined as CLOs issued in the same calendar quarter. NB XVI-S and NB XVII based on subordinated issuance price of 94, NB XIX based on subordinated notes issuance price of 90, and NB XXII and NB XXIII based on subordinated issuance price of 97.5. NB XVI-S, XVII, XXII, XXIII includes subordinated fee notes. All other CLOs based on subordinated notes issuance price of par.For illustrative purposes only. This material is intended as a broad overview of the portfolio managers’ style, philosophy and investment process and is subject to change without notice. Past performance is not indicative of future results. As with any investment, there is the possibility of profit as well as the risk of loss. Please see Disclosures, Index Definitions and Risk Factors at the end of this presentation.
Active CLO Cumulative Cash on Cash Dist. Plus Current NAV vs Peers
S&P CCC & Lower vs Peers
Stable distributions demonstrate preservation of capital and strong total returns with relatively low CCC holdings
Active CLO Cumulative Cash on Cash Dist. vs Peers
Junior Overcollateralization Level vs Peers
0%
20%
40%
60%
80%
100%
120%
140%
2Q13 1Q14 4Q14 4Q15 3Q16 2Q17 4Q18 2Q18 1Q19 2Q19 4Q19 2Q20
NB14
NB15
NB16
NB17
NB18
NB19
NB20
NB21
NB22
NB23
NB24
NB25
NB26
NB27
NB28
NB29
NB30
NB32
NB31
NB33
NB34
NB35
NB36
0%
20%
40%
60%
80%
100%
120%
2Q13 1Q14 4Q14 4Q15 3Q16 2Q17 4Q18 2Q18 1Q19 2Q19 4Q19 2Q20
NB14
NB15
NB16
NB17
NB18
NB19
NB20
NB21
NB22
NB23
NB24
NB25
NB26
NB27
NB28
NB29
NB30
NB32
NB31
NB33
NB34
NB35
NB36
0%
2%
4%
6%
8%
10%
12%
14%
2Q13 1Q14 4Q14 4Q15 3Q16 2Q17 4Q18 2Q18 1Q19 2Q19 4Q19 2Q20 4Q20
NB14
NB15
NB16
NB17
NB18
NB19
NB20
NB21
NB22
NB23
NB24
NB25
NB26
NB27
NB28
NB29
NB30
NB32
NB31
NB33
NB34
NB35
NB36
NB37
NB38
NB39
median 75pct 25pct NB
0%
1%
2%
3%
4%
5%
6%
2Q13 1Q14 4Q14 4Q15 3Q16 2Q17 4Q18 2Q18 1Q19 2Q19 4Q19 2Q20 4Q20
NB14
NB15
NB16
NB17
NB18
NB19
NB20
NB21
NB22
NB23
NB24
NB25
NB26
NB27
NB28
NB29
NB30
NB32
NB31
NB33
NB34
NB35
NB36
NB37
NB38
NB39
median 75pct 25pct NB

17For the Employees' Retirement System of Rhode Island Use Only
Neuberger Berman CLOs Exhibited Strong Market Value Performance in 2020
Multiple research desks have highlighted outperformance of Neuberger Berman CLOs through challenging markets
Source: Left side Nomura and right side BofA Securities. Data as of July 30, 2020 and October 5, 2020, respectively. Data from BofA Securities excludes CLOs that voluntarily diverted equity cashflows in 2020.
For illustrative purposes only. This material is intended as a broad overview of the portfolio managers’ style, philosophy and investment process and is subject to change without notice. Past performance is not indicative of future
results. As with any investment, there is the possibility of profit as well as the risk of loss. See Disclosures and Risk Considerations at the end of the presentation.
BofA SECURITIES – October 5, 2020NOMURA - July 30, 2020
18For the Employees' Retirement System of Rhode Island Use Only
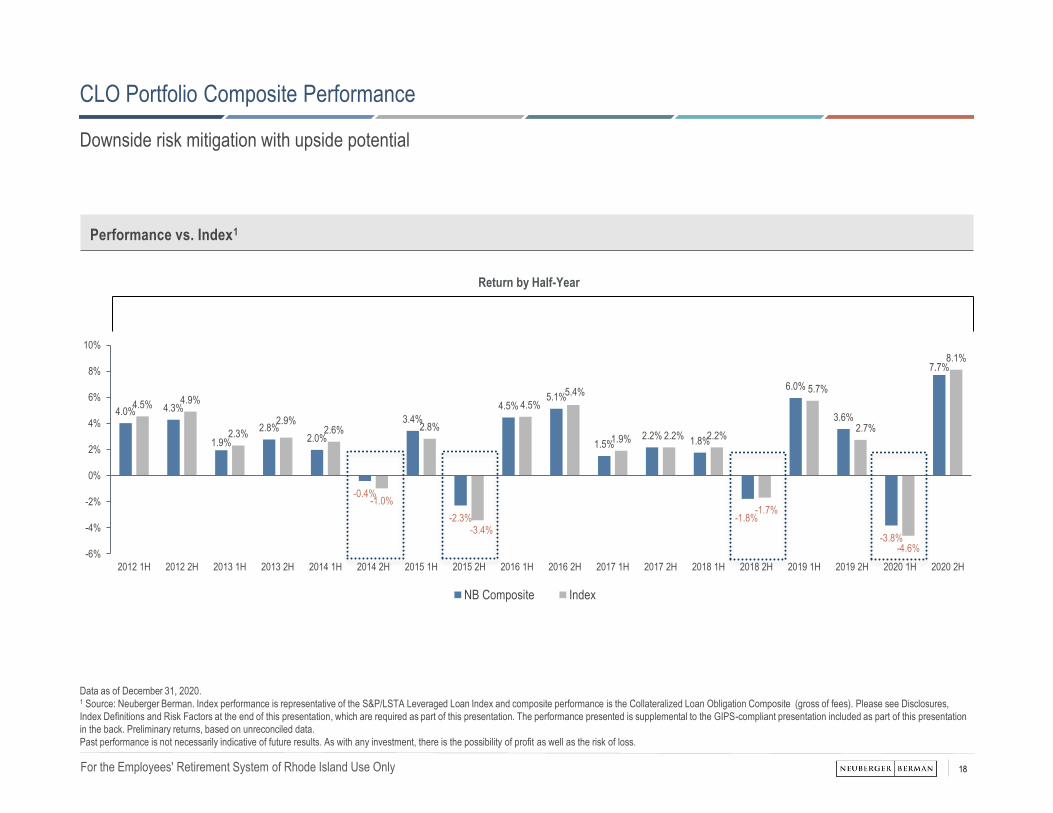
CLO Portfolio Composite Performance
Downside risk mitigation with upside potential
Data as of December 31, 2020.1 Source: Neuberger Berman. Index performance is representative of the S&P/LSTA Leveraged Loan Index and composite performance is the Collateralized Loan Obligation Composite (gross of fees). Please see Disclosures,
Index Definitions and Risk Factors at the end of this presentation, which are required as part of this presentation. The performance presented is supplemental to the GIPS-compliant presentation included as part of this presentation
in the back. Preliminary returns, based on unreconciled data.
Past performance is not necessarily indicative of future results. As with any investment, there is the possibility of profit as well as the risk of loss.
Return by Half-Year
4.0% 4.3%
1.9%
2.8%2.0%
-0.4%
3.4%
-2.3%
4.5%5.1%
1.5%2.2%
1.8%
-1.8%
6.0%
3.6%
-3.8%
7.7%
4.5% 4.9%
2.3%
2.9%2.6%
-1.0%
2.8%
-3.4%
4.5%
5.4%
1.9% 2.2% 2.2%
-1.7%
5.7%
2.7%
-4.6%
8.1%
-6%
-4%
-2%
0%
2%
4%
6%
8%
10%
2012 1H 2012 2H 2013 1H 2013 2H 2014 1H 2014 2H 2015 1H 2015 2H 2016 1H 2016 2H 2017 1H 2017 2H 2018 1H 2018 2H 2019 1H 2019 2H 2020 1H 2020 2H
NB Composite Index
Performance vs. Index1

19For the Employees' Retirement System of Rhode Island Use Only
Default Rates – Neuberger Berman CLO Portfolios
Neuberger Berman believes its disciplined investment process led to lower cumulative defaults for US loans than the index
over the last 16 years
Source: Neuberger Berman, S&P/LSTA Leveraged Loan Index as of December 31, 2020; see definitions of indices at the back of this presentation.
The Neuberger Berman US CLO default rate excludes Marquette US/European CLO, P.L.C., which is excluded due to its dual currency nature.
Defaults for Neuberger Berman US CLOs exclude selective default ratings from S&P when the loans held in CLOs continued to meet all payment obligations.
Past performance is not indicative of future results. As with any investment, there is the possibility of profit as well as the risk of loss. Please see Disclosures, Index Definitions and Risk Factors at the end of this presentation.
0.00%
1.58%1.12%
0.00%
3.97%
2.45%
0.13%0.06%
0.33%0.41%
0.00%
1.23%
0.00%
0.62%0.16% 0.07%
1.78%
0.82%1.01%
3.02%
0.48%0.24%
3.75%
9.61%
1.87%
0.17%
1.37%
2.16%
3.24%
1.54% 1.58%2.05%
1.63%1.39%
3.83%
2.29%
0%
2%
4%
6%
8%
10%
12%
2004 2005 2006 2007 2008 2009 2010 2011 2012 2013 2014 2015 2016 2017 2018 2019 2020 Average
Neuberger Berman US CLOs S&P Leveraged Loan Index
Neuberger Berman US CLO Default Rate Versus S&P Leveraged Loan Index

CLO Equity Performance Summary

21For the Employees' Retirement System of Rhode Island Use Only
0.50
0.60
0.70
0.80
0.90
1.00
1.10
1.20
1.30
1.40
1.50
Mar
-17
Sep
-17
Mar
-18
Sep
-18
Mar
-19
Sep
-19
Mar
-20
Sep
-20
Mar
-21
DPI
RVPI
Total Net Drawdowns,
88%
Sidecar/Reduced,
10%
Remaining Commitments,
2%
CLO Equity, 88%
Warehouse, 9%
Vertical Retention,
4%
Risk Retention Vehicle 1 Unaudited Performance Summary
1 Calculated based on distributions since inception for first close investors plus the liquidation of the equity value based on March 31, 2021 unaudited financial statements; investors in subsequent closings have lower cumulative distributions. Not reduced for potential carried interest. No representation is made that an investor will achieve the return shown. Past performance is not indicative of future results..2 Inclusive of drawdowns and cumulative distributions through May 4, 2021. Reporting quarters for distributions cover the approx. three month period through the first week of the second month of such calendar quarter.Source: Neuberger Berman. Performance figures and holdings metrics are unaudited, are subject to change and are provided for illustrative and informational purposes only. Values and figures extracted from the accounting books and records used to compile the Risk Retention Vehicle’s March 31, 2021 unaudited financial statements unless otherwise noted.Past performance is not indicative of future results. Return may not be comparable to actual returns. Investing entails risks, including the loss of principal. Please see the Disclosures and Risk Considerations at the end of this presentation.
Current Committed Capital2 Sources of Fund Income2 Distributions on Net Drawdowns2 Historical Fund Performance (TVPI)
0.0%
1.0%
2.0%
3.0%
4.0%
5.0%
6.0%
7.0%
2Q17 1Q18 4Q18 3Q19 2Q20 1Q21
Capital Summary
Total Commitments $455.3m
Total Net Drawdowns $399.4m2
Sidecar and Pro-rata
Reduced Commitments$45.5m2
Remaining and Returned
Commitments$10.4m2
Investments Summary
Number of CLOs Invested In 17
New Issue CLO Equity 13
Legacy CLO Equity 1
Refinancing (vertical) 3
Key Valuation Metrics
Distributions to paid-in capital 0.45x
Residual value to paid-in capital 0.94x
Total value to paid-in capital 1.39x
Internal Rate of Return 17.5%1
Distributions Summary
Total Income Distributions $198.4m2
Percent of Paid-in Capital 49.5%2
Money-Weighted Annualized 21.2%2
Current Quarter Annualized 23.4%2
NB Majority CLO Equity Vehicle (Q1 2017 – Q1 2020) with CLO Warehouses, Fee Share, & Capital Call Facility

22For the Employees' Retirement System of Rhode Island Use Only
CLO Equity, 65%
Warehouse, 23%
Opportunistic, 13%
Risk Retention Vehicle 2 Unaudited Performance Summary
Current Committed Capital2 Sources of Fund Income2 Distributions on Net Drawdowns2 Historical Fund Performance (TVPI)
Total Net Drawdowns,
27%
Remaining Commitments,
73%
Capital Summary
Total Commitments $455.7m
Total Net Drawdowns $123.1m2
Remaining Commitments $322.7m2
Current Opportunistic $0.0m2
Investments Summary
Number of CLOs Invested In 6
New Issue CLO Equity 5
Legacy CLO Equity 0
Warehouse-stage CLOs 1
Key Valuation Metrics
Distributions to paid-in capital 0.17x
Residual value to paid-in capital 1.08x
Total value to paid-in capital 1.25x
Internal Rate of Return 151.0%1
Distributions Summary
Total Distributions $19.3m2
Percent of Paid-in Capital 15.7%2
Money-Weighted Annualized N/A
Current Quarter Annualized 27.4%2
0.50
0.60
0.70
0.80
0.90
1.00
1.10
1.20
1.30
DPI
RVPI
0.0%
3.0%
6.0%
9.0%
12.0%
15.0%
1Q20 2Q20* 3Q20* 4Q20 1Q20 2Q20
*Drawdown based on subsequent first call amount
NB Majority CLO Equity Vehicle (March 2020 – present) with CLO Warehouses, Fee Share, & Capital Call Facility
1 Calculated based on distributions since inception for first close investors plus the liquidation of the equity value based on March 31, 2021 unaudited financial statements; investors in subsequent closings have lower cumulative distributions. Not reduced for potential carried interest. No representation is made that an investor will achieve the return shown. Past performance is not indicative of future results..2 Inclusive of drawdowns and cumulative distributions through May 4, 2021. Reporting quarters for distributions cover the approx. three month period through the first week of the second month of such calendar quarter.Source: Neuberger Berman. Performance figures and holdings metrics are unaudited, are subject to change and are provided for illustrative and informational purposes only. Values and figures extracted from the accounting books and records used to compile the Risk Retention Vehicle’s March 31, 2021 unaudited financial statements unless otherwise noted.Past performance is not indicative of future results. Return may not be comparable to actual returns. Investing entails risks, including the loss of principal. Please see the Disclosures and Risk Considerations at the end of this presentation.

CLO Debt and Opportunistic Investments and Performance Summary

24For the Employees' Retirement System of Rhode Island Use Only
CLO Debt Investment Process Framework
Differentiated with advanced and rigorous portfolio management process
This material is intended as a broad overview of the portfolio managers' style, philosophy and investment process and is subject to change without notice. Portfolio managers' views may differ from those of other portfolio managers
as well as the views of Neuberger Berman. Please see the Disclosures and Risk Considerations section of this presentation.
Proprietary Analytics and Platform Individual CLO Deep-Dive
• Advanced integrated tools that aggregate underlying credit information
(internal ranking, analyst notes, etc), security level data (price, spread,
liquidity), and manager trading activity (style drift, performance)
• Designed to allow team to efficiently evaluate large volumes of potential
investments for selective deeper analysis
• Seek to quickly/easily exploit opportunities to take advantage of market
dislocations caused by CLO market inefficiencies
• Monitor and track investments and watchlists for trading opportunities
• Loan-level detail mapped to fundamental outlook on credits
• Fundamental assessment of collateral quality, manager style, trading
activity, and potential losses
• Credit selectivity with focus on long-term capital preservation
• Detailed evaluation of deal structure, covenants, and triggers to seek to
uncover value
• Portfolio Management team approves investments with culture of shared
risk and ownership

25For the Employees' Retirement System of Rhode Island Use Only
Source: Aladdin, Blackrock, Intex, and Neuberger Berman as of April 30, 2021. Differences in allocation are due to rounding. Portfolio statistics are based on traded investments.1 Current Yield calculated as current coupon divided by market price2 Credit Spread based on Discount Margin for CLOs.3 Traded securities balances that include unsettled positons, does not reflect negative traded cash balances or future anticipated transactions.4 Periods less than one year are not annualized. Updated as of April 30, 2021.5 Composite Inception August 31, 2015.Fund performance is representative of the USD I Accumulating Class and has been calculated to account for the deduction of fees. Fund performance does not take account of any commission or costs incurred by investors when subscribing for or redeeming shares. These figures refer to the past. Past performance is not a reliable indicator of future results.
Neuberger Berman CLO BB Composite Portfolio and Performance Summary
Portfolio Characteristics
CLO BBB, 2.8%
CLO BB, 92.6%
CLO B, 4.5%
Original Rating Group (% of investments)3 Ratings Stratification (% of investments)
Current Yield Stratification (% of investments)
0.0%
0.6%
2.2%
4.7%
77.9%
10.0%
0.8%
3.8%
BBB
BBB-
BB+
BB
BB-
B+
B
B-
0.0%
2.2%
0.6%
2.2%
0.0%
4.8%
22.2%
24.4%
14.6%
18.3%
10.0%
0.0%
0.7%
<3%
3-3.5
3.5-4
4-4.5
4.5-5
5-5.5
5.5-6
6-6.5
6.5-7
7-7.5
7.5-8
8-8.5
8.5-9
Investment Performance 4
CLO BB Composite
(Gross of Fees)
1 Month 1.20%
2021 YTD 3.64%
1 Year 57.97%
Since Inception 5 8.67%
Summary Statistics
Current Yield (%) 1 6.42
Yield to Worst (%) 7.75
Credit Spread (bps) 2 649
Duration (yrs) 0.25
Modified Duration (yrs) 5.5
Average Rating BB-
Number of Bonds 82
Number of Issuers 80
Market Value ($ USD mn) 210

26For the Employees' Retirement System of Rhode Island Use Only
Neuberger Berman CLO Mezzanine Debt Composite Performance Summary
Source: Neuberger Berman, JP Morgan Securities as of March 31, 2021. Please see attached additional GIPS notes and disclosures, which are required as part of this presentation. This information is supplemental to the attached GIPS notes and disclosure.The index is the JPM Collateralized Loan Obligation Index (the “Index”), which is divided into sub-indexes based on rating classes and time period of origination, or vintage (which can be measured as pre- or post-crisis or based on the year of origination). The Benchmark is the Post-Crisis BB Index. The Benchmark (Vintage Adjusted) and Benchmark (Vintage and Rating Adjusted) are custom indexes calculated by Neuberger Berman by measuring the vintages and ratings of the positions in the Composite on a monthly basis, and aggregating the performance of the corresponding sub-indexes of the Index for such month. The Benchmark (Vintage Adjusted) and Benchmark (Vintage and Rating Adjusted) are recalculated each month to generate that month’s performance. The manager believes that the Benchmark (Vintage Adjusted) and Benchmark (Vintage and Rating Adjusted) better reflect the universe in which the Composite is invested because (i) the Benchmark includes vintages and ratings not included in the Composite, and (ii) the Composite includes ratings not included in the Benchmark. The use of a custom benchmark can have many inherent limitations. For example, it does not represent the performance of any single index or sub-index. Other vintages and/or ratings may have different results, including losses. Each custom benchmark was created with the benefit of hindsight after the performance of the Composite is known, which could cause the custom benchmark to have a bias that favors the Composite performance. In addition, the monthly rebalancing of these benchmarks may make it difficult or impossible to evaluate the performance of the Composite and/or a benchmark over time. Neuberger Berman does not make any representation as to the reasonableness of the assumptions or that all the assumptions used in calculating the benchmarks have been stated or fully considered. Changes in the assumptions may have a material impact on the returns presented.This presentation is made available for illustrative purposes only. Past performance is not indicative of future results. As with any investment, there is the possibility of profit as well as the risk of loss. Please see the Disclosures and Risk Considerations section of this presentation, which are an important part of this presentation.
Outperforming custom vintage-weighted benchmark with lower downside volatility in 2016 and 2020 credit selloffs
Strategy Cumulative Total Return (base=100, gross of fees) Half-Year Returns (gross of fees)
70
80
90
100
110
120
130
140
150
160
170Benchmark (Vintage Adjusted)
Benchmark (Vintage and Rating Adjusted)
Composite
-10%
-5%
0%
5%
10%
15%
20%
25%Benchmark (Vintage Adjusted)
Benchmark (Vintage and Rating Adjusted)
Composite
Annualized
Total Return
8.07%8.29%
8.57%

27For the Employees' Retirement System of Rhode Island Use Only
Neuberger Berman CLO Opportunistic Account Summary
Dedicated Opportunistic CLO Account deployed capital in April and May 2020 at fundamentally cheap levels, harvested in
June and July as prices reached non-distressed levels
Called and Returned Capital, $40.1
Uncalled Commitments To
Date, $40.0
Capital Allocation
Committed Capital $80.1m
Called/Returned Capital $40.1m
Since Inception Invested
Capital
$34.2m
Performance Metrics (gross returns)1
0.00x Residual Value to Paid-In (RVPI)
1.26x Distribution to Paid-In (DPI)
1.26x Total Value to Paid-In (TVPI)
234% Internal Rate of Return (IRR)
Selected Portfolio Metrics
Key Dates
Investment Period Start March 24, 2020
Investment Period End March 24, 2022
1. Inclusive of cumulative distributions through July 23, 2020. .IRR is calculated based on distributions since inception for first close investors plus the NAV of current investments based on March 31, 2020 unaudited financial statements; investors in subsequent closings have lower cumulative distributions. Not reduced for potential carried interest. Source: Neuberger Berman. Performance figures and holdings metrics are unaudited, are subject to change and are provided for illustrative and informational purposes only. Values and figures extracted from the accounting books and records used to compile the CLO Opportunistic Account’s March 31, 2021 unaudited financial statements unless otherwise noted. Past performance is not indicative of future results. Return may not be comparable to actual returns. Investing entails risks, including the loss of principal. Please see the Disclosures and Risk Considerations at the end of this presentation.
Cumulative Number of
Investments 17
New Investments in 2Q 15
Investments Harvested in
2Q10
Investments Harvested
after 2Q7
Investments other than
CLO Mezzanine Debt0%
Average Purchase Price of
Investments68.60
Average Sale Price of
Investments1
89.33
Average DM at Cost 1,284
Yield to Maturity at Cost 13.50%
Yield to Maturity at Sale1 8.66%

Disclosures And Risk Considerations

29For the Employees' Retirement System of Rhode Island Use Only
Collateralized Loan Obligation Composite (Inception 7/1/2004)
Investment Performance Results – As of December 31, 2020
Past performance is no guarantee of future results.
Please see attached important disclosures which contain complete performance information and definitions.
Composite Benchmark Composite 3 Year Standard Deviation
Total Return
(%, Gross
of Fees)
Total Return
(%, Net
of Fees)
S&P/LS & TALL
Index (%)
No. of
Accounts
Market Value
($, m)
Total Firm
Assets
($, bn)
% of Firm
Assets
Internal
Dispersion
Composite
(%)
S&P/LS & TALL
Index
(%)
2020 3.60 3.04 3.12 24 11,295.2 -- -- 0.20 8.94 8.67
2019 9.73 9.13 8.64 19 9,032.1 355.8 2.54 0.11 3.12 2.77
2018 -0.05 -0.60 0.44 16 7,538.0 304.1 2.48 0.65 3.10 2.86
2017 3.70 3.14 4.12 13 6,011.7 295.2 2.04 0.20 2.81 2.69
2016 9.81 9.20 10.16 12 5,211.9 255.2 2.04 0.46 2.89 2.89
2015 1.05 0.49 -0.69 9 3,851.6 240.4 1.60 0.33 1.92 2.11
2014 1.54 0.98 1.60 7 3,033.1 250.0 1.21 -- 1.92 2.10
2013 4.77 4.19 5.29 ≤ 5 1,599.3 241.7 0.66 -- 3.52 3.77
2012 8.47 7.88 9.66 ≤ 5 1,377.8 205.0 0.67 -- 4.08 4.42
2011 2.02 1.56 1.52 7 2,362.2 193.1 1.22 0.31 8.11 8.43

30For the Employees' Retirement System of Rhode Island Use Only
CLO BB (Inception 9/1/2015)
Investment Performance Results – As of March 31, 2021
Past performance is no guarantee of future results.
Please see attached important disclosures which contain complete performance information and definitions.
Composite Benchmark Composite 3 Year Standard Deviation
Total Return
(%, Gross
of Fees)
Total Return
(%, Net
of Fees)
JPM
Collateralized
Loan Obligation
Index BB
("CLOIE") (%)
No. of
Accounts
Market Value
($, m)
Total Firm
Assets
($, bn)
% of Firm
Assets
Internal
Dispersion
Composite
(%)
JPM Collateralized
Loan Obligation
Index BB
("CLOIE")
(%)
YTD Mar-
20212.41 2.25 2.98 ≤ 5 294.9 -- -- -- 25.58 25.35
2020 8.98 8.28 8.05 ≤ 5 247.9 405.4 0.06 -- 25.58 25.32
2019 14.79 14.05 10.86 ≤ 5 258.1 355.8 0.07 -- 7.08 5.60
2018 -3.08 -3.70 0.37 6 251.4 304.1 0.08 -- 11.11 12.45
2017 14.29 13.55 17.52 ≤ 5 54.3 295.2 0.02 -- -- --
2016 18.96 18.19 21.86 ≤ 5 35.4 255.2 0.01 -- -- --
4 Months
2015-6.25 -6.45 -9.85 ≤ 5 62.7 240.4 0.03 -- -- --

31For the Employees' Retirement System of Rhode Island Use Only
Collateralized Loan Obligation Composite
Investment Performance Disclosure Statement
Compliance Statement
• Neuberger Berman Group LLC ("NB", "Neuberger Berman" or the "Firm") claims compliance with the Global Investment Performance Standards (GIPS®) and has prepared and presented this report in compliance with theGIPS® standards. Neuberger Berman has been independently verified for the period January 1, 2011 to December 31, 2019. A firm that claims compliance with the GIPS standards must establish policies and procedure forcomplying with all the applicable requirements of the GIPS standards. Verification provides assurance on whether the firm's policies and procedures related to composite and pooled fund maintenance, as well as the calculation,presentation, and distribution of performance, have been designed in compliance with the GIPS standards and have been implemented on a firm-wide basis. Verification does not ensure the accuracy of any specific compositepresentation. The verification reports are available upon request.
• The GIPS® firm definition was redefined effective January 1, 2011. For prior periods there were two separate firms for GIPS® firm definition purposes and such firms were independently verified for the periods January 1, 1997to December 31, 2010 and January 1, 1996 to December 31, 2010, respectively.
Definition of the Firm
• The firm is currently defined for GIPS® purposes as Neuberger Berman Group LLC, ("NB", "Neuberger Berman" or the "Firm"), and includes the following subsidiaries and affiliates: Neuberger Berman Investment Advisers LLC,Neuberger Berman Europe Ltd., Neuberger Berman Asia Ltd., Neuberger Berman East Asia Ltd., Neuberger Berman Singapore Pte. Ltd., Neuberger Berman Taiwan Ltd, Neuberger Berman Australia Pty. Ltd., NeubergerBerman Trust Company N.A., Neuberger Berman Trust Company of Delaware N.A., NB Alternatives Advisers LLC Neuberger Berman Breton Hill ULC, Neuberger Berman Loan Advisers LLC and Neuberger Berman LoanAdvisers II LLC.
Policies
• Policies for valuing portfolios, calculating performance, and preparing compliant presentations are available upon request.
Composite Description
• The Collateralized Loan Obligation Composite (the "Composite") includes the performance of all Collateralized Loan Obligation portfolios, with no minimum investment, managed on a fully discretionary basis by the Non Investment Grade Fixed Income team. A Collateralized Loan Obligation ("CLO") will be excluded from the strategy in any period in which such CLO is in its reinvestment period and its assets under management ("AUM") are at least 25% less than the AUM at its initial funding. The Composite creation date is September 2007, and performance inception date is July 2004. The returns presented are based on asset and cash activity within the CLOs and do not include leverage. A complete list of Neuberger Berman's composites is available upon request.
Primary Benchmark Description
• The benchmark is the Standard & Poor's / Loan Syndications & Trading Association Leveraged Loan Index (the "Index"). The Index measures the performance of the U.S. leveraged loan market based upon real-time market weightings, spreads and interest payments. Loan Syndications and Trading Association (LSTA)/Loan Pricing Corporation (LPC) mark-to-market pricing is used to price each loan in the index. The benchmark is calculated on a total return basis.
Reporting Currency
• Valuations are computed and performance is reported in U.S. Dollars. Performance includes reinvestment of dividends and other earnings.
Fees
• Composite Gross of Fee returns are the return on investments reduced by any trading expenses incurred during the period. Composite Net of Fee returns are the Gross of Fee returns reduced by investment advisory fees.
• Presented risk measures are calculated using gross-of-fee composite returns.
Fee Schedule
• The annual investment advisory fee, generally payable quarterly, is as follows: 0.55% on the first $50mn; 0.45% on the next $250mn; 0.35% thereafter.
Internal Dispersion
• Internal dispersion is calculated using the asset-weighted standard deviation of annual gross returns of those portfolios that were in the Composite for the entire year. Internal dispersion is not calculated if the Composite does not contain at least 6 portfolios for the entire year.
Annualized Standard Deviation
• The three-year annualized standard deviation measures the variability of the Composite and the benchmark returns over the preceding 36-month period. The standard deviation is not required for periods prior to 2011.
Availability and Trademark Disclosures
• The firm's list of composite descriptions, limited distribution pooled fund descriptions, and broad distribution pooled fund descriptions are available upon request.
• GIPS® is a registered trademark of CFA Institute. CFA Institute does not endorse or promote this organization, nor does it warrant the accuracy or quality of the content contained herein.

32For the Employees' Retirement System of Rhode Island Use Only
CLO BB Composite
Investment Performance Disclosure Statement
Compliance Statement
• Neuberger Berman Group LLC ("NB", "Neuberger Berman" or the "Firm") claims compliance with the Global Investment Performance Standards (GIPS®) and has prepared and presented this report in compliance with theGIPS® standards. Neuberger Berman has been independently verified for the period January 1, 2011 to December 31, 2019. A firm that claims compliance with the GIPS standards must establish policies and procedure forcomplying with all the applicable requirements of the GIPS standards. Verification provides assurance on whether the firm's policies and procedures related to composite and pooled fund maintenance, as well as the calculation,presentation, and distribution of performance, have been designed in compliance with the GIPS standards and have been implemented on a firm-wide basis. Verification does not ensure the accuracy of any specific compositepresentation. The verification reports are available upon request.
• The GIPS® firm definition was redefined effective January 1, 2011. For prior periods there were two separate firms for GIPS® firm definition purposes and such firms were independently verified for the periods January 1, 1997to December 31, 2010 and January 1, 1996 to December 31, 2010, respectively. The Firm definition was most recently changed in 2020 to include the addition of Neuberger Berman Loan Advisers LLC and Neuberger BermanLoan Advisers II LLC.
Definition of the Firm
• The firm is currently defined for GIPS® purposes as Neuberger Berman Group LLC, ("NB", "Neuberger Berman" or the "Firm"), and includes the following subsidiaries and affiliates: Neuberger Berman Investment Advisers LLC,Neuberger Berman Europe Ltd., Neuberger Berman Asia Ltd., Neuberger Berman East Asia Ltd., Neuberger Berman Singapore Pte. Ltd., Neuberger Berman Taiwan Ltd, Neuberger Berman Australia Pty. Ltd., NeubergerBerman Trust Company N.A., Neuberger Berman Trust Company of Delaware N.A., NB Alternatives Advisers LLC, Neuberger Berman Breton Hill ULC, Neuberger Berman Loan Advisers LLC and Neuberger Berman LoanAdvisers II LLC.
Policies
• Policies for valuing portfolios, calculating performance, and preparing compliant presentations are available upon request.
Composite Description
• The CLO BB Composite (the "Composite") includes the performance of all CLO BB portfolios managed on a fully discretionary basis by the Non Investment Grade Fixed Income team. The CLO BB strategy is designed for investors who seek to achieve total returns from a portfolio that invests in CLO BB rated debt but may opportunistically allocate to AAA, AA, A, and BBB ratings. The principal objectives are high current income, lower volatility and capital preservation achieved through the avoidance of credit deterioration in the underlying portfolios, manager selection, and focus on structural protections. The Composite creation date is June 2019 and performance inception date is September 2015. A complete list of Neuberger Berman's composites is available upon request.
Primary Benchmark Description
• The benchmark is the JPM Collateralized Loan Obligation Index BB ("CLOIE") (the "Index"). The Index is reflects the market for broadly-syndicated, arbitrage CLOs denominated in US dollars. CLOIE is divided by time period of origination (pre versus post crisis) and is broken out further into five original rating classes (AAA, AA, A, BBB, BB). The index is rebalanced monthly with daily reported index values.
Reporting Currency
• Valuations are computed and performance is reported in U.S. Dollars. Performance includes reinvestment of dividends and other earnings.
Fees
• Composite Gross of Fee returns are the return on investments reduced by any trading expenses incurred during the period. Composite Net of Fee returns are the Gross of Fee returns reduced by investment advisory fees.
• Presented risk measures are calculated using gross-of-fee composite returns.
Fee Schedule
• The annual investment advisory fee, generally payable quarterly, is as follows: 0.70% on the first $50mm; 0.65% on the next $250mm; 0.50% thereafter.
Internal Dispersion
• Internal dispersion is calculated using the asset-weighted standard deviation of annual gross returns of those portfolios that were in the Composite for the entire year. Internal dispersion is not calculated if the Composite does not contain at least 6 portfolios for the entire year.
Annualized Standard Deviation
• The three-year annualized standard deviation measures the variability of the Composite and the benchmark returns over the preceding 36-month period. The standard deviation is not required for periods prior to 2011.
Availability and Trademark Disclosures
• The firm's list of composite descriptions, limited distribution pooled fund descriptions, and broad distribution pooled fund descriptions are available upon request.
• GIPS® is a registered trademark of CFA Institute. CFA Institute does not endorse or promote this organization, nor does it warrant the accuracy or quality of the content contained herein.

33For the Employees' Retirement System of Rhode Island Use Only
Risk Considerations
Risks of Investing in CLOs
An investment in notes in a CLO involves risks. The following list of risk factors is a preliminary summary only and is qualified in its entirety by the more detailed description of the risk factors described in the final offering circular
relating to a particular CLO (“Offering Circular”).
The Issuer. The issuer of a CLO will generally be a newly formed entity. As a newly formed entity, the issuer will have no prior operating history. The issuer will have no significant assets other than the collateral (portfolio
investments and other assets of the issuer).
The Collateral. The collateral may primarily consist of non-investment grade senior secured loans, which have greater credit and liquidity risk than more highly-rated securities. The collateral may include debt obligations which may
be unsecured, or may have been issued in connection with highly leveraged transactions or may be subordinated to certain other obligations of the underlying obligors. The lower rating of these obligations reflects a greater
possibility that adverse changes in the financial condition of an obligor or in general economic conditions or both may impair the ability of such obligor to make payments of principal and interest.
Credit Ratings. Any credit ratings of certain of the notes, or the loans and other assets that may comprise the collateral, represent the rating agencies’ opinions regarding their credit quality and are not a guarantee of future credit
performance of such securities. Rating agencies attempt to evaluate the safety of principal and interest payments and do not evaluate the risks of fluctuations in market value. Therefore, the ratings assigned to securities by rating
agencies may not fully reflect the true risks of an investment. Also, the rating agencies may not make timely changes in credit ratings in response to subsequent events so that an issuer’s current financial condition may be better or
worse than a rating indicates. Ratings may be subject to revision or withdrawal by a rating agency at any time including to the extent the issuer doesn’t comply with its obligation under Rule 17g-5 of the Securities Exchange Act of
1934 as amended (the "Exchange Act"). Rating reductions or withdrawals may occur for any number of reasons and may affect numerous assets at a single time or within a short period of time, which in turn may have a material
adverse effect upon the notes.
Leveraged Capital Structure. A CLO will generally be substantially leveraged. Use of leverage is a speculative investment technique and involves certain risks to investors in the notes. The leverage provided to the issuer by the
issuance of the notes will result in interest expense and other costs incurred in connection with such borrowings that may not be covered by the net interest income, dividends or other proceeds of the collateral or any appreciation
thereof. The use of leverage generally magnifies the issuer’s opportunity for gain and risk of loss.
Payments in Respect of the Subordinated Notes. The issuer will generally pledge substantially all of its assets to secure the secured notes and certain other obligations pursuant to an indenture. The proceeds of such assets will
only be available to make payments in respect of the subordinated notes as and when such proceeds are released from the lien of such indenture in accordance with the priority of payments that will be set forth therein. There can
be no assurance that, after payment of principal and interest on the secured notes and other fees and expenses in accordance with such priority of payments, the issuer will have funds remaining to make distributions in respect of
the subordinated notes.
Volatility in Market. In recent years, securities issued in securitization transactions have experienced significant fluctuations in market value and accordingly high price volatility relative to historical experience. There is no
assurance that such volatility will not continue or (to the extent it has eased) return.
Regulatory Risk. Changes in the legislative and regulatory environment may affect the ability of issuers to make payments on the notes. In particular, the Dodd-Frank Wall Street Reform and Consumer Protection Act (the "Dodd-
Frank Act"), which was signed into law on July 21, 2010, includes provisions that are expected to have a broad impact on credit and other financial markets. Such changes, together with uncertainty about the nature and timing of
regulations that will be promulgated to implement such changes, may create uncertainty in the credit and other financial markets and create other unknown risks.
Default Rates on Collateral. While a number of articles and research reports have been written on historical default rates, there is no central source for relevant data or a standardized method for measuring default rates, and such
general corporate default studies cannot accurately reflect the performance of corporate debt obligations which satisfy the criteria described herein with respect to the collateral. Furthermore, the historical performance of corporate
debt markets is not necessarily indicative of its future performance. Should increases in default rates occur with respect to the type of collateral comprising the collateral for the transaction, the actual default rates of the collateral
may exceed any hypothetical default rates set forth herein.
34For the Employees' Retirement System of Rhode Island Use Only
Risk Considerations
Risks of Investing in CLOs – continued
General Market Risk with Respect to Collateral Performance. Negative economic trends nationally as well as in specific geographic areas of the United States continue to be indicators of potential loan defaults and
delinquencies. The levels of defaults and delinquencies have been increasing and/or volatile, and there is a material possibility that economic activity will continue to be volatile or to slow. Some obligors may have been significantly
and negatively impacted by such negative economic trends. A continuing decreased ability of obligors to obtain refinancing (particularly as high levels of required refinancings approach) may result in a further economic decline that
could delay an economic recovery and cause a further deterioration in loan performance generally. There is no way to determine whether such trends in the credit markets will improve or worsen in the future.
Illiquidity in the CLO, Leveraged Finance and Fixed Income Markets may Affect the Holders of Notes. A severe liquidity crisis in the global credit markets has resulted in substantial fluctuations in prices for leveraged loans
and high-yield debt securities and limited liquidity for such instruments. No assurance can be made that the conditions giving rise to such price fluctuations and limited liquidity will not continue or become more acute. During periods
of limited liquidity and higher price volatility, an issuer's ability to acquire or dispose of collateral at a price and time that the issuer deems advantageous may be severely impaired. Regardless of current or future market conditions,
certain items of collateral purchased by an issuer will have only a limited trading market (or none). Illiquid debt obligations may trade at a discount from comparable, more liquid investments.
No Information on the Obligors. Investors generally have limited rights to obtain from the collateral manager information regarding the obligors on the collateral. The collateral manager may from time to time receive material non-
public information or other notices with respect to assets comprising the collateral or the obligors thereon which they will not be required to disclose to investors. The collateral manager has no obligation to keep investors informed
as to matters arising in relation to any obligors on the collateral.
No Market for Notes. Transfer Restrictions. Generally no market will exist for CLO notes. If a secondary market does develop, there can be no assurance that it will provide holders of notes with liquidity on investment or that it will
continue for the life of notes. In addition, CLO notes not registered under the United States Securities Act of 1933, as amended, or under any United States state securities or “Blue Sky” laws or the securities laws of any other
jurisdiction, nor is the issuer registered under the United States Investment Company Act of 1940, as amended. The CLO notes are issued and sold in reliance upon exemptions from registration provided by such laws. As such,
CLO notes are subject to certain transfer restrictions. Consequently, an investor in CLO notes must be prepared to hold such notes for an indefinite period of time or until their stated maturity.
Final Maturity, Average Life and Prepayment Considerations. The average lives of notes are expected to be shorter than the number of years until the final stated maturity date, and their average lives may vary due to various
factors affecting the early retirement of the collateral, the timing and amount of sales of collateral and the ability of the collateral manager to invest in additional collateral. Retirement of the collateral prior to final maturity will depend,
among other things, on the financial condition of the obligors on the underlying collateral and the respective characteristics of such collateral, including the existence and frequency of exercise of any optional redemption, mandatory
redemption or sinking fund features, the prevailing level of interest rates, the redemption prices, the actual default rates and the actual amount collected on any defaulted collateral and the frequency of tender or exchange offers for
such collateral. In particular, loans are generally prepayable at par, and a high proportion of loans could be prepaid. The ability of the issuer to reinvest proceeds in securities with comparable interest rates that satisfy the
reinvestment criteria specified herein may affect the timing and amount of payments received by the holders of notes and the yield to maturity of notes.
Limited Recourse Obligations. CLO notes will be limited recourse obligations of the issuer and secured notes will be non-recourse obligations of the co-issuer. Distributions of interest on and principal of notes will be payable
solely from the collateral pledged to secure the secured notes. The issuer, as a special purpose entity, will have no significant assets other than the collateral. The issuer will not be obligated to make any payments on notes from a
source other than such pledged collateral. No person other than the co-issuers will be obligated to make payments on the notes. Consequently, holders of the notes must rely solely upon distributions on the collateral for the
payment of amounts payable in respect of the notes. If distributions on such collateral are insufficient to make payments on the notes, no other assets of the issuer or any other person or entity will be available for the payment of the
deficiency.
Subordination; Control by Controlling Class. Payments of principal of, or interest on and other distributions in respect of, CLO notes will be subject to the priority of payments set forth in an indenture. Pursuant to such indenture,
the senior most class of notes then outstanding in the capital structure (the “Controlling Class”) will be entitled to exercise certain rights which are superior and may be detrimental to the holders of any class of notes which is
subordinated to the Controlling Class.

35For the Employees' Retirement System of Rhode Island Use Only
Risk Considerations
Risks of Investing in CLOs – continued
Adverse Effect of Determination of U.S. Business. The United States federal income tax treatment of the issuer is not entirely free from doubt and if it were determined that the issuer was engaged in a United States trade or
business and had taxable income that is effectively connected with such United States trade or business, then the issuer would be subject under the United States Revenue Code of 1986 to the regular corporate income tax on such
effectively connected taxable income and possibly to 30% branch profits tax as well.
Other Tax Considerations. CLO issuers may be passive foreign investment companies ("PFIC"). A U.S. person holding subordinated notes will be treated as a shareholder rather than a noteholder of the PFIC and may be subject
to additional taxes unless it elects to treat the issuer as a qualified electing fund ("QEF") and to recognize currently its proportionate share of the issuer's income. Although a QEF election avoids the imposition of these additional
taxes, it can have its own adverse tax consequences. Prospective purchasers of the subordinated notes considering a QEF election should be aware that it is possible that a significant amount of the issuer's income, as determined
for U.S. federal income tax purposes, will not be distributed on a current basis to the holders of the subordinated notes. Consequently, U.S. Holders of subordinated notes making a QEF election may owe income tax on a significant
amount of such "phantom", or undistributed, income. The tax consequences of the ownership and disposition of subordinated notes can be quite complex and U.S. holders of subordinated notes should consult their own tax advisors
in this regard.
Projections. Cash-flow projections are based on assumptions that are unlikely to be consistent with, and may differ materially from, actual events. Actual events will vary from projections and the variations may be material. Some
important factors that could cause actual results to differ materially from projections include the actual composition of the portfolio, and defaults in respect of the portfolio, the timing of any defaults and recoveries, changes in interest
rates, loan prepayments, price of assets, spread on assets, liquidity of loans, the ability of the issuer to reinvest in new assets or remain fully invested, and any weakening of the specific investments included in the portfolio, among
others.
Collateral Manager: Performance. The collateral manager’s performance history in other transactions may not be indicative of future results including any results it may achieve in this transaction. The nature and risks associated
with the issuer’s future investments may differ materially from those investments and strategies historically undertaken by the collateral manager. There can be no assurance that the collateral manager or the persons associated
with it or any other entity or person will realize returns comparable to those achieved in the past or generally available in the market. Because the composition of the collateral will vary over time, the performance of the notes
depends heavily on the skills of the collateral manager in analyzing, selecting and managing the collateral. As a result, the issuer will be highly dependent on the analytical and managerial experience of the collateral manager and
certain of its officers and employees to whom the task of managing the collateral has been assigned.
Collateral Manager: Conflict of Interests. Various potential and actual conflicts of interest may arise from the overall investment activity of the collateral manager and its affiliates and the payment of management fees to the
collateral manager.
Recent Developments with Respect to LIBOR. Recent information has called into question the integrity of the process for determining LIBOR, and the full implications of such information is unknown at this time. An inaccurate
LIBOR setting could have adverse effects on a CLO issuer and/or the holders of secured notes. For example, holders of secured notes would receive lower dollar amounts as interest payments if LIBOR was artificially lower than a
properly functioning market would otherwise set LIBOR. Additionally, On July 27, 2017, the head of the UK Financial Conduct Authority made remarks indicating that LIBOR in its current form will be phased out as a benchmark rate
by the end of 2021. Actions by regulatory authorities or financial institutions to phase out, modify or eliminate LIBOR in the future may have a material adverse effect on the holders of notes, including the liquidity of such notes.
In addition, recent events have indicated that the UK’s Financial Conduct Authority intends to cease sustaining LIBOR from the end of 2021, and for the development of alternative benchmark rates. It is possible that the LIBOR
administrator and the panel banks could continue to produce LIBOR on the current basis after 2021, if they are willing and able to do so. However, the survival of LIBOR in its current form, or at all, is not guaranteed until or after
2021 and, if LIBOR in its current form does not survive, it could cause a disruption in the credit markets generally, which could negatively impact the market value and/or transferability of CLO securities and/or underlying senior
floating rate loans.

36For the Employees' Retirement System of Rhode Island Use Only
Risk Considerations
Risks of Investing in Senior Floating Rate Loans
Investing in Senior Floating Rate Loans entails certain unique risks, including but not limited to the following:
Interest Rate Risk. The value of the investments may decline when interest rates rise. In general, the longer the maturity of a security, the greater the effect a change in interest rates could have on the security’s price. In addition, a
security’s sensitivity to interest rate risk will increase with any increase in its duration. Floating rate securities can be less sensitive to interest rate changes.
Prepayment Risk. Performance could be affected if unexpected interest rate trends or an excess of cash flow cause borrowers to pay back principal on debt securities, shortening their duration. Floating rate securities can be less
sensitive to prepayment risk.
Credit Risk. A downgrade or default affecting any of the investments could affect performance.
Lower-Rated Debt Securities Risk. Lower-rated debt securities involve greater risks than investment grade debt securities. Lower-rated debt securities may fluctuate more widely in price and yield than investment grade debt
securities and may fall in price during times when the economy is weak or is expected to become weak. Lower-rated debt securities carry a greater risk that the issuer of such securities will default in the timely payment of principal
and interest. Issuers of securities that are in default may fail to resume principal or interest payments.
Loan Interests Risk. Loans generally are subject to restrictions on transfer, and the loans may be unable to be sold at a time when it may otherwise be desirable to do so or the loans may be able to be sold only at prices that are
less than their fair market value. It may be difficult to establish a fair value for loans held. There is a risk that the value of the collateral securing a loan may decline and that the collateral may not be sufficient to cover the amount
owed to the investor. In the event the borrower defaults, access to the collateral may be limited or delayed by bankruptcy or other insolvency laws. Further, in the event of a default, second lien secured loans will generally be paid
only if the value of the collateral is sufficient to satisfy the borrower’s obligations to the first lien secured lenders and , even then, the remaining collateral may not be sufficient to cover the amount owed to the investor. If a
participation interest in a loan is acquired, the investor may not be able to control the exercise of any remedies that the lender would have under the loan and likely would not have any rights against the borrower directly. Loans
made to finance highly leveraged corporate acquisitions may be especially vulnerable to adverse changes in economic or market conditions.
Distressed Securities Risk. In certain periods, there may be little or no liquidity in the markets for distressed securities or instruments. The prices of such securities may be subject to periods of abrupt and erratic market
movements and above average price volatility and it may be more difficult to value such securities. The investor may lose a substantial portion or all of its investment in distressed securities or it may be required to accept cash or
securities with a value less than the original investment.
Collateralized Loan Obligations (“CLOs”). CLOs issue classes or “tranches” that vary in risk and yield, and may experience substantial losses due to actual defaults, decrease of market value due to collateral defaults and
disappearance of subordinate tranches, market anticipation of defaults and investor aversion to CLO securities as a class. The risks of investing in CLOs depend largely on the type of the underlying loans and the tranche of the
CLO in which invested. In addition, CLOs carry risks including, but not limited to, interest rate risk, credit risk and default risk.
Foreign Market Risk. Foreign securities involve risks in addition to those associated with comparable U.S. securities. Additional risks include exposure to less developed or less efficient trading markets; social, political or economic
instability; fluctuations in foreign currencies; nationalization or expropriation of assets; settlement, custodial or other operational risks; and less stringent auditing and legal standards. As a result, foreign securities can fluctuate more
widely in price and may also be less liquid than comparable U.S. securities. World markets may all react in similar fashion to important economic or political developments. In addition, foreign markets can perform differently than the
U.S. market.
Illiquid Securities Risk. Illiquid securities may be more difficult to purchase or sell at an advantageous price or time, and there is a greater risk that the securities may not be sold for the price at which they are being carried.
Recent Market Conditions. Recent events in the U.S. and global economies have resulted, and may continue to result, in fixed income instruments experiencing unusual liquidity issues, increased price volatility and, in some
cases, credit downgrades and increased likelihood of default. Because the situation is unprecedented and widespread, it may be unusually difficult to identify both risks and opportunities using past models of the interplay of market
forces, or to predict the duration of these market events. The severity or duration of these conditions may also be affected by policy changes made by governments or quasi-governmental organizations.
37For the Employees' Retirement System of Rhode Island Use Only
Disclosures
This presentation contains confidential and proprietary information and is being furnished on a confidential basis to a sophisticated investor on a “one-on-one” basis for informational and discussion purposes only. This presentation
is intended solely for the person to whom it was originally delivered. None of the presentation, nor any content, may be altered in any way, transmitted to, copied, reproduced or distributed in any format in whole or in part to any
other party without prior express written consent of Neuberger Berman or an affiliate. By accepting this presentation, the recipient agrees that it will, and will cause its representatives and advisors to, use the information solely for
the purposes contemplated herein and for no other purpose.
This material is intended as a broad overview of the portfolio managers' current style, philosophy and process. Nothing in this presentation constitutes investment, legal, accounting, tax or other advice, or a representation that any
investment or strategy is suitable or appropriate to any investor’s individual circumstances or otherwise constitutes a recommendation to any investor. This presentation has been prepared solely for informational purposes and does
not constitute an offer to sell or a solicitation of an offer to buy or sell any security, instrument or interest (including an interest in any CLO vehicle managed or sponsored by Neuberger Berman). A private offering of interests in any
such CLO vehicle will be made only pursuant to an offering circular (together with any supplements, the “Offering Circular”) and subscription documents, which will be furnished to qualified investors on a confidential basis at their
request for their consideration in connection with an offering. The Offering Circular will contain information about the investment objective, terms and conditions of an investment in a CLO vehicle and will also contain tax information
and risk disclosures that are important to an investment decision. Any decision to invest should be made after a careful review, the conduct of such investigations as an investor deems necessary or appropriate and after
consultation with legal, accounting, tax and other advisors in order to make an independent determination of the suitability and consequences of an investment. Certain products and services may not be available in all jurisdictions
or to all client types. Unless otherwise indicated, returns shown reflect reinvestment of dividends and distributions.
Neuberger Berman Loan Advisers II LLC ("NBLA II") is the registered investment adviser that provides the investment management services for all new CLO mandates, beginning June 1, 2020. Neuberger Berman Investment
Advisers LLC ("NBIA") and Neuberger Berman Loan Advisers LLC ("NBLA I") are the registered investment advisers that provide the collateral management services for all existing CLO mandates
Past performance is not necessarily indicative of future results and there can be no assurance that targeted returns will be achieved, that an investor will achieve results comparable to or that the returns generated
will equal or exceed those of other investment activities of NBLA or that NBLA will able to implement an investment strategy or achieve the investment objectives described herein. None of NBLA or its affiliates
makes any representation or warranty, express or implied, regarding future performance.
All information as of the date indicated, except as otherwise noted. Firm data, including employee and assets under management figures, reflect collective data for the various affiliated investment advisers that are subsidiaries of
Neuberger Berman Group LLC (the “firm”), including, but not limited to, Neuberger Berman BD LLC, Neuberger Berman Investment Advisers LLC, NB Alternative Investment Management LLC, NB Alternatives Advisers LLC,
Neuberger Berman Europe Ltd., Neuberger Berman Asia Ltd., Neuberger Berman East Asia Ltd., Neuberger Berman Singapore Pte. Ltd., Neuberger Berman Taiwan Ltd., Neuberger Berman Australia Pty. Ltd., Neuberger Berman
Trust Company N.A., and Neuberger Berman Trust Company of Delaware N.A. Firm history/timeline information dates back to the 1939 founding of Neuberger & Berman (the predecessor to Neuberger Berman BD LLC), and
highlights key business expansions, including those that resulted from acquisitions of the various affiliated investment advisers that now comprise the firm. Investment professionals referenced include: Equity portfolio managers,
research analysts/associates, traders, and product specialists; Fixed Income portfolio managers, research analysts/associates, traders, and investment support (product specialists, portfolio analysts, and trading support);
Alternatives investment professionals who are involved in the decisions concerning asset allocation, investment monitoring and making new investments (includes two consultants). Average years experience does not include Equity
product specialists or Fixed Income investment support.
Any investment (including an investment in a CLO) is speculative, not suitable for all investors and is intended for experienced and sophisticated investors who are willing to bear the high economic risk of the investment, which risks
may include: loss of all or a substantial portion of the investment in the securities due to leveraging or other speculative investment practices; impairment of credit quality and defaults on collateral; restrictions on sale of underlying
collateral; negative economic trends could adversely affect collateral obligation performance; actions of rating agencies can adversely affect the market value and liquidity of collateralized loan obligation equity; lack of liquidity, in
that there may be no secondary market for the securities and none is expected to develop; volatility of returns; restrictions on transferring interests in the securities; absence of information regarding valuations and pricing; delays in
tax reporting; less regulation and higher fees. Investing entails risks, including possible loss of principal. Investment strategies may not achieve the desired results due to implementation lag, other timing factors, portfolio
management decision making, economic or market conditions or other factors.

38For the Employees' Retirement System of Rhode Island Use Only
Disclosures (Continued)
Credit quality generally reflects the average credit quality of three Nationally Recognized Statistical Ratings Organizations (NRSROs), S&P, Moody’s and Fitch, as calculated internally by the investment adviser. Holdings that are
unrated by any NRSRO may be assigned an equivalent rating by the investment manager. If NRSRO ratings differ for a particular holding, the average rating is generally used. No NRSRO has been involved with the calculation of
average credit quality and the ratings of underlying portfolio holdings should not be viewed as a rating of the portfolio itself. Portfolio holdings, underlying ratings of holdings and average credit may change materially overtime.
Statements contained herein are based on current expectations, estimates, projections, opinions and/or beliefs of NBLA. This presentation contains “forward-looking” or statements which often can be identified by the use of forward
looking terminology such as “may,” “will,” “seek,” “should,” “expect,” “anticipate,” “project,” “estimate,” “intend,” “continue,” “target,” “plan” or “believe” or the negatives thereof or other variations thereon or comparable terminology.
Such information may include, among other things, projections, forecasts or estimates of cash flows, yields or return, scenario analyses and proposed or expected portfolio composition. Such forward-looking information is based
upon certain assumptions about future events or conditions and is intended only to illustrate hypothetical results under those assumptions (not all of which are specified herein). Such statements involve known and unknown risks,
uncertainties and other factors, and undue reliance should not be placed thereon. Such statements are necessarily speculative in nature, as they are based on certain assumptions. It can be expected that some or all of the
assumptions underlying such statements will not reflect actual conditions. Accordingly, there can be no assurance that any estimated projections, forecast or estimates will be realized or that the forward looking statements will
materialize. Due to various risks and uncertainties, including those set forth herein, actual events or results or the actual performance of any security referenced herein may differ materially from those reflected or contemplated in
such forward looking statements.
A bond’s value may fluctuate based on interest rates, market conditions, credit quality and other factors. You may have a gain or loss if you sell your bonds prior to maturity. Of course, bonds are subject to the credit risk of the
issuer. If sold prior to maturity, municipal securities are subject to gain/losses based on the level of interest rates, market conditions and the credit quality of the issuer. Income may be subject to the alternative minimum tax (AMT)
and/or state and local taxes, based on the investor’s state of residence. High-yield bonds, also known as “junk bonds,” are considered speculative and carry a greater risk of default than investment-grade bonds. Their market value
tends to be more volatile than investment-grade bonds and may fluctuate based on interest rates, market conditions, credit quality, political events, currency devaluation and other factors. High yield bonds are not suitable for all
investors and the risks of these bonds should be weighed against the potential rewards. Neither Neuberger Berman nor its employees provide tax or legal advice. You should contact a tax advisor regarding the suitability of tax-
exempt investments in your portfolio.
Illustrative performance results are based on mathematical models that calculate these results using input that are based on assumptions about a variety of future conditions and events. As with all models, results may vary
significantly depending upon the value and accuracy of the inputs given, and relatively minor modifications to, or the elimination of, an assumption, may have a significant impact on the results. Actual conditions or events are
unlikely to be consistent with, and may differ materially from, those assumed. You should understand such assumptions and evaluate whether they are appropriate for your purposes. None of NBLA or its affiliates make any
representation or warranty, express or implied, as to the reasonableness of any assumptions used in calculating illustrative performance information or the accuracy (mathematical or otherwise) or validity of such information.
You should consider whether the behavior of these securities should be tested using different or additional assumptions from those set forth herein. The securities may not perform as described in any of the calculations presented
herein.
Securities issued by CLO vehicles are not registered under the U.S. Securities Act of 1933, as amended, or the U.S. Investment Company Act of 1940, as amended. None of the information contained herein has been filed with the
Securities and Exchange Commission, any securities administrator under any securities laws of any U.S. or non-U.S. jurisdiction or any other U.S. or non-U.S. governmental or self-regulatory authority. No such governmental or self-
regulatory authority will pass upon or endorse the merits of the investment or the adequacy of the information contained herein. Any representation to the contrary is unlawful.
Gross returns do not reflect the deduction of advisory fees and other expenses, which will reduce returns. Investment advisory fees have a compounding effect on cumulative results. For example, assume Neuberger Berman
achieves a 10% annual return prior to the deduction of fees each year for a period of ten years. If an annual advisory fee of 1.00% of assets under management for the ten-year period were charged, the resulting annual average
return after fees would be reduced to 8.90%. Performance results will vary based upon the period measured. Additional information regarding fees can be found in Neuberger Berman’s Form ADV, Part 2A, which is available upon
request.

39For the Employees' Retirement System of Rhode Island Use Only
Disclosures (Continued)
This material is general in nature and is not directed to any category of investors and should not be regarded as individualized, a recommendation, investment advice or a suggestion to engage in or refrain from any investment-
related course of action. Neuberger Berman is not providing this material in a fiduciary capacity and has a financial interest in the sale of its products and services. Investment decisions and the appropriateness of this material
should be made based on an investor's individual objectives and circumstances and in consultation with his or her advisors. This material may not be used for any investment decision in respect of any U.S. private sector retirement
account unless the recipient is a fiduciary that is a U.S. registered investment adviser, a U.S. registered broker-dealer, a bank regulated by the United States or any State, an insurance company licensed by more than one State to
manage the assets of employee benefit plans subject to ERISA (and together with plans subject to Section 4975 of the Internal Revenue Code, “Plans”), or, if subject to Title I of ERISA, a fiduciary with at least $50 million of client
assets under management and control, and in all cases financially sophisticated, capable of evaluating investment risks independently, both in general and with regard to particular transactions and investment strategies. This
means that “retail” retirement investors are expected to engage the services of an advisor in evaluating this material for any investment decision. If your understanding is different, we ask that you inform us immediately.
Certain information contained in this presentation has been obtained from published and non-published sources prepared by third parties. While such information is believed to be reliable, neither NBLA nor any of its affiliates have
independently verified such information nor does it or they assume any responsibility for the accuracy, completeness or reliability thereof. Except as otherwise indicated herein, the information, opinions and estimates provided in this
presentation are based on matters and information as they exist as of the date this presentation has been prepared and not as of any future date, and will not be updated or otherwise revised to reflect information that is
subsequently discovered or available, or for changes in circumstances occurring after the date hereof. Third-party economic, market or security estimates or forecasts discussed herein may or may not be realized and no opinion or
representation is being given regarding such estimates or forecasts. We do not represent that the information contained herein is accurate or complete, and it should not be relied upon as such.
While Neuberger Berman believe that the information is correct at the date of production, no warranty or representation is given to this effect and no responsibility can be accepted by Neuberger Berman to the recipient of this
document or end users for any action taken on the basis of the information contained herein. No reliance may be placed for any purpose on the information and opinions contained in this document or their accuracy or
completeness. Opinions expressed herein reflect the opinion of relevant investment team and are subject to change without notice. Any views or opinions expressed may not reflect those of the firm as a whole.
Disclosure For Manager Track Record. The performance shown is for the stated time period only; due to market volatility, each account’s performance may be different. Returns are calculated using a daily time-weighted return, and
unless otherwise stated, gross performance results are net of direct expenses, but before management fees, custody charges, withholding taxes, and other indirect expenses. Net performance results are net of management fees
and other direct expenses, but before custody charges, withholding taxes, and other indirect expenses. All returns include the reinvestment of dividends. Differences in account size, timing of transactions and market conditions
prevailing at the time of investment may lead to different results. Differences in the methodology used to calculate performance may also lead to different performance results than those shown. The performance shown is compared
to the S&P/LSTA Leveraged Loan Index, a broad-based loan market index. The S&P/LSTA Leveraged Loan index is a daily total return index that uses LSTA/LPC Mark-to-Market Pricing to calculate market value change. On a real-
time basis, the S&P/LSTA Leveraged Loan index tracks the current outstanding balance and spread over LIBOR for fully funded term loans. The facilities included in the index represent a broad cross section of leveraged loans
syndicated in the United States, including dollar-denominated loans to overseas issuers. Indices are unmanaged, are not available for direct investment and are not subject to fees and expenses typically associated with managed
accounts or investment funds. Past performance is no guarantee of future results.
Principles for Responsible Investment (PRI) Scores: For illustrative and discussion purposes only. PRI grades are based on information reported directly by PRI signatories, of which investment managers totaled 1,924 for 2020,
1,119 for 2019, 1,120 for 2018 and 935 for 2017. All signatories are eligible to participate and must complete a questionnaire to be included. The underlying information submitted by signatories is not audited by the PRI or any
other party acting on its behalf. Signatories report on their responsible investment activities by responding to asset-specific modules in the Reporting Framework. Each module houses a variety of indicators that address specific
topics of responsible investment. Signatories’ answers are then assessed and results are compiled into an Assessment Report. The Assessment Report includes indicator scores – summarizing the individual scores achieved and
comparing them to the median; section scores – grouping similar indicator scores together into categories (e.g. policy, assurance, governance) and comparing them to the median; module scores – aggregating all the indicator
scores within a module to assign one of six performance bands (from E to A+). Awards and ratings referenced do not reflect the experiences of any Neuberger Berman client and readers should not view such information as
representative of any particular client’s experience or assume that they will have a similar investment experience as any previous or existing client. Awards and ratings are not indicative of the past or future performance of any
Neuberger Berman product or service. Moreover, the underlying information has not been audited by the PRI or any other party acting on its behalf. While every effort has been made to produce a fair representation of performance,
no representations or warranties are made as to the accuracy of the information presented, and no responsibility or liability can be accepted for damage caused by use of or reliance on the information contained within this report.

40For the Employees' Retirement System of Rhode Island Use Only
Additional Disclosures
Private Offerings: Certain strategies referenced herein may only be available through a private offering of interests made pursuant to offering and subscription documents, which will be furnished solely to qualified investors on a
confidential basis at their request for their consideration in connection with an offering. These documents will contain information about the investment objective, terms and conditions of an investment in such vehicle and will also
contain tax information and risk disclosures that are important to an investment decision. Any decision to invest in such vehicle should be made after a careful review of these documents, the conduct of such investigations as an
investor deems necessary or appropriate and after consultation with legal, accounting, tax and other advisors in order to make an independent determination of the suitability and consequences of an investment in such vehicle.
Principles for Responsible Investment (PRI) 2020 Leaders’ Group: The year 2020 represents the first year that asset managers became eligible for PRI Leader designation, which formerly included asset owners only. The new
designation was awarded to only 20 of the 2100+ investment manager PRI signatories. The Leaders’ Group showcases signatories at the cutting edge of responsible investment, and highlights trends in what they are doing. PRI
uses signatories’ reporting responses and assessment data to identify those that are doing excellent work in responsible investment – across their organizations and with a focus on a given theme each year. The 2020 theme is
climate reporting. Information about PRI Leader is sourced entirely from PRI and Neuberger Berman makes no representations, warranties or opinions based on that information.
FOR UNITED STATES RESIDENTS
In making an investment decision, investors must rely on their own examination of the relevant issuer and the terms of the offering, including the merits and risks involved. Interests have not been recommended by any U.S. federal,
state, local or other securities commission or regulatory authority. Furthermore, the foregoing authorities have not confirmed the accuracy or determined the adequacy of this document. Any representation to the contrary is a criminal
offense. Interests are expected to be subject to restrictions on transferability and resale and may not be transferred or resold except as permitted under the U.S. Securities Act of 1933, as amended, and any applicable state or other
securities laws, pursuant to registration or exemption therefrom. Investors should be aware that they will be required to bear the financial risks of an investment for an indefinite period of time.
Each of NBLA I and NBLA II is registered as an investment adviser. NBIA is registered as an investment adviser, commodity pool operator and commodity trading advisor and, under limited circumstances, makes available certain
investment products, strategies and services through the associated persons of its affiliate, Neuberger Berman BD LLC, a registered broker-dealer.
The “Neuberger Berman” name and logo are registered service marks of Neuberger Berman Group LLC.
© 2021 Neuberger Berman Group LLC. All rights reserved.
526005 5/2021