Embed Size (px)
Citation preview
Clinical Study
Re-defining Hyperkalemia in Chronic Kidney Disease – A Cohort Study
Ming-Fang Hsieh MD1,2, I-Wen Wu MD1,2, Chin-Chan Lee MD1,2, Shun-Yin
Wang2, Mai-Szu Wu MD1,2
1School of Medicine, Chang Gung University,2Department of Nephrology, Chang Gung Memorial Hospital, Keelung, Taiwan
Address for all correspondence: Dr. Mai-Szu Wu
Division of Nephrology, Chang Gung Memorial hospital, 222, Mai-Chin Road,
Keelung, 204, Taiwan.
Tel: 886-2-24313131, ext 2501.
Fax: 886-2-24335342.
E-mail: [email protected]
Running Title: Re-defining hyperkalemia in chronic kidney disease
Key word: Chronic kidney disease, Hyperkalemia, ACEI/ARB
1
AbstractBackground: The serum potassium (K+) level increased with progression of
chronic kidney disease (CKD), which is considered a physiological process.
The appropriate serum K+ level in different stage of renal dysfunction remains
unclear. We hypothesized serum K+ level increases in parallel with drop of
renal function and the conventional normal range for serum K+ is not suitable
with CKD patients.
Materials and Methods: We conducted a cohort study to define the serum K+
level in patients without clinical manifestations of hyperkalemia in different
stages of CKD. 548 CKD patients were included and followed up for at least 1
year, since March 2006 to May 2007. The patients were sub-grouped by
MDRD estimated glomerular filtration rate (eGFR). Serum creatinine, eGFR
and K+ level were recorded at least twice during the study. We analyzed the
average K+ level in different CKD stages.
Results: Average K+ level increases along renal function deterioration. The
increase became statistically significant after stage 4 comparing to stage 3
(stage 3: 4.36±0.49, stage 4: 4.50±0.55, stage 5: 4.69±0.73). Male, diabetes
mellitus, low eGFR and low hemoglobin were the probable risk factors for
hyperkalemia in our CKD patients. We also noticed there was linear increase
2
of standard deviation of serum K+ levels along renal function deterioration.
The use of ACEI/ARB was not associated with hyperkalemia in our patients.
Conclusion: We suggested that serum K+ level increased along the decline
of eGFR and became significant since stage 3. Interpretation of serum K+
should be adjusted in late stage CKD patients.
3
IntroductionPotassium (K+) is the most abundant cation within intracellular fluid. The
serum K+ level is the major factor in determining cellular resting potential,
which is important for excitable cells, such as neuron and myocardial cells 1,2.
The elevated serum K+ level is a medical emergency in daily practice because
of rigorous alteration in cardiac electrophysiology. The elevated serum K+
level is associated with reduced myocardial conduction velocity and
accelerated repolarization. Extreme value of hyperkalemia can even lead to
fatal cardiac arrhythmia 3.
Serum K+ level is maintained within a very narrow range in human body.
The re-distribution of K+ between the intracellular and extracellular space can
equilibrate the serum K+ level from the daily intake of K+. However, the most
important part of the long-term K+ regulation depends on the renal K+
excretion1. Secretion of K+ occurs mainly in cortical collecting duct (CCD), in
which apical membrane K+ (ROMK, renal outer medullary K+ channel)
channels in the principal cells efficiently excrete surplus K+ 4-6. The impeccable
ability of kidney to excrete K+ keeps our internal milieu out of the danger for
complications associated with high K+ levels. Also, serum K+ level is one of
4
the major regulators in renal K+ excretion. High serum K+ level leads to
enhanced ROMK activity and increased renal K+ excretion.
The mechanism of renal excreting K+ is compromised in chronic kidney
disease (CKD) patients. The serum K+ level might increase along the
deteriorating renal function. Subsequently, the elevated K+ level might by itself
stimulate K+ excretion. A new steady state develops without medical
complications 7. It is reasonable to speculate that the elevated serum K+ level
might be a physiological adaptation of failing kidney. However, the line
between physiological adaptation and medical complication is unclear. It is
interesting to ask what are the appropriate ranges of serum K+ in the patients
with different degrees of kidney dysfunction. We hypothesized that K+ level
increased along deterioration of renal function within a range different from
that of patient with normal renal function. To answer the question, we
conducted a cohort study to evaluate the relationship of serum K+ levels and
the stages of CKD. We also try to define appropriate ranges of K + in patients
with different CKD stages.
5
Materials and MethodsStudy population
In this cohort study, we included 583 predialysis CKD patients, who
visited the nephrology outpatient clinics of the Department of Nephrology at a
university-afflicted teaching hospital, Chang Gung Memorial Hospital at
Keelung from May 2006 to May 2007. Patients aged 18–80 years who
participated in a multidisciplinary predialysis education program were included
after obtaining informed consent. Thirty five patients with documented cardiac
arrhythmia or those patients under treatment of cation exchange resin,
diuretics, β-blockers, digoxin, mineralocorticoids, or non-steroidal anti-
inflammatory drugs were excluded from the study 8,9. 548 patients received
standardized predialysis education and dietitian counseling according to
NKF/DOQI guideline.
Definition of CKD
CKD was defined as a structural or functional kidney abnormality
persisting for at least 3 months and manifested by either kidney damage
(persistent proteinuria) or a decreased estimated glomerular filtration rate
(eGFR) (< 60 ml/min per 1.73 m2), as estimated by abbreviated Modification
of Diet in Renal Disease (MDRD) equation in which estimated GFR = 186.3 x
6
(serum creatinine level)-1.154 x age-0.203 x (0.742 if female) 10. For descriptive
purposes, CKD stage 1 was defined as eGFR >90 ml/min per 1.73 m2 with
structural abnormalities or proteinuria; stage 2, as 60 to 89 ml/min per 1.73
m2; CKD stage 3, as 30 to 59 ml/min per 1.73 m2; stage 4, as 15-29 ml/min
per 1.73 m2 and stage 5, as eGFR <15 ml/min per 1.73 m2 or patients who
had commenced dialysis therapy.
Laboratory and Clinical data
The serial measurement of K+ was performed in the core laboratory of
Chang Gung Memorial hospital, using SYNCHRON LX System (SYNCHRON
LX ISE, Buffer and Reference) with a normal range value of 3.0 to 4.8 meq/L.
The following information was obtained from each patient: age, gender, body
mass index (BMI), comorbidity, and the usage of Angiotensin-converting
enzyme inhibitors (ACEIs) and Angiotensin II receptor blockers (ARBs).
Serum K+ concentration, serum creatinine and hemoglobin were checked at
least twice in the follow-up period. Hyperkalemia was defined by a serum K
value > 4.8 meq/L in two occasions.
Statistic methods
Descriptive statistics were expressed as means and standard deviation.
Discrete variables were presented as frequencies and group percentage. All
7
variables were tested for normal distribution by Kolmogorov-Simirnov test.
The Student’s t-test was applied to compare means of continues variables
and normal distribution data. Categorical data were tested using the Chi-
square test. Analysis of variance (ANOVA) test using LSD post hoc test was
used for numerical values. Pearson or Spearman correlation coefficients were
used as appropriate to test correlations between K+ level and eGFR. Risk
factors for hyperkalemia with statistical significance in the univariate analysis
were included in multivariate analysis by applying a multiple logistic
regression based on backward elimination of data. All statistical tests were
two-tailed, and a p<0.05 was considered statistically significant. Data were
analyzed using SPSS 13.0 for Windows XP (SPSS, Chicago, IL).
8
ResultsBaseline characteristic
A total of 583 patients were enrolled into study. Five-hundred fifty two
patients completed laboratory analysis and only 548 patients completed 12-
month follow-up. Four patients were excluded due to documented
hyperkalemia change in resting electrocardiography. Patients’ characteristics
were summarized in Table 1. The mean age of CKD patients in stage 3 to 5
was higher than that in stage 1 patients. There was also a trend of increase in
serum K+ levels. The K+ levels were significantly higher in stage 4 and 5
patients, comparing to that of the stage 3 patients (stage 1: 4.04±0.21, stage
2: 4.13±0.36, stage 3: 4.36±0.49, stage 4: 4.50±0.55, stage 5: 4.69±0.73,
meq/L, p<0.05. Fig 1). It is also very interesting to find that there is a wider
range of serum K+ level along the progression of CKD stages. The anemia
developed along the progression of CKD. The hemoglobin levels were lower
in stage 3 to 5 patients comparing to that of stage 1 patients (stage 1:
13.31±1.74, stage 3: 12.31±2.07, stage 4: 10.69±1.95, stage 5: 9.60±1.56,
g/dL, p<0.001). We also found that there were more male gender,
hypertension, and diabetes in patients with late stage of CKD; however, the
difference did not reach statistical significance (Table 1).
9
Risk factors for hyperkalemia in CKD patients
We performed a multiple logistic regression analysis to evaluate the
independent risk factor associated with the hyperkalemia (Table 2). Male
gender [Odds ratio (OR), 1.756; 95% confidential interval (CI), 1.164-2.649; p-
value= 0.008], diabetes mellitus (OR: 1.511; 95% CI, 1.043-2.191; p-value=
0.029), eGFR (OR: 0.967; 95% CI, 0.953-0.981; p-value <0.001), and
hemoglobin (OR: 0.775; 95% CI, 0.692-0.867; p-value <0.001) remained
significantly associated with the development of hyperkalemia.
Use of ACEI or ARB and hyperkalemia in CKD patients
In our study, more than 80% of stage 3 to 5 CKD patients used ACEI or
ARB. It is very interesting to ask if the usage of ACEI/ARB affect the
appearance of hyperkalemia. Surprisingly, we did not find the association of
usage of ACEI/ARB and hyperkalemia. (Table 2).
To evaluate the effect of ACEI/ARB on the serum K+ of patients with
similar CKD stage, we compared the absolute serum K+ levels of the users
and non-users of ACEI/ARB by CKD stage (Table 3). The additional analysis
suggested that the serum K+ levels were not different between patients with or
without ACEI/ARB in stage 3 to 5 CKD patients.
10
Diabetes mellitus and hyperkalemia in CKD patients
Patients with diabetes mellitus (DM) tend to have hyporenin
hypoaldosteronism, which might be associated with higher K+ levels and
metabolic acidosis. Diabetes is associated with the presence of hyperkalemia,
when defined as serum K+ level higher than 4.8 mEq/L. The similar question
appeared if the presence of diabetes is also related to the absolute serum K+
levels. For the reason, we compared absolute serum K+ levels of DM patients
and non-DM patients in CKD stage 3, 4 and 5. We found that DM patients do
not have significantly higher K+ level than non-DM patients (Fig 2). The results
suggested that the serum K+ levels are correlated with the progression of CKD
rather than diabetes itself. The significant correlation might come from the
progressive increase of diabetes population along the progression of CKD in
our study cohort.
Estimated K+ (eK+) level at different stage of CKD
We had shown that high serum K+ levels were associated with worsening
CKD stages. It is very interesting to know the altitude of increment of serum
potassium levels along the progression of CKD. To demonstrate the
11
increasing slope, we plot the serum K+ levels according to related eGFR and a
linear regression equation is obtained as eK+= -0.0117 eGFR + 4.792 (Fig 3).
We also observed that the standard deviation of serum K+ levels became
wider with more advanced CKD stage. We further plotted the standard
deviation of serum K+ levels according to CKD stage. For the estimated
standard deviation of serum K+ levels, the equation is 0.246 CKD stage +
0.198 with R2 of 0.9819 (Fig 4). All these results suggested that the mean
serum potassium levels increased with wider range of fluctuation along the
progression of CKD.
12
Discussion
In the United States, hyperkalemia cause 5 deaths/1,000 person-years
in patients with chronic kidney disease 11. However, it has been postulated
that patients with ESRD have a tolerance for hyperkalemia, and that the usual
cardiac and neuromuscular sequelae of hyperkalemia are less evident in
ESRD patients than in those with normal renal function 12,13. It is very
interesting to ask whether this phenomenon appeared far beyond the
development of ESRD and appeared in the late stage of CKD. We proposed
that K+ level might increase along the deterioration of renal function within a
range other than that of patient with normal renal function without any clinical
significance. To answer the question, we conducted a cohort study to
evaluate the relationship of serum K+ levels and the stages of CKD. We also
try to define appropriate ranges of K+ in patients with different CKD stages.
In patients with chronic renal insufficiency, hyperkalemia was thought
to be an adaptive response 7. In our study, we also found that the patients had
higher average K+ levels when their renal function became worse (Stage 3:
4.36±0.49, Stage4: 4.50±0.55, stage 5: 4.69±0.73, meq/L, p<0.05) (table 1).
Our patients did not have emergent electrocardiographic change or muscle
weakness even when hyperkalemia was found. Recognizing that mild to
13
moderate hyperkalemia might be an adaptive response is a clinically
important issue, which guides clinician in determining the timing of the
treatment of hyperkalemia. Insulin, β-agonist, sodium bicarbonate, and
exchanging resin might be given unnecessarily if the K+ level increased in
proportionally with the progression of renal failure. The above therapies are
not without complications. It is very important to define the proper K+ level to
avoid overtreatment of hyperkalemia.
Diabetic nephropathy is the single most common cause of ESRD in
Taiwan, Europe, Japan, and United States, with diabetic patients accounting
for 25% to 45% of all patients enrolled in ESRD programs 14. Previous studies
found that hyperkalemia appeared to occur more frequently in patients with
tubulointerstitial disease of diabetes mellitus 15. We did not find that diabetic
patients had higher K+ level in all CKD patients. Non-DM and DM patients had
the similar K+ levels along the progression of renal failure. The results
suggested that the serum K+ levels were correlated with the progression of
CKD rather than diabetes itself. The results also reflected the progressive
increase of diabetes population along the progression of CKD in our study
cohort.
14
Angiotensin-converting enzyme inhibitors (ACEIs) and angiotensin II
receptor blockers (ARBs), which have antihypertensive effect, are thought to
have cardiorenal-protective benefits in CKD patients 16. ACEIs/ARBs are
highly effective in reducing proteinuria and slowing progression to ESRD in
nondiabetic nephropathy. Their effect on slowing loss of GFR is tightly linked
to the antiproteinuric effect 17. ACEIs/ARBs have been suggested to confer
additional nephroprotection in diabetes, beyond their effects on blood
pressure 18. Therefore, the use of ACEIs/ARBs is often recommended as a
first line of treatment in chronic kidney diseases and diabetic nephropathy 19.
Most of our CKD patients were taking ACEIs/ARBs as supported by current
literatures. There was no significant difference in the frequency of using
ACEIs/ARBs between each CKD stage, especially in stage 3 to 5 (Table 1).
Hyperkalemia was thought to be one of the major complications in patients
using ACEIs/ARBs. There was no significant difference between the serum K+
levels in patients using and not using ACEIs/ARBs (Table 3). Hyperkalemia
seemed to have stronger relation with lower eGFR, rather than with using
ACEIs/ARBs (Table 2). ACEIs/ARBs seem to have no significant correlation
with hyperkalemia in cohorted CKD patients.
To further confirm the eGFR is the most significant determinant of the K +
15
level in CKD patients, we made a linear regression analysis on serum K+ level
against eGFR (Fig 3). We got a linear regression equation (y=-0.0117x +
4.792 in which x meaned eGFR and y meaned estimated K+ level of the
eGFR). This meaned that in every increase of 1 ml/min eGFR there was a
decrease of 0.0117 meq/L serum K+ level from base of 4.792 mEq/L. The
distribution of serum K+ level, which is represented by the standard deviation
of average K+ level, became wider as the progression of CKD stages. The
results reflected the fact that the kidney was less capable to keep the serum
K+ level within a narrow range as the progress of CKD. This phenomenon
might be more clinical important when facing the hyperkalemia in CKD
patients.
In our study, K+ level indeed increased when renal function
deteriorated, but there were some limitations to influence our results. The size
of the study cohort was only 548 patients. We used Stata 10 for Windows XP
to estimate sample size using the difference of K+ level of 0.0-0.2 meq/L with
standard deviation of 0.5 meq/L, and estimated sample size should be more
than 130 patients in each stage to make power of test 0.9. Our study cohort
constituted enough patients in stage 3 to 5 (146, 170, and 215 patients in
respective stages). The expansion of the study cohort size might further
16
enhance our findings, especially in early stage CKD. However, the potassium
level did not increase significant in early stage CKD in our cohort and from
previous literatures. The information regarding the assessment in K+ intake
and K+ excretion was limited in our study. Because all patients were enrolled
in the predialysis education program and had same dietitian counseling, we
presume the difference in dietary K+ intake was minimal in our patients.
Furthermore, the exclusion criteria of our study had excluded use of certain
drugs, which could affect K+ renal handling, such as diuretics, β-blockers,
digoxin, mineralocorticoids, or non-steroidal anti-inflammatory drugs. The
renal K+ excretion may merely dependent on its renal function. On the other
hand, we did not take into consideration of the acid-base status, which might
influence the K+ level in the study. For this reason, we made comparison
within the same CKD stage, when acid-base status might be homogenous
enough to affect the serum K+ level in the same stage of CKD progression.
We found that serum K+ level increased along the decrease of eGFR.
ACEIs/ ARBs usage was not significantly associated with serum K+ level. The
results suggested that serum K+ level should be re-defined in progression of
CKD and ACEIs/ARBs usages might not precipitated the CKD-associated
high K+ level.
17
18
Conflicts of interest
All coauthors have no financial conflicts or other conflicts of interest in this
area.
19
Acknowledgement
The authors wish to express their deepest gratitude to all the patients who
participated in this study.
20
Reference1. David BM, Alan SLY: Transport of Inorganic Solutes: Sodium, Chloride,
Potassium, Magnesium, Calcium, and Phosphate. In: Barry MB, editor.
Brenner and Rector's The Kidney, Philadelphia; Saunders, 2007:180-5.
2. Rastegar A, Soleimani M: Hypokalaemia and hyperkalaemia. Postgrad
Med J 2001; 77: 759-764.
3. Ahmed J, Weisberg LS: Hyperkalemia in dialysis patients. Semin Dial
2001; 14: 348-356.
4. Giebisch G, Krapf R, Wagner C: Renal and extrarenal regulation of
potassium. Kidney Int 2007; 72: 397-410.
5. Giebisch G: Renal potassium transport: mechanisms and regulation. Am
J Physiol 1998; 274: F817-33.
6. Giebisch G, Wang W: Potassium transport: From clearance to channels
and pumps. Kidney Int 1996; 49:1624-31.
7. Gennari FJ, Segal AS: Hyperkalemia: An adaptive response in chronic
renal insufficiency. Kidney Int 2002; 62: 1-9.
8. Nielsen EH: Hyperkalaemic muscle paresis--side-effect of prostaglandin
inhibition in a haemodialysis patient. Nephrol Dial Transplant 1999; 14:
480-2.
9. Wright FS: Sites and mechanisms of potassium transport along the renal
tubule. Kidney int 1977; 11: 415-32.
21
10. Levey A, Eckardt KU, Tsukamoto Y, et al: Definition and classification of
chronic kidney disease: a position statement from Kidney Disease:
Improving Global Outcomes (KDIGO). Kidney Int 2005; 67: 2089-2100.
11. Tzamaloukas AH, Avasthi PS: Temporal profile of serum potassium
concentration in nondiabetic and diabetic outpatients on chronic dialysis.
Am J Nephrol 1987; 7: 101-9.
12. Aslam S, Friedman EA, Ifudu: Electrocardiography is unreliable in
detecting potentially lethal hyperkalaemia in haemodialysis patients.
Nephrol Dial Transplant 2002; 17: 1639-42.
13. Szerlip HM, Weiss J, Singer I: Profound hyperkalemia without
electrocardiographic manifestations. Am J Kidney Dis 1986; 7: 461-5.
14. Hans-Henrik P, Michael M, Eberhard R: Diabetic Nephropathy. In: Barry
MB, editor. Brenner and Rector's The Kidney, Philadelphia; Saunders,
2007: 1265-1279.
15. Schambelan M, Sebastian A, Biglieri EG: Prevalence, pathogenesis, and
functional significance of aldosterone deficiency in hyperkalemic patients
with chronic renal insufficiency. Kidney Int 1980; 17: 89-101.
16. Cannella G, Paoletti E, Delfino R, Peloso G, Rolla D, Molinari S:
Prolonged therapy with ACE inhibitors induces a regression of left
22

ventricular hypertrophy of dialyzed uremic patients independently from
hypotensive effects. Am J Kidney Dis 1997; 30: 659-64.
17. Codreanu I, Perico N, Remuzzi G: Dual blockade of the renin-angiotensin
system: the ultimate treatment for renal protection? J Am Soc Nephrol
2005; 16 (Suppl 1): S34-38.
18. Fioretto P, Solini A: Antihypertensive treatment and multifactorial
approach for renal protection in diabetes. J Am Soc Nephrol 2005; 16
(Suppl 1): S18-21.
19. Bakris GL, Siomos M, Richardson D, et al: ACE inhibition or angiotensin receptor blockade: impact on potassium in renal failure. Kidney Int 2000; 58: 2084-92.
23

Table 1: Demographic and clinical characteristics of study population (n=548)
Stage 1 Stage 2 Stage 3 Stage 4 Stage 5
(n=7) (n=10) (n=146) (n=170) (n=215)
Age, y 49.95±19.17 58.82±16.41 69.30±12.91* 68.16±12.60* 65.83±12.74
*
Male, No. (%) 2 (28.6%) 4 (40.0%) 99(67.8%) 86 (50.6%) 95 (44.2%)
BMI, kg/m2 26.78±8.38 23.74±4.81 26.11±4.06 25.25±3.82 26.24±13.39
Chronic GN, No. (%) 2 (28.6%) 3 (30.0%) 18 (12.3%) 22 (12.9%) 51 (23.7%)
Diabetes, No. (%) 4 (57.1%) 4 (40.0%) 65 (44.5%) 98 (57.6%) 126 (58.6%)
Gout, No. (%) 0 (0.0%) 1 (10.0%) 27 (18.5%) 10 (5.9%) 8 (3.7%)
Obstructive uropathy, No.
(%)
0 (0.0%) 0 (0.0%) 3 (2.1%) 3 (1.8%) 7 (3.3%)
Hypertension, No. (%) 5 (71.4%) 3 (30.0%) 122 (83.6%) 141 (82.9%) 180 (83.7%)
Heart failure, No. (%) 0 (0.0%) 0 (0.0%) 15 (10.3%) 18 (10.6%) 19 (8.8%)
Coronary artery disease, No.
(%)
0 (0.0%) 1 (10.0%) 25 (17.1%) 30 (17.6%) 25 (11.6%)
CVA, No. (%) 1 (14.3%) 0 (0.0%) 13 (8.9%) 18 (10.6%) 25 (11.6%)
Hyperlipidemia, No. (%) 3 (42.9%) 3 (30.0%) 54 (37.0%) 49 (28.8%) 77 (35.8%)
eGFR, Cockcroft-Gault,
ml/min *
124.03±40.67 66.52 ±26.53 36.83±9.66 21.82±6.45 9.84±4.02
eGFR, abbrevated MDRD,
ml/min*
141.27±49.16 74±10.21 39.75±7.18 22.30±4.74 8.91±3.92
Average K, meq/L 4.04±0.21 4.13±0.36 4.36±0.49 4.50±0.55# 4.69±0.73#
Hemoglobin, mg/dl 13.31±1.74 12.66±2.83 12.31±2.07* 10.69±1.95* 9.6±1.56*
Abbreviations: y, years; BMI, body mass index; †: X² for trend, p< 0.05
*: Analysis of variance (ANOVA) test using LSD post hoc test (all stages compared with stage 1), p< 0.05
#: Analysis of variance (ANOVA) test using LSD post hoc test (all stages compared with stage 3), p< 0.05
24
25
Table 2: Multiple logistic regression analysis showing risk factors for hyperkalemia in CKD patients.
Variable (incremental) Odds Ratio (95% CI) p-value
Male 1.756 (1.164-2.649) 0.008
Age 1.007 (0.992-1.023) 0.356
Diabetes (yes) 1.511 (1.043-2.191) 0.029
Hypertension (yes) 1.261 (0.797-1.997) 0.322
eGFR, MDRD, ml/min 0.967 (0.953-0.981) <0.001
Hemoglobin 0.775 (0.692-0.867) <0.001
Use of ACEI/ARB 1.378 (0.836- 2.262) 0.205
Abbreviations: CKD: chronic kidney disease; eGFR: estimated glomerular filtration rate.
Table 3 Potassium level in patients with or without ACEi/ARB
ACEi/ARB, No (%) Average K P-value
With Without With
ACEi/ARB
Without
ACEi/ARB
Stage 3 121 (82.9%) 25(17.1%) 4.34±0.48 4.42±0.55 0.46
Stage 4 144 (84.7%) 26(15.3%) 4.50±0.55 4.46±0.56 0.72
Stage 5 178 (82.8%) 37(17.2%) 4.70±0.74 4.63±0.72 0.60
P-value is for average K of the patient with and without ACEi/ARB
26
Figure legends:
Figure 1. The range of average potassium level in CKD stage 3-5.
Figure 2. The average and the range of potassium level between the patients
with diabetes and without diabetes in CKD stage 3-5. All P-value > 0.05,
between two groups in each stage.
Figure 3. The distribution of average serum K+ level correlated with different
eGFR. Linear regression equation, in which x means eGFR and y means
estimated potassium level of the eGFR. The trend of higher potassium level is
noted when eGFR declines.
Figure 4. The range (standard deviation x 2) of average serum K+ level in
each stage of CKD. Linear regression equation, in which x means CKD stage
and y means doubling value of estimated the standard deviation of average
serum K+ levels.
27
Figure 1.
28
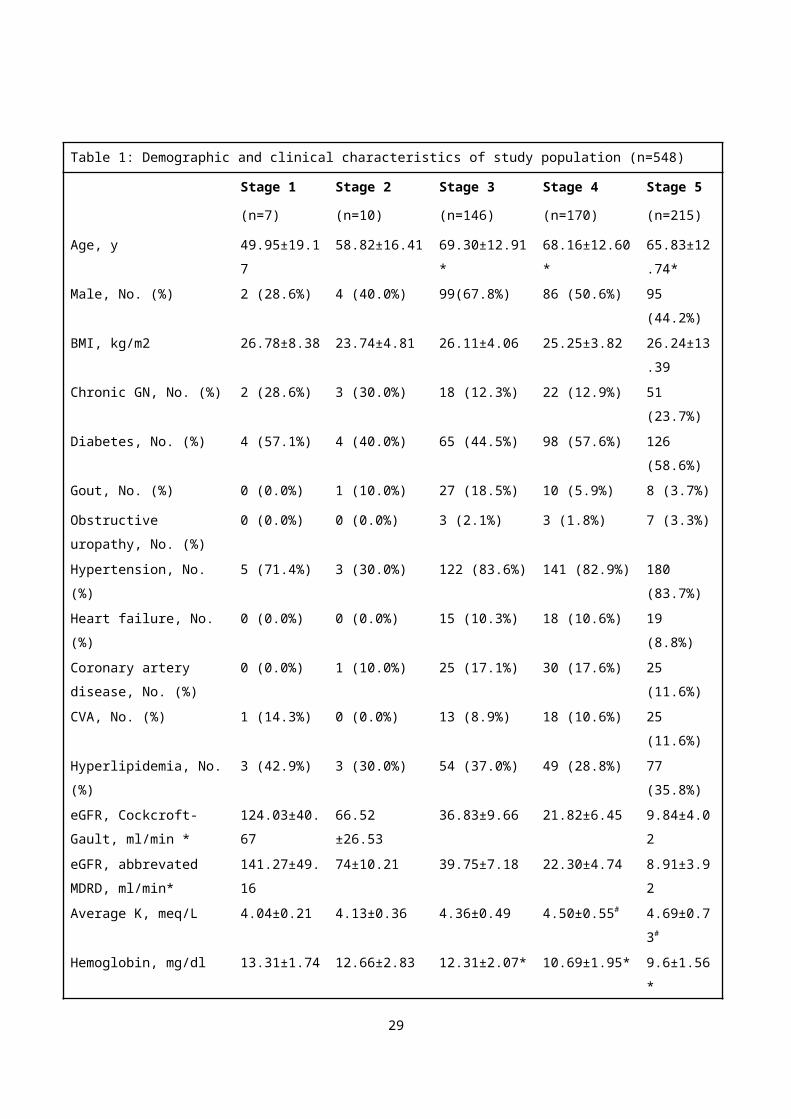
Figure 2
29
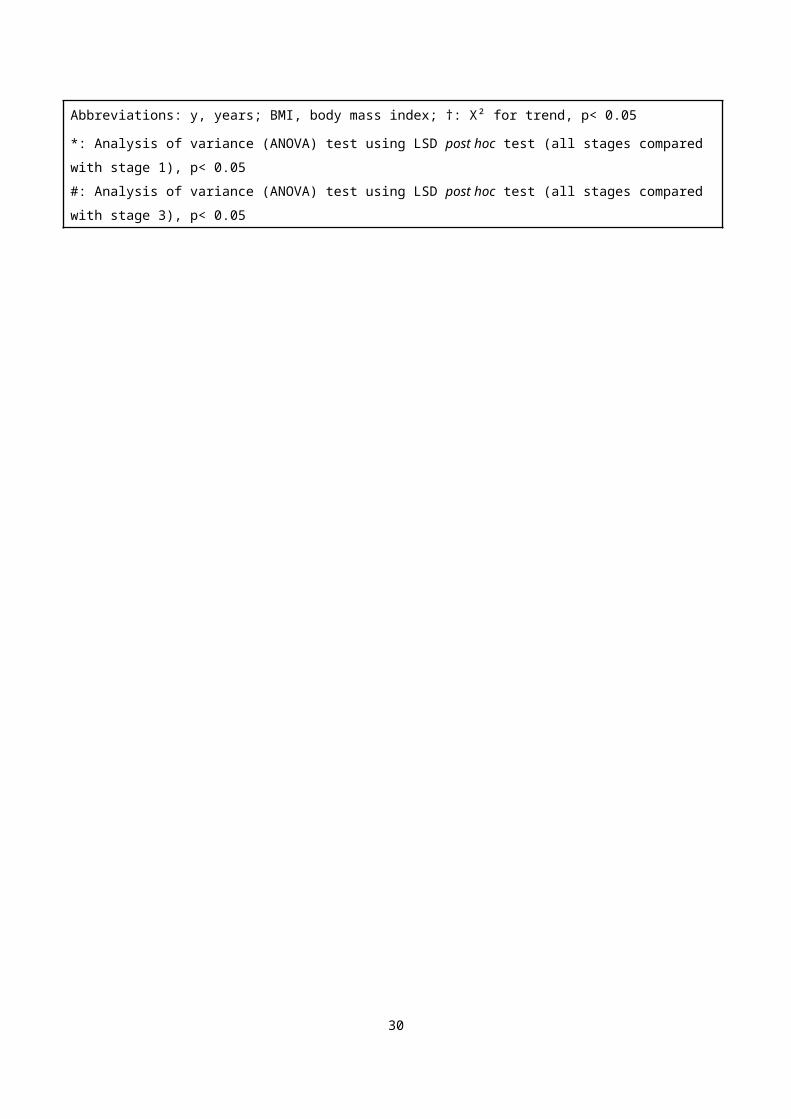
Figure 3
30
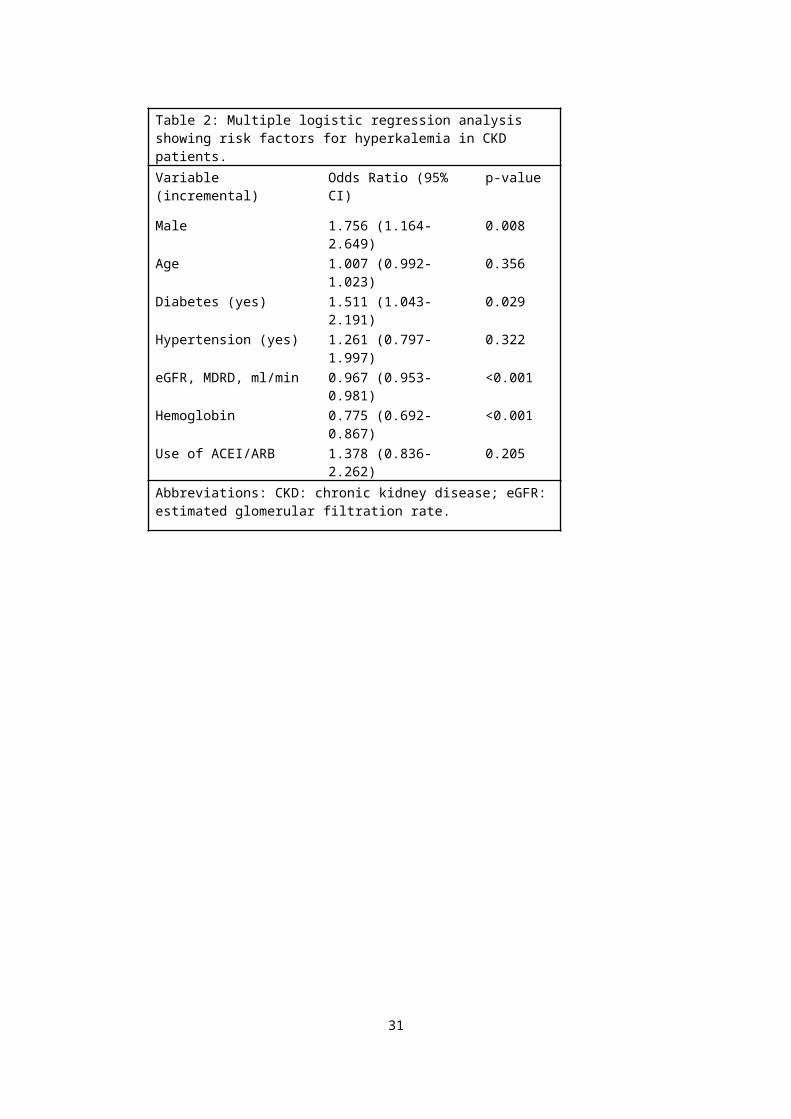
Figure 4
31
重新定義慢性腎臟病之高血鉀-- 一個世代研究謝明芳 1,2, 吳逸文 1,2, 李進昌 1,2, 王秀英 2, 吳麥斯 1,2
1 長庚大學醫學院,
2 基隆長庚醫院 腎臟科
摘要血清中鉀離子濃度會隨著慢性腎臟病(CKD)惡化而逐漸增加,但在不同程
度的腎臟病患者中,適合的鉀離子濃度為多少是未知的,於是我們假設血清中鉀離子濃度上升與腎臟功能降低有線性關係,而傳統的鉀離子濃度或許不適合套用在慢性腎臟病患者。 在我們的研究中,包括了 548 位慢性腎臟病患者,自2006年三月開始追蹤至少一年,將病人依腎絲球濾過率(MDRD eGFR)歸類至慢性腎臟病的五個階段,並記錄血清中肌酐酸、鋰離子濃度,比較不同階段且無臨床高血鉀症狀的慢性腎臟病患者之平均血鉀。我們得到的數值反應出平均血鉀會隨著腎功能惡化而逐步上升,且男性、糖尿病、低腎絲球濾過率及低血色素皆可能是此研究中慢性腎臟病患者有高血鉀之危險因子;另外,當慢性腎臟病越嚴重時,平均血鉀的標準差會呈線性增加;在我們的研究中,使用 ACEI 或 ARB 與不同階段慢性腎臟病之高血鉀無明顯關聯。於是我們推測當腎絲球濾過率下降時,血中鉀離
32
子會呈線性上升,尤其是慢性腎臟病第三階段之後,因此對於較末期的慢性腎臟病患者,血鉀判讀應與腎臟功能正常者不同,須再調整。關鍵字:慢性腎臟病,高血鉀,血管緊張素轉化酶抑制劑(Angiotensin-converting-
enzyme inhibitor, ACEI)/血管緊張素Ⅱ接受器阻斷劑(AngiotensinⅡ receptor blocker,
ARB)
作者服務單位:基隆長庚醫院 腎臟科通訊作者:吳麥斯 醫師通訊地址:基隆市麥金路222號 基隆長庚醫院腎臟科
33