Embed Size (px)
Citation preview

www.ejpmr.com
Harisha. European Journal of Pharmaceutical and Medical Research
508
CLINICAL STUDY TO EVALUATE THE EFFICACY & SAFETY OF CURCUMIN CAPSULE IN
PATIENTS WITH COUGH DUE TO CHRONIC BRONCHITIS
*Dr. Harisha S.
ICBio Clinical Research Pvt. Ltd, #16 & 18 ICBio Tower, Yelahanka Main Road, Chikkabettahalli, Vidyaranyapura,
Bangalore - 560 097, Karnataka, India.
Article Received on 21/10/2019 Article Revised on 11/11/2019 Article Accepted on 01/12/2019
INTRODUCTION
Chronic bronchitis
Chronic bronchitis is defined as a cough that occurs
every day with sputum production that lasts for at least 3
months, two years in a row. This definition was
developed to help select uniform patient populations for
research purposes, for example, to study medication
therapies for treatment of chronic bronchitis.
Many of the bronchi develop chronic inflammation with
swelling and excess mucus production. The
inflammation causes a change in the lining cells of the
airways to varying degrees. Many cells that line the
airway lose the function of their cilia (hair-like
appendages that are capable of beating rapidly), and
eventually the ciliated cells are lost. Cilia perform the
function of moving particles and fluid (usually mucus)
over the lining surface in such structures as the trachea,
bronchial tubes, and nasal cavities to keep these hollow
structures clear of particles and fluids. These ciliated
cells that help in clearance of secretions are often
replaced by so-called goblet cells. This group of cells
secretes mucus into the airway. The warm moist
environment of the airway along with the nutrients in the
mucus is an excellent medium for growing bacteria. The
mucus often becomes infected and discoloured from the
bacterial overgrowth and the body's inflammatory
response to it. The inflammation, swelling, and mucus
frequently and significantly inhibit the airflow to and
from the lung alveoli by narrowing and partially
obstructing the bronchi and bronchioles.
Description
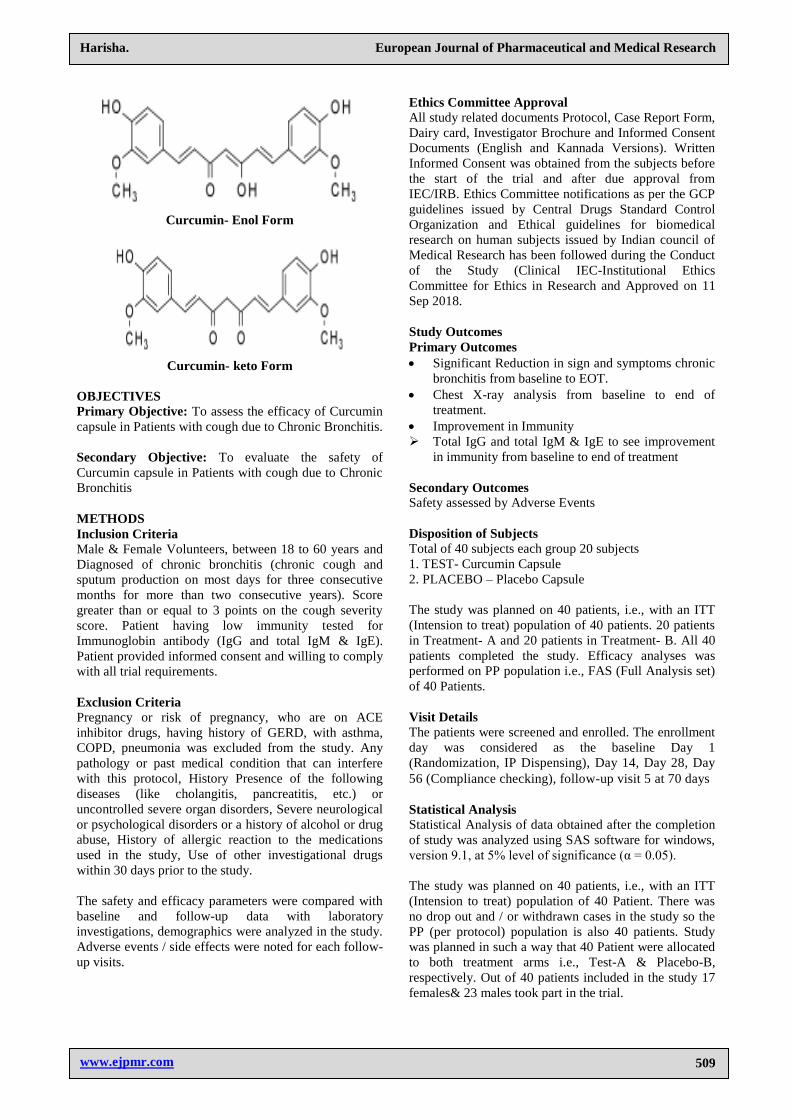
Curcumin is a diarylheptanoid. IUPAC name is (1E, 6E)-
1, 7-Bis (4-hydroxy-3-methoxyphenyl)-1, 6-heptadiene-
3, 5-Dione. Its molecular formula is C21H20O6 and
molecular weight is 368.38. It is the
principal curcuminoid of turmeric, which is a member of
the ginger family (Zingiberaceae). Turmeric's other two
curcuminoids are desmethoxycurcumin and bis-
desmethoxycurcumin. The Curcuminoids are natural
phenols that are responsible for the yellow colour of
turmeric. Curcumin can exist in
several tautomeric forms, including a 1, 3-diketo form
and two equivalent enol forms. The enol form is more
energetically stable in the solid phase and in solution.
SJIF Impact Factor 6.222
Research Article
ISSN 2394-3211
EJPMR
EUROPEAN JOURNAL OF PHARMACEUTICAL
AND MEDICAL RESEARCH
www.ejpmr.com
ejpmr, 2019,6(12), 508-519
ABSTRACT Background: Bronchitis is a term that describes inflammation of the bronchial tubes (bronchi and the smaller
branches termed bronchioles) that results in excessive secretions of mucus into the tubes, leading to tissue swelling
that can narrow or close off bronchial tubes. Bronchial tubes extend from the trachea and terminate at the alveoli in
the lungs. The bronchial system resembles an inverted tree and is sometimes termed the "bronchial tree." A few
authors include the trachea and upper airway in the definition of bronchitis. There are two major types of
bronchitis, acute and chronic. Chronic bronchitis differs from acute bronchitis in several ways, for example,
pathology, progression of disease, major causes, treatments, and prognosis. Recurrent incidences of acute
bronchitis are the first steps that can lead to developing chronic bronchitis, according to some doctors and
researchers. Chronic bronchitis is defined as a cough that occurs every day with sputum production that lasts for at
least 3 months, two years in a row. This definition was developed to help select uniform patient populations for
research purposes, for example, to study medication therapies for treatment of chronic bronchitis. Objectives: To
assess the efficacy and safety of Curcumin capsule in Patients with cough due to Chronic Bronchitis. Conclusion:
The study concludes that, TEST (CURCUMIN) due to its anti-inflammatory and immunomodulatory effect it is
more efficacious and safer in comparison to PLACEBO (B) in treatment of cough due to chronic bronchitis and
also alleviating the symptoms of chronic bronchitis along with improvement in immunity.
KEYWORDS: Forced Expiratory Volume-One Second (FEV1).
*Corresponding Author: Dr. Harisha S.
ICBio Clinical Research Pvt. Ltd, #16 & 18 ICBio Tower, Yelahanka Main Road, Chikkabettahalli, Vidyaranyapura, Bangalore - 560 097,
Karnataka, India.
www.ejpmr.com
Harisha. European Journal of Pharmaceutical and Medical Research
509
Curcumin- Enol Form
Curcumin- keto Form
OBJECTIVES
Primary Objective: To assess the efficacy of Curcumin
capsule in Patients with cough due to Chronic Bronchitis.
Secondary Objective: To evaluate the safety of
Curcumin capsule in Patients with cough due to Chronic
Bronchitis
METHODS
Inclusion Criteria
Male & Female Volunteers, between 18 to 60 years and
Diagnosed of chronic bronchitis (chronic cough and
sputum production on most days for three consecutive
months for more than two consecutive years). Score
greater than or equal to 3 points on the cough severity
score. Patient having low immunity tested for
Immunoglobin antibody (IgG and total IgM & IgE).
Patient provided informed consent and willing to comply
with all trial requirements.
Exclusion Criteria
Pregnancy or risk of pregnancy, who are on ACE
inhibitor drugs, having history of GERD, with asthma,
COPD, pneumonia was excluded from the study. Any
pathology or past medical condition that can interfere
with this protocol, History Presence of the following
diseases (like cholangitis, pancreatitis, etc.) or
uncontrolled severe organ disorders, Severe neurological
or psychological disorders or a history of alcohol or drug
abuse, History of allergic reaction to the medications
used in the study, Use of other investigational drugs
within 30 days prior to the study.
The safety and efficacy parameters were compared with
baseline and follow-up data with laboratory
investigations, demographics were analyzed in the study.
Adverse events / side effects were noted for each follow-
up visits.
Ethics Committee Approval
All study related documents Protocol, Case Report Form,
Dairy card, Investigator Brochure and Informed Consent
Documents (English and Kannada Versions). Written
Informed Consent was obtained from the subjects before
the start of the trial and after due approval from
IEC/IRB. Ethics Committee notifications as per the GCP
guidelines issued by Central Drugs Standard Control
Organization and Ethical guidelines for biomedical
research on human subjects issued by Indian council of
Medical Research has been followed during the Conduct
of the Study (Clinical IEC-Institutional Ethics
Committee for Ethics in Research and Approved on 11
Sep 2018.
Study Outcomes
Primary Outcomes
Significant Reduction in sign and symptoms chronic
bronchitis from baseline to EOT.
Chest X-ray analysis from baseline to end of
treatment.
Improvement in Immunity
Total IgG and total IgM & IgE to see improvement
in immunity from baseline to end of treatment
Secondary Outcomes
Safety assessed by Adverse Events
Disposition of Subjects
Total of 40 subjects each group 20 subjects
1. TEST- Curcumin Capsule
2. PLACEBO – Placebo Capsule
The study was planned on 40 patients, i.e., with an ITT
(Intension to treat) population of 40 patients. 20 patients
in Treatment- A and 20 patients in Treatment- B. All 40
patients completed the study. Efficacy analyses was
performed on PP population i.e., FAS (Full Analysis set)
of 40 Patients.
Visit Details
The patients were screened and enrolled. The enrollment
day was considered as the baseline Day 1
(Randomization, IP Dispensing), Day 14, Day 28, Day
56 (Compliance checking), follow-up visit 5 at 70 days
Statistical Analysis
Statistical Analysis of data obtained after the completion
of study was analyzed using SAS software for windows,
version 9.1, at 5% level of significance (α = 0.05).
The study was planned on 40 patients, i.e., with an ITT
(Intension to treat) population of 40 Patient. There was
no drop out and / or withdrawn cases in the study so the
PP (per protocol) population is also 40 patients. Study
was planned in such a way that 40 Patient were allocated
to both treatment arms i.e., Test-A & Placebo-B,
respectively. Out of 40 patients included in the study 17
females& 23 males took part in the trial.

www.ejpmr.com
Harisha. European Journal of Pharmaceutical and Medical Research
510
Efficacy analyses was performed on PP population i.e.,
FAS (Full Analysis set) of 40 Patient. The primary and
secondary parameters considered for efficacy analysis
were.
RESULTS
In the study 40 patients were screened and 40 patients
were enrolled after meeting the inclusion Criteria and
they were randomised randomly into Treatment- A,
Treatment- B.
Data Sets Analyzed
Table 1: Data sets analyzed for the test and placebo
treatments.
Treatments Placebo Test
Enrolled 20 20
Randomized 20 20
No. of patients completed visit 20 20
Withdrawn 0 0
Efficacy Evaluation
Primary Endpoints
1. Significant Reduction in sign and symptoms of
chronic bronchitis from baseline to EOT
A separate set of analyses were performed to check the
efficacy of Test (A) in comparison to Placebo (B) for
Baseline and EOT values.
I. Evaluation Of Total Severity Score Of Coughing
Between Test (A) & Placebo (B) Comparisons
between the coughing scores were done from baseline
to EOT using ANOVA for both Test-A and Placebo-
B arm, respectively.
For the comparison of coughing scores from baseline to
EOT the p-value was found for ―Test-A vs. Placebo-B‖
as <.0001, which shows that there is a statistically
significant difference among the scores. Considering
Table 05 we can observe that mean change was more for
Test-A arm in comparison to the Placebo-B arm,
respectively and the same has been reflected in Fig. 02
and this proves that Test-A is more efficacious in
alleviating cough in patients as compared to Placebo-B.
Descriptive statistics of coughing
Descriptive Statistics of Coughing
Outcome Test (A) Placebo (B)
Baseline EOT Baseline EOT
Mean value 7.55 2.65 7.70 4.90
Std 1.05 0.99 0.87 0.85
Sem 0.24 0.22 0.19 0.19
Table No 5: Anova for Total Severity Score for coughing between Test (A) & Placebo (B).
Anova for Total severity Score for coughing between Test (A) & Placebo (B)
Drug Code Mean Difference T-Value P-Value 95% Confidence Interval
Test ( A ) -4.90
-6.56 <.0001
(-5.35,-4.44)
Placebo ( B ) -2.80 (-3.25,-2.34)
(A-B) -2.10 (-2.74,-1.45)
Test (A) & Placebo (B)
Fig. 02: Total severity Score for coughing between.

www.ejpmr.com
Harisha. European Journal of Pharmaceutical and Medical Research
511
II. Evaluation Of Total Severity Score For Mucus
Production Between Test (A) & Placebo (B)
Comparisons between the Mucus scores were done
from baseline to EOT using ANOVA for both Test-
A and Placebo-B arm, respectively.
For the comparison of Mucus scores from baseline to
EOT the p-value was found for ―Test-A vs. Placebo-B‖
as <.0001, which shows that there is statistically
significant difference among the scores. Considering
Table 06 we can observe that mean change was more for
Test-A arm in comparison to the Placebo-B arm,
respectively and the same has been reflected in Fig. 03
and this proves that Test-A significantly reduces the
mucous secretion in patients which gives immense relief
as compared to Placebo-B.
Descriptive statistics of Mucus
Descriptive Statistics Of Mucus
Outcome Test (A) Placebo (B)
Baseline EOT Baseline EOT
Mean value 6.10 2.10 5.90 3.55
Std 1.02 0.91 0.85 1.05
Sem 0.23 0.20 0.19 0.24
Table No 6: Anova for Total Severity for Mucus production between Test (A) & Placebo (B).
Anova for Total severity Score of Mucus between TEST(A) & PLACEBO (B)
Drug Code Mean Difference T-Value P-Value 95% Confidence Interval
Test (A) -4.00
-4.71 <.0001
(-4.50, -3.49)
Placebo (B) -2.35 (-2.85, -1.84)
(A-B) -1.65 (-2.35, -0.94)
Fig. 03: Total severity Score of Mucus between TEST (A) & PLACEBO (B).
III. Evaluation Of Total Severity Score Of Wheezing
Or Whistling Sound Between Test (A) & Placebo
(B) Comparisons between the wheezing or whistling
sound scores were done from baseline to EOT using
ANOVA for both Test-A and Placebo-B arm,
respectively.
For the comparison of wheezing or whistling sound
scores from baseline to EOT the p-value was found for
―Test-A vs. Placebo-B‖ as 0.0008, which shows that
there is statistically significant difference among the
scores. Considering Table 07 we can observe that mean
change was more for Test-A arm in comparison to the
Placebo-B arm, respectively and the same has been
reflected in Fig. 04 and this proves that Test-A is highly
efficacious in reduction of wheezing and whizzing sound
in patient’s as compared to Placebo-B.
Descriptive statistics of wheezing or whistling sound
Descriptive Statistics Of Wheezing Or Whistling
Sound
Outcome Test (A) Placebo (B)
Baseline EOT Baseline EOT
Mean value 4.50 3.05 2.55 2.70
Std 2.37 1.40 3.27 2.20
Sem 0.53 0.31 0.73 0.49

www.ejpmr.com
Harisha. European Journal of Pharmaceutical and Medical Research
512
Table No 7: Anova for Total Severity Score of wheezing or whistling sound in the lungs between Test (A) &
Placebo (B).
ANOVA for Total severity Score of Wheezing or whistling sound in the lungs
between TEST (A) & PLACEBO (B)
Drug Code Mean Difference T-Value P-Value 95% Confidence Interval
Test (A) -1.45
-3.64 0.0008
(-2.07, -0.82)
Placebo (B) 0.15 (-0.47, 0.77)
(A-B) -1.60 (-2.49, -0.70)
Fig. 04: Total severity Score of wheezing or whistling sound in the lungs between TEST (A) & PLACEBO (B).
IV. Evaluation of Total Severity Score for Low
Grade Fever Between Test (A) & Placebo (B)
Comparisons between the low fever scores were
done from baseline to EOT using ANOVA for both
Test-A and Placebo-B arm, respectively.
For the comparison of low fever scores from baseline to
EOT the p-value was found for ―Test-A vs. Placebo-B‖
as 0.0001, which shows that there is statistically
significant difference among the scores. Considering
Table 08 we can observe that mean change was more for
Test-A arm in comparison to the Placebo-B arm,
respectively and the same has been reflected in Fig. 05
and this proves that Test-A is more effective in
controlling low grade fever in patients compared to
Placebo-B.
Descriptive statistics of Low fever.
Descriptive Statistics Of Low Fever
Outcome Test (A) Placebo (B)
Baseline EOT Baseline EOT
Mean value 4.30 1.00 6.05 4.25
Std 1.08 0.00 1.10 0.44
Sem 0.24 0.00 0.25 0.10
Table No 8: ANOVA for Total Severity Score for Low grade fever between TEST (A) & PLACEBO (B).
ANOVA for Total severity Score of Low grade fever between TEST(A) & PLACEBO (B)
Drug Code Mean Difference T-Value P-Value 95% Confidence Interval
Test (A) -3.30
-4.34 0.0001
(-3.79, -2.80)
Placebo (B) -1.80 (-2.29, -1.30)
(A-B) -1.50 (-2.19, -0.80)
Fig. 05: Total severity Score of Signs and symptoms Low fever between TEST (A) & PLACEBO (B).

www.ejpmr.com
Harisha. European Journal of Pharmaceutical and Medical Research
513
V. Evaluation of total severity score for chest
discomfort between test (a) & placebo (B)
Comparisons between the chest discomfort scores
were done from baseline to EOT using ANOVA for
both Test-A and Placebo-B arm, respectively.
For the comparison of chest discomfort scores from
baseline to EOT the p-value was found for ―Test-A vs.
Placebo-B‖ as 0.0006, which shows that there is
statistically significant difference among the scores.
Considering Table 09 we can observe that mean change
was more for Test-A arm in comparison to the Placebo-B
arm, respectively and the same has been reflected in Fig.
06 and this proves that Test-A is more effective in
alleviating the symptoms of chest discomfort in patients
and this can be correlated with reduction in mucous
secretion and cough symptom as compared to Placebo-B.
Descriptive statistics of chest discomfort.
Descriptive Statistics Of Chest Discomfort
Outcome Test (A) Placebo (B)
Baseline EOT Baseline EOT
Mean value 3.70 1.15 1.95 1.60
Std 1.98 0.37 2.48 0.88
Sem 0.44 0.08 0.56 0.20
Table No 9: ANOVA for Total Severity Score of Chest discomfort between TEST (A) & PLACEBO (B).
ANOVA for Total severity Score of Chest discomfort between TEST (A) & PLACEBO (B)
Drug Code Mean Difference T-Value P-Value 95% Confidence Interval
Test (A) -2.55
-3.77 0.0006
(-3.38, -1.71)
Placebo (B) -0.35 (-1.18, 0.48)
(A-B) -2.20 (-3.38, -1.01)
Fig. 06: Total severity Score of by Subjective Chest discomfort between TEST (A) & PLACEBO (B).
VI. Evaluation of total severity score for of shortness
of breath between TEST (A) & PLACEBO (B)
Comparisons between the shortness of breath scores
were done from baseline to EOT using ANOVA for
both Test-A and Placebo-B arm, respectively.
For the comparison of shortness of breath scores from
baseline to EOT the p-value was found for ―Test-A vs.
Placebo-B‖ as 0.0022, which shows that there is
statistically significant difference among the scores.
Considering Table 10 we can observe that mean change
was more for Test-A arm in comparison to the Placebo-B
arm, respectively and the same has been reflected in Fig.
07 and this proves that Test-A is more efficacious in
reducing the symptoms as compared to Placebo-B.
Descriptive statistics of shortness of breath
Descriptive statistics of shortness of breath
Outcome TEST (A) PLACEBO (B)
Baseline EOT Baseline EOT
Mean value 3.95 1.20 3.80 1.90
Std 1.00 0.41 0.70 0.72
Sem 0.22 0.09 0.16 0.16
Table No 10: ANOVA for Total Severity Score of Shortness of breath between TEST (A) & PLACEBO (B).
ANOVA for Total severity Score of Shortness of breath between TEST (A) & PLACEBO (B)
Drug Code Mean Difference T-Value P-Value 95% Confidence Interval
Test (A) -2.75
-3.28 0.0022
(-3.12, -2.37)
Placebo (B) -1.90 (-2.27, -1.52)
(A-B) -0.85 (-1.37, -0.32)

www.ejpmr.com
Harisha. European Journal of Pharmaceutical and Medical Research
514
Fig. 07: Total severity Score of Shortness of breath between TEST (A) & PLACEBO (B).
VII. Evaluation of total severity score of cold
symptoms between TEST (A) & PLACEBO (B)
Comparisons between the cold symptoms scores
were done from baseline to EOT using ANOVA
for both Test-A and Placebo-B arm, respectively.
For the comparison of cold symptoms scores from
baseline to EOT the p-value was found for ―Test-A vs.
Placebo-B‖ as <.0001, which shows that there is
statistically significant difference among the scores.
Considering Table 11 we can observe that mean change
was more for Test-A arm in comparison to the Placebo-B
arm, respectively and the same has been reflected in Fig.
08 and this proves that Test-A is more effective in
reducing all the symptoms of cold like fatigue, watery
eyes and running nose in patient’s as compared to
Placebo-B.
Descriptive statistics of cold symptoms.
Descriptive Statistics Of Cold Symptoms
Outcome Test (A) Placebo (B)
Baseline EOT Baseline EOT
Mean value 6.65 2.45 6.80 4.75
Std 1.04 0.89 1.06 0.91
Sem 0.23 0.20 0.24 0.20
Table No 11: ANOVA for Total Severity Score of Cold symptoms between TEST (A) & PLACEBO (B).
Fig. 08: Total severity Score of Cold symptoms between TEST (A) & PLACEBO (B).
VIII. Evaluation of total severity score for sign and
symptoms of frequent respiratory infections
between TEST (A) & PLACEBO (B) Comparisons
between the frequent respiratory infections scores
were done from baseline to EOT using ANOVA for
both Test-A and Placebo-B arm, respectively.
For the comparison of Frequent respiratory infections
scores from baseline to EOT the p-value was found for
―Test-A vs. Placebo-B‖ as <.0001, which shows that
there is statistically significant difference among the
scores. Considering Table 12 we can observe that mean
change was more for Test-A arm in comparison to the
Placebo-B arm, respectively and the same has been
ANOVA for Total severity Score of Cold symptoms between TEST(A) & PLACEBO (B)
Drug Code Mean Difference T-Value P-Value 95% Confidence Interval
Test (A) -4.20
-6.04 <.0001
(-4.70, -3.69)
Placebo (B) -2.05 (-2.55, -1.54)
(A-B) -2.15 (-2.87, -1.42)

www.ejpmr.com
Harisha. European Journal of Pharmaceutical and Medical Research
515
reflected in Fig. 09 and this proves that Test-A is more
efficacious in reducing the episodes of frequent
respiratory tract infections before and after treatment as
compared to Placebo-B.
Descriptive statistics of frequent respiratory infections.
Descriptive Statistics of Frequent Respiratory Infections
Outcome Test (A) Placebo (B)
Baseline EOT Baseline EOT
Mean value 6.20 2.70 6.15 4.90
Std 0.83 1.22 0.93 0.85
Sem 0.19 0.27 0.21 0.19
Table No 12: ANOVA for Total Severity Score of Signs and symptoms frequent respiratory infections between
TEST (A) & PLACEBO (B).
ANOVA for Total severity Score of Signs and symptoms Frequent respiratory
infections between TEST(A) & PLACEBO(B)
Drug Code Mean Difference T-Value P-Value 95% Confidence Interval
Test (A) -3.50
-5.07 <.0001
(-4.13, -2.86)
Placebo (B) -1.25 (-1.88, -0.61)
(A-B) -2.25 (-3.14, -1.35)
Fig. 09: Total severity Score of Signs and symptoms Frequent respiratory infections between TEST (A) &
PLACEBO (B).
IX. Evaluation of total severity score for sign and
symptoms of blue skin discoloration between
TEST (A) & PLACEBO (B) There were no
symptoms reported for the Blue skin discoloration
for both Test-A and Placebo-B arm. So we were not
able to perform any statistical analysis for this
efficacy parameter.
2. Chest X-ray analysis from baseline to end of
treatment Change in chest X-ray score for Test – A & Placebo - B
arms were assessed from X-ray reports independently.
As per Table 13A, it is evident that, 17 patient’s X-ray
report was clinically abnormal and 3 patient’s X-ray
report was normal at Baseline but at the End of
Treatment all patient’s X-ray reports were normal in Test
(A) arm, whereas all 20 patient’s X-ray report was
abnormal NCS at Baseline but at the End of Treatment
only 9 patient’s X-ray report were normal in Placebo (B)
arm (Table 13B & Fig. 11).
At end of the treatment p-value was found as <.0001
which shows that there is a statistically significant
association between Test-A & Placebo-B in comparison
to the normal and abnormal events.
Considering Table 13(A), 13(B) & 13(C) we can observe
that change in chest X-ray score from X-ray report was
more for Test-A arm as compared to Placebo-B arm,
respectively and the same has been reflected in Fig. 11.
So, this evidences the superiority of Test (A) over
Placebo (B).
Table No 13(A): Analysis of Change in Chest X ray findings from Baseline to the EOT (Test = A).
Analysis of Change in Chest X ray findings from Baseline to the EOT (Test = A)
Outcome Baseline EOT
Abnormal NCS 17 0
Normal 3 20

www.ejpmr.com
Harisha. European Journal of Pharmaceutical and Medical Research
516
Table No 13(B): Analysis of Change in Chest X ray findings from Baseline to the EOT (Placebo= B).
Analysis of Change in Chest X ray findings from Baseline to the EOT (Placebo =B B)
Outcome Baseline EOT
Abnormal NCS 20 11
Normal 0 9
Table No 13(C): Analysis of Change in Chest X ray findings at EOT between Test (A) and Placebo (B).
Analysis of Change in Chest X ray findings at EOT between TEST(A) and PLACEBO(B)
Outcome Abnormal NCS Normal P- value
Test (A) 0 20 <.0001
Placebo (B) 11 9
Fig. 10: Analysis of Change in Chest X ray findings at EOT between TEST (A) and PLACEBO (B).
3. Improvement in Immunity (Total IgG, IgM & IgE
to see improvement in immunity from baseline to end
of treatment)
I. Improvement in Immunity (IgG)
Improvement in Immunity Score of IgG for Test – A &
Placebo - B arms were assessed from lab report
independently. As per Table 14A, it is evident that, 9
patient’s Immunity report of IgG was clinically abnormal
and 11 patient’s Immunity report of IgG was normal at
Baseline but at the End of Treatment all patient’s
Immunity report of IgG were normal in Test (A) arm,
whereas 12 patient’s Immunity report of IgG was
abnormal NCS at Baseline but at End of Treatment only
8 patient’s Immunity report of IgG were normal in
Placebo (B) arm (Table 14B & Fig.12).
At end of the treatment p-value was found as <.0001
which shows that there is statistically significant
association between Test-A & Placebo-B in comparison
to the normal and abnormal events.
Considering Table 14(A), 14(B) & 14(C) we can observe
that improvement in patient’s immunity (IgG) was more
for Test-A arm in comparison to the Placebo-B arm,
respectively and the same has been reflected in Fig. 12.
So, this evidences the superiority of Test (A) over
Placebo (B).
Table No 14(A): Improvement in Immunity (IgG)
from Baseline to the EOT (Test= A).
Improvement in Immunity(IgG) (Test = A)
Outcome Baseline EOT
Abnormal NCS 9 0
Normal 11 20
Table No 14(B): Improvement in Immunity (IgG)
from Baseline to the EOT (Placebo= B).
Improvement in Immunity(IgG) (Placebo = B)
Outcome Baseline EOT
Abnormal NCS 12 12
Normal 8 8
Table No 14(C): Improvement in Immunity (IgG) at EOT between TEST (A) and PLACEBO (B).
Improvement in Immunity(IgG) at EOT between TEST(A) and PLACEBO(B)
Outcome Abnormal NCS Normal P- value
Test (A) 0 20 <.0001
Placebo (B) 12 8

www.ejpmr.com
Harisha. European Journal of Pharmaceutical and Medical Research
517
Fig. 11: Improvement in Immunity (IgG) at EOT between TEST (A) and PLACEBO (B).
II. Improvement in Immunity (IgM)
Improvement in Immunity Score of IgM for Test – A &
Placebo - B arms were assessed from lab report
independently. As per Table 15A, it is evident that, 12
patient’s Immunity report of IgM was clinically
abnormal and 8 patients Immunity report of IgM was
normal at Baseline but at the End of Treatment all
patient’s Immunity report of IgM were normal in Test
(A) arm, whereas 10 patient’s Immunity report of IgM
was abnormal NCS at Baseline but at the End of
Treatment only 10 patient’s Immunity report of IgM
were normal in Placebo (B) arm (Table 15B & Fig. 13).
At end of the treatment p-value was found as 0.0003
which shows that there is statistically significant
association between Test-A & Placebo-B in comparison
to the normal and abnormal events.
Considering Table 15(A), 15(B) & 15(C) we can observe
that improvement in patient’s immunity (IgM) was more
for Test-A arm in comparison to the Placebo-B arm,
respectively and the same has been reflected in Fig. 13.
So, this evidences the superiority of Test (A) over
Placebo (B).
Table No 15(A): Improvement in Immunity (IgM)
from Baseline to the EOT (Test= A).
Improvement in Immunity(IgM) (Test = A)
Outcome Baseline EOT
Abnormal NCS 12 0
Normal 8 20
Table No 15(B): Improvement in Immunity (IgM)
from Baseline to the EOT (Placebo= B).
Improvement in Immunity(IgM) (Placebo = B)
Outcome Baseline EOT
Abnormal NCS 10 10
Normal 10 10
Table no 15(C): Improvement in Immunity (IgM) at EOT between TEST (A) and PLACEBO (B)
Improvement in Immunity(IgM) at EOT between TEST(A) and PLACEBO(B)
Outcome Abnormal NCS Normal P- value
Test = A 0 20 0.0003
Placebo = B 10 10
Fig. 12: Improvement in Immunity (IgM) at EOT between TEST (A) and PLACEBO (B).
III. Improvement in Immunity (IgE)
Improvement in Immunity Score of IgE for Test – A &
Placebo - B arms were assessed from lab report
independently. As per Table 17A, it is evident that, 7
patients Immunity report of IgE was clinically abnormal
and 13 patients Immunity report of IgE was normal at

www.ejpmr.com
Harisha. European Journal of Pharmaceutical and Medical Research
518
Baseline but at the End of Treatment all patient’s
Immunity report of IgE were normal in Test (A) arm,
whereas 12 patient’s Immunity report of IgE was
abnormal NCS at Baseline but at End of Treatment only
9 patient’s Immunity Score of IgE were normal in
Placebo (B) arm (Table 17B & Fig.14).
At end of the treatment p-value was found as <.0001
which shows that there is statistically significant
association between Test-A & Placebo-B in comparison
to the normal and abnormal events.
Considering Table 17(A), 17(B) & 17(C) we can observe
that improvement in patient’s immunity (IgE) was more
for Test-A arm in comparison to the Placebo-B arm,
respectively and the same has been reflected in Fig. 14.
So this proves the efficacy of Test (A) over Placebo (B).
Table No 16 (A): Improvement in Immunity (IgE)
from Baseline to the EOT (Test= A).
Improvement in Immunity(IgE) (Test = A)
Outcome Baseline EOT
Abnormal NCS 7 0
Normal 13 20
Table No 16(B): Improvement in Immunity (IgE)
from Baseline to the EOT (Placebo= B).
Improvement in Immunity(IgE) (Placebo = B)
Outcome Baseline EOT
Abnormal NCS 12 11
Normal 8 9
Table 16 (C): Improvement in Immunity (IgE) at EOT between TEST (A) and PLACEBO (B)
Improvement in Immunity(IgE) at EOT between TEST(A) and PLACEBO(B)
Outcome Abnormal NCS Normal P- value
Test = A 0 20 <.0001
Placebo = B 11 9
Fig No 13: Improvement in Immunity (IgE) at EOT between TEST (A) and PLACEBO (B).
Secondary Endpoints
Safety analysis was done as per the ADVERSE
EVENTS reported No AEs/ADR was reported which
was related to study drug which confirmed that TEST
drug is safe to be given in human population.
There were 02 (Patient No; 01-009, 01-032) adverse
event was observed during the study, which was resolved
and not related to study drug.
The detail list of adverse events mentioned as follow:
Sub. No Name of AE SAE Onset date Resolved date Intensity Causality Action Taken Outcome of
the events
01-009 Hypertension No 09 Feb 2019 11 Feb 2019 Mild Unlikely Tab. Amlodepin 5mg Resolved
01-032 Hypertension No 15 Apr 2019 17 Apr 2019 Mild Unlikely Tab. Metaprolol 50 mg Resolved
DISCUSSION AND CONCLUSION
Bronchitis is a term that describes inflammation of the
bronchial tubes (bronchi and the smaller branches termed
bronchioles) that results in excessive secretions of mucus
into the tubes, leading to tissue swelling that can narrow
or close off bronchial tubes.
There are several clinical trials which proves that
curcumin has an anti-inflammatory effect by lowering
histamine levels and by possibly increasing the
production of natural cortisone by adrenal glands
additionally. The mechanism of action by which
curcumin shows anti-inflammatory effect is also by
attenuating inflammatory response of TNF-α stimulated
human endothelial cells by interfering with NF-κB.
Furthermore, curcumin is also capable of preventing
platelet-derived growth factor (PDGF).
This study was done on 40 patients with chronic
bronchitis. Patients were selected as per the inclusion

www.ejpmr.com
Harisha. European Journal of Pharmaceutical and Medical Research
519
criteria. It was a double blinded study where patients
were allocated into 2 arms PLACEBO and TEST arm as
per the randomization chart generated.
Efficacy analysis was performed on all 40 patients who
completed the trial. The results obtained from Intra-
Group statistical analyses and Efficacy analyses of
primary endpoints between the TEST and PLACEBO
showed statistically significant improvement in
symptoms of chronic bronchitis and also improving the
immunity of patients in TEST (CURCUMIN) arm.
Safety analysis was done as per the ADVERSE
EVENTS reported. Two AEs which was not related to
TEST drug was reported which confirmed that TEST
drug is safe to be given in human population.
The study concludes that, TEST (CURCUMIN) due to
its anti-inflammatory and immunomodulatory effect it is
more efficacious and safer in comparison to PLACEBO
(B) in treatment of cough due to chronic bronchitis and
also alleviating the symptoms of chronic bronchitis along
with improvement in immunity.
REFERENCES
1. Chow SC, Shao J and Wang H (2003) Sample size
calculations in clinical research. Marcel Dekker.
New York.
2. Indian Council of Medical Research (ICMR).
Ethical Guidelines for Biomedical Research on
Human Participants. New Delhi, India, 2006.
3. International Conference on Harmonisation (ICH),
Guideline for Good Clinical Practice, ICH Topic E6
(R1), (CPMP/ICH/135/95), 2002.
4. International Conference on Harmonisation (ICH),
ICH Harmonised Tripartite Guideline, Guideline for
Good Clinical Practice E6 (R1), 1996.
5. Ministry of Health and Family Welfare (Department
of Health). ―Schedule Y‖, Requirements and
Guidelines for Permission to Import and / or
Manufacture of New Drugs for Sale or to Undertake
Clinical Trials. Drugs and Cosmetics Rules, New
Delhi, 2015.
6. World Medical Association (WMA). Declaration of
Helsinki – Ethical principles for medical research
involving human Patient. 64th WMA General
Assembly, Brazil, 2013.
7. https://www.medicinenet.com/chronic_bronchitis/art
icle.htm
8. http://en.wikipedia.org/wiki/Curcumin
9. https://www.thieme-
connect.com/products/ejournals/pdf/10.1055/s-2006-
960004.pdf
10. https://www.ncbi.nlm.nih.gov/pmc/articles/PMC462
5352/
11. https://www.drugs.com/npp/turmeric.html
12. https://www.ncbi.nlm.nih.gov/pmc/articles/PMC419
0737/
13. Sambaiah, K., Ratankumar, S., Kamanna, V. S.,
Satyanarayana, M. N., Rao, M. V. L. J. Food Sci.
Technol, 1982; 19: 187—190.
14. http://www.chiro.org/LINKS/OUTCOME/Patients_
Global_Impression_of_Change.pdf
15. https://www.ncbi.nlm.nih.gov/pmc/articles/PMC288
0930/
16. https://onlinelibrary.wiley.com/doi/pdf/10.1002/art.1
780400711
17. http://www.err.eg.net/article.asp?issn=1110161X;ye
ar=2018;volume=45;issue=2;spage=43;epage=48;au
last=Kamel.
18. https://emj.bmj.com/content/22/6/429.