Embed Size (px)
Citation preview
Clinical Process Analysis
Ambulatory Operations Project:
Endoscopy Center Summary
April 6, 2013

STAFF
Laurie Kaufman MSN, RN Manager
Gina Aranzamendez MS, RN-BC
Courtney Barnes MBA
Beverly Hayes
Valerie Haywood MBA, BSN, RN
Duke Rohe, IE
Marvetta Walker, MHA, RN Manager Endoscopy

Time Driven Activity Based Costing (TDABC)
• Harvard University Business School– Michael Porter, PhD– Robert Kaplan, PhD
• Institute for Cancer Care Excellence (ICCE)– Thomas Feeley, MD– Heidi Albright, Director– Head & Neck Center Pilot
• Office of Performance Improvement– Process Flow Charting

TDABC & Clinical Process Analysis
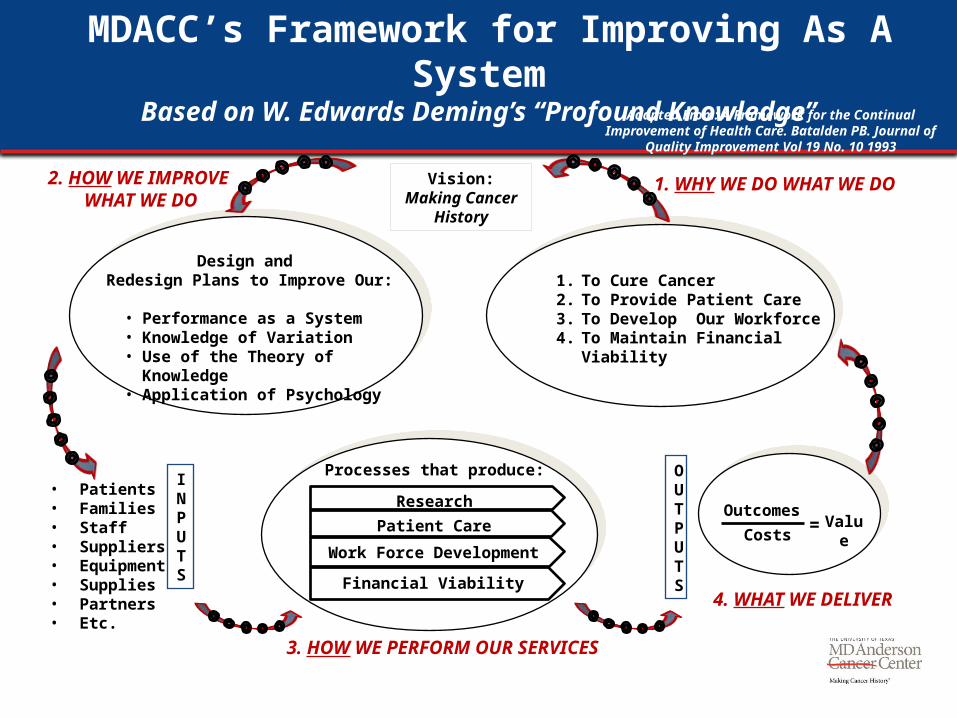
2. HOW WE IMPROVE WHAT WE DO
3. HOW WE PERFORM OUR SERVICES
INPUTS
Outcomes
Costs = Value
Vision:Making Cancer
History
Design and Redesign Plans to Improve Our:
• Performance as a System• Knowledge of Variation• Use of the Theory of Knowledge• Application of Psychology
OUTPUTS
4. WHAT WE DELIVER
• Patients• Families• Staff• Suppliers• Equipment• Supplies• Partners• Etc.
Processes that produce:
Work Force Development
Financial Viability
Patient Care
Research
1. WHY WE DO WHAT WE DO
1. To Cure Cancer2. To Provide Patient Care 3. To Develop Our Workforce4. To Maintain Financial Viability
MDACC’s Framework for Improving As A SystemBased on W. Edwards Deming’s “Profound Knowledge”
Adapted From: A Framework for the Continual Improvement of Health Care. Batalden PB. Journal of Quality Improvement
Vol 19 No. 10 1993

Clinical Process Analysis
Program Aim: Create a comprehensive visual display of current work processes for analysis to drive improvement in clinical quality & financial performance.
INPUTS
Current Work Activities
Clinical Leadership
Content Experts
Clinical Process Analysis Team
OUTPUTS Process Flow Charts
In-sync Data Reporting
Direct Labor Costs
Opportunities for Improvement
Embed QI Knowledge
Workforce Engagement
PI Projects
• Create a shared sense of the future • Align with strategic goals • Develop clearly defined aim and scope • Engage all levels of leadership support • Avoid competing priorities w/optimal scheduling in roll-out • Create two-way communication • Instill psychological safety for staff to share current processes
• Mobilize clinicians to make changes needed for healthcare (Berwick, 2011) • Capture the voice of the patient (Institute of Healthcare Improvement) • Illustrate frontline reality (James, 2012) • Align data reporting to frontline processes (James, 2012)
Precursory Work
Weekly Interviews
Summary &
Evaluation
PHASE I PHASE II PHASE III
Why do this? How to do this?
The Process
Performance Improvement Phase
The Office of Performance Improvement, © 2012 The University of Texas MD Anderson Cancer Center
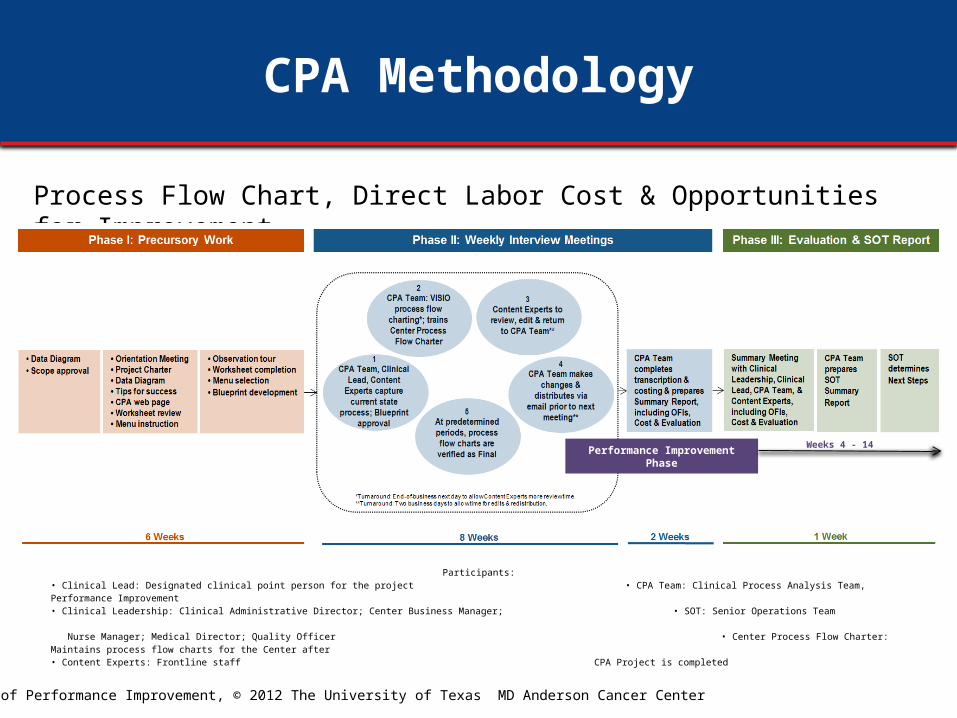
Process Flow Chart, Direct Labor Cost & Opportunities for Improvement
CPA Methodology
Participants:• Clinical Lead: Designated clinical point person for the project • CPA Team: Clinical Process Analysis Team, Performance Improvement • Clinical Leadership: Clinical Administrative Director; Center Business Manager; • SOT: Senior Operations Team
Nurse Manager; Medical Director; Quality Officer • Center Process Flow Charter: Maintains process flow charts for the Center after • Content Experts: Frontline staff CPA Project is completed
Performance Improvement PhaseWeeks 4 - 14
The Office of Performance Improvement, © 2012 The University of Texas MD Anderson Cancer Center
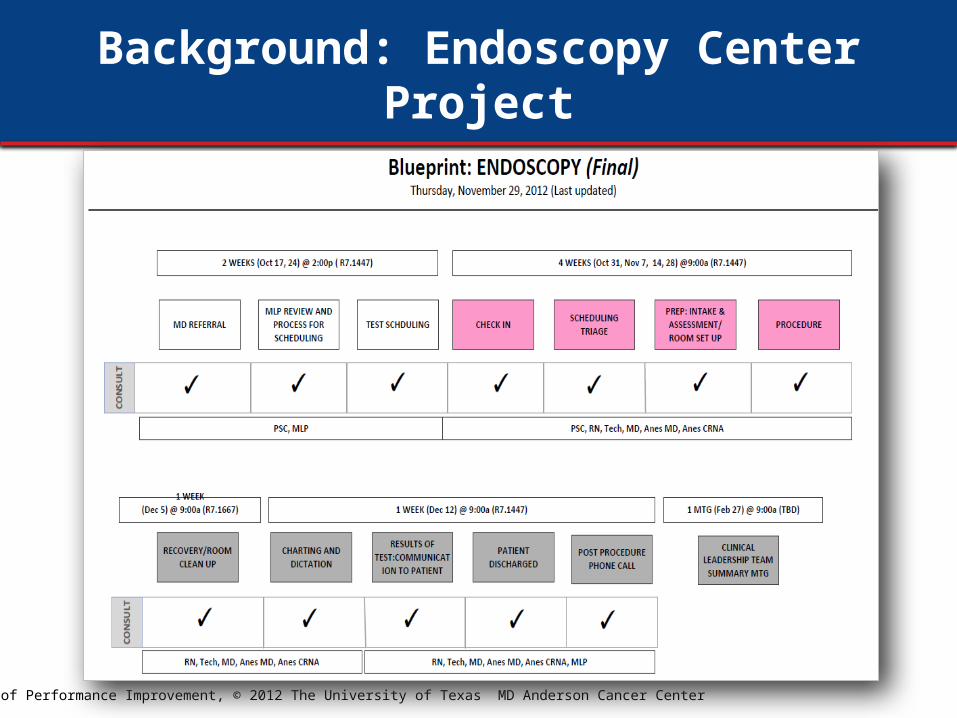
Background: Endoscopy Center Project
• Center Variation
• Scope Development

The Office of Performance Improvement, © 2012 The University of Texas MD Anderson Cancer Center

The Office of Performance Improvement, © 2012 The University of Texas MD Anderson Cancer Center

The Office of Performance Improvement, © 2012 The University of Texas MD Anderson Cancer Center

Process Flow Charts

Aligning Data to Frontline Processes &
Elements of a Process Flow Chart

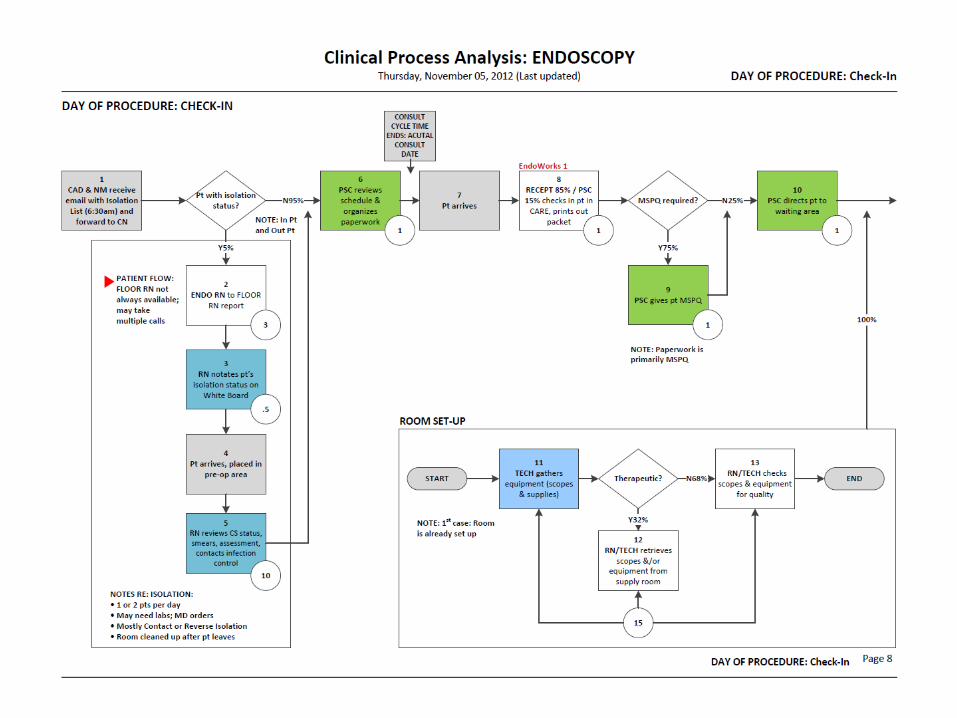


Direct Labor Cost
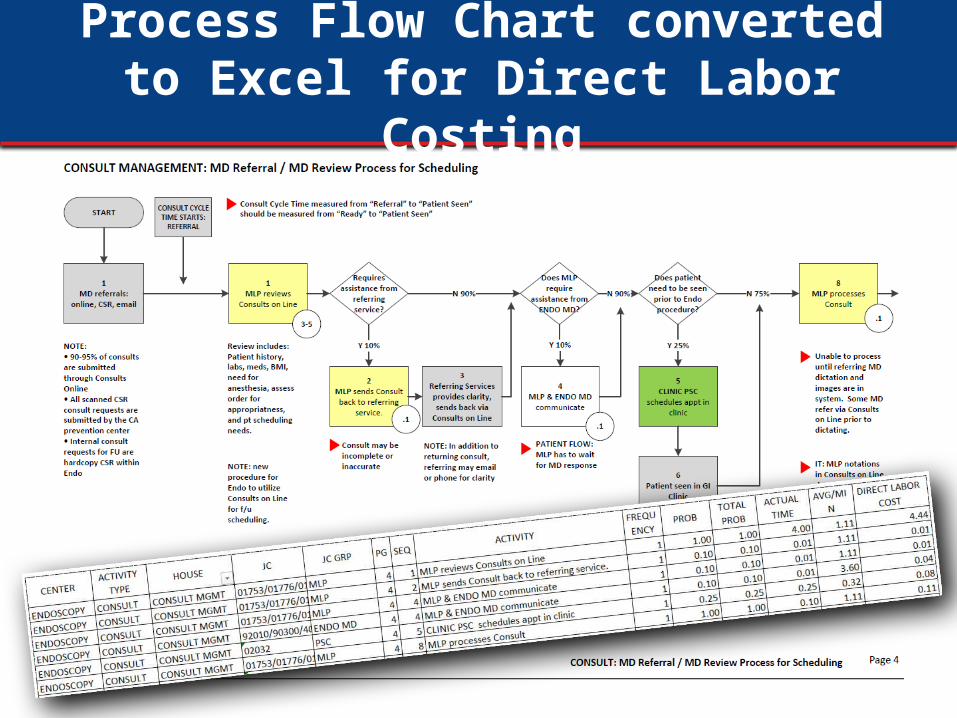
Process Flow Chart converted to Excel for Direct Labor Costing

Costing
• Salaries based on FY 2012 from ResourceOne
• Data based on information captured in process flow charts from 10.17.2012 – 12.12.12
• Based on estimated times given by frontline staff in the Endoscopy Center
• Salaries in this report are average adjusted hourly rates including fringe
• Salaries for each Job Code Group are blended by utilizing FTEs to weight the averages:
• MD- Professor, Associate Professor, Assistant Professor• PSC- Lead Services Coord, Patient Services Coord• MLP- APN and APN supervisor
• Data is reported per patient
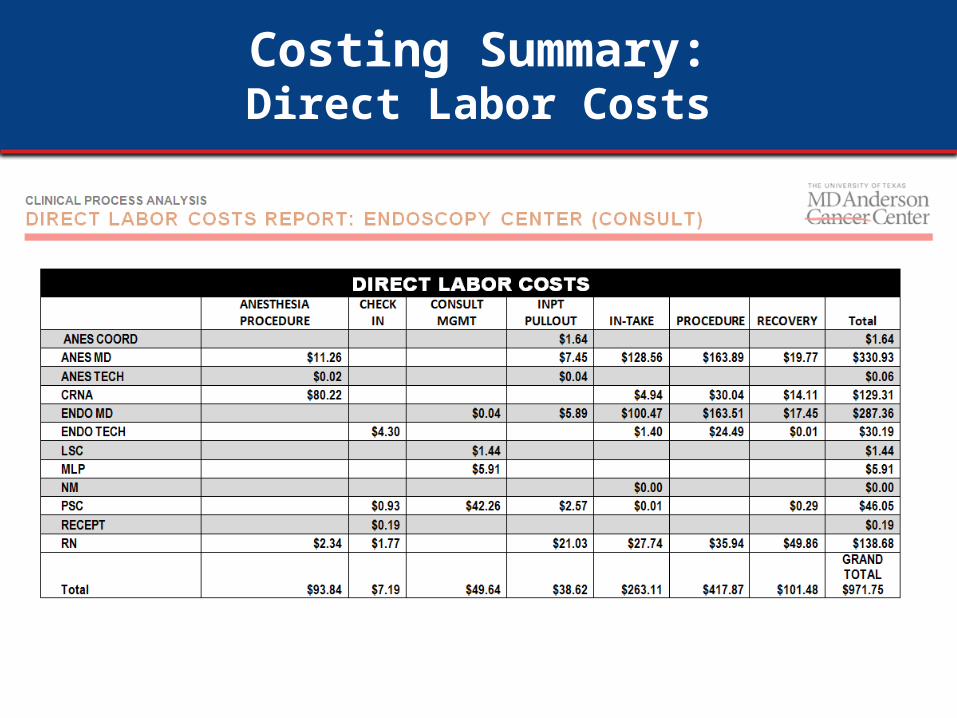
Costing Summary:Direct Labor Costs
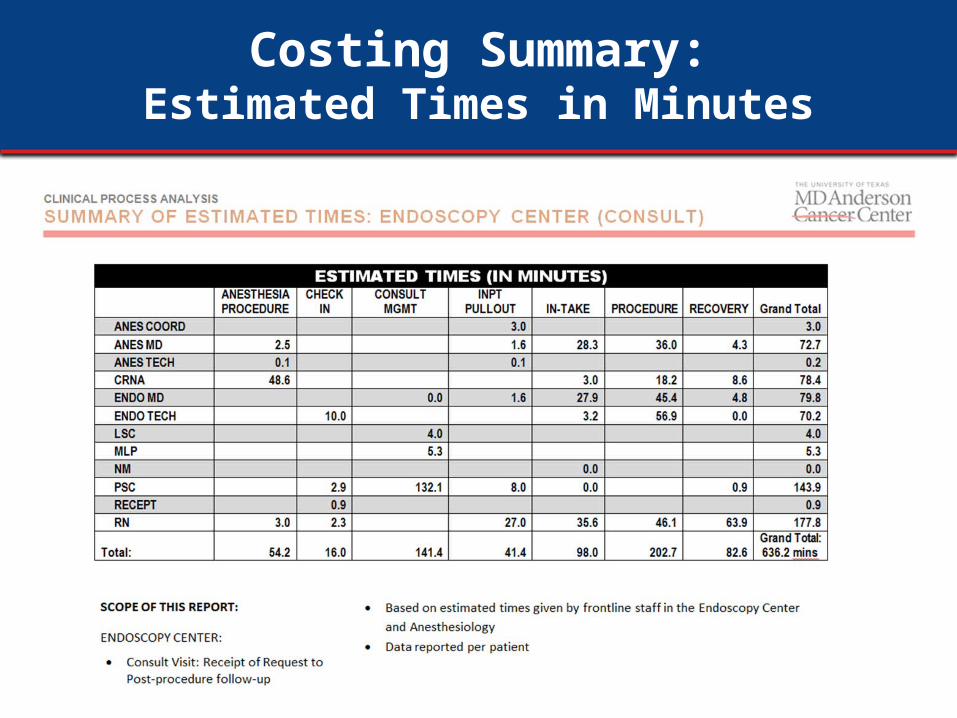
Costing Summary:Estimated Times in Minutes
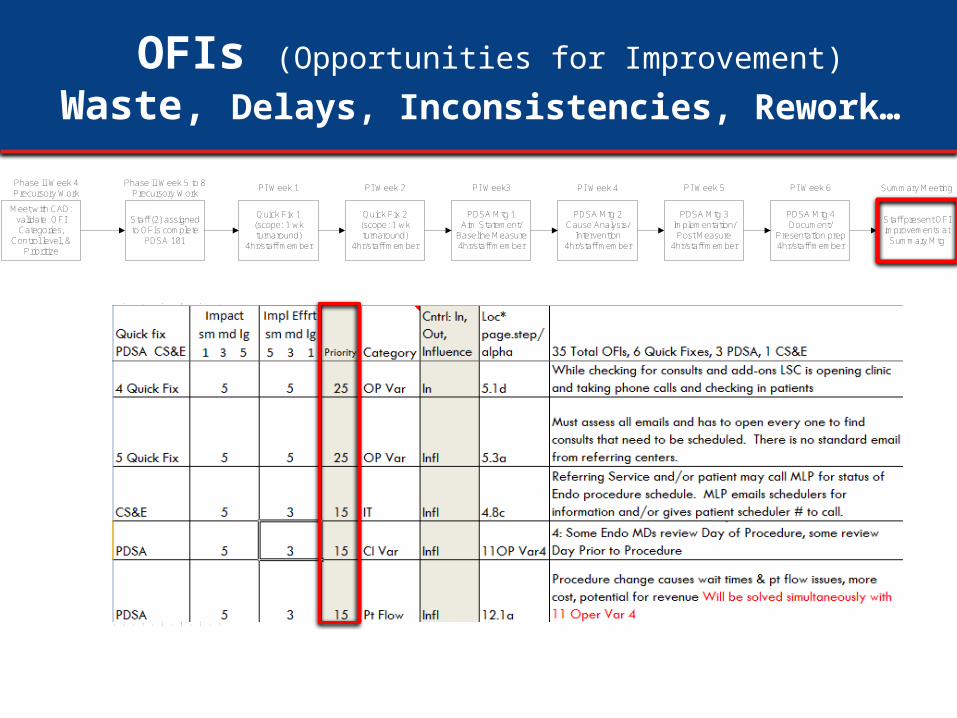
OFIs (Opportunities for Improvement)
Waste, Delays, Inconsistencies, Rework…
Meet with CAD: validate OFI Categories,
Control level, & Prioritize
Staff (2) assigned to OFIs complete
PDSA 101
Phase II Week 4 Precursory Work
Phase II Week 5 to 8Precursory Work
Quick Fix 1 (scope: 1 wk turnaround)
4hr/staff member
Quick Fix 2 (scope: 1 wk turnaround)
4hr/staff member
PI Week 1 PI Week 2
PDSA Mtg 1Aim Statement/
Baseline Measure4hr/staff member
PDSA Mtg 2Cause Analysis/
Intervention4hr/staff member
PDSA Mtg 3Implementation/Post Measure
4hr/staff member
PDSA Mtg 4Document/
Presentation prep4hr/staff member
PI Week3 PI Week 4 PI Week 5 PI Week 6
Staff present OFI improvements at
Summary Mtg
Summary Meeting

SharePoint Site for Project Storage
• Provides storage for project work-ups• Available for bench-marking• Easy placement in Quality Project database

OFI Summary
• Total OFIs: 53
• OFIs in department's control: 6
• OFIs out of department's control: 14
• OFIs within department's influence: 33

OFI Projects
6 Quick Fixes 8 PDSA 1 CS&E
1. Ready Call pagers2. Consult processing/patient check-in3. Optimization of Endoscopy Online Consult
Health questionnaire 4. Bedside consenting
5. Nurse sedation practices
6. Guidelines for scheduling an Endoscopy
procedure
7. Physician notification process for patient
cancellation or reschedule
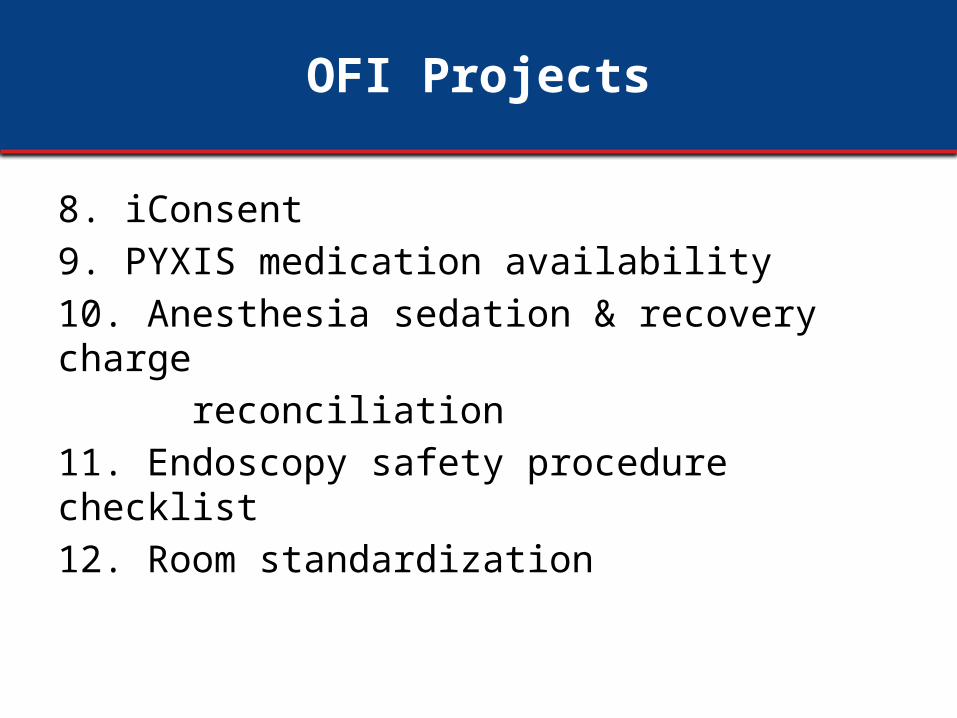
OFI Projects
8. iConsent
9. PYXIS medication availability
10. Anesthesia sedation & recovery charge
reconciliation
11. Endoscopy safety procedure checklist
12. Room standardization