Embed Size (px)
Citation preview

CLINICAL PHARMACOLOGYBIOPHARMACEUTICS REVIEW DRUG Risperidone PRIMARY REVIEWER Andre Jackson NDA 2027220588 TYPE NDA FORMULATION Oral Tablet STRENGTH 025mg 05mg 1 mg
2mg 3mg and 4mg APPLICANT Johnson and Johnson Submission DatesDecember 22 2006
INDICATIONS Schizophrenia Bipolar Disorder
TABLE OF CONTENTS
Executive Summary 2 Introduction 2 Summary 3 COMMENTS TO MEDICAL REVIEWER 3 Objective of the analysis 3 Methods 4
Overview of Study Designs 4 ASSAY VALIDATION 4
Analytical 4 Study RIS-BIM-301- (STUDY 1) CHILDREN AND ADOLESCENTS (10-17 YEARS) 5 STUDY RIS-USA-231 (STUDY 2) ADOLESCENTS 7 STUDY RIS-USA-160 (STUDY 3)- CHILDREN AND ADOLESCENTS 9 STUDY RIS-USA-239-(STUDY 4)-ADULTS 10 STUDY RIS-IND-2 (STUDY 5) ADULTS 12 STUDY RIS-IND25-(STUDY 6)- ADULTS 13 STUDY RIS-P01-103-(STUDY 7)- ADULTS 15 STUDY RSA-5-(STUDY 8)- ADULTS 19 STUDY R076477-SCH-102 STUDY 9- ADULTS 21
PHARMACOKINETIC ANALYSIS 24 Planned Analysis for Risperidone and the Active Moiety 25
IDENTIFICATION OF OUTLIERS 25 DERIVED TRANSFORMED AND MISSING DATA 26 POPULATION MODELING 27
MODEL QUALIFICATION 27 ESTIMATION METHOD 27 STRUCTURAL MODEL SELECTION 28 Statistical Model Selection 29 Covariate Analysis 30 Final PK Model on Index Dataset 31 FINAL PK MODEL AND EFFECT OF CO-MEDICATIONS 31 Model-Based Simulations 32
RESULTS 32 Demographic and Baseline Characteristics 32
FIRMrsquoS ANALYSIS 34 ACTIVE MOIETY INDEX DATA SET 34
MODEL QUALIFICATION 36 EFFECT OF CO-MEDICATIONS 38
FINAL PK MODEL OF THE ACTIVE MOIETY ndash FULL DATASET 38 SIMULATIONS 41 RISPERIDONE INDEX DATA SET 44
1
Pharmacokinetic Parameters 44 COVARIATE SELECTION ndash INDEX DATASET 46 Model Qualification 48 Effect of Co-Medications 50
FINAL PK MODEL OF RISPERIDONE ndash FULL DATASET 51 FDA ANALYSIS 58
BASE MODEL -ACTIVE-MOIETY 58 FINAL MODEL ACTIVE MOIETY 59 BASE MODEL - RISPERIDONE 61
DISCUSSION 63 FIRMrsquoS PROPOSED LABEL 64 FDA LABEL 66 SIGNATURES 69
EXECUTIVE SUMMARY
A study was done combining data from several centers in children and adolescents ages 5-18 yrs to determine if the pharmacokinetics were similar or different from that previously observed in adults The study data from 3 study sites were analyzed by mixed effects modeling to identify any important covariates which impacted Risperidone pharmacokinetics in adolescents These results were contrasted with those in adults The study results indicated that weight normalized mean exposure based upon trough levels prior to dosing in children adolescents and adults was comparable Pharmacokinetics of the active moiety (risperidone + 9-hydroxy risperidone) and risperidone alone are comparable in children (less than 12 years) adolescents (12 to 17 years) and adults after correction for body weight The recommended dose for
(b) (4)schizophrenia is QD while that for bipolar should be initiated at 05 mg QD with adjustments of 05-1 mgday as tolerated to a recommended dose of 25 mgday Based on the final results and the lack of a dose response no dose adjustments based on body weight are warranted in children and adolescents (between 10-17 years)
INTRODUCTION
Risperidone is completely absorbed after oral administration reaching peak plasma concentrations within 1 to 2 hours The absorption is not affected by food and thus risperidone can be given with or without meals Risperidone is metabolized by CYP2D6 to 9-hydroxy-risperidone which has a similar pharmacological activity as risperidone Risperidone plus 9-hydroxy-risperidone form the active antipsychotic fraction (active moiety) Another metabolic pathway of risperidone is N-dealkylation Risperidone is subject to CYP2D6-mediated genetic polymorphism Extensive metabolizers (EMs) convert risperidone rapidly into 9-hydroxy-risperidone while poor metabolizers (PMs) convert it much more slowly EMs therefore have
2
lower risperidone and higher 9-hydroxy-risperidone concentrations than PMs The PK of the active moiety after single and multiple doses are similar in EMs and PMs of CYP2D6
After oral administration to psychotic patients risperidone is eliminated with a half-life of about 3 hours The elimination half-life of 9-hydroxy-risperidone and of the active moiety is 24 hours Steady-state of risperidone is reached within 1 day in most patients Steady state of 9-hydroxy-risperidone is reached within 4-5 days of dosing Risperidone plasma concentrations are dose-proportional in the dose-range of 1 to 16 mg daily (05 to 8 mg bid) Risperidone is rapidly distributed The volume of distribution is 1 to 2 Lkg In plasma risperidone is bound to albumin and alpha1-acid glycoprotein The plasma protein binding of risperidone is 88 while that of 9-hydroxyshyrisperidone is 77
SUMMARY
Based on the current population PK analysis pharmacokinetics of the active moiety and risperidone are comparable in children (less than 12 years) adolescents (12 to 17 years) and adults after correction for body weight Based on the final results of the covariate analysis for the active moiety no dose adjustments based on body weight are warranted in children and adolescents (between 10-17 years)
COMMENTS TO MEDICAL REVIEWER
1 Pharmacokinetics of the active moiety (risperidone + 9-hydroxy risperidone) and risperidone alone are comparable in children (less than 12 years) adolescents (12 to 17 years) and adults after correction for body weight
2 Because of the lack of a dose response fixed dosing regimens are acceptable to OCP for schizophrenia or for bipolar I disorder
OBJECTIVE OF THE ANALYSIS
The objectives of the population PK analysis of risperidone and the active moiety were bull To get estimates of the typical PK parameters of risperidone and the active moiety in the target populations and of their inter- and intraindividual variability bull To evaluate the effect of patientsrsquo demographic characteristics and other covariates on the PK of risperidone and the active moiety bull To compare the PK of risperidone and the active moiety between childrenadolescents and adults
3
METHODS
Overview of Study Designs
The current analysis consisted of modeling the PK of risperidone and of the active moiety separately in a pooled database including children adolescents and adults with bipolar I disorder or schizophrenia following oral administration of risperidone The following studies were used
STUDY STUDY DEMOGRAPHICS FORMULATION 1 RIS ndashBIM-301 CHILDREN AND 025MG-4 MG
ADOLESCENTS (10-17 TABLETS YRS)
2 RIS-USA-231 ADOLESCENTS 01 MGL AND (13-17 YRS) 10 MGML
SOLN 3 RIS-USA-160 CHILDREN AND 001 TO 008
ADOLESCENTS (5 to lt12 YRS) (b) (4)
(12 to lt 18 YRS) 4 RIS-USA-239 ADULTS TABLET 5 RIS-IND-2 ADULTS TABLET 6 RIS-IND-25 ADULTS (b) (4)
ABLET T7 RIS-P01-103 ADULTS TABLET 8 RIS-RSA-5 ADULTS TABLET 9 R076477-SCH-102 ADULTS TABLET
mgkg
TABLETS
The 1-mgmL oral solution is bioequivalent to the marketed 1-mg tablet The marketed 1-mg tablet when given as 2x1 mg or 4x1 mg tablets is bioequivalent to marketed 2-mg and 4-mg risperidone tablets Bioequivalence was also shown between the 05-mg research tablet (when given as 2x05 mg tablets) and the 1shymg marketed risperidone tablet
ASSAY VALIDATION ANALYTICAL
Two moieties were analyzed Risperidone and 9-hydroxy-risperidone
4
Risperidone and active moiety (Risperidone + 9-hydroxy-risperidone) levels were reported
(b) (4)
Study RIS-BIM-301- (STUDY 1) CHILDREN AND ADOLESCENTS (10shy17 YEARS)
Objective assess the efficacy safety tolerability and PK of two dosage ranges of risperidone monotherapy (05 to 25 mgday and 3 to 6 mgday) versus placebo and explore the PKPD relationship to efficacy and safety
Population 169 enrolled (58 placebo and 101 risperidone) children and adolescents (10-17 years) with a DSM-IV diagnosis of Bipolar I disorder experiencing a manic or mixed episode (Young Mania Rating Scale ge20)
Design randomized placebo-controlled double-blind 3-arm multicenter Phase 3 study The study was composed of a screening phase (with a
5
(b) (4)
STUDY RIS-USA-231 (STUDY 2) ADOLESCENTS
Objective assess the efficacy safety tolerability and PK of risperidone during 8 weeks randomized double-blind parallel-group multicenter study in adolescents (aged 13-17 years) with schizophrenia and suffering from an acute episode of treatment and to explore the PKPD relationship to efficacy and safety
Population 279 enrolled adolescents with schizophrenia
Design randomized double-blind parallel-group multicenter Phase 3 study
Subjects were randomized to receive 1 of 2 risperidone treatments low dose (lt50 kg 0007-0012 mgkgday gt50 kg 035-06 mgday) and high dose (lt50 kg 007-012 mgkgday gt50 kg 35-6 mgday) (dose range post protocol amendment 3) Study medication was provided as an oral solution containing risperidone at concentrations of either 01 mgmL or 1 mgmL Study
7
(b) (4)
STUDY RIS-USA-160 (STUDY 3)- CHILDREN AND ADOLESCENTS
Objective determine the PK and safety of risperidone (001 to 008 mgkgday bid dosing) 9-hydroxy-risperidone and of the active moiety at steady state
Population 24 children and adolescents (aged 5 years to less than 18 years)
Design open-label multicenter Phase 1 study with 2 periods screeningrun-in (7 to 30 Days) ie a maintenance dose of risperidone and a single day for PK monitoring and check-out
The subjects were divided into 2 groups 12 children (aged 6-11 years and weighing between 20-61 kg) and 12 adolescents (aged 12-16 years and weighing between 33-92 kg) A complete urinary output was also collected from 0 to 6 hours and from 6 to 12 hours after dosing Subjects were phenotyped for CYP2D6 using the risperidone metabolic ratio (ie AUCτssrisperidoneAUCτss9-hydroxy-risperidone) and genotyped for CYP2D6 Subjects with a risperidone metabolic ratio higher than 1 were categorized as PMs for CYP2D6 and subjects with a ratio of less than 1 as EMs for CYP2D6 The daily dose of risperidone ranged between 025 - 15 mg bid for children and between 075 - 175 mg bid for adolescents or expressed per kg body weight equivalent to a range of 0024 - 0074 mgkgday (mean 0049 mgkgday) for children and 0016 - 0076 mgkgday (mean 0041 mgkgday) for adolescents
9
Blood samples were collected immediately before (0 hour) and 2 4 8 and 12 hours after the morning dose on the PK monitoring day
ANALYTICAL STUDY RIS-USA-160-STUDY 3 starting date completion date
(b) (4)
STUDY RIS-USA-239-(STUDY 4)-ADULTS
Objective assess the efficacy safety tolerability and PK of dosage range (1
10
(b) (4)
STUDY RIS-IND-2 (STUDY 5) ADULTS
Objective To assess the efficacy and safety of risperidone dosage range (1 to 6 mgday)compared with placebo during 3 weeks of treatment in subjects with Bipolar I disorder suffering a manic or mixed episode The primary efficacy measure was the change in mean YMRS total score from baseline to endpoint
Population 290 treated (144 placebo 146 risperidone) adult patients with Bipolar I Disorder who are suffering a manic or mixed episode
Design randomized placebo-controlled double-blind parallel-group multicenter Phase 3 study A flexible doses of risperidone (1 to 6 mgday) or placebo were administered after dose escalation Randomized patients were stratified by the presence or absence of psychotic features at baseline and by center Following randomization and the initiation of double-blind study drug therapy a minimum of 7 full days of inpatient hospitalization was required Subjects assigned to the risperidone treatment group received a single 3-mg dose on Day 1
Sampling
Sparse PK samples were taken on week 1 and week 3 All blood for PK samples were drawn immediately before the intake of trial medication (predose) except that on Day 7 a second sample was to be drawn post-dose at least 1 hour after the first withdrawal
ANALYTICAL
RIS-IND-2 STUDY=5
12
Trial dates Start 12 Mar 2001 ⎜ end 24 Dec 2001 Study dates Starting date Completion date Sample receipt Sample analysi
(b) (4)
(b) (4)
STUDY RIS-IND25-(STUDY 6)- ADULTS
Objective To determine the oral bioequivalence of a single dose of 2 mg (b) (4)risperidone given as a tablet (F556) with that of the 2-mg
conventional RISPERDAL tablet (F37) in healthy volunteers
The primary objective was to show bioequivalence with respect to
13
Study Design
This was a single-center Phase 1 open randomized 2-way crossover bioequivalence study in 40 subjects with schizophrenia or schizoaffective disorder The study consisted of 2 treatment periods 5 days per period separated by a washout period of at least 10 days between administration of study drug on Day 1 of Period 1 and administration of study drug on Day 1 of Period 2 The study duration was approximately 6 weeks (including the screening period) Subjects remained in the study facility for approximately 18 days
DOSING AND PK SAMPLING
16
Table 1 Time and event schedule for study RIS-PO1-RO3
ANALYTICAL
17
STUDY RSA-5-(STUDY 8)- ADULTS
OBJECTIVE
The primary objective of this study was to demonstrate the bioequivalence
Study Design
This was a Phase I open randomized 2-way cross-over bioequivalence study in 36 subjects with schizophrenia or schizoaffective disorder The subjects received in a randomized manner a single oral dose of 4 mg risperidone on two occasions
The duration of the study was approximately 6 weeks
DOSING AND PK SAMPLING
with respect to risperidone and active moiety between a single oral dose of 4 mg risperidone given as a 4 mg tablet manufactured
and as a 4 mg RISPERDALor currently marketed tablet
(b) (4)
- Treatment A RISPERDALD marketed tablet - Treatment B tablet manufactured
The pharmacokinetics of risperidone were assessed up to 96 hours post dosing The wash-out period between treatments was at least 10 days
(b) (4)
19
Table 1a Time and event schedule for study RIS-RSA-5
RIS-RSA-5 STU=8 DATE STUDY INITIATED 22 April 2002 DATE STUDY COMPLETED 10 July 2002 Study dates Starting date Completion date Sample receipt Analytical Stud Sample analysis
(b) (4)
(b) (4)
20
(b) (4)
STUDY R076477-SCH-102 STUDY 9- ADULTS
OBJECTIVE
The primary objectives of the study were to compare the steady-state pharmacokinetics of paliperidone after oral administration of 15 mg ER OROS paliperidone once daily with the steady-state pharmacokinetics of paliperidone after oral administration of 8 mg IR risperidone twice daily and to explore the dose-proportionality of 9 mg and 15 mg ER OROS paliperidone
Study Design
21
A dose of 15 mg ER OROS paliperidone once daily was chosen because this is the highest dose of ER OROS paliperidone that is proposed for use in the Phase 3 studies The dose of risperidone was chosen because 8 mg twice daily is the highest registered dose of risperidone Study medication was administered after a (high-fat) breakfast as in a previous study the exposure to paliperidone increased by circa 10 after intake of food1 Food does not affect the pharmacokinetics of risperidone The study was done in 17 subjects (17 M2F)
DOSING AND PK SAMPLING
22
Drug Sampling
Immediately before dosing on Day 8 (baseline) Days 11 to 14 and Days 18 to 21 at 2 4 6 9 12 16 19 22 and 24 hours after dosing on Day 14 and at 2 4 6 9 12 16 19 22 24 27 30 34 40 48 72 96 and 120 hours after dosing on Day 21 for subjects receiving ER OROS paliperidone immediately before the morning dose on Day 8 (baseline) and Days 18 to 21 and at 1 2 3 4 6 8 12 13 14 15 16 24 36 48 72 96 and 120 hours after the morning dose on Day 21 for subjects receiving risperidone
R076477-SCH-102 STUDY=9
23
index dataset and the remaining 30 constituted the qualification dataset
When concomitant medication was present one day before the PK sampling day the flag for concomitant medication was set to 1 (present) on the PK day even though the concomitant medication was stopped the day before
Planned Analysis for Risperidone and the Active Moiety
The analysis consisted of two separate population PK analyses one for risperidone and one for the active moiety in the pool of children adolescent and adult subjects after oral administration of risperidone For both risperidone and the active moiety (ie sum of the risperidone + 9 hydroxy risperidone plasma levels) the population PK analysis consisted of the following steps bull An exploratory analysis of concentration-time data and covariates identification of potential outliers At this stage prior PK and other relevant information to support the structural model selection was used particularly the results of previous modeling activities bull Using the index dataset evaluation of a base and a covariate model (demographics body size variables and study) bull Model qualification and model adjustment if needed bull Estimation of the model on the full dataset and exploration of the effect of concomitant medications bull Estimation of the final model with the effect of concomitant medications
IDENTIFICATION OF OUTLIERS
Data points were considered as potential outliers if they substantially deviated from adjacent points in the concentration-time profiles Final outlier identification was performed after selecting a structural model and was based on the graphical exploration of individual and population residuals (weighted and non-weighted) After the model development was complete the final model was fitted to the entire data set with all excluded outliers in and the results were compared
Outlier identification in the sparse data set was performed through a different approach Initially posterior predictions were generated for each individual by fitting the structural model to the sparse data Individual and population residuals (weighted and non-weighted) were analyzed graphically and potential outliers were identified For individuals with outliers the observations were plotted against the time since the last dose (one subject per panel) and were superimposed with the corresponding individual and population predictions The outliers that deviated both in terms of residuals
25
and observations were finally identified and excluded unless other factors (like co-administration of other drugs) caused the deviation of the concentration from predicted levels
DERIVED TRANSFORMED AND MISSING DATA
If a given covariate either categorical or continuous was missing in more than 15 of patients it was omitted from the analysis If necessary an analysis of subpopulations was performed In the current dataset weight and height were missing for two subjects in Study RIS-USA-239 the missing values were replaced by the median by sex in the study population For the exploratory data analysis the creatinine clearance (CRCL) in the populations derivation used the Cockroft-Gault equation for all subjects pediatric and adults The influence of CRCL on the active moiety and risperidone PK was explored in NONMEM using several different values using the Schwartz equation for the pediatric population or the Cockroft-Gault equation for the adult population Creatinine clearance (CRCL in mLmin) was derived within the NMTRAN control file
(b) (4)
5 Page(s) has been Withheld in Full as b4 (CCITS) immediately following this page
26
(b) (4)
RESULTS
Demographic and Baseline Characteristics
Table 4 Summary statistics of demographic and baseline characteristics
32
33
Table 5 The number of subjects () taking the selected concomitant medications included in the population PK analysis
Due to the small numbers of subjects receiving concomitant CYP3A4 inducers CYP2D6 inducers methylphenidate or mood stabilizers was too small to allow analysis
FIRMrsquoS ANALYSIS
ACTIVE MOIETY INDEX DATA SET
The best model to describe the concentrations of the active moiety was a two-compartment model with first order input and a lag time
Allometric scaling factors for clearance and volume and the effect of creatinine clearance (derived with the Schwartz formula for the actual CRCL) were included a priori in the model
To correct for the underprediction at the beginning of the distribution phase observed in the data rich studies a study effect was tested on the volume of the central compartment The volume of the central compartment was shown to be lower in Studies RIS-USA-160 RIS-NED-25 RIS-P01-103 and RIS-RSA-5
Interindividual variability (IIV) was estimated for apparent clearance (CLF) apparent central volume (V2F) Ka and relative bioavailability (F1) Two separate additive models described the residual error one for the single dose studies and the other one for the repeated dosing studies The firmrsquos base model control stream for the active moiety is presented in Appendix I
The population estimates for the base model (using the FO method) are reported in Table 6
Table 6 Base Model Parameters for Active Moiety After Oral Administration of Risperidone Results were obtained With the Index Dataset Using the FO Method
34
MODEL QUALIFICATION Figure 2 presents the diagnostic plots of the model qualification PRED vs DV IPRED vs DV WRES vs PRED and IRES vs IPRED
Figure 3 External Qualification of the Active Moiety Final Model ndash Qualification Dataset a PRED Versus DV
36
(b) (4)
37
EFFECT OF CO-MEDICATIONS The effect of co-medication was assessed using the full dataset A summary of the univariate analyses of DDI is reported in Table
Table 8 Drug drug interactions ndashActive moiety
There were no significant drug drug interactions indicated except for GPID (PGP inducers) however this PGP inducers effect should be interpreted with caution since only 7 out of 780 patients took this medication
FINAL PK MODEL OF THE ACTIVE MOIETY ndash FULL DATASET
After including all significant effects the final PK parameters of the active moiety were estimated using the FOCE method To obtain a minimization with a successful covariance step the model had to be further simplified the covariance between CLF and F1 was removed and the random effect on Ka was deleted
Table 9 Final Model Parameters for Active Moiety After Oral Administration of Risperidone Results are Obtained With the Full Dataset Using the FOCE Method
38
Figure 5 Simulated Concentrations of Active Moiety in NonBlack Subjects Treated With 3 mgday (Split bid Dose) of Risperidone (5th 25th 50th 75th and 95th percentile
42
Figure 5 Simulated Concentrations of Active Moiety in NonBlack Subjects Treated With 3 mgday (qd Dose) of Risperidone (5th 25th 50th 75th and 95th
percentile
43
QF θ4 147(0119) 148(0122) Ka θ5 548(0654) 548(0657) ALAG1 θ7 024(000189) 024(000189) F1 1 Fixed 1 Fixed
IIV on CL ω2 1 00648(00137) 0068(00158)
IIV on V2 ω2 2 00105(00146) 00076(00139)
IIV on Ka ω2 3 627(134) 631(136)
IIV on F1 ω2 4 0197(00358) 0225(0048)
Residual variability Study 123459F2
1 Study 678F2
2
00692(00112) 024 (0033)
00692(00112) 024 (0044)
(b) (4)
FINAL MODEL ACTIVE MOIETY FINAL MODEL WOULD NOT RUN ON MY COMPUTER BUT DID RUN ON YANINGrsquoS RESULTS WERE FOUND TO BE THE SAME AS FOR THE SPONSOR
(b) (4)
COMMENT
59
DOSES OF 2 3 4 6 MG KG
C 40 o n c e n t r 30 a t i o n
o f 20
A c t i v e 10
M o i e t y 0
2 3 4 6
CHI LD ADOL ADULT CHI LD ADOL ADULT CHI LD ADOL ADULT CHI LD ADOL ADULT
Pat i ent Popul at i on
1 There was minimal change in the base model results with study 2 deleted 2 FDA results for the base and final models were identical to the firmrsquos
results
The firmrsquos analysis was further checked by selecting times after dose for the observed data based upon the sampling schedules for studies 1 2 and 3 These were used to make comparisons to the other adult studies at the same times after dose for the intensive sampling studies Trough samples were selected based upon time of last dose that were comparable between the studies These were further sorted based upon dose with the final concentrations normalized to dose
Figure 9 Comparison of adolescent and adult data observed data as a function of normalized dose for Active moiety at trough
Comment
60
1 Mean values for the active moiety were similar for adults and children and adolescents at trough based upon mgkg
BASE MODEL - RISPERIDONE
Table 12 Comparative results were Parameter Firmrsquos analysis FDA analysis FDA analysis
Estimate (Rel SE) (Rel SE) without study 2 (Rel SE)
Ka (b) (4)
603(91) 603(90) CL
49(129) 51(134) θ2 0782(118) 0782(118)
V2F θ3
θ9 323(136) 331(141)
V3F θ4 256(216) 255(233) QF θ5 696(162) 73(179) ALAG1 θ6 024(08) 024(08) F1 Population 1 θ7 35(123) 36(141) Population 2 1(fixed) 1(fixed) Proportion 0346(242) 035(203) population 1 p(1)= θ8 Proportion 0654 0654 population 2 1-p(1)
ω2IIV on Ka 1 83(228) 83(228) IIV on CL ω2
2 0332(173) 038(202) IIV on V2 ω2
3 0261(221) 030(242) Residual variability Study 123459F2
1 0073(191) 0073(191) Study 678F2
2 0828 (115) 0837 (115)
COMMENTS
1There was minimal change in the base model results with study 2 deleted 2 FDA results for the base and final models were identical to the firmrsquos results
61
Table 13 Final Model Parameters for Risperidone After Oral Administration Results are Obtained With the Full Dataset Using the FOCE Method
Parameter Firmrsquos Estimates FDA Estimates
Ka (h-1) Study 123459 θ1 Study 678 θ10
CLF (Lh)=θ2(Weight70)075 θ9 POP1 θ2 θ9
V2F (L)=θ3(Weight70) θ3
V3F (L)=θ4(Weight70) θ4 QF (Lh) θ5 ALAG1 (h) θ6 F1 Population 1 θ7 Population 2
Proportion population 1 P(1)= θ8 Proportion population 2 1-P(1) IIV on CL ω2 1 IIV on V2 ω2 2 IIV on F1 ω2 3 Residual variability on log(conc) Study 1 2 3 4 5 9 σ2 1 Study 6 7 8 σ2 2
(SE) (SE) (b) (4)
An analysis of the trough times after dose concentrations were selected based upon the sampling schedules for studies 1 2 and 3 and analyzed the same as those for the active moiety
Figure 10 Comparison of adolescent and adult data observed data as a function of normalized dose for Risperidone at trough
62
DOSES OF 2 3 4 6 MG KG
30 C o n c e n t r a t 20 i o n
o f
R i 10 s p e r i d o n e
0
2 3 4 6
CHI LD ADOL ADULT CHI LD ADOL ADULT CHI LD ADOL ADULT CHI LD ADOL ADULT
Pat i ent Popul at i on
DISCUSSION
The results from this analysis indicates that based upon the model developed to describe risperidone and the active moiety that there are differences in clearance between adolescents children and adults Values for the standard errors indicated that the parameters were estimated with precisions usually less than 25 The residual variability remained high suggesting that assumptions about dosing history may be incorrect or sampling datetime may not be accurate for some subjects at steady state
The analysis of the raw trough data based upon time after dosing supports the model results indicating that weight normalized doses are comparable in children adolescents and adults in the dose range 2345 and 6 mgkg However based upon the lack of a clear dose response relationship for both indications dosing based upon body weight is not recommended Recommended doses for schizophrenia is 3 mg QD while that for bipolar should be initiated at 05 mg QD with adjustment of 05-1 mgday as tolerated
5 Page(s) of Draft Labeling have been Withheld in Full as b4 (CCITS) immediately following this page
63
---------------------------------------------------------------------------------------------------------------------
---------------------------------------------------------------------------------------------------------------------
---------------------
This is a representation of an electronic record that was signed electronically and this page is the manifestation of the electronic signature
s
Andre Jackson 6132007 075956 AM BIOPHARMACEUTICS
Yaning Wang 6132007 012858 PM BIOPHARMACEUTICS
Raman Baweja 6132007 030822 PM BIOPHARMACEUTICS

(b) (4)
STUDY RIS-USA-231 (STUDY 2) ADOLESCENTS
Objective assess the efficacy safety tolerability and PK of risperidone during 8 weeks randomized double-blind parallel-group multicenter study in adolescents (aged 13-17 years) with schizophrenia and suffering from an acute episode of treatment and to explore the PKPD relationship to efficacy and safety
Population 279 enrolled adolescents with schizophrenia
Design randomized double-blind parallel-group multicenter Phase 3 study
Subjects were randomized to receive 1 of 2 risperidone treatments low dose (lt50 kg 0007-0012 mgkgday gt50 kg 035-06 mgday) and high dose (lt50 kg 007-012 mgkgday gt50 kg 35-6 mgday) (dose range post protocol amendment 3) Study medication was provided as an oral solution containing risperidone at concentrations of either 01 mgmL or 1 mgmL Study
7
(b) (4)
STUDY RIS-USA-160 (STUDY 3)- CHILDREN AND ADOLESCENTS
Objective determine the PK and safety of risperidone (001 to 008 mgkgday bid dosing) 9-hydroxy-risperidone and of the active moiety at steady state
Population 24 children and adolescents (aged 5 years to less than 18 years)
Design open-label multicenter Phase 1 study with 2 periods screeningrun-in (7 to 30 Days) ie a maintenance dose of risperidone and a single day for PK monitoring and check-out
The subjects were divided into 2 groups 12 children (aged 6-11 years and weighing between 20-61 kg) and 12 adolescents (aged 12-16 years and weighing between 33-92 kg) A complete urinary output was also collected from 0 to 6 hours and from 6 to 12 hours after dosing Subjects were phenotyped for CYP2D6 using the risperidone metabolic ratio (ie AUCτssrisperidoneAUCτss9-hydroxy-risperidone) and genotyped for CYP2D6 Subjects with a risperidone metabolic ratio higher than 1 were categorized as PMs for CYP2D6 and subjects with a ratio of less than 1 as EMs for CYP2D6 The daily dose of risperidone ranged between 025 - 15 mg bid for children and between 075 - 175 mg bid for adolescents or expressed per kg body weight equivalent to a range of 0024 - 0074 mgkgday (mean 0049 mgkgday) for children and 0016 - 0076 mgkgday (mean 0041 mgkgday) for adolescents
9
Blood samples were collected immediately before (0 hour) and 2 4 8 and 12 hours after the morning dose on the PK monitoring day
ANALYTICAL STUDY RIS-USA-160-STUDY 3 starting date completion date
(b) (4)
STUDY RIS-USA-239-(STUDY 4)-ADULTS
Objective assess the efficacy safety tolerability and PK of dosage range (1
10
(b) (4)
STUDY RIS-IND-2 (STUDY 5) ADULTS
Objective To assess the efficacy and safety of risperidone dosage range (1 to 6 mgday)compared with placebo during 3 weeks of treatment in subjects with Bipolar I disorder suffering a manic or mixed episode The primary efficacy measure was the change in mean YMRS total score from baseline to endpoint
Population 290 treated (144 placebo 146 risperidone) adult patients with Bipolar I Disorder who are suffering a manic or mixed episode
Design randomized placebo-controlled double-blind parallel-group multicenter Phase 3 study A flexible doses of risperidone (1 to 6 mgday) or placebo were administered after dose escalation Randomized patients were stratified by the presence or absence of psychotic features at baseline and by center Following randomization and the initiation of double-blind study drug therapy a minimum of 7 full days of inpatient hospitalization was required Subjects assigned to the risperidone treatment group received a single 3-mg dose on Day 1
Sampling
Sparse PK samples were taken on week 1 and week 3 All blood for PK samples were drawn immediately before the intake of trial medication (predose) except that on Day 7 a second sample was to be drawn post-dose at least 1 hour after the first withdrawal
ANALYTICAL
RIS-IND-2 STUDY=5
12
Trial dates Start 12 Mar 2001 ⎜ end 24 Dec 2001 Study dates Starting date Completion date Sample receipt Sample analysi
(b) (4)
(b) (4)
STUDY RIS-IND25-(STUDY 6)- ADULTS
Objective To determine the oral bioequivalence of a single dose of 2 mg (b) (4)risperidone given as a tablet (F556) with that of the 2-mg
conventional RISPERDAL tablet (F37) in healthy volunteers
The primary objective was to show bioequivalence with respect to
13
Study Design
This was a single-center Phase 1 open randomized 2-way crossover bioequivalence study in 40 subjects with schizophrenia or schizoaffective disorder The study consisted of 2 treatment periods 5 days per period separated by a washout period of at least 10 days between administration of study drug on Day 1 of Period 1 and administration of study drug on Day 1 of Period 2 The study duration was approximately 6 weeks (including the screening period) Subjects remained in the study facility for approximately 18 days
DOSING AND PK SAMPLING
16
Table 1 Time and event schedule for study RIS-PO1-RO3
ANALYTICAL
17
STUDY RSA-5-(STUDY 8)- ADULTS
OBJECTIVE
The primary objective of this study was to demonstrate the bioequivalence
Study Design
This was a Phase I open randomized 2-way cross-over bioequivalence study in 36 subjects with schizophrenia or schizoaffective disorder The subjects received in a randomized manner a single oral dose of 4 mg risperidone on two occasions
The duration of the study was approximately 6 weeks
DOSING AND PK SAMPLING
with respect to risperidone and active moiety between a single oral dose of 4 mg risperidone given as a 4 mg tablet manufactured
and as a 4 mg RISPERDALor currently marketed tablet
(b) (4)
- Treatment A RISPERDALD marketed tablet - Treatment B tablet manufactured
The pharmacokinetics of risperidone were assessed up to 96 hours post dosing The wash-out period between treatments was at least 10 days
(b) (4)
19
Table 1a Time and event schedule for study RIS-RSA-5
RIS-RSA-5 STU=8 DATE STUDY INITIATED 22 April 2002 DATE STUDY COMPLETED 10 July 2002 Study dates Starting date Completion date Sample receipt Analytical Stud Sample analysis
(b) (4)
(b) (4)
20
(b) (4)
STUDY R076477-SCH-102 STUDY 9- ADULTS
OBJECTIVE
The primary objectives of the study were to compare the steady-state pharmacokinetics of paliperidone after oral administration of 15 mg ER OROS paliperidone once daily with the steady-state pharmacokinetics of paliperidone after oral administration of 8 mg IR risperidone twice daily and to explore the dose-proportionality of 9 mg and 15 mg ER OROS paliperidone
Study Design
21
A dose of 15 mg ER OROS paliperidone once daily was chosen because this is the highest dose of ER OROS paliperidone that is proposed for use in the Phase 3 studies The dose of risperidone was chosen because 8 mg twice daily is the highest registered dose of risperidone Study medication was administered after a (high-fat) breakfast as in a previous study the exposure to paliperidone increased by circa 10 after intake of food1 Food does not affect the pharmacokinetics of risperidone The study was done in 17 subjects (17 M2F)
DOSING AND PK SAMPLING
22
Drug Sampling
Immediately before dosing on Day 8 (baseline) Days 11 to 14 and Days 18 to 21 at 2 4 6 9 12 16 19 22 and 24 hours after dosing on Day 14 and at 2 4 6 9 12 16 19 22 24 27 30 34 40 48 72 96 and 120 hours after dosing on Day 21 for subjects receiving ER OROS paliperidone immediately before the morning dose on Day 8 (baseline) and Days 18 to 21 and at 1 2 3 4 6 8 12 13 14 15 16 24 36 48 72 96 and 120 hours after the morning dose on Day 21 for subjects receiving risperidone
R076477-SCH-102 STUDY=9
23
index dataset and the remaining 30 constituted the qualification dataset
When concomitant medication was present one day before the PK sampling day the flag for concomitant medication was set to 1 (present) on the PK day even though the concomitant medication was stopped the day before
Planned Analysis for Risperidone and the Active Moiety
The analysis consisted of two separate population PK analyses one for risperidone and one for the active moiety in the pool of children adolescent and adult subjects after oral administration of risperidone For both risperidone and the active moiety (ie sum of the risperidone + 9 hydroxy risperidone plasma levels) the population PK analysis consisted of the following steps bull An exploratory analysis of concentration-time data and covariates identification of potential outliers At this stage prior PK and other relevant information to support the structural model selection was used particularly the results of previous modeling activities bull Using the index dataset evaluation of a base and a covariate model (demographics body size variables and study) bull Model qualification and model adjustment if needed bull Estimation of the model on the full dataset and exploration of the effect of concomitant medications bull Estimation of the final model with the effect of concomitant medications
IDENTIFICATION OF OUTLIERS
Data points were considered as potential outliers if they substantially deviated from adjacent points in the concentration-time profiles Final outlier identification was performed after selecting a structural model and was based on the graphical exploration of individual and population residuals (weighted and non-weighted) After the model development was complete the final model was fitted to the entire data set with all excluded outliers in and the results were compared
Outlier identification in the sparse data set was performed through a different approach Initially posterior predictions were generated for each individual by fitting the structural model to the sparse data Individual and population residuals (weighted and non-weighted) were analyzed graphically and potential outliers were identified For individuals with outliers the observations were plotted against the time since the last dose (one subject per panel) and were superimposed with the corresponding individual and population predictions The outliers that deviated both in terms of residuals
25
and observations were finally identified and excluded unless other factors (like co-administration of other drugs) caused the deviation of the concentration from predicted levels
DERIVED TRANSFORMED AND MISSING DATA
If a given covariate either categorical or continuous was missing in more than 15 of patients it was omitted from the analysis If necessary an analysis of subpopulations was performed In the current dataset weight and height were missing for two subjects in Study RIS-USA-239 the missing values were replaced by the median by sex in the study population For the exploratory data analysis the creatinine clearance (CRCL) in the populations derivation used the Cockroft-Gault equation for all subjects pediatric and adults The influence of CRCL on the active moiety and risperidone PK was explored in NONMEM using several different values using the Schwartz equation for the pediatric population or the Cockroft-Gault equation for the adult population Creatinine clearance (CRCL in mLmin) was derived within the NMTRAN control file
(b) (4)
5 Page(s) has been Withheld in Full as b4 (CCITS) immediately following this page
26
(b) (4)
RESULTS
Demographic and Baseline Characteristics
Table 4 Summary statistics of demographic and baseline characteristics
32
33
Table 5 The number of subjects () taking the selected concomitant medications included in the population PK analysis
Due to the small numbers of subjects receiving concomitant CYP3A4 inducers CYP2D6 inducers methylphenidate or mood stabilizers was too small to allow analysis
FIRMrsquoS ANALYSIS
ACTIVE MOIETY INDEX DATA SET
The best model to describe the concentrations of the active moiety was a two-compartment model with first order input and a lag time
Allometric scaling factors for clearance and volume and the effect of creatinine clearance (derived with the Schwartz formula for the actual CRCL) were included a priori in the model
To correct for the underprediction at the beginning of the distribution phase observed in the data rich studies a study effect was tested on the volume of the central compartment The volume of the central compartment was shown to be lower in Studies RIS-USA-160 RIS-NED-25 RIS-P01-103 and RIS-RSA-5
Interindividual variability (IIV) was estimated for apparent clearance (CLF) apparent central volume (V2F) Ka and relative bioavailability (F1) Two separate additive models described the residual error one for the single dose studies and the other one for the repeated dosing studies The firmrsquos base model control stream for the active moiety is presented in Appendix I
The population estimates for the base model (using the FO method) are reported in Table 6
Table 6 Base Model Parameters for Active Moiety After Oral Administration of Risperidone Results were obtained With the Index Dataset Using the FO Method
34
MODEL QUALIFICATION Figure 2 presents the diagnostic plots of the model qualification PRED vs DV IPRED vs DV WRES vs PRED and IRES vs IPRED
Figure 3 External Qualification of the Active Moiety Final Model ndash Qualification Dataset a PRED Versus DV
36
(b) (4)
37
EFFECT OF CO-MEDICATIONS The effect of co-medication was assessed using the full dataset A summary of the univariate analyses of DDI is reported in Table
Table 8 Drug drug interactions ndashActive moiety
There were no significant drug drug interactions indicated except for GPID (PGP inducers) however this PGP inducers effect should be interpreted with caution since only 7 out of 780 patients took this medication
FINAL PK MODEL OF THE ACTIVE MOIETY ndash FULL DATASET
After including all significant effects the final PK parameters of the active moiety were estimated using the FOCE method To obtain a minimization with a successful covariance step the model had to be further simplified the covariance between CLF and F1 was removed and the random effect on Ka was deleted
Table 9 Final Model Parameters for Active Moiety After Oral Administration of Risperidone Results are Obtained With the Full Dataset Using the FOCE Method
38
Figure 5 Simulated Concentrations of Active Moiety in NonBlack Subjects Treated With 3 mgday (Split bid Dose) of Risperidone (5th 25th 50th 75th and 95th percentile
42
Figure 5 Simulated Concentrations of Active Moiety in NonBlack Subjects Treated With 3 mgday (qd Dose) of Risperidone (5th 25th 50th 75th and 95th
percentile
43
QF θ4 147(0119) 148(0122) Ka θ5 548(0654) 548(0657) ALAG1 θ7 024(000189) 024(000189) F1 1 Fixed 1 Fixed
IIV on CL ω2 1 00648(00137) 0068(00158)
IIV on V2 ω2 2 00105(00146) 00076(00139)
IIV on Ka ω2 3 627(134) 631(136)
IIV on F1 ω2 4 0197(00358) 0225(0048)
Residual variability Study 123459F2
1 Study 678F2
2
00692(00112) 024 (0033)
00692(00112) 024 (0044)
(b) (4)
FINAL MODEL ACTIVE MOIETY FINAL MODEL WOULD NOT RUN ON MY COMPUTER BUT DID RUN ON YANINGrsquoS RESULTS WERE FOUND TO BE THE SAME AS FOR THE SPONSOR
(b) (4)
COMMENT
59
DOSES OF 2 3 4 6 MG KG
C 40 o n c e n t r 30 a t i o n
o f 20
A c t i v e 10
M o i e t y 0
2 3 4 6
CHI LD ADOL ADULT CHI LD ADOL ADULT CHI LD ADOL ADULT CHI LD ADOL ADULT
Pat i ent Popul at i on
1 There was minimal change in the base model results with study 2 deleted 2 FDA results for the base and final models were identical to the firmrsquos
results
The firmrsquos analysis was further checked by selecting times after dose for the observed data based upon the sampling schedules for studies 1 2 and 3 These were used to make comparisons to the other adult studies at the same times after dose for the intensive sampling studies Trough samples were selected based upon time of last dose that were comparable between the studies These were further sorted based upon dose with the final concentrations normalized to dose
Figure 9 Comparison of adolescent and adult data observed data as a function of normalized dose for Active moiety at trough
Comment
60
1 Mean values for the active moiety were similar for adults and children and adolescents at trough based upon mgkg
BASE MODEL - RISPERIDONE
Table 12 Comparative results were Parameter Firmrsquos analysis FDA analysis FDA analysis
Estimate (Rel SE) (Rel SE) without study 2 (Rel SE)
Ka (b) (4)
603(91) 603(90) CL
49(129) 51(134) θ2 0782(118) 0782(118)
V2F θ3
θ9 323(136) 331(141)
V3F θ4 256(216) 255(233) QF θ5 696(162) 73(179) ALAG1 θ6 024(08) 024(08) F1 Population 1 θ7 35(123) 36(141) Population 2 1(fixed) 1(fixed) Proportion 0346(242) 035(203) population 1 p(1)= θ8 Proportion 0654 0654 population 2 1-p(1)
ω2IIV on Ka 1 83(228) 83(228) IIV on CL ω2
2 0332(173) 038(202) IIV on V2 ω2
3 0261(221) 030(242) Residual variability Study 123459F2
1 0073(191) 0073(191) Study 678F2
2 0828 (115) 0837 (115)
COMMENTS
1There was minimal change in the base model results with study 2 deleted 2 FDA results for the base and final models were identical to the firmrsquos results
61
Table 13 Final Model Parameters for Risperidone After Oral Administration Results are Obtained With the Full Dataset Using the FOCE Method
Parameter Firmrsquos Estimates FDA Estimates
Ka (h-1) Study 123459 θ1 Study 678 θ10
CLF (Lh)=θ2(Weight70)075 θ9 POP1 θ2 θ9
V2F (L)=θ3(Weight70) θ3
V3F (L)=θ4(Weight70) θ4 QF (Lh) θ5 ALAG1 (h) θ6 F1 Population 1 θ7 Population 2
Proportion population 1 P(1)= θ8 Proportion population 2 1-P(1) IIV on CL ω2 1 IIV on V2 ω2 2 IIV on F1 ω2 3 Residual variability on log(conc) Study 1 2 3 4 5 9 σ2 1 Study 6 7 8 σ2 2
(SE) (SE) (b) (4)
An analysis of the trough times after dose concentrations were selected based upon the sampling schedules for studies 1 2 and 3 and analyzed the same as those for the active moiety
Figure 10 Comparison of adolescent and adult data observed data as a function of normalized dose for Risperidone at trough
62
DOSES OF 2 3 4 6 MG KG
30 C o n c e n t r a t 20 i o n
o f
R i 10 s p e r i d o n e
0
2 3 4 6
CHI LD ADOL ADULT CHI LD ADOL ADULT CHI LD ADOL ADULT CHI LD ADOL ADULT
Pat i ent Popul at i on
DISCUSSION
The results from this analysis indicates that based upon the model developed to describe risperidone and the active moiety that there are differences in clearance between adolescents children and adults Values for the standard errors indicated that the parameters were estimated with precisions usually less than 25 The residual variability remained high suggesting that assumptions about dosing history may be incorrect or sampling datetime may not be accurate for some subjects at steady state
The analysis of the raw trough data based upon time after dosing supports the model results indicating that weight normalized doses are comparable in children adolescents and adults in the dose range 2345 and 6 mgkg However based upon the lack of a clear dose response relationship for both indications dosing based upon body weight is not recommended Recommended doses for schizophrenia is 3 mg QD while that for bipolar should be initiated at 05 mg QD with adjustment of 05-1 mgday as tolerated
5 Page(s) of Draft Labeling have been Withheld in Full as b4 (CCITS) immediately following this page
63
---------------------------------------------------------------------------------------------------------------------
---------------------------------------------------------------------------------------------------------------------
---------------------
This is a representation of an electronic record that was signed electronically and this page is the manifestation of the electronic signature
s
Andre Jackson 6132007 075956 AM BIOPHARMACEUTICS
Yaning Wang 6132007 012858 PM BIOPHARMACEUTICS
Raman Baweja 6132007 030822 PM BIOPHARMACEUTICS
(b) (4)
STUDY RIS-USA-160 (STUDY 3)- CHILDREN AND ADOLESCENTS
Objective determine the PK and safety of risperidone (001 to 008 mgkgday bid dosing) 9-hydroxy-risperidone and of the active moiety at steady state
Population 24 children and adolescents (aged 5 years to less than 18 years)
Design open-label multicenter Phase 1 study with 2 periods screeningrun-in (7 to 30 Days) ie a maintenance dose of risperidone and a single day for PK monitoring and check-out
The subjects were divided into 2 groups 12 children (aged 6-11 years and weighing between 20-61 kg) and 12 adolescents (aged 12-16 years and weighing between 33-92 kg) A complete urinary output was also collected from 0 to 6 hours and from 6 to 12 hours after dosing Subjects were phenotyped for CYP2D6 using the risperidone metabolic ratio (ie AUCτssrisperidoneAUCτss9-hydroxy-risperidone) and genotyped for CYP2D6 Subjects with a risperidone metabolic ratio higher than 1 were categorized as PMs for CYP2D6 and subjects with a ratio of less than 1 as EMs for CYP2D6 The daily dose of risperidone ranged between 025 - 15 mg bid for children and between 075 - 175 mg bid for adolescents or expressed per kg body weight equivalent to a range of 0024 - 0074 mgkgday (mean 0049 mgkgday) for children and 0016 - 0076 mgkgday (mean 0041 mgkgday) for adolescents
9
Blood samples were collected immediately before (0 hour) and 2 4 8 and 12 hours after the morning dose on the PK monitoring day
ANALYTICAL STUDY RIS-USA-160-STUDY 3 starting date completion date
(b) (4)
STUDY RIS-USA-239-(STUDY 4)-ADULTS
Objective assess the efficacy safety tolerability and PK of dosage range (1
10
(b) (4)
STUDY RIS-IND-2 (STUDY 5) ADULTS
Objective To assess the efficacy and safety of risperidone dosage range (1 to 6 mgday)compared with placebo during 3 weeks of treatment in subjects with Bipolar I disorder suffering a manic or mixed episode The primary efficacy measure was the change in mean YMRS total score from baseline to endpoint
Population 290 treated (144 placebo 146 risperidone) adult patients with Bipolar I Disorder who are suffering a manic or mixed episode
Design randomized placebo-controlled double-blind parallel-group multicenter Phase 3 study A flexible doses of risperidone (1 to 6 mgday) or placebo were administered after dose escalation Randomized patients were stratified by the presence or absence of psychotic features at baseline and by center Following randomization and the initiation of double-blind study drug therapy a minimum of 7 full days of inpatient hospitalization was required Subjects assigned to the risperidone treatment group received a single 3-mg dose on Day 1
Sampling
Sparse PK samples were taken on week 1 and week 3 All blood for PK samples were drawn immediately before the intake of trial medication (predose) except that on Day 7 a second sample was to be drawn post-dose at least 1 hour after the first withdrawal
ANALYTICAL
RIS-IND-2 STUDY=5
12
Trial dates Start 12 Mar 2001 ⎜ end 24 Dec 2001 Study dates Starting date Completion date Sample receipt Sample analysi
(b) (4)
(b) (4)
STUDY RIS-IND25-(STUDY 6)- ADULTS
Objective To determine the oral bioequivalence of a single dose of 2 mg (b) (4)risperidone given as a tablet (F556) with that of the 2-mg
conventional RISPERDAL tablet (F37) in healthy volunteers
The primary objective was to show bioequivalence with respect to
13
Study Design
This was a single-center Phase 1 open randomized 2-way crossover bioequivalence study in 40 subjects with schizophrenia or schizoaffective disorder The study consisted of 2 treatment periods 5 days per period separated by a washout period of at least 10 days between administration of study drug on Day 1 of Period 1 and administration of study drug on Day 1 of Period 2 The study duration was approximately 6 weeks (including the screening period) Subjects remained in the study facility for approximately 18 days
DOSING AND PK SAMPLING
16
Table 1 Time and event schedule for study RIS-PO1-RO3
ANALYTICAL
17
STUDY RSA-5-(STUDY 8)- ADULTS
OBJECTIVE
The primary objective of this study was to demonstrate the bioequivalence
Study Design
This was a Phase I open randomized 2-way cross-over bioequivalence study in 36 subjects with schizophrenia or schizoaffective disorder The subjects received in a randomized manner a single oral dose of 4 mg risperidone on two occasions
The duration of the study was approximately 6 weeks
DOSING AND PK SAMPLING
with respect to risperidone and active moiety between a single oral dose of 4 mg risperidone given as a 4 mg tablet manufactured
and as a 4 mg RISPERDALor currently marketed tablet
(b) (4)
- Treatment A RISPERDALD marketed tablet - Treatment B tablet manufactured
The pharmacokinetics of risperidone were assessed up to 96 hours post dosing The wash-out period between treatments was at least 10 days
(b) (4)
19
Table 1a Time and event schedule for study RIS-RSA-5
RIS-RSA-5 STU=8 DATE STUDY INITIATED 22 April 2002 DATE STUDY COMPLETED 10 July 2002 Study dates Starting date Completion date Sample receipt Analytical Stud Sample analysis
(b) (4)
(b) (4)
20
(b) (4)
STUDY R076477-SCH-102 STUDY 9- ADULTS
OBJECTIVE
The primary objectives of the study were to compare the steady-state pharmacokinetics of paliperidone after oral administration of 15 mg ER OROS paliperidone once daily with the steady-state pharmacokinetics of paliperidone after oral administration of 8 mg IR risperidone twice daily and to explore the dose-proportionality of 9 mg and 15 mg ER OROS paliperidone
Study Design
21
A dose of 15 mg ER OROS paliperidone once daily was chosen because this is the highest dose of ER OROS paliperidone that is proposed for use in the Phase 3 studies The dose of risperidone was chosen because 8 mg twice daily is the highest registered dose of risperidone Study medication was administered after a (high-fat) breakfast as in a previous study the exposure to paliperidone increased by circa 10 after intake of food1 Food does not affect the pharmacokinetics of risperidone The study was done in 17 subjects (17 M2F)
DOSING AND PK SAMPLING
22
Drug Sampling
Immediately before dosing on Day 8 (baseline) Days 11 to 14 and Days 18 to 21 at 2 4 6 9 12 16 19 22 and 24 hours after dosing on Day 14 and at 2 4 6 9 12 16 19 22 24 27 30 34 40 48 72 96 and 120 hours after dosing on Day 21 for subjects receiving ER OROS paliperidone immediately before the morning dose on Day 8 (baseline) and Days 18 to 21 and at 1 2 3 4 6 8 12 13 14 15 16 24 36 48 72 96 and 120 hours after the morning dose on Day 21 for subjects receiving risperidone
R076477-SCH-102 STUDY=9
23
index dataset and the remaining 30 constituted the qualification dataset
When concomitant medication was present one day before the PK sampling day the flag for concomitant medication was set to 1 (present) on the PK day even though the concomitant medication was stopped the day before
Planned Analysis for Risperidone and the Active Moiety
The analysis consisted of two separate population PK analyses one for risperidone and one for the active moiety in the pool of children adolescent and adult subjects after oral administration of risperidone For both risperidone and the active moiety (ie sum of the risperidone + 9 hydroxy risperidone plasma levels) the population PK analysis consisted of the following steps bull An exploratory analysis of concentration-time data and covariates identification of potential outliers At this stage prior PK and other relevant information to support the structural model selection was used particularly the results of previous modeling activities bull Using the index dataset evaluation of a base and a covariate model (demographics body size variables and study) bull Model qualification and model adjustment if needed bull Estimation of the model on the full dataset and exploration of the effect of concomitant medications bull Estimation of the final model with the effect of concomitant medications
IDENTIFICATION OF OUTLIERS
Data points were considered as potential outliers if they substantially deviated from adjacent points in the concentration-time profiles Final outlier identification was performed after selecting a structural model and was based on the graphical exploration of individual and population residuals (weighted and non-weighted) After the model development was complete the final model was fitted to the entire data set with all excluded outliers in and the results were compared
Outlier identification in the sparse data set was performed through a different approach Initially posterior predictions were generated for each individual by fitting the structural model to the sparse data Individual and population residuals (weighted and non-weighted) were analyzed graphically and potential outliers were identified For individuals with outliers the observations were plotted against the time since the last dose (one subject per panel) and were superimposed with the corresponding individual and population predictions The outliers that deviated both in terms of residuals
25
and observations were finally identified and excluded unless other factors (like co-administration of other drugs) caused the deviation of the concentration from predicted levels
DERIVED TRANSFORMED AND MISSING DATA
If a given covariate either categorical or continuous was missing in more than 15 of patients it was omitted from the analysis If necessary an analysis of subpopulations was performed In the current dataset weight and height were missing for two subjects in Study RIS-USA-239 the missing values were replaced by the median by sex in the study population For the exploratory data analysis the creatinine clearance (CRCL) in the populations derivation used the Cockroft-Gault equation for all subjects pediatric and adults The influence of CRCL on the active moiety and risperidone PK was explored in NONMEM using several different values using the Schwartz equation for the pediatric population or the Cockroft-Gault equation for the adult population Creatinine clearance (CRCL in mLmin) was derived within the NMTRAN control file
(b) (4)
5 Page(s) has been Withheld in Full as b4 (CCITS) immediately following this page
26
(b) (4)
RESULTS
Demographic and Baseline Characteristics
Table 4 Summary statistics of demographic and baseline characteristics
32
33
Table 5 The number of subjects () taking the selected concomitant medications included in the population PK analysis
Due to the small numbers of subjects receiving concomitant CYP3A4 inducers CYP2D6 inducers methylphenidate or mood stabilizers was too small to allow analysis
FIRMrsquoS ANALYSIS
ACTIVE MOIETY INDEX DATA SET
The best model to describe the concentrations of the active moiety was a two-compartment model with first order input and a lag time
Allometric scaling factors for clearance and volume and the effect of creatinine clearance (derived with the Schwartz formula for the actual CRCL) were included a priori in the model
To correct for the underprediction at the beginning of the distribution phase observed in the data rich studies a study effect was tested on the volume of the central compartment The volume of the central compartment was shown to be lower in Studies RIS-USA-160 RIS-NED-25 RIS-P01-103 and RIS-RSA-5
Interindividual variability (IIV) was estimated for apparent clearance (CLF) apparent central volume (V2F) Ka and relative bioavailability (F1) Two separate additive models described the residual error one for the single dose studies and the other one for the repeated dosing studies The firmrsquos base model control stream for the active moiety is presented in Appendix I
The population estimates for the base model (using the FO method) are reported in Table 6
Table 6 Base Model Parameters for Active Moiety After Oral Administration of Risperidone Results were obtained With the Index Dataset Using the FO Method
34
MODEL QUALIFICATION Figure 2 presents the diagnostic plots of the model qualification PRED vs DV IPRED vs DV WRES vs PRED and IRES vs IPRED
Figure 3 External Qualification of the Active Moiety Final Model ndash Qualification Dataset a PRED Versus DV
36
(b) (4)
37
EFFECT OF CO-MEDICATIONS The effect of co-medication was assessed using the full dataset A summary of the univariate analyses of DDI is reported in Table
Table 8 Drug drug interactions ndashActive moiety
There were no significant drug drug interactions indicated except for GPID (PGP inducers) however this PGP inducers effect should be interpreted with caution since only 7 out of 780 patients took this medication
FINAL PK MODEL OF THE ACTIVE MOIETY ndash FULL DATASET
After including all significant effects the final PK parameters of the active moiety were estimated using the FOCE method To obtain a minimization with a successful covariance step the model had to be further simplified the covariance between CLF and F1 was removed and the random effect on Ka was deleted
Table 9 Final Model Parameters for Active Moiety After Oral Administration of Risperidone Results are Obtained With the Full Dataset Using the FOCE Method
38
Figure 5 Simulated Concentrations of Active Moiety in NonBlack Subjects Treated With 3 mgday (Split bid Dose) of Risperidone (5th 25th 50th 75th and 95th percentile
42
Figure 5 Simulated Concentrations of Active Moiety in NonBlack Subjects Treated With 3 mgday (qd Dose) of Risperidone (5th 25th 50th 75th and 95th
percentile
43
QF θ4 147(0119) 148(0122) Ka θ5 548(0654) 548(0657) ALAG1 θ7 024(000189) 024(000189) F1 1 Fixed 1 Fixed
IIV on CL ω2 1 00648(00137) 0068(00158)
IIV on V2 ω2 2 00105(00146) 00076(00139)
IIV on Ka ω2 3 627(134) 631(136)
IIV on F1 ω2 4 0197(00358) 0225(0048)
Residual variability Study 123459F2
1 Study 678F2
2
00692(00112) 024 (0033)
00692(00112) 024 (0044)
(b) (4)
FINAL MODEL ACTIVE MOIETY FINAL MODEL WOULD NOT RUN ON MY COMPUTER BUT DID RUN ON YANINGrsquoS RESULTS WERE FOUND TO BE THE SAME AS FOR THE SPONSOR
(b) (4)
COMMENT
59
DOSES OF 2 3 4 6 MG KG
C 40 o n c e n t r 30 a t i o n
o f 20
A c t i v e 10
M o i e t y 0
2 3 4 6
CHI LD ADOL ADULT CHI LD ADOL ADULT CHI LD ADOL ADULT CHI LD ADOL ADULT
Pat i ent Popul at i on
1 There was minimal change in the base model results with study 2 deleted 2 FDA results for the base and final models were identical to the firmrsquos
results
The firmrsquos analysis was further checked by selecting times after dose for the observed data based upon the sampling schedules for studies 1 2 and 3 These were used to make comparisons to the other adult studies at the same times after dose for the intensive sampling studies Trough samples were selected based upon time of last dose that were comparable between the studies These were further sorted based upon dose with the final concentrations normalized to dose
Figure 9 Comparison of adolescent and adult data observed data as a function of normalized dose for Active moiety at trough
Comment
60
1 Mean values for the active moiety were similar for adults and children and adolescents at trough based upon mgkg
BASE MODEL - RISPERIDONE
Table 12 Comparative results were Parameter Firmrsquos analysis FDA analysis FDA analysis
Estimate (Rel SE) (Rel SE) without study 2 (Rel SE)
Ka (b) (4)
603(91) 603(90) CL
49(129) 51(134) θ2 0782(118) 0782(118)
V2F θ3
θ9 323(136) 331(141)
V3F θ4 256(216) 255(233) QF θ5 696(162) 73(179) ALAG1 θ6 024(08) 024(08) F1 Population 1 θ7 35(123) 36(141) Population 2 1(fixed) 1(fixed) Proportion 0346(242) 035(203) population 1 p(1)= θ8 Proportion 0654 0654 population 2 1-p(1)
ω2IIV on Ka 1 83(228) 83(228) IIV on CL ω2
2 0332(173) 038(202) IIV on V2 ω2
3 0261(221) 030(242) Residual variability Study 123459F2
1 0073(191) 0073(191) Study 678F2
2 0828 (115) 0837 (115)
COMMENTS
1There was minimal change in the base model results with study 2 deleted 2 FDA results for the base and final models were identical to the firmrsquos results
61
Table 13 Final Model Parameters for Risperidone After Oral Administration Results are Obtained With the Full Dataset Using the FOCE Method
Parameter Firmrsquos Estimates FDA Estimates
Ka (h-1) Study 123459 θ1 Study 678 θ10
CLF (Lh)=θ2(Weight70)075 θ9 POP1 θ2 θ9
V2F (L)=θ3(Weight70) θ3
V3F (L)=θ4(Weight70) θ4 QF (Lh) θ5 ALAG1 (h) θ6 F1 Population 1 θ7 Population 2
Proportion population 1 P(1)= θ8 Proportion population 2 1-P(1) IIV on CL ω2 1 IIV on V2 ω2 2 IIV on F1 ω2 3 Residual variability on log(conc) Study 1 2 3 4 5 9 σ2 1 Study 6 7 8 σ2 2
(SE) (SE) (b) (4)
An analysis of the trough times after dose concentrations were selected based upon the sampling schedules for studies 1 2 and 3 and analyzed the same as those for the active moiety
Figure 10 Comparison of adolescent and adult data observed data as a function of normalized dose for Risperidone at trough
62
DOSES OF 2 3 4 6 MG KG
30 C o n c e n t r a t 20 i o n
o f
R i 10 s p e r i d o n e
0
2 3 4 6
CHI LD ADOL ADULT CHI LD ADOL ADULT CHI LD ADOL ADULT CHI LD ADOL ADULT
Pat i ent Popul at i on
DISCUSSION
The results from this analysis indicates that based upon the model developed to describe risperidone and the active moiety that there are differences in clearance between adolescents children and adults Values for the standard errors indicated that the parameters were estimated with precisions usually less than 25 The residual variability remained high suggesting that assumptions about dosing history may be incorrect or sampling datetime may not be accurate for some subjects at steady state
The analysis of the raw trough data based upon time after dosing supports the model results indicating that weight normalized doses are comparable in children adolescents and adults in the dose range 2345 and 6 mgkg However based upon the lack of a clear dose response relationship for both indications dosing based upon body weight is not recommended Recommended doses for schizophrenia is 3 mg QD while that for bipolar should be initiated at 05 mg QD with adjustment of 05-1 mgday as tolerated
5 Page(s) of Draft Labeling have been Withheld in Full as b4 (CCITS) immediately following this page
63
---------------------------------------------------------------------------------------------------------------------
---------------------------------------------------------------------------------------------------------------------
---------------------
This is a representation of an electronic record that was signed electronically and this page is the manifestation of the electronic signature
s
Andre Jackson 6132007 075956 AM BIOPHARMACEUTICS
Yaning Wang 6132007 012858 PM BIOPHARMACEUTICS
Raman Baweja 6132007 030822 PM BIOPHARMACEUTICS

(b) (4)
STUDY RIS-IND-2 (STUDY 5) ADULTS
Objective To assess the efficacy and safety of risperidone dosage range (1 to 6 mgday)compared with placebo during 3 weeks of treatment in subjects with Bipolar I disorder suffering a manic or mixed episode The primary efficacy measure was the change in mean YMRS total score from baseline to endpoint
Population 290 treated (144 placebo 146 risperidone) adult patients with Bipolar I Disorder who are suffering a manic or mixed episode
Design randomized placebo-controlled double-blind parallel-group multicenter Phase 3 study A flexible doses of risperidone (1 to 6 mgday) or placebo were administered after dose escalation Randomized patients were stratified by the presence or absence of psychotic features at baseline and by center Following randomization and the initiation of double-blind study drug therapy a minimum of 7 full days of inpatient hospitalization was required Subjects assigned to the risperidone treatment group received a single 3-mg dose on Day 1
Sampling
Sparse PK samples were taken on week 1 and week 3 All blood for PK samples were drawn immediately before the intake of trial medication (predose) except that on Day 7 a second sample was to be drawn post-dose at least 1 hour after the first withdrawal
ANALYTICAL
RIS-IND-2 STUDY=5
12
Trial dates Start 12 Mar 2001 ⎜ end 24 Dec 2001 Study dates Starting date Completion date Sample receipt Sample analysi
(b) (4)
(b) (4)
STUDY RIS-IND25-(STUDY 6)- ADULTS
Objective To determine the oral bioequivalence of a single dose of 2 mg (b) (4)risperidone given as a tablet (F556) with that of the 2-mg
conventional RISPERDAL tablet (F37) in healthy volunteers
The primary objective was to show bioequivalence with respect to
13
Study Design
This was a single-center Phase 1 open randomized 2-way crossover bioequivalence study in 40 subjects with schizophrenia or schizoaffective disorder The study consisted of 2 treatment periods 5 days per period separated by a washout period of at least 10 days between administration of study drug on Day 1 of Period 1 and administration of study drug on Day 1 of Period 2 The study duration was approximately 6 weeks (including the screening period) Subjects remained in the study facility for approximately 18 days
DOSING AND PK SAMPLING
16
Table 1 Time and event schedule for study RIS-PO1-RO3
ANALYTICAL
17
STUDY RSA-5-(STUDY 8)- ADULTS
OBJECTIVE
The primary objective of this study was to demonstrate the bioequivalence
Study Design
This was a Phase I open randomized 2-way cross-over bioequivalence study in 36 subjects with schizophrenia or schizoaffective disorder The subjects received in a randomized manner a single oral dose of 4 mg risperidone on two occasions
The duration of the study was approximately 6 weeks
DOSING AND PK SAMPLING
with respect to risperidone and active moiety between a single oral dose of 4 mg risperidone given as a 4 mg tablet manufactured
and as a 4 mg RISPERDALor currently marketed tablet
(b) (4)
- Treatment A RISPERDALD marketed tablet - Treatment B tablet manufactured
The pharmacokinetics of risperidone were assessed up to 96 hours post dosing The wash-out period between treatments was at least 10 days
(b) (4)
19
Table 1a Time and event schedule for study RIS-RSA-5
RIS-RSA-5 STU=8 DATE STUDY INITIATED 22 April 2002 DATE STUDY COMPLETED 10 July 2002 Study dates Starting date Completion date Sample receipt Analytical Stud Sample analysis
(b) (4)
(b) (4)
20
(b) (4)
STUDY R076477-SCH-102 STUDY 9- ADULTS
OBJECTIVE
The primary objectives of the study were to compare the steady-state pharmacokinetics of paliperidone after oral administration of 15 mg ER OROS paliperidone once daily with the steady-state pharmacokinetics of paliperidone after oral administration of 8 mg IR risperidone twice daily and to explore the dose-proportionality of 9 mg and 15 mg ER OROS paliperidone
Study Design
21
A dose of 15 mg ER OROS paliperidone once daily was chosen because this is the highest dose of ER OROS paliperidone that is proposed for use in the Phase 3 studies The dose of risperidone was chosen because 8 mg twice daily is the highest registered dose of risperidone Study medication was administered after a (high-fat) breakfast as in a previous study the exposure to paliperidone increased by circa 10 after intake of food1 Food does not affect the pharmacokinetics of risperidone The study was done in 17 subjects (17 M2F)
DOSING AND PK SAMPLING
22
Drug Sampling
Immediately before dosing on Day 8 (baseline) Days 11 to 14 and Days 18 to 21 at 2 4 6 9 12 16 19 22 and 24 hours after dosing on Day 14 and at 2 4 6 9 12 16 19 22 24 27 30 34 40 48 72 96 and 120 hours after dosing on Day 21 for subjects receiving ER OROS paliperidone immediately before the morning dose on Day 8 (baseline) and Days 18 to 21 and at 1 2 3 4 6 8 12 13 14 15 16 24 36 48 72 96 and 120 hours after the morning dose on Day 21 for subjects receiving risperidone
R076477-SCH-102 STUDY=9
23
index dataset and the remaining 30 constituted the qualification dataset
When concomitant medication was present one day before the PK sampling day the flag for concomitant medication was set to 1 (present) on the PK day even though the concomitant medication was stopped the day before
Planned Analysis for Risperidone and the Active Moiety
The analysis consisted of two separate population PK analyses one for risperidone and one for the active moiety in the pool of children adolescent and adult subjects after oral administration of risperidone For both risperidone and the active moiety (ie sum of the risperidone + 9 hydroxy risperidone plasma levels) the population PK analysis consisted of the following steps bull An exploratory analysis of concentration-time data and covariates identification of potential outliers At this stage prior PK and other relevant information to support the structural model selection was used particularly the results of previous modeling activities bull Using the index dataset evaluation of a base and a covariate model (demographics body size variables and study) bull Model qualification and model adjustment if needed bull Estimation of the model on the full dataset and exploration of the effect of concomitant medications bull Estimation of the final model with the effect of concomitant medications
IDENTIFICATION OF OUTLIERS
Data points were considered as potential outliers if they substantially deviated from adjacent points in the concentration-time profiles Final outlier identification was performed after selecting a structural model and was based on the graphical exploration of individual and population residuals (weighted and non-weighted) After the model development was complete the final model was fitted to the entire data set with all excluded outliers in and the results were compared
Outlier identification in the sparse data set was performed through a different approach Initially posterior predictions were generated for each individual by fitting the structural model to the sparse data Individual and population residuals (weighted and non-weighted) were analyzed graphically and potential outliers were identified For individuals with outliers the observations were plotted against the time since the last dose (one subject per panel) and were superimposed with the corresponding individual and population predictions The outliers that deviated both in terms of residuals
25
and observations were finally identified and excluded unless other factors (like co-administration of other drugs) caused the deviation of the concentration from predicted levels
DERIVED TRANSFORMED AND MISSING DATA
If a given covariate either categorical or continuous was missing in more than 15 of patients it was omitted from the analysis If necessary an analysis of subpopulations was performed In the current dataset weight and height were missing for two subjects in Study RIS-USA-239 the missing values were replaced by the median by sex in the study population For the exploratory data analysis the creatinine clearance (CRCL) in the populations derivation used the Cockroft-Gault equation for all subjects pediatric and adults The influence of CRCL on the active moiety and risperidone PK was explored in NONMEM using several different values using the Schwartz equation for the pediatric population or the Cockroft-Gault equation for the adult population Creatinine clearance (CRCL in mLmin) was derived within the NMTRAN control file
(b) (4)
5 Page(s) has been Withheld in Full as b4 (CCITS) immediately following this page
26
(b) (4)
RESULTS
Demographic and Baseline Characteristics
Table 4 Summary statistics of demographic and baseline characteristics
32
33
Table 5 The number of subjects () taking the selected concomitant medications included in the population PK analysis
Due to the small numbers of subjects receiving concomitant CYP3A4 inducers CYP2D6 inducers methylphenidate or mood stabilizers was too small to allow analysis
FIRMrsquoS ANALYSIS
ACTIVE MOIETY INDEX DATA SET
The best model to describe the concentrations of the active moiety was a two-compartment model with first order input and a lag time
Allometric scaling factors for clearance and volume and the effect of creatinine clearance (derived with the Schwartz formula for the actual CRCL) were included a priori in the model
To correct for the underprediction at the beginning of the distribution phase observed in the data rich studies a study effect was tested on the volume of the central compartment The volume of the central compartment was shown to be lower in Studies RIS-USA-160 RIS-NED-25 RIS-P01-103 and RIS-RSA-5
Interindividual variability (IIV) was estimated for apparent clearance (CLF) apparent central volume (V2F) Ka and relative bioavailability (F1) Two separate additive models described the residual error one for the single dose studies and the other one for the repeated dosing studies The firmrsquos base model control stream for the active moiety is presented in Appendix I
The population estimates for the base model (using the FO method) are reported in Table 6
Table 6 Base Model Parameters for Active Moiety After Oral Administration of Risperidone Results were obtained With the Index Dataset Using the FO Method
34
MODEL QUALIFICATION Figure 2 presents the diagnostic plots of the model qualification PRED vs DV IPRED vs DV WRES vs PRED and IRES vs IPRED
Figure 3 External Qualification of the Active Moiety Final Model ndash Qualification Dataset a PRED Versus DV
36
(b) (4)
37
EFFECT OF CO-MEDICATIONS The effect of co-medication was assessed using the full dataset A summary of the univariate analyses of DDI is reported in Table
Table 8 Drug drug interactions ndashActive moiety
There were no significant drug drug interactions indicated except for GPID (PGP inducers) however this PGP inducers effect should be interpreted with caution since only 7 out of 780 patients took this medication
FINAL PK MODEL OF THE ACTIVE MOIETY ndash FULL DATASET
After including all significant effects the final PK parameters of the active moiety were estimated using the FOCE method To obtain a minimization with a successful covariance step the model had to be further simplified the covariance between CLF and F1 was removed and the random effect on Ka was deleted
Table 9 Final Model Parameters for Active Moiety After Oral Administration of Risperidone Results are Obtained With the Full Dataset Using the FOCE Method
38
Figure 5 Simulated Concentrations of Active Moiety in NonBlack Subjects Treated With 3 mgday (Split bid Dose) of Risperidone (5th 25th 50th 75th and 95th percentile
42
Figure 5 Simulated Concentrations of Active Moiety in NonBlack Subjects Treated With 3 mgday (qd Dose) of Risperidone (5th 25th 50th 75th and 95th
percentile
43
QF θ4 147(0119) 148(0122) Ka θ5 548(0654) 548(0657) ALAG1 θ7 024(000189) 024(000189) F1 1 Fixed 1 Fixed
IIV on CL ω2 1 00648(00137) 0068(00158)
IIV on V2 ω2 2 00105(00146) 00076(00139)
IIV on Ka ω2 3 627(134) 631(136)
IIV on F1 ω2 4 0197(00358) 0225(0048)
Residual variability Study 123459F2
1 Study 678F2
2
00692(00112) 024 (0033)
00692(00112) 024 (0044)
(b) (4)
FINAL MODEL ACTIVE MOIETY FINAL MODEL WOULD NOT RUN ON MY COMPUTER BUT DID RUN ON YANINGrsquoS RESULTS WERE FOUND TO BE THE SAME AS FOR THE SPONSOR
(b) (4)
COMMENT
59
DOSES OF 2 3 4 6 MG KG
C 40 o n c e n t r 30 a t i o n
o f 20
A c t i v e 10
M o i e t y 0
2 3 4 6
CHI LD ADOL ADULT CHI LD ADOL ADULT CHI LD ADOL ADULT CHI LD ADOL ADULT
Pat i ent Popul at i on
1 There was minimal change in the base model results with study 2 deleted 2 FDA results for the base and final models were identical to the firmrsquos
results
The firmrsquos analysis was further checked by selecting times after dose for the observed data based upon the sampling schedules for studies 1 2 and 3 These were used to make comparisons to the other adult studies at the same times after dose for the intensive sampling studies Trough samples were selected based upon time of last dose that were comparable between the studies These were further sorted based upon dose with the final concentrations normalized to dose
Figure 9 Comparison of adolescent and adult data observed data as a function of normalized dose for Active moiety at trough
Comment
60
1 Mean values for the active moiety were similar for adults and children and adolescents at trough based upon mgkg
BASE MODEL - RISPERIDONE
Table 12 Comparative results were Parameter Firmrsquos analysis FDA analysis FDA analysis
Estimate (Rel SE) (Rel SE) without study 2 (Rel SE)
Ka (b) (4)
603(91) 603(90) CL
49(129) 51(134) θ2 0782(118) 0782(118)
V2F θ3
θ9 323(136) 331(141)
V3F θ4 256(216) 255(233) QF θ5 696(162) 73(179) ALAG1 θ6 024(08) 024(08) F1 Population 1 θ7 35(123) 36(141) Population 2 1(fixed) 1(fixed) Proportion 0346(242) 035(203) population 1 p(1)= θ8 Proportion 0654 0654 population 2 1-p(1)
ω2IIV on Ka 1 83(228) 83(228) IIV on CL ω2
2 0332(173) 038(202) IIV on V2 ω2
3 0261(221) 030(242) Residual variability Study 123459F2
1 0073(191) 0073(191) Study 678F2
2 0828 (115) 0837 (115)
COMMENTS
1There was minimal change in the base model results with study 2 deleted 2 FDA results for the base and final models were identical to the firmrsquos results
61
Table 13 Final Model Parameters for Risperidone After Oral Administration Results are Obtained With the Full Dataset Using the FOCE Method
Parameter Firmrsquos Estimates FDA Estimates
Ka (h-1) Study 123459 θ1 Study 678 θ10
CLF (Lh)=θ2(Weight70)075 θ9 POP1 θ2 θ9
V2F (L)=θ3(Weight70) θ3
V3F (L)=θ4(Weight70) θ4 QF (Lh) θ5 ALAG1 (h) θ6 F1 Population 1 θ7 Population 2
Proportion population 1 P(1)= θ8 Proportion population 2 1-P(1) IIV on CL ω2 1 IIV on V2 ω2 2 IIV on F1 ω2 3 Residual variability on log(conc) Study 1 2 3 4 5 9 σ2 1 Study 6 7 8 σ2 2
(SE) (SE) (b) (4)
An analysis of the trough times after dose concentrations were selected based upon the sampling schedules for studies 1 2 and 3 and analyzed the same as those for the active moiety
Figure 10 Comparison of adolescent and adult data observed data as a function of normalized dose for Risperidone at trough
62
DOSES OF 2 3 4 6 MG KG
30 C o n c e n t r a t 20 i o n
o f
R i 10 s p e r i d o n e
0
2 3 4 6
CHI LD ADOL ADULT CHI LD ADOL ADULT CHI LD ADOL ADULT CHI LD ADOL ADULT
Pat i ent Popul at i on
DISCUSSION
The results from this analysis indicates that based upon the model developed to describe risperidone and the active moiety that there are differences in clearance between adolescents children and adults Values for the standard errors indicated that the parameters were estimated with precisions usually less than 25 The residual variability remained high suggesting that assumptions about dosing history may be incorrect or sampling datetime may not be accurate for some subjects at steady state
The analysis of the raw trough data based upon time after dosing supports the model results indicating that weight normalized doses are comparable in children adolescents and adults in the dose range 2345 and 6 mgkg However based upon the lack of a clear dose response relationship for both indications dosing based upon body weight is not recommended Recommended doses for schizophrenia is 3 mg QD while that for bipolar should be initiated at 05 mg QD with adjustment of 05-1 mgday as tolerated
5 Page(s) of Draft Labeling have been Withheld in Full as b4 (CCITS) immediately following this page
63
---------------------------------------------------------------------------------------------------------------------
---------------------------------------------------------------------------------------------------------------------
---------------------
This is a representation of an electronic record that was signed electronically and this page is the manifestation of the electronic signature
s
Andre Jackson 6132007 075956 AM BIOPHARMACEUTICS
Yaning Wang 6132007 012858 PM BIOPHARMACEUTICS
Raman Baweja 6132007 030822 PM BIOPHARMACEUTICS

Study Design
This was a single-center Phase 1 open randomized 2-way crossover bioequivalence study in 40 subjects with schizophrenia or schizoaffective disorder The study consisted of 2 treatment periods 5 days per period separated by a washout period of at least 10 days between administration of study drug on Day 1 of Period 1 and administration of study drug on Day 1 of Period 2 The study duration was approximately 6 weeks (including the screening period) Subjects remained in the study facility for approximately 18 days
DOSING AND PK SAMPLING
16
Table 1 Time and event schedule for study RIS-PO1-RO3
ANALYTICAL
17
STUDY RSA-5-(STUDY 8)- ADULTS
OBJECTIVE
The primary objective of this study was to demonstrate the bioequivalence
Study Design
This was a Phase I open randomized 2-way cross-over bioequivalence study in 36 subjects with schizophrenia or schizoaffective disorder The subjects received in a randomized manner a single oral dose of 4 mg risperidone on two occasions
The duration of the study was approximately 6 weeks
DOSING AND PK SAMPLING
with respect to risperidone and active moiety between a single oral dose of 4 mg risperidone given as a 4 mg tablet manufactured
and as a 4 mg RISPERDALor currently marketed tablet
(b) (4)
- Treatment A RISPERDALD marketed tablet - Treatment B tablet manufactured
The pharmacokinetics of risperidone were assessed up to 96 hours post dosing The wash-out period between treatments was at least 10 days
(b) (4)
19
Table 1a Time and event schedule for study RIS-RSA-5
RIS-RSA-5 STU=8 DATE STUDY INITIATED 22 April 2002 DATE STUDY COMPLETED 10 July 2002 Study dates Starting date Completion date Sample receipt Analytical Stud Sample analysis
(b) (4)
(b) (4)
20
(b) (4)
STUDY R076477-SCH-102 STUDY 9- ADULTS
OBJECTIVE
The primary objectives of the study were to compare the steady-state pharmacokinetics of paliperidone after oral administration of 15 mg ER OROS paliperidone once daily with the steady-state pharmacokinetics of paliperidone after oral administration of 8 mg IR risperidone twice daily and to explore the dose-proportionality of 9 mg and 15 mg ER OROS paliperidone
Study Design
21
A dose of 15 mg ER OROS paliperidone once daily was chosen because this is the highest dose of ER OROS paliperidone that is proposed for use in the Phase 3 studies The dose of risperidone was chosen because 8 mg twice daily is the highest registered dose of risperidone Study medication was administered after a (high-fat) breakfast as in a previous study the exposure to paliperidone increased by circa 10 after intake of food1 Food does not affect the pharmacokinetics of risperidone The study was done in 17 subjects (17 M2F)
DOSING AND PK SAMPLING
22
Drug Sampling
Immediately before dosing on Day 8 (baseline) Days 11 to 14 and Days 18 to 21 at 2 4 6 9 12 16 19 22 and 24 hours after dosing on Day 14 and at 2 4 6 9 12 16 19 22 24 27 30 34 40 48 72 96 and 120 hours after dosing on Day 21 for subjects receiving ER OROS paliperidone immediately before the morning dose on Day 8 (baseline) and Days 18 to 21 and at 1 2 3 4 6 8 12 13 14 15 16 24 36 48 72 96 and 120 hours after the morning dose on Day 21 for subjects receiving risperidone
R076477-SCH-102 STUDY=9
23
index dataset and the remaining 30 constituted the qualification dataset
When concomitant medication was present one day before the PK sampling day the flag for concomitant medication was set to 1 (present) on the PK day even though the concomitant medication was stopped the day before
Planned Analysis for Risperidone and the Active Moiety
The analysis consisted of two separate population PK analyses one for risperidone and one for the active moiety in the pool of children adolescent and adult subjects after oral administration of risperidone For both risperidone and the active moiety (ie sum of the risperidone + 9 hydroxy risperidone plasma levels) the population PK analysis consisted of the following steps bull An exploratory analysis of concentration-time data and covariates identification of potential outliers At this stage prior PK and other relevant information to support the structural model selection was used particularly the results of previous modeling activities bull Using the index dataset evaluation of a base and a covariate model (demographics body size variables and study) bull Model qualification and model adjustment if needed bull Estimation of the model on the full dataset and exploration of the effect of concomitant medications bull Estimation of the final model with the effect of concomitant medications
IDENTIFICATION OF OUTLIERS
Data points were considered as potential outliers if they substantially deviated from adjacent points in the concentration-time profiles Final outlier identification was performed after selecting a structural model and was based on the graphical exploration of individual and population residuals (weighted and non-weighted) After the model development was complete the final model was fitted to the entire data set with all excluded outliers in and the results were compared
Outlier identification in the sparse data set was performed through a different approach Initially posterior predictions were generated for each individual by fitting the structural model to the sparse data Individual and population residuals (weighted and non-weighted) were analyzed graphically and potential outliers were identified For individuals with outliers the observations were plotted against the time since the last dose (one subject per panel) and were superimposed with the corresponding individual and population predictions The outliers that deviated both in terms of residuals
25
and observations were finally identified and excluded unless other factors (like co-administration of other drugs) caused the deviation of the concentration from predicted levels
DERIVED TRANSFORMED AND MISSING DATA
If a given covariate either categorical or continuous was missing in more than 15 of patients it was omitted from the analysis If necessary an analysis of subpopulations was performed In the current dataset weight and height were missing for two subjects in Study RIS-USA-239 the missing values were replaced by the median by sex in the study population For the exploratory data analysis the creatinine clearance (CRCL) in the populations derivation used the Cockroft-Gault equation for all subjects pediatric and adults The influence of CRCL on the active moiety and risperidone PK was explored in NONMEM using several different values using the Schwartz equation for the pediatric population or the Cockroft-Gault equation for the adult population Creatinine clearance (CRCL in mLmin) was derived within the NMTRAN control file
(b) (4)
5 Page(s) has been Withheld in Full as b4 (CCITS) immediately following this page
26
(b) (4)
RESULTS
Demographic and Baseline Characteristics
Table 4 Summary statistics of demographic and baseline characteristics
32
33
Table 5 The number of subjects () taking the selected concomitant medications included in the population PK analysis
Due to the small numbers of subjects receiving concomitant CYP3A4 inducers CYP2D6 inducers methylphenidate or mood stabilizers was too small to allow analysis
FIRMrsquoS ANALYSIS
ACTIVE MOIETY INDEX DATA SET
The best model to describe the concentrations of the active moiety was a two-compartment model with first order input and a lag time
Allometric scaling factors for clearance and volume and the effect of creatinine clearance (derived with the Schwartz formula for the actual CRCL) were included a priori in the model
To correct for the underprediction at the beginning of the distribution phase observed in the data rich studies a study effect was tested on the volume of the central compartment The volume of the central compartment was shown to be lower in Studies RIS-USA-160 RIS-NED-25 RIS-P01-103 and RIS-RSA-5
Interindividual variability (IIV) was estimated for apparent clearance (CLF) apparent central volume (V2F) Ka and relative bioavailability (F1) Two separate additive models described the residual error one for the single dose studies and the other one for the repeated dosing studies The firmrsquos base model control stream for the active moiety is presented in Appendix I
The population estimates for the base model (using the FO method) are reported in Table 6
Table 6 Base Model Parameters for Active Moiety After Oral Administration of Risperidone Results were obtained With the Index Dataset Using the FO Method
34
MODEL QUALIFICATION Figure 2 presents the diagnostic plots of the model qualification PRED vs DV IPRED vs DV WRES vs PRED and IRES vs IPRED
Figure 3 External Qualification of the Active Moiety Final Model ndash Qualification Dataset a PRED Versus DV
36
(b) (4)
37
EFFECT OF CO-MEDICATIONS The effect of co-medication was assessed using the full dataset A summary of the univariate analyses of DDI is reported in Table
Table 8 Drug drug interactions ndashActive moiety
There were no significant drug drug interactions indicated except for GPID (PGP inducers) however this PGP inducers effect should be interpreted with caution since only 7 out of 780 patients took this medication
FINAL PK MODEL OF THE ACTIVE MOIETY ndash FULL DATASET
After including all significant effects the final PK parameters of the active moiety were estimated using the FOCE method To obtain a minimization with a successful covariance step the model had to be further simplified the covariance between CLF and F1 was removed and the random effect on Ka was deleted
Table 9 Final Model Parameters for Active Moiety After Oral Administration of Risperidone Results are Obtained With the Full Dataset Using the FOCE Method
38
Figure 5 Simulated Concentrations of Active Moiety in NonBlack Subjects Treated With 3 mgday (Split bid Dose) of Risperidone (5th 25th 50th 75th and 95th percentile
42
Figure 5 Simulated Concentrations of Active Moiety in NonBlack Subjects Treated With 3 mgday (qd Dose) of Risperidone (5th 25th 50th 75th and 95th
percentile
43
QF θ4 147(0119) 148(0122) Ka θ5 548(0654) 548(0657) ALAG1 θ7 024(000189) 024(000189) F1 1 Fixed 1 Fixed
IIV on CL ω2 1 00648(00137) 0068(00158)
IIV on V2 ω2 2 00105(00146) 00076(00139)
IIV on Ka ω2 3 627(134) 631(136)
IIV on F1 ω2 4 0197(00358) 0225(0048)
Residual variability Study 123459F2
1 Study 678F2
2
00692(00112) 024 (0033)
00692(00112) 024 (0044)
(b) (4)
FINAL MODEL ACTIVE MOIETY FINAL MODEL WOULD NOT RUN ON MY COMPUTER BUT DID RUN ON YANINGrsquoS RESULTS WERE FOUND TO BE THE SAME AS FOR THE SPONSOR
(b) (4)
COMMENT
59
DOSES OF 2 3 4 6 MG KG
C 40 o n c e n t r 30 a t i o n
o f 20
A c t i v e 10
M o i e t y 0
2 3 4 6
CHI LD ADOL ADULT CHI LD ADOL ADULT CHI LD ADOL ADULT CHI LD ADOL ADULT
Pat i ent Popul at i on
1 There was minimal change in the base model results with study 2 deleted 2 FDA results for the base and final models were identical to the firmrsquos
results
The firmrsquos analysis was further checked by selecting times after dose for the observed data based upon the sampling schedules for studies 1 2 and 3 These were used to make comparisons to the other adult studies at the same times after dose for the intensive sampling studies Trough samples were selected based upon time of last dose that were comparable between the studies These were further sorted based upon dose with the final concentrations normalized to dose
Figure 9 Comparison of adolescent and adult data observed data as a function of normalized dose for Active moiety at trough
Comment
60
1 Mean values for the active moiety were similar for adults and children and adolescents at trough based upon mgkg
BASE MODEL - RISPERIDONE
Table 12 Comparative results were Parameter Firmrsquos analysis FDA analysis FDA analysis
Estimate (Rel SE) (Rel SE) without study 2 (Rel SE)
Ka (b) (4)
603(91) 603(90) CL
49(129) 51(134) θ2 0782(118) 0782(118)
V2F θ3
θ9 323(136) 331(141)
V3F θ4 256(216) 255(233) QF θ5 696(162) 73(179) ALAG1 θ6 024(08) 024(08) F1 Population 1 θ7 35(123) 36(141) Population 2 1(fixed) 1(fixed) Proportion 0346(242) 035(203) population 1 p(1)= θ8 Proportion 0654 0654 population 2 1-p(1)
ω2IIV on Ka 1 83(228) 83(228) IIV on CL ω2
2 0332(173) 038(202) IIV on V2 ω2
3 0261(221) 030(242) Residual variability Study 123459F2
1 0073(191) 0073(191) Study 678F2
2 0828 (115) 0837 (115)
COMMENTS
1There was minimal change in the base model results with study 2 deleted 2 FDA results for the base and final models were identical to the firmrsquos results
61
Table 13 Final Model Parameters for Risperidone After Oral Administration Results are Obtained With the Full Dataset Using the FOCE Method
Parameter Firmrsquos Estimates FDA Estimates
Ka (h-1) Study 123459 θ1 Study 678 θ10
CLF (Lh)=θ2(Weight70)075 θ9 POP1 θ2 θ9
V2F (L)=θ3(Weight70) θ3
V3F (L)=θ4(Weight70) θ4 QF (Lh) θ5 ALAG1 (h) θ6 F1 Population 1 θ7 Population 2
Proportion population 1 P(1)= θ8 Proportion population 2 1-P(1) IIV on CL ω2 1 IIV on V2 ω2 2 IIV on F1 ω2 3 Residual variability on log(conc) Study 1 2 3 4 5 9 σ2 1 Study 6 7 8 σ2 2
(SE) (SE) (b) (4)
An analysis of the trough times after dose concentrations were selected based upon the sampling schedules for studies 1 2 and 3 and analyzed the same as those for the active moiety
Figure 10 Comparison of adolescent and adult data observed data as a function of normalized dose for Risperidone at trough
62
DOSES OF 2 3 4 6 MG KG
30 C o n c e n t r a t 20 i o n
o f
R i 10 s p e r i d o n e
0
2 3 4 6
CHI LD ADOL ADULT CHI LD ADOL ADULT CHI LD ADOL ADULT CHI LD ADOL ADULT
Pat i ent Popul at i on
DISCUSSION
The results from this analysis indicates that based upon the model developed to describe risperidone and the active moiety that there are differences in clearance between adolescents children and adults Values for the standard errors indicated that the parameters were estimated with precisions usually less than 25 The residual variability remained high suggesting that assumptions about dosing history may be incorrect or sampling datetime may not be accurate for some subjects at steady state
The analysis of the raw trough data based upon time after dosing supports the model results indicating that weight normalized doses are comparable in children adolescents and adults in the dose range 2345 and 6 mgkg However based upon the lack of a clear dose response relationship for both indications dosing based upon body weight is not recommended Recommended doses for schizophrenia is 3 mg QD while that for bipolar should be initiated at 05 mg QD with adjustment of 05-1 mgday as tolerated
5 Page(s) of Draft Labeling have been Withheld in Full as b4 (CCITS) immediately following this page
63
---------------------------------------------------------------------------------------------------------------------
---------------------------------------------------------------------------------------------------------------------
---------------------
This is a representation of an electronic record that was signed electronically and this page is the manifestation of the electronic signature
s
Andre Jackson 6132007 075956 AM BIOPHARMACEUTICS
Yaning Wang 6132007 012858 PM BIOPHARMACEUTICS
Raman Baweja 6132007 030822 PM BIOPHARMACEUTICS

(b) (4)
STUDY R076477-SCH-102 STUDY 9- ADULTS
OBJECTIVE
The primary objectives of the study were to compare the steady-state pharmacokinetics of paliperidone after oral administration of 15 mg ER OROS paliperidone once daily with the steady-state pharmacokinetics of paliperidone after oral administration of 8 mg IR risperidone twice daily and to explore the dose-proportionality of 9 mg and 15 mg ER OROS paliperidone
Study Design
21
A dose of 15 mg ER OROS paliperidone once daily was chosen because this is the highest dose of ER OROS paliperidone that is proposed for use in the Phase 3 studies The dose of risperidone was chosen because 8 mg twice daily is the highest registered dose of risperidone Study medication was administered after a (high-fat) breakfast as in a previous study the exposure to paliperidone increased by circa 10 after intake of food1 Food does not affect the pharmacokinetics of risperidone The study was done in 17 subjects (17 M2F)
DOSING AND PK SAMPLING
22
Drug Sampling
Immediately before dosing on Day 8 (baseline) Days 11 to 14 and Days 18 to 21 at 2 4 6 9 12 16 19 22 and 24 hours after dosing on Day 14 and at 2 4 6 9 12 16 19 22 24 27 30 34 40 48 72 96 and 120 hours after dosing on Day 21 for subjects receiving ER OROS paliperidone immediately before the morning dose on Day 8 (baseline) and Days 18 to 21 and at 1 2 3 4 6 8 12 13 14 15 16 24 36 48 72 96 and 120 hours after the morning dose on Day 21 for subjects receiving risperidone
R076477-SCH-102 STUDY=9
23
index dataset and the remaining 30 constituted the qualification dataset
When concomitant medication was present one day before the PK sampling day the flag for concomitant medication was set to 1 (present) on the PK day even though the concomitant medication was stopped the day before
Planned Analysis for Risperidone and the Active Moiety
The analysis consisted of two separate population PK analyses one for risperidone and one for the active moiety in the pool of children adolescent and adult subjects after oral administration of risperidone For both risperidone and the active moiety (ie sum of the risperidone + 9 hydroxy risperidone plasma levels) the population PK analysis consisted of the following steps bull An exploratory analysis of concentration-time data and covariates identification of potential outliers At this stage prior PK and other relevant information to support the structural model selection was used particularly the results of previous modeling activities bull Using the index dataset evaluation of a base and a covariate model (demographics body size variables and study) bull Model qualification and model adjustment if needed bull Estimation of the model on the full dataset and exploration of the effect of concomitant medications bull Estimation of the final model with the effect of concomitant medications
IDENTIFICATION OF OUTLIERS
Data points were considered as potential outliers if they substantially deviated from adjacent points in the concentration-time profiles Final outlier identification was performed after selecting a structural model and was based on the graphical exploration of individual and population residuals (weighted and non-weighted) After the model development was complete the final model was fitted to the entire data set with all excluded outliers in and the results were compared
Outlier identification in the sparse data set was performed through a different approach Initially posterior predictions were generated for each individual by fitting the structural model to the sparse data Individual and population residuals (weighted and non-weighted) were analyzed graphically and potential outliers were identified For individuals with outliers the observations were plotted against the time since the last dose (one subject per panel) and were superimposed with the corresponding individual and population predictions The outliers that deviated both in terms of residuals
25
and observations were finally identified and excluded unless other factors (like co-administration of other drugs) caused the deviation of the concentration from predicted levels
DERIVED TRANSFORMED AND MISSING DATA
If a given covariate either categorical or continuous was missing in more than 15 of patients it was omitted from the analysis If necessary an analysis of subpopulations was performed In the current dataset weight and height were missing for two subjects in Study RIS-USA-239 the missing values were replaced by the median by sex in the study population For the exploratory data analysis the creatinine clearance (CRCL) in the populations derivation used the Cockroft-Gault equation for all subjects pediatric and adults The influence of CRCL on the active moiety and risperidone PK was explored in NONMEM using several different values using the Schwartz equation for the pediatric population or the Cockroft-Gault equation for the adult population Creatinine clearance (CRCL in mLmin) was derived within the NMTRAN control file
(b) (4)
5 Page(s) has been Withheld in Full as b4 (CCITS) immediately following this page
26
(b) (4)
RESULTS
Demographic and Baseline Characteristics
Table 4 Summary statistics of demographic and baseline characteristics
32
33
Table 5 The number of subjects () taking the selected concomitant medications included in the population PK analysis
Due to the small numbers of subjects receiving concomitant CYP3A4 inducers CYP2D6 inducers methylphenidate or mood stabilizers was too small to allow analysis
FIRMrsquoS ANALYSIS
ACTIVE MOIETY INDEX DATA SET
The best model to describe the concentrations of the active moiety was a two-compartment model with first order input and a lag time
Allometric scaling factors for clearance and volume and the effect of creatinine clearance (derived with the Schwartz formula for the actual CRCL) were included a priori in the model
To correct for the underprediction at the beginning of the distribution phase observed in the data rich studies a study effect was tested on the volume of the central compartment The volume of the central compartment was shown to be lower in Studies RIS-USA-160 RIS-NED-25 RIS-P01-103 and RIS-RSA-5
Interindividual variability (IIV) was estimated for apparent clearance (CLF) apparent central volume (V2F) Ka and relative bioavailability (F1) Two separate additive models described the residual error one for the single dose studies and the other one for the repeated dosing studies The firmrsquos base model control stream for the active moiety is presented in Appendix I
The population estimates for the base model (using the FO method) are reported in Table 6
Table 6 Base Model Parameters for Active Moiety After Oral Administration of Risperidone Results were obtained With the Index Dataset Using the FO Method
34
MODEL QUALIFICATION Figure 2 presents the diagnostic plots of the model qualification PRED vs DV IPRED vs DV WRES vs PRED and IRES vs IPRED
Figure 3 External Qualification of the Active Moiety Final Model ndash Qualification Dataset a PRED Versus DV
36
(b) (4)
37
EFFECT OF CO-MEDICATIONS The effect of co-medication was assessed using the full dataset A summary of the univariate analyses of DDI is reported in Table
Table 8 Drug drug interactions ndashActive moiety
There were no significant drug drug interactions indicated except for GPID (PGP inducers) however this PGP inducers effect should be interpreted with caution since only 7 out of 780 patients took this medication
FINAL PK MODEL OF THE ACTIVE MOIETY ndash FULL DATASET
After including all significant effects the final PK parameters of the active moiety were estimated using the FOCE method To obtain a minimization with a successful covariance step the model had to be further simplified the covariance between CLF and F1 was removed and the random effect on Ka was deleted
Table 9 Final Model Parameters for Active Moiety After Oral Administration of Risperidone Results are Obtained With the Full Dataset Using the FOCE Method
38
Figure 5 Simulated Concentrations of Active Moiety in NonBlack Subjects Treated With 3 mgday (Split bid Dose) of Risperidone (5th 25th 50th 75th and 95th percentile
42
Figure 5 Simulated Concentrations of Active Moiety in NonBlack Subjects Treated With 3 mgday (qd Dose) of Risperidone (5th 25th 50th 75th and 95th
percentile
43
QF θ4 147(0119) 148(0122) Ka θ5 548(0654) 548(0657) ALAG1 θ7 024(000189) 024(000189) F1 1 Fixed 1 Fixed
IIV on CL ω2 1 00648(00137) 0068(00158)
IIV on V2 ω2 2 00105(00146) 00076(00139)
IIV on Ka ω2 3 627(134) 631(136)
IIV on F1 ω2 4 0197(00358) 0225(0048)
Residual variability Study 123459F2
1 Study 678F2
2
00692(00112) 024 (0033)
00692(00112) 024 (0044)
(b) (4)
FINAL MODEL ACTIVE MOIETY FINAL MODEL WOULD NOT RUN ON MY COMPUTER BUT DID RUN ON YANINGrsquoS RESULTS WERE FOUND TO BE THE SAME AS FOR THE SPONSOR
(b) (4)
COMMENT
59
DOSES OF 2 3 4 6 MG KG
C 40 o n c e n t r 30 a t i o n
o f 20
A c t i v e 10
M o i e t y 0
2 3 4 6
CHI LD ADOL ADULT CHI LD ADOL ADULT CHI LD ADOL ADULT CHI LD ADOL ADULT
Pat i ent Popul at i on
1 There was minimal change in the base model results with study 2 deleted 2 FDA results for the base and final models were identical to the firmrsquos
results
The firmrsquos analysis was further checked by selecting times after dose for the observed data based upon the sampling schedules for studies 1 2 and 3 These were used to make comparisons to the other adult studies at the same times after dose for the intensive sampling studies Trough samples were selected based upon time of last dose that were comparable between the studies These were further sorted based upon dose with the final concentrations normalized to dose
Figure 9 Comparison of adolescent and adult data observed data as a function of normalized dose for Active moiety at trough
Comment
60
1 Mean values for the active moiety were similar for adults and children and adolescents at trough based upon mgkg
BASE MODEL - RISPERIDONE
Table 12 Comparative results were Parameter Firmrsquos analysis FDA analysis FDA analysis
Estimate (Rel SE) (Rel SE) without study 2 (Rel SE)
Ka (b) (4)
603(91) 603(90) CL
49(129) 51(134) θ2 0782(118) 0782(118)
V2F θ3
θ9 323(136) 331(141)
V3F θ4 256(216) 255(233) QF θ5 696(162) 73(179) ALAG1 θ6 024(08) 024(08) F1 Population 1 θ7 35(123) 36(141) Population 2 1(fixed) 1(fixed) Proportion 0346(242) 035(203) population 1 p(1)= θ8 Proportion 0654 0654 population 2 1-p(1)
ω2IIV on Ka 1 83(228) 83(228) IIV on CL ω2
2 0332(173) 038(202) IIV on V2 ω2
3 0261(221) 030(242) Residual variability Study 123459F2
1 0073(191) 0073(191) Study 678F2
2 0828 (115) 0837 (115)
COMMENTS
1There was minimal change in the base model results with study 2 deleted 2 FDA results for the base and final models were identical to the firmrsquos results
61
Table 13 Final Model Parameters for Risperidone After Oral Administration Results are Obtained With the Full Dataset Using the FOCE Method
Parameter Firmrsquos Estimates FDA Estimates
Ka (h-1) Study 123459 θ1 Study 678 θ10
CLF (Lh)=θ2(Weight70)075 θ9 POP1 θ2 θ9
V2F (L)=θ3(Weight70) θ3
V3F (L)=θ4(Weight70) θ4 QF (Lh) θ5 ALAG1 (h) θ6 F1 Population 1 θ7 Population 2
Proportion population 1 P(1)= θ8 Proportion population 2 1-P(1) IIV on CL ω2 1 IIV on V2 ω2 2 IIV on F1 ω2 3 Residual variability on log(conc) Study 1 2 3 4 5 9 σ2 1 Study 6 7 8 σ2 2
(SE) (SE) (b) (4)
An analysis of the trough times after dose concentrations were selected based upon the sampling schedules for studies 1 2 and 3 and analyzed the same as those for the active moiety
Figure 10 Comparison of adolescent and adult data observed data as a function of normalized dose for Risperidone at trough
62
DOSES OF 2 3 4 6 MG KG
30 C o n c e n t r a t 20 i o n
o f
R i 10 s p e r i d o n e
0
2 3 4 6
CHI LD ADOL ADULT CHI LD ADOL ADULT CHI LD ADOL ADULT CHI LD ADOL ADULT
Pat i ent Popul at i on
DISCUSSION
The results from this analysis indicates that based upon the model developed to describe risperidone and the active moiety that there are differences in clearance between adolescents children and adults Values for the standard errors indicated that the parameters were estimated with precisions usually less than 25 The residual variability remained high suggesting that assumptions about dosing history may be incorrect or sampling datetime may not be accurate for some subjects at steady state
The analysis of the raw trough data based upon time after dosing supports the model results indicating that weight normalized doses are comparable in children adolescents and adults in the dose range 2345 and 6 mgkg However based upon the lack of a clear dose response relationship for both indications dosing based upon body weight is not recommended Recommended doses for schizophrenia is 3 mg QD while that for bipolar should be initiated at 05 mg QD with adjustment of 05-1 mgday as tolerated
5 Page(s) of Draft Labeling have been Withheld in Full as b4 (CCITS) immediately following this page
63
---------------------------------------------------------------------------------------------------------------------
---------------------------------------------------------------------------------------------------------------------
---------------------
This is a representation of an electronic record that was signed electronically and this page is the manifestation of the electronic signature
s
Andre Jackson 6132007 075956 AM BIOPHARMACEUTICS
Yaning Wang 6132007 012858 PM BIOPHARMACEUTICS
Raman Baweja 6132007 030822 PM BIOPHARMACEUTICS
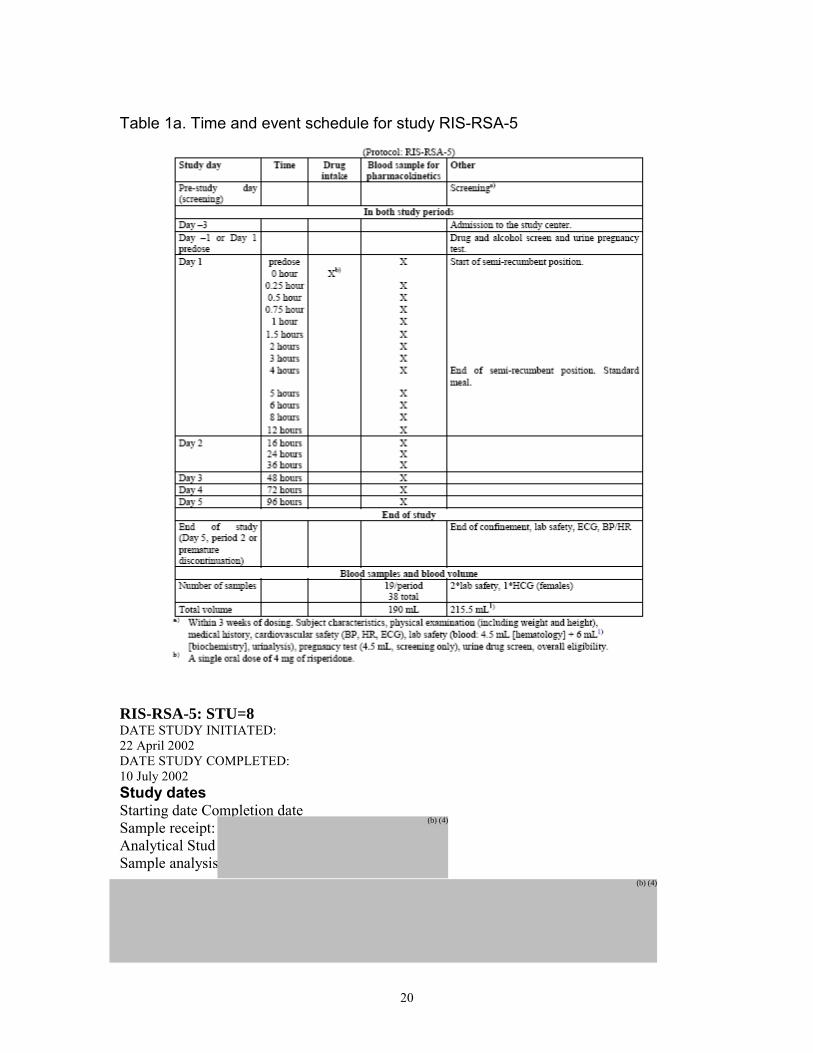
(b) (4)
RESULTS
Demographic and Baseline Characteristics
Table 4 Summary statistics of demographic and baseline characteristics
32
33
Table 5 The number of subjects () taking the selected concomitant medications included in the population PK analysis
Due to the small numbers of subjects receiving concomitant CYP3A4 inducers CYP2D6 inducers methylphenidate or mood stabilizers was too small to allow analysis
FIRMrsquoS ANALYSIS
ACTIVE MOIETY INDEX DATA SET
The best model to describe the concentrations of the active moiety was a two-compartment model with first order input and a lag time
Allometric scaling factors for clearance and volume and the effect of creatinine clearance (derived with the Schwartz formula for the actual CRCL) were included a priori in the model
To correct for the underprediction at the beginning of the distribution phase observed in the data rich studies a study effect was tested on the volume of the central compartment The volume of the central compartment was shown to be lower in Studies RIS-USA-160 RIS-NED-25 RIS-P01-103 and RIS-RSA-5
Interindividual variability (IIV) was estimated for apparent clearance (CLF) apparent central volume (V2F) Ka and relative bioavailability (F1) Two separate additive models described the residual error one for the single dose studies and the other one for the repeated dosing studies The firmrsquos base model control stream for the active moiety is presented in Appendix I
The population estimates for the base model (using the FO method) are reported in Table 6
Table 6 Base Model Parameters for Active Moiety After Oral Administration of Risperidone Results were obtained With the Index Dataset Using the FO Method
34
MODEL QUALIFICATION Figure 2 presents the diagnostic plots of the model qualification PRED vs DV IPRED vs DV WRES vs PRED and IRES vs IPRED
Figure 3 External Qualification of the Active Moiety Final Model ndash Qualification Dataset a PRED Versus DV
36
(b) (4)
37
EFFECT OF CO-MEDICATIONS The effect of co-medication was assessed using the full dataset A summary of the univariate analyses of DDI is reported in Table
Table 8 Drug drug interactions ndashActive moiety
There were no significant drug drug interactions indicated except for GPID (PGP inducers) however this PGP inducers effect should be interpreted with caution since only 7 out of 780 patients took this medication
FINAL PK MODEL OF THE ACTIVE MOIETY ndash FULL DATASET
After including all significant effects the final PK parameters of the active moiety were estimated using the FOCE method To obtain a minimization with a successful covariance step the model had to be further simplified the covariance between CLF and F1 was removed and the random effect on Ka was deleted
Table 9 Final Model Parameters for Active Moiety After Oral Administration of Risperidone Results are Obtained With the Full Dataset Using the FOCE Method
38
Figure 5 Simulated Concentrations of Active Moiety in NonBlack Subjects Treated With 3 mgday (Split bid Dose) of Risperidone (5th 25th 50th 75th and 95th percentile
42
Figure 5 Simulated Concentrations of Active Moiety in NonBlack Subjects Treated With 3 mgday (qd Dose) of Risperidone (5th 25th 50th 75th and 95th
percentile
43
QF θ4 147(0119) 148(0122) Ka θ5 548(0654) 548(0657) ALAG1 θ7 024(000189) 024(000189) F1 1 Fixed 1 Fixed
IIV on CL ω2 1 00648(00137) 0068(00158)
IIV on V2 ω2 2 00105(00146) 00076(00139)
IIV on Ka ω2 3 627(134) 631(136)
IIV on F1 ω2 4 0197(00358) 0225(0048)
Residual variability Study 123459F2
1 Study 678F2
2
00692(00112) 024 (0033)
00692(00112) 024 (0044)
(b) (4)
FINAL MODEL ACTIVE MOIETY FINAL MODEL WOULD NOT RUN ON MY COMPUTER BUT DID RUN ON YANINGrsquoS RESULTS WERE FOUND TO BE THE SAME AS FOR THE SPONSOR
(b) (4)
COMMENT
59
DOSES OF 2 3 4 6 MG KG
C 40 o n c e n t r 30 a t i o n
o f 20
A c t i v e 10
M o i e t y 0
2 3 4 6
CHI LD ADOL ADULT CHI LD ADOL ADULT CHI LD ADOL ADULT CHI LD ADOL ADULT
Pat i ent Popul at i on
1 There was minimal change in the base model results with study 2 deleted 2 FDA results for the base and final models were identical to the firmrsquos
results
The firmrsquos analysis was further checked by selecting times after dose for the observed data based upon the sampling schedules for studies 1 2 and 3 These were used to make comparisons to the other adult studies at the same times after dose for the intensive sampling studies Trough samples were selected based upon time of last dose that were comparable between the studies These were further sorted based upon dose with the final concentrations normalized to dose
Figure 9 Comparison of adolescent and adult data observed data as a function of normalized dose for Active moiety at trough
Comment
60
1 Mean values for the active moiety were similar for adults and children and adolescents at trough based upon mgkg
BASE MODEL - RISPERIDONE
Table 12 Comparative results were Parameter Firmrsquos analysis FDA analysis FDA analysis
Estimate (Rel SE) (Rel SE) without study 2 (Rel SE)
Ka (b) (4)
603(91) 603(90) CL
49(129) 51(134) θ2 0782(118) 0782(118)
V2F θ3
θ9 323(136) 331(141)
V3F θ4 256(216) 255(233) QF θ5 696(162) 73(179) ALAG1 θ6 024(08) 024(08) F1 Population 1 θ7 35(123) 36(141) Population 2 1(fixed) 1(fixed) Proportion 0346(242) 035(203) population 1 p(1)= θ8 Proportion 0654 0654 population 2 1-p(1)
ω2IIV on Ka 1 83(228) 83(228) IIV on CL ω2
2 0332(173) 038(202) IIV on V2 ω2
3 0261(221) 030(242) Residual variability Study 123459F2
1 0073(191) 0073(191) Study 678F2
2 0828 (115) 0837 (115)
COMMENTS
1There was minimal change in the base model results with study 2 deleted 2 FDA results for the base and final models were identical to the firmrsquos results
61
Table 13 Final Model Parameters for Risperidone After Oral Administration Results are Obtained With the Full Dataset Using the FOCE Method
Parameter Firmrsquos Estimates FDA Estimates
Ka (h-1) Study 123459 θ1 Study 678 θ10
CLF (Lh)=θ2(Weight70)075 θ9 POP1 θ2 θ9
V2F (L)=θ3(Weight70) θ3
V3F (L)=θ4(Weight70) θ4 QF (Lh) θ5 ALAG1 (h) θ6 F1 Population 1 θ7 Population 2
Proportion population 1 P(1)= θ8 Proportion population 2 1-P(1) IIV on CL ω2 1 IIV on V2 ω2 2 IIV on F1 ω2 3 Residual variability on log(conc) Study 1 2 3 4 5 9 σ2 1 Study 6 7 8 σ2 2
(SE) (SE) (b) (4)
An analysis of the trough times after dose concentrations were selected based upon the sampling schedules for studies 1 2 and 3 and analyzed the same as those for the active moiety
Figure 10 Comparison of adolescent and adult data observed data as a function of normalized dose for Risperidone at trough
62
DOSES OF 2 3 4 6 MG KG
30 C o n c e n t r a t 20 i o n
o f
R i 10 s p e r i d o n e
0
2 3 4 6
CHI LD ADOL ADULT CHI LD ADOL ADULT CHI LD ADOL ADULT CHI LD ADOL ADULT
Pat i ent Popul at i on
DISCUSSION
The results from this analysis indicates that based upon the model developed to describe risperidone and the active moiety that there are differences in clearance between adolescents children and adults Values for the standard errors indicated that the parameters were estimated with precisions usually less than 25 The residual variability remained high suggesting that assumptions about dosing history may be incorrect or sampling datetime may not be accurate for some subjects at steady state
The analysis of the raw trough data based upon time after dosing supports the model results indicating that weight normalized doses are comparable in children adolescents and adults in the dose range 2345 and 6 mgkg However based upon the lack of a clear dose response relationship for both indications dosing based upon body weight is not recommended Recommended doses for schizophrenia is 3 mg QD while that for bipolar should be initiated at 05 mg QD with adjustment of 05-1 mgday as tolerated
5 Page(s) of Draft Labeling have been Withheld in Full as b4 (CCITS) immediately following this page
63
---------------------------------------------------------------------------------------------------------------------
---------------------------------------------------------------------------------------------------------------------
---------------------
This is a representation of an electronic record that was signed electronically and this page is the manifestation of the electronic signature
s
Andre Jackson 6132007 075956 AM BIOPHARMACEUTICS
Yaning Wang 6132007 012858 PM BIOPHARMACEUTICS
Raman Baweja 6132007 030822 PM BIOPHARMACEUTICS
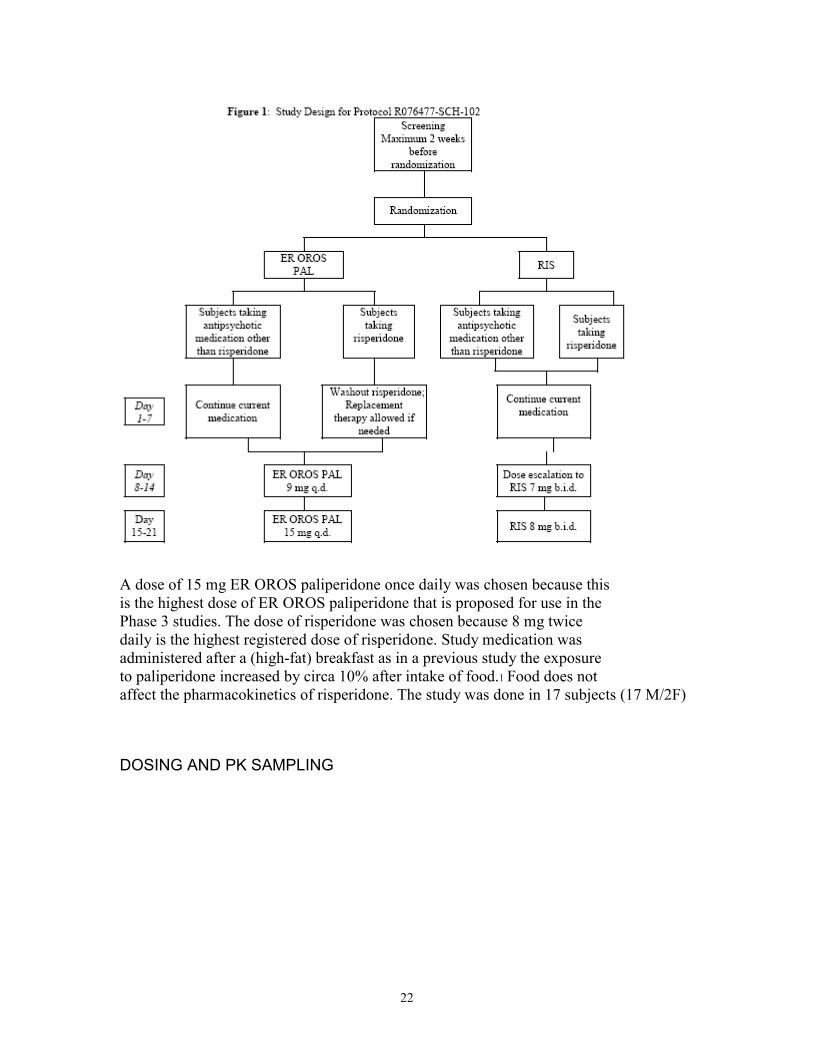
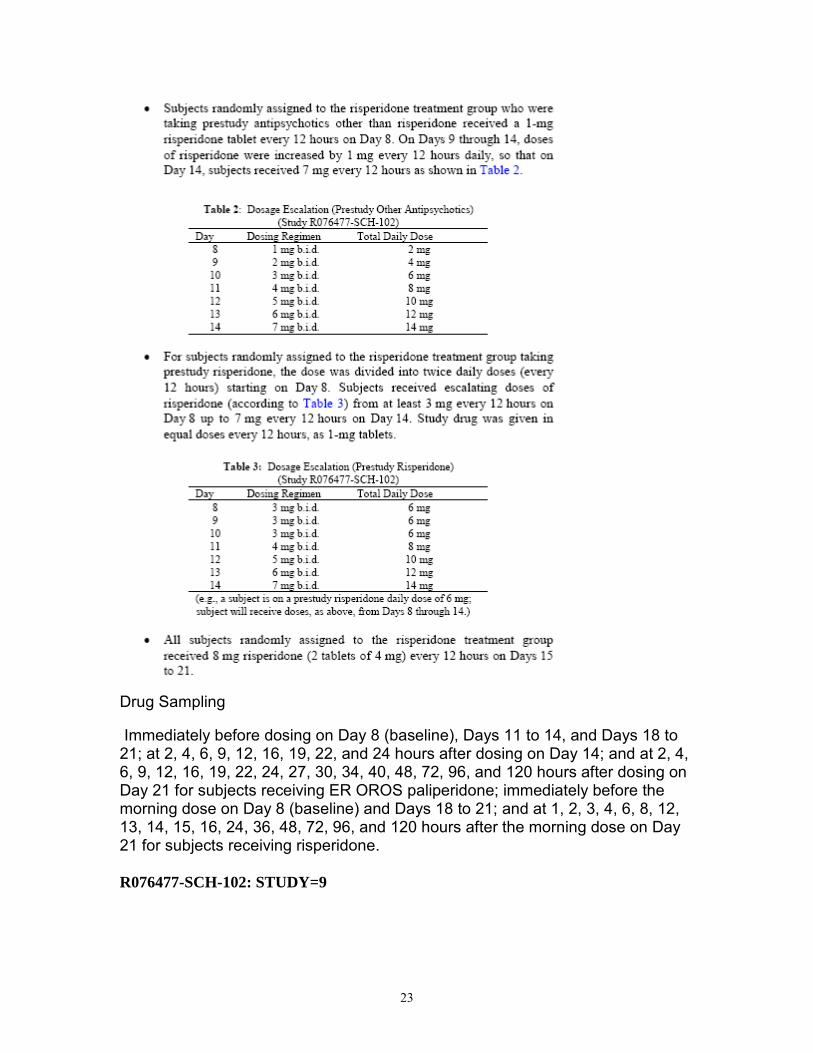

(b) (4)
37
EFFECT OF CO-MEDICATIONS The effect of co-medication was assessed using the full dataset A summary of the univariate analyses of DDI is reported in Table
Table 8 Drug drug interactions ndashActive moiety
There were no significant drug drug interactions indicated except for GPID (PGP inducers) however this PGP inducers effect should be interpreted with caution since only 7 out of 780 patients took this medication
FINAL PK MODEL OF THE ACTIVE MOIETY ndash FULL DATASET
After including all significant effects the final PK parameters of the active moiety were estimated using the FOCE method To obtain a minimization with a successful covariance step the model had to be further simplified the covariance between CLF and F1 was removed and the random effect on Ka was deleted
Table 9 Final Model Parameters for Active Moiety After Oral Administration of Risperidone Results are Obtained With the Full Dataset Using the FOCE Method
38
Figure 5 Simulated Concentrations of Active Moiety in NonBlack Subjects Treated With 3 mgday (Split bid Dose) of Risperidone (5th 25th 50th 75th and 95th percentile
42
Figure 5 Simulated Concentrations of Active Moiety in NonBlack Subjects Treated With 3 mgday (qd Dose) of Risperidone (5th 25th 50th 75th and 95th
percentile
43
QF θ4 147(0119) 148(0122) Ka θ5 548(0654) 548(0657) ALAG1 θ7 024(000189) 024(000189) F1 1 Fixed 1 Fixed
IIV on CL ω2 1 00648(00137) 0068(00158)
IIV on V2 ω2 2 00105(00146) 00076(00139)
IIV on Ka ω2 3 627(134) 631(136)
IIV on F1 ω2 4 0197(00358) 0225(0048)
Residual variability Study 123459F2
1 Study 678F2
2
00692(00112) 024 (0033)
00692(00112) 024 (0044)
(b) (4)
FINAL MODEL ACTIVE MOIETY FINAL MODEL WOULD NOT RUN ON MY COMPUTER BUT DID RUN ON YANINGrsquoS RESULTS WERE FOUND TO BE THE SAME AS FOR THE SPONSOR
(b) (4)
COMMENT
59
DOSES OF 2 3 4 6 MG KG
C 40 o n c e n t r 30 a t i o n
o f 20
A c t i v e 10
M o i e t y 0
2 3 4 6
CHI LD ADOL ADULT CHI LD ADOL ADULT CHI LD ADOL ADULT CHI LD ADOL ADULT
Pat i ent Popul at i on
1 There was minimal change in the base model results with study 2 deleted 2 FDA results for the base and final models were identical to the firmrsquos
results
The firmrsquos analysis was further checked by selecting times after dose for the observed data based upon the sampling schedules for studies 1 2 and 3 These were used to make comparisons to the other adult studies at the same times after dose for the intensive sampling studies Trough samples were selected based upon time of last dose that were comparable between the studies These were further sorted based upon dose with the final concentrations normalized to dose
Figure 9 Comparison of adolescent and adult data observed data as a function of normalized dose for Active moiety at trough
Comment
60
1 Mean values for the active moiety were similar for adults and children and adolescents at trough based upon mgkg
BASE MODEL - RISPERIDONE
Table 12 Comparative results were Parameter Firmrsquos analysis FDA analysis FDA analysis
Estimate (Rel SE) (Rel SE) without study 2 (Rel SE)
Ka (b) (4)
603(91) 603(90) CL
49(129) 51(134) θ2 0782(118) 0782(118)
V2F θ3
θ9 323(136) 331(141)
V3F θ4 256(216) 255(233) QF θ5 696(162) 73(179) ALAG1 θ6 024(08) 024(08) F1 Population 1 θ7 35(123) 36(141) Population 2 1(fixed) 1(fixed) Proportion 0346(242) 035(203) population 1 p(1)= θ8 Proportion 0654 0654 population 2 1-p(1)
ω2IIV on Ka 1 83(228) 83(228) IIV on CL ω2
2 0332(173) 038(202) IIV on V2 ω2
3 0261(221) 030(242) Residual variability Study 123459F2
1 0073(191) 0073(191) Study 678F2
2 0828 (115) 0837 (115)
COMMENTS
1There was minimal change in the base model results with study 2 deleted 2 FDA results for the base and final models were identical to the firmrsquos results
61
Table 13 Final Model Parameters for Risperidone After Oral Administration Results are Obtained With the Full Dataset Using the FOCE Method
Parameter Firmrsquos Estimates FDA Estimates
Ka (h-1) Study 123459 θ1 Study 678 θ10
CLF (Lh)=θ2(Weight70)075 θ9 POP1 θ2 θ9
V2F (L)=θ3(Weight70) θ3
V3F (L)=θ4(Weight70) θ4 QF (Lh) θ5 ALAG1 (h) θ6 F1 Population 1 θ7 Population 2
Proportion population 1 P(1)= θ8 Proportion population 2 1-P(1) IIV on CL ω2 1 IIV on V2 ω2 2 IIV on F1 ω2 3 Residual variability on log(conc) Study 1 2 3 4 5 9 σ2 1 Study 6 7 8 σ2 2
(SE) (SE) (b) (4)
An analysis of the trough times after dose concentrations were selected based upon the sampling schedules for studies 1 2 and 3 and analyzed the same as those for the active moiety
Figure 10 Comparison of adolescent and adult data observed data as a function of normalized dose for Risperidone at trough
62
DOSES OF 2 3 4 6 MG KG
30 C o n c e n t r a t 20 i o n
o f
R i 10 s p e r i d o n e
0
2 3 4 6
CHI LD ADOL ADULT CHI LD ADOL ADULT CHI LD ADOL ADULT CHI LD ADOL ADULT
Pat i ent Popul at i on
DISCUSSION
The results from this analysis indicates that based upon the model developed to describe risperidone and the active moiety that there are differences in clearance between adolescents children and adults Values for the standard errors indicated that the parameters were estimated with precisions usually less than 25 The residual variability remained high suggesting that assumptions about dosing history may be incorrect or sampling datetime may not be accurate for some subjects at steady state
The analysis of the raw trough data based upon time after dosing supports the model results indicating that weight normalized doses are comparable in children adolescents and adults in the dose range 2345 and 6 mgkg However based upon the lack of a clear dose response relationship for both indications dosing based upon body weight is not recommended Recommended doses for schizophrenia is 3 mg QD while that for bipolar should be initiated at 05 mg QD with adjustment of 05-1 mgday as tolerated
5 Page(s) of Draft Labeling have been Withheld in Full as b4 (CCITS) immediately following this page
63
---------------------------------------------------------------------------------------------------------------------
---------------------------------------------------------------------------------------------------------------------
---------------------
This is a representation of an electronic record that was signed electronically and this page is the manifestation of the electronic signature
s
Andre Jackson 6132007 075956 AM BIOPHARMACEUTICS
Yaning Wang 6132007 012858 PM BIOPHARMACEUTICS
Raman Baweja 6132007 030822 PM BIOPHARMACEUTICS
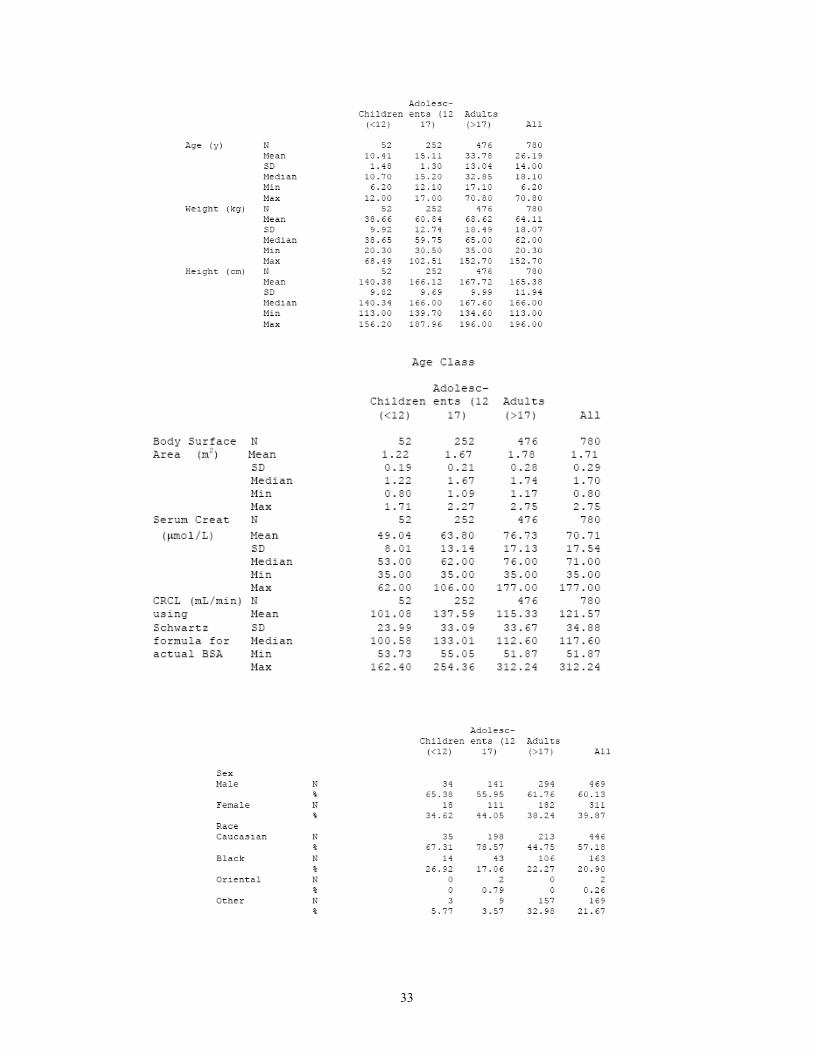
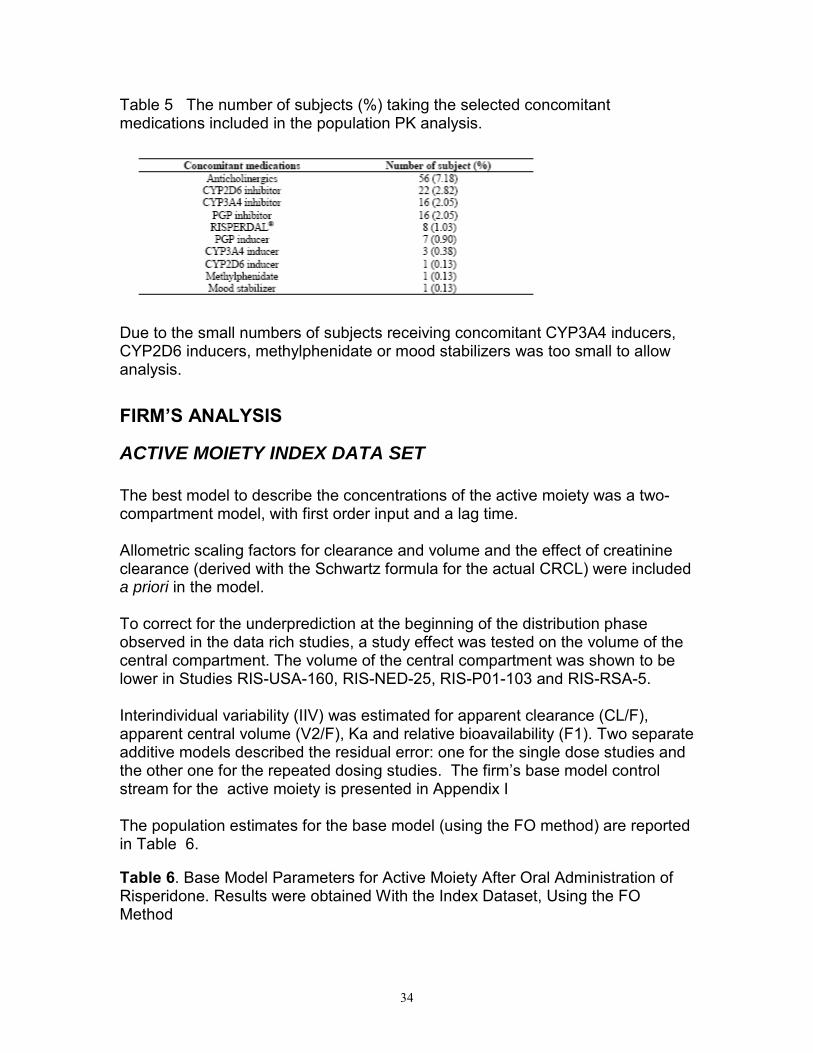
DOSES OF 2 3 4 6 MG KG
C 40 o n c e n t r 30 a t i o n
o f 20
A c t i v e 10
M o i e t y 0
2 3 4 6
CHI LD ADOL ADULT CHI LD ADOL ADULT CHI LD ADOL ADULT CHI LD ADOL ADULT
Pat i ent Popul at i on
1 There was minimal change in the base model results with study 2 deleted 2 FDA results for the base and final models were identical to the firmrsquos
results
The firmrsquos analysis was further checked by selecting times after dose for the observed data based upon the sampling schedules for studies 1 2 and 3 These were used to make comparisons to the other adult studies at the same times after dose for the intensive sampling studies Trough samples were selected based upon time of last dose that were comparable between the studies These were further sorted based upon dose with the final concentrations normalized to dose
Figure 9 Comparison of adolescent and adult data observed data as a function of normalized dose for Active moiety at trough
Comment
60
1 Mean values for the active moiety were similar for adults and children and adolescents at trough based upon mgkg
BASE MODEL - RISPERIDONE
Table 12 Comparative results were Parameter Firmrsquos analysis FDA analysis FDA analysis
Estimate (Rel SE) (Rel SE) without study 2 (Rel SE)
Ka (b) (4)
603(91) 603(90) CL
49(129) 51(134) θ2 0782(118) 0782(118)
V2F θ3
θ9 323(136) 331(141)
V3F θ4 256(216) 255(233) QF θ5 696(162) 73(179) ALAG1 θ6 024(08) 024(08) F1 Population 1 θ7 35(123) 36(141) Population 2 1(fixed) 1(fixed) Proportion 0346(242) 035(203) population 1 p(1)= θ8 Proportion 0654 0654 population 2 1-p(1)
ω2IIV on Ka 1 83(228) 83(228) IIV on CL ω2
2 0332(173) 038(202) IIV on V2 ω2
3 0261(221) 030(242) Residual variability Study 123459F2
1 0073(191) 0073(191) Study 678F2
2 0828 (115) 0837 (115)
COMMENTS
1There was minimal change in the base model results with study 2 deleted 2 FDA results for the base and final models were identical to the firmrsquos results
61
Table 13 Final Model Parameters for Risperidone After Oral Administration Results are Obtained With the Full Dataset Using the FOCE Method
Parameter Firmrsquos Estimates FDA Estimates
Ka (h-1) Study 123459 θ1 Study 678 θ10
CLF (Lh)=θ2(Weight70)075 θ9 POP1 θ2 θ9
V2F (L)=θ3(Weight70) θ3
V3F (L)=θ4(Weight70) θ4 QF (Lh) θ5 ALAG1 (h) θ6 F1 Population 1 θ7 Population 2
Proportion population 1 P(1)= θ8 Proportion population 2 1-P(1) IIV on CL ω2 1 IIV on V2 ω2 2 IIV on F1 ω2 3 Residual variability on log(conc) Study 1 2 3 4 5 9 σ2 1 Study 6 7 8 σ2 2
(SE) (SE) (b) (4)
An analysis of the trough times after dose concentrations were selected based upon the sampling schedules for studies 1 2 and 3 and analyzed the same as those for the active moiety
Figure 10 Comparison of adolescent and adult data observed data as a function of normalized dose for Risperidone at trough
62
DOSES OF 2 3 4 6 MG KG
30 C o n c e n t r a t 20 i o n
o f
R i 10 s p e r i d o n e
0
2 3 4 6
CHI LD ADOL ADULT CHI LD ADOL ADULT CHI LD ADOL ADULT CHI LD ADOL ADULT
Pat i ent Popul at i on
DISCUSSION
The results from this analysis indicates that based upon the model developed to describe risperidone and the active moiety that there are differences in clearance between adolescents children and adults Values for the standard errors indicated that the parameters were estimated with precisions usually less than 25 The residual variability remained high suggesting that assumptions about dosing history may be incorrect or sampling datetime may not be accurate for some subjects at steady state
The analysis of the raw trough data based upon time after dosing supports the model results indicating that weight normalized doses are comparable in children adolescents and adults in the dose range 2345 and 6 mgkg However based upon the lack of a clear dose response relationship for both indications dosing based upon body weight is not recommended Recommended doses for schizophrenia is 3 mg QD while that for bipolar should be initiated at 05 mg QD with adjustment of 05-1 mgday as tolerated
5 Page(s) of Draft Labeling have been Withheld in Full as b4 (CCITS) immediately following this page
63
---------------------------------------------------------------------------------------------------------------------
---------------------------------------------------------------------------------------------------------------------
---------------------
This is a representation of an electronic record that was signed electronically and this page is the manifestation of the electronic signature
s
Andre Jackson 6132007 075956 AM BIOPHARMACEUTICS
Yaning Wang 6132007 012858 PM BIOPHARMACEUTICS
Raman Baweja 6132007 030822 PM BIOPHARMACEUTICS

---------------------------------------------------------------------------------------------------------------------
---------------------------------------------------------------------------------------------------------------------
---------------------
This is a representation of an electronic record that was signed electronically and this page is the manifestation of the electronic signature
s
Andre Jackson 6132007 075956 AM BIOPHARMACEUTICS
Yaning Wang 6132007 012858 PM BIOPHARMACEUTICS
Raman Baweja 6132007 030822 PM BIOPHARMACEUTICS


![BIOPHARMACEUTICS lecture 2[1]](https://img.pdfslide.us/doc/110x75/551c4bf74979590c568b462e/biopharmaceutics-lecture-21.jpg)