Embed Size (px)
Citation preview

REVIEW ARTICLE
Clinical Pharmacokinetics and Pharmacodynamics of Afatinib
Sven Wind1• David Schnell1 • Thomas Ebner2
• Matthias Freiwald1•
Peter Stopfer1
Published online: 28 July 2016
� The Author(s) 2016. This article is published with open access at Springerlink.com
Abstract Afatinib is an oral, irreversible ErbB family blocker
that covalently binds to the kinase domains of epidermal growth
factor receptor (EGFR), human EGFRs (HER) 2, and HER4,
resulting in irreversible inhibition of tyrosine kinase
autophosphorylation. Studies in healthy volunteers and patients
with advanced solid tumours have shown that once-daily afa-
tinib has time-independent pharmacokinetic characteristics.
Maximum plasma concentrations of afatinib are reached
approximately 2–5 h after oral administration and thereafter
decline, at least bi-exponentially. Food reduces total exposure
to afatinib. Over the clinical dose range of 20–50 mg, afatinib
exposure increases slightly more than dose proportional. Afa-
tinib metabolism is minimal, with unchanged drug predomi-
nantly excreted in the faeces and approximately 5 % in urine.
Apart from the parent drug afatinib, the major circulation spe-
cies in human plasma are the covalently bound adducts to
plasma protein. The effective elimination half-life is approxi-
mately 37 h, consistent with an accumulation of drug exposure
by 2.5- to 3.4-fold based on area under the plasma concentra-
tion–time curve (AUC) after multiple dosing. The pharma-
cokinetic profile of afatinib is consistent across a range of
patient populations. Age, ethnicity, smoking status and hepatic
function had no influence on afatinib pharmacokinetics, while
females and patients with low body weight had increased
exposure to afatinib. Renal function is correlated with afatinib
exposure, but, as for sex and body weight, the effect size for
patients with severe renal impairment (approximately 50 %
increase in AUC) is only mildly relative to the extent of
unexplained interpatient variability in afatinib exposure. Afa-
tinib has a low potential as a victim or perpetrator of drug–drug
interactions, especially with cytochrome P450-modulating
agents. However, concomitant treatment with potent inhibitors
or inducers of the P-glycoprotein transporter can affect the
pharmacokinetics of afatinib. At a dose of 50 mg, afatinib does
not have proarrhythmic potential.
Key Points
Afatinib is an irreversible ErbB family blocker that is
well absorbed, with maximum plasma concentration
attained at 2–5 h.
Afatinib demonstrates high apparent clearance after
oral administration and is eliminated primarily as
unchanged drug by faecal excretion.
Afatinib has a favourable and time-independent
pharmacokinetic profile that is consistent across a
range of patient populations.
Afatinib has a low potential for drug–drug
interactions via cytochrome P450; coadministration
of drugs that are potent inhibitors or inducers of
P-glycoprotein should be undertaken with care.
Intrinsic factors such as age, ethnicity, and hepatic
function do not affect the pharmacokinetics of afatinib.
Effects of sex, weight and renal function status are
within the variability range of afatinib exposure.
Electronic supplementary material The online version of thisarticle (doi:10.1007/s40262-016-0440-1) contains supplementarymaterial, which is available to authorized users.
& Sven Wind
1 Translational Medicine and Clinical Pharmacology,
Boehringer Ingelheim Pharma GmbH & Co KG,
Birkendorfer Strasse 65, 88397 Biberach an der Riss,
Germany
2 Drug metabolism and Pharmacokinetics, Boehringer
Ingelheim Pharma GmbH & Co KG, Birkendorfer Strasse 65,
88397 Biberach an der Riss, Germany
Clin Pharmacokinet (2017) 56:235–250
DOI 10.1007/s40262-016-0440-1

1 Introduction
In tumours arising from malignant epithelial cells, the
ErbB family of proteins (Class I tyrosine kinase receptor
pathway) is often dysregulated. The family is comprised of
epidermal growth factor receptor (EGFR), human EGFRs
2, 3, and 4 (HER2, HER3 and HER4), and their cognate
ligands [1]. This receptor pathway is implicated in the
growth of malignant cells. The development of small-
molecule tyrosine kinase inhibitors (TKIs) that target
EGFR has revolutionised the management of non-small
cell lung cancer (NSCLC). The first-generation EGFR–
TKIs, erlotinib and gefitinib, compete reversibly with
adenosine triphosphate (ATP) for binding to the intracel-
lular catalytic domain of EGFR tyrosine kinase and thus
inhibit EGFR autophosphorylation and downstream sig-
nalling [2]. Erlotinib and gefitinib are especially effective
in tumours with activating EGFR mutations, evident in
10–15 % of Caucasians and 40 % of Asians with NSCLC
[3]. In 90 % of cases, these mutations are exon 19 deletions
or exon 21 substitutions (L858R) [3]. However, these
agents are susceptible to mutations that affect the binding
affinity of ATP or the kinase inhibitor itself and, therefore,
EGFR mutation-positive patients inevitably develop resis-
tance to EGFR–TKIs after 9–12 months of treatment [4–8].
One important mechanism of acquired resistance is the
T790M gatekeeper EGFR mutation in exon 20, which is
found in approximately half of NSCLC cases [9, 10]. This
mutation increases the affinity of the mutant EGFR for its
substrate, ATP, and thus reduces the efficacy of EGFR–
TKIs [10–13]. Less common mutations, such as amplifi-
cation of the proto-oncogene MET, HER2 amplification,
small cell transformation, and PIK3CA mutations, have
been associated with the development of EGFR–TKI
resistance in NSCLC [9, 10].
Newer, so called ‘second-generation’ EGFR–TKIs,
including afatinib and dacomitinib, differ from erlotinib or
gefitinib in that they form irreversible covalent bonds to the
ATP-binding site of the EGFR receptor, and also target
multiple ErbB family members, including HER2, which
plays a key role in ErbB activation [14].
Afatinib is an oral, irreversible ErbB family blocker with
activity in a wide range of tumour cell lines harbouring a
hyperactivated ErbB signalling network [15, 16]. Afatinib
has demonstrated clinical efficacy in phase III trials in
patients with NSCLC and head and neck squamous cell
cancer (HNSCC). In 2013, afatinib was approved for the
first-line treatment of EGFR mutation-positive NSCLC
[17, 18], based on the results of the LUX-Lung 3 and LUX-
Lung 6 studies, which demonstrated a significant increase in
progression-free survival (PFS) with afatinib compared with
standard of care chemotherapy in EGFR-mutant patients
with advanced NSCLC [19, 20]. A pooled analysis of these
two trials show a significant improvement in overall survival
(OS) [31.7 vs. 20.7 months; hazard ratio 0.59; p = 0.0001]
with afatinib in patients with exon 19 EGFR deletion com-
pared with standard chemotherapy [21]. In patients with lung
squamous cell cancer, afatinib has also demonstrated a sig-
nificant increase in PFS and OS compared with erlotinib
[22]. On 31 March 2016, the European Medicines Agency
approved afatinib for the treatment of patients with advanced
NSCLC of squamous cell histology progressing on or after
platinum-based chemotherapy [23]. The recommended dose
of afatinib is 40 mg orally once daily; however, the dose can
be increased to a maximum of 50 mg/day, or decreased to a
minimum of 20 mg/day, depending on tolerability [17, 18].
In the event of potential drug–drug interaction, dose
adjustment may be needed to avoid toxicity. Treatment is
continued until disease progression or unacceptable toxicity.
This review discusses the pharmacokinetic and phar-
macodynamic properties and drug–drug interaction profile
of afatinib.
2 Preclinical Pharmacology
2.1 Structure and Physicochemical Properties
Afatinib (Giotrif�, Gilotrif�), also known as BIBW 2992
(Fig. 1), is an ATP-competitive 4-anilinoquinazoline
derivative. Structural modelling studies demonstrate that it
harbours a reactive acrylamide group that covalently binds
to specific cysteine (Cys) residues in the kinase domains of
EGFR (Cys773), HER2 (Cys805), and HER4 (Cys803)
receptors [15, 16, 24].
Afatinib is administered as a film-coated tablet that
contains afatinib as dimaleate salt. It is highly soluble
throughout the physiological pH range of 1–7.5 [25], and
N
N
N
N
O
N
CH3
CH3
O
O
F
Cl HH
Fig. 1 Structural formula of afatinib (BIBW 2992): N-[4-[(3-chloro-
4-fluorophenyl)amino]-7-[[(3S)-tetrahydro-3-furanyl]oxy]-6-quina-
zolinyl]-4-(dimethylamino)-2-butenamide
236 S. Wind et al.

also shows high passive permeability through cell mem-
branes, but efflux transport by intestinal P-glycoprotein (P-
gp) can confound the permeability of afatinib as it is a P-gp
substrate. Thus, no conclusive placement of afatinib in the
Biopharmaceutics Classification System (BCS) is possible
and it should be considered as either a BCS class 1 or 3
compound [26].
2.2 Pharmacodynamic Properties
2.2.1 Mechanism of Action
The covalent binding of afatinib to EGFR, HER2, and
HER4 irreversibly inhibits the tyrosine kinase activity of
these receptors, resulting in reduced auto- and transphos-
phorylation within the ErbB dimers and inhibition of
important steps in the signal transduction of all ErbB
receptor family members [15, 16]. It also inhibits
transphosphorylation of ErbB3 (HER3), thereby blocking
signalling of all ErbB family members [15].
In cell-free in vitro kinase assays, afatinib showed
nanomolar potency to inhibit wild-type EGFR, HER2
and ErbB4 (ErbB3 misses critical amino acid residues
responsible for enzymatic activity, and thus has a much
weaker tyrosine kinase activity) [15, 16, 24]. The
potency of afatinib to inhibit the tyrosine kinase activity
of wild-type EGFR (mean apparent half maximal effec-
tive concentration [EC50] of 0.5 nM) was maintained on
EGFR with the activating L858R mutation (EC50 of
0.2 nM) [16] but reduced on the L858R/T790M double
mutation of EGFR (EC50 of 9 nM). Cellular activity
demonstrated by inhibition of phosphorylation by afatinib
was shown for EGFR, HER2, ErbB4 and of transphos-
phorylation for ErbB3 in a wide variety of cell lines,
with potency in the low nanomolar range. Inhibition of
autophosphorylation was demonstrated not only in cells
expressing wild-type EGFR but also in those containing
EGFR mutations, including L858R and L858R/T790M,
at afatinib concentrations that can be achieved, at least
transiently, in patients [15, 16]. For a more thorough
discussion about the preclinical efficacy profile of afa-
tinib, the reader is referred to a recent comprehensive
review by Modjtahedi et al. [24].
2.3 In-Vitro Drug–Drug Interaction Victim
and Perpetrator Properties
Several in vitro metabolism, transport, and drug interaction
studies were performed to quantitatively assess the drug–
drug interaction potential of afatinib.
In vitro studies with human hepatocytes and human liver
microsomes showed that afatinib had a low potential to
inhibit or induce cytochrome P450 (CYP) isoenzymes
(Boehringer Ingelheim, unpublished data) [26], including
those that are most relevant for drug metabolism in humans
(CYP1A1/2, CYP2B6, CYP2C8, CYP2C9, CYP2C19,
CYP2D6 and CYP3A4) (Table 1) [27]. Further in vitro
data indicated that drug–drug interactions with afatinib due
to inhibition of UDP-glucuronosyltransferase 1A1
(UGT1A1) are considered unlikely [26].
In vitro bidirectional transport assays in human colon
adenocarcinoma Caco-2 cell monolayers and human
P-gp-expressing LLC-PK1 cells showed that afatinib is a
substrate of the efflux transporter P-gp, and in vitro
efflux transport was inhibited in the presence of
cyclosporine A, verapamil and zosuquidar (all three
compounds being potent P-gp inhibitors) [25, 26]. Fur-
ther in vitro studies showed that afatinib is also a P-gp
inhibitor, reducing the in vitro transport of the P-gp
substrate digoxin [25, 26]. In these studies, concentra-
tions yielded an inhibition constant (Ki) value of 3.4 lM
for afatinib. For comparison, the geometric mean
(gMean) maximum plasma concentration (Cmax) of afa-
tinib 50 mg at steady state was 0.158 lM, which is
substantially below the afatinib concentration needed to
inhibit P-gp.
Afatinib is also a substrate and inhibitor of the efflux
transporter BCRP, with comparable in vitro inhibitory
effects as for the known BCRP inhibitor fumitremorgin C
[25, 26].
Studies using transfected HEK293 cell lines that
express different drug transporters, including organic
anion-transporting polypeptide (OATP), organic anion
transporters (OAT) and organic cation transporters
(OCT) showed no relevant in vitro transport of afatinib.
Thus, active transport of afatinib by OATP, OAT and
OCT drug transporters is not expected to be of in vivo
relevance for the pharmacokinetics of afatinib in humans.
At concentrations up to 100 lM, afatinib had a minor
inhibitory effect on OATP1B1 and OATP1B3
(IC50[ 70 lM), and showed negligible in vitro inhibi-
tion of several other drug transporters (OAT1, OAT3,
OCT2; IC50[ 100 lM) (Table 1) [25]. Afatinib inhibited
OCT1 and OCT3-mediated transport of the probe sub-
strate N-methyl-4-phenyl pyridinium in a concentration-
dependent manner, with IC50 values of 20.0 and
11.8 lM, respectively.
In summary, in the clinical setting, afatinib is unlikely to
affect the pharmacokinetics of other drugs that are sub-
strates of major drug metabolising CYPs or uptake trans-
porters, such as OATP1B1, OATP1B3, OAT1, OAT3 or
OCT2. Afatinib inhibits P-gp in vitro, but plasma con-
centrations of afatinib at therapeutic doses are considerably
lower than concentrations expected to inhibit P-gp.
Clinical PK/PD of Afatinib 237

Ta
ble
1In
vit
roin
hib
itio
no
fd
rug
met
abo
lisi
ng
enzy
mes
and
inh
ibit
ion
of
effl
ux
and
up
tak
etr
ansp
ort
of
test
sub
stra
tes
by
afat
inib
inv
itro
(Bo
ehri
ng
erIn
gel
hei
m,
un
pu
bli
shed
dat
a)[2
5,
26]
Tra
nsp
ort
eren
zym
eT
issu
elo
cati
on
(maj
or
exp
ress
ion
)C
ell
lin
e/te
stsy
stem
Inv
itro
test
sub
stra
teIn
hib
itio
nb
yaf
atin
ib,
lM
(IC
50)
Dru
gm
etab
oli
sin
gen
zym
esw
ith
maj
or
imp
ort
ance
for
dru
gm
etab
oli
sm
CY
P1
A2
Liv
ero
nly
Hu
man
liv
erm
icro
som
esP
hen
acet
in(O
-dee
thy
lati
on
)[
10
0
CY
P2
B6
Liv
erH
um
anli
ver
mic
roso
mes
S-M
eph
eny
toin
(N-d
emet
hy
lati
on
)[
10
0
CY
P2
C8
Liv
erH
um
anli
ver
mic
roso
mes
Pac
lita
xel
(6a
-hy
dro
xy
lati
on
)[
10
0
CY
P2
C9
Liv
er,
smal
lin
test
ine
Hu
man
liv
erm
icro
som
esT
olb
uta
mid
e(4
-hy
dro
xy
lati
on
)7
9
CY
P2
C1
9L
iver
Hu
man
liv
erm
icro
som
esS
-mep
hen
yto
in(4
-hy
dro
xy
lati
on
)[
10
0
CY
P2
D6
Liv
erH
um
anli
ver
mic
roso
mes
Bu
fura
lol
(10 -
hy
dro
xy
lati
on
)[
10
0
CY
P3
A4
Liv
er,
smal
lin
test
ine
Hu
man
liv
erm
icro
som
esM
idaz
ola
m(1
0 -h
yd
rox
yla
tio
n)
[1
00
UG
T1
A1
Liv
erH
um
anli
ver
mic
roso
mes
b-e
stra
dio
l(3
-glu
curo
nid
atio
n)
24
.2
UG
T2
B7
Liv
er,
kid
ney
Hu
man
liv
erm
icro
som
esb
-est
rad
iol
(17
-glu
curo
nid
atio
n)
73
.7
AB
Cef
flu
xtr
ansp
ort
ers
of
clin
ical
imp
ort
ance
for
hep
atic
and
inte
stin
alef
flu
x
P-g
pIn
test
inal
ente
rocy
te,
kid
ney
pro
xim
altu
bu
le,
hep
ato
cyte
(can
alic
ula
r)C
aco
-2ce
llm
on
ola
yer
sD
igo
xin
24
LL
C-P
K1
cell
sD
igo
xin
1.5
9
BC
RP
Inte
stin
alen
tero
cyte
,h
epat
ocy
te(c
anal
icu
lar)
,k
idn
eyp
rox
imal
tub
ule
Cac
o-2
cell
mo
no
lay
ers
Est
ron
e-3
-su
lfat
e0
.75
SL
Cu
pta
ke
tran
spo
rter
so
fcl
inic
alim
po
rtan
cefo
rh
epat
icu
pta
ke
and
ren
alu
pta
ke/
elim
inat
ion
OA
TP
1B
1H
epat
ocy
te(s
inu
soid
al)
HE
K2
93
Est
rad
iol
17b-
glu
curo
nid
e8
2.8
OA
TP
1B
3H
epat
ocy
te(s
inu
soid
al)
HE
K2
93
Est
rad
iol
17b-
glu
curo
nid
e7
1.2
OA
TP
2B
1H
epat
ocy
te(s
inu
soid
al)
HE
K2
93
Est
ron
e-3
-su
lfat
e6
.05
OA
T1
Kid
ney
pro
xim
altu
bu
leH
EK
29
3P
ara-
amin
oh
ipp
uri
cac
id[
10
0
OA
T3
Kid
ney
pro
xim
altu
bu
leH
EK
29
3E
stro
ne-
3-s
ulf
ate
[1
00
OC
T1
Hep
ato
cyte
(sin
uso
idal
),in
test
inal
epit
hel
ium
(bas
ola
tera
l)H
EK
29
3N
-Met
hy
l-4
-ph
eny
lp
yri
din
ium
20
OC
T2
Kid
ney
pro
xim
altu
bu
leH
EK
29
3N
-Met
hy
l-4
-ph
eny
lp
yri
din
ium
[1
00
OC
T3
Liv
er,
kid
ney
HE
K2
93
N-M
eth
yl-
4-p
hen
yl
py
rid
iniu
m1
1.8
Tab
leis
bas
edo
nth
ed
raft
US
FD
Ad
rug
–d
rug
inte
ract
ion
gu
idan
ce[2
7]
ABC
AT
P-b
ind
ing
cass
ette
,BCRP
bre
ast
can
cer
resi
stan
cep
rote
in,CYP
cyto
chro
me
P4
50
iso
enzy
mes
,HEK
hu
man
emb
ryo
nic
kid
ney
,IC
50
50
%in
hib
ito
ryco
nce
ntr
atio
n,LLC
-PK1
Lil
ly
Lab
ora
tori
esC
ell-
Po
rcin
eK
idn
ey,OAT
org
anic
anio
ntr
ansp
ort
er,OATP
org
anic
anio
n-t
ran
spo
rtin
gp
oly
pep
tid
e,OCT
org
anic
cati
on
tran
spo
rter
,P
-gp
P-g
lyco
pro
tein
,SLC
solu
teca
rrie
r,UGT
UD
P-g
lucu
ron
osy
ltra
nsf
eras
e
238 S. Wind et al.

2.4 Preclinical Pharmacokinetics
The pharmacokinetics and drug metabolism of afatinib
(dose as suspension/solution formulation of the dimaleate
salt) were studied in several animal species (mice, rats,
rabbits and Gottingen minipigs).
Absolute bioavailability of afatinib in rats and minipigs
was variable, ranging from 11 to 45 % (Boehringer
Ingelheim, unpublished data) [25, 28]. Following admin-
istration of [14C]-radiolabelled afatinib to rats and minip-
igs, radioactivity was widely distributed into most of the
tissues, and declined slowly so that most tissues still had
detectable levels at 312 h. Pronounced body distribution
was also shown by relatively large volumes of distribution
of afatinib after intravenous dosing to animal species,
which was 12.4 and 16.2 L/kg in minipigs and rats,
respectively.
Mean plasma protein binding of afatinib was[92 % in
all animal species (rabbits, rats, minipigs and mice), over a
concentration range of 0.05–0.5 lM [25, 28]. In vitro,
binding of afatinib dimaleate to isolated human serum
albumin (45 g/L) was subordinate (79.6 %), and binding to
human a1-acid glycoprotein (AGP) increased with the
protein concentration from 11.6 % (0.1 g/L AGP) to
90.6 % (10 g/L AGP). The blood-to-plasma ratio of afa-
tinib in vitro by incubation of [14C]-radiolabelled afatinib
in rats and minipigs was [3, indicating that afatinib was
predominantly distributed into blood cells of these species.
In vivo metabolism was studied in several species (rats,
mice, minipigs and rabbits) following oral and intravenous
(rats only) administration of [14C]-radiolabelled afatinib
(Boehringer Ingelheim, unpublished data) [25, 28]. In all
species, metabolism was minimal; excretion of unchanged
parent compound accounted for [50, [60, [72, and
[87 % in the rat, mouse, minipigs and rabbit, respectively.
The total number of metabolites observed in all species at
amounts [1 % of the administered dose was relatively
small, with only minor differences in the metabolite pattern
between the investigated species. In all animal species, the
parent drug afatinib was the major circulating component
in the plasma, with the next most predominant metabolites
being the fraction of covalently bound afatinib. Across all
investigated animal species, afatinib was primarily excre-
ted in the faeces (85–94 % of the oral dose). Based on
in vitro and in vivo toxicology studies, there was no evi-
dence of genotoxicity with afatinib [25, 28].
3 Clinical Pharmacokinetics
The clinical pharmacokinetics of afatinib monotherapy
were investigated in healthy subjects and patients with
advanced solid tumours, including those with hepatic and
renal impairment. To characterise the pharmacokinetics of
afatinib in a large number of patients with advanced solid
tumours, a meta-analysis of five phase I trials [29–32] and
one phase II trial [33] in patients with advanced solid
tumours (n = 221) who received afatinib (10–100 mg
doses) was performed using non-compartmental analysis
[34]. The key pharmacokinetic parameters following single
and multiple doses of afatinib are presented in Tables 2 and
3. For comparison, Table 4 also gives the pharmacokinetic
parameter estimates after multiple dosing of 40 mg to a
typical NSCLC patient based on a population
Table 2 Summary of single-
dose pharmacokinetics of
afatinib after once-daily oral
doses in cancer patients enrolled
in four phase I trials [29–32]
and one phase II trial [33].
Results are based on a meta-
analysis of data from these five
trials [34]
Parameter and unit Afatinib dose
20 mg (N = 13) 30 mg (N = 10) 40 mg (N = 30) 50 mg (N = 73)
AUC24 [ng�h/mL] 119 (56.6)a 189 (95.9) 324 (68.9) 459 (68.0)b
Cmax [ng/mL] 11.6 (85.1) 16.3 (139) 25.2 (73.3) 40.8 (76.6)
tmax [h] 3.00 (0.50–24.0) 2.00 (0.57–6.92) 3.98 (0.58–9.10) 3.13 (0.90–9.05)
t� [h] 22.3 (80.3)c 21.3 (82.1) 26.9 (61.1) 21.9 (54.8)d,e
CL/F [mL/min] 1430 (64.7)c 1370 (72.9) 952 (86.2) 1090 (94.0)d,e
Vz/F [L] 2770 (61.8)c 2520 (109) 2220 (71.4) 2080 (123)d,e
Data are expressed as geometric mean [gCV (%)] or median (range)
AUC24 area under the drug plasma concentration–time curve over the time interval from zero to 24 h, CL/F
clearance of drug from plasma after oral administration, Cmax maximum drug concentration in plasma,
gCV(%) geometric coefficient of variation (%), t� terminal elimination half-life, tmax time to reach Cmax, Vz/F
(apparent) volume of distributiona n = 12b n = 69c n = 11d n = 13e No t�-dependent parameters were calculated in one trial [33]
Clinical PK/PD of Afatinib 239
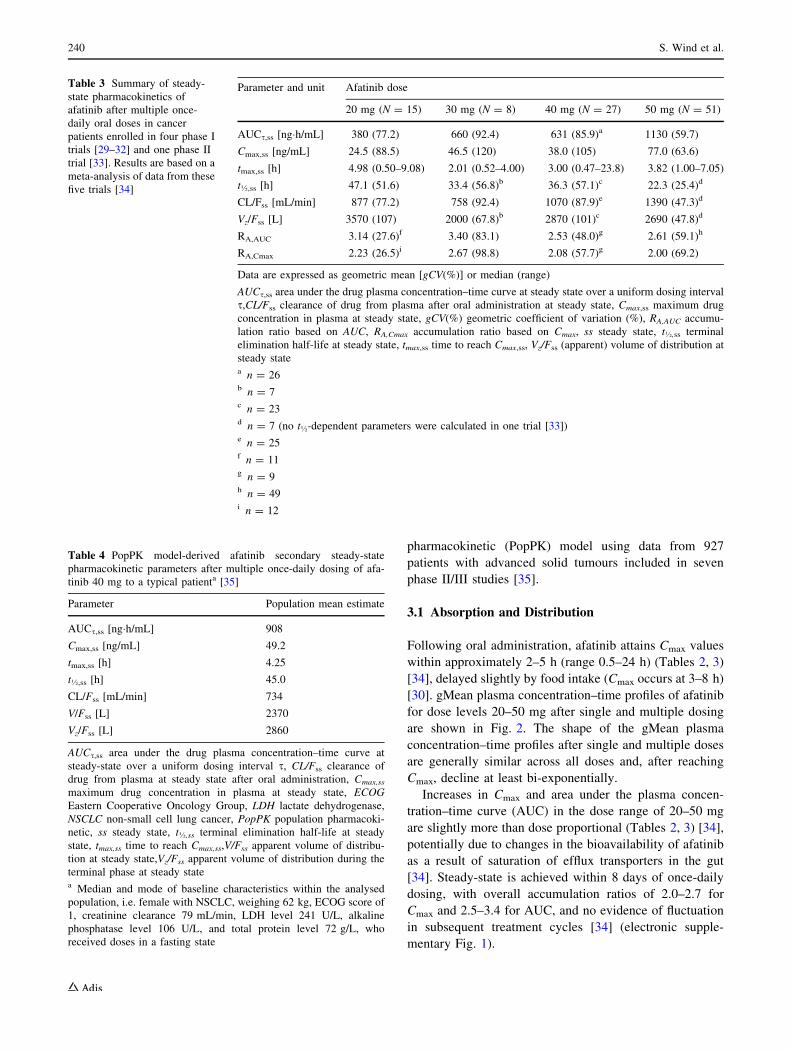
pharmacokinetic (PopPK) model using data from 927
patients with advanced solid tumours included in seven
phase II/III studies [35].
3.1 Absorption and Distribution
Following oral administration, afatinib attains Cmax values
within approximately 2–5 h (range 0.5–24 h) (Tables 2, 3)
[34], delayed slightly by food intake (Cmax occurs at 3–8 h)
[30]. gMean plasma concentration–time profiles of afatinib
for dose levels 20–50 mg after single and multiple dosing
are shown in Fig. 2. The shape of the gMean plasma
concentration–time profiles after single and multiple doses
are generally similar across all doses and, after reaching
Cmax, decline at least bi-exponentially.
Increases in Cmax and area under the plasma concen-
tration–time curve (AUC) in the dose range of 20–50 mg
are slightly more than dose proportional (Tables 2, 3) [34],
potentially due to changes in the bioavailability of afatinib
as a result of saturation of efflux transporters in the gut
[34]. Steady-state is achieved within 8 days of once-daily
dosing, with overall accumulation ratios of 2.0–2.7 for
Cmax and 2.5–3.4 for AUC, and no evidence of fluctuation
in subsequent treatment cycles [34] (electronic supple-
mentary Fig. 1).
Table 3 Summary of steady-
state pharmacokinetics of
afatinib after multiple once-
daily oral doses in cancer
patients enrolled in four phase I
trials [29–32] and one phase II
trial [33]. Results are based on a
meta-analysis of data from these
five trials [34]
Parameter and unit Afatinib dose
20 mg (N = 15) 30 mg (N = 8) 40 mg (N = 27) 50 mg (N = 51)
AUCs,ss [ng�h/mL] 380 (77.2) 660 (92.4) 631 (85.9)a 1130 (59.7)
Cmax,ss [ng/mL] 24.5 (88.5) 46.5 (120) 38.0 (105) 77.0 (63.6)
tmax,ss [h] 4.98 (0.50–9.08) 2.01 (0.52–4.00) 3.00 (0.47–23.8) 3.82 (1.00–7.05)
t�,ss [h] 47.1 (51.6) 33.4 (56.8)b 36.3 (57.1)c 22.3 (25.4)d
CL/Fss [mL/min] 877 (77.2) 758 (92.4) 1070 (87.9)e 1390 (47.3)d
Vz/Fss [L] 3570 (107) 2000 (67.8)b 2870 (101)c 2690 (47.8)d
RA,AUC 3.14 (27.6)f 3.40 (83.1) 2.53 (48.0)g 2.61 (59.1)h
RA,Cmax 2.23 (26.5)i 2.67 (98.8) 2.08 (57.7)g 2.00 (69.2)
Data are expressed as geometric mean [gCV(%)] or median (range)
AUCs,ss area under the drug plasma concentration–time curve at steady state over a uniform dosing interval
s,CL/Fss clearance of drug from plasma after oral administration at steady state, Cmax,ss maximum drug
concentration in plasma at steady state, gCV(%) geometric coefficient of variation (%), RA,AUC accumu-
lation ratio based on AUC, RA,Cmax accumulation ratio based on Cmax, ss steady state, t�,ss terminal
elimination half-life at steady state, tmax,ss time to reach Cmax,ss, Vz/Fss (apparent) volume of distribution at
steady statea n = 26b n = 7c n = 23d n = 7 (no t�-dependent parameters were calculated in one trial [33])e n = 25f n = 11g n = 9h n = 49i n = 12
Table 4 PopPK model-derived afatinib secondary steady-state
pharmacokinetic parameters after multiple once-daily dosing of afa-
tinib 40 mg to a typical patienta [35]
Parameter Population mean estimate
AUCs,ss [ng�h/mL] 908
Cmax,ss [ng/mL] 49.2
tmax,ss [h] 4.25
t�,ss [h] 45.0
CL/Fss [mL/min] 734
V/Fss [L] 2370
Vz/Fss [L] 2860
AUCs,ss area under the drug plasma concentration–time curve at
steady-state over a uniform dosing interval s, CL/Fss clearance of
drug from plasma at steady state after oral administration, Cmax,ss
maximum drug concentration in plasma at steady state, ECOG
Eastern Cooperative Oncology Group, LDH lactate dehydrogenase,
NSCLC non-small cell lung cancer, PopPK population pharmacoki-
netic, ss steady state, t�,ss terminal elimination half-life at steady
state, tmax,ss time to reach Cmax,ss,V/Fss apparent volume of distribu-
tion at steady state,Vz/Fss apparent volume of distribution during the
terminal phase at steady statea Median and mode of baseline characteristics within the analysed
population, i.e. female with NSCLC, weighing 62 kg, ECOG score of
1, creatinine clearance 79 mL/min, LDH level 241 U/L, alkaline
phosphatase level 106 U/L, and total protein level 72 g/L, who
received doses in a fasting state
240 S. Wind et al.

In line with this, a two-compartment disposition model
with first-order absorption, linear elimination and dose-
dependent bioavailability was used when performing
compartmental analyses [35].
The absolute bioavailability of afatinib in humans has
not been studied. Relative bioavailability was 92 % (90 %
confidence interval [CI] 76–112 %) based on the AUC
from time zero to infinity (AUC?), and 85 % (90 % CI
69–106 %) based on Cmax after a single dose of a 20 mg
tablet compared with an oral solution [36]. After a high-fat,
high-caloric meal [37], afatinib exposure is reduced, with
Cmax and AUC? reduced by approximately 50 % and
39 %, respectively. Thus, afatinib should be administered
at least 1 h before or 2–3 h after ingestion of food [17, 18].
Afatinib is approximately 95 % plasma protein bound
[38, 39]. In the previously described meta-analysis, afatinib
(10–100 mg doses) showed a high apparent volume of
distribution during the terminal phase (Vz/F) after single
doses and at steady state (gMean values were 1940 and
2770 L, respectively), indicative of high tissue distribution
[34]. In line with this, Vz/F was 2860 L for a typical patient
receiving a 40 mg dose, based on the PopPK analysis
(Table 4) [35]. However, the values of Vz/F should be
treated with caution as the absolute bioavailability (F) of
afatinib is unknown. The final PopPK model adequately
described the pharmacokinetics of afatinib in different
cancer patient populations.
3.2 Metabolism and Elimination
The disposition and metabolism of afatinib were investi-
gated in a dedicated absorption, distribution, metabolism,
and elimination (ADME) study in eight male subjects who
received a single oral dose of [14C-]radiolabelled afatinib
solution [40]. Following an oral dose of 15 mg [14C]-ra-
diolabelled afatinib dimaleate, most of the dose was
recovered in the faeces (85.4 % within 312 h after dosing),
with negligible clearance in the urine (4.29 % within 216 h
after dosing). The renal excretion of afatinib itself was also
low, which suggests primarily biliary secretion of
unchanged drug. The combined faecal and urinary recovery
accounted for 89.5 % of the administered [14C]-radiola-
belled dose, indicative of an essentially complete mass
balance. Most of the recovery occurred within 72 h of
dosing.
Metabolite profiling showed that afatinib was metabo-
lised to a minor extent [40] and the parent compound
(afatinib) was the major drug-related component in plasma,
urine and faeces. The major circulating form of afatinib in
human plasma were adducts of afatinib covalently bound to
plasma proteins (e.g. albumin) via a chemical reaction
mechanism of Michael addition that does not involve
enzymatic catalysis. No metabolites formed by CYP
enzymes were detected in excreta. Oxidative metabolism
mediated via CYPs was of negligible importance for the
metabolism and elimination of afatinib, suggesting that the
risk of interaction between afatinib and other therapies
metabolised by CYP enzymes (i.e. CYP substrates, CYP
inhibitors and CYP inducers), is minimal.
Overall drug clearance (CL/F) was comparable after
single doses and at steady state (gMean 1050 and
898 mL/min, respectively). The gMean terminal half-life
was 21 h (range 21–27 h) after single doses and 37 h
(predominantly ranging from 22 to 47 h) at steady state
0
10
20
30
40
50
60
70
Afa
tinib
plas
ma
conc
entra
tion
[ng/
mL]
Time [hours]
20 mg (n=16/15)
30 mg (n=10/8)
40 mg (n=48/29)
50 mg (n=73/52)
0 4 8 12 16 20 24 480 484 488 492 496 500 504
Fig. 2 Geometric mean afatinib
plasma concentration–time
profiles after single doses and at
steady-state following oral
administration of afatinib
(20–50 mg) once daily to cancer
patients (linear scale).
n = maximum number of
patients contributing to the
geometric mean of each time
point for afatinib single doses
and at steady-state. Reproduced
from Wind et al. [34], with
permission of Springer
Clinical PK/PD of Afatinib 241

Alkaline phosphatase (U/L)
Lactate dehydrogenase (U/L)
ECOG performance score
Creatinine clearance (mL/min)
Body weight (kg)
Gender
Total protein (g/L)
Model predicted mean AUCτ,ss ratio [%] 40 60 80 100 120 140 160 180 200 220
40 60 80 100 120 140 160 180 200 220
Male (body weight corrected)
42 (2.5th percentile)
54 (25th percentile)
71 (75th percentile)
95 (97.5th percentile)
30 (severe)
60 (moderate)
120 (normal)
90 (mild)
2 or higher
0
49 (2.5th percentile)
509 (97.5th percentile)
189 (75th percentile)
76 (25th percentile)
126 (2.5th percentile)
382 (75th percentile)
893 (97.5th percentile)
180 (25th percentile)
85 (97.5th percentile)
76 (75th percentile)
60 (2.5th percentile)
68 (25th percentile)
Reference patient = Female, Body weight 62 kg, Creatinine clearance 79 mL/min, ECOG performance score 1,Alkaline phosphatase 106 U/L, Lactate dehydrogenase 241 U/L, Total protein 72 g/L, Cancer type NSCLC
Bioequivalence limits (80−125%)
90% prediction interval for inter−patient variability
Point estimate from final population pharmacokinetic model and 95% confidence interval
Fig. 3 Ratios (point estimates and 95 % confidence interval based on
bootstrap analysis) of afatinib population mean exposure at steady
state (AUCs) predicted by the population pharmacokinetic model for
different scenarios compared with a typical patient. *Typical patient
was female with NSCLC, body weight 62 kg, creatinine clearance
79 mL/min, ECOG score of 1, alkaline phosphatase 106 U/L, lactate
dehydrogenase 241 U/L, total protein 72 g/L, receiving afatinib
40 mg once daily. The solid vertical line indicates the population
mean for the typical patient, and the shaded area is the 90 %
prediction interval for interpatient variability. The vertical dotted
lines indicate the bioequivalence limits (80–125 %). The 2.5th, 25th,
75th and 97.5th percentiles of the baseline values observed in the
analysed population are shown for body weight, alkaline phosphatase,
lactate dehydrogenase and total protein. Data for the creatinine
clearance subgroups are based on the US FDA classification of renal
function [41]. AUCs area under the drug plasma concentration–time
curve over a uniform dosing interval s, ECOG Eastern Cooperative
Oncology Group, NSCLC non-small cell lung cancer. Reproduced
from Freiwald et al. [35], with permission of Springer
242 S. Wind et al.

(10–100 mg doses) in the phase I meta-analysis [34]. A
half-life of approximately 37 h can be also calculated
based on the accumulation ratio, and can thus be con-
sidered as the effective half-life of afatinib. However, the
real terminal half-life of afatinib seems to be significantly
longer, as suggested by recent studies with more sensitive
bioanalytical assays and longer pharmacokinetic sampling
periods after dosing. A terminal half-life of 70–80 h was
determined after single-dose administration and subse-
quent pharmacokinetic sampling up to 312 h [38, 39], and
up to approximately 340 h after multiple dosing in
patients who stopped afatinib therapy after at least
6 months of treatment and had pharmacokinetic sampling
up to 6 weeks after the last dose (Boehringer Ingelheim,
unpublished data). This phenomenon may be explained by
afatinib’s feature to form covalently bound adducts with
proteins via Michael addition, which is a chemical equi-
librium. These covalent protein adducts can decompose
and slowly release afatinib, leading to the prolonged
elimination phase. However, this prolonged terminal half-
life after long-term treatment does not contribute to the
accumulation of the drug, and resulting afatinib plasma
levels are far below the exposure known to exert phar-
macological efficacy or adverse effects.
3.3 Variability in Exposure
Substantial variability was observed in afatinib exposure in
the clinical trials; for example, geometric coefficient of
variation (gCV) values for AUC across the dose range
20–50 mg ranged from 60 to 92 % in the phase I meta-
analysis [26].
Interindividual variability is still moderate to high, even
after accounting for known effects of intrinsic and extrinsic
factors as illustrated in Fig. 3 by the 90 % prediction
interval of afatinib exposure for an individual NSCLC
patient based on a recent PopPK analysis using data from
927 patients with advanced solid tumours included in seven
phase II/III studies [35].
In the target population of NSCLC patients from the
LUX-Lung 3 trial, afatinib plasma levels also showed high
interpatient variability (gCV from 67 to 85 % with a 40 mg
dose) [19]. However, the applied dose reduction schedule
in LUX-Lung 3 was effective in reducing excessive plasma
concentrations, thus reducing the interpatient variability in
exposure (gCV reduced from 85 % [day 1 of cycle two] to
67 % [day 1 of cycle three]) and thereby providing similar
plasma levels for patients across the dose groups [19] (see
Sect. 7.2).
In the phase I meta-analysis, intraindividual variability
for afatinib trough plasma concentrations over the treat-
ment cycles was moderate, with gCVs ranging from 31.0 to
35.7 % for the 20, 30, 40 and 50 mg dose groups [34].
4 Pharmacokinetics in Special Populations
4.1 Pharmacokinetics in Subjects with Renal
Impairment
In a single-dose study of afatinib 40 mg in subjects with
moderate (n = 8) or severe (n = 8) renal impairment (es-
timated glomerular filtration rate [eGFR] 30–59 and
15–29 mL/min, respectively) and healthy matched controls
(n = 14) [39], the plasma concentration–time profile of
afatinib was similar in both groups. An increase in afatinib
exposure and a decrease in renal clearance with decreased
renal function was observed, as assessed by eGFR,
although overall afatinib terminal half-lives were similar in
subjects with renal impairment. The extent of exposure, as
indicated by area under the drug plasma concentration–
time curve from time zero to the time of the last quantifi-
able data point (AUClast) and Cmax, was generally similar
between the matched treatment groups (Table 5), with the
Table 5 Relationship between degree of renal or hepatic impairment and afatinib pharmacokinetic parameters (adapted from Schnell et al. [38]
and Wiebe et al. [39])
Comparison of grades of renal/hepatic impairment Renal impairment study Hepatic impairment study
AUClast (ng�h/mL) Cmax (ng/mL) AUC? (ng�h/mL) Cmax (ng/mL)
Mild vs. healthy matched controls NA NA 92.6 (68.0–126.3)a 109.5 (82.7–144.9)a
Moderate vs. healthy matched controls 122.2 (95.7–156.0)a 101.2 (72.9–140.3)a 94.9 (72.3–124.5)a 126.9 (86.0–187.2)a
Severe vs. healthy matched controls 150.0 (105.3–213.7)a,b 121.7 (90.8–163.2) NA NA
Data are expressed as adjusted geometric mean ratios (90 % CI)
AUClast area under the drug plasma concentration–time curve from time zero to the time of the last quantifiable data point, AUC? area under the
drug plasma concentration–time curve from time zero to infinity, CI confidence interval, Cmax maximum concentration, NA not applicablea n = 8 per group in each comparison shownb p = 0.06 (two-sided p\ 0.1 indicates formal significance)
Clinical PK/PD of Afatinib 243

exception of the gMean ratio of AUClast for subjects with
severe renal impairment, which showed a trend towards a
higher value compared with matched healthy subjects.
Renal impairment had no effect on plasma protein binding
of afatinib. The relatively minor influence on the pharma-
cokinetics of afatinib is in line with the results from a
recent PopPK analysis based on phase II and III data
testing creatinine clearance (CLCR) as a covariate, and is
within the known interpatient variability of afatinib expo-
sure (Fig. 3) [35]. Based on the low urinary excretion of
afatinib-related radioactivity (\5 %) found in the ADME
study [40], the renal impairment study [39] and the PopPK
analysis [35], it may be hypothesized that non-renal elim-
ination pathways of afatinib are impacted by renal func-
tion, such as a decrease in expression and/or activity of
intestinal P-gp [42, 43].
4.2 Pharmacokinetics in Subjects with Hepatic
Impairment
In a single-dose study of afatinib 50 mg in subjects with
mild (n = 8) or moderate (n = 8) hepatic impairment
(Child–Pugh A and B grades, respectively) and matched
healthy controls (n = 16) [38], plasma concentrations were
generally similar as the mean ratios for Cmax and AUC?
varied between 92.6 and 126.9 % (Table 5). No correlation
between degree of hepatic impairment and pharmacoki-
netics was observed.
Hepatic impairment had no effect on plasma protein
binding of afatinib. Since metabolism of afatinib is negli-
gible [40], there is no effect on biliary excretion of pre-
dominantly unchanged afatinib, consistent with findings
from the PopPK model, which showed that the presence of
liver dysfunction associated with liver metastases had no
significant impact on the exposure (AUC) of afatinib [35].
Overall, these results imply that hepatic function does
not influence the exposure to afatinib; however, it should
be noted that data in patients with severe hepatic impair-
ment (Child–Pugh C) are sparse. Therefore, the EU pre-
scribing guidelines state that treatment with afatinib is not
recommended in patients with severe hepatic impairment
[18], while the US prescribing information states that
patients with severe hepatic impairment should be closely
monitored and the afatinib dose adjusted if not tolerated
[17].
5 Drug–Drug Interactions
Afatinib is not metabolised to an appreciable extent and
does not relevantly inhibit or induce CYP enzymes. Since
it is highly soluble throughout the physiological pH range
of 1–7.5 [25], any drug–drug interactions with acid-
reducing drugs such as H2-receptor antagonists, proton
pump inhibitors and antacids are not expected.
In vitro data suggest that afatinib is a BCRP substrate
and inhibitor. Because no specific in vivo BCRP modula-
tors or substrates are available, which could be adminis-
tered to subjects, no dedicated clinical study was performed
to address the clinical drug–drug interaction potential of
afatinib with regard to substrates of this efflux transporter.
As mentioned, afatinib inhibits P-gp in vitro, but plasma
concentrations of afatinib at therapeutic doses are consid-
erably lower than concentrations expected to inhibit P-gp.
In line with this, concomitant administration of afatinib
with sirolimus, a P-gp substrate, did not result in a clini-
cally relevant change in exposure of either drug [44],
suggesting that afatinib has low or negligible interaction
potential with other P-gp substrates [18]. This also suggests
that there are no drug–drug interactions likely between
afatinib and P-gp substrates at the absorption site in the gut,
where potentially higher local afatinib concentrations could
occur compared with systemic plasma levels.
Since afatinib is a substrate of P-gp in vitro, coadmin-
istration of potent inhibitors and inducers of this efflux
transporter can potentially modify its exposure (AUC and
Cmax). Several phase I drug–drug interaction studies were
performed to investigate the interaction potential with
potent P-gp modulators [45].
5.1 Ritonavir
Two drug–drug interaction studies in healthy subjects
evaluated the effect on afatinib exposure of the potent P-gp
and BCRP inhibitor ritonavir (200 mg twice daily)
administered 1 h before, concomitantly, or 6 h after afa-
tinib [45]. Coadministration of ritonavir did not relevantly
change the exposure to afatinib 40 mg when taken con-
comitantly or 6 h after afatinib, but increased exposure to
afatinib 20 mg by 48 % (AUC?) and 39 % (Cmax) when
administered 1 h before afatinib (Fig. 4). The lack of
interaction with the afatinib 40 mg dose can be explained
by two potential mechanisms; on one hand, P-gp-mediated
transport might be saturated and thus be of minor relevance
for exposure at the 40 mg dose level, which would be in
line with the slightly more than dose proportional increase
in exposure in the therapeutic dose range. On the other
hand, the concomitant and 6 h staggered administration of
ritonavir led to a time delay in P-gp inhibition that did not
relevantly affect afatinib exposure. However, as data con-
firm that potent P-gp inhibitors may increase exposure to
afatinib, caution should be exercised when afatinib needs to
be combined with such comedications. It is recommended
that P-gp inhibitors should be administered in a staggered
dosing regimen, i.e. with as large as possible interval from
the afatinib dose, preferably 6 h (if administered twice
244 S. Wind et al.

daily) or 12 h (if administered once daily) from afatinib
dosing [18]. Furthermore, the afatinib daily dose can be
reduced by 10 mg if not tolerated, and increased to the
previous dose level, if concomitant treatment with P-gp
inhibitors is stopped [17].
As exposure to ritonavir was sufficient to inhibit BCRP
in the two studies [46], it is assumed that a possible
interaction with BCRP inhibitors is also covered by the
drug–drug interaction studies with ritonavir. Thus, it can be
concluded that afatinib exposure is mildly, if at all,
increased by BCRP inhibition.
5.2 Rifampicin
In healthy subjects [45], pretreatment with the potent P-gp
inducer rifampicin (600 mg once daily) for 7 days
decreased plasma exposure of afatinib 40 mg by 34 %
(AUC?) and 22 % (Cmax) (Fig. 4). Therefore, coadminis-
tration with P-gp inducers should be avoided as this may
result in decreased exposure to afatinib. However, if
patients require chronic treatment with a P-gp inducer, the
afatinib daily dose can be increased by 10 mg as tolerated,
and then lowered to the previous dose 2–3 days after the
P-gp inducer is discontinued [17].
5.3 Anticancer Therapy
The pharmacokinetics of afatinib have been studied in
combination with standard chemotherapy agents, including
letrozole [47], paclitaxel [48], pemetrexed [49], docetaxel
[50], vinorelbine [51], temozolomide [52], trastuzumab
[53, 54], nintedanib [55], carboplatin [56], paclitaxel/be-
vacizumab [56], cisplatin/paclitaxel [56, 57] and cisplatin/
5-fluorouracil [57]. In most of these studies, the primary
objective was to determine the maximum tolerated dose of
the combination treatment in patients with advanced solid
tumours. None of the studies demonstrated a significant
pharmacokinetic interaction between afatinib and the other
therapies.
6 Effect of Other Intrinsic and Extrinsic Factorson Afatinib Pharmacokinetics
The potential effects of various intrinsic and extrinsic
factors were investigated using a population approach.
Age, ethnicity, smoking history, alcohol consumption, or
the presence of liver metastases had no statistically sig-
nificant impact on the exposure (AUC) and clearance of
afatinib in the respective PopPK analyses [35]. Significant
covariates that influenced afatinib exposure included food
intake, body weight, sex, Eastern Cooperative Oncology
Group (ECOG) performance score, renal function, and the
level of several serum variables (alkaline phosphatase,
lactate dehydrogenase [LDH] or total protein). Female
patients had a 15 % increase in exposure when accounting
for all other covariate effects (particularly weight), while
exposure was increased by 26 % for a 42 kg patient (2.5th
percentile) relative to a patient weighing 62 kg (median
within the analysed population). Other than a CLCR of
30 mL/min, these covariates had little influence on afatinib
exposure (Fig. 3), with only the upper 95 % CI of AUC for
body weight 42 kg (2.5th percentile), ECOG score [2 or
higher, alkaline phosphatase 509 U/L (97.5th percentile),
LDH 893 U/L (97.5th percentile) exceeding 125 %.
Varying those covariates within the observed extreme
values (2.5th or 97.5th percentile of the baseline values)
increased exposure by 27.8 % for CLCR 43 mL/min (2.5th
percentile), or decreased exposure by 26 % for food intake
less than 3 h before or less than 1 h after afatinib
Test/reference ratio ± 90% CI
AUC test/reference ratio ± 90% CICmax test/reference ratio ± 90% CI
80% 100% 125%
Reference Test
with ritonavir [-1 h]Afatinib 20 mg
with ritonavir [0 h]Afatinib 40 mg
with ritonavir [+6 h]Afatinib 40 mg
Afatinib 40 mg with rifampicin
Fig. 4 Effect of ritonavir and
rifampicin on afatinib exposure.
Broken vertical lines illustrate
the no-effect boundaries
(0.8–1.25) used in the
assessment. AUC area under the
plasma concentration–time
curve, CI confidence interval,
Cmax maximum plasma
concentration. Reproduced from
Wind et al. [45], with
permission of Springer
Clinical PK/PD of Afatinib 245

administration. In simulations of the individual covariate
effects, all of the individual covariate effects were within
the 90 % prediction interval plasma concentration–time
profile for a typical patient (electronic supplementary
Fig. 2).
As mentioned above, smoking history had no significant
effect on plasma exposure of afatinib in the PopPK analysis
[35]. This was expected based on the minor metabolism of
afatinib, in which CYP enzymes such as CYP1A1/1A2,
which are induced by smoking [58], play a negligible role.
7 Clinical Pharmacodynamics
7.1 Effect on Cardiac Repolarisation
The effect of afatinib 50 mg on cardiac repolarisation was
studied in 60 patients with advanced solid tumours. The
mean time-matched QT interval using the Fridericia cor-
rection method (QTcF) over 1–24 h following adminis-
tration of afatinib, showed a non-significant decrease of
0.3 ms (90 % CI -2.8 to 2.3 ms) between baseline and day
14. No changes in the mean QTc interval [20 ms were
detected and no patient had new-onset prolongation of the
QTcF interval ([450 ms) or an uncorrected QT interval of
[500 ms on days 1 or 14 [33]. No correlation was
observed between pharmacokinetic parameters and elec-
trocardiogram (ECG) variables, and no treatment-related
morphological ECG abnormalities were detected. Thus, the
data indicate that afatinib does not affect the QTc interval
and therefore no specific ECG monitoring is indicated
clinically.
7.2 Exposure–Response Relationships
The association between afatinib trough plasma concen-
trations and efficacy endpoints was investigated in the
LUX-Lung 3 trial [19] (Boehringer Ingelheim, unpublished
data) [26]. For this analysis, afatinib trough plasma con-
centrations on the last day of sampling (day 42) were taken
(or days 29 or 21 if missing). The relationship between
trough afatinib concentrations, categorised using the
quartile values, was explored according to week 6 tumour
shrinkage, measured as the absolute and percentage change
in the sum of target lesion diameters from randomisation
(Table 6). No correlation between afatinib trough plasma
concentrations and any tumour shrinkage could be
detected.
The association between afatinib trough plasma con-
centrations and severity of the adverse events (AEs) diar-
rhoea and rash/acne was investigated using pooled data
from several trials [19, 59–62] (Boehringer Ingelheim,
unpublished data) [26]. For this analysis, the severity of
diarrhoea and skin rash/acne during treatment, as measured
by the maximum grades for these AEs (graded according to
the National Cancer Institute Common Terminology Cri-
teria for Adverse Events [CTCAE] Version 3.0), were
compared against afatinib trough plasma concentrations on
day 15 (the first day of pharmacokinetic sampling), as the
onset of these AEs generally occurs within the first or
second week of afatinib treatment. The median trough
plasma concentration of afatinib was calculated among
patients per maximum CTCAE grade observed (Table 7).
Median afatinib trough plasma concentrations were
increased with the severity of diarrhoea and rash/acne,
suggesting that higher exposure of afatinib increases the
risk of experiencing CTCAE grade 3 or higher toxicity or
grade 2 or higher diarrhoea events.
Afatinib-related AEs are generally managed with dose
modifications; in the case of grade 3 or selected, prolonged
grade 2 AE events, the dose can be reduced by 10 mg
decrements to 30 mg or a final dose of 20 mg [17, 18]. A
dose modification schedule based on tolerability was
applied in the LUX-Lung 3 trial [19]. Patients started with
a dose of afatinib 40 mg, but should be dose-escalated to
50 mg in case of good tolerability, and dose reduced to
30 mg and 20 mg in case afatinib was not tolerated. Post
hoc analyses from LUX-Lung 3 assessed the influence of
afatinib dose reduction on trough concentrations [63]
(Fig. 5). By applying this dose modification schedule,
Table 6 Relationship between tumour shrinkage and quartiles of afatinib trough plasma concentrations in the LUX-Lung 3 trial [19] (Boeh-
ringer Ingelheim, unpublished data) [26]
Parameter and unit Quartiles of afatinib trough plasma concentrations (n = 193)
Trough B Q1 Q1\ trough B median Median\ trough B Q3 Trough[Q3
Decrease from baseline to week 6 in sum of target lesion diametersa
Patients with trough/tumour measurements, n (%) 49 (100.0) 48 (100.0) 48 (100.0) 48 (100.0)
Maximum decrease from baseline, mmb -13.00 -8.40 -12.80 -14.65
Maximum % mm decrease from baseline -30.27 -22.66 -30.45 -25.15
a Based on independent reviewb Data are expressed as median values
246 S. Wind et al.

Table 7 Relationship between maximum CTCAE grades of diarrhoea and rash and afatinib trough plasma concentrations for patients with
evaluable pharmacokinetic data across the dose range 40–50 mg in the LUX-Lung 1–4 trials [19, 59–62] (Boehringer Ingelheim, unpublished
data) [26]
CTCAE grade Afatinib trough plasma concentrations (ng/mL) on day 15
50 mg starting dosea 40 mg starting doseb Totalc
N Median N Median N Median
Diarrhoea
0 (none) 1 86.4 1 86.4
1 159 35.6 113 25.2 272 31.3
2 152 44.1 93 31.6 245 39.6
3 90 50.1 35 35.8 125 47.5
Rash/acne
1 125 37.9 77 27.6 202 34.4
2 164 39.9 111 26.8 275 34.2
3 73 52.1 39 31.4 112 45.1
CTCAE National Cancer Institute Common Terminology Criteria for Adverse Events Version 3.0, NSCLC non-small cell lung cancer, TKI
tyrosine kinase inhibitora TKI-naıve patients in LUX-Lung 2 [59] and LUX-Lung 3 [19] who received an afatinib starting dose of 40 mgb TKI-resistant NSCLC patients in LUX-Lung 1 [60] and LUX-Lung 4 [61, 62] who received an afatinib starting dose of 50 mgc Both NSCLC patient populations (i.e. 40 and 50 mg starting doses in LUX-Lung 1–4) [19, 59–62]
0
20
40 mg(n=122)
Individual data with medianand 25th/75th percentiles
10th/90th percentiles
Datapoints outside percentiles
40 mg(n=10)
Day 22 (cycle 2, visit 1) Day 43 (cycle 3, visit 1)(n=165)
40 mg(n=13)
40 mg(n=126)
30 mg(n=38)
50 mg(n=14)
40
60
80
100
120
140
Trou
gh p
lasm
a co
ncen
tratio
ns [n
g/m
L]
Fig. 5 Comparison of afatinib
trough plasma concentrations on
days 22 and 43 in patients who
remained on afatinib 40 mg,
reduced their dose to 30 mg, or
escalated to 50 mg in the LUX-
Lung 3 trial [19, 63]. Striped
boxes indicate patients who
remained on 40 mg until day 43
(cycle 3, visit 1, n = 126). Grey
boxes indicate patients who
reduced their dose to 30 mg
before day 43 (n = 38; only 10
of these patients had valid
trough concentrations on
afatinib 40 mg at day 22 [cycle
2, visit 1; the rest had either no
pharmacokinetic sampling due
to dose interruption, were
already receiving afatinib
30 mg, or were excluded due to
invalid sampling]). White boxes
indicate patients who dose
escalated to 50 mg before cycle
3, visit 1 (n = 14)
Clinical PK/PD of Afatinib 247

variability in trough plasma concentration was decreased
from day 22 to day 43, as, in general, patients with higher
plasma exposure were dose reduced to 30 mg and, in
patients with lower plasma exposure, the dose was esca-
lated to afatinib 50 mg. At the time of the last pharma-
cokinetic observation on day 43, gMean trough plasma
concentrations were in the same range for all patients,
independent of the afatinib dose, indicating that the dose
modification schedule was effective in reducing the vari-
ability and bringing the patients to a tolerated plasma
exposure.
8 Summary/Conclusions
In patients with solid tumours, peak plasma concentra-
tions of afatinib occur approximately 2–5 h after oral
dosing and decline afterwards in an at least bi-expo-
nential manner. Afatinib metabolism is minimal, with
unchanged drug predominantly excreted in the faeces and
approximately 5 % in urine. The effective half-life is
approximately 37 h, justifying a once-daily dosing regi-
men. Over the clinical dose range 20–50 mg, the phar-
macokinetics of afatinib are slightly more than dose
proportional. The main covariates for afatinib exposure
are body weight and renal function, while factors such as
age, ethnicity, smoking status or hepatic function have
no relevant influence. Predicted exposure increases for
female patients, patients with low body weight or
patients with impaired renal function are within the
variability range of afatinib exposure.
At the approved afatinib dose of 40 mg, there is low
drug–drug interaction potential. Afatinib pharmacokinetics
are not affected by commonly coprescribed medications
such as CYP inducers/inhibitors and acid-reducing agents,
but concomitant treatment with strong inhibitors or
inducers of P-gp can affect the pharmacokinetics of afa-
tinib, and thus caution is advisable with this combination.
At a dose of 50 mg, afatinib does not have proarrhythmic
potential.
In conclusion, the studies discussed in this review sup-
port the use of afatinib as an efficacious and well-tolerated
treatment for patients in its approved indications. In routine
clinical practice, afatinib may offer a number of theoretical
advantages compared with first-generation TKIs, notably
the lack of CYP-related interaction potential, thereby
decreasing the risk of drug–drug interactions [64].
Acknowledgments The authors would like to thank Marion Schmid
for technical support.
Compliance with Ethical Standards
Conflicts of interest Sven Wind, David Schnell, Thomas Ebner,
Matthias Freiwald and Peter Stopfer are full-time employees of
Boehringer Ingelheim.
Ethical approval All procedures performed in studies involving
human participants were in accordance with the ethical standards of
the independent ethics committee and with the 1964 Helsinki decla-
ration and its later amendments or comparable ethical standards.
Informed consent Informed consent was obtained from all individ-
ual human participants included in the described studies.
Open Access This article is distributed under the terms of the
Creative Commons Attribution-NonCommercial 4.0 International
License (http://creativecommons.org/licenses/by-nc/4.0/), which per-
mits any noncommercial use, distribution, and reproduction in any
medium, provided you give appropriate credit to the original
author(s) and the source, provide a link to the Creative Commons
license, and indicate if changes were made.
References
1. Arteaga CL. Epidermal growth factor receptor dependence in
human tumors: more than just expression? Oncologist.
2002;7(Suppl 4):31–9.
2. Ciardiello F, Tortora G. EGFR antagonists in cancer treatment.
N Engl J Med. 2008;358:1160–74.
3. Sharma SV, Bell DW, Settleman J, et al. Epidermal growth factor
receptor mutations in lung cancer. Nat Rev Cancer.
2007;7:169–81.
4. Mok TS, Wu YL, Thongprasert S, et al. Gefitinib or carboplatin-
paclitaxel in pulmonary adenocarcinoma. N Engl J Med.
2009;361:947–57.
5. Mitsudomi T, Morita S, Yatabe Y, et al. Gefitinib versus cisplatin
plus docetaxel in patients with non-small-cell lung cancer har-
bouring mutations of the epidermal growth factor receptor
(WJTOG3405): an open label, randomised phase 3 trial. Lancet
Oncol. 2010;11:121–8.
6. Maemondo M, Inoue A, Kobayashi K, et al. Gefitinib or
chemotherapy for non-small-cell lung cancer with mutated
EGFR. N Engl J Med. 2010;362:2380–8.
7. Zhou C, Wu YL, Chen G, et al. Erlotinib versus chemotherapy as
first-line treatment for patients with advanced EGFR mutation-
positive non-small-cell lung cancer (OPTIMAL, CTONG-0802):
a multicentre, open-label, randomised, phase 3 study. Lancet
Oncol. 2011;12:735–42.
8. Rosell R, Carcereny E, Gervais R, et al. Erlotinib versus standard
chemotherapy as first-line treatment for European patients with
advanced EGFR mutation-positive non-small-cell lung cancer
(EURTAC): a multicentre, open-label, randomised phase 3 trial.
Lancet Oncol. 2012;13:239–46.
9. Sequist LV, Waltman BA, Dias-Santagata D, et al. Genotypic and
histological evolution of lung cancers acquiring resistance to
EGFR inhibitors. Sci Transl Med. 2011;3:7526.
10. Yu HA, Arcila ME, Rekhtman N, et al. Analysis of tumor
specimens at the time of acquired resistance to EGFR-TKI
therapy in 155 patients with EGFR-mutant lung cancers. Clin
Cancer Res. 2013;19:2240–7.
11. Kosaka T, Yatabe Y, Endoh H, et al. Analysis of epidermal
growth factor receptor gene mutation in patients with non-small
cell lung cancer and acquired resistance to gefitinib. Clin Cancer
Res. 2006;12:5764–9.
248 S. Wind et al.
12. Yun CH, Mengwasser KE, Toms AV, et al. The T790M mutation
in EGFR kinase causes drug resistance by increasing the affinity
for ATP. Proc Natl Acad Sci USA. 2008;105:2070–5.
13. Wu SG, Liu YN, Tsai MF, et al. The mechanism of acquired
resistance to irreversible EGFR tyrosine kinase inhibitor-afa-
tinib in lung adenocarcinoma patients. Oncotarget. 2016;7:
12404–13.
14. Reid A, Vidal L, Shaw H, et al. Dual inhibition of ErbB1 (EGFR/
HER1) and ErbB2 (HER2/neu). Eur J Cancer. 2007;43:481–9.
15. Li D, Ambrogio L, Shimamura T, et al. BIBW2992, an irre-
versible EGFR/HER2 inhibitor highly effective in preclinical
lung cancer models. Oncogene. 2008;27:4702–11.
16. Solca F, Dahl G, Zoephel A, et al. Target binding properties and
cellular activity of afatinib (BIBW 2992), an irreversible ErbB
family blocker. J Pharmacol Exp Ther. 2012;343:342–50.
17. Boehringer Ingelheim. Gilotrif [prescribing information] (2016)
Boehringer Ingelheim Pharmaceuticals, Inc., Ridgefield, CT.
http://www.gilotrif.com/. Accessed 7 Jun 2016.
18. European Medicines Agency. Giotrif: summary of product
characteristics, version 24 May 2016. http://www.ema.europa.eu/
docs/en_GB/document_library/EPAR_-_Product_Information/
human/002280/WC500152392.pdf. Accessed 7Jun 2016.
19. Sequist LV, Yang JC, Yamamoto N, et al. Phase III study of
afatinib or cisplatin plus pemetrexed in patients with metastatic
lung adenocarcinoma with EGFR mutations. J Clin Oncol.
2013;31:3327–34.
20. Wu YL, Zhou C, Hu CP, et al. Afatinib versus cisplatin plus
gemcitabine for first-line treatment of Asian patients with
advanced non-small-cell lung cancer harbouring EGFR mutations
(LUX-Lung 6): an open-label, randomised phase 3 trial. Lancet
Oncol. 2014;15:213–22.
21. Yang JC, Wu YL, Schuler M, et al. Afatinib versus cisplatin-
based chemotherapy for EGFR mutation-positive lung adeno-
carcinoma (LUX-Lung 3 and LUX-Lung 6): analysis of overall
survival data from two randomised, phase 3 trials. Lancet Oncol.
2015;16:141–51.
22. Soria JC, Felip E, Cobo M, et al. Afatinib versus erlotinib as
second-line treatment of patients with advanced squamous cell
carcinoma of the lung (LUX-Lung 8): an open-label randomised
controlled phase 3 trial. Lancet Oncol. 2015;16:897–907.
23. European Medicines Agency. Giotrif. Procedural steps taken and
scientific information after the authorisation. 2016. http://www.
ema.europa.eu/docs/en_GB/document_library/EPAR_-_Procedural_
steps_taken_and_scientific_information_after_authorisation/
human/002280/WC500177054.pdf. Accessed 19 July 2016.
24. Modjtahedi H, Cho BC, Michel MC, et al. A comprehensive
review of the preclinical efficacy profile of the ErbB family
blocker afatinib in cancer. Naunyn Schmiedebergs Arch Phar-
macol. 2014;387:505–21.
25. European Medicines Agency. Committee for Medicinal Products
for Human Use (CHMP) Assessment report for Giotrif (afatinib).
2013. http://www.ema.europa.eu/docs/en_GB/document_library/
EPAR_-_Public_assessment_report/human/002280/WC5001523
94.pdf. Accessed 17 Mar 2016.
26. FDA Center for Drug Evaluation and Research. Afatinib clinical
pharmacology NDA review. 2013. http://www.accessdata.fda.
gov/drugsatfda_docs/nda/2013/201292Orig1s000ClinPharmR.
pdfAccessed 17 Mar 2016.
27. FDA Center for Drug Evaluation and Research (CDER). Guid-
ance for industry. Drug interaction studies: study design, data
analysis, implications for dosing, and labeling recommendations.
US FDA draft guidance. 2012. http://www.fda.gov/downloads/
Drugs/GuidanceComplianceRegulatoryInformation/Guidances/
ucm292362.pdf. Accessed 17 Mar 2016.
28. FDA Center for Drug Evaluation and Research. Afatinib phar-
macology NDA# 201292 review. 2013. http://www.accessdata.
fda.gov/drugsatfda_docs/nda/2013/201292Orig1s000PharmR.
pdf. Accessed 17 Mar 2016.
29. Eskens FA, Mom CH, Planting AS, et al. A phase I dose esca-
lation study of BIBW 2992, an irreversible dual inhibitor of
epidermal growth factor receptor 1 (EGFR) and 2 (HER2) tyr-
osine kinase in a 2-week on, 2-week off schedule in patients with
advanced solid tumours. Br J Cancer. 2008;98:80–5.
30. Yap TA, Vidal L, Adam J, et al. Phase I trial of the irreversible
EGFR and HER2 kinase inhibitor BIBW 2992 in patients with
advanced solid tumors. J Clin Oncol. 2010;28:3965–72.
31. Marshall J, Hwang J, Eskens FA, et al. A Phase I, open-label,
dose escalation study of afatinib, in a 3-week-on/1-week-off
schedule in patients with advanced solid tumors. Invest New
Drugs. 2013;31:399–408.
32. Gordon MS, Mendelson DS, Gross M, et al. A Phase I, open-
label, dose-escalation study of continuous once-daily oral treat-
ment with afatinib in patients with advanced solid tumors. Invest
New Drugs. 2013;31:409–16.
33. Molife LR, Rudman SM, Alam S, et al. Phase II, open-label trial
to assess QTcF effects, pharmacokinetics and antitumor activity
of afatinib in patients with relapsed or refractory solid tumors.
Cancer Chemother Pharmacol. 2013;72:1213–22.
34. Wind S, Schmid M, Erhardt J, et al. Pharmacokinetics of afatinib,
a selective irreversible ErbB family blocker, in patients with
advanced solid tumours. Clin Pharmacokinet. 2013;52:1101–9.
35. Freiwald M, Schmid U, Fleury A, et al. Population pharma-
cokinetics of afatinib, an irreversible ErbB family blocker, in
patients with various solid tumors. Cancer Chemother Pharmacol.
2014;73:759–70.
36. Boehringer Ingelheim. Relative bioavailability of a single dose of
20 mg BIBW 2992 administered as tablet (final formulation)
compared to BIBW 2992 drinking solution and BIBW 2992 tablet
(trial formulation II) following oral administration to healthy
male volunteers (an open-label, randomised, single-dose, three-
way crossover phase I study). Trial No. 1200.35. http://trials.
boehringer-ingelheim.com/content/dam/internet/opu/clinicaltrial/
com_EN/results/1200/1200.35_U09-2233-02.pdf. Accessed 17
Mar 2016.
37. FDA Center for Drug Evaluation and Research (CDER). Guid-
ance for industry. Food-effect bioavailability and fed bioequiva-
lence studies. US FDA draft guidance. 2002. http://www.fda.gov/
downloads/RegulatoryInformation/Guidances/UCM126833.pdf.
Accessed 17 Mar 2016.
38. Schnell D, Buschke S, Fuchs H, et al. Pharmacokinetics of afa-
tinib in subjects with mild or moderate hepatic impairment.
Cancer Chemother Pharmacol. 2014;74:267–75.
39. Wiebe S, Schnell D, Kulzer R, et al. Influence of renal impair-
ment on the pharmacokinetics of afatinib: an open-label, single-
centre study. Eur J Drug Metab Pharmacokinet. 2016. doi:10.
1007/s13318-016-0359-9.
40. Stopfer P, Marzin K, Narjes H, et al. Afatinib pharmacokinetics
and metabolism after oral administration to healthy male volun-
teers. Cancer Chemother Pharmacol. 2012;69:1051–61.
41. US FDA Center for Drug Evaluation and Research. US Depart-
ment of Health and Human Services, Food and Drug Adminis-
tration, Center for Drug Evaluation and Research (CDER).
Guidance for industry. Pharmacokinetics in patients with
impaired renal function: study design, data analysis, and impact
on dosing and labeling. 2010. http://www.fda.gov/downloads/
Drugs/GuidanceComplianceRegulatoryInformation/Guidances/
UCM204959.pdf. Accessed 2 Jan 2016.
42. Nolin TD, Naud J, Leblond FA, et al. Emerging evidence of the
impact of kidney disease on drug metabolism and transport. Clin
Pharmacol Ther. 2008;83:898–903.
43. Zhang Y, Zhang L, Abraham S, et al. Assessment of the impact of
renal impairment on systemic exposure of new molecular entities:
Clinical PK/PD of Afatinib 249

evaluation of recent new drug applications. Clin Pharmacol Ther.
2009;85:305–11.
44. Moran T, Palmero R, Provencio M, et al. A Phase Ib open label
clinical trial of continuous once daily oral afatinib (A) plus sir-
olimus (S) in patients (Pts) with EGFR mutation positive (EGFR
M ?) NSCLC and/or disease progression following prior erloti-
nib (E) or gefitinib (G) [abstract no. 1248PA]. Ann Oncol.
2014;25:iv437.
45. Wind S, Giessmann T, Jungnik A, et al. Pharmacokinetic drug
interactions of afatinib with rifampicin and ritonavir. Clin Drug
Investig. 2014;34:173–82.
46. Tachibana T, Kato M, Watanabe T, et al. Method for predicting
the risk of drug-drug interactions involving inhibition of intestinal
CYP3A4 and P-glycoprotein. Xenobiotica. 2009;39:430–43.
47. Gunzer K, Joly F, Ferrero JM, et al. A phase II study of afatinib,
an irreversible ErbB family blocker, added to letrozole in patients
with estrogen receptor-positive hormone-refractory metastatic
breast cancer progressing on letrozole. Springerplus. 2016;5:45.
48. Suder A, Ang JE, Kyle F, et al. A phase I study of daily afatinib,
an irreversible ErbB family blocker, in combination with weekly
paclitaxel in patients with advanced solid tumours. Eur J Cancer.
2015;51:2275–84.
49. Chu QS, Sangha R, Hotte SJ, et al. A phase I, dose-escalation trial
of continuous- and pulsed-dose afatinib combined with peme-
trexed in patients with advanced solid tumors. Invest New Drugs.
2014;32:1226–35.
50. Awada AH, Dumez H, Hendlisz A, et al. Phase I study of pul-
satile 3-day administration of afatinib (BIBW 2992) in combi-
nation with docetaxel in advanced solid tumors. Invest New
Drugs. 2013;31:734–41.
51. Mukai H, Masuda N, Ishiguro H, et al. Phase I trial of afatinib
plus vinorelbine in Japanese patients with advanced solid tumors,
including breast cancer. Cancer Chemother Pharmacol.
2015;76:739–50.
52. Reardon DA, Nabors LB, Mason WP, et al. Phase I/randomized
phase II study of afatinib, an irreversible ErbB family blocker,
with or without protracted temozolomide in adults with recurrent
glioblastoma. Neuro Oncol. 2015;17:430–9.
53. Lin NU, Winer EP, Wheatley D, et al. A phase II study of afatinib
(BIBW 2992), an irreversible ErbB family blocker, in patients
with HER2-positive metastatic breast cancer progressing after
trastuzumab. Breast Cancer Res Treat. 2012;133:1057–65.
54. Ring A, Wheatley D, Hatcher H, et al. Phase I study to assess the
combination of afatinib with trastuzumab in patients with
advanced or metastatic HER2-positive breast cancer. Clin Cancer
Res. 2015;21:2737–44.
55. Gordon MS, Springett GM, Su YB, et al. A Phase I dose-esca-
lation study of afatinib combined with nintedanib in patients with
advanced solid tumors. Future Oncol. 2015;11:1479–91.
56. Boehringer Ingelheim. A phase I open label trial of continuous
dosing with BIBW 2992 combined with paclitaxel and BIBW
2992 combined with paclitaxel and bevacizumab, BIBW 2992
combined with carboplatin and BIBW 2992 combined with
paclitaxel and carboplatin in patients with advanced solid
tumours. Trial No. 1200.12. http://trials.boehringer-ingelheim.
com/content/dam/internet/opu/clinicaltrial/com_EN/results/1200/
1200.12_c01802594-02_DR.pdf. Accessed 17 Mar 2016.
57. Vermorken JB, Rottey S, Ehrnrooth E, et al. A phase Ib, open-
label study to assess the safety of continuous oral treatment with
afatinib in combination with two chemotherapy regimens: cis-
platin plus paclitaxel and cisplatin plus 5-fluorouracil, in patients
with advanced solid tumors. Ann Oncol. 2013;24:1392–400.
58. Petros WP, Younis IR, Ford JN, et al. Effects of tobacco smoking
and nicotine on cancer treatment. Pharmacotherapy. 2012;32:
920–31.
59. Yang JC, Shih JY, Su WC, et al. Afatinib for patients with lung
adenocarcinoma and epidermal growth factor receptor mutations
(LUX-Lung 2): a phase 2 trial. Lancet Oncol. 2012;13:539–48.
60. Miller VA, Hirsh V, Cadranel J, et al. Afatinib versus placebo for
patients with advanced, metastatic non-small-cell lung cancer
after failure of erlotinib, gefitinib, or both, and one or two lines of
chemotherapy (LUX-Lung 1): a phase 2b/3 randomised trial.
Lancet Oncol. 2012;13:528–38.
61. Murakami H, Tamura T, Takahashi T, et al. Phase I study of
continuous afatinib (BIBW 2992) in patients with advanced non-
small cell lung cancer after prior chemotherapy/erlotinib/gefitinib
(LUX-Lung 4). Cancer Chemother Pharmacol. 2012;69:891–9.
62. Katakami N, Atagi S, Goto K, et al. LUX-Lung 4: a phase II trial
of afatinib in patients with advanced non-small-cell lung cancer
who progressed during prior treatment with erlotinib, gefitinib, or
both. J Clin Oncol. 2013;31:3335–41.
63. Yang JC, Ahn MJ, Dickgreber NJ, et al. Influence of dose
adjustment on afatinib safety and efficacy in patients (pts) with
advanced EGFR mutation-positive (EGFRm?) non-small cell
lung cancer (NSCLC). J Clin Oncol. 2015;33(15_Suppl):8073.
64. Song X, Varker H, Eichelbaum M, et al. Treatment of lung cancer
patients and concomitant use of drugs interacting with cyto-
chrome P450 isoenzymes. Lung Cancer. 2011;74:103–11.
250 S. Wind et al.


![Simulation-based comparison of Biopharmaceutics ...Introduction The Biopharmaceutics Classification System (BCS) [1-2] was proposed in 1995 [3] to classify drugs into four categories](https://img.pdfslide.us/doc/110x75/5e938115f1d85227825f0719/simulation-based-comparison-of-biopharmaceutics-introduction-the-biopharmaceutics.jpg)


![Solidification of nanosuspensions for the production of solid oral … · 2017. 12. 14. · that fall into classes II and IV of the Biopharmaceutics Classification system (BCS) [13,14]](https://img.pdfslide.us/doc/110x75/60b9d8bbc4ac48439b321c73/solidification-of-nanosuspensions-for-the-production-of-solid-oral-2017-12-14.jpg)