Embed Size (px)
Citation preview
University of Kentucky University of Kentucky
UKnowledge UKnowledge
Theses and Dissertations--Pharmacy College of Pharmacy
2012
CLINICAL EVALUATION OF NOVEL METHODS FOR EXTENDING CLINICAL EVALUATION OF NOVEL METHODS FOR EXTENDING
MICRONEEDLE PORE LIFETIME MICRONEEDLE PORE LIFETIME
Nicole K. Brogden University of Kentucky, [email protected]
Right click to open a feedback form in a new tab to let us know how this document benefits you. Right click to open a feedback form in a new tab to let us know how this document benefits you.
Recommended Citation Recommended Citation Brogden, Nicole K., "CLINICAL EVALUATION OF NOVEL METHODS FOR EXTENDING MICRONEEDLE PORE LIFETIME" (2012). Theses and Dissertations--Pharmacy. 8. https://uknowledge.uky.edu/pharmacy_etds/8
This Doctoral Dissertation is brought to you for free and open access by the College of Pharmacy at UKnowledge. It has been accepted for inclusion in Theses and Dissertations--Pharmacy by an authorized administrator of UKnowledge. For more information, please contact [email protected].

STUDENT AGREEMENT: STUDENT AGREEMENT:
I represent that my thesis or dissertation and abstract are my original work. Proper attribution
has been given to all outside sources. I understand that I am solely responsible for obtaining
any needed copyright permissions. I have obtained and attached hereto needed written
permission statements(s) from the owner(s) of each third-party copyrighted matter to be
included in my work, allowing electronic distribution (if such use is not permitted by the fair use
doctrine).
I hereby grant to The University of Kentucky and its agents the non-exclusive license to archive
and make accessible my work in whole or in part in all forms of media, now or hereafter known.
I agree that the document mentioned above may be made available immediately for worldwide
access unless a preapproved embargo applies.
I retain all other ownership rights to the copyright of my work. I also retain the right to use in
future works (such as articles or books) all or part of my work. I understand that I am free to
register the copyright to my work.
REVIEW, APPROVAL AND ACCEPTANCE REVIEW, APPROVAL AND ACCEPTANCE
The document mentioned above has been reviewed and accepted by the student’s advisor, on
behalf of the advisory committee, and by the Director of Graduate Studies (DGS), on behalf of
the program; we verify that this is the final, approved version of the student’s dissertation
including all changes required by the advisory committee. The undersigned agree to abide by
the statements above.
Nicole K. Brogden, Student
Dr. Audra L. Stinchcomb, Major Professor
Dr. Jim Pauly, Director of Graduate Studies
CLINICAL EVALUATION OF NOVEL METHODS FOR EXTENDING MICRONEEDLE PORE LIFETIME
DISSERTATION
A dissertation submitted in partial fulfillment
of the requirements for the degree of Doctor of Philosophy in the
College of Pharmacy
at the University of Kentucky
By
Nicole K. Brogden
Lexington, Kentucky
Director: Dr. Audra L. Stinchcomb, Professor of Pharmaceutical Sciences
Lexington, Kentucky
2012
Copyright © Nicole K. Brogden 2012
ABSTRACT OF DISSERTATION
CLINICAL EVALUATION OF NOVEL METHODS FOR EXTENDING MICRONEEDLE PORE LIFETIME
Microneedles are a minimally invasive method for delivering drugs through the impermeable skin layers, and have been used to deliver a variety of compounds including macromolecules, vaccines, and naltrexone. Microneedles can be applied to the skin once, creating micropores that allow for drug delivery into the underlying circulation from a drug formulation. The utility of this technique, however, is blunted by rapid micropore closure. This research project sought to: 1) characterize micropore lifetime and re-sealing kinetics, and 2) prolong micropore lifetime via inhibition of the skin’s barrier restoration processes. Impedance spectroscopy was used as a surrogate technique in animals and humans to measure micropore formation and lifetime. A proof of concept study in humans, using impedance spectroscopy, demonstrated that diclofenac (a topical anti-inflammatory) applied to microporated skin resulted in slower re-sealing kinetics compared to placebo, in agreement with previous animal studies. The clinical feasibility of prolonging micropore lifetime with diclofenac was confirmed via 7-day delivery of naltrexone through microneedle treated skin in humans (compared to 72 hour delivery with placebo). Lastly, naltrexone gels with calcium salts were applied to microneedle treated skin (hairless guinea pigs) to restore the altered epidermal calcium gradient; this method did not significantly extend micropore lifetime.
KEYWORDS: diclofenac, impedance, microneedles, naltrexone, transdermal
Nicole K. Brogden Student’s signature
July 17, 2012 Date
CLINICAL EVALUATION OF NOVEL METHODS FOR EXTENDING MICRONEEDLE PORE LIFETIME
By
Nicole K. Brogden
Dr. Audra L. Stinchcomb Director of Dissertation
Dr. Jim Pauly Director of Graduate Studies
July 17, 2012 Date

DEDICATION
This entire body of work is dedicated to my parents,
who have provided immense support, encouragement, and guidance throughout all of
my academic endeavors.
iii
ACKNOWLEDGEMENTS
Listen to the MUSTN’TS, child,
Listen to the DON’TS,
Listen to the SHOULDN’TS
The IMPOSSIBLES, the WON’TS
Listen to the NEVER HAVES
Then listen close to me –
Anything can happen, child,
ANYTHING can be.
– Shel Silverstein
It is not an overstatement that this work could not have been completed without
the expertise and support of a large number of people. I extend my sincerest thanks to
Dr. Audra Stinchcomb for the opportunity to be involved in a clinically relevant and
human-focused research project. I have grown as both a pharmacist and research
investigator through completion of this work. Additionally, Dr. Stinchcomb was extremely
generous to support me in completing my studies at University of Kentucky after she
relocated for a new faculty position at University of Maryland, Baltimore. Next, I wish to
thank the complete dissertation committee, and outside examiner, respectively: Dr. E.
Penni Black, Dr. Charles Loftin, Dr. Susan S. Smyth, and Dr. Kimberly Anderson. My
committee was extremely supportive throughout my training, particularly after Dr.
Stinchcomb began her new position in Baltimore. Dr. Leslie Crofford, as my clinical
mentor and study physician on all of the human studies, has been generous beyond
words in the support she provided me. She selflessly agreed to mentor me through all of
my clinical work, and I am deeply grateful for her continued encouragement and
mentoring. The love and support of my parents, Kim and Katherine Brogden, has been
unwavering during my long academic training (from pharmacy school through residency
iv
and graduate school), and helped me maintain the continued drive to complete this
research project. Ken Clinkenbeard has provided consistent love, understanding, and
good coffee during my training, despite long hours and late nights. I would like to thank
all my labmates: Dr. Kalpana Paudel, Dr. Caroline Strasinger, Dr. Mikolaj Milewski, Dr.
Courtney Swadley, Priyanka Ghosh, Jessica Wehle and Dana Hammell - their help with
experiments and day to day lab activities was critical in finishing this project. Dr. Stan
Banks has been unbelievably helpful and supportive of my growth as a bench scientist
and his contributions to my training cannot be overstated. Several funding sources have
supported this work, including NIH and the Center for Clinical and Translational Science;
I appreciate their support and the help of everyone at OSPA for administering the grants.
The IRB and staff in the ORI have been extremely helpful as I’ve learned to
appropriately conduct human clinical studies. Thank you to the staff and veterinarians in
the animal facilities who assisted with animal studies and took excellent care of our
animals. All of the nurses and staff at the Center for Clinical and Translational Science
were extremely generous and patient as I learned the processes of clinical research, and
they were fantastic in their clinical skills. I would like to acknowledge Dr. Vladimir
Zarnitsyn and Dr. Mark Prausnitz (Georgia Institute of Technology) for their expertise
with the MN arrays and fabrication process, and for providing expert opinions on my
research efforts. Catina Rossoll, Tammi Young, Betsy Davis, Tammy Kamer, Barbara
Hurst, Rodney Armstrong, Janice Butner, and Lou Dunn have all helped me immensely
with administrative activities. I would like to extend a heartfelt thanks to my research
subjects, without whom this body of work would not have had much meaning. To all of
my friends who have provided study breaks, good laughs, and a sense of home for me
here in Kentucky – you’ll never understand how much that helped me towards achieving
my goals. Without all of these people, all from different facets of my life, this work would
have remained solely an idea, and would not have ever come to completion.
v
TABLE OF CONTENTS
Acknowledgements ........................................................................................................... iii
List of tables ..................................................................................................................... xi
List of figures ................................................................................................................... xiii
List of abbreviations ........................................................................................................ xv
Chapter 1: Statement of the problem ................................................................................ 1
Chapter 2: Research hypotheses ...................................................................................... 4
Chapter 3: Research plan ................................................................................................. 7
3.1 Develop an impedance spectroscopy technique as a surrogate marker to
monitor micropore formation and lifetime .............................................................. 7
3.2 Characterize the kinetics of micropore closure following topical application of
diclofenac to microneedle-treated skin in healthy human volunteers .................... 8
3.3 Quantify in vitro diclofenac skin concentrations in Yucatan miniature pig
skin following one-time microneedle treatment and application of diclofenac ±
naltrexone .............................................................................................................. 8
3.4 Determine in vitro microneedle-enhanced transdermal flux of naltrexone
across Yucatan miniature pig skin in the presence of diclofenac ......................... 9
3.5 Establish the tolerability of a combination of a 3% diclofenac gel
and an 11% naltrexone gel on microneedle-treated skin in hairless guinea
pigs ........................................................................................................................ 9
3.6 Pharmacokinetic evaluation of microneedle/COX inhibitor-enhanced
transdermal 7-day delivery of naltrexone in healthy human volunteers .............. 10
3.7 Pharmacokinetic evaluation of microneedle-enhanced transdermal 7-day
delivery of naltrexone following restoration of the Ca2+ epidermal gradient in
hairless guinea pigs ............................................................................................. 11
Chapter 4: Background and literature review .................................................................. 12
4.1 Introduction .................................................................................................... 12
4.2 Structure and function of the skin .................................................................. 12
4.2.1 Stratum corneum ............................................................................ 13
4.2.2 Viable epidermis ............................................................................. 14
4.2.3 Dermis and microvasculature ......................................................... 15
4.3 Transdermal drug delivery ............................................................................. 16
4.3.1 Optimal properties of transdermally delivered drugs ...................... 17
vi
4.3.2 Routes of skin penetration .............................................................. 18
4.3.2.1 Intercellular ...................................................................... 18
4.3.2.2 Transcellular .................................................................... 18
4.3.2.3 Appendageal .................................................................... 18
4.3.3 Mathematical models of passive diffusion through the skin ............ 19
4.4 Enhancement methods in transdermal drug delivery .................................... 21
4.4.1 Chemical permeation enhancers .................................................... 21
4.4.2 Physical methods............................................................................ 22
4.4.2.1 Thermal ablation .............................................................. 22
4.4.2.2 Laser ablation .................................................................. 22
4.4.2.3 Jet injections .................................................................... 22
4.4.2.4 Dermabrasion .................................................................. 23
4.4.2.5 Sonophoresis ................................................................... 23
4.4.2.6 Iontophoresis ................................................................... 23
4.4.2.7 Electroporation ................................................................. 24
4.4.2.8 Microneedles .................................................................... 25
4.5 Tolerability and safety of microneedles ......................................................... 28
4.6 Micropore lifetime after microneedle treatment ............................................. 28
4.6.1 Effects of occlusion ......................................................................... 29
4.6.2 Geometry and physical properties of the microneedles .................. 30
4.6.3 Drug delivery window following microneedle treatment .................. 31
4.7 Extending micropore lifetime ......................................................................... 33
4.7.1 Processes involved in wound healing and barrier restoration ........ 33
4.7.1.1 Lipid synthesis pathway ................................................... 34
4.7.1.2 Catioinic ion gradients ...................................................... 35
4.7.1.3 Arachidonic acid pathway ................................................ 36
4.8 Naltrexone as an ideal model compound for exploring the kinetics of
micropore closure ................................................................................................ 38
4.8.1 Challenges with current naltrexone formulations ............................ 38
4.8.2 Physicochemical properties of naltrexone favoring microneedle-
enhanced delivery.................................................................................... 39
Chapter 5: Development of impedance spectroscopy techniques for measurement of
micropore formation ........................................................................................................ 40
5.1 Introduction .................................................................................................... 40
vii
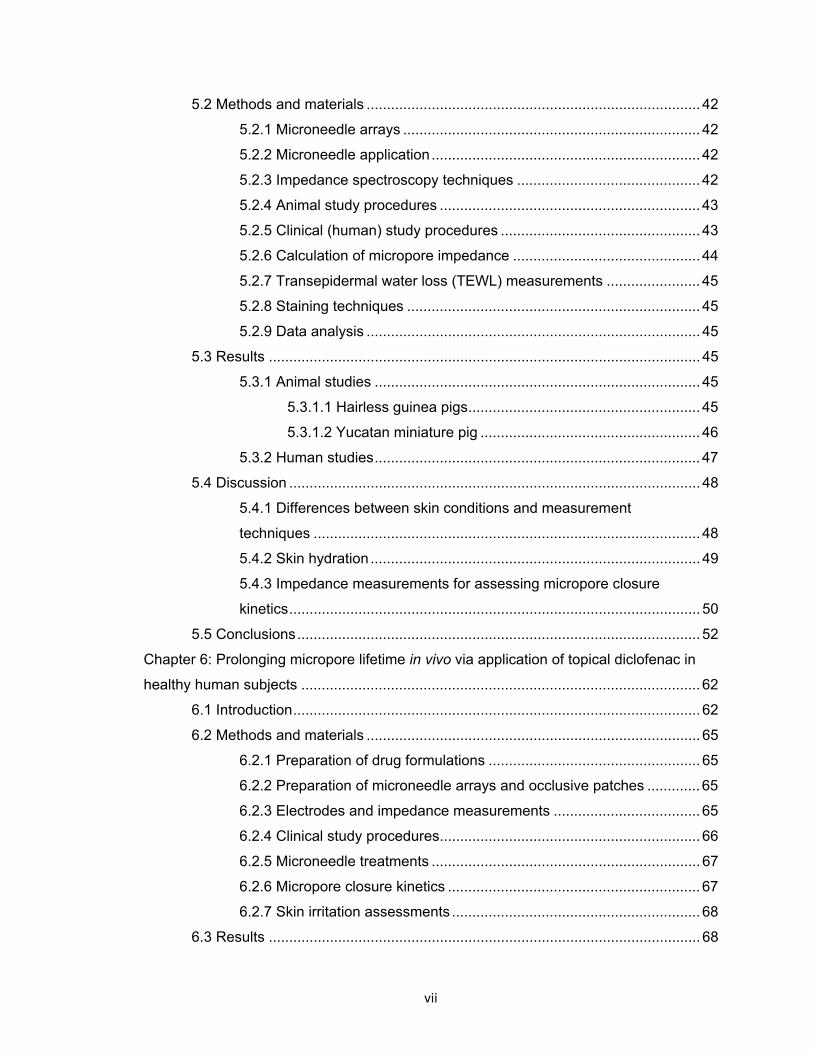
5.2 Methods and materials .................................................................................. 42
5.2.1 Microneedle arrays ......................................................................... 42
5.2.2 Microneedle application .................................................................. 42
5.2.3 Impedance spectroscopy techniques ............................................. 42
5.2.4 Animal study procedures ................................................................ 43
5.2.5 Clinical (human) study procedures ................................................. 43
5.2.6 Calculation of micropore impedance .............................................. 44
5.2.7 Transepidermal water loss (TEWL) measurements ....................... 45
5.2.8 Staining techniques ........................................................................ 45
5.2.9 Data analysis .................................................................................. 45
5.3 Results .......................................................................................................... 45
5.3.1 Animal studies ................................................................................ 45
5.3.1.1 Hairless guinea pigs ......................................................... 45
5.3.1.2 Yucatan miniature pig ...................................................... 46
5.3.2 Human studies ................................................................................ 47
5.4 Discussion ..................................................................................................... 48
5.4.1 Differences between skin conditions and measurement
techniques ............................................................................................... 48
5.4.2 Skin hydration ................................................................................. 49
5.4.3 Impedance measurements for assessing micropore closure
kinetics ..................................................................................................... 50
5.5 Conclusions ................................................................................................... 52
Chapter 6: Prolonging micropore lifetime in vivo via application of topical diclofenac in
healthy human subjects .................................................................................................. 62
6.1 Introduction .................................................................................................... 62
6.2 Methods and materials .................................................................................. 65
6.2.1 Preparation of drug formulations .................................................... 65
6.2.2 Preparation of microneedle arrays and occlusive patches ............. 65
6.2.3 Electrodes and impedance measurements .................................... 65
6.2.4 Clinical study procedures ................................................................ 66
6.2.5 Microneedle treatments .................................................................. 67
6.2.6 Micropore closure kinetics .............................................................. 67
6.2.7 Skin irritation assessments ............................................................. 68
6.3 Results .......................................................................................................... 68
viii
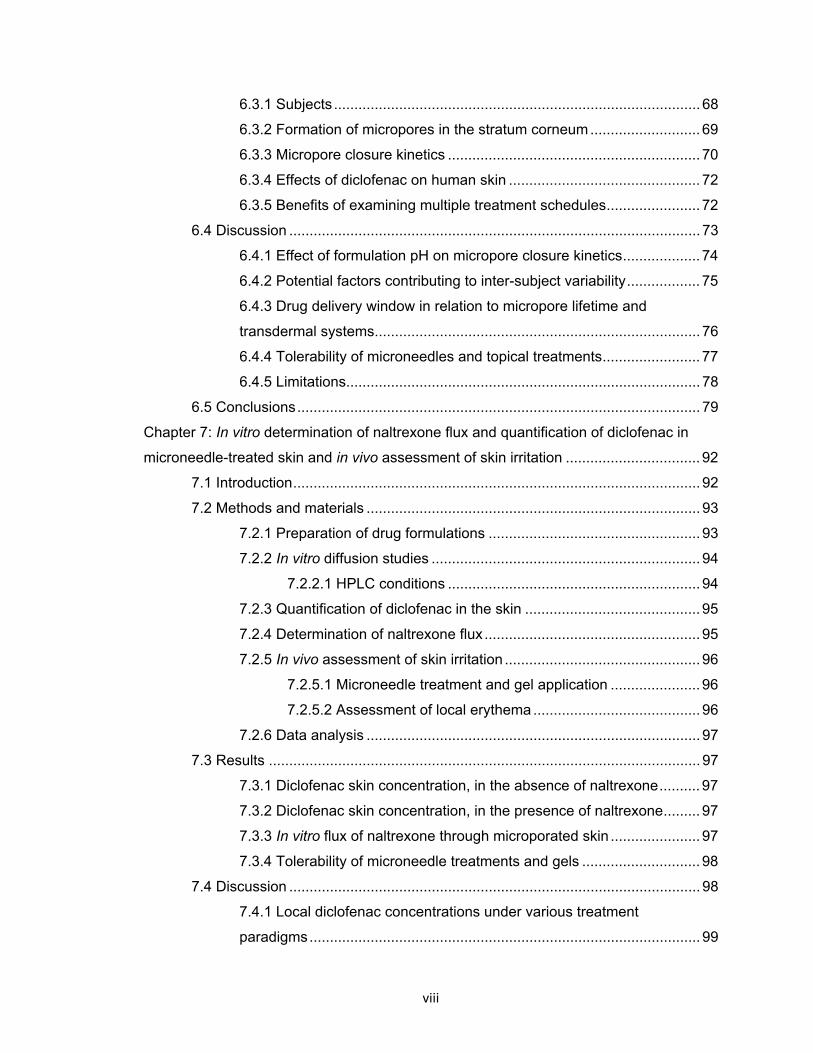
6.3.1 Subjects .......................................................................................... 68
6.3.2 Formation of micropores in the stratum corneum ........................... 69
6.3.3 Micropore closure kinetics .............................................................. 70
6.3.4 Effects of diclofenac on human skin ............................................... 72
6.3.5 Benefits of examining multiple treatment schedules ....................... 72
6.4 Discussion ..................................................................................................... 73
6.4.1 Effect of formulation pH on micropore closure kinetics ................... 74
6.4.2 Potential factors contributing to inter-subject variability .................. 75
6.4.3 Drug delivery window in relation to micropore lifetime and
transdermal systems ................................................................................ 76
6.4.4 Tolerability of microneedles and topical treatments ........................ 77
6.4.5 Limitations....................................................................................... 78
6.5 Conclusions ................................................................................................... 79
Chapter 7: In vitro determination of naltrexone flux and quantification of diclofenac in
microneedle-treated skin and in vivo assessment of skin irritation ................................. 92
7.1 Introduction .................................................................................................... 92
7.2 Methods and materials .................................................................................. 93
7.2.1 Preparation of drug formulations .................................................... 93
7.2.2 In vitro diffusion studies .................................................................. 94
7.2.2.1 HPLC conditions .............................................................. 94
7.2.3 Quantification of diclofenac in the skin ........................................... 95
7.2.4 Determination of naltrexone flux ..................................................... 95
7.2.5 In vivo assessment of skin irritation ................................................ 96
7.2.5.1 Microneedle treatment and gel application ...................... 96
7.2.5.2 Assessment of local erythema ......................................... 96
7.2.6 Data analysis .................................................................................. 97
7.3 Results .......................................................................................................... 97
7.3.1 Diclofenac skin concentration, in the absence of naltrexone .......... 97
7.3.2 Diclofenac skin concentration, in the presence of naltrexone ......... 97
7.3.3 In vitro flux of naltrexone through microporated skin ...................... 97
7.3.4 Tolerability of microneedle treatments and gels ............................. 98
7.4 Discussion ..................................................................................................... 98
7.4.1 Local diclofenac concentrations under various treatment
paradigms ................................................................................................ 99

ix
7.4.2 In vitro naltrexone flux in the presence of diclofenac .................... 100
7.4.3 Local erythema and tolerability of the treatments ......................... 101
7.5 Conclusions ................................................................................................. 102
Chapter 8: Pharmacokinetic evaluation of microneedle/diclofenac sodium enhanced
transdermal 7-day delivery of naltrexone in healthy human volunteers ........................ 108
8.1 Introduction .................................................................................................. 108
8.2 Methods and materials ................................................................................ 109
8.2.1 Preparation of drug formulations .................................................. 109
8.2.2 Preparation of microneedle arrays and occlusive patches ........... 110
8.2.3 Microneedle application technique ............................................... 110
8.2.4 Clinical study procedures .............................................................. 111
8.2.5 Calculation of naltrexone patch number per treatment group ....... 112
8.2.6 Sampling schedule for pharmacokinetic analysis ......................... 112
8.2.7 Plasma extraction procedure and analysis, naltrexone and 6-β-
naltrexol ................................................................................................. 113
8.2.8 Impedance spectroscopy and micropore closure kinetics ............ 114
8.2.9 Data analysis ................................................................................ 115
8.3 Results ........................................................................................................ 116
8.3.1 Micropore impedance and permeable area .................................. 116
8.3.2 Pharmacokinetic parameters ........................................................ 116
8.3.3 Tolerability of treatments .............................................................. 117
8.4 Discussion ................................................................................................... 118
8.4.1 Impedance spectroscopy for predicting drug delivery
timeframes ............................................................................................. 119
8.4.2 In vitro naltrexone flux and in vivo delivery considerations ........... 120
8.5 Conclusions ................................................................................................. 123
Chapter 9: Pharmacokinetic evaluation of microneedle-enhanced 7-day transdermal
delivery of naltrexone via restoration of the epidermal Ca2+ gradient in hairless guinea
pigs ................................................................................................................................ 132
9.1 Introduction .................................................................................................. 132
9.2 Methods and materials ................................................................................ 133
9.2.1 Preparation of gel formulations ..................................................... 133
9.2.2 Preparation of microneedle arrays and occlusive patches ........... 134
9.2.3 Study procedures .......................................................................... 134
x
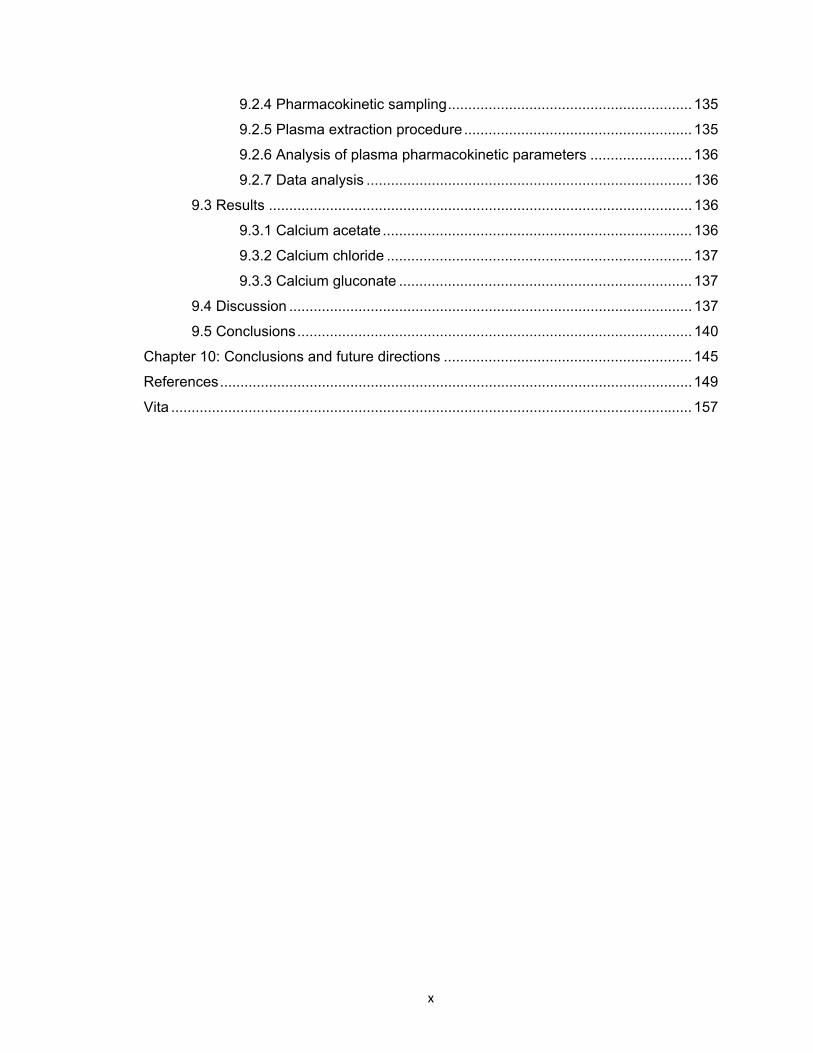
9.2.4 Pharmacokinetic sampling ............................................................ 135
9.2.5 Plasma extraction procedure ........................................................ 135
9.2.6 Analysis of plasma pharmacokinetic parameters ......................... 136
9.2.7 Data analysis ................................................................................ 136
9.3 Results ........................................................................................................ 136
9.3.1 Calcium acetate ............................................................................ 136
9.3.2 Calcium chloride ........................................................................... 137
9.3.3 Calcium gluconate ........................................................................ 137
9.4 Discussion ................................................................................................... 137
9.5 Conclusions ................................................................................................. 140
Chapter 10: Conclusions and future directions ............................................................. 145
References .................................................................................................................... 149
Vita ................................................................................................................................ 157
xi
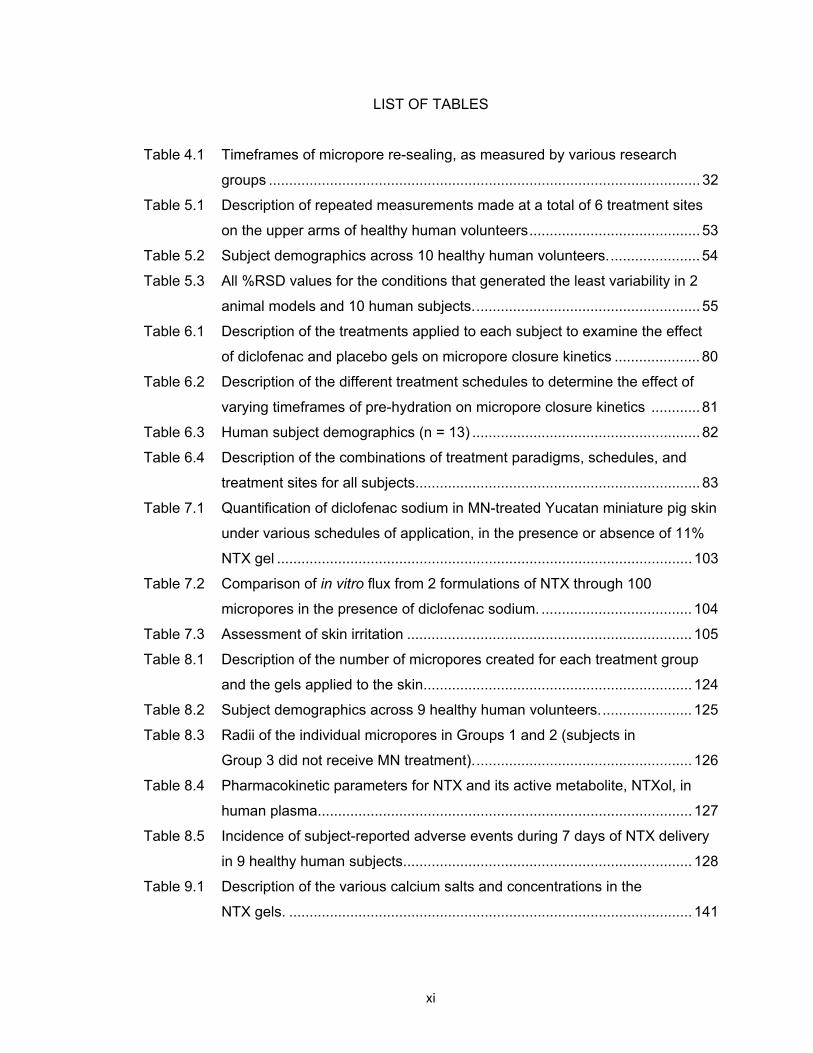
LIST OF TABLES
Table 4.1 Timeframes of micropore re-sealing, as measured by various research
groups .......................................................................................................... 32
Table 5.1 Description of repeated measurements made at a total of 6 treatment sites
on the upper arms of healthy human volunteers .......................................... 53
Table 5.2 Subject demographics across 10 healthy human volunteers. ...................... 54
Table 5.3 All %RSD values for the conditions that generated the least variability in 2
animal models and 10 human subjects. ....................................................... 55
Table 6.1 Description of the treatments applied to each subject to examine the effect
of diclofenac and placebo gels on micropore closure kinetics ..................... 80
Table 6.2 Description of the different treatment schedules to determine the effect of
varying timeframes of pre-hydration on micropore closure kinetics ............ 81
Table 6.3 Human subject demographics (n = 13) ........................................................ 82
Table 6.4 Description of the combinations of treatment paradigms, schedules, and
treatment sites for all subjects ...................................................................... 83
Table 7.1 Quantification of diclofenac sodium in MN-treated Yucatan miniature pig skin
under various schedules of application, in the presence or absence of 11%
NTX gel ...................................................................................................... 103
Table 7.2 Comparison of in vitro flux from 2 formulations of NTX through 100
micropores in the presence of diclofenac sodium. ..................................... 104
Table 7.3 Assessment of skin irritation ...................................................................... 105
Table 8.1 Description of the number of micropores created for each treatment group
and the gels applied to the skin .................................................................. 124
Table 8.2 Subject demographics across 9 healthy human volunteers. ...................... 125
Table 8.3 Radii of the individual micropores in Groups 1 and 2 (subjects in
Group 3 did not receive MN treatment). ..................................................... 126
Table 8.4 Pharmacokinetic parameters for NTX and its active metabolite, NTXol, in
human plasma............................................................................................ 127
Table 8.5 Incidence of subject-reported adverse events during 7 days of NTX delivery
in 9 healthy human subjects ....................................................................... 128
Table 9.1 Description of the various calcium salts and concentrations in the
NTX gels. ................................................................................................... 141
xii
Table 9.2 Pharmacokinetic parameters in hairless guinea pigs treated once with MN
arrays (200 micropores total) followed by application of an 8.4% NTX gel
containing various calcium salts.. ............................................................... 142
xiii
LIST OF FIGURES
Figure 4.1 Structure of the skin. .................................................................................... 12
Figure 4.2 Cross-section of the skin depicting the various layers of the epidermis and
dermis and the intercellular pathway of penetration for a xenobiotic. .......... 14
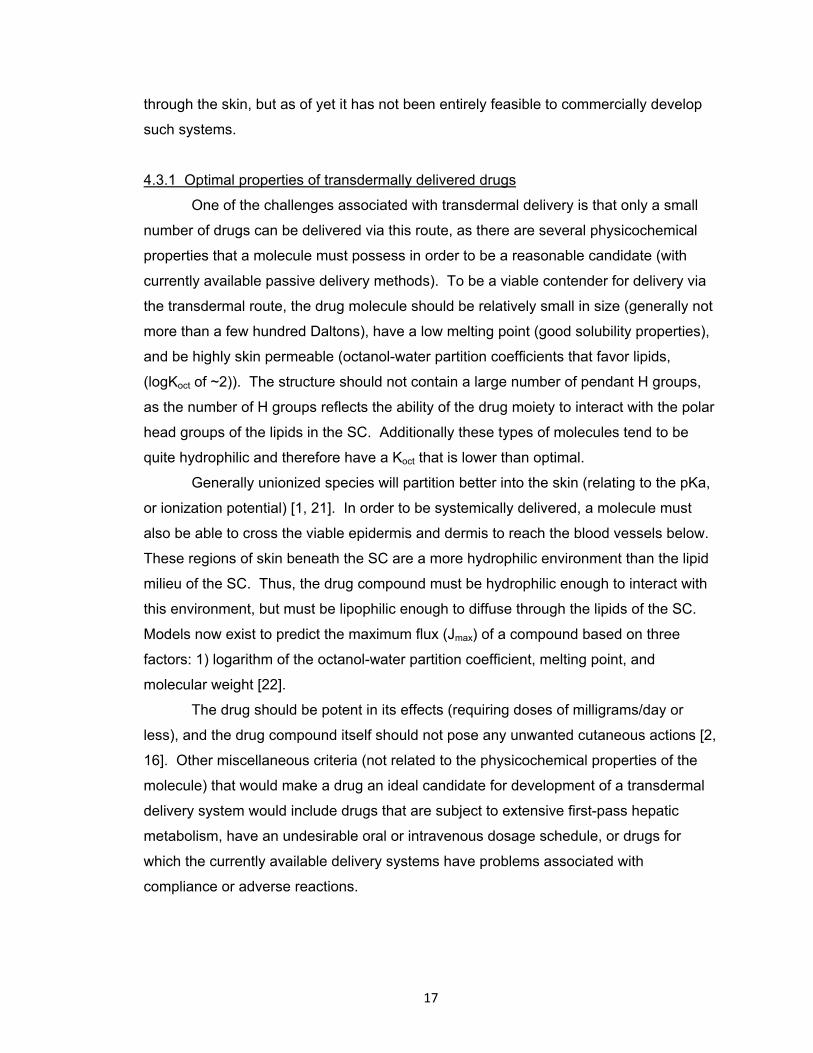
Figure 4.3 Depiction of the intercellular and transcellular routes of penetration through
the skin ......................................................................................................... 19
Figure 4.4 Representation of a typical in vitro drug permeation profile from a saturated
donor solution following topical application. ................................................. 20
Figure 4.5. Effects of combined physical enhancement methods on the barrier of the
stratum corneum. ........................................................................................ 25
Figure 4.6 Four methods of microneedle-enhanced drug delivery to the skin. ............. 27
Figure 4.7 Timeframes required for complete return to baseline barrier function under
occluded conditions following application of MNs of varying geometries,
determined by impedance spectroscopy. ..................................................... 30
Figure 4.8 Diagram of the conversion of arachidonic acid into downstream
prostaglandins and eicosanoids via the cyclooxygenase enzymes. ............ 37
Figure 5.1 Impedance setup used for all human and animal studies ............................ 56
Figure 5.2 Representative impedance and TEWL measurements made pre- and post-
MN on non pre-hydrated skin in one hairless guinea pig ............................. 57
Figure 5.3 A micropore grid on the dorsal surface of a hairless guinea pig (top) and a
Yucatan miniature pig (bottom) treated once with a 50 MN array ................ 59
Figure 5.4 Representative impedance profiles in six treatment sites on one human
subject; all measurements were made on the hairless upper arm following
an overnight pre-hydration period. ............................................................... 60
Figure 6.1 Image of a microneedle array ...................................................................... 84
Figure 6.2 Treatment patches and electrodes on a subject’s upper arm ...................... 85
Figure 6.3 Impedance of the micropores immediately following MN treatment ............. 86
Figure 6.4 Comparison of AUC values at diclofenac vs. placebo treatment sites. ........ 87
Figure 6.5 Representative profiles of micropore admittance from two subjects. ........... 88
Figure 6.6 Comparison of admittance profiles in two subjects who completed a
crossover design .......................................................................................... 89
Figure 6.7 Ratios of diclofenac to placebo AUC. ........................................................... 90
xiv
Figure 6.8 Assessment of skin irritation. ....................................................................... 91
Figure 7.1 In vitro flux of NTX through microporated skin in the presence of diclofenac
sodium or 2.5% HA placebo gel ................................................................. 106
Figure 7.2 Trends of erythema in hairless guinea pigs following application of NTX and
diclofenac gels to MN-treated skin every 48 hours. ................................... 107
Figure 8.1 Representative impedance profiles from one subject in Group 1 (MN +
diclofenac + NTX) and one subject in Group 2 (MN + placebo + NTX). .... 129
Figure 8.2 NTX plasma profiles following one-time MN treatment and application of
diclofenac and NTX gel every 48 hours for 7 days post-MN
(n = 6 subjects). ......................................................................................... 130
Figure 8.3 NTXol plasma profiles following one time MN treatment and application of
diclofenac and NTX gel every 48 hours for 7 days post-MN treatment (n = 6
subjects). .................................................................................................... 131
Figure 9.1 Visual depiction of the change in the SC barrier as the calcium gradient is
restored after insult. ................................................................................... 143
Figure 9.2 Plasma concentrations of NTX following one time treatment with a MN array
and application of various calcium-containing NTX•HCl gels ..................... 144
xv
LIST OF ABBREVIATIONS
w/w weight per weight
w/v weight per volume
°C degrees Celsius
μm micrometer
ACN acetonitrile
ANOVA analysis of variance
APCI atmospheric pressure chemical ionization
AUC area under the curve
Cl clearance
cm centimeter
Cmax Maximum plasma concentration
Css Plasma concentration at steady state
COX cyclooxygenase
FDA Food and Drug Administration
J flux
hr hour
HCl hydrochloride
HEC hydroxyethylcellulose
HEPES 4-(2-hydroxyethyl)-1-piperazineethanesulfonic acid
HPLC high performance liquid chromatography
IACUC Institutional Animal Care and Use Committee
IS Impedance spectroscopy
IV intravenous
kHz kilohertz
kg kilogram
LC-MS/MS liquid chromatography-tandem mass spectroscopy
log Ko/w logarithm of octanol-water partition coefficient
logP logarithm of permeability coefficient
MeOH methanol
mg milligram
mHz millihertz
min minute
ml milliliter
xvi
mm millimeter
mM millimolar
MN(s) microneedle(s)
MW molecular weight
n number
ng nanogram
NSAID non-steroidal anti-inflammatory drugs
NTX•HCl naltrexone hydrochloride salt
NTXol 6-β-naltrexol free base
NTXol•HCl 6-β-naltrexol hydrochloride salt
pH negative logarithm of hydronium ion concentration
pKa acid ionization constant
PGs prostaglandins
r2 coefficient of determination
SC stratum corneum
SD standard deviation
SDS sodium dodecyl sulfate
TEWL transepidermal water loss
Tlag Time until appearance of drug in the plasma
Tmax Time of maximum plasma concentration
UV ultraviolet
1
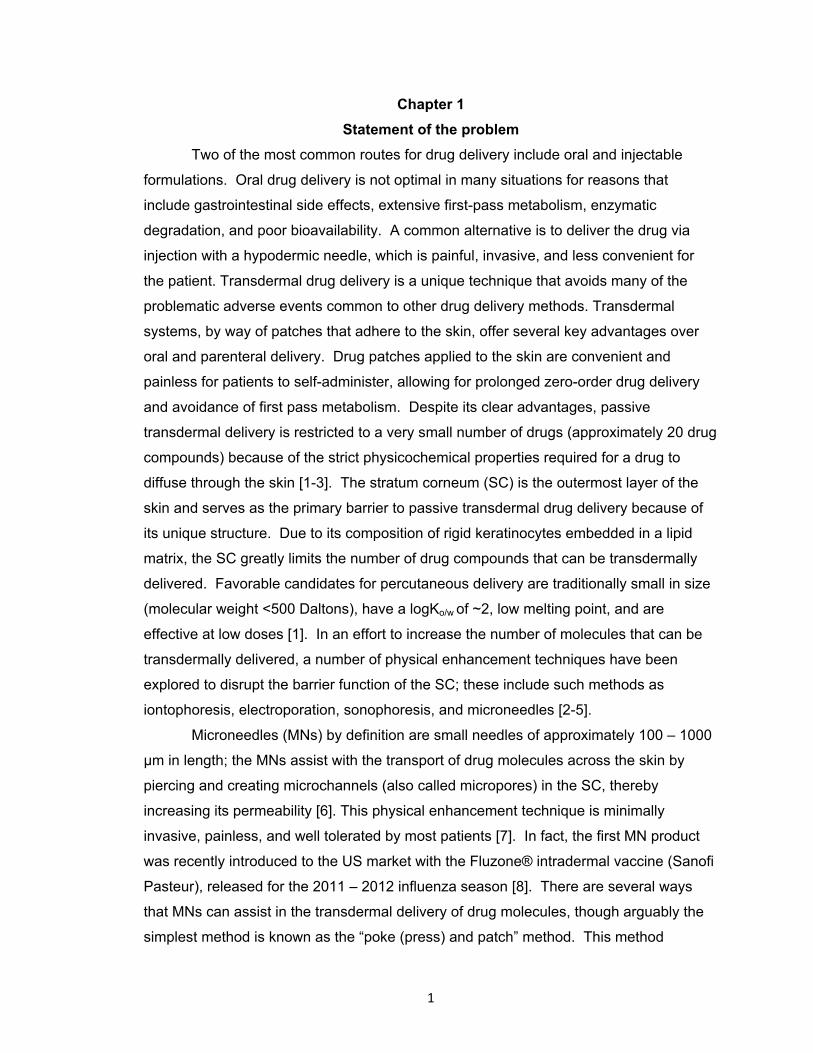
Chapter 1
Statement of the problem
Two of the most common routes for drug delivery include oral and injectable
formulations. Oral drug delivery is not optimal in many situations for reasons that
include gastrointestinal side effects, extensive first-pass metabolism, enzymatic
degradation, and poor bioavailability. A common alternative is to deliver the drug via
injection with a hypodermic needle, which is painful, invasive, and less convenient for
the patient. Transdermal drug delivery is a unique technique that avoids many of the
problematic adverse events common to other drug delivery methods. Transdermal
systems, by way of patches that adhere to the skin, offer several key advantages over
oral and parenteral delivery. Drug patches applied to the skin are convenient and
painless for patients to self-administer, allowing for prolonged zero-order drug delivery
and avoidance of first pass metabolism. Despite its clear advantages, passive
transdermal delivery is restricted to a very small number of drugs (approximately 20 drug
compounds) because of the strict physicochemical properties required for a drug to
diffuse through the skin [1-3]. The stratum corneum (SC) is the outermost layer of the
skin and serves as the primary barrier to passive transdermal drug delivery because of
its unique structure. Due to its composition of rigid keratinocytes embedded in a lipid
matrix, the SC greatly limits the number of drug compounds that can be transdermally
delivered. Favorable candidates for percutaneous delivery are traditionally small in size
(molecular weight <500 Daltons), have a logKo/w of ~2, low melting point, and are
effective at low doses [1]. In an effort to increase the number of molecules that can be
transdermally delivered, a number of physical enhancement techniques have been
explored to disrupt the barrier function of the SC; these include such methods as
iontophoresis, electroporation, sonophoresis, and microneedles [2-5].
Microneedles (MNs) by definition are small needles of approximately 100 – 1000
μm in length; the MNs assist with the transport of drug molecules across the skin by
piercing and creating microchannels (also called micropores) in the SC, thereby
increasing its permeability [6]. This physical enhancement technique is minimally
invasive, painless, and well tolerated by most patients [7]. In fact, the first MN product
was recently introduced to the US market with the Fluzone® intradermal vaccine (Sanofi
Pasteur), released for the 2011 – 2012 influenza season [8]. There are several ways
that MNs can assist in the transdermal delivery of drug molecules, though arguably the
simplest method is known as the “poke (press) and patch” method. This method
2
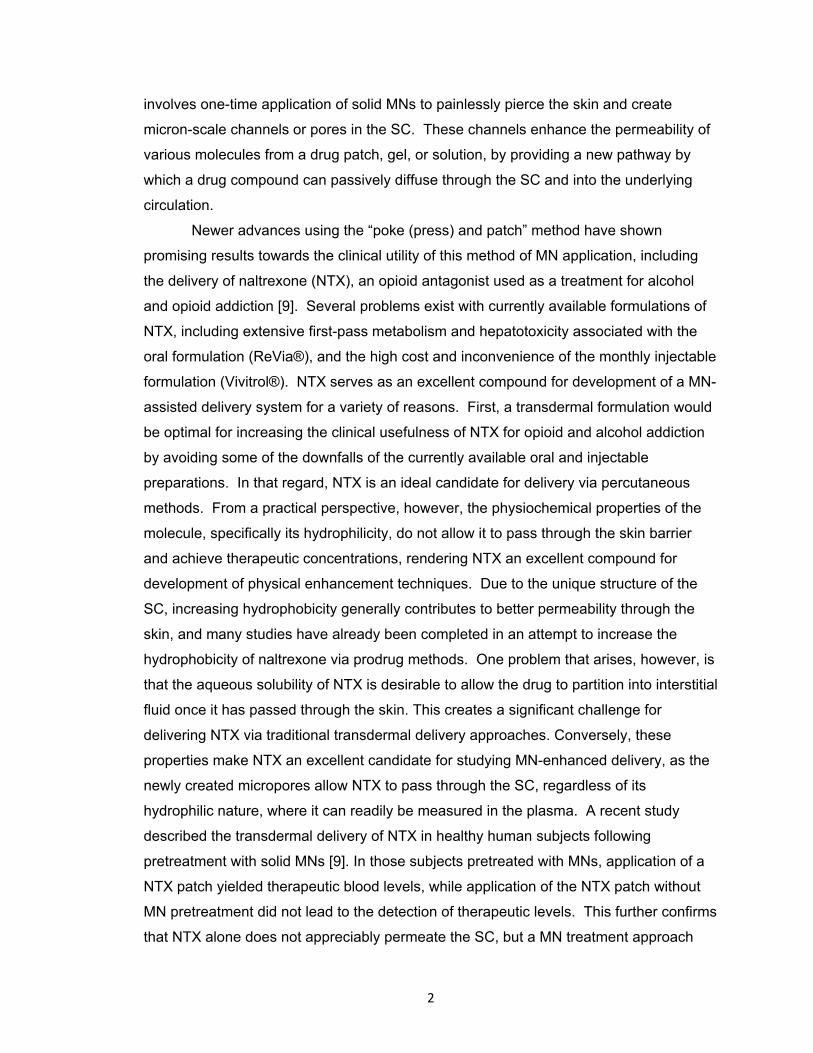
involves one-time application of solid MNs to painlessly pierce the skin and create
micron-scale channels or pores in the SC. These channels enhance the permeability of
various molecules from a drug patch, gel, or solution, by providing a new pathway by
which a drug compound can passively diffuse through the SC and into the underlying
circulation.
Newer advances using the “poke (press) and patch” method have shown
promising results towards the clinical utility of this method of MN application, including
the delivery of naltrexone (NTX), an opioid antagonist used as a treatment for alcohol
and opioid addiction [9]. Several problems exist with currently available formulations of
NTX, including extensive first-pass metabolism and hepatotoxicity associated with the
oral formulation (ReVia®), and the high cost and inconvenience of the monthly injectable
formulation (Vivitrol®). NTX serves as an excellent compound for development of a MN-
assisted delivery system for a variety of reasons. First, a transdermal formulation would
be optimal for increasing the clinical usefulness of NTX for opioid and alcohol addiction
by avoiding some of the downfalls of the currently available oral and injectable
preparations. In that regard, NTX is an ideal candidate for delivery via percutaneous
methods. From a practical perspective, however, the physiochemical properties of the
molecule, specifically its hydrophilicity, do not allow it to pass through the skin barrier
and achieve therapeutic concentrations, rendering NTX an excellent compound for
development of physical enhancement techniques. Due to the unique structure of the
SC, increasing hydrophobicity generally contributes to better permeability through the
skin, and many studies have already been completed in an attempt to increase the
hydrophobicity of naltrexone via prodrug methods. One problem that arises, however, is
that the aqueous solubility of NTX is desirable to allow the drug to partition into interstitial
fluid once it has passed through the skin. This creates a significant challenge for
delivering NTX via traditional transdermal delivery approaches. Conversely, these
properties make NTX an excellent candidate for studying MN-enhanced delivery, as the
newly created micropores allow NTX to pass through the SC, regardless of its
hydrophilic nature, where it can readily be measured in the plasma. A recent study
described the transdermal delivery of NTX in healthy human subjects following
pretreatment with solid MNs [9]. In those subjects pretreated with MNs, application of a
NTX patch yielded therapeutic blood levels, while application of the NTX patch without
MN pretreatment did not lead to the detection of therapeutic levels. This further confirms
that NTX alone does not appreciably permeate the SC, but a MN treatment approach
3
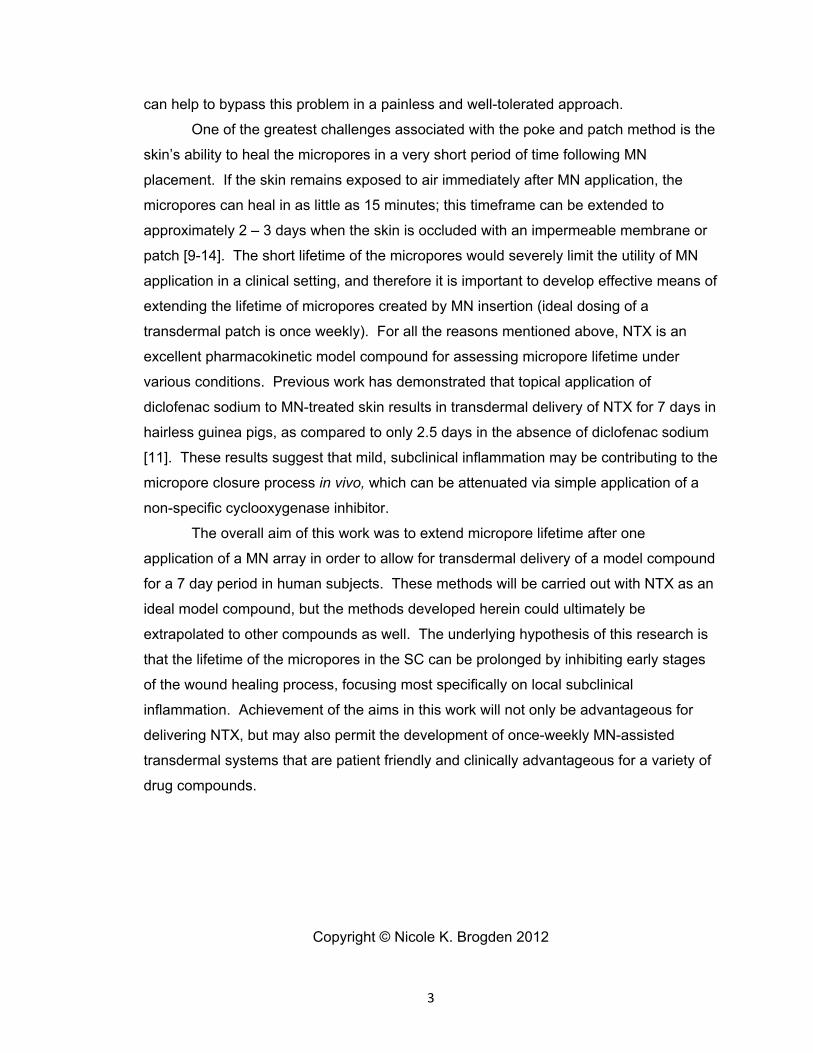
can help to bypass this problem in a painless and well-tolerated approach.
One of the greatest challenges associated with the poke and patch method is the
skin’s ability to heal the micropores in a very short period of time following MN
placement. If the skin remains exposed to air immediately after MN application, the
micropores can heal in as little as 15 minutes; this timeframe can be extended to
approximately 2 – 3 days when the skin is occluded with an impermeable membrane or
patch [9-14]. The short lifetime of the micropores would severely limit the utility of MN
application in a clinical setting, and therefore it is important to develop effective means of
extending the lifetime of micropores created by MN insertion (ideal dosing of a
transdermal patch is once weekly). For all the reasons mentioned above, NTX is an
excellent pharmacokinetic model compound for assessing micropore lifetime under
various conditions. Previous work has demonstrated that topical application of
diclofenac sodium to MN-treated skin results in transdermal delivery of NTX for 7 days in
hairless guinea pigs, as compared to only 2.5 days in the absence of diclofenac sodium
[11]. These results suggest that mild, subclinical inflammation may be contributing to the
micropore closure process in vivo, which can be attenuated via simple application of a
non-specific cyclooxygenase inhibitor.
The overall aim of this work was to extend micropore lifetime after one
application of a MN array in order to allow for transdermal delivery of a model compound
for a 7 day period in human subjects. These methods will be carried out with NTX as an
ideal model compound, but the methods developed herein could ultimately be
extrapolated to other compounds as well. The underlying hypothesis of this research is
that the lifetime of the micropores in the SC can be prolonged by inhibiting early stages
of the wound healing process, focusing most specifically on local subclinical
inflammation. Achievement of the aims in this work will not only be advantageous for
delivering NTX, but may also permit the development of once-weekly MN-assisted
transdermal systems that are patient friendly and clinically advantageous for a variety of
drug compounds.
Copyright © Nicole K. Brogden 2012
4
Chapter 2
Research hypotheses
The objective of this research project was twofold:
1) Characterize the lifetime of micropores and kinetics of re-sealing, using
impedance spectroscopy as an in vivo surrogate technique and pharmacokinetic
analysis to define drug delivery parameters; and
2) Prolong the lifetime of the micropores via inhibition of various components of
the skin’s normal wound healing and barrier restoration processes.
Under these primary objectives, the research was driven by the following hypotheses.
Hypothesis 1: MN treatment of healthy skin disrupts the permeability barrier of the
stratum corneum, resulting in significantly lower impedance to the flow of
electrical current between the body and external environment.
It is important to develop an appropriate in vivo model for studying the kinetics of
micropore closure following MN treatment in animal models and human subjects. One
means of measuring skin permeability barrier function is impedance spectroscopy, which
can be used as a complementary or alternative technique to transepidermal water loss
(TEWL, a commonly used technique for evaluating permeability barrier function). The
SC serves as the skin’s barrier to movement of ions (i.e. flow of electrical current), such
that the impedance spectrum of the skin changes with disruption of the SC. The
impedance decreases if the skin is damaged, and this has been demonstrated as a
reliable method of evaluating barrier function. Accurate measurements can be collected
in a clinical environment without any computers, software, or need for a highly controlled
environment, making this a valuable tool for various environments. Impedance
measurements of the SC using various methods and techniques have been described
previously, but there are limited publications describing the use of this technique to
evaluate micropore lifetime following MN treatment (in animal models or human
subjects). A methods development study is necessary to optimize the techniques and
electrode types required to minimize variability and optimize reproducibility.
5
Hypothesis 2: The processes involved in the skin’s normal healing and barrier
restoration following injury also govern micropore re-sealing, and inhibition of
these normal paradigms will result in a clinically relevant extension of micropore
lifetime following one-time application of a MN array.
The physiological processes underlying micropore closure following MN
treatment are not currently understood, and elucidation of the specific pathways involved
would provide therapeutic targets for prolonging the lifetime of the micropores. The skin
follows a well-defined sequence of events following injury, and local inflammation
(through activation of the arachidonic acid pathway) is one of the first steps. It is
possible that subclinical inflammation at a microscopic level may also contribute to the
micropore closure process, which could be inhibited via topical application of diclofenac
sodium (a non-specific inhibitor of the cyclooxygenase enzymes involved in the
arachidonic acid pathway). Additionally, a calcium gradient exists in the unperturbed
epidermis, such that high concentrations of extracellular Ca2+ are found in the upper
epidermis. Following barrier disruption, increased water movement within the SC
dissipates the gradient, and this change appears to be one of the primary signals for
restoring barrier function. Following disruption via MN application, the Ca2+ gradient
would likely be disrupted and thus may serve as an additional target to investigate for
prolonging micropore lifetime.
Hypothesis 3: Local concentrations of diclofenac in MN-treated skin will not be
significantly different in the presence or absence of naltrexone, allowing for co-
application of a locally delivered anti-inflammatory and a systemically delivered
model compound.
The diclofenac sodium formulation in these studies is delivered from a
commercially available preparation called Solaraze®, which consists of 3% diclofenac in
a 2.5% hyaluronate sodium vehicle. Following topical application, this unique vehicle
creates a depot of diclofenac in the epidermis, providing an ideal situation for locally
inhibiting any inflammation that may be involved in micropore closure. A
pharmacokinetic study in humans will be completed to characterize the delivery of
naltrexone HCl in the presence or absence of diclofenac sodium, but it is important to
confirm that the local concentrations of diclofenac are maintained despite the flux of
naltrexone HCl through the skin into the systemic circulation in the dermis. These
6
studies will allow for calculation of an appropriate dose and schedule for co-applying
diclofenac and naltrexone HCl for a human pharmacokinetic study.
Hypothesis 4: Inhibition of subclinical inflammatory processes involved in
micropore re-sealing will allow a therapeutically relevant dose of naltrexone to be
delivered through the skin for up to 7 days in healthy human subjects.
While the overall intent of this research is to prolong the dosing interval following
one application of a MN array, extending micropore closure kinetics is only clinically
significant if a drug can be delivered to a therapeutically relevant concentration for the
duration of the micropore lifetime. A pharmacokinetic study is the best way to
characterize the drug diffusion window for the micropores. Naltrexone HCl is an
excellent model compound to study because previous work allows for comparison of a
drug delivery window under conditions of occlusion without co-application of any active
moiety to prolong micropore lifetime. In contrast, inhibition of the skin’s inflammatory
responses should prolong the drug delivery window by allowing the micropores to
remain viable for up to 7 days.
Hypothesis 5: A good correlation exists between in vitro flux data and in vivo
plasma concentrations of naltrexone in human subjects
The plasma concentrations of naltrexone HCl obtained from a pharmacokinetic
study in human subjects with MNs should have a strong correlation with the in vitro flux
data that is used to calculate the patch number and estimate the plasma concentrations
over 7 days. This will validate the in vitro diffusion studies and provide parameter
estimates for future pharmacokinetic studies.
Copyright © Nicole K. Brogden 2012
7
Chapter 3
Research plan
3.1 Develop an impedance spectroscopy technique as a surrogate marker to
monitor micropore formation and lifetime
Several methods exist for monitoring barrier disruption in the SC, though many of
these techniques are highly sensitive to environmental humidity and skin hydration, or
require sophisticated instrumentation and software that makes use in a clinical
environment cumbersome. Impedance spectroscopy avoids these pitfalls, and is a
reliable method for monitoring the skin’s barrier function. The SC is relatively non-
conductive and does not permit the movement of electrical current. As such, the
impedance of intact skin is very high (indicating an intact barrier) but perturbation of the
barrier results in a decrease in the impedance. Impedance has been described to
monitor the lifetime of micropores in the skin of human volunteers under occluded and
non-occluded conditions, demonstrating its usefulness in this type of physical
enhancement [14]. Several types of electrodes and impedance setups exist, and it is
necessary to develop an experimental setup that introduces the least amount of error
and variability to measure micropore formation. The objective of this study is to develop
an impedance spectroscopy setup that can monitor SC barrier function and micropore
re-sealing with the least amount of variability. Healthy human volunteers will be treated
with 100 MN insertions per site (50 MN array applied twice) at 6 sites on the upper arm
following an overnight pre-hydration period. Impedance measurements will be made
pre- and post-MN using an impedance meter (EIM-105 Prep-Check Electrode
Impedance Meter; General Devices, Ridgefield, NJ) connected by lead wires to
reference and measurement electrodes and modified by a 200 kΩ resistor in parallel
(IET labs, Inc., Westbury, NY). Three sites will be evaluated with dry Ag/AgCl electrodes
(10 mm active electrode diameter; 25 mm x 25 mm total area; Thought Technology T-
3404; Stens Corporation, San Rafael, CA), and the other sites will be evaluated with gel
Ag/AgCl electrodes (10 mm active electrode diameter; 50 mm diameter; S&W
Healthcare Corporation, Brooksville, FA). Measurements will be made in triplicate at
each site, and two application pressures will be examined: light pressure (to simply hold
the electrode o the surface of the skin) or direct pressure applied by the thumb of the
investigator (to create greater contract between the skin and the electrode surface).
8
3.2 Characterize the kinetics of micropore closure following topical application of
diclofenac to microneedle-treated skin in healthy human volunteers
While the specific physiologic processes contributing to micropore closure are
not well defined, one of the underlying hypotheses of this project is that local subclinical
inflammation at the micropores may contribute to the rapid re-sealing time. Thus, the
objective of this study is to demonstrate prolonged micropore lifetime in the presence of
diclofenac sodium (a non-specific COX inhibitor) vs. placebo conditions. Ten volunteers
will be treated on the arm with a MN array ± diclofenac sodium or placebo gel; control
sites will also be included. The kinetics of micropore lifetime under various timeframes
of skin pre-hydration (0, 24, or 72 hours) will be measured with impedance spectroscopy
as a surrogate in vivo technique. Measurements will be taken at baseline, post-MN, and
daily thereafter for a total of 5 days (2 subjects will be treated for a full 7 day period and
will only have one measurement at 96 hours into the study, rather than daily).
Impedance of the micropores will be calculated assuming 3 parallel and independent
pathways in the impedance setup (Zskin, Zbox, and Zpores), and the micropore impedance
will be converted to admittance (1/Zpores), to more closely mimic the trends observed with
transepidermal water loss (another commonly utilized technique for monitoring skin
barrier function). Area under the admittance-time curve will be calculated and the
kinetics of micropore closure between diclofenac sodium and placebo treatment sites will
be compared (paired t-test). In 6 subjects, skin irritation potential of the treatments will
also be assessed via tristimulus colorimetry readings, taken in triplicate at each time
point. The Δa* value will be calculated from baseline (representing a change in the red-
green axis) to quantify any local erythema.
3.3 Quantify in vitro diclofenac skin concentrations in Yucatan miniature pig skin
following one-time microneedle treatment and application of diclofenac ±
naltrexone
It is important to determine the local concentration of diclofenac sodium in MN-
treated skin in conditions similar to those conditions described above in Research Plan
3.2, as this helps to estimate the amount needed to inhibit micropore closure.
Additionally, diclofenac skin concentrations in other situations in which diclofenac
sodium and naltrexone HCl gels are both applied to the skin should be examined, as this
will mimic the setting for the in vivo pharmacokinetic study (described below in Research
Plan 3.4). Yucatan miniature pig skin will be treated 20 times with a 5 MN array
9
(dimensions: 750 μm long, 200 μm wide, and 75 μm thick), to create a grid of 100 non-
overlapping micropores. A PermeGear In-Line flow-through diffusion system (Hellertown,
PA, USA) will be used. The receiver solution will consist of nanopure water with 20%
EtOH, adjusted to a pH of 7.4. The experiments will be started by charging the cells with
100 – 200 μl of Solaraze®, ± 500 μl of an 11% naltrexone HCl gel. Samples will be
collected at 6 hour intervals over a 7 day period, and stored at 4°C until analysis on
HPLC. Skin will be taken down at 24 to 48 hour intervals for determination of skin
diclofenac concentration. The skin will be rinsed 3 times with deionized water and
blotted gently with Kimwipes® to remove excess drug from the skin surface. Skin
samples will be tape stripped twice and the skin weight recorded. The skin will be
suspended in acetonitrile and shaken in a 32°C water bath overnight. Diclofenac
concentration will be analyzed by HPLC.
3.4 Determine in vitro microneedle-enhanced transdermal flux of naltrexone
across Yucatan miniature pig skin in the presence of diclofenac
In order to calculate an appropriate number of patches suitable for a human
pharmacokinetic study, it is necessary to determine the transdermal flux of naltrexone
hydrochloride across MN-treated Yucatan miniature pig skin in the presence of
diclofenac sodium delivered from Solaraze® (3% diclofenac sodium and 2.5%
hyaluronate sodium). A PermeGear In-Line flow-through diffusion system (Hellertown,
PA, USA) will be used for skin diffusion studies. The physiological receiver solution will
consist of HEPES-buffered Hank’s balanced salts with gentamicin, maintained at a flow
rate of 1.5 ml/min and a temperature of 37° C. Yucatan miniature pig skin will be treated
20 times with a 5 MN array to create a grid of 100 non-overlapping micropores. The
experiments will be started by charging the cells with 100 – 200 μl of Solaraze® and 500
μl of 11% naltrexone HCl gel. Samples will be collected at 6 hour intervals over a 7 day
period, and stored at 4°C until analysis on HPLC. The cumulative quantity of NTX
collected in the receiver solution will be plotted as a function of time and the flux
determined from the slope of the line at steady state.
3.5 Establish the tolerability of a combination of a 3% diclofenac gel and an 11%
naltrexone gel on microneedle-treated skin in hairless guinea pigs
In order to advance the optimal in vitro treatment conditions (determined in
Research Plans 3.4 and 3.5) to human subjects, the skin irritation potential and

10
tolerability of the combination of diclofenac sodium and naltrexone HCl must be
assessed. Hairless guinea pigs will be utilized for these studies, as these animals are
typically more sensitive than humans to topical xenobiotics, providing a conservative
model for assessing irritation potential to human skin. The hairless guinea pigs will be
treated on the dorsal surface with arrays of 50 MNs applied twice to create 100 non-
overlapping micropores. The microporated skin will be treated with 100 μl of Solaraze®
and 500 μl of a 11% naltrexone HCl gel and covered by an occlusive, air-impermeable
patch that is secured to the skin with Bioclusive medical tape. Tristimulus colorimetry
will be used to assess local erythema at MN-treatment sites; non-MN sites will be used
as controls. Measurements will be taken in triplicate at baseline and every 48 hours
after application of the gels; fresh gels will be re-applied at each time point. The Δa*
value will be calculated from baseline (representing a change in the red-green axis) to
quantify local erythema.
3.6 Pharmacokinetic evaluation of microneedle/COX inhibitor-enhanced
transdermal 7-day delivery of naltrexone in healthy human volunteers
The first pharmacokinetic study in humans with MN-assisted transdermal delivery
demonstrated therapeutic plasma concentrations of naltrexone hydrochloride for 48 – 72
hours after one MN treatment [9]. This study, while confirming the ability of the “poke
and patch” method to allow delivery to therapeutic drug concentrations, also
demonstrated the relatively short period of drug delivery (2 – 3 days) after one
application of MN arrays. Conversely, another study showed enhanced permeation of
naltrexone for 7 days in hairless guinea pigs treated with MNs and diclofenac sodium,
confirming that topical application of a non-specific COX inhibitor to microporated skin
can extend the drug delivery window to a therapeutically relevant timeframe [11]. The
objective of the current study is to characterize the clinical utility of extending micropore
lifetime (with diclofenac sodium) by measuring plasma naltrexone concentrations in
healthy human subjects over 7 days. Subjects will be treated with 50 MN arrays at 8
sites (to create a total of 800 micropores), followed by application of 100 μl of 3%
diclofenac sodium gel and 500 μl of a 11% naltrexone hydrochloride gel (gels will be
replaced every 48 hours). To confirm the formation (and monitor lifetime) of micropores
in the SC, impedance spectroscopy measurements will be taken at baseline,
immediately post-MN treatment, and 7 days post-MN. Blood samples will be taken at 9
time points on Day 0 (day of MN treatment), and daily thereafter, up to 7 days. Two
11
groups of control subjects will also be evaluated: a non-MN group (gels applied to intact
skin), and a placebo group (diclofenac sodium gel replaced with a placebo gel
formulation containing no anti-inflammatory moiety). All plasma samples will be
analyzed for naltrexone and 6-β-naltrexol with LC-MS/MS (positive mode atmospheric
pressure chemical ionization [APCI+]). All plasma samples and standards (200 µl
volume) will be extracted with 1 ml of ethyl acetate:acetonitrile (1:1, v/v), resulting in
protein precipitation. The samples in ethyl acetate:acetonitrile mixture will be vortexed
for 15 seconds and centrifuged for 20 minutes at 12000xg. The supernatant will be
transferred to a glass tube and evaporated under nitrogen. The resulting residue will be
reconstituted in 200 µl acetonitrile, vortexed for 15 seconds, and sonicated for 10
minutes. Samples will be transferred into low volume inserts in HPLC vials and injected
onto the LC-MS/MS system.
3.7 Pharmacokinetic evaluation of microneedle-enhanced transdermal 7-day
delivery of naltrexone following restoration of the Ca2+ epidermal gradient in
hairless guinea pigs
Dissipation of the epidermal Ca2+ gradient is one of the skin’s primary signals for
restoring barrier function after disruption via chemical or physical means. Restoration of
the gradient would prevent the skin from re-sealing the micropores after one-time
application of a MN array. The objective of these studies is to characterize the
percutaneous delivery of naltrexone HCl through MN-treated skin in hairless guinea pigs,
from gels containing various calcium salts (chloride, citrate, gluconate). The guinea pigs
will be treated at 2 sites on the dorsal surface with a 50 MN array applied twice at each
site (to create a total of 200 micropores), followed by application of a 11% naltrexone
HCl gel containing a calcium salt. Plasma samples will be taken over a 7 day period and
assessed via LC-MS/MS with the methods described above in Research Plan 3.6.
Copyright © Nicole K. Brogden 2012
12
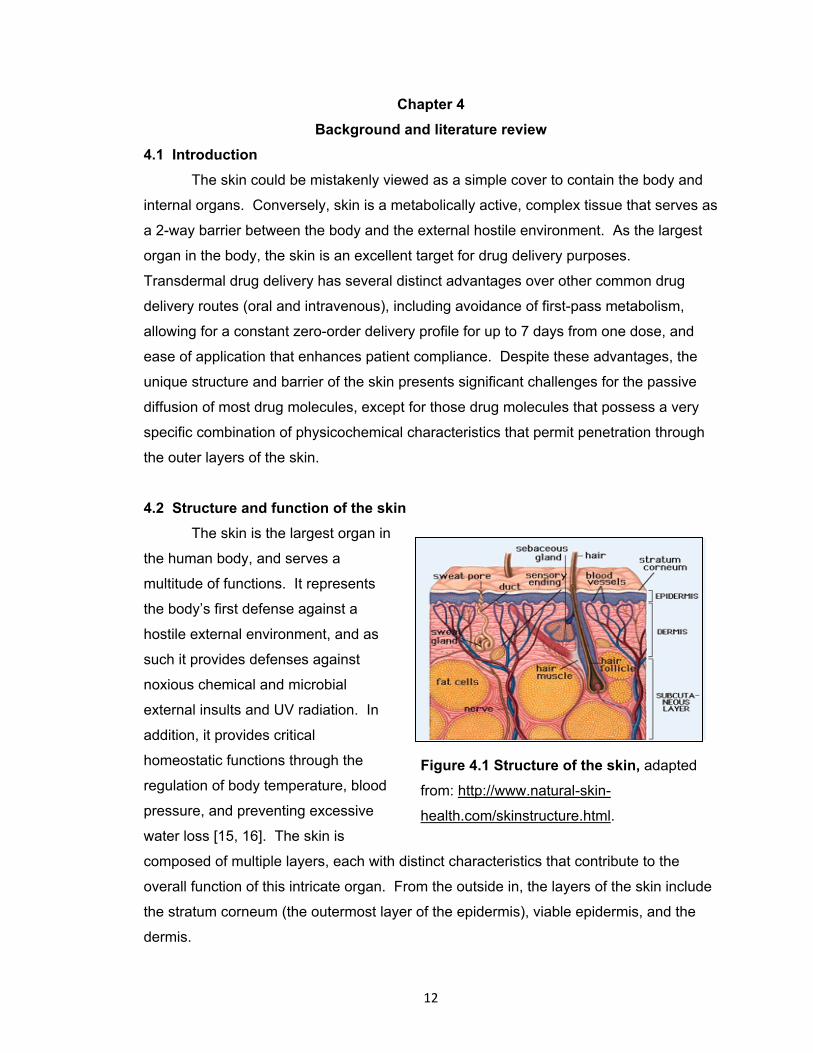
Figure 4.1 Structure of the skin, adapted
from: http://www.natural-skin-
health.com/skinstructure.html.
Chapter 4
Background and literature review
4.1 Introduction
The skin could be mistakenly viewed as a simple cover to contain the body and
internal organs. Conversely, skin is a metabolically active, complex tissue that serves as
a 2-way barrier between the body and the external hostile environment. As the largest
organ in the body, the skin is an excellent target for drug delivery purposes.
Transdermal drug delivery has several distinct advantages over other common drug
delivery routes (oral and intravenous), including avoidance of first-pass metabolism,
allowing for a constant zero-order delivery profile for up to 7 days from one dose, and
ease of application that enhances patient compliance. Despite these advantages, the
unique structure and barrier of the skin presents significant challenges for the passive
diffusion of most drug molecules, except for those drug molecules that possess a very
specific combination of physicochemical characteristics that permit penetration through
the outer layers of the skin.
4.2 Structure and function of the skin
The skin is the largest organ in
the human body, and serves a
multitude of functions. It represents
the body’s first defense against a
hostile external environment, and as
such it provides defenses against
noxious chemical and microbial
external insults and UV radiation. In
addition, it provides critical
homeostatic functions through the
regulation of body temperature, blood
pressure, and preventing excessive
water loss [15, 16]. The skin is
composed of multiple layers, each with distinct characteristics that contribute to the
overall function of this intricate organ. From the outside in, the layers of the skin include
the stratum corneum (the outermost layer of the epidermis), viable epidermis, and the
dermis.
13
4.2.1 Stratum corneum
The true interface between the body and the hostile external environment is the
outermost layer of the skin, known as the stratum corneum (SC), or horny layer [15, 16].
It was believed to be a metabolically inactive tissue, similar to a plastic film, until the mid-
1970s [15]. It is now known to be a biosensor with limited metabolic activities that can
respond to external cues and insults. The SC is a multicellular layer that is
approximately 10 to 15 μm thick over most of the body, though it is much thicker on the
friction surfaces of the skin (palms and soles). This outermost layer of the skin serves
many critical functions, as it prevents excessive water loss to the outside environment
while protecting the body from external xenobiotics and microbes. Structurally, the SC
has been described as a “brick and mortal” model, composed of fully differentiated
keratinocytes (“bricks”) embedded in a continuous lipid matrix (“mortar”). Mechanical
strength of the barrier is provided by the keratinocytes, while the lipids serve as the
barrier to water and electrolyte movement [15, 17]. This layer of the skin is structurally
distinct from all other layers, imparting its unique barrier properties to the skin as a
whole.
The mechanical strength of the SC is provided by the keratinocytes
(corneocytes). Over most parts of the body, the SC is composed of approximately 10 –
15 layers of flattened keratinocytes (each with a mean thickness of about 1 μm) [15].
The individual keratinocytes are composed of keratin that fills up the cell, and a
substance known as natural moisturizing factor, a mixture of amino acids and their
derivatives, that helps to maintain the normal hydration of the SC (approximately 20%
water under normal conditions) [18]. Natural moisturizing factor acts as a humectant by
absorbing atmospheric water, thus allowing the SC to remain hydrated and not lose its
moisture to the outside environment; maintaining this free water helps facilitate
biochemical events within the SC [18]. The keratinocytes in the SC are encapsulated by
a cornified envelope (CE) that is composed of insoluble proline-rich proteins (loricrin and
involucrin) [15]. The CEs of neighboring keratinocytes are linked together by
intercellular protein structures called corneodesmosomes [19]. These structures must
be enzymatically degraded in order for the outermost layer of cells to be shed, in a
process known as desquamation [19]. The entire SC is replaced and turned over every
2 weeks in healthy adults [15, 16].
The intercellular lipid matrix makes up approximately 15 - 20% of the SC volume,
and provides the barrier to water and electrolyte movement [15-17]. These lipids are
14
notably different from other biological membranes, in that there is very little phospholipid
present [15, 17]. The composition of the lipid species found in the SC is always in an
equimolar ratio as follows: ceramides (50% by mass), cholesterol (25% by mass), and
free fatty acids (10 - 20% by mass) [15, 17, 19]. These lipids are secreted as lamellar
bodies from the keratinocytes. Lamellar bodies are unique to the epidermis (first seen in
the stratum spinosum layer), and are membrane bilayer-encircled secretory organelles
[17]. These lamellar bodies contain the lipids that serve as precursors to the SC
extracellular lipids, and after secretion, these lipids are metabolized by enzymes that are
also secreted in the lamellar bodies [17]. This sequence of events is known as “lipid
processing” and is a critical step for the formation of a normal permeability barrier [17].
The extracellular processing of lipids has important effects with regard to the
barrier function of the SC (in fact, many of the key functions of the SC are somewhat
derived from the extracellular processing of lipids) [17]. For example, maintenance of
the SC hydration is partly maintained by the glycerol formed by the breakdown of
phospholipids [17]. Free fatty acids contribute to the acidic pH of the SC (the pH of the
skin surface ranges from ~5 to 5.5 in humans and animals), and this acidity is very
important for regulating activity of many of the SC enzymes [17]. If the pH is increased,
the lipid processing is impaired, thereby decreasing the permeability barrier function [17].
4.2.2 Viable epidermis
The viable epidermis (often simply referred to as the ‘epidermis’, which includes
the SC) is contained between the SC and the underlying dermis (it deserves note that
the epidermis is often described as two distinct layers: the viable epidermis and the SC).
The epidermis is approximately 50 – 100 μm thick and is completely avascular. From
the perspective of drug delivery this section of the skin is viewed as one single
diffusional field, though under microscopic evaluation it can be seen that multiple strata
make up the epidermis (representing progressive differentiation of the cells towards the
external skin surface). From outward in, the layers of the epidermis consist of the
stratum corneum, stratum granulosum, stratum spinosum, and stratum basale [16, 19]
The cells of the basement layer of the epidermis (stratum basale) give rise to the
cells that eventually comprise the SC; for this reason the stratum basale is often referred
to as the germinative layer. The cells flatten and begin to internally synthesize lipids and
proteins that will ultimately characterize a fully differentiated SC layer. Several distinct
cell types are found within the epidermis, though the primary cells are keratinocytes.
15
Langerhans cells serve as the primary antigen presenting cells; melanocytes synthesize
the pigment that gives unique colorations across different human races and these cells
also produce the suntanning effect in response to ultraviolet radiation [16]. Additional
cell types include lymphocytes and migrant macrophages, which are especially evident
following skin trauma.
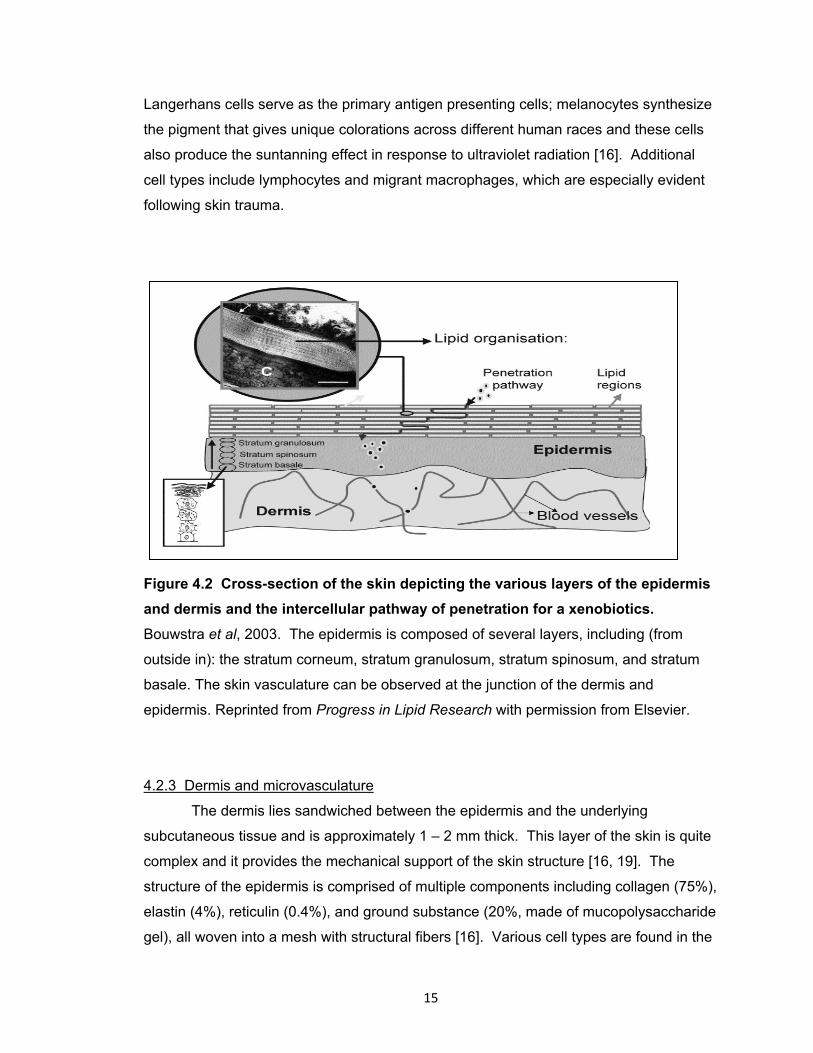
Figure 4.2 Cross-section of the skin depicting the various layers of the epidermis
and dermis and the intercellular pathway of penetration for a xenobiotics.
Bouwstra et al, 2003. The epidermis is composed of several layers, including (from
outside in): the stratum corneum, stratum granulosum, stratum spinosum, and stratum
basale. The skin vasculature can be observed at the junction of the dermis and
epidermis. Reprinted from Progress in Lipid Research with permission from Elsevier.
4.2.3 Dermis and microvasculature
The dermis lies sandwiched between the epidermis and the underlying
subcutaneous tissue and is approximately 1 – 2 mm thick. This layer of the skin is quite
complex and it provides the mechanical support of the skin structure [16, 19]. The
structure of the epidermis is comprised of multiple components including collagen (75%),
elastin (4%), reticulin (0.4%), and ground substance (20%, made of mucopolysaccharide
gel), all woven into a mesh with structural fibers [16]. Various cell types are found in the
16
dermis, including: nerve cells and endings (sensors of the skin); endothelial cells that
form the vessels of the vasculature; blood cells; fibroblasts that produce the structure
fiber network; and mast cells responsible for production of ground substance and
release of histamine following aggravation. The appendages of the skin arise in the
dermis, including sebaceous glands, hair follicles, eccrine and apocrine sweat glands.
Of particular importance, the dermis is highly vascularized, providing the circulation that
serves all of the skin. The first point of entry for a drug into the systemic circulation
occurs within the papillary plexus (a delicate capillary structure in the upper dermis). A
rich lymphatic system is also present, in addition to a network of sensory nerves for pain,
pressure, and temperature.
4.3 Transdermal drug delivery
Transdermal (percutaneous) drug delivery, by definition, is the delivery of drugs
through the skin in order to elicit systemic effects [16, 20]. Transdermal delivery offers
several unique advantages over oral and non-oral drug delivery. The skin provides a
large surface area (1 – 2 m2) that is readily available for drug absorption [1].
Transdermal systems can provide the option for a sustained release system, which is
particularly beneficial for drugs with short elimination half-lives and frequent dosing
requirements. Controlled kinetics for drug input can be achieved, while avoiding the
peak and valley effects seen with oral and IV administration, and removal of the patch
allows for easy termination of drug input. These are especially attractive qualities for
delivering drugs possessing narrow therapeutic indices [1]. Applying a patch to the skin
for drug delivery purposes is non-invasive, allowing for better patient acceptance and
ease of application without need for a healthcare professional. The combination of all
these factors would likely contribute to an increase in patient compliance, which would
be the ultimate goal of any drug delivery system.
In spite of its clear and unique advantages, transdermal delivery is not suitable
for all drugs and therapeutic indications. For example, a drug that already exhibits high
bioavailability following oral administration, especially with infrequent dosing
requirements would not necessarily warrant the use of percutaneous delivery.
Additionally, any therapeutics that require a rapid bolus dosing or need to achieve high
concentrations quickly would not be appropriate, as transdermal delivery generally
provides a slower and sustained release profile over longer timeframes [1] . As such,
there still remains a large number of drugs and biologics that would benefit from delivery
17
through the skin, but as of yet it has not been entirely feasible to commercially develop
such systems.
4.3.1 Optimal properties of transdermally delivered drugs
One of the challenges associated with transdermal delivery is that only a small
number of drugs can be delivered via this route, as there are several physicochemical
properties that a molecule must possess in order to be a reasonable candidate (with
currently available passive delivery methods). To be a viable contender for delivery via
the transdermal route, the drug molecule should be relatively small in size (generally not
more than a few hundred Daltons), have a low melting point (good solubility properties),
and be highly skin permeable (octanol-water partition coefficients that favor lipids,
(logKoct of ~2)). The structure should not contain a large number of pendant H groups,
as the number of H groups reflects the ability of the drug moiety to interact with the polar
head groups of the lipids in the SC. Additionally these types of molecules tend to be
quite hydrophilic and therefore have a Koct that is lower than optimal.
Generally unionized species will partition better into the skin (relating to the pKa,
or ionization potential) [1, 21]. In order to be systemically delivered, a molecule must
also be able to cross the viable epidermis and dermis to reach the blood vessels below.
These regions of skin beneath the SC are a more hydrophilic environment than the lipid
milieu of the SC. Thus, the drug compound must be hydrophilic enough to interact with
this environment, but must be lipophilic enough to diffuse through the lipids of the SC.
Models now exist to predict the maximum flux (Jmax) of a compound based on three
factors: 1) logarithm of the octanol-water partition coefficient, melting point, and
molecular weight [22].
The drug should be potent in its effects (requiring doses of milligrams/day or
less), and the drug compound itself should not pose any unwanted cutaneous actions [2,
16]. Other miscellaneous criteria (not related to the physicochemical properties of the
molecule) that would make a drug an ideal candidate for development of a transdermal
delivery system would include drugs that are subject to extensive first-pass hepatic
metabolism, have an undesirable oral or intravenous dosage schedule, or drugs for
which the currently available delivery systems have problems associated with
compliance or adverse reactions.

18
4.3.2 Routes of skin penetration
With passive delivery techniques, there are 3 steps that must occur for a drug to
be successfully delivered from the vehicle and through the skin. First, the drug must
diffuse out of the vehicle and reach the vehicle-SC interface. Following this, the drug
must partition into and diffuse through the SC to reach the viable epidermis below. The
final step is the diffusion of the drug through the dermis and then into the
microcirculation [20]. Based on the general structure of the skin, there are 3 major
diffusion pathways that a drug molecule can take through the skin: 1) through the
continuous lipid matrix in the SC (intercellular route); 2) directly through the
keratinocytes (transcellular route); or 3) appendageal route (hair follicles and sweat
glands) [16, 23, 24]. The various routes of skin penetration are displayed in Figure 4.3.
4.3.2.1 Intercellular: The lipid matrix of the SC in which the keratinocytes are
embedded provides the only continuous phase throughout the SC, and this is thought to
be the primary pathway of percutaneous delivery for most compounds. This creates a
very tortuous route through the skin, and as such, generally only low molecular weight
and moderately lipophilic drug compounds can transverse this environment successfully.
4.3.2.2 Transcellular: The transcellular path of delivery would include delivery
through the keratinocytes, requiring that a drug compound transverse through the
keratin-filled corneocytes as well as the intercellular lipid matrix, with several transfers
between the corneocytes and the lipid matrix between them [24]. As such, it is thought
that this pathway would be generally unfavorable and would not likely contribute
substantially to the overall delivery of most drug compounds through the SC.
4.3.2.3 Appendageal: The appendageal route of transport simply refers to the
pathway of hair follicles and sweat ducts, which can be seen as a mean of bypassing the
permeability barrier of the SC. For this reason, appendageal transport is often known as
a “shunt pathway”, as it provides a pathway of lesser resistance as compared to the
tortuous lipid pathway of the SC. However, the area available for appendageal transport
is very small (about 0.1%), and thus this route typically can be considered negligible in
its contribution to drug flux at steady state [25].
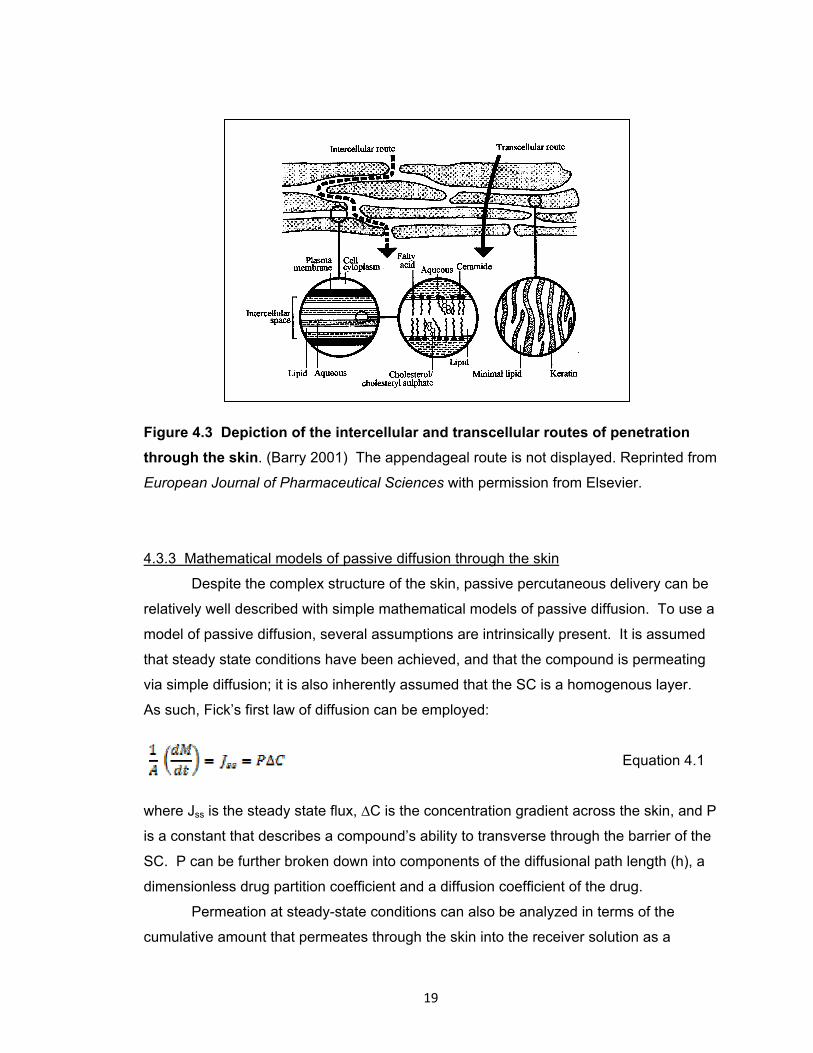
19
Figure 4.3 Depiction of the intercellular and transcellular routes of penetration
through the skin. (Barry 2001) The appendageal route is not displayed. Reprinted from
European Journal of Pharmaceutical Sciences with permission from Elsevier.
4.3.3 Mathematical models of passive diffusion through the skin
Despite the complex structure of the skin, passive percutaneous delivery can be
relatively well described with simple mathematical models of passive diffusion. To use a
model of passive diffusion, several assumptions are intrinsically present. It is assumed
that steady state conditions have been achieved, and that the compound is permeating
via simple diffusion; it is also inherently assumed that the SC is a homogenous layer.
As such, Fick’s first law of diffusion can be employed:
Equation 4.1
where Jss is the steady state flux, ∆C is the concentration gradient across the skin, and P
is a constant that describes a compound’s ability to transverse through the barrier of the
SC. P can be further broken down into components of the diffusional path length (h), a
dimensionless drug partition coefficient and a diffusion coefficient of the drug.
Permeation at steady-state conditions can also be analyzed in terms of the
cumulative amount that permeates through the skin into the receiver solution as a
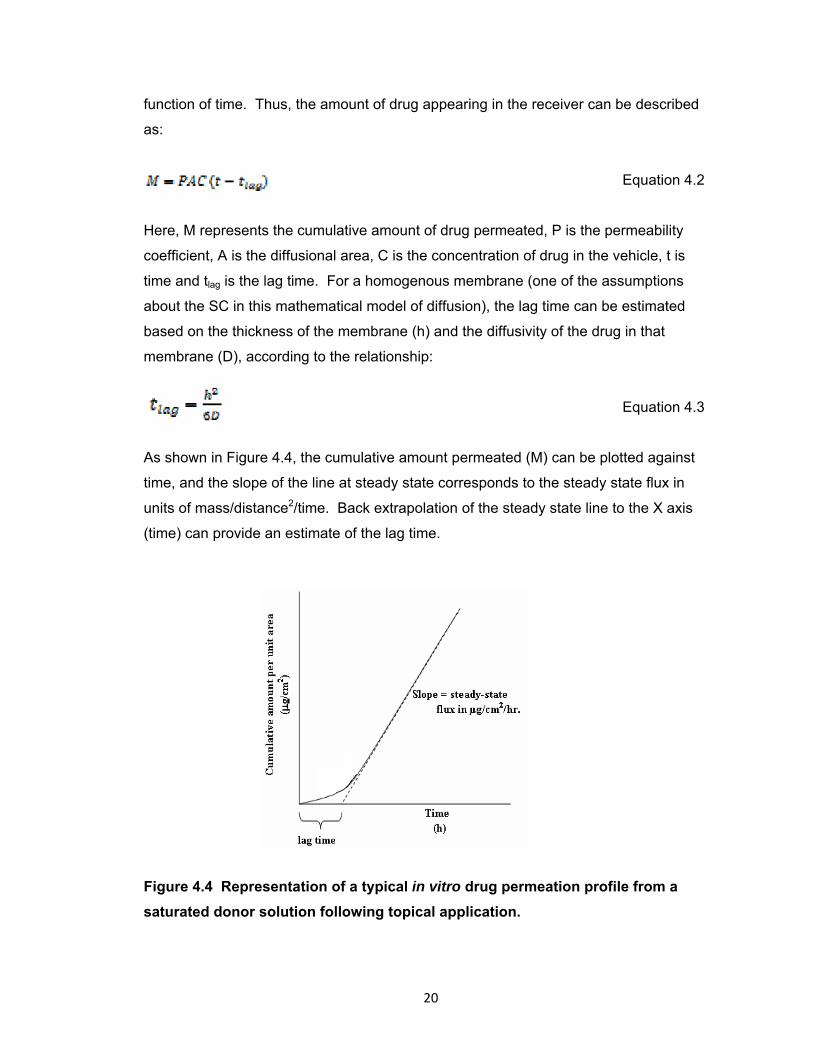
20
function of time. Thus, the amount of drug appearing in the receiver can be described
as:
Equation 4.2
Here, M represents the cumulative amount of drug permeated, P is the permeability
coefficient, A is the diffusional area, C is the concentration of drug in the vehicle, t is
time and tlag is the lag time. For a homogenous membrane (one of the assumptions
about the SC in this mathematical model of diffusion), the lag time can be estimated
based on the thickness of the membrane (h) and the diffusivity of the drug in that
membrane (D), according to the relationship:
Equation 4.3
As shown in Figure 4.4, the cumulative amount permeated (M) can be plotted against
time, and the slope of the line at steady state corresponds to the steady state flux in
units of mass/distance2/time. Back extrapolation of the steady state line to the X axis
(time) can provide an estimate of the lag time.
Figure 4.4 Representation of a typical in vitro drug permeation profile from a
saturated donor solution following topical application.
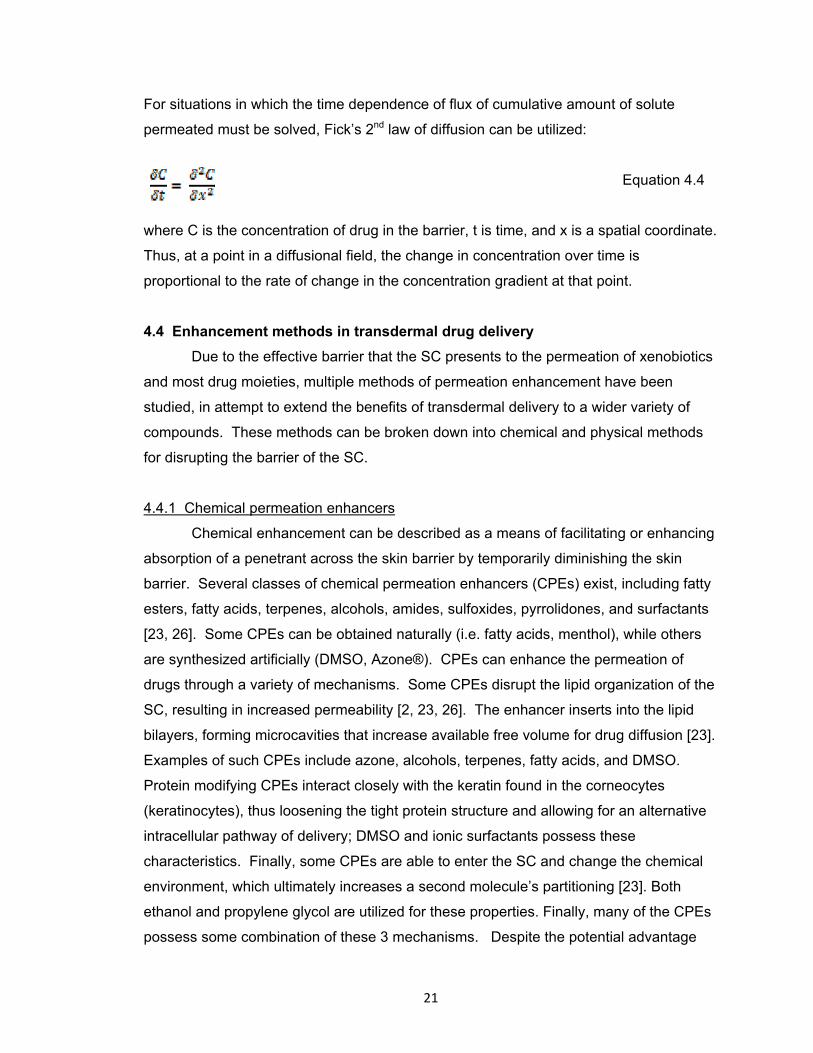
21
For situations in which the time dependence of flux of cumulative amount of solute
permeated must be solved, Fick’s 2nd law of diffusion can be utilized:
Equation 4.4
where C is the concentration of drug in the barrier, t is time, and x is a spatial coordinate.
Thus, at a point in a diffusional field, the change in concentration over time is
proportional to the rate of change in the concentration gradient at that point.
4.4 Enhancement methods in transdermal drug delivery
Due to the effective barrier that the SC presents to the permeation of xenobiotics
and most drug moieties, multiple methods of permeation enhancement have been
studied, in attempt to extend the benefits of transdermal delivery to a wider variety of
compounds. These methods can be broken down into chemical and physical methods
for disrupting the barrier of the SC.
4.4.1 Chemical permeation enhancers
Chemical enhancement can be described as a means of facilitating or enhancing
absorption of a penetrant across the skin barrier by temporarily diminishing the skin
barrier. Several classes of chemical permeation enhancers (CPEs) exist, including fatty
esters, fatty acids, terpenes, alcohols, amides, sulfoxides, pyrrolidones, and surfactants
[23, 26]. Some CPEs can be obtained naturally (i.e. fatty acids, menthol), while others
are synthesized artificially (DMSO, Azone®). CPEs can enhance the permeation of
drugs through a variety of mechanisms. Some CPEs disrupt the lipid organization of the
SC, resulting in increased permeability [2, 23, 26]. The enhancer inserts into the lipid
bilayers, forming microcavities that increase available free volume for drug diffusion [23].
Examples of such CPEs include azone, alcohols, terpenes, fatty acids, and DMSO.
Protein modifying CPEs interact closely with the keratin found in the corneocytes
(keratinocytes), thus loosening the tight protein structure and allowing for an alternative
intracellular pathway of delivery; DMSO and ionic surfactants possess these
characteristics. Finally, some CPEs are able to enter the SC and change the chemical
environment, which ultimately increases a second molecule’s partitioning [23]. Both
ethanol and propylene glycol are utilized for these properties. Finally, many of the CPEs
possess some combination of these 3 mechanisms. Despite the potential advantage
22
gained in terms of increasing the permeability of drugs across the SC, the biggest
challenge that CPEs have faced is skin irritancy and toxicity, as they affect underlying
viable cells beneath the SC.
4.4.2 Physical methods
A wide variety of physical methods have been explored to temporarily disrupt the
SC, designed to make a physical breach of the barrier without harming the underlying
tissues, ultimately to provide a temporary permeation enhancement. In addition to
investigation of the individual methods, much research has also been devoted recently
to trying to achieve additive effects from combining multiple techniques (Figure 4.5).
4.4.2.1 Thermal ablation: Thermal ablation selectively heats the skin surface for
a short period of time to generate micron-scale perforations in the SC, thus increasing
skin permeability [5, 6]. This method localizes heat transfer to the skin surface without
allowing heat to propagate to and damage the viable tissue below. The heating period is
very brief (<< 1 second), generating local temperatures reaching hundreds of degrees
Celsius [2, 6]. The short pulses are typically on the time scale of milliseconds or shorter,
allowing for limitation of the heat to the SC; longer heating times results in damage to
deeper underlying tissue. Several drugs (for example, testosterone, granisetron HCl,
and diclofenac) and vaccines have been delivered via this route, while interstitial fluid
has also been extracted from human subjects [3]. The PassPort™ system (Altea
Therapeutics) has been tested in clinical trials for delivery of insulin using this type of
physical enhancement.
4.4.2.2 Laser ablation: Lasers can be used to thermally ablate, and thereby
create pores, in the SC. Similar to other poration techniques, this allows a drug to
bypass the SC and transverse through the aqueous pathway of the pores and into the
underlying epidermis and dermis. It can also be used to increase delivery of both
hydrophilic and lipophilic compounds, and can also allow for extraction of interstitial
fluids. This method does carry with it a high cost and complicated equipment.
4.4.2.3 Jet injections: Jet injectors can be broken down into two types: liquid
and powder. The same principle of delivery applies to both types, in which a high-speed
jet is used to puncture the skin and deliver drugs (in either liquid or powder formulations)
without using a needle [6]. Acceptance of jet injectors has been somewhat variable,
mostly due to the wide variety of reactions that have been observed at the administration
sites. Varying levels of pain, bleeding and hematomas have been reported with the
23
liquid injectors, while powder injectors have seen reports of hyperpigmentation, flaky
skin, and erythema at treatment sites.
4.4.2.4 Dermabrasion: Microdermabrasion is a common technique for cosmetic
purposes (to treat scars, acne, and dermatologic conditions), primarily to remove or alter
the skin tissue. Increased permeability to small drugs like 5-flurouracil has been
demonstrated following abrasion of the skin [27].
4.4.2.5 Sonophoresis: Sonophoresis is the term used to describe ultrasound
methods that are used to enhance skin permeability. High frequency ultrasound
(therapeutic ultrasound, f > 1 MHz) was originally a popular choice for sonophoresis, but
it is now known that low frequency ultrasound (f <100 kHz) is much more effective for
enhancing transdermal delivery [3]. While there are several possibilities that have been
explored as to the exact mechanism of sonophoresis for enhancing skin permeability,
perhaps now the most accepted mechanism is acoustic cavitation. This refers to the
formation, oscillation, and collapse of “microbubbles” in the tissue. The violent collapse
of the bubbles is thought to create aqueous pathways (water channels) within the lipid
bilayers of the SC, thus disrupting the structure and allowing for enhanced drug delivery
[3, 28, 29].
An interesting feature of sonophoresis delivery systems is that the skin remains
in a state of high permeability for hours after a short application of ultrasound, which
allows for a pretreatment scenario in which the patient does not need to wear the device
for the duration of the drug delivery window [28]. Sonophoresis has been used to
successfully deliver a large range of molecules, including macromolecules (insulin and
erythropoietin) and smaller molecules such as lidocaine and calcein [30]. In 2004 the
FDA approved SonoPrep®, a commercially available tool to accelerate local anesthesia
with lidocaine; it has since been proven effective for enhancing anesthesia from
application of EMLA® cream prior to intravenous cannulation in children [31].
4.4.2.6 Iontophoresis: The underlying principle of iontophoresis is to provide an
electrical driving force to assist the transport of molecules across the SC [1-3, 23].
Iontophoretic delivery has already been well described for clinical applications, including
pilocarpine sweat tests for diagnosing cystic fibrosis, lidocaine delivery for local
anesthesia, and tap water to treat hyperhidrosis [2]. This method involves the passage
of a small current through a drug-containing electrode that is in contact with the skin [23].
The efficiency of transport depends on the polarity, valency, and mobility of the species
of interest [1, 23]. Three primary mechanisms of drug transport have been described,
24
including electroosmosis, electrophoresis, and increased skin permeability resulting from
the flow of electric current [1, 4]. Drugs that carry a charge will be moved across the
skin via electrophoresis, which drives the compound across the skin via direct interaction
with the electric field [2, 3]. Species with smaller molecular mass and greater charge are
generally favored and delivered more rapidly with iontophoresis techniques [3]. As such,
drug delivery in clinical studies has been limited to smaller molecules including fentanyl
and lidocaine [32-34].
Commercial products have been previously marketed in the United States
(Iontocaine® and Lidosite®) and IONSYS™ (never marketed in the US). The products
marketed in the US were subsequently removed due to safety concerns and corrosion of
a component of the device, in the case of the IONSYS™ system. These market
withdrawals illustrate perhaps the biggest drawback of iontophoresis, in that it requires a
relatively complex and expensive delivery device to be effective.
4.4.2.7 Electroporation: Electroporation (also known as electropermeabilization)
involves the application of transient high-voltage electrical pulse to the skin, resulting in a
rapid and reversible disruption of the stratum corneum. Lipid bilayer structures are
disrupted and a reversible polar pathway is created in the skin (it is generally accepted
that rearrangements in the lipid structure creates temporary aqueous pores/pathways)
[2, 3, 23, 35]. The main mechanisms of molecular transport derived from this method
are enhanced diffusion via skin poration (both during and after the pulses), electrically
driven transport that occurs during the pulses, and electroosmosis [4, 23, 35].
Electroporation acts directly on the skin and induces a change in the tissue permeability
[36]. The properties of drugs that can be delivered via electroporation are vast, including
small and large molecules, hydrophilic or lipophilic, and charged or neutral molecules.
Molecules that have been successfully delivered via electroporation include ions,
calcein, metoprolol, fentanyl, sulforhodamine, peptides, and macromolecules [37-39].
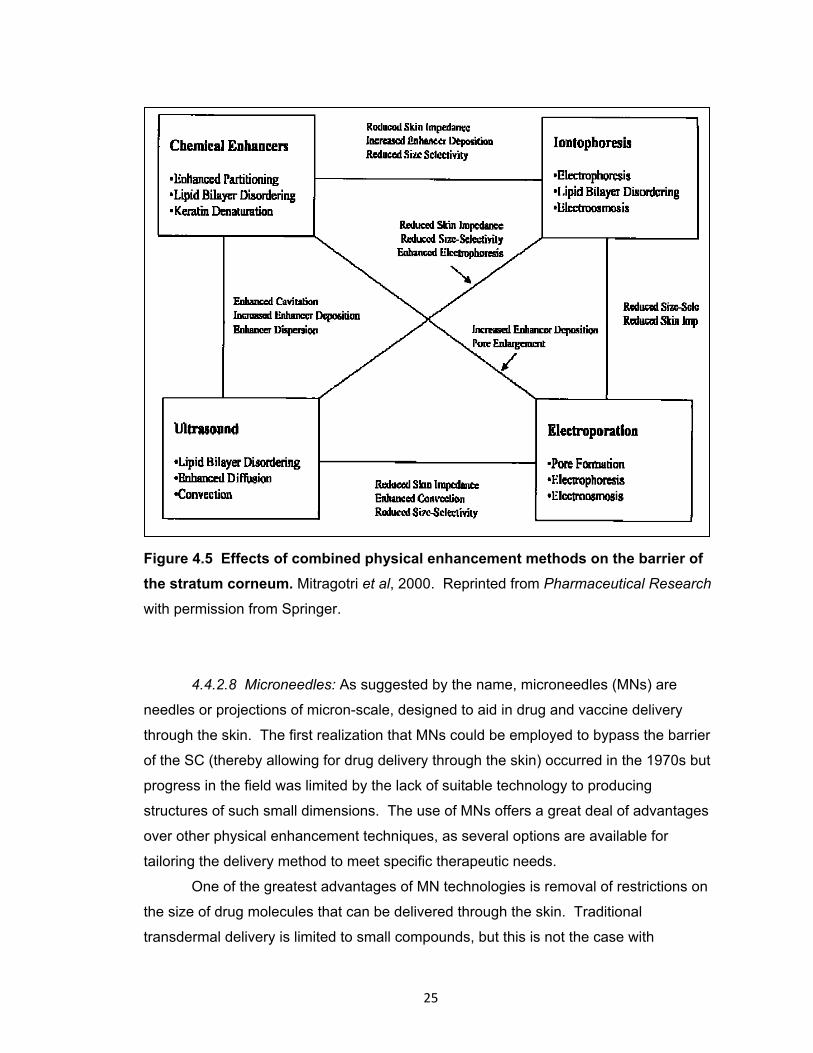
25
Figure 4.5 Effects of combined physical enhancement methods on the barrier of
the stratum corneum. Mitragotri et al, 2000. Reprinted from Pharmaceutical Research
with permission from Springer.
4.4.2.8 Microneedles: As suggested by the name, microneedles (MNs) are
needles or projections of micron-scale, designed to aid in drug and vaccine delivery
through the skin. The first realization that MNs could be employed to bypass the barrier
of the SC (thereby allowing for drug delivery through the skin) occurred in the 1970s but
progress in the field was limited by the lack of suitable technology to producing
structures of such small dimensions. The use of MNs offers a great deal of advantages
over other physical enhancement techniques, as several options are available for
tailoring the delivery method to meet specific therapeutic needs.
One of the greatest advantages of MN technologies is removal of restrictions on
the size of drug molecules that can be delivered through the skin. Traditional
transdermal delivery is limited to small compounds, but this is not the case with

26
microporated skin. The newly created micropores are micron in scale but are still
notably larger than drug molecules. As such, it is feasible to deliver proteins,
macromolecules, and DNA through microporated skin. MN treatment also allows for
hydrophilic compounds to be delivered into the skin, whereas traditional passive
transdermal delivery is restricted to hydrophobic compounds [40]. There is a wide range
of flexibility with the geometry and composition of the needles and the arrays. MNs have
been made from a variety of materials, including stainless steel, titanium, polymers,
silicon, glass, sugars, and palladium [3, 5]. The length of the needles can range from
100 up to 1500 μm, and the number of needles applied can range anywhere from a
single needle (in the case of vaccines) all the way up to a roller possessing 192 needles
(DermaRoller®).
Four primary methods of drug delivery with MNs have been described (depicted
in Figure 4.6): 1) pretreatment of the skin with solid MNs, 2) drug-coated MNs, 3) MNs
that dissolve upon insertion into the skin, and 4) hollow MNs [5, 41]. The varying
methods all have different mechanisms to allow for drug delivery, each with specific
advantages and disadvantages.
The use of solid MNs is typically viewed as a pretreatment paradigm, in which
MNs are inserted into the skin and immediately removed, leaving behind micron-scaled
pores (micropores) [5, 6, 41]. The creation of such micropores in the SC can increase
skin permeability by up to 4 orders of magnitude [42-44], and application of a drug or
vaccine over the newly permeable skin allows for delivery into or through the skin [6].
This treatment process is often referred to as the “poke (press) and patch” approach.
Solid MNs can be made from a variety of materials, including metals (stainless steel,
titanium or nickel), silicon, ceramics, maltose, and polymers (both degradable and non-
degradable) [6, 41]. The solid MNs are typically designed as flat substrates such that
the needles are all pressed into the skin at the same time. However, a rollers of MNs
are now commercially available that can treat larger areas of the skin. Some examples
of drug molecules that have been successfully delivered with solid MN technologies
include naltrexone [9], calcein [44], docetaxel [45], phenylephrine [46], and insulin [47].
In addition to simply piercing the skin to create aqueous micropores to aid in drug
delivery, solid MNs can be coated with drug formulations that can be delivered quickly
into the tissue upon insertion of the MNs into the skin (the “coat and poke” approach).
Multiple methods exist for coating the MNs, including dipping and spraying techniques
[41]. While this technique does limit the amount of drug that can be delivered (due to the

27
small volume that can be coated onto the needle surfaces), this mode of MN application
has proven to be versatile in its applications and the drugs that can be successfully
delivered. Peptides [48], vaccines [49-51], and antigens [52] have all been successfully
coated onto MNs.
Dissolving MNs are quite different from the 2 MN techniques already discussed,
in that these needles are composed of degradable, water-soluble materials (often
polymers and sugars) that completely dissolve within the skin following insertion. These
needles do offer the possibility of being used as a pretreatment, but often a drug is
encapsulated within the polymer, allowing for slow release into the skin. Dissolvable
MNs often require up to 5 minutes of insertion time to completely dissolve; in contrast,
biodegradable polymers remain in the skin for several days to provide controlled-release
degradation. Human growth hormone [53], erythropoietin [54], and influenza vaccine [55]
have all been successfully delivered with this approach.
Finally, hollow MNs provide a defined pathway for drug delivery through the
needles into the skin. This allows for a liquid drug formulation to be delivered via
pressure-driven flow (similar to a hypodermic needle), which creates a system in which
the flow rate can be adjusted to meet a specific therapeutic need. The greatest
advancement with hollow MNs has been the successful delivery of insulin to both
animals and humans [56, 57].
Figure 4.6 Four methods of microneedle-enhanced drug delivery to the skin. Kim
et al, 2012. Reprinted from Advanced Drug Delivery Reviews with permission from
Elsevier.
28
4.5 Tolerability and safety of microneedles
In order to be clinically feasible as a drug delivery technique, it is important that
MN treatment is both well tolerated by patients and safe with regards to infection
potential/risk. It has been demonstrated through multiple studies that application of MNs
to the skin is painless and well tolerated. Using visual analog scales (VAS), MN
application is reported to be significantly less painful than a hypodermic needle [7, 58,
59], while other reports have not specifically used VAS methods, but have still reported
lack of pain with MN insertion [60, 61]. Subjects perceive MN insertion as a “pressure”
or “heavy” sensation, but not painful [7]. The perception of pain increases with two
factors: 1) MN length and 2) number of MNs. The MN tip angle, width, and thickness do
not significantly affect pain [58].
One of the first criticisms mentioned with regard to MN treatments is the potential
for increased risk of local infection once the micropores have been created. In fact, it
has been demonstrated that in vitro microbial penetration is less after MN application
(when compared to a hypodermic needle) for Gram negative, Gram positive, and Yeast
species [62]. Additionally, there have been no reports of infection following MN
application, despite the increasing numbers of human trials in this area.
4.6 Micropore lifetime after microneedle treatment
The utility of MN treatments for enhancing drug delivery through the SC is
dependent on 2 primary factors: the efficiency of micropore formation, and the lifetime
during which a drug compound can diffuse through the micropores (in other words, the
effective lifetime of the micropores). This has become a topic of great recent interest in
the MN delivery field, and several studies in animals and human have been published
addressing the topic of micropore closure kinetics and determination of a viable drug
delivery window after one-time MN application [10-14]. A variety of experimental
techniques are available for assessing both formation and the lifetime of the micropores,
including methylene blue staining [7, 63, 64], india ink staining [12], calcein imaging [63,
65], histology techniques [63, 65], optical coherence tomography [13], confocal laser
microscopy [10, 63, 65], transepidermal water loss [7, 11, 63, 65], impedance
spectroscopy [9, 14], and drug diffusion (pharmacokinetic) studies [9, 11, 12]. Through
these various techniques of evaluating micropore formation it is now understood that
multiple factors contribute to the degree of perturbation that MNs create in the skin and
how long the micropores will remain viable, including: local skin occlusion, geometry and
29
physical properties of the MNs, and physiological processes involved in barrier
restoration. A summary of the studies that have examined the effect of these
parameters on micropore re-sealing kinetics is found in Table 4.1, below.
4.6.1 Effects of occlusion
Occlusion of the skin with an impermeable membrane blocks the insensible loss
of water from the skin’s surface, thereby resulting in a local increase in skin hydration. In
typical transdermal delivery systems, the skin remains occluded under a patch for a
period of hours to days. This would also be the situation with a “poke (press) and patch”
MN application, when the micropores are occluded with a drug formulation. The steep
water gradient that results from damage to the skin (in this case, from the creation of
micropores) is one of the first signals for the skin to initiate the cascades of events
contributing to barrier restoration, as this affects ion gradients in the skin that ultimately
trigger repair mechanisms [66-68]. Blocking the formation of the water gradient thus
blocks initiation of repair mechanisms. This could also be considered an advantageous
attribute of the occlusion of the “poke (press) and patch” system, as the micropores
would be expected to heal more slowly under conditions of limited (or absent) airflow to
the external environment. This concept has been demonstrated by several groups who
have examined the effect of occlusion on micropore re-sealing kinetics.
When unoccluded, the micropores heal quickly: TEWL measurements
demonstrated a return to baseline within a range of 2 hours [14, 69], 4 hours [63, 65], or
by 24 hours [7]. Other techniques demonstrate similar timeframes. Bal et al viewed the
micropores with confocal laser scanning microscopy and reported that no dye was
present on the skin surface at 15 minutes, suggesting rapid re-sealing of the micropores
at the SC [10]; using optical coherence tomography, Enfield and colleagues described
that micropores were still visible at 85 minutes post-treatment, though the micropore size
had decreased [13]. Methylene blue binding studies have displayed evidence of repair
at 8 and 24 hours post-MN [7], while calcein imaging techniques have exhibited closure
over a range of 12 to 18 hours [63, 65].
Under occluded conditions, the timeframe of micropore re-sealing is extended to
a notable degree. TEWL measurements demonstrate that baseline barrier function is
not achieved by 72 hours under occlusion with a blank patch or buffers of pH 4 or 7,
confirming that the pH of the local environment does not affect micropore closure rates
this was confirmed with calcein imaging in which the micropore could be visualized at 72
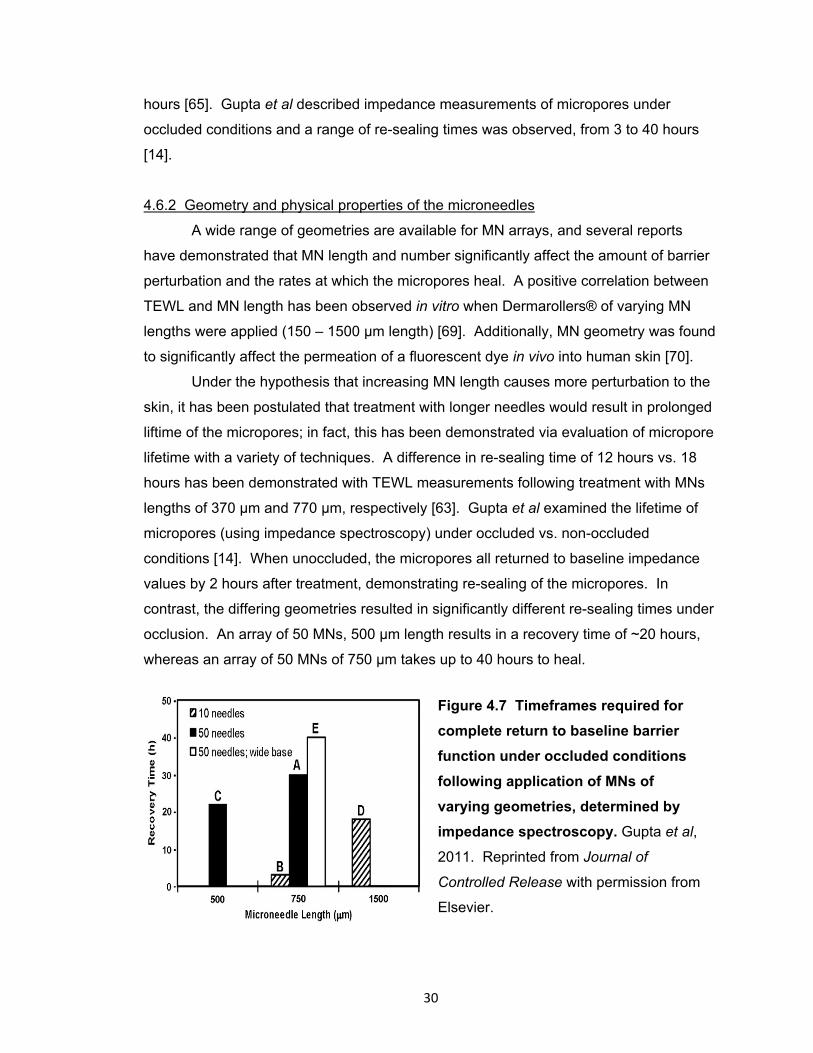
30
hours [65]. Gupta et al described impedance measurements of micropores under
occluded conditions and a range of re-sealing times was observed, from 3 to 40 hours
[14].
4.6.2 Geometry and physical properties of the microneedles
A wide range of geometries are available for MN arrays, and several reports
have demonstrated that MN length and number significantly affect the amount of barrier
perturbation and the rates at which the micropores heal. A positive correlation between
TEWL and MN length has been observed in vitro when Dermarollers® of varying MN
lengths were applied (150 – 1500 μm length) [69]. Additionally, MN geometry was found
to significantly affect the permeation of a fluorescent dye in vivo into human skin [70].
Under the hypothesis that increasing MN length causes more perturbation to the
skin, it has been postulated that treatment with longer needles would result in prolonged
liftime of the micropores; in fact, this has been demonstrated via evaluation of micropore
lifetime with a variety of techniques. A difference in re-sealing time of 12 hours vs. 18
hours has been demonstrated with TEWL measurements following treatment with MNs
lengths of 370 μm and 770 μm, respectively [63]. Gupta et al examined the lifetime of
micropores (using impedance spectroscopy) under occluded vs. non-occluded
conditions [14]. When unoccluded, the micropores all returned to baseline impedance
values by 2 hours after treatment, demonstrating re-sealing of the micropores. In
contrast, the differing geometries resulted in significantly different re-sealing times under
occlusion. An array of 50 MNs, 500 μm length results in a recovery time of ~20 hours,
whereas an array of 50 MNs of 750 μm takes up to 40 hours to heal.
Figure 4.7 Timeframes required for
complete return to baseline barrier
function under occluded conditions
following application of MNs of
varying geometries, determined by
impedance spectroscopy. Gupta et al,
2011. Reprinted from Journal of
Controlled Release with permission from
Elsevier.
31
4.6.3 Drug delivery window following microneedle treatment
All of the aforementioned studies examining micropore formation and closure
kinetics utilized “surrogate” markers to assess the re-sealing time of micropores under
various conditions. However, the ultimate goal of characterizing micropore lifetime is to
determine the window during which drug can be delivered through the micropores to a
therapeutic level. The first study to examine this concept in human subjects described
the delivery of naltrexone (NTX), an opioid antagonist, using the “poke (press) and
patch” method in healthy human volunteers. Subjects were treated once with MN arrays
at 4 patch sites, for a total of 400 micropores (arrays of 50 MNs each, 620 μm in length).
A 16% NTX•HCl patch was applied to each MN-treated skin site, and remained on the
skin for the full 72 hours of the study. NTX was delivered to a therapeutic plasma
concentration (2.5 ± 1.0 ng/ml) for 48 hours; 2 subjects demonstrated delivery up to 72
hours [9]. This delivery window is in very good agreement with impedance, TEWL, and
calcein imaging data that demonstrated viability of micropores in a window ranging from
40 hours to 72 hours under occlusion, following treatment with MNs of similar
geometries (500 or 750 μm length) [14, 63]. A very similar drug delivery window was
observed when hairless guinea pigs were treated on the dorsal surface with MNs (50
MN arrays, 750 μm in length) followed by application of a 21.7% gel patch of 6-β NTXol
(the active metabolite of NTX) that remained in place for the duration of the study.
Concentrations of NTXol in the plasma were consistent (21.3 ± 6.9 ng/ml) up to 48
hours, after which the plasma levels began to vary. TEWL was employed as a
concurrent surrogate technique, which confirmed that the micropores were no longer
viable after 48 hours [12]. Furthermore, in a study by Banks et al studying the effect of
diclofenac sodium on micropore closure, control animals were treated once with MN
arrays (50 MN arrays, 750 μm in length) followed by application of a 16% NTX•HCl gel
patch. Consistent with the other studies, NTX was detected in the plasma up to
approximately 60 hours post-MN (3.4 ± 1.3 ng/ml), after which the plasma levels were
undetectable [11]. All of these studies confirm 2 important concepts: first, under
occluded conditions drug delivery can be achieved through micropores for a timeframe
of approximately 48 – 72 hours (assuming a MN length of ≥ 500 μM); second, the
lifetime of micropores predicted by surrogate techniques (e.g. calcein imaging, TEWL,
impedance) correlates closely with plasma concentrations of drugs delivered under
similar conditions.
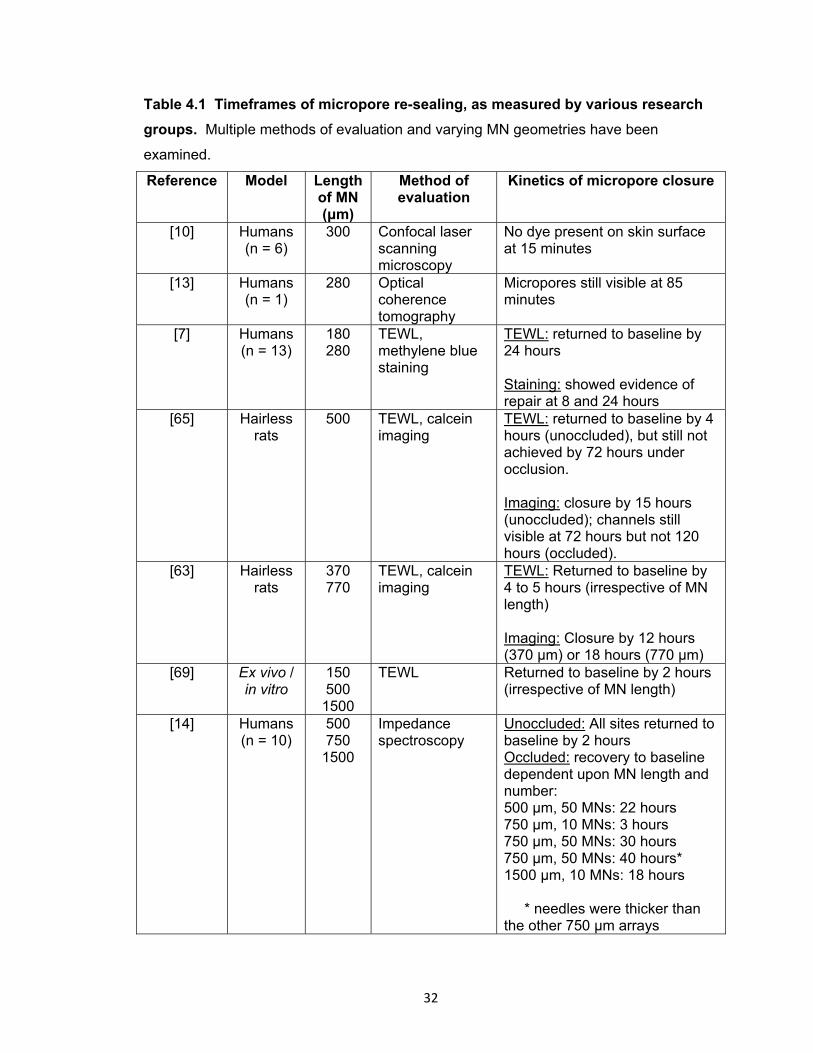
32
Table 4.1 Timeframes of micropore re-sealing, as measured by various research
groups. Multiple methods of evaluation and varying MN geometries have been
examined.
Reference Model Length of MN (μm)
Method of evaluation
Kinetics of micropore closure
[10] Humans (n = 6)
300 Confocal laser scanning microscopy
No dye present on skin surface at 15 minutes
[13] Humans (n = 1)
280 Optical coherence tomography
Micropores still visible at 85 minutes
[7] Humans (n = 13)
180 280
TEWL, methylene blue staining
TEWL: returned to baseline by 24 hours Staining: showed evidence of repair at 8 and 24 hours
[65] Hairless rats
500 TEWL, calcein imaging
TEWL: returned to baseline by 4 hours (unoccluded), but still not achieved by 72 hours under occlusion. Imaging: closure by 15 hours (unoccluded); channels still visible at 72 hours but not 120 hours (occluded).
[63] Hairless rats
370 770
TEWL, calcein imaging
TEWL: Returned to baseline by 4 to 5 hours (irrespective of MN length) Imaging: Closure by 12 hours (370 μm) or 18 hours (770 μm)
[69] Ex vivo / in vitro
150 500
1500
TEWL Returned to baseline by 2 hours (irrespective of MN length)
[14] Humans (n = 10)
500 750
1500
Impedance spectroscopy
Unoccluded: All sites returned to baseline by 2 hours Occluded: recovery to baseline dependent upon MN length and number: 500 μm, 50 MNs: 22 hours 750 μm, 10 MNs: 3 hours 750 μm, 50 MNs: 30 hours 750 μm, 50 MNs: 40 hours* 1500 μm, 10 MNs: 18 hours * needles were thicker than the other 750 μm arrays
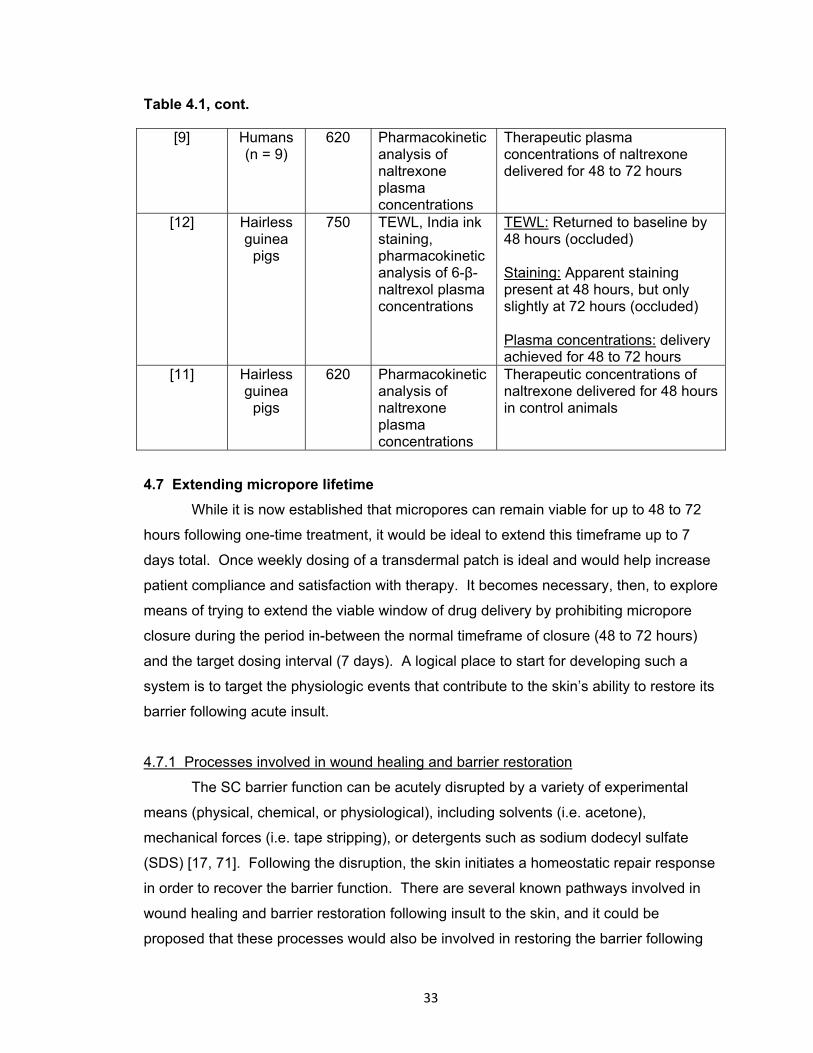
33
Table 4.1, cont.
[9] Humans (n = 9)
620 Pharmacokinetic analysis of naltrexone plasma concentrations
Therapeutic plasma concentrations of naltrexone delivered for 48 to 72 hours
[12] Hairless guinea
pigs
750 TEWL, India ink staining, pharmacokinetic analysis of 6-β-naltrexol plasma concentrations
TEWL: Returned to baseline by 48 hours (occluded) Staining: Apparent staining present at 48 hours, but only slightly at 72 hours (occluded) Plasma concentrations: delivery achieved for 48 to 72 hours
[11] Hairless guinea
pigs
620 Pharmacokinetic analysis of naltrexone plasma concentrations
Therapeutic concentrations of naltrexone delivered for 48 hours in control animals
4.7 Extending micropore lifetime
While it is now established that micropores can remain viable for up to 48 to 72
hours following one-time treatment, it would be ideal to extend this timeframe up to 7
days total. Once weekly dosing of a transdermal patch is ideal and would help increase
patient compliance and satisfaction with therapy. It becomes necessary, then, to explore
means of trying to extend the viable window of drug delivery by prohibiting micropore
closure during the period in-between the normal timeframe of closure (48 to 72 hours)
and the target dosing interval (7 days). A logical place to start for developing such a
system is to target the physiologic events that contribute to the skin’s ability to restore its
barrier following acute insult.
4.7.1 Processes involved in wound healing and barrier restoration
The SC barrier function can be acutely disrupted by a variety of experimental
means (physical, chemical, or physiological), including solvents (i.e. acetone),
mechanical forces (i.e. tape stripping), or detergents such as sodium dodecyl sulfate
(SDS) [17, 71]. Following the disruption, the skin initiates a homeostatic repair response
in order to recover the barrier function. There are several known pathways involved in
wound healing and barrier restoration following insult to the skin, and it could be
proposed that these processes would also be involved in restoring the barrier following
34
MN treatment, including 1) lipid synthesis; 2) cationic ion gradients in the skin; and 3) the
arachidonic acid pathway.
4.7.1.1 Lipid synthesis pathway: The lipids of the SC are the primary
determinant of the permeability barrier, affecting water transport, movement of
electrolytes, and drug penetration [17, 72]. This has been demonstrated by an inverse
correlation that has been noted between penetration of solutes and the weight of SC
lipids [72]. In addition to the extreme hydrophobicity of the extracellular lipids, the critical
molar ratio (1:1:1) of the 3 key species also contributes to the barrier function [73].
Under basal conditions, epidermal lipid synthesis is highly active and generally
independent of systemic influences, though it can be modified by external influences that
alter the SC barrier function [73]. Acute disruption of the barrier function stimulates a
characteristic sequence of recovery events that contributes to restoration of normal
function within approximately 48 – 72 hours [17, 73]. Within minutes of the insult,
contents of the lamellar bodies in the stratum granulosum cells are secreted, and this
leads to a notable decrease in the number of lamellar bodies that are found in the
stratum granulosum [17]. Newly formed lamellar bodies will begin to appear shortly in
the stratum granulosum cells, and this accelerated rate of secretion will continue until the
barrier function is returned to normal [17]. Of note, this process can be inhibited via
application of an impermeable membrane that artificially restores the barrier function
[17].
The sequence of events that is initiated to repair barrier function includes
accelerated synthesis of epidermal cholesterol, sphingolipids, and fatty acids [17, 72].
The timeframe of these events differs slightly in that the increase in cholesterol and fatty
acid synthesis occurs shortly after the barrier disruption (within 1 – 2 hours), whereas the
increase in sphingolipid synthesis is slightly delayed (6 – 9 hours) [17, 72]. These
events provide the basis for metabolic inhibitors as a potential means to inhibit barrier
recovery, thereby increasing SC permeability and improving transdermal delivery of drug
molecules [17, 21, 72]. In fact, it has been demonstrated that repair response can be
modulated via the use of pharmacological agents aimed specifically at inhibiting some
component of epidermal lipid synthesis [17, 21, 72]. In support of this concept, topical
HMG CoA reductase inhibitors (specifically lovastatin and fluvastatin) have been shown
to cause a delay in barrier recovery when applied to adult hairless mice. In these
studies, the kinetics of barrier recovery were delayed, while a barrier defect was also
noticed after several days of repeated daily application [17, 21, 72, 74, 75]. Co-
35
application of mevolanate (rate limiting step in the cholesterol synthesis pathway) or
cholesterol (distal product of the pathway) reverses the inhibition of barrier restoration,
thus suggesting that the delay is not related to nonspecific toxicity effects of the
inhibitors themselves [21, 73, 74]. When combined with the assessment of transdermal
delivery of the model compound lidocaine, the barrier disruption associated with the
topical application of fluvastatin correlated linearly with the extent of lidocaine disruption,
further supporting the notion of utilizing these pharmacologic agents to enhance
transdermal delivery techniques [72].
4.7.1.2 Cationic ion gradients: Calcium (Ca2+) is known to have several roles in
the skin. High concentrations of Ca2+ regulate differentiation of cultured keratinocytes,
and are involved with late epidermal differentiation events including conversion of
profilaggrin to filaggrin and activation of serine proteases and transglutaminase. Under
normal conditions, a steep gradient of Ca2+ ions exists in the epidermis, with
concentrations of ~180 mg/kg in the basal layer, and increasing to a peak of ~460 mg/kg
in the outer layers of the stratum granulosum. This gradient falls off steeply at the SC,
where the lowest levels of Ca2+ are present in the skin [76].
Following disruption of the permeability barrier (acetone treatment, tape stripping,
application of 2% SDS), the steep gradient of Ca2+ is dissipated, resulting in lower Ca2+
concentrations in the outermost layers of the skin. The peak of Ca2+ normally found in
the stratum granulosum layer falls by almost 4 fold, to ~128 mg/kg [76]. Concurrently,
the amount of Ca2+ in the epidermis actually increases slightly, suggesting that the skin
restores the gradient from below by moving Ca2+ up from deeper layers in the skin. The
decreased Ca2+ in the upper layers of the skin results in a characteristic sequence of
responses to repair the permeability barrier. These responses include: 1) secretion of
preformed lamellar bodies from the stratum granulosum cells; 2) increased assembly
and further secretion of lamellar bodies from stratum granulosum cells; 3) increased
synthesis of epidermal cholesterol, fatty acids, and sphingolipids; and 4) and increase
epidermal DNA synthesis.
Several bodies of evidence support the involvement of Ca2+ in maintaining or
repairing skin homeostasis. Following barrier disruption (via acetone treatment or tape
stripping), submersion of the skin in an isomolar sucrose or isotonic NaCl solution with
mM concentrations of calcium chloride (CaCl2) delays barrier recovery (measured with
TEWL). When submersion is performed with phosphate buffered saline solution with
added Ca2+, no increase in HMG CoA reductase activity is observed. Application of 1
36
μM ionomycin (a Ca2+ iontophore) to barrier disputed skin also delays barrier recovery
[77]. There was also no secretion of lamellar bodies, no localization of neutral lipids, and
a very thin stratum corneum/stratum granulosum domain.
In addition to the above mentioned studies demonstrating the role of extracellular
Ca2+ concentrations towards initiating barrier restoration processes, many of these
studies also suggest that high intracellular Ca2+, or at least high flux of Ca2+ into cells,
prevents lamellar body secretion. When verapamil or nifedipine (L-type, voltage
sensitive Ca2+ channel blockers) are added to the Ca2+- containing submersion solutions,
barrier recovery occurs at normal rates. Furthermore, addition of TMB-8 (to inhibit
translocation of Ca2+ from membrane bound vesicles into the cytosol) results in normal
recovery rates; addition of calmodulin inhibitor (trifluoperazine) generates the same
effect [67].
4.7.1.3 Arachidonic acid pathway: General skin wound healing follows 3 distinct
phases, the first phase involving inflammation at the site of injury [78]. This pathway
involves the conversion of arachidonic acid into downstream prostaglandins (belonging
to the family of eicosanoids), many of which are pro-inflammatory. The eicosanoids are a
class of lipid mediators that are oxygenated, hydrophobic derivatives of C20 fatty acids
[79]. This family is integrally involved in the body’s natural inflammation response, for
which arachidonic acid (20:4ω6) serves as the premier precursor [79]. The chemistry
involved in the biosynthetic pathway(s) of arachidonic acid metabolism is well known
[80]. Arachidonic acid can undergo oxygenation in a process regulated by the
cyclooxygenase (COX) enzymes [80, 81]. This leads to the formation of PGH2, a central
intermediate that is further metabolized to other downstream products, including both
pro- and anti-inflammatory prostaglandins (PGs) [80, 81]. There are currently 3
recognized isoforms of the COX enzymes [82]. COX-1 is a constitutively expressed
form that is considered to be a “housekeeping” enzyme, and under basal conditions is
found in almost all tissues. COX-1 is generally thought to be involved more in
homeostatic regulation at sites such as the platelets, kidney, and gastric mucosa [80,
83]. Conversely, COX-2 is considered an inducible form and an immediate early
response gene product involved primarily with the inflammatory response [80, 83].
COX-3 is a splice variant of COX-1, and its function is currently not well defined [82].
The conversion of arachidonic acid to downstream PGs via the action of the COX
pathway has been extensively researched since the 1970s when it was discovered that
the nonsteroidal anti-inflammatory drugs (NSAIDs) exhibit their anti-inflammatory effects
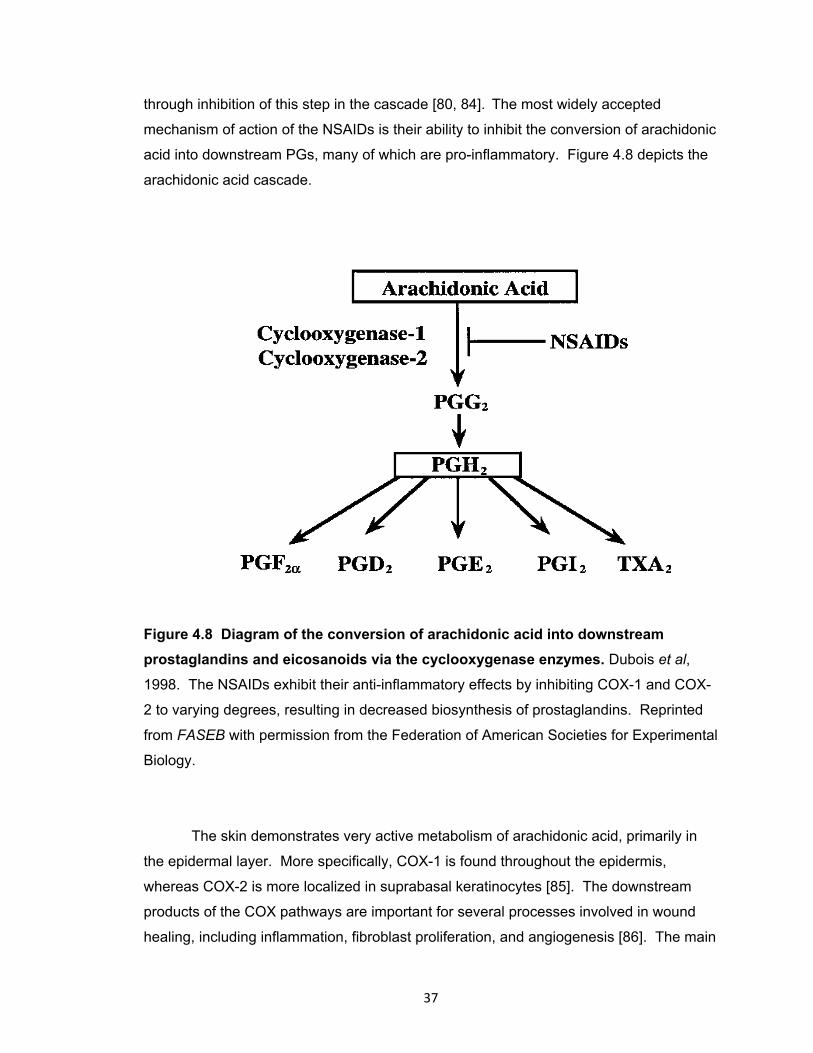
37
through inhibition of this step in the cascade [80, 84]. The most widely accepted
mechanism of action of the NSAIDs is their ability to inhibit the conversion of arachidonic
acid into downstream PGs, many of which are pro-inflammatory. Figure 4.8 depicts the
arachidonic acid cascade.
Figure 4.8 Diagram of the conversion of arachidonic acid into downstream
prostaglandins and eicosanoids via the cyclooxygenase enzymes. Dubois et al,
1998. The NSAIDs exhibit their anti-inflammatory effects by inhibiting COX-1 and COX-
2 to varying degrees, resulting in decreased biosynthesis of prostaglandins. Reprinted
from FASEB with permission from the Federation of American Societies for Experimental
Biology.
The skin demonstrates very active metabolism of arachidonic acid, primarily in
the epidermal layer. More specifically, COX-1 is found throughout the epidermis,
whereas COX-2 is more localized in suprabasal keratinocytes [85]. The downstream
products of the COX pathways are important for several processes involved in wound
healing, including inflammation, fibroblast proliferation, and angiogenesis [86]. The main
38
PG products formed via the COX pathway in the skin of many species (including
humans) are PGD2 and PGE2, both of which are pro-inflammatory [81]. PGE2 has also
been shown to regulate cytokine secretions and epidermal cell proliferation, and is
important for the pathophysiology of the skin [85, 87].
4.8 Naltrexone as an ideal model compound for exploring the kinetics of
micropore closure
In examining micropore closure kinetics specifically from a pharmacokinetic/drug
delivery standpoint, it is necessary to have a model compound that can be easily
detected in the plasma and has appropriate physicochemical characteristics for MN-
enhanced delivery. Naltrexone (NTX) is a mu opioid receptor antagonist that is FDA
approved for the treatment of opioid and alcohol abuse. As a receptor antagonist, the
therapeutic effects of NTX relate directly to its ability to block alcohol-induced “highs”
and intoxication, ultimately resulting in decreased craving and eventual relapse [88].
Multiple studies have demonstrated the efficacy of NTX in the treatment of alcohol
abuse, and it is significantly improved over placebo conditions with or without behavioral
therapies [89].
4.8.1 Challenges with current naltrexone formulations
NTX is currently available in oral tablet forms (Revia®, as naltrexone HCl) and an
injectable depot form (Vivitrol®, as naltrexone base, 380 mg extended release form
delivered as an intramuscular injection every 4 weeks). Despite the proven efficacy of
NTX in the treatment of alcohol and opioid abuse, there are multiple downfalls of both of
these dosage forms that create problems for chronic dosing scenarios. The oral
formulation exhibits unpredictable bioavailability (5 – 40%), due to its extensive first-pass
metabolism through the liver [90]. This creates challenges when trying to predict plasma
concentrations and response to therapy, and presents a therapeutic safety concern
when administered to alcoholics with pre-existing liver complications. The depot
injection, on the other hand, possesses a different array of adverse events and
therapeutic concerns. The FDA has received reports of injection site reactions with NTX
with this formulation, including hematomas, cellulitis, and necrosis. In a report issued in
August 2008, there had been 196 reports of injection site reactions, many of which
required serious medical attention (in 16 cases, surgery was required). Another serious
concern with the use of a depot formulation would arise in emergency situations when a
39
patient would have an acute requirement for pain control. High (and potentially unsafe)
doses of opioids would be required to overcome the narcotic blockade from the NTX,
resulting in the need for surgical removal of the depot.
In light of the downfalls of current NTX formulations, transdermal delivery would
provide several key advantages, specifically: 1) decreased potential for hepatotoxicity,
via avoidance of the first-pass effect; 2) simplicity of application and likely enhanced
patient compliance; and 3) ease of removal in the event of an acute need for emergency
pain relief.
4.8.2 Physicochemical properties of naltrexone favoring microneedle-enhanced delivery
Despite the clear benefits of transdermal delivery, NTX does not possess ideal
physicochemical characteristics to allow it to passive deliver through the SC. Most
specifically, it is not hydrophobic enough to passively transverse through the lipophilic
milieu of the SC (logP 1.8). Conversely, it does possess sufficient hydrophilicity to
partition into the interstitial fluid and aqueous environment in the deeper layers of the
skin. For these reasons, NTX is a poor candidate for traditional transdermal delivery, but
it is an ideal candidate for MN-enhanced delivery. The creation of aqueous channels
from MN insertion would provide a pathway for NTX to diffuse through the SC and into
the underlying circulation. Multiple studies in animals and humans have demonstrated
the feasibility of this technique for delivering NTX (and its metabolite, 6-β-NTXol) to
animals and humans [9, 11, 12, 91, 92]. Furthermore, validated methods exist for its
detection in plasma [93]. For these reasons, NTX is an excellent model compound for
studying MN-enhanced drug delivery and micropore closure kinetics.
Copyright © Nicole K. Brogden 2012
40
Chapter 5
Development of in vivo impedance spectroscopy techniques for measurement of
micropore formation
5.1 Introduction
Microneedle (MN) – assisted transdermal delivery represents a minimally
invasive physical enhancement technique that increases the permeability of the stratum
corneum (SC), the outermost layer of the skin [2, 5]. This allows for various types of
molecules to cross the otherwise impermeable outer layers of skin, including
macromolecules, proteins, and hydrophilic compounds. Several types of MN delivery
systems have been described, including hollow, coated, and dissolving MN systems [5].
In one of the simplest MN techniques, a solid MN array is applied to the skin to create
micron-scale pores (also called micropores) in the SC; application of a drug solution or
patch to the MN-treated area allows a drug to cross the skin into the systemic circulation
(a treatment paradigm known as the “poke (press) and patch” method) [5].
The “poke/press and patch” approach for MN insertion is particularly appealing
for a variety of reasons. The creation of micropores in the SC is a very simple process,
achieved by placing a MN array on the skin and applying gentle pressure for 10 – 15
seconds, followed by immediate removal of the MNs. This creates a grid of micropores
in the SC that can be utilized for drug delivery. The number of micropores can be
tailored for the requirements of the condition being treated, the amount of drug needed,
and the properties of the drug to be delivered. Second, a drug moiety can be delivered
from a variety of sources, including a patch, gel, or solution, providing flexibility in
application sites, drug volumes, and patch types. Lastly, the lifetime of the micropores in
the skin can be manipulated to allow for a variety of dosing schedules. When
unoccluded, the micropores reseal rapidly (approximately 15 minutes to 2 hours), but
this can be extended to 48 – 72 hours when the microporated skin is covered by an
occlusive patch [9, 10, 13, 14]. The micropore lifetime can be further extended via
topical application of a non-specific anti-inflammatory compound, diclofenac sodium,
allowing for drug delivery for up to 7 days [11].
The primary factors that influence drug delivery with the “poke/press and patch”
MN technique are 1) adequate formation of micropores in the skin, and 2) the lifetime of
the micropores in the SC. In order to continue expanding the utilization of this novel
drug delivery technique, it is important to develop appropriate in vivo models for
41
evaluating micropore formation and lifetime following MN treatment in animal models
and human subjects. Two commonly utilized methods to investigate the barrier function
of the skin include transepidermal water loss (TEWL) and impedance spectroscopy. The
SC is the skin’s primary means of preventing water loss from the body into the external
environment, and it also serves as the skin’s barrier to movement of ions (i.e. flow of
electrical current) [14, 94-97]. TEWL estimates water loss through the skin, derived from
the difference in vapor pressure between the skin and the area 4 mm above the skin
(REF). TEWL increases when the skin is damaged, while impedance decreases, thus
rendering these as complementary techniques for assessing the integrity of the skin’s
barrier; both have been demonstrated to be reliable techniques for such evaluations [94-
96]. The nature of transdermal patches is such that the skin remains occluded
underneath the patch for a timeframe of hours to days, resulting in a local increase in
skin hydration. This can create a substantial problem with TEWL readings when the
micropores in the SC begin to heal and subtle changes are difficult to discern from the
effects of the hydration alone. While impedance measurements are also somewhat
affected by hydration status, the technique is sensitive enough to detect changes in the
micropores under both hydrated and non-hydrated conditions, as the technique is less
sensitive overall to hydration effects [14]. Additionally, an impedance setup can be
devised that is cost effective, portable, and does not require any software to make
measurements – making this an ideal measurement technique for clinical settings.
Impedance measurements of the SC using various methods and techniques
have been described previously [94, 98], but there are limited publications describing the
use of this technique to evaluate micropore formation following MN treatment in animal
models or human subjects. Two animal models commonly used in percutaneous and
topical drug delivery studies include Yucatan miniature pigs (large animal model) and
hairless guinea pigs (small animal model). Porcine skin is the most similar to human skin
with regard to histological and biochemical properties including hair density, epidermal
thickness, and composition of intercellular SC lipids [99-101]. Hairless guinea pigs are
an excellent small model for permeability studies due to the ease of handling, smooth
skin devoid of hair, and histological characteristics similar to human skin [99, 102].
While these are well accepted models for studying permeation properties of xenobiotics
in vitro, these also serve as excellent in vivo models for method development studies.
The aim of this work was to develop sensitive and reproducible impedance
measurement techniques in two animal models (Yucatan miniature pig and hairless
42
guinea pigs) and human subjects, in order to monitor micropore formation in the SC.
The studies herein satisfy Research Plan 3.1.
5.2 Methods and materials
5.2.1 Microneedle arrays
Briefly, fixed MN geometries were cut into 50 μm thick stainless steel sheets
using chemical etching and were then manually bent perpendicular to the plane of their
metal substrate. MNs arrays contained 50 MNs arranged in a 5 x 10 array configuration;
each MN measured 800 µm in length and 200 µm in width at the base; the geometry and
configuration of the MN arrays were designed and provided by the Prausnitz lab at the
Georgia Institute of Technology. For better insertion and adhesion of patches to the
skin, microneedle arrays were assembled into adhesive patches with Arclad (Adhesives
Research, Inc., Glen Rock, PA). The adhesive serves to hold the MNs firmly against the
skin by compensating for the mechanical mismatch between the flexible skin tissue and
the rigid MN array. The MN patches were ethylene oxide sterilized before use.
5.2.2 Microneedle application
The same MN application technique was used for animal and human studies.
MN insertion is a simple procedure, achieved by placing the 50 MN array on the skin and
pressing gently for approximately 10 – 15 seconds and then immediately removed. The
array was rotated 45 degrees for a second insertion, in order to create 100 non-
overlapping micropores. The same investigator performed all MN insertions in order to
eliminate any inter-investigator variability.
5.2.3 Impedance spectroscopy techniques
Impedance measurements were made using Ag/AgCl measurement electrodes
and a large electrode with a conductive gel surface, which serves as the reference
electrode (Superior Silver Electrode with PermaGel, 70 mm total and active electrode
diameter [human and Yucatan pig studies] and 30 mm [hairless guinea pig studies];
Tyco Healthcare Uni-Patch, Wabasha, MN). Two different types of Ag/AgCl
measurement electrodes were evaluated: one has a dry active electrode measurement
surface (10 mm active electrode diameter; 25 mm x 25 mm total area; Thought
Technology T-3404; Stens Corporation, San Rafael, CA), while the other has foam, wet-
gel active electrode measurement surface (50 mm diameter, S&W Healthcare Corp,
43
Brooksville, FA). These types of measurement electrodes are often used for ECG
monitoring in a clinical setting, applied to clean dry skin. The reference electrode was
placed in the middle of the treatment area, equidistant from all treatment sites.
Measurements were made by connecting lead wires to the measurement and reference
electrodes, the opposite ends of the wires being connected to an impedance meter. This
applies a low frequency alternating current modified with a 200 kΩ resistor in parallel.
Figure 5.1 displays the impedance setup.
5.2.4 Animal study procedures
These studies were carried out in two animal models (Yucatan miniature pig and
hairless guinea pigs); all studies were approved by the University of Kentucky IACUC.
Six sites (Yucatan pig) or 4 sites (guinea pigs) on the dorsal surface were treated with
MN arrays. Half of the sites were evaluated with Ag/AgCl dry electrodes, while gel
Ag/AgCl electrodes were used at the remaining sites. Repeated baseline (pre-MN)
measurements were made at each site: 3 measurements using very light pressure to
hold the electrode to the skin, and 3 measurements using more direct pressure, applied
by the thumb of the investigator. The same procedure was followed immediately post-
MN treatment.
Two different treatment paradigms were investigated, to evaluate impedance
measurements made on normal (non-hydrated) vs. hydrated skin. For the hydrated
condition, the treatment sites were covered overnight with blank occlusive patches with
3M double-sided medical tape on one side to allow for the patches to adhere closely to
the skin; the patches were further secured in place with Bioclusive® waterproof tape.
The blank patches thus allowed the skin to locally hydrate under the overnight. Under
these conditions, the patches were removed one at a time and all measurements were
made at one site before moving to the next.
5.2.5 Clinical (human) study procedures
Healthy human volunteers between 18 – 45 years of age were interviewed and
examined to determine appropriateness for the study. Subjects were in general good
health (determined by the study physician) with no history of dermatologic disease. All
study procedures were approved by the University of Kentucky Institutional Review
Board and were completed according to the principles defined in the World Medical
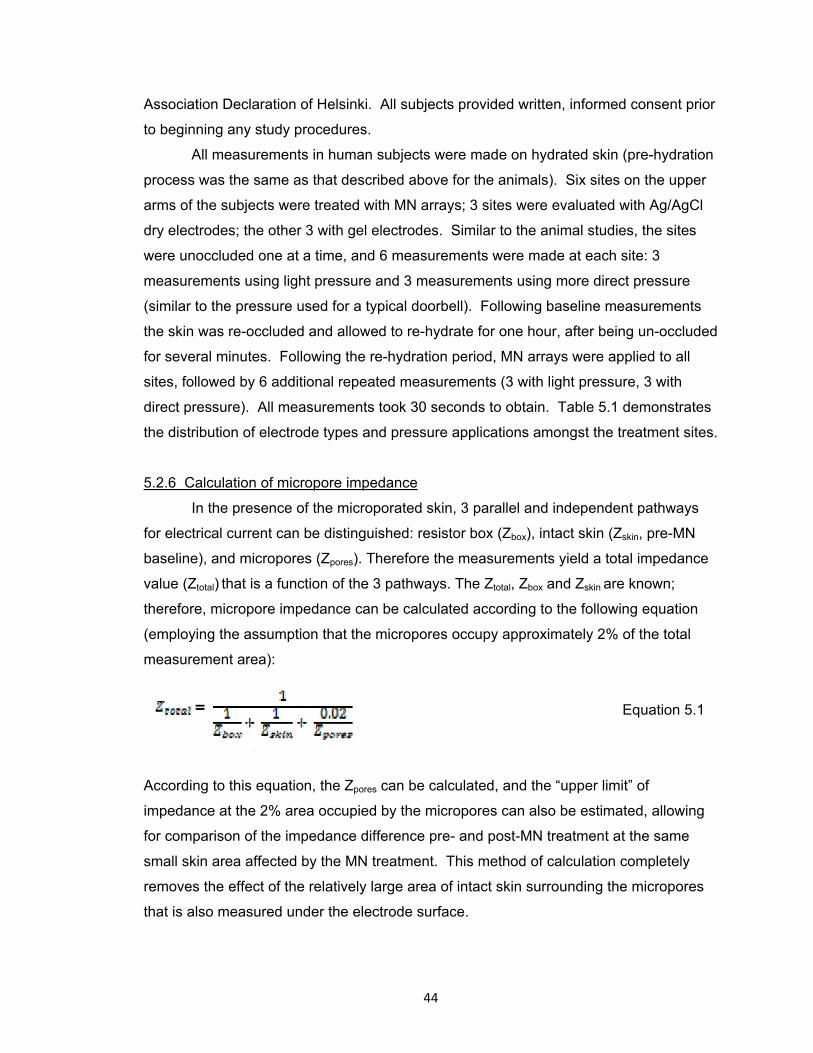
44
Association Declaration of Helsinki. All subjects provided written, informed consent prior
to beginning any study procedures.
All measurements in human subjects were made on hydrated skin (pre-hydration
process was the same as that described above for the animals). Six sites on the upper
arms of the subjects were treated with MN arrays; 3 sites were evaluated with Ag/AgCl
dry electrodes; the other 3 with gel electrodes. Similar to the animal studies, the sites
were unoccluded one at a time, and 6 measurements were made at each site: 3
measurements using light pressure and 3 measurements using more direct pressure
(similar to the pressure used for a typical doorbell). Following baseline measurements
the skin was re-occluded and allowed to re-hydrate for one hour, after being un-occluded
for several minutes. Following the re-hydration period, MN arrays were applied to all
sites, followed by 6 additional repeated measurements (3 with light pressure, 3 with
direct pressure). All measurements took 30 seconds to obtain. Table 5.1 demonstrates
the distribution of electrode types and pressure applications amongst the treatment sites.
5.2.6 Calculation of micropore impedance
In the presence of the microporated skin, 3 parallel and independent pathways
for electrical current can be distinguished: resistor box (Zbox), intact skin (Zskin, pre-MN
baseline), and micropores (Zpores). Therefore the measurements yield a total impedance
value (Ztotal) that is a function of the 3 pathways. The Ztotal, Zbox and Zskin are known;
therefore, micropore impedance can be calculated according to the following equation
(employing the assumption that the micropores occupy approximately 2% of the total
measurement area):
Equation 5.1
According to this equation, the Zpores can be calculated, and the “upper limit” of
impedance at the 2% area occupied by the micropores can also be estimated, allowing
for comparison of the impedance difference pre- and post-MN treatment at the same
small skin area affected by the MN treatment. This method of calculation completely
removes the effect of the relatively large area of intact skin surrounding the micropores
that is also measured under the electrode surface.
45
5.2.7 Transepidermal water loss (TEWL) measurements
In the hairless guinea pigs, TEWL was measured as a complementary technique
to impedance. TEWL measurements were made at baseline and post-MN treatment,
using an evaporimeter (cyberDERM, INC., Broomall, PA). Measurements were made by
simply placing the probe on the surface of the skin until the reading stabilized (the TEWL
is calculated by the device in units of g•m-2•h-1); each measurement took approximately
30 – 60 seconds to obtain.
5.2.8 Staining techniques
Skin staining was utilized in both animal models to visually confirm the presence
of micropores in the SC. Gentian violet stains microporated skin sites, making this a
quick and effective means of visualizing the sites where microneedles were inserted into
the skin [103]; in the presence of micropores, a grid can be clearly visualized. Following
MN treatment the dye was applied to the skin for approximately one minute, followed by
removal of excess dye with isopropanol alcohol wipes. A non-treated site was also
stained as a control.
5.2.9 Data analysis
Student’s t tests were used to compare the calculated impedance of the
micropores (Zpores, calculations described above) to pre-MN baseline impedance values
at that same site; the same statistical tests were used to compare pre and post-MN
TEWL values. p < 0.05 was considered statistically significant (GraphPad Prism®
software, version 5.04).
5.3 Results
5.3.1 Animal studies
5.3.1.1 Hairless guinea pigs: Male and female hairless guinea pigs (n = 3, mean
(± SD) weight of 785 ± 51 g) were treated with MNs at 4 independent sites on the dorsal
surface. Due to the smaller surface area of the animals, only 4 sites were treated rather
than 6 sites as in humans and the Yucatan pig. All studies were performed on both non
pre-hydrated and pre-hydrated skin, to confirm that similar trends would be observed
irrespective of skin hydration status. Impedance measurements were made at each site
pre- and post-MN, and a TEWL measurement was taken immediately following the
impedance measurement at all sites. Impedance measurements dropped significantly
46
baseline to post-MN (p < 0.05, Student’s t-test) at all sites, irrespective of skin hydration
status, electrode type, or pressure applied. The conditions that resulted in the lowest
amount of variability in the guinea pigs were dry electrodes, applied with direct pressure.
On non pre-hydrated skin, mean (± SD) %RSD on pre-MN and post-MN skin were 22.4
± 11.1% (range 3.2 – 35.4%) and 5.9 ± 2.5% (3.9 – 9.8%), respectively, compared to
pre-MN values of 10.8 ± 7.1% (3.4 – 23.5%) and post-MN 19.9 ± 10.0% (6.0 – 29.5%)
for gel electrodes under the same conditions. All %RSD values for hydrated and non
pre-hydrated skin made with dry electrodes, direct pressure can be seen in Table 5.3,
and representative impedance measurements can be seen in Figure 5.1.
TEWL values were low at baseline regardless of skin hydration, confirming an
intact barrier function. Mean (± SD) baseline TEWL values were 2.0 ± 0.69 g•m-2•h-1
(non pre-hydrated) and 20.2 ± 2.3 g•m-2•h-1 (pre-hydrated). A significant rise in TEWL
was observed after MN treatment at all sites (p < 0.05, Student’s t-test), with post-MN
measurements on non pre-hydrated and pre-hydrated skin of 27.4 ± 7.6 g•m-2•h-1 and
47.4 ± 17.7 g•m-2•h-1, respectively. Representative TEWL measurements are displayed
in Figure 5.2.
In order to visualize the micropores using a third independent means of
evaluating MN insertion, one guinea pig was treated on non pre-hydrated skin at an
additional site with one application of a 50 MN array, followed by staining with gentian
violet. As seen in Figure 5.2, a grid in the SC can clearly be visualized, demonstrating
the presence of 50 non-overlapping micropores. No staining was observed at the control
site when gentian violet was applied to intact skin.
5.3.1.2 Yucatan miniature pig: One male Yucatan miniature pig (weighing
approximately 60 kg) was treated with MN arrays at 6 independent sites on the dorsal
surface and repeated impedance measurements were made pre- and post-MN
treatment on pre-hydrated vs. non pre-hydrated skin. A total of 72 measurements were
made on pre-hydrated skin; the same number of measurements were made on non pre-
hydrated skin; one measurement was thrown out as an outlier from the pre-MN
measurements under pre-hydrated conditions. Similar to the guinea pigs, a significant
drop in impedance was seen following MN treatment at all sites (p < 0.05, Student’s t-
test), irrespective of skin hydration status, electrode type, or pressure applied In the pig,
the lowest overall variability under both hydration conditions was observed with gel
electrode measurements applied with direct pressure, as demonstrated by lower %RSD
values. For non pre-hydrated skin, mean (± SD) %RSD on pre-MN and post-MN skin
47
were 13.9 ± 2.6 (range 10.8 – 15.3%) and 4.1 ± 1.8% (2.3 – 5.5%), respectively,
compared to pre-MN values of 15.1 ± 9.0% (7.0 – 24.8%) and post-MN 4.7 ± 5.3% (1.0 –
10.8%) for dry electrodes under the same conditions. Table 5.3 displays all %RSD
values from measurements made with gel electrodes applied with direct pressure.
In the same manner as applied to the guinea pig, one additional (non pre-
hydrated) site was treated with a MN array to create 50 micropores (rather than the 100
micropores used for the impedance measurements) and stained with gentian violet dye.
All 50 micropores could be clearly seen in the skin, confirming the breach in the SC and
the formation of 50 independent micropores (image not shown). Additionally, the non-
MN treated control site did not display any staining patterns following removal of the dye.
5.3.2 Human studies
Four males and six females completed the protocol; mean (± SD) age was 27 ±
4.1 years. General demographics are described in Table 5.2. Six sites were treated on
the upper arm of each subject; impedance measurements were made pre- and post-MN
treatment with dry Ag/AgCl electrodes (3 sites) and gel Ag/AgCl electrodes (3 sites)
applied with light or direct pressure (applied by the thumb of the investigator (the applied
pressure was similar to the force used to ring a doorbell). Based on this study design, a
total of 360 measurements were made for each electrode type, further divided into 180
baseline pre-MN measurements (90 measurements with light pressure; 90
measurements with direct pressure) and 180 post-MN measurements, also divided
equally between light and direct pressure techniques. A total of 331 measurements
were analyzed across the 10 subjects. All MN applications were well tolerated and no
infection or irritation was seen at any MN treatment sites. Some subjects experience
mild irritation from the Bioclusive® tape that was used to secure the occlusive patches to
the skin for the overnight hydration period. The irritation resolved completely following a
short course of topical steroid treatment.
Mean impedance values dropped significantly from baseline to post-MN for all
treatment sites, irrespective of pressure or electrode type (p <0.05, Student’s t test). The
overall variability was lowest with gel electrodes, particularly for the calculated
impedance of the micropores. In several subjects there was no variation at all between
the 3 measurements made post-MN. The mean ± SD pre-MN and post-MN %RSD was
9.7 ± 6.1% (0.8 – 24.1%) and 2.4 ± 3.0% (0.00 – 11.8%) respectively, across all 10
subjects. A representative profile from one subject is shown in Figure 5.3.
48
5.4 Discussion
MN technologies offer a wide range of flexibility as a drug delivery technique in
that several parameters can be modified to meet specific therapeutic needs; such
parameters include the delivery method, geometry of the needles, drug formulation, re-
sealing kinetics of the micropores, and type of drug moiety. In the realm of a
“poke/press and patch” MN technique, adequate formation of micropores is critical to the
success of the delivery approach. A variety of methods are available for evaluating
micropore formation in the SC, including optical coherence tomography, confocal
microscopy, infrared spectroscopy, impedance spectroscopy, and TEWL. Most of these
techniques, while effective for visualizing and evaluating micropore formation, require
equipment and software that are less convenient and user-friendly than what is desired
in a clinical research environment. The impedance setup described in these studies is
portable, requires very little training to use, and has no need for software to obtain
measurements, making it ideal for a range of clinical environments as well as animal
studies.
5.4.1 Differences between skin conditions and measurement techniques
In both animal models and in human subjects, measurements were noisy and
somewhat erratic on pre-MN, intact skin (regardless of hydration status). This is not
unexpected, as it represents the skin’s effective barrier in preventing the movement of
current between the internal and external environments; similar results have been
observed previously when impedance methods were used to monitor micropore closure
kinetics in human subjects [14]. The post-MN measurements were less variable and
noisy, likely due to creation of an un-impeded and consistent pathway for movement of
the current. An overall trend was observed that the measurements were generally lower
when more direct pressure was applied to the electrode during the measurement,
regardless of dry vs. gel electrode, or pre- vs. post-MN. This is likely due to enhanced
contact between the electrode surface and the skin, providing a more consistent (and
hence less tortuous) pathway for the current to travel. Additionally, the measurements
using gel electrodes were generally more stable and did not fluctuate during the
measurements, as compared to the dry electrodes (both light and direct pressure). This
was observed for intact and post-MN treated skin, but was most notable on MN-treated
skin. This could be the case for a variety of reasons. First, the gel provides a pathway
of lesser resistance compared to the dry electrodes, as the gel provides an aqueous
49
pathway for the current to move across. Second, the gel surface likely creates
enhanced contact between the electrode and the micropores, which would result in a
lower impedance measurement due to the higher number of micropores present in a
small measurement area. This would also help explain why measurements are
consistently lower with direct pressure measurements when compared to light pressure
techniques with the same electrode type. The direct pressure would allow for better
contact with the whole grid of 100 micropores, whereas lighter pressure might not
provide complete contact between all of the micropores under the small electrode
surface. Thus, the optimal situation would be to make measurements with the gel
electrodes while applying direct pressure to maintain close contact between the
electrode and the skin. In fact, this is consistent with our observation that the lowest
variability was observed in human subjects and the Yucatan pig when this technique
was used.
Due to typical inter-subject variation, some subjects have naturally lower baseline
impedance measurements in general (regardless of electrode type). In these situations
it can make the difference between baseline and post-MN treatment somewhat more
difficult to interpret from the raw impedance values (Ztotal). Despite this potential
challenge it is not likely be clinically significant, as 1) it is not a uniform concern across
all subjects, and 2) the calculation of Zpores clearly distinguishes that the SC has been
sufficiently breached, despite a seemingly small difference in the raw values pre-and
post-MN.
5.4.2 Skin hydration
In half of the animal experiments and all of the human studies, measurements
were made on skin that had been pre-hydrated during an overnight occlusion period.
The hydration status represents the truest clinical scenario for transdermal delivery
systems, in which the skin remains occluded for hour to days under a patch, resulting in
an increase in local skin hydration. Anytime the skin is occluded after MN treatment (the
typical situation for the “poke/press and patch method”), impedance measurements for
the resulting treatment period would be made on hydrated skin. While MNs would not
likely be applied to pre-hydrated skin in clinical practice, in a controlled research setting
the pre-hydration removes an additional variable in the impedance setup (dry vs.
hydrated skin, a discrepancy that would arise if the baseline measurements were made
on dry skin but all other measurements were made on skin that had been occluded). For
50
these reasons, we explored the impedance techniques on non pre-hydrated AND pre-
hydrated skin in the animal models. As demonstrated by the results (in both animal
models), the skin’s hydration status does not affect the efficiency of MN insertion into the
skin, nor does it affect the ability of the impedance setup to determine that the barrier
has been breached. The primary difference observed between the hydration states was
that the baseline measurements were somewhat more erratic on non pre-hydrated skin,
as demonstrated by greater %RSD values. However, the absolute values of the
baseline measurements are not as critical because the MN treatment produces such a
clear effect on the impedance measurements. Furthermore, in a situation when
micropore impedance would be followed over time (during which time the skin would
hydrate under a patch), a non-MN treated control site under the same conditions would
be used in the equation for calculating Zpores, thus removing the need for the initial
baseline value after the first measurement. For these reasons, it would be suitable to
use impedance methods for measuring micropore formation in a typical clinical scenario,
when human subjects would be treated on dry baseline skin.
5.4.3 Impedance measurements for assessing micropore closure kinetics
One novel application that impedance measurements are well suited for is
monitoring micropore lifetime under various conditions after one application of a MN
array, by following the Zpores value over time. To be used in this setting, however, it was
necessary to develop a measurement setup that minimizes variability between
measurements, in order to accurately characterize the kinetics of micropore closure. As
the micropores begin to heal the measurements would be expected to become more
erratic as the biological processes in the skin begin to restore the intact barrier baseline.
In fact, this trend is consistent with previous reports in human subjects treated with MNs
of varying geometries, using an identical setup with dry Ag/AgCl electrodes [14].
Investigators in this study found that a significant amount of experimental noise was
present when measurements were made on intact skin, but this was not the case on
microporated skin, irrespective of the geometry of the MN array applied (varied number
or length of the MNs). For this reason it is imperative to have a measurement technique
that introduces the least amount of variability, such that the variations observed are
directly reflective of the skin re-sealing, rather than the measurement technique itself.
In the current study, the Zpores value was calculated apart from the total
impedance measurement that was comprised of 3 parallel pathways. By calculating the

51
upper limit of the impedance values expected at the 2% area occupied by the
micropores, the Zpores can be followed over time until it reaches the upper limit, at which
times the micropores would be considered “closed” or “re-sealed”. While this method
has the advantage of providing a clear numerical target for evaluating when the
micropores have completely healed, it could be perceived to falsely exaggerate the
difference between pre- and post-MN impedance values. Thus, it is important to
evaluate the formation of the micropores with an alternative method to ensure the
applicability of the current methods. An additional method that would be suitable for
monitoring micropore formation and closure kinetics over time would be to calculate the
permeable area (Apermeable) of all micropores created by the application of a MN array,
according to the following equation, as described by Gupta et al [14]:
Equation 5.2
where ρ represents the electrical resistivity of interstitial fluid present in the skin (~78 Ω-
cm), L is an estimate of the thickness of the SC (approximately 15 μm over most parts of
the body), and Z is the absolute impedance measured. Under the technique that
generated the least amount of variability in human subjects (gel electrodes applied with
direct pressure), this equation results in a range of total permeable area spanning from
4.65 x 10⁻⁴ mm2 to 2.81 x 10⁻³ mm2; these values are less than the cross-section of a
human hair. Furthermore, the radii of each individual micropore can be calculated
(assuming a circular cross section and that each micropore contributes 1/100 of the total
Apermeable). According to these assumptions, the mean (± SD) radii of the individual
micropores was 1.97 ± 0.51 μm, which is remarkably consistent with previous estimates
of an effective radius of ~2 μm [14, 42]. In a similar manner, a limit of the Apermeable can
be estimated based on pre-MN measurements, which would also provide a numerical
target for reaching the conclusion that the micropores have been re-sealed. Thus, our
method demonstrated adequate formation of micropores in the SC based on the Zpores,
and the suitability of this method is confirmed by the similarity of our data with previous
reports, based on the alternative calculation of the Apermeable.
The use of impedance spectroscopy is particularly appealing in that it can be
used to evaluate MN treatment parameters and micropore closure kinetics, but that it
could also be expanded to evaluate other physical enhancement techniques that also
create pores in the skin (i.e. thermal ablation, electroporation, etc.). For that reason, this
52
method of measurement is well suited for a variety of scenarios in clinical and research
environments .
5.5 Conclusions
In summary, this is the first methods development study to explore various
impedance spectroscopy conditions to minimize experimental variability when monitoring
micropore formation in animal models and human subjects. The impedance setup
allows for great flexibility that can be tailored to the conditions of MN treatment (varying
hydration status, different animal models, different electrode types and pressure
applications) and is highly appropriate for clinical research setting. Additionally, the
impedance of the micropores can be specifically calculated, or the permeable area of the
microporated skin can be determined, allowing for various means for comparing the
effectiveness of treatment and monitoring the closure of the micropores over time.
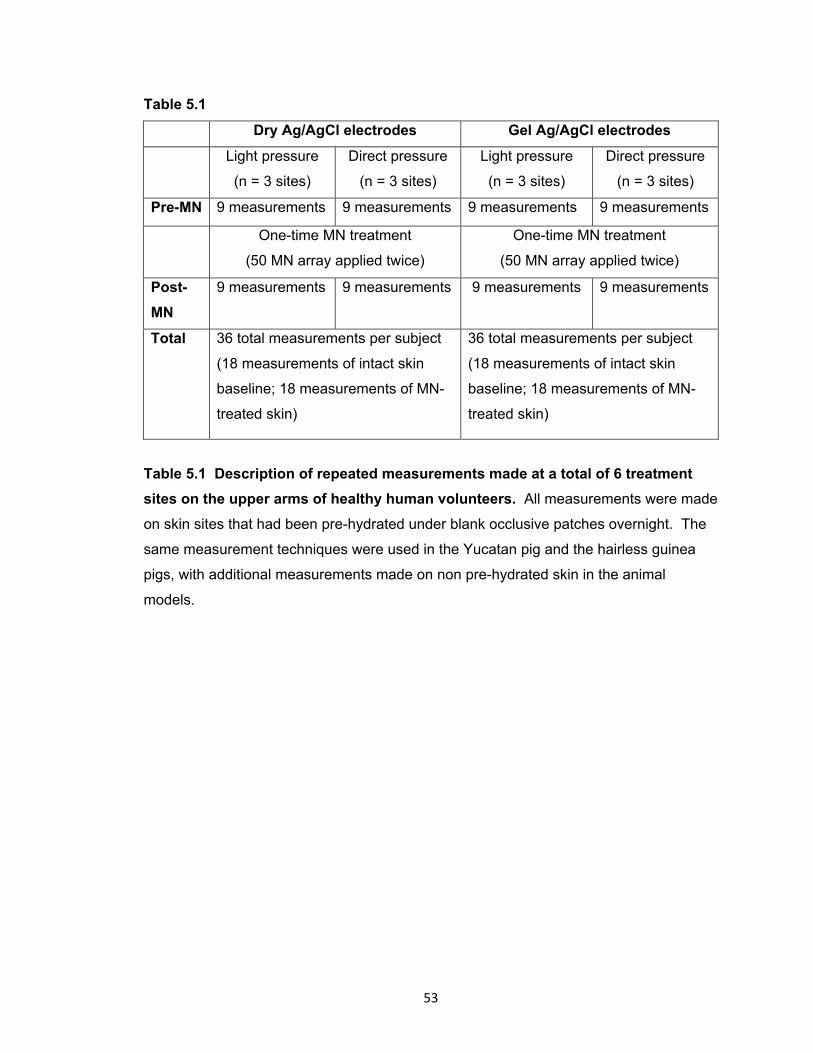
53
Table 5.1
Dry Ag/AgCl electrodes Gel Ag/AgCl electrodes
Light pressure
(n = 3 sites)
Direct pressure
(n = 3 sites)
Light pressure
(n = 3 sites)
Direct pressure
(n = 3 sites)
Pre-MN 9 measurements 9 measurements 9 measurements 9 measurements
One-time MN treatment
(50 MN array applied twice)
One-time MN treatment
(50 MN array applied twice)
Post-
MN
9 measurements 9 measurements 9 measurements 9 measurements
Total 36 total measurements per subject
(18 measurements of intact skin
baseline; 18 measurements of MN-
treated skin)
36 total measurements per subject
(18 measurements of intact skin
baseline; 18 measurements of MN-
treated skin)
Table 5.1 Description of repeated measurements made at a total of 6 treatment
sites on the upper arms of healthy human volunteers. All measurements were made
on skin sites that had been pre-hydrated under blank occlusive patches overnight. The
same measurement techniques were used in the Yucatan pig and the hairless guinea
pigs, with additional measurements made on non pre-hydrated skin in the animal
models.
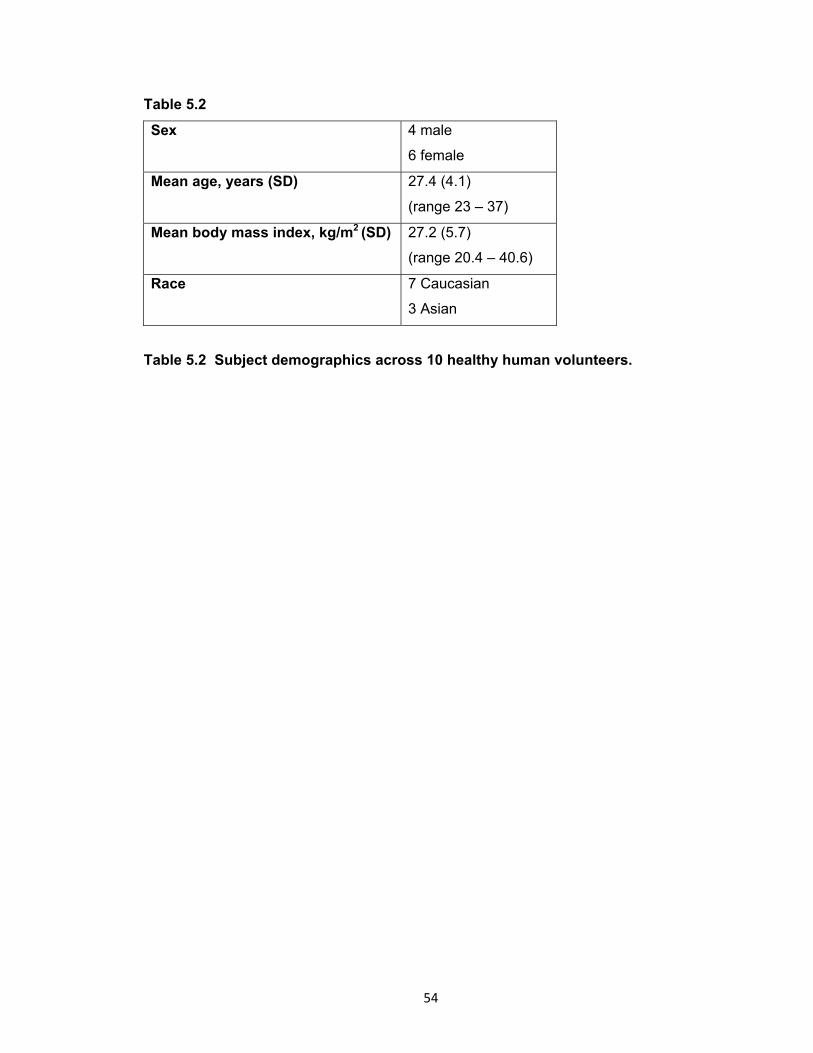
54
Table 5.2
Sex 4 male
6 female
Mean age, years (SD) 27.4 (4.1)
(range 23 – 37)
Mean body mass index, kg/m2 (SD) 27.2 (5.7)
(range 20.4 – 40.6)
Race 7 Caucasian
3 Asian
Table 5.2 Subject demographics across 10 healthy human volunteers.
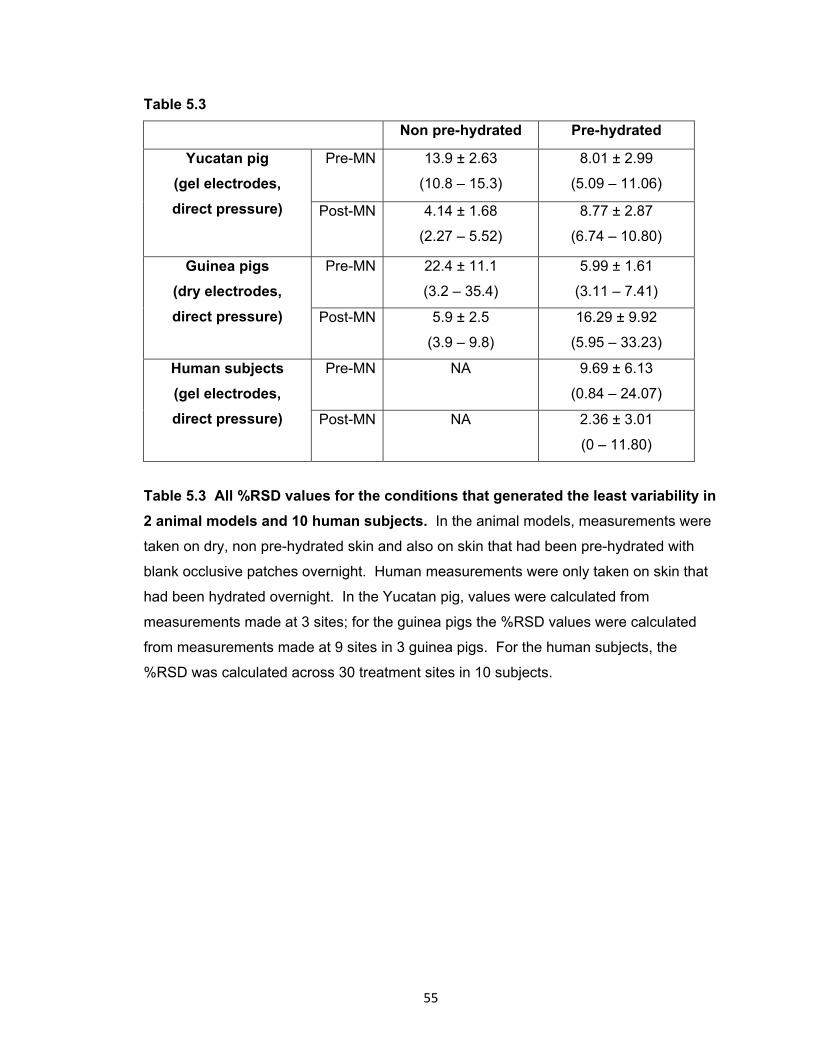
55
Table 5.3
Non pre-hydrated Pre-hydrated
Yucatan pig
(gel electrodes,
direct pressure)
Pre-MN 13.9 ± 2.63
(10.8 – 15.3)
8.01 ± 2.99
(5.09 – 11.06)
Post-MN 4.14 ± 1.68
(2.27 – 5.52)
8.77 ± 2.87
(6.74 – 10.80)
Guinea pigs
(dry electrodes,
direct pressure)
Pre-MN 22.4 ± 11.1
(3.2 – 35.4)
5.99 ± 1.61
(3.11 – 7.41)
Post-MN 5.9 ± 2.5
(3.9 – 9.8)
16.29 ± 9.92
(5.95 – 33.23)
Human subjects
(gel electrodes,
direct pressure)
Pre-MN NA
9.69 ± 6.13
(0.84 – 24.07)
Post-MN NA
2.36 ± 3.01
(0 – 11.80)
Table 5.3 All %RSD values for the conditions that generated the least variability in
2 animal models and 10 human subjects. In the animal models, measurements were
taken on dry, non pre-hydrated skin and also on skin that had been pre-hydrated with
blank occlusive patches overnight. Human measurements were only taken on skin that
had been hydrated overnight. In the Yucatan pig, values were calculated from
measurements made at 3 sites; for the guinea pigs the %RSD values were calculated
from measurements made at 9 sites in 3 guinea pigs. For the human subjects, the
%RSD was calculated across 30 treatment sites in 10 subjects.
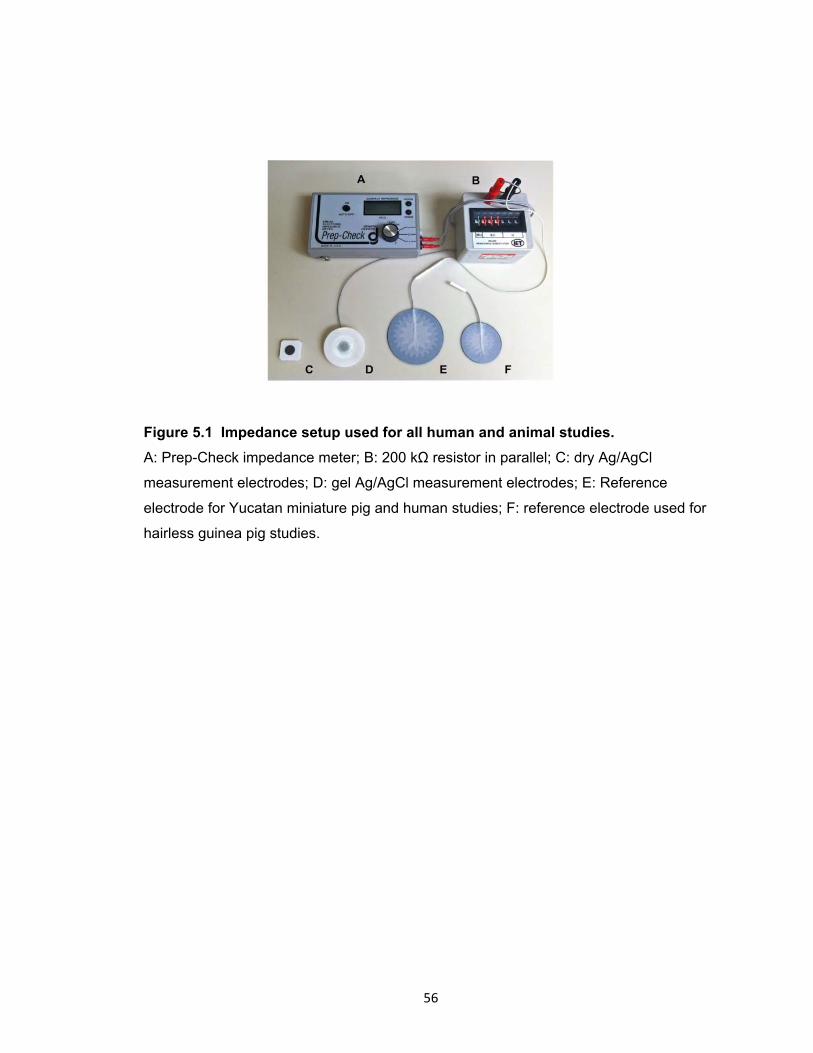
56
Figure 5.1 Impedance setup used for all human and animal studies.
A: Prep-Check impedance meter; B: 200 kΩ resistor in parallel; C: dry Ag/AgCl
measurement electrodes; D: gel Ag/AgCl measurement electrodes; E: Reference
electrode for Yucatan miniature pig and human studies; F: reference electrode used for
hairless guinea pig studies.
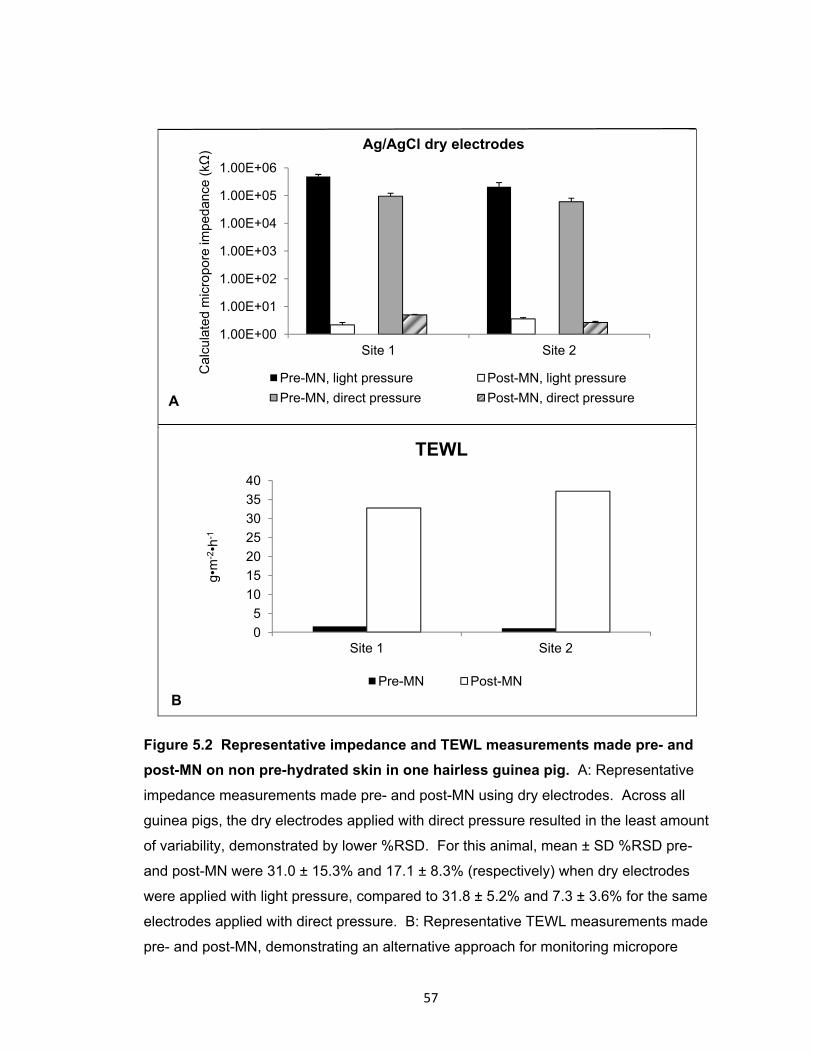
57
Figure 5.2 Representative impedance and TEWL measurements made pre- and
post-MN on non pre-hydrated skin in one hairless guinea pig. A: Representative
impedance measurements made pre- and post-MN using dry electrodes. Across all
guinea pigs, the dry electrodes applied with direct pressure resulted in the least amount
of variability, demonstrated by lower %RSD. For this animal, mean ± SD %RSD pre-
and post-MN were 31.0 ± 15.3% and 17.1 ± 8.3% (respectively) when dry electrodes
were applied with light pressure, compared to 31.8 ± 5.2% and 7.3 ± 3.6% for the same
electrodes applied with direct pressure. B: Representative TEWL measurements made
pre- and post-MN, demonstrating an alternative approach for monitoring micropore
1.00E+00
1.00E+01
1.00E+02
1.00E+03
1.00E+04
1.00E+05
1.00E+06
Site 1 Site 2
Cal
cula
ted
mic
ropo
re im
peda
nce
(kΩ
) Ag/AgCl dry electrodes
Pre-MN, light pressure Post-MN, light pressure
Pre-MN, direct pressure Post-MN, direct pressure
0
5
10
15
20
25
30
35
40
Site 1 Site 2
g•m
-2•h
-1
TEWL
Pre-MN Post-MN
A
B

58
formation in the SC (TEWL measurements were not made in triplicate like the
impedance measurements; this figure represents single measurements). Baseline
TEWL measurements were 1.6 and 1.1 g•m-2•h-1 at Sites 1 and 2, respectively,
compared to post-MN measurements of 32.8 and 37.2 g•m-2•h-1at the same sites.
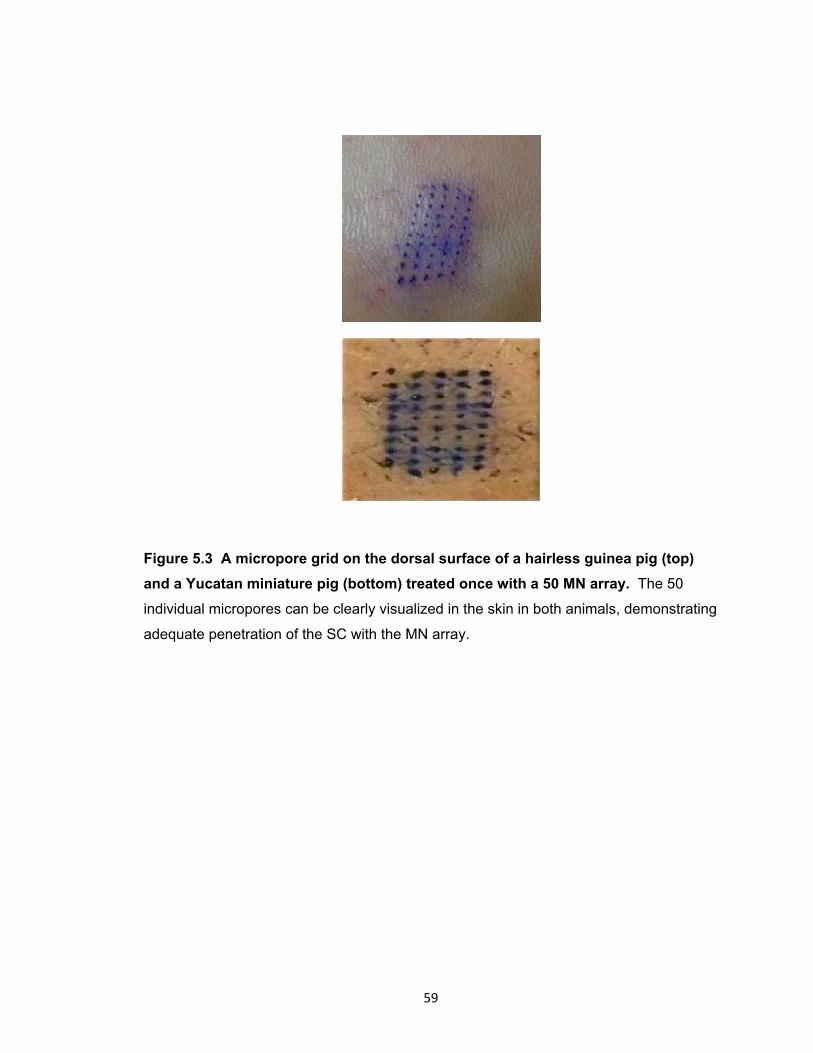
59
Figure 5.3 A micropore grid on the dorsal surface of a hairless guinea pig (top)
and a Yucatan miniature pig (bottom) treated once with a 50 MN array. The 50
individual micropores can be clearly visualized in the skin in both animals, demonstrating
adequate penetration of the SC with the MN array.
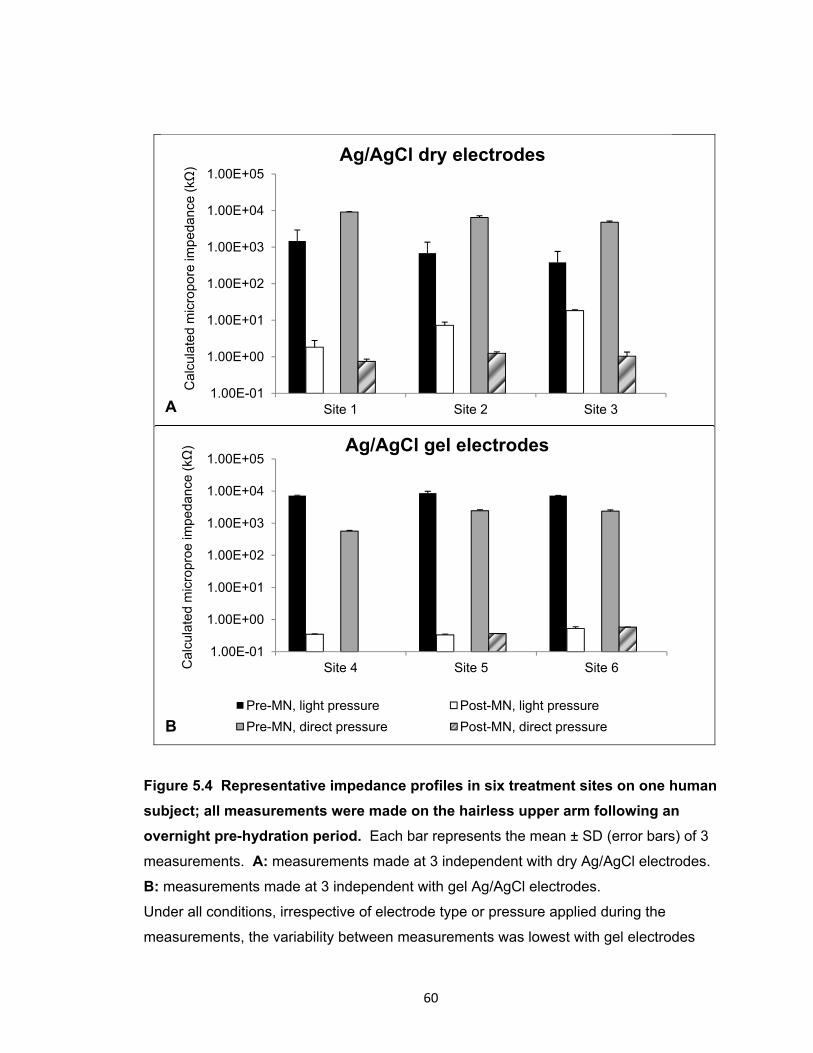
60
Figure 5.4 Representative impedance profiles in six treatment sites on one human
subject; all measurements were made on the hairless upper arm following an
overnight pre-hydration period. Each bar represents the mean ± SD (error bars) of 3
measurements. A: measurements made at 3 independent with dry Ag/AgCl electrodes.
B: measurements made at 3 independent with gel Ag/AgCl electrodes.
Under all conditions, irrespective of electrode type or pressure applied during the
measurements, the variability between measurements was lowest with gel electrodes
1.00E-01
1.00E+00
1.00E+01
1.00E+02
1.00E+03
1.00E+04
1.00E+05
Site 1 Site 2 Site 3
Cal
cula
ted
mic
ropo
re im
peda
nce
(kΩ
)
Ag/AgCl dry electrodes
1.00E-01
1.00E+00
1.00E+01
1.00E+02
1.00E+03
1.00E+04
1.00E+05
Site 4 Site 5 Site 6Cal
cula
ted
mic
ropr
oe im
peda
nce
(kΩ
) Ag/AgCl gel electrodes
Pre-MN, light pressure Post-MN, light pressure
Pre-MN, direct pressure Post-MN, direct pressure
A
B
61
applied with direct pressure. For this subject, mean (± SD) %RSD with gel electrodes
under direct application for pre-MN was 7.86 ± 2.09% (range 5.59 – 9.70%), and 0.58 ±
0.54% (range 0.00 – 1.07%) for post-MN. Under the same conditions (direct pressure)
for the dry electrodes, the mean %RSD pre-MN was 8.59 ± 3.82% (range 4.71 –
12.35%) and 18.0 ± 10.1% (range 9.68 – 29.29%) for post-MN.
Copyright © Nicole K. Brogden 2012
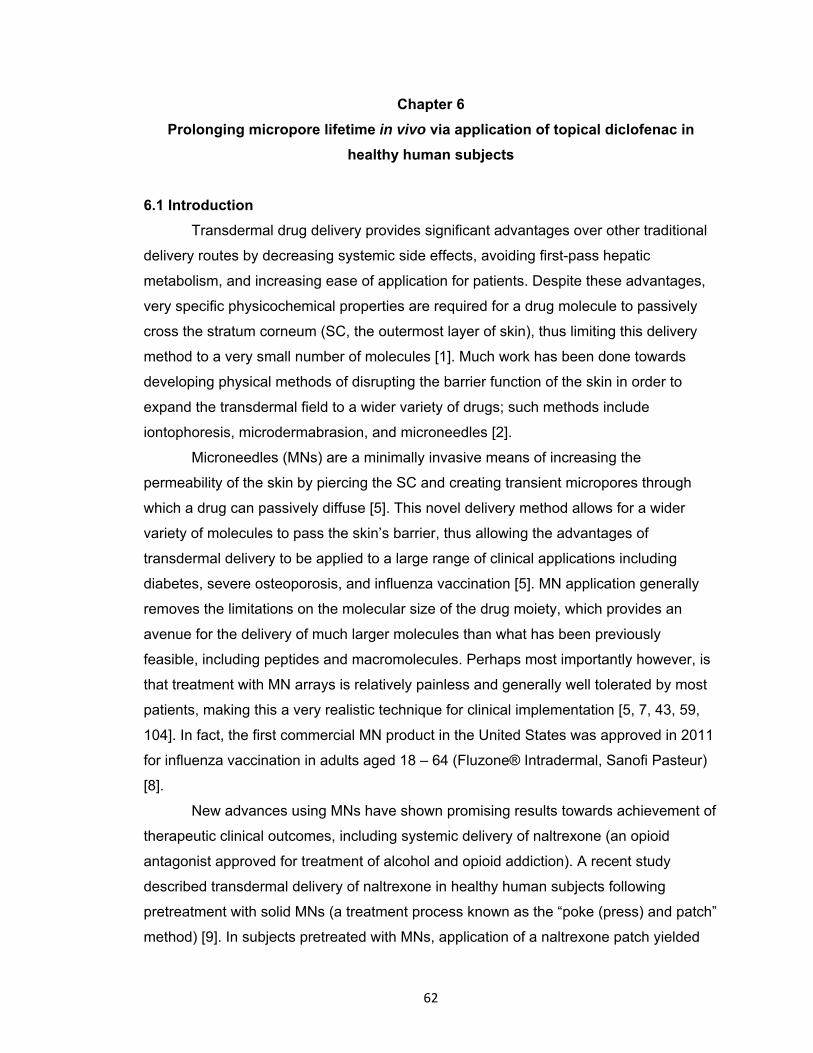
62
Chapter 6
Prolonging micropore lifetime in vivo via application of topical diclofenac in
healthy human subjects
6.1 Introduction
Transdermal drug delivery provides significant advantages over other traditional
delivery routes by decreasing systemic side effects, avoiding first-pass hepatic
metabolism, and increasing ease of application for patients. Despite these advantages,
very specific physicochemical properties are required for a drug molecule to passively
cross the stratum corneum (SC, the outermost layer of skin), thus limiting this delivery
method to a very small number of molecules [1]. Much work has been done towards
developing physical methods of disrupting the barrier function of the skin in order to
expand the transdermal field to a wider variety of drugs; such methods include
iontophoresis, microdermabrasion, and microneedles [2].
Microneedles (MNs) are a minimally invasive means of increasing the
permeability of the skin by piercing the SC and creating transient micropores through
which a drug can passively diffuse [5]. This novel delivery method allows for a wider
variety of molecules to pass the skin’s barrier, thus allowing the advantages of
transdermal delivery to be applied to a large range of clinical applications including
diabetes, severe osteoporosis, and influenza vaccination [5]. MN application generally
removes the limitations on the molecular size of the drug moiety, which provides an
avenue for the delivery of much larger molecules than what has been previously
feasible, including peptides and macromolecules. Perhaps most importantly however, is
that treatment with MN arrays is relatively painless and generally well tolerated by most
patients, making this a very realistic technique for clinical implementation [5, 7, 43, 59,
104]. In fact, the first commercial MN product in the United States was approved in 2011
for influenza vaccination in adults aged 18 – 64 (Fluzone® Intradermal, Sanofi Pasteur)
[8].
New advances using MNs have shown promising results towards achievement of
therapeutic clinical outcomes, including systemic delivery of naltrexone (an opioid
antagonist approved for treatment of alcohol and opioid addiction). A recent study
described transdermal delivery of naltrexone in healthy human subjects following
pretreatment with solid MNs (a treatment process known as the “poke (press) and patch”
method) [9]. In subjects pretreated with MNs, application of a naltrexone patch yielded
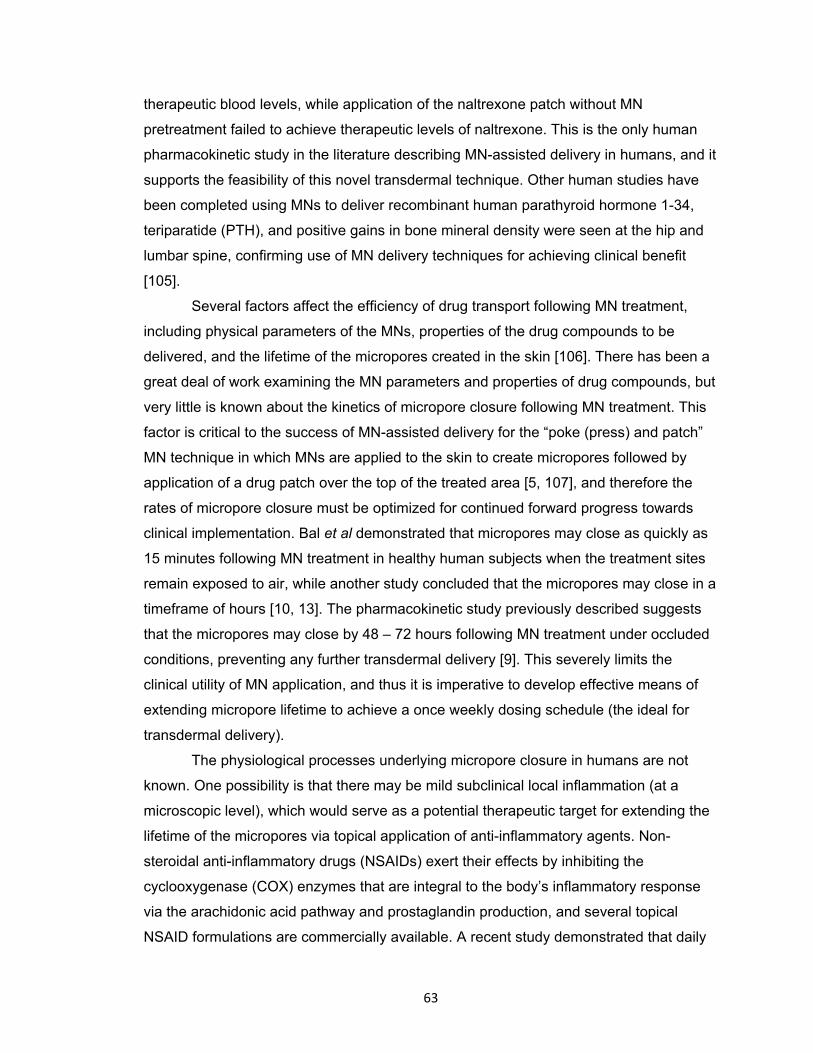
63
therapeutic blood levels, while application of the naltrexone patch without MN
pretreatment failed to achieve therapeutic levels of naltrexone. This is the only human
pharmacokinetic study in the literature describing MN-assisted delivery in humans, and it
supports the feasibility of this novel transdermal technique. Other human studies have
been completed using MNs to deliver recombinant human parathyroid hormone 1-34,
teriparatide (PTH), and positive gains in bone mineral density were seen at the hip and
lumbar spine, confirming use of MN delivery techniques for achieving clinical benefit
[105].
Several factors affect the efficiency of drug transport following MN treatment,
including physical parameters of the MNs, properties of the drug compounds to be
delivered, and the lifetime of the micropores created in the skin [106]. There has been a
great deal of work examining the MN parameters and properties of drug compounds, but
very little is known about the kinetics of micropore closure following MN treatment. This
factor is critical to the success of MN-assisted delivery for the “poke (press) and patch”
MN technique in which MNs are applied to the skin to create micropores followed by
application of a drug patch over the top of the treated area [5, 107], and therefore the
rates of micropore closure must be optimized for continued forward progress towards
clinical implementation. Bal et al demonstrated that micropores may close as quickly as
15 minutes following MN treatment in healthy human subjects when the treatment sites
remain exposed to air, while another study concluded that the micropores may close in a
timeframe of hours [10, 13]. The pharmacokinetic study previously described suggests
that the micropores may close by 48 – 72 hours following MN treatment under occluded
conditions, preventing any further transdermal delivery [9]. This severely limits the
clinical utility of MN application, and thus it is imperative to develop effective means of
extending micropore lifetime to achieve a once weekly dosing schedule (the ideal for
transdermal delivery).
The physiological processes underlying micropore closure in humans are not
known. One possibility is that there may be mild subclinical local inflammation (at a
microscopic level), which would serve as a potential therapeutic target for extending the
lifetime of the micropores via topical application of anti-inflammatory agents. Non-
steroidal anti-inflammatory drugs (NSAIDs) exert their effects by inhibiting the
cyclooxygenase (COX) enzymes that are integral to the body’s inflammatory response
via the arachidonic acid pathway and prostaglandin production, and several topical
NSAID formulations are commercially available. A recent study demonstrated that daily
64
application of 3% diclofenac sodium (a non-specific inhibitor of COX-1 and COX-2)
extends micropore lifetime in hairless guinea pigs, allowing transdermal delivery of
naltrexone for up to 7 days [11]. This was the first study to demonstrate the feasibility
and applicability of extending micropore lifetime with topical NSAIDs.
There are many techniques that can be employed to monitor micropore formation
in the skin, both qualitatively and quantitatively. The SC serves as the primary barrier to
movement of water and ions, and these properties can be used as a means to evaluate
the state of the skin’s barrier [16]. Transepidermal water loss (TEWL) measures the
movement of water between the skin and the external environment, and an increase in
TEWL reflects that the skin’s barrier has been compromised [108]. Despite being a
widely used technique, however, TEWL measurements are exquisitely sensitive to the
hydration status of the skin, presenting a significant challenge for evaluating small
changes in SC that has been occluded for hours to days (the typical scenario for a
transdermal patch). Impedance spectroscopy is another useful technique that reflects
disruption of the SC by measuring the movement of ions. It is well known that human
skin presents a large impedance to the movement of electrical current, thus displaying a
high electrical resistance that is primarily due to the SC [97, 109, 110]. Accordingly, the
electrical impedance of the SC provides important information regarding the state of the
skin’s barrier function (notably, the impedance of intact, healthy skin is quite high, but
decreases in response to injury or insult) [95, 97, 109, 111, 112], and this has been
shown to be a reliable method of evaluating barrier function [94-96, 113]. Impedance
measurements can detect small changes in skin that has been hydrated, and this
technique has very recently been described for specifically studying the kinetics of
micropore closure under the effects of occlusion, making this an excellent technique for
clinical applications and evaluating “real world” transdermal scenarios with microneedle
application [14, 110]. The inverse of the electrical impedance (admittance) can also be
used as a measure of the skin barrier integrity as high admittance values signify
compromised barrier integrity, while low baseline values are typical under normal
physiological conditions (similar trends to those observed with TEWL).
The objective of the present study was to extend the lifetime of the micropores
created from MN insertion in healthy human subjects by targeting the COX enzymes via
topical application of diclofenac. Impedance spectroscopy was utilized to monitor
micropore closure following one-time MN treatment, and tristimulus colorimetry was
employed to assess local erythema and skin irritation. These are the first data to
65
demonstrate that application of small bioactive drugs can effectively delay micropore
closure in human subjects. These studies fulfill Research Goal 3.2, and have been
submitted for publication to the Journal of Controlled Release.
6.2 Methods and materials
6.2.1 Preparation of drug formulations
Solaraze® gel (3% diclofenac sodium, 2.5% hyaluronic acid, PharmaDerm,
Melville, NY) and 0.2% sodium hyaluronate gel (Cypress Pharmaceutical, Inc., Madison,
MS) were purchased through the University of Kentucky. Sodium hyaluronate powder
(Macronan-P) was a gift from American International Chemical, Inc. (Framingham, MA).
A 2.5% hyaluronic acid gel served as the placebo vehicle control, and was prepared
from the 0.2% sodium hyaluronate gel and the Macronan-P powder.
6.2.2 Preparation of microneedle arrays and occlusive patches
Briefly, fixed MN geometries are cut into 50 μm thick stainless steel sheets and
are manually bent perpendicular to the plane of their metal substrate. The arrays contain
50 MNs arranged in a 5 x 10 configuration. The arrays are further assembled into
adhesive patches with Arclad (Adhesives Research, Inc., Glen Rock, PA), which allows
for close contact between the MNs and the skin during treatment (methods described
previously) [9]. This close contact compensates for the mismatch between the flexible
skin tissue and the rigid MN substrate. Each MN measures 800 µm in length and 200
µm in width at the base. The MN patches were ethylene oxide sterilized before use.
Figure 6.1 displays one of the MN arrays.
Blank occlusive patches were made by fabricating a rubber-ringed barrier with a
drug-impermeable backing membrane on one side (Scotchpak 1109 SPAK 1.34 MIL
heat-sealable polyester film; 3M, St. Paul, MN) that was secured to the rubber ring with
3M double-sided medical tape. The patches were held closely to the skin with Bioclusive
dressing (Systagenix Wound Management, Quincy, MA). The patches on a subject’s
arm can be seen in Figure 6.2.
6.2.3 Electrodes and impedance measurements
Ag/AgCl measurement electrodes (Thought Technology T-3404; 25 mm x 25 mm
total area; 10 mm active electrode diameter; Stens Corporation, San Rafael, CA) were
used to measure the impedance at treatment sites. A large electrode with a conductive
66
gel was placed in the middle of the treatment sites and served as the reference
electrode (Superior Silver Electrode with PermaGel, 70 mm total and active electrode
diameter; Tyco Healthcare Unit-Patch, Wabasha, MN). Lead wires were connected to
the measurement and reference electrodes, and the opposite ends of the wires were
connected to an impedance meter (EIM-105 Prep-Check Electrode Impedance Meter;
General Devices, Ridgefield, NJ). The meter applied a low frequency (30 Hz) alternating
current that was modified with a 200 kΩ resistor in parallel (IET labs, Inc., Westbury,
NY).
6.2.4 Clinical study procedures
All study procedures were approved by the University of Kentucky Institutional
Review Board and were carried out in accordance with the principles governing clinical
research as defined in the World Medical Association Declaration of Helsinki; all subjects
provided informed consent prior to beginning any study procedures. Healthy volunteers
were examined and interviewed to determine appropriateness for the study. Volunteers
were between 18 – 45 years of age and in general good health with no history of
dermatological disease. Subjects were excluded if they had any of the following
conditions: severe general allergies (indoor, outdoor, or seasonal); allergy to diclofenac
sodium, Solaraze® gel, or hyaluronic acid; previous adverse reaction to MN insertion;
known allergy or adverse reaction to medical tape or adhesive. Subjects were also
excluded if they were pregnant/nursing or had HIV/AIDS. Immediately prior to and during
the study, subjects were asked to refrain from taking any oral anti-inflammatory drugs. At
each visit, the subjects sat in the clinic room for 30 minutes prior to any study activities in
order to acclimate to normal room temperature of ~25°C. At the first visit, 6 sites were
marked on the arm of each subject; each site received a different treatment (Table 6.1).
The treatments were applied to either the volar forearm or upper arm, and three
different treatment schedules were examined (Table 6.2). Sites were randomly
numbered for the subjects treated on the volar forearm. The observed trends in closure
kinetics were similar irrespective of the site; thus for the remaining subjects the sites
were not randomized, but were kept consistent. Site 1 was marked at the 12 o’clock
position (nearest to the shoulder) and Sites 2 – 6 were number consecutively in a
clockwise fashion. After the first three subjects, the treatment sites were moved to the
upper arm in order to more accurately represent a possible site of patch placement in
clinical practice, and the sites were kept consistent to further eliminate any source of
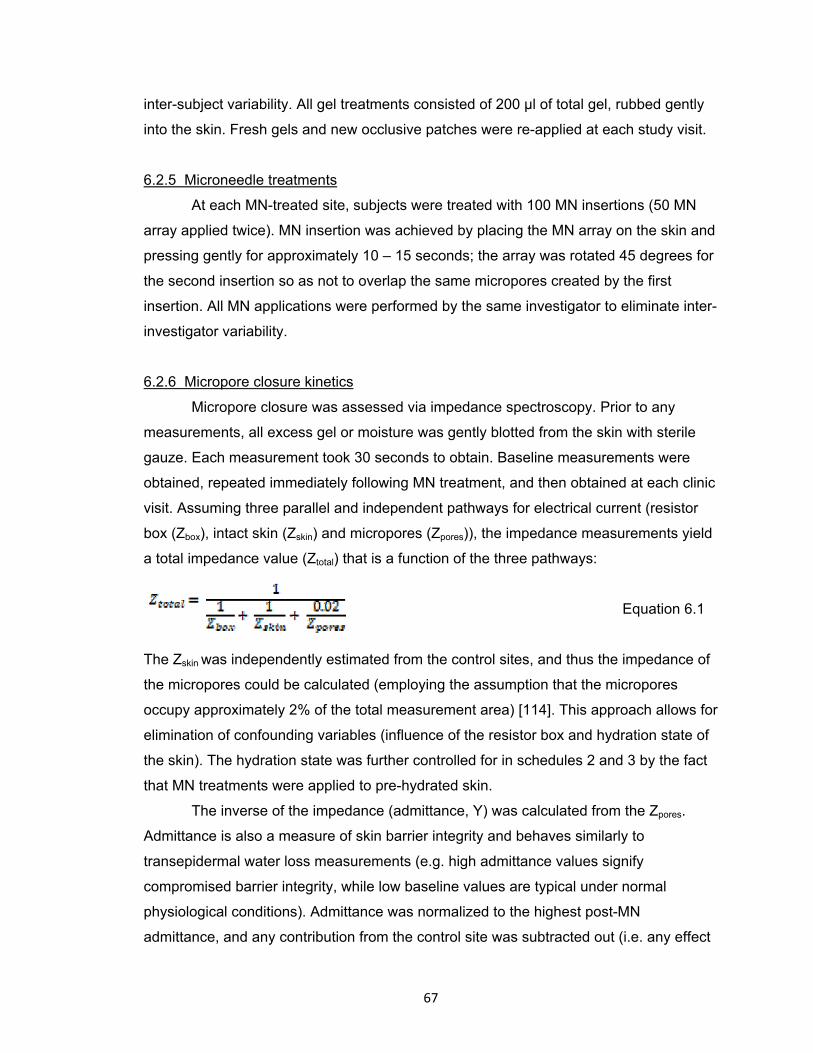
67
inter-subject variability. All gel treatments consisted of 200 µl of total gel, rubbed gently
into the skin. Fresh gels and new occlusive patches were re-applied at each study visit.
6.2.5 Microneedle treatments
At each MN-treated site, subjects were treated with 100 MN insertions (50 MN
array applied twice). MN insertion was achieved by placing the MN array on the skin and
pressing gently for approximately 10 – 15 seconds; the array was rotated 45 degrees for
the second insertion so as not to overlap the same micropores created by the first
insertion. All MN applications were performed by the same investigator to eliminate inter-
investigator variability.
6.2.6 Micropore closure kinetics
Micropore closure was assessed via impedance spectroscopy. Prior to any
measurements, all excess gel or moisture was gently blotted from the skin with sterile
gauze. Each measurement took 30 seconds to obtain. Baseline measurements were
obtained, repeated immediately following MN treatment, and then obtained at each clinic
visit. Assuming three parallel and independent pathways for electrical current (resistor
box (Zbox), intact skin (Zskin) and micropores (Zpores)), the impedance measurements yield
a total impedance value (Ztotal) that is a function of the three pathways:
Equation 6.1
The Zskin was independently estimated from the control sites, and thus the impedance of
the micropores could be calculated (employing the assumption that the micropores
occupy approximately 2% of the total measurement area) [114]. This approach allows for
elimination of confounding variables (influence of the resistor box and hydration state of
the skin). The hydration state was further controlled for in schedules 2 and 3 by the fact
that MN treatments were applied to pre-hydrated skin.
The inverse of the impedance (admittance, Y) was calculated from the Zpores.
Admittance is also a measure of skin barrier integrity and behaves similarly to
transepidermal water loss measurements (e.g. high admittance values signify
compromised barrier integrity, while low baseline values are typical under normal
physiological conditions). Admittance was normalized to the highest post-MN
admittance, and any contribution from the control site was subtracted out (i.e. any effect
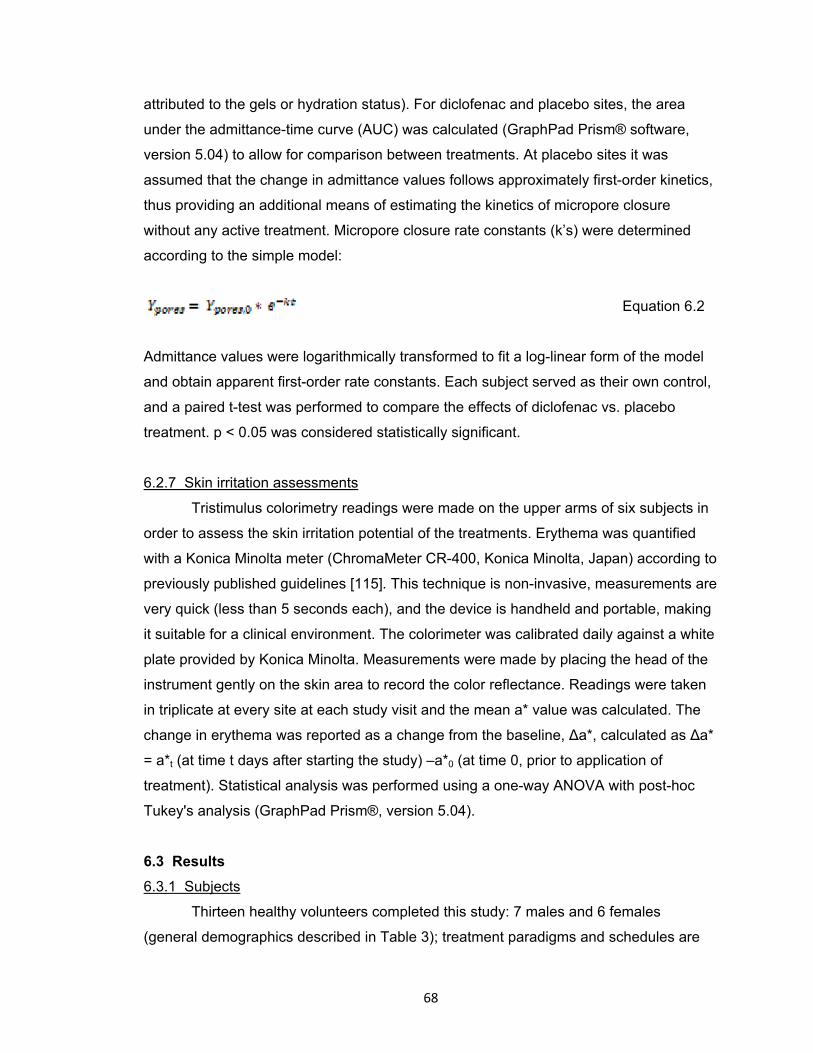
68
attributed to the gels or hydration status). For diclofenac and placebo sites, the area
under the admittance-time curve (AUC) was calculated (GraphPad Prism® software,
version 5.04) to allow for comparison between treatments. At placebo sites it was
assumed that the change in admittance values follows approximately first-order kinetics,
thus providing an additional means of estimating the kinetics of micropore closure
without any active treatment. Micropore closure rate constants (k’s) were determined
according to the simple model:
Equation 6.2
Admittance values were logarithmically transformed to fit a log-linear form of the model
and obtain apparent first-order rate constants. Each subject served as their own control,
and a paired t-test was performed to compare the effects of diclofenac vs. placebo
treatment. p < 0.05 was considered statistically significant.
6.2.7 Skin irritation assessments
Tristimulus colorimetry readings were made on the upper arms of six subjects in
order to assess the skin irritation potential of the treatments. Erythema was quantified
with a Konica Minolta meter (ChromaMeter CR-400, Konica Minolta, Japan) according to
previously published guidelines [115]. This technique is non-invasive, measurements are
very quick (less than 5 seconds each), and the device is handheld and portable, making
it suitable for a clinical environment. The colorimeter was calibrated daily against a white
plate provided by Konica Minolta. Measurements were made by placing the head of the
instrument gently on the skin area to record the color reflectance. Readings were taken
in triplicate at every site at each study visit and the mean a* value was calculated. The
change in erythema was reported as a change from the baseline, Δa*, calculated as Δa*
= a*t (at time t days after starting the study) –a*0 (at time 0, prior to application of
treatment). Statistical analysis was performed using a one-way ANOVA with post-hoc
Tukey's analysis (GraphPad Prism®, version 5.04).
6.3 Results
6.3.1 Subjects
Thirteen healthy volunteers completed this study: 7 males and 6 females
(general demographics described in Table 3); treatment paradigms and schedules are
69
described in Table 4. The various paradigms and schedules allowed for the investigation
of different scenarios, including: 1) the effects of pre-hydration on micropore closure; 2)
evaluation of micropore closure kinetics under different frequencies of diclofenac
application; and 3) comparison of admittance profiles following identical treatment at two
independent sites. MN treatments were well tolerated by all of the subjects and no
irritation or infection was noted at any of the treatment sites. Some subjects had mild to
moderate irritation/allergic reactions to the Bioclusive adhesive tape that was used to
secure the blank occlusive patches to the skin (to cover the treatment sites). These local
reactions were isolated to the areas of skin covered by the Bioclusive and were
determined by the study physicians to be unrelated to the MN or gel treatments
themselves. All reactions were treated with brief courses of topical steroids, and all
resolved quickly.
6.3.2 Formation of micropores in the stratum corneum
A total of 50 MN treatments were applied in 13 subjects at diclofenac and
placebo treated sites (one MN treatment consists of two applications of a 50 MN array,
in order to create 100 micropores). Zpores (impedance of the micropores) was calculated
as described above in the Methods section. Impedance dropped significantly from
baseline immediately following MN treatment in all subjects (p = 0.002, paired t-test)
indicating formation of micropores in the SC and significant disruption of the skin’s
barrier function (one subject’s measurements were excluded as outliers, n = 2).
The most relevant clinical scenario for transdermal patches is such that the skin
remains occluded beneath a patch for a timeframe of hours to days. Impedance
measurements can be made on skin with varied levels of hydration [112], but this does
impose an additional factor that could create variability in the measurements. In some
subjects the skin was pre-hydrated before MN treatment in order to completely remove
any possible effects of hydration on the impedance measurements (n = 20 MN
treatments). However, the employed basic research method of calculating the Zpores
described in the Methods section (using the measurements at corresponding control
sites to estimate the value of hydrated intact skin) also allows for removal of hydration
effects. Therefore, to more accurately depict the truest clinical scenario, the pre-
hydration period was removed from the treatment schedule (n = 28 MN treatments). Two
subjects completed the study in a crossover design, once with pre-hydration and once
without pre-hydration. There was no significant difference (p > 0.5, Student’s t-test) in
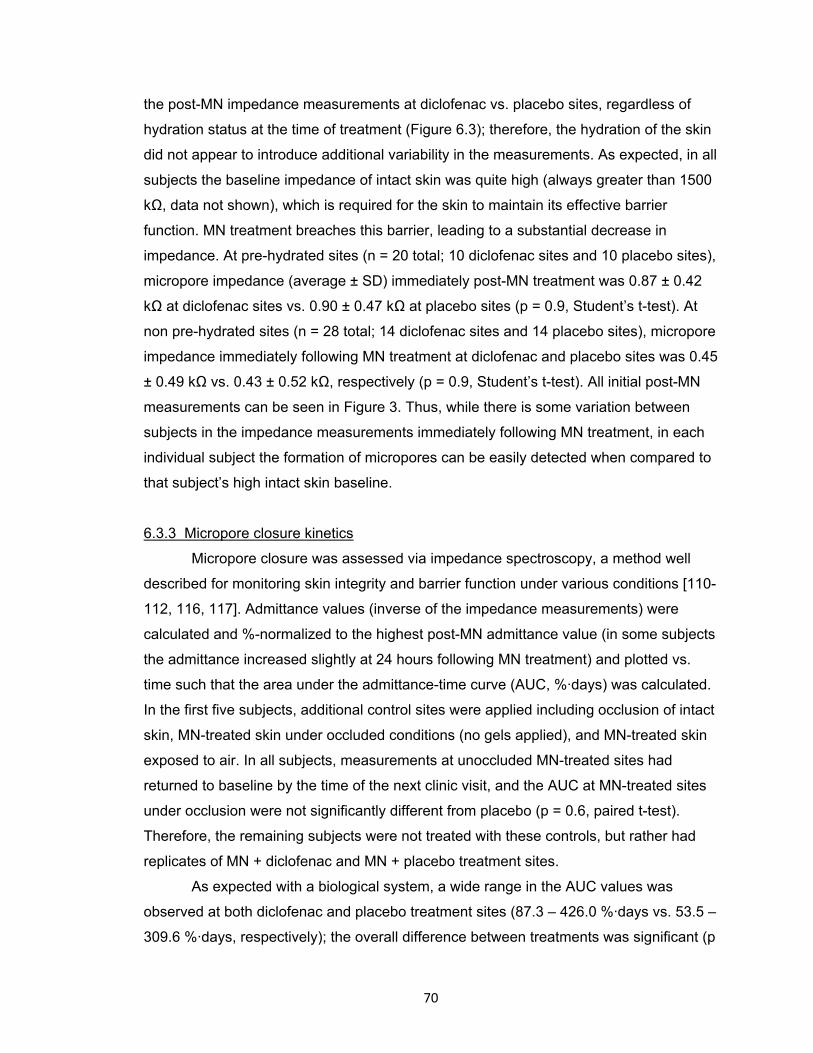
70
the post-MN impedance measurements at diclofenac vs. placebo sites, regardless of
hydration status at the time of treatment (Figure 6.3); therefore, the hydration of the skin
did not appear to introduce additional variability in the measurements. As expected, in all
subjects the baseline impedance of intact skin was quite high (always greater than 1500
kΩ, data not shown), which is required for the skin to maintain its effective barrier
function. MN treatment breaches this barrier, leading to a substantial decrease in
impedance. At pre-hydrated sites (n = 20 total; 10 diclofenac sites and 10 placebo sites),
micropore impedance (average ± SD) immediately post-MN treatment was 0.87 ± 0.42
kΩ at diclofenac sites vs. 0.90 ± 0.47 kΩ at placebo sites (p = 0.9, Student’s t-test). At
non pre-hydrated sites (n = 28 total; 14 diclofenac sites and 14 placebo sites), micropore
impedance immediately following MN treatment at diclofenac and placebo sites was 0.45
± 0.49 kΩ vs. 0.43 ± 0.52 kΩ, respectively (p = 0.9, Student’s t-test). All initial post-MN
measurements can be seen in Figure 3. Thus, while there is some variation between
subjects in the impedance measurements immediately following MN treatment, in each
individual subject the formation of micropores can be easily detected when compared to
that subject’s high intact skin baseline.
6.3.3 Micropore closure kinetics
Micropore closure was assessed via impedance spectroscopy, a method well
described for monitoring skin integrity and barrier function under various conditions [110-
112, 116, 117]. Admittance values (inverse of the impedance measurements) were
calculated and %-normalized to the highest post-MN admittance value (in some subjects
the admittance increased slightly at 24 hours following MN treatment) and plotted vs.
time such that the area under the admittance-time curve (AUC, %·days) was calculated.
In the first five subjects, additional control sites were applied including occlusion of intact
skin, MN-treated skin under occluded conditions (no gels applied), and MN-treated skin
exposed to air. In all subjects, measurements at unoccluded MN-treated sites had
returned to baseline by the time of the next clinic visit, and the AUC at MN-treated sites
under occlusion were not significantly different from placebo (p = 0.6, paired t-test).
Therefore, the remaining subjects were not treated with these controls, but rather had
replicates of MN + diclofenac and MN + placebo treatment sites.
As expected with a biological system, a wide range in the AUC values was
observed at both diclofenac and placebo treatment sites (87.3 – 426.0 %·days vs. 53.5 –
309.6 %·days, respectively); the overall difference between treatments was significant (p
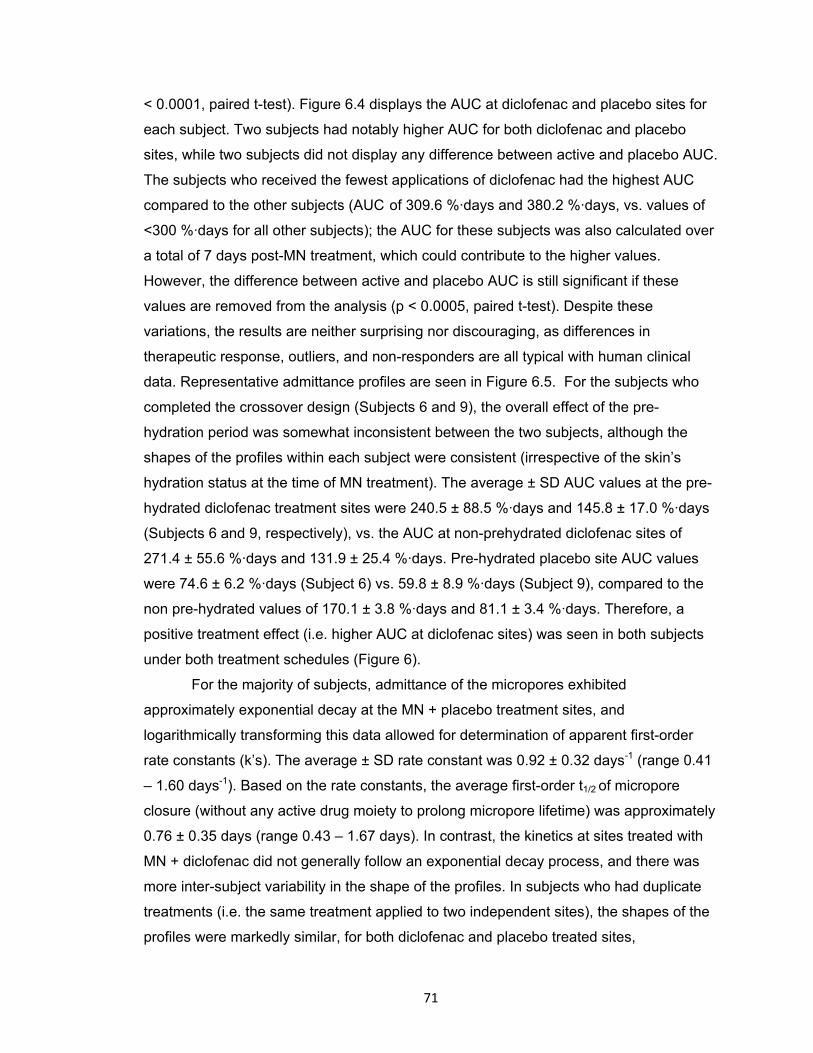
71
< 0.0001, paired t-test). Figure 6.4 displays the AUC at diclofenac and placebo sites for
each subject. Two subjects had notably higher AUC for both diclofenac and placebo
sites, while two subjects did not display any difference between active and placebo AUC.
The subjects who received the fewest applications of diclofenac had the highest AUC
compared to the other subjects (AUC of 309.6 %·days and 380.2 %·days, vs. values of
<300 %·days for all other subjects); the AUC for these subjects was also calculated over
a total of 7 days post-MN treatment, which could contribute to the higher values.
However, the difference between active and placebo AUC is still significant if these
values are removed from the analysis (p < 0.0005, paired t-test). Despite these
variations, the results are neither surprising nor discouraging, as differences in
therapeutic response, outliers, and non-responders are all typical with human clinical
data. Representative admittance profiles are seen in Figure 6.5. For the subjects who
completed the crossover design (Subjects 6 and 9), the overall effect of the pre-
hydration period was somewhat inconsistent between the two subjects, although the
shapes of the profiles within each subject were consistent (irrespective of the skin’s
hydration status at the time of MN treatment). The average ± SD AUC values at the pre-
hydrated diclofenac treatment sites were 240.5 ± 88.5 %·days and 145.8 ± 17.0 %·days
(Subjects 6 and 9, respectively), vs. the AUC at non-prehydrated diclofenac sites of
271.4 ± 55.6 %·days and 131.9 ± 25.4 %·days. Pre-hydrated placebo site AUC values
were 74.6 ± 6.2 %·days (Subject 6) vs. 59.8 ± 8.9 %·days (Subject 9), compared to the
non pre-hydrated values of 170.1 ± 3.8 %·days and 81.1 ± 3.4 %·days. Therefore, a
positive treatment effect (i.e. higher AUC at diclofenac sites) was seen in both subjects
under both treatment schedules (Figure 6).
For the majority of subjects, admittance of the micropores exhibited
approximately exponential decay at the MN + placebo treatment sites, and
logarithmically transforming this data allowed for determination of apparent first-order
rate constants (k’s). The average ± SD rate constant was 0.92 ± 0.32 days-1 (range 0.41
– 1.60 days-1). Based on the rate constants, the average first-order t1/2 of micropore
closure (without any active drug moiety to prolong micropore lifetime) was approximately
0.76 ± 0.35 days (range 0.43 – 1.67 days). In contrast, the kinetics at sites treated with
MN + diclofenac did not generally follow an exponential decay process, and there was
more inter-subject variability in the shape of the profiles. In subjects who had duplicate
treatments (i.e. the same treatment applied to two independent sites), the shapes of the
profiles were markedly similar, for both diclofenac and placebo treated sites,
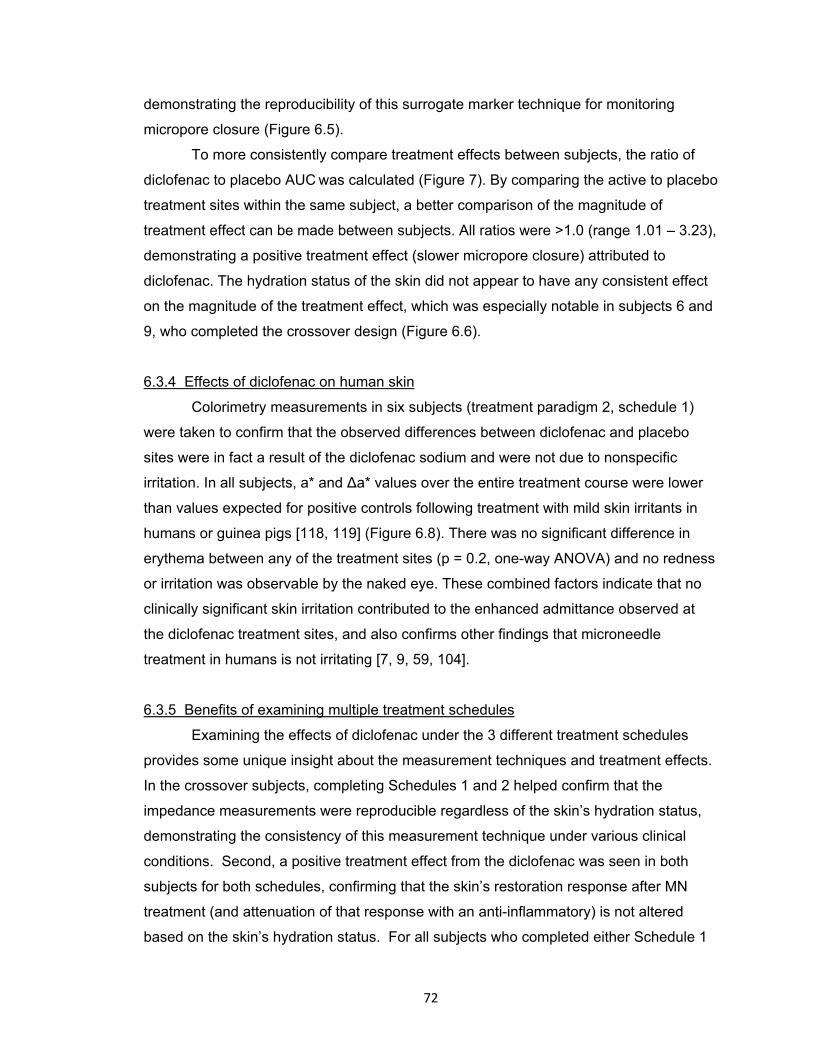
72
demonstrating the reproducibility of this surrogate marker technique for monitoring
micropore closure (Figure 6.5).
To more consistently compare treatment effects between subjects, the ratio of
diclofenac to placebo AUC was calculated (Figure 7). By comparing the active to placebo
treatment sites within the same subject, a better comparison of the magnitude of
treatment effect can be made between subjects. All ratios were >1.0 (range 1.01 – 3.23),
demonstrating a positive treatment effect (slower micropore closure) attributed to
diclofenac. The hydration status of the skin did not appear to have any consistent effect
on the magnitude of the treatment effect, which was especially notable in subjects 6 and
9, who completed the crossover design (Figure 6.6).
6.3.4 Effects of diclofenac on human skin
Colorimetry measurements in six subjects (treatment paradigm 2, schedule 1)
were taken to confirm that the observed differences between diclofenac and placebo
sites were in fact a result of the diclofenac sodium and were not due to nonspecific
irritation. In all subjects, a* and Δa* values over the entire treatment course were lower
than values expected for positive controls following treatment with mild skin irritants in
humans or guinea pigs [118, 119] (Figure 6.8). There was no significant difference in
erythema between any of the treatment sites (p = 0.2, one-way ANOVA) and no redness
or irritation was observable by the naked eye. These combined factors indicate that no
clinically significant skin irritation contributed to the enhanced admittance observed at
the diclofenac treatment sites, and also confirms other findings that microneedle
treatment in humans is not irritating [7, 9, 59, 104].
6.3.5 Benefits of examining multiple treatment schedules
Examining the effects of diclofenac under the 3 different treatment schedules
provides some unique insight about the measurement techniques and treatment effects.
In the crossover subjects, completing Schedules 1 and 2 helped confirm that the
impedance measurements were reproducible regardless of the skin’s hydration status,
demonstrating the consistency of this measurement technique under various clinical
conditions. Second, a positive treatment effect from the diclofenac was seen in both
subjects for both schedules, confirming that the skin’s restoration response after MN
treatment (and attenuation of that response with an anti-inflammatory) is not altered
based on the skin’s hydration status. For all subjects who completed either Schedule 1
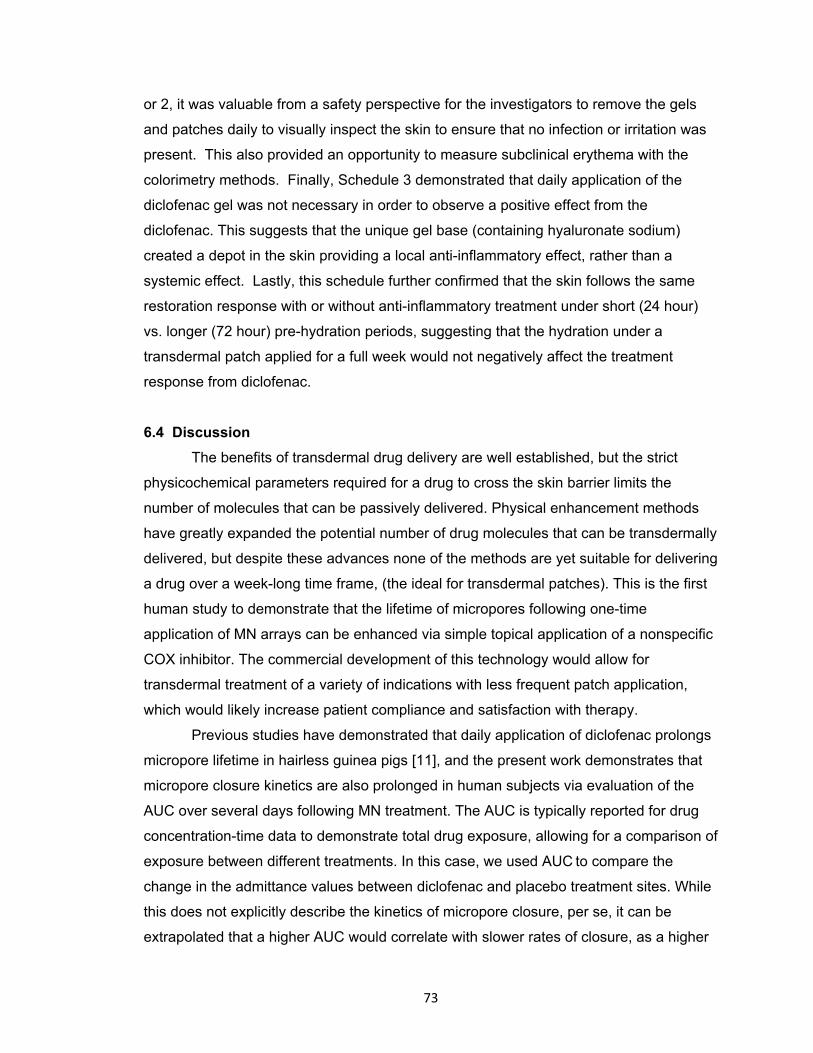
73
or 2, it was valuable from a safety perspective for the investigators to remove the gels
and patches daily to visually inspect the skin to ensure that no infection or irritation was
present. This also provided an opportunity to measure subclinical erythema with the
colorimetry methods. Finally, Schedule 3 demonstrated that daily application of the
diclofenac gel was not necessary in order to observe a positive effect from the
diclofenac. This suggests that the unique gel base (containing hyaluronate sodium)
created a depot in the skin providing a local anti-inflammatory effect, rather than a
systemic effect. Lastly, this schedule further confirmed that the skin follows the same
restoration response with or without anti-inflammatory treatment under short (24 hour)
vs. longer (72 hour) pre-hydration periods, suggesting that the hydration under a
transdermal patch applied for a full week would not negatively affect the treatment
response from diclofenac.
6.4 Discussion
The benefits of transdermal drug delivery are well established, but the strict
physicochemical parameters required for a drug to cross the skin barrier limits the
number of molecules that can be passively delivered. Physical enhancement methods
have greatly expanded the potential number of drug molecules that can be transdermally
delivered, but despite these advances none of the methods are yet suitable for delivering
a drug over a week-long time frame, (the ideal for transdermal patches). This is the first
human study to demonstrate that the lifetime of micropores following one-time
application of MN arrays can be enhanced via simple topical application of a nonspecific
COX inhibitor. The commercial development of this technology would allow for
transdermal treatment of a variety of indications with less frequent patch application,
which would likely increase patient compliance and satisfaction with therapy.
Previous studies have demonstrated that daily application of diclofenac prolongs
micropore lifetime in hairless guinea pigs [11], and the present work demonstrates that
micropore closure kinetics are also prolonged in human subjects via evaluation of the
AUC over several days following MN treatment. The AUC is typically reported for drug
concentration-time data to demonstrate total drug exposure, allowing for a comparison of
exposure between different treatments. In this case, we used AUC to compare the
change in the admittance values between diclofenac and placebo treatment sites. While
this does not explicitly describe the kinetics of micropore closure, per se, it can be
extrapolated that a higher AUC would correlate with slower rates of closure, as a higher
74
AUC would be a result of higher admittance values over the entire treatment period.
Therefore, this model incorporates the general assumption that slower kinetics of
micropore closure are described by higher AUC values.
The diclofenac formulation used in these studies is unique in that the vehicle
contains 2.5% hyaluronic acid, a naturally occurring polysaccharide found in the skin.
Studies have demonstrated that hyaluronic acid aids the partitioning of diclofenac into
the skin and promotes its retention within the epidermis, ultimately creating a local depot
of drug [120]. For the purposes of enhancing micropore lifetime this property is
particularly appealing, as it ensures that the effects of the diclofenac are a result of local
concentrations at the micropores, rather than any effects from systemic delivery. The
subjects with the highest AUC were those that completed the treatment schedule with
the fewest applications of diclofenac, suggesting that daily application of the diclofenac
is not necessary (which is likely partly attributable to the depot of diclofenac formed in
the skin). The AUC values for the subjects in Schedule 3 were calculated over a total of
7 days post-MN treatment, which could also contribute to the higher values. It was not
feasible to accurately determine the AUC over a 4 day post-MN period in these subjects
because this would have generated an AUC from a much smaller number of data points,
which is likely to greatly overestimate the values and produce the appearance of a more
pronounced treatment effect. It is also possible that the increased exposure to air
(created by daily impedance measurements) at the MN-treated sites in the other
subjects may have contributed to faster micropore closure, as MN-treated skin heals
markedly faster when unoccluded. Any systemic absorption of diclofenac from the
topical dose (200 μl of a 3% w/w gel, 6 mg total) would be considered negligible, as this
is far below the lowest oral dose of diclofenac given for systemic indications (100 mg/day
with 50% oral bioavailability equating to a 50 mg systemic dose) [121].
6.4.1 Effect of formulation pH on micropore closure kinetics
The experimentally measured pH values of the diclofenac and placebo gels were
7.3 and 4.7, respectively. The effect of pH on skin wound healing has been investigated
in the literature and it has been shown that pH does not play a role in wound healing for
lesser insults [122]. However, in the case of acetone disruption when the ‘’acid mantle”
of the skin is disturbed, the rate of healing is slower at pH 7.4 compared to pH 5.5. This
can be attributed to the acidic pH optimum of β-glucocerebrosidase, an enzyme
responsible for the post-secretion modifications of polar to non-polar ceramides [122].
75
Since the pH of the diclofenac gel was higher compared to the placebo in this study, we
examined the role of formulation pH in the re-sealing of the micropores. Micropore
closure kinetics were evaluated in vivo under 3 different pH conditions in a Yucatan
miniature pig: pH 5.5, 6.5 and 7.4 (gels made in 100 mM citrate buffer and gelled with
3% hydroxyethylcellulose). Three MN treated sites and 1 untreated control site were
used for each pH condition; all sites were under occlusion after one time MN application.
There was no significant difference in admittance values among the 3 conditions after
the first 24 hours (p>0.05). The difference in admittance up to 24 hours is consistent with
previous reports demonstrating significant differences in TEWL (following acetone
treatment) between pH 5.5 and pH 7.4 at 2h and 4h (p<0.01) and 24h (p<0.05) [122].
After the early time points, however, the rates of recovery normalize in spite of the pH
difference. Thus, as the skin begins to heal itself over time, the effect of formulation pH
becomes less evident in the repair mechanism. Hence it can be concluded that the effect
of diclofenac seen in this study is independent of the formulation pH of the gels, beyond
the 24h time point. Based on the pH data and all of the above mentioned factors it can
be concluded that the differences in micropore closure (between diclofenac and placebo)
that were observed in this study are related to the local concentration of diclofenac, not
from a systemic anti-inflammatory effect, or from the effects of the gel vehicles.
6.4.2 Potential factors contributing to inter-subject variability
The ability of drugs to permeate intact human skin is related both to the individual
characteristics of the subject’s skin as well as the structural and physicochemical
properties of the drug compound (molecular weight, octanol/water partition coefficient,
and hydrogen bonding) [123]. For in vitro human skin experimental permeability data
alone, it is not unusual to observe as much as 30% variation [24, 124]. Responses to
topical treatments can sometimes be quite unpredictable, and there are currently no
methods to accurately predict whether or not a subject will be an outlier in the typical
response to a topically applied drug. In the present study there are various reasons why
some subjects had higher or lower levels of response. First, previous work has
demonstrated that drug-metabolizing enzymes (DMEs) are expressed in human skin
[125], and inter-subject differences in the expression of these enzymes could be related
to the magnitude of treatment effect observed from a variety of topical treatments.
Diclofenac metabolism in the skin is thought to be similar to the metabolism seen
following oral administration (conversion to glucuronide conjugates) [126], and varied
76
expression of the enzymes involved in this metabolism could impact the treatment effect
observed following topical diclofenac application. It is noteworthy here, however, that the
amount of drug applied per unit area for typical topical drug applications would likely
saturate the enzyme systems, and therefore differences in metabolism of diclofenac in
the skin would likely have a minimal effect in this regard. Second, expression of the COX
enzymes in normal skin can vary [127], and it is possible that a subject with lower COX
enzyme expression may not display as pronounced an effect to the diclofenac treatment
(the opposite would be true for subjects with greater COX expression in the skin). Third,
expression of DMEs in the skin can be increased or decreased to varying degrees in
response to topical treatments used in clinical practice, which could further contribute to
the observed variation [125]. Despite these possible inter-subject variations, the overall
trend demonstrated a significant difference between active and placebo treatments in a
relatively small sample size.
6.4.3 Drug delivery window in relation to micropore lifetime and transdermal systems
It is important to note that extending micropore lifetime is not the only factor that
will contribute to enhanced delivery of a drug molecule to therapeutically relevant
systemic concentrations. The nature of transdermal patches dictates that a treatment
site is occluded for the duration of patch application, which leads to a local increase in
skin hydration. This natural byproduct of the treatment system can lead to enhanced
drug delivery for many compounds [128] and helps the micropores to remain open for
days (as seen by the drug delivery window observed in the human pharmacokinetic
study) vs. approximately 15 minutes (observed when the micropores remain
unoccluded) [9, 10]. The enhanced micropore lifetime seen in this study combined with
the increased drug delivery related to the local hydration represents the truest clinical
scenario and would be expected to produce an additive effect on drug delivery.
In MN-assisted drug delivery, the concept of micropore lifetime is only useful in
the context of a window during which a drug can be transdermally delivered to a
therapeutic plasma concentration. The first MN-assisted pharmacokinetic study
demonstrated that naltrexone can be transdermally delivered through micropores for 2-3
days under occluded conditions in the absence of any active drug moiety to prolong
micropore lifetime [9]. An average micropore closure half-life of 0.76 days was observed
in the current study, corresponding with the pharmacokinetic drug delivery window of
approximately 2-3 days (or 3-5 half-lives) when ~87.5 - 97% of the micropores would be
77
closed (according to the impedance measurements). While the notion of first-order rate
constants cannot be extrapolated directly to the diclofenac sites because of the non-
exponential decay of the admittance profiles, it does illustrate that the true drug delivery
window is significantly longer than what is predicted based on the kinetics of micropore
closure alone. It is probable that the impedance measurements overestimate the
micropore closure rate, and this method is not as sensitive as evaluating drug diffusion
in a pharmacokinetic study. A proof-of-concept pharmacokinetic study will be necessary,
but impedance is a useful surrogate marker to conduct micropore closure formulation
study screening.
In addition to providing a better understanding of the drug delivery window, the
consistency of rate constants at the placebo treatment sites also provides a novel
method of evaluating other treatments for enhancing the lifetime of micropores. The ratio
of active treatment to placebo treatment effects (in this case, AUC) offers a means to
understand the magnitude of a treatment effect, allowing for more direct comparison
between subjects. Without drug plasma concentrations to measure the amount of drug
delivery through the micropores, this ratio solely describes the difference between AUC
values; thus, a ratio of 2.0 would correlate to 2-fold slower rates of micropore closure at
diclofenac sites vs. placebo sites (based on the assumption that higher AUC indirectly
describes slower kinetics of micropore closure). This ratio of 2.0 would then also loosely
predict that the maximum amount of drug that could be delivered through the micropores
at diclofenac treatment sites would be approximately twice that seen at placebo sites.
This analysis was not only useful in the current work, but will likely also prove to be
beneficial for screening additional compounds for similar effects. This ratio allows for a
direct comparison of the utility of various treatments within the same subject by allowing
the subject to serve as their own control, while also allowing for comparison between
subjects. Furthermore, these techniques could be expanded to measure pore closure in
other physical enhancement techniques that create pores in the skin (e.g.
microdermabrasion or electroporation).
6.4.4 Tolerability of microneedles and topical treatments
Skin erythema after MN treatment and topical gel applications was quantified
using a tristimulus colorimeter. This technique allows for analysis of blue, red, and green
light reflected from the skin, providing a quantitative means of assessing skin color that
mimics the perception of the human eye. The a* measurement represents the red-green
78
axis, and this value becomes more positive as erythema appears on the skin (i.e. less
green light is reflected) [115]. The a* values obtained with a colorimeter correlate well
with erythema and can be used to quantify skin irritation; the Δa* demonstrates change
in local erythema from a pre-treatment baseline at that site [115]. It has been reported
that Δa* values can reach up to 4.73 in humans following treatment with sodium lauryl
sulfate (a known skin irritant) and as high as 8.9 in hairless guinea pigs [119, 129].
Hairless guinea pigs are a well accepted model for studying skin irritation as they are
more sensitive than humans to mild irritation, allowing for a more conservative
estimation of skin irritation potential [130]. In this study, Δa* values were well below
those of typical positive controls, confirming the lack of erythema and providing
additional support that the observed changes in micropore lifetime are not related to
nonspecific local irritation.
The concern often arises that prolonging micropore lifetime may increase the risk
of local infection at MN treated sites. From a practical point of view, however, this is not
a prominent concern. Prior to application of MN arrays, the skin is treated with 70%
isopropyl alcohol and the arrays are sterile and only used once (similar precautions to
those used in routine clinical care for inserting a hypodermic needle into the skin). All
topical treatments applied to the MN treated skin would be in a preparation suitable for
human use, i.e. the formulation would contain bacteriostatic/cidal preservatives designed
to prevent local bacterial infection [9]. Finally, despite all of the research performed on
MN-assisted delivery, no reports have described any kind of infection (local or systemic),
and in vitro work has demonstrated that microbial penetration is significantly less
following treatment with a MN array vs. a 21G hypodermic needle [62].
6.4.5 Limitations
There are some limitations to this work. Due to the rapid closure of the
micropores in unoccluded conditions, repeated impedance measurements could not be
made at each time point because of the prolonged exposure to air that this would allow.
Despite this limitation, the profiles were similar in shape in those subjects who had
multiple sites for identical treatments, and placebo rate constants were similar between
subjects, demonstrating the reliability and reproducibility of the results. Secondly, MN
insertion is a somewhat imprecise process and there are currently no non-proprietary
standardized means of applying MN arrays to the skin. This was controlled for as much
as possible by having the same investigator apply all of the MN treatments, to avoid

79
inter-investigator variability. There was no significant difference in the post-MN
measurements between diclofenac and placebo treatment sites, and therefore the
imprecise nature of MN application would not be expected to substantially affect the
results. Finally, in this study diclofenac was applied daily to the skin for the majority of
subjects. This does not represent the ideal clinical situation, as it would be cumbersome
for a patient to apply the gel daily. Additionally, in a regulatory sense the concept of
using diclofenac to enhance micropore lifetime might seem impractical because of the
frequent applications and off-label use of a commercial product. However, the
application schedule was a necessary component of this work given the proof-of-concept
nature of the study and the need to remove the gels in order to make impedance
measurements; furthermore, the diclofenac gel represented the safest formulation due to
the lack of systemic delivery from the gel vehicle. Current work in our lab is focused on
developing codrugs for integrating diclofenac into a patch system that would allow for
continued local delivery of the diclofenac. A codrug consists of two drug moieties joined
by a chemical linker (in this case diclofenac sodium linked to another drug), in order to
improve the delivery of one or both drugs. Our efforts are aimed at developing a codrug
system with diclofenac that will dissociate within the skin, thus separating the two
independent drugs and allowing for local delivery of diclofenac sodium while allowing the
other drug moiety to passively diffuse through the micropores into the systemic
circulation. This would thereby eliminate the need for daily application of the diclofenac
moiety and would be a product designed specifically for enhancing micropore lifetime to
allow for a longer drug delivery window [131].
6.5 Conclusions
In summary, this is the first study in human volunteers to demonstrate that topical
application of a nonspecific COX inhibitor can prolong micropore lifetime. Future
directions of this work will include a pharmacokinetic proof-of-concept study to
demonstrate the clinical utility of extending micropore lifetime, as well as continued
development of diclofenac codrugs. This work indicates that MN-assisted transdermal
delivery has immense potential to continue expanding to allow for delivery of a vast array
of drug compounds for a variety of clinical uses.
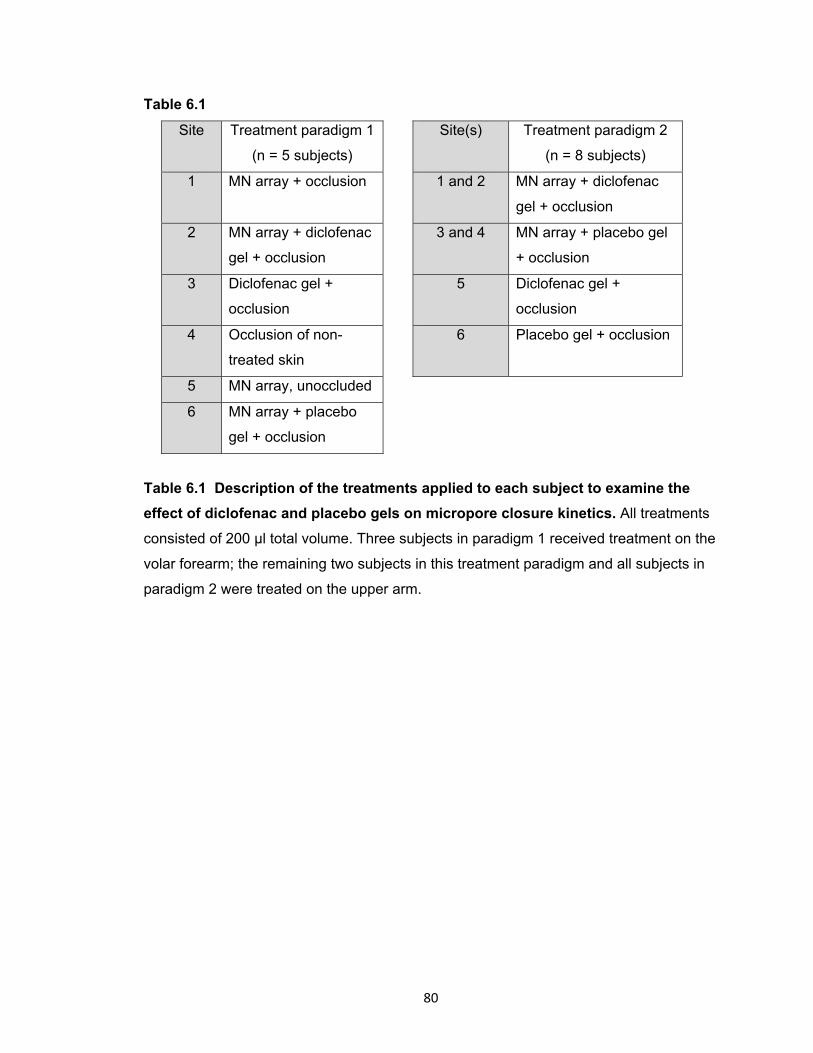
80
Table 6.1
Site Treatment paradigm 1
(n = 5 subjects)
Site(s) Treatment paradigm 2
(n = 8 subjects)
1 MN array + occlusion 1 and 2 MN array + diclofenac
gel + occlusion
2 MN array + diclofenac
gel + occlusion
3 and 4 MN array + placebo gel
+ occlusion
3 Diclofenac gel +
occlusion
5 Diclofenac gel +
occlusion
4 Occlusion of non-
treated skin
6 Placebo gel + occlusion
5 MN array, unoccluded
6 MN array + placebo
gel + occlusion
Table 6.1 Description of the treatments applied to each subject to examine the
effect of diclofenac and placebo gels on micropore closure kinetics. All treatments
consisted of 200 μl total volume. Three subjects in paradigm 1 received treatment on the
volar forearm; the remaining two subjects in this treatment paradigm and all subjects in
paradigm 2 were treated on the upper arm.
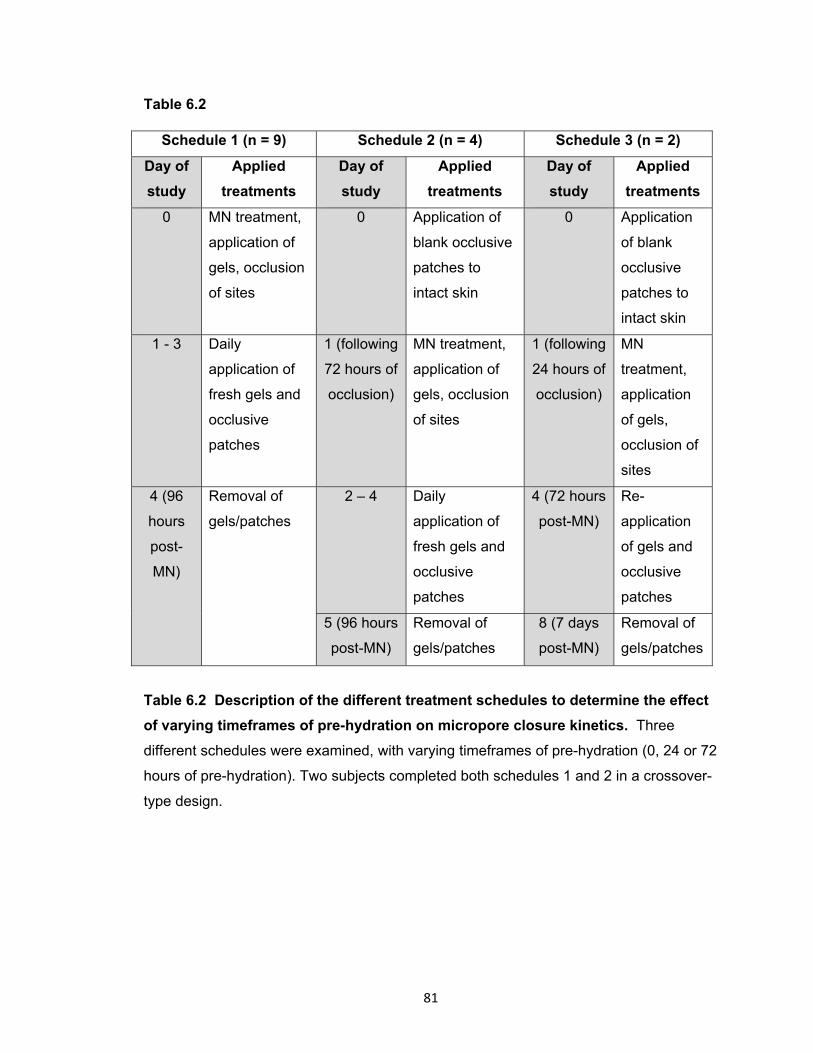
81
Table 6.2
Schedule 1 (n = 9) Schedule 2 (n = 4) Schedule 3 (n = 2)
Day of
study
Applied
treatments
Day of
study
Applied
treatments
Day of
study
Applied
treatments
0 MN treatment,
application of
gels, occlusion
of sites
0 Application of
blank occlusive
patches to
intact skin
0 Application
of blank
occlusive
patches to
intact skin
1 - 3 Daily
application of
fresh gels and
occlusive
patches
1 (following
72 hours of
occlusion)
MN treatment,
application of
gels, occlusion
of sites
1 (following
24 hours of
occlusion)
MN
treatment,
application
of gels,
occlusion of
sites
4 (96
hours
post-
MN)
Removal of
gels/patches
2 – 4 Daily
application of
fresh gels and
occlusive
patches
4 (72 hours
post-MN)
Re-
application
of gels and
occlusive
patches
5 (96 hours
post-MN)
Removal of
gels/patches
8 (7 days
post-MN)
Removal of
gels/patches
Table 6.2 Description of the different treatment schedules to determine the effect
of varying timeframes of pre-hydration on micropore closure kinetics. Three
different schedules were examined, with varying timeframes of pre-hydration (0, 24 or 72
hours of pre-hydration). Two subjects completed both schedules 1 and 2 in a crossover-
type design.
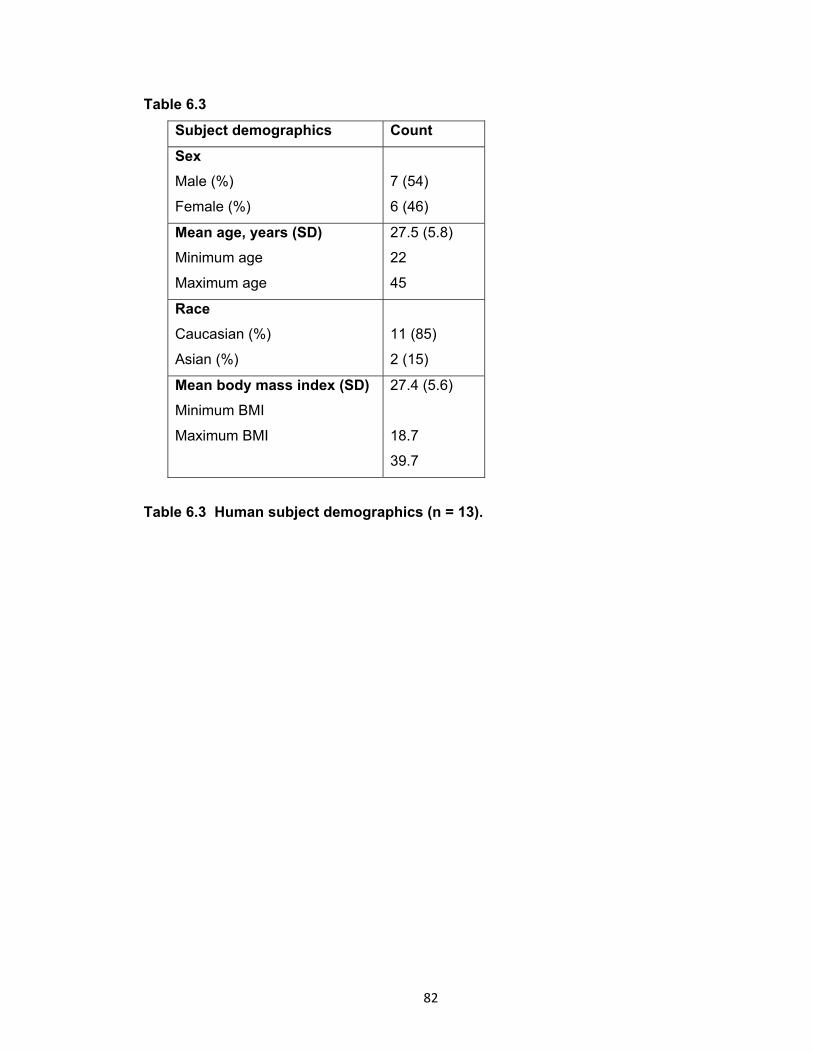
82
Table 6.3
Subject demographics Count
Sex
Male (%)
Female (%)
7 (54)
6 (46)
Mean age, years (SD)
Minimum age
Maximum age
27.5 (5.8)
22
45
Race
Caucasian (%)
Asian (%)
11 (85)
2 (15)
Mean body mass index (SD)
Minimum BMI
Maximum BMI
27.4 (5.6)
18.7
39.7
Table 6.3 Human subject demographics (n = 13).
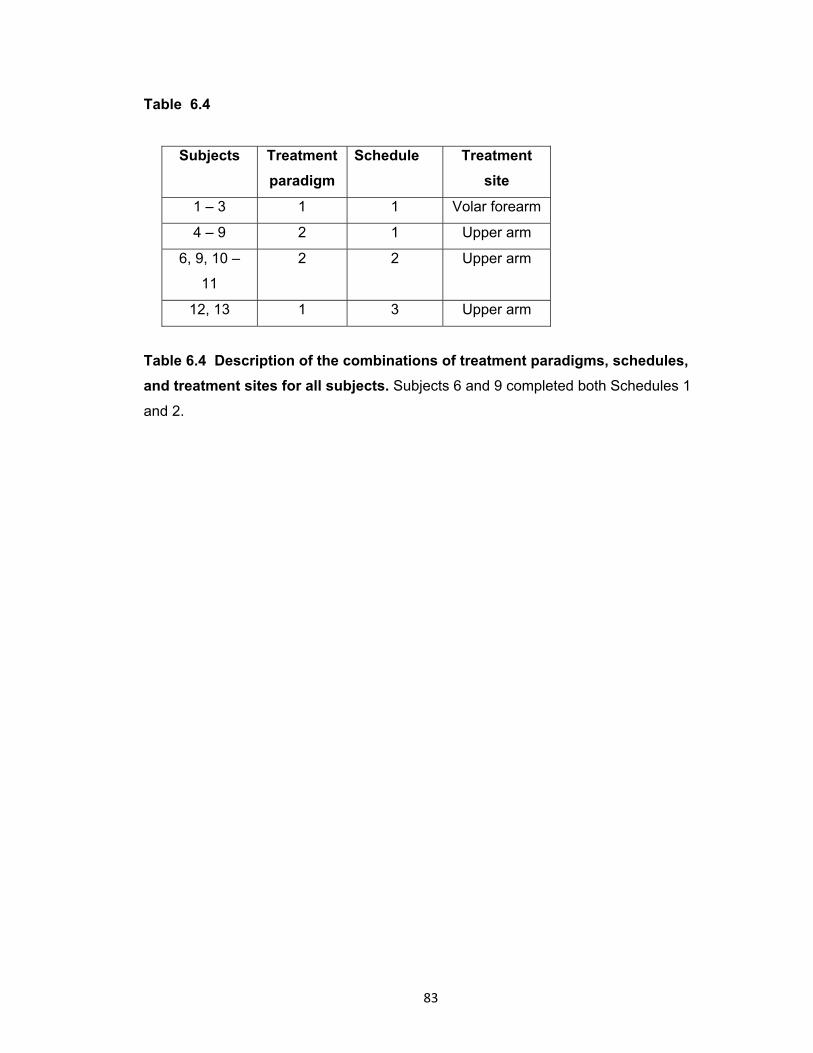
83
Table 6.4
Subjects Treatment
paradigm
Schedule Treatment
site
1 – 3 1 1 Volar forearm
4 – 9 2 1 Upper arm
6, 9, 10 –
11
2 2 Upper arm
12, 13 1 3 Upper arm
Table 6.4 Description of the combinations of treatment paradigms, schedules,
and treatment sites for all subjects. Subjects 6 and 9 completed both Schedules 1
and 2.
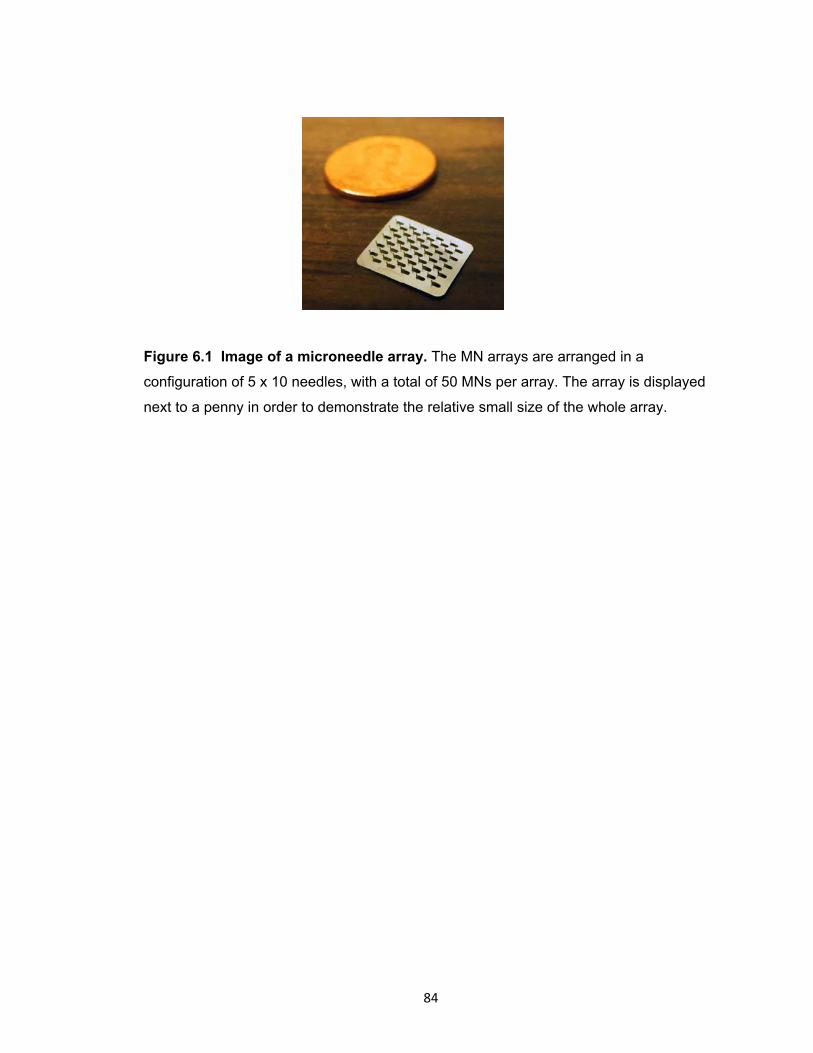
84
Figure 6.1 Image of a microneedle array. The MN arrays are arranged in a
configuration of 5 x 10 needles, with a total of 50 MNs per array. The array is displayed
next to a penny in order to demonstrate the relative small size of the whole array.
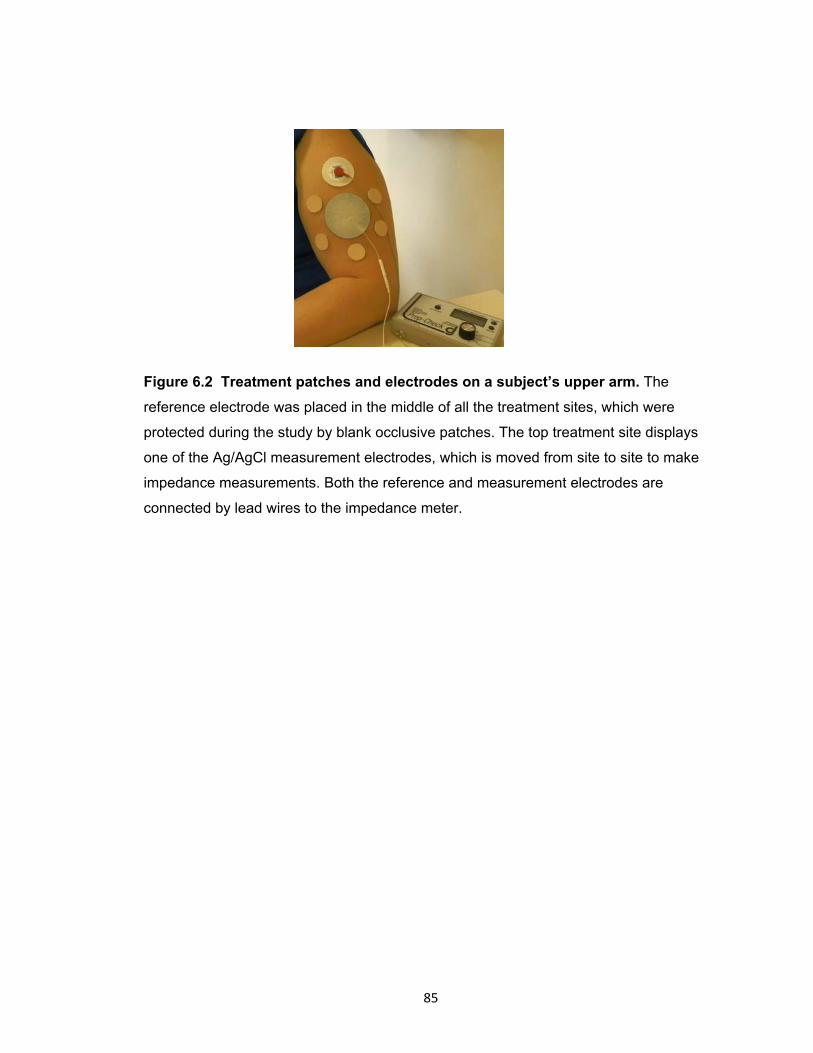
85
Figure 6.2 Treatment patches and electrodes on a subject’s upper arm. The
reference electrode was placed in the middle of all the treatment sites, which were
protected during the study by blank occlusive patches. The top treatment site displays
one of the Ag/AgCl measurement electrodes, which is moved from site to site to make
impedance measurements. Both the reference and measurement electrodes are
connected by lead wires to the impedance meter.
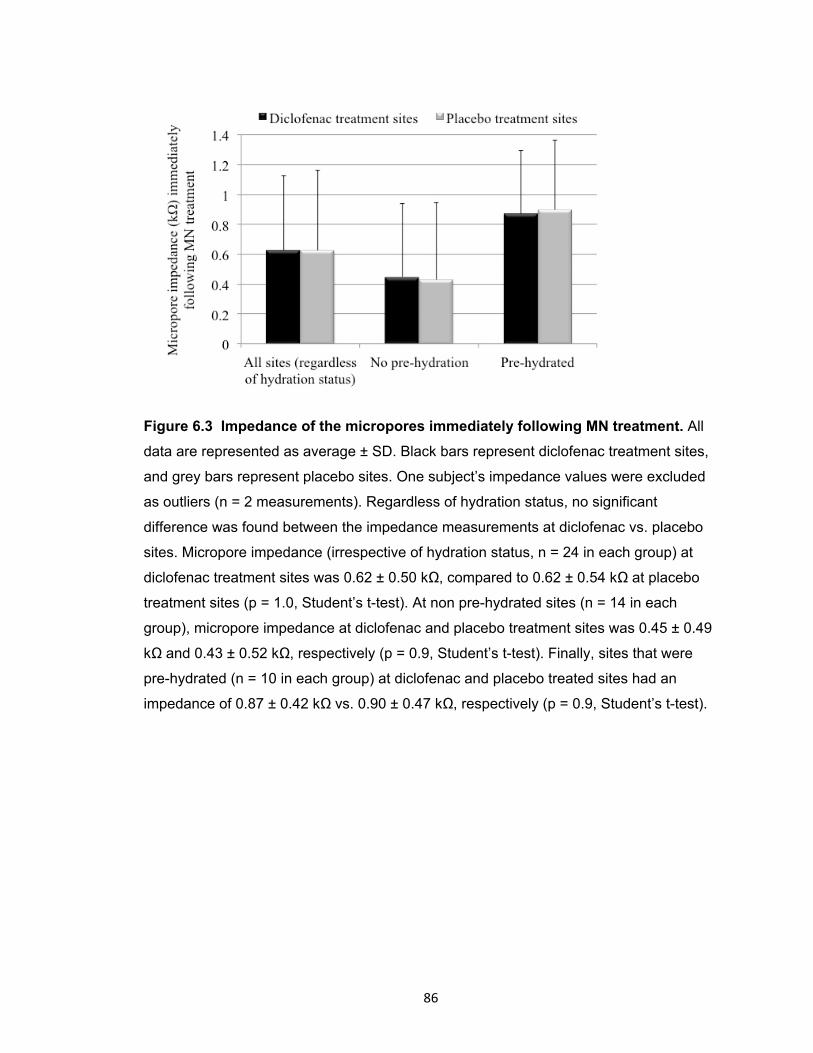
86
Figure 6.3 Impedance of the micropores immediately following MN treatment. All
data are represented as average ± SD. Black bars represent diclofenac treatment sites,
and grey bars represent placebo sites. One subject’s impedance values were excluded
as outliers (n = 2 measurements). Regardless of hydration status, no significant
difference was found between the impedance measurements at diclofenac vs. placebo
sites. Micropore impedance (irrespective of hydration status, n = 24 in each group) at
diclofenac treatment sites was 0.62 ± 0.50 kΩ, compared to 0.62 ± 0.54 kΩ at placebo
treatment sites (p = 1.0, Student’s t-test). At non pre-hydrated sites (n = 14 in each
group), micropore impedance at diclofenac and placebo treatment sites was 0.45 ± 0.49
kΩ and 0.43 ± 0.52 kΩ, respectively (p = 0.9, Student’s t-test). Finally, sites that were
pre-hydrated (n = 10 in each group) at diclofenac and placebo treated sites had an
impedance of 0.87 ± 0.42 kΩ vs. 0.90 ± 0.47 kΩ, respectively (p = 0.9, Student’s t-test).
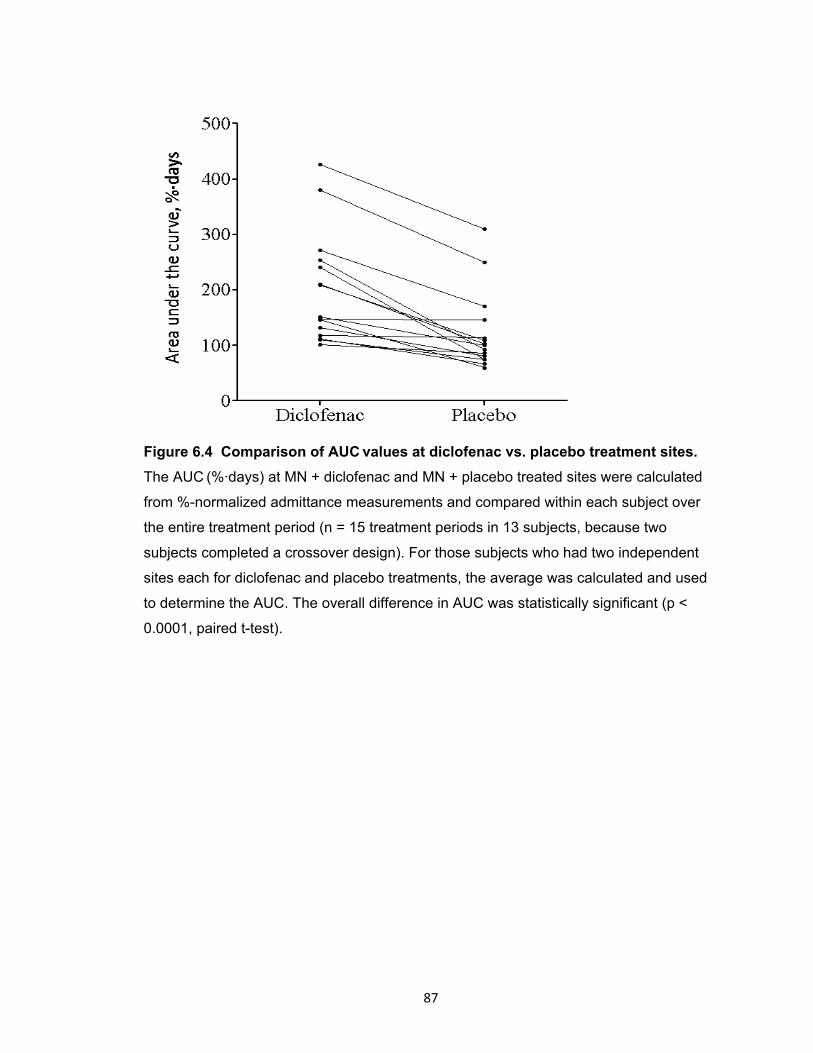
87
Figure 6.4 Comparison of AUC values at diclofenac vs. placebo treatment sites.
The AUC (%·days) at MN + diclofenac and MN + placebo treated sites were calculated
from %-normalized admittance measurements and compared within each subject over
the entire treatment period (n = 15 treatment periods in 13 subjects, because two
subjects completed a crossover design). For those subjects who had two independent
sites each for diclofenac and placebo treatments, the average was calculated and used
to determine the AUC. The overall difference in AUC was statistically significant (p <
0.0001, paired t-test).
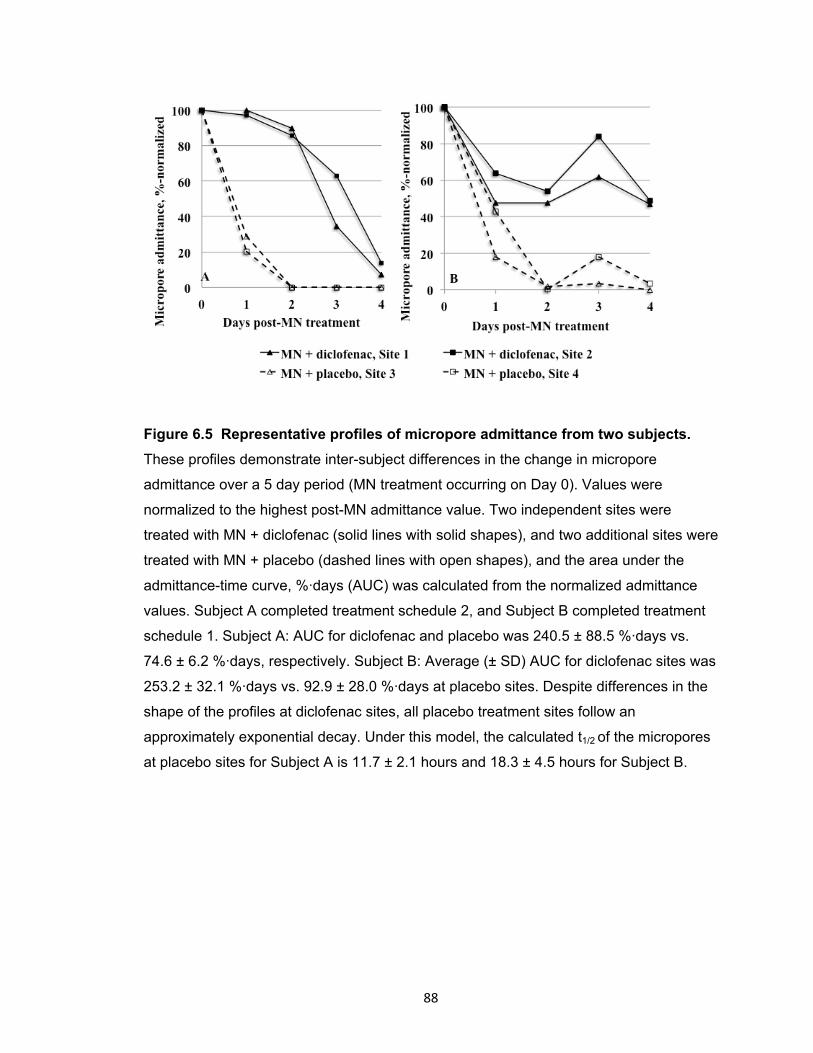
88
Figure 6.5 Representative profiles of micropore admittance from two subjects.
These profiles demonstrate inter-subject differences in the change in micropore
admittance over a 5 day period (MN treatment occurring on Day 0). Values were
normalized to the highest post-MN admittance value. Two independent sites were
treated with MN + diclofenac (solid lines with solid shapes), and two additional sites were
treated with MN + placebo (dashed lines with open shapes), and the area under the
admittance-time curve, %·days (AUC) was calculated from the normalized admittance
values. Subject A completed treatment schedule 2, and Subject B completed treatment
schedule 1. Subject A: AUC for diclofenac and placebo was 240.5 ± 88.5 %·days vs.
74.6 ± 6.2 %·days, respectively. Subject B: Average (± SD) AUC for diclofenac sites was
253.2 ± 32.1 %·days vs. 92.9 ± 28.0 %·days at placebo sites. Despite differences in the
shape of the profiles at diclofenac sites, all placebo treatment sites follow an
approximately exponential decay. Under this model, the calculated t1/2 of the micropores
at placebo sites for Subject A is 11.7 ± 2.1 hours and 18.3 ± 4.5 hours for Subject B.
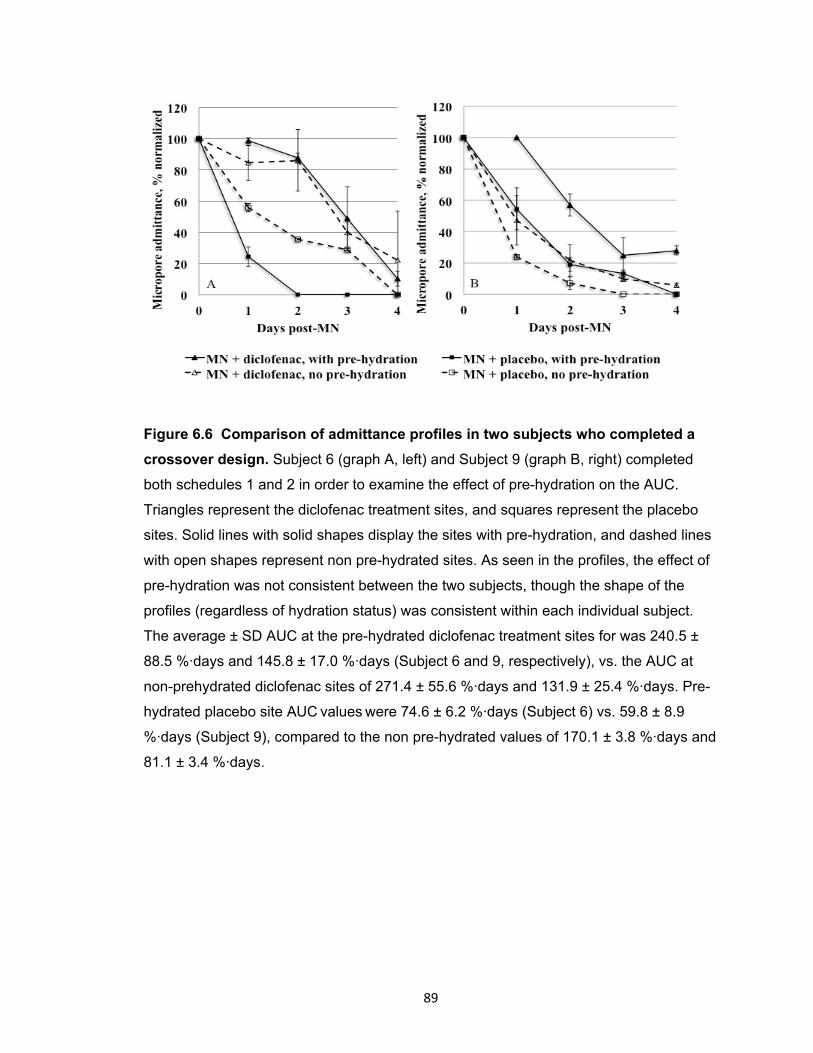
89
Figure 6.6 Comparison of admittance profiles in two subjects who completed a
crossover design. Subject 6 (graph A, left) and Subject 9 (graph B, right) completed
both schedules 1 and 2 in order to examine the effect of pre-hydration on the AUC.
Triangles represent the diclofenac treatment sites, and squares represent the placebo
sites. Solid lines with solid shapes display the sites with pre-hydration, and dashed lines
with open shapes represent non pre-hydrated sites. As seen in the profiles, the effect of
pre-hydration was not consistent between the two subjects, though the shape of the
profiles (regardless of hydration status) was consistent within each individual subject.
The average ± SD AUC at the pre-hydrated diclofenac treatment sites for was 240.5 ±
88.5 %·days and 145.8 ± 17.0 %·days (Subject 6 and 9, respectively), vs. the AUC at
non-prehydrated diclofenac sites of 271.4 ± 55.6 %·days and 131.9 ± 25.4 %·days. Pre-
hydrated placebo site AUC values were 74.6 ± 6.2 %·days (Subject 6) vs. 59.8 ± 8.9
%·days (Subject 9), compared to the non pre-hydrated values of 170.1 ± 3.8 %·days and
81.1 ± 3.4 %·days.
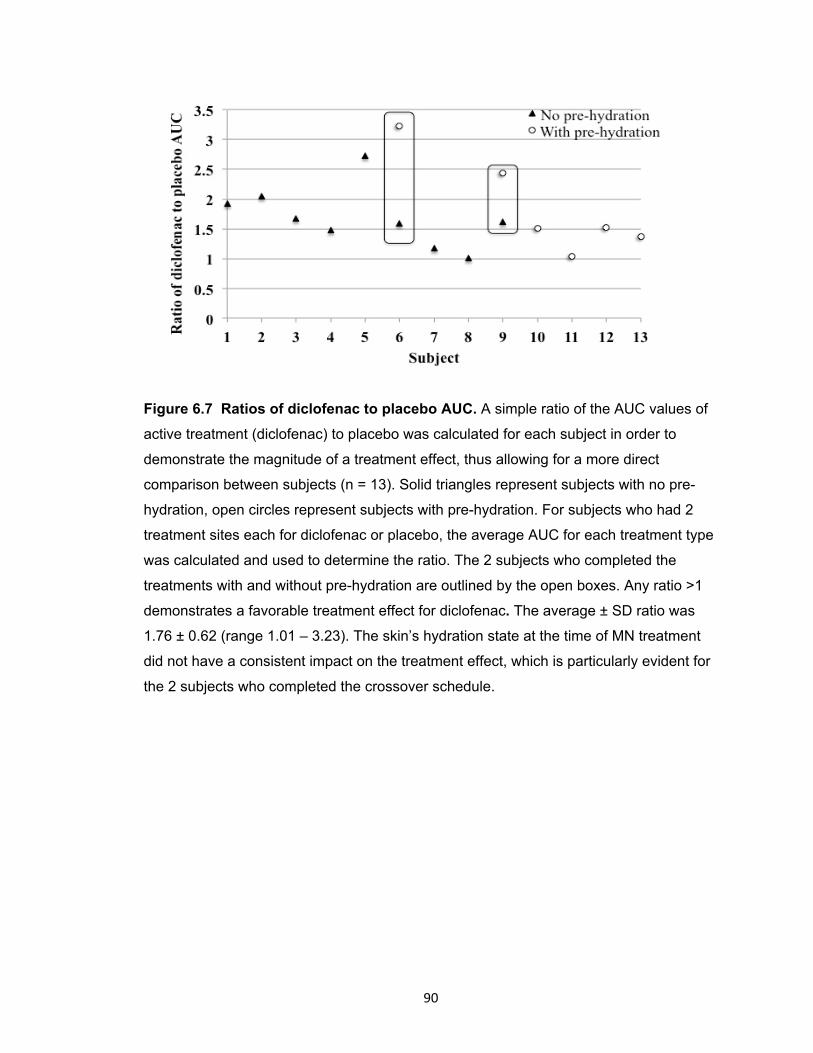
90
Figure 6.7 Ratios of diclofenac to placebo AUC. A simple ratio of the AUC values of
active treatment (diclofenac) to placebo was calculated for each subject in order to
demonstrate the magnitude of a treatment effect, thus allowing for a more direct
comparison between subjects (n = 13). Solid triangles represent subjects with no pre-
hydration, open circles represent subjects with pre-hydration. For subjects who had 2
treatment sites each for diclofenac or placebo, the average AUC for each treatment type
was calculated and used to determine the ratio. The 2 subjects who completed the
treatments with and without pre-hydration are outlined by the open boxes. Any ratio >1
demonstrates a favorable treatment effect for diclofenac. The average ± SD ratio was
1.76 ± 0.62 (range 1.01 – 3.23). The skin’s hydration state at the time of MN treatment
did not have a consistent impact on the treatment effect, which is particularly evident for
the 2 subjects who completed the crossover schedule.
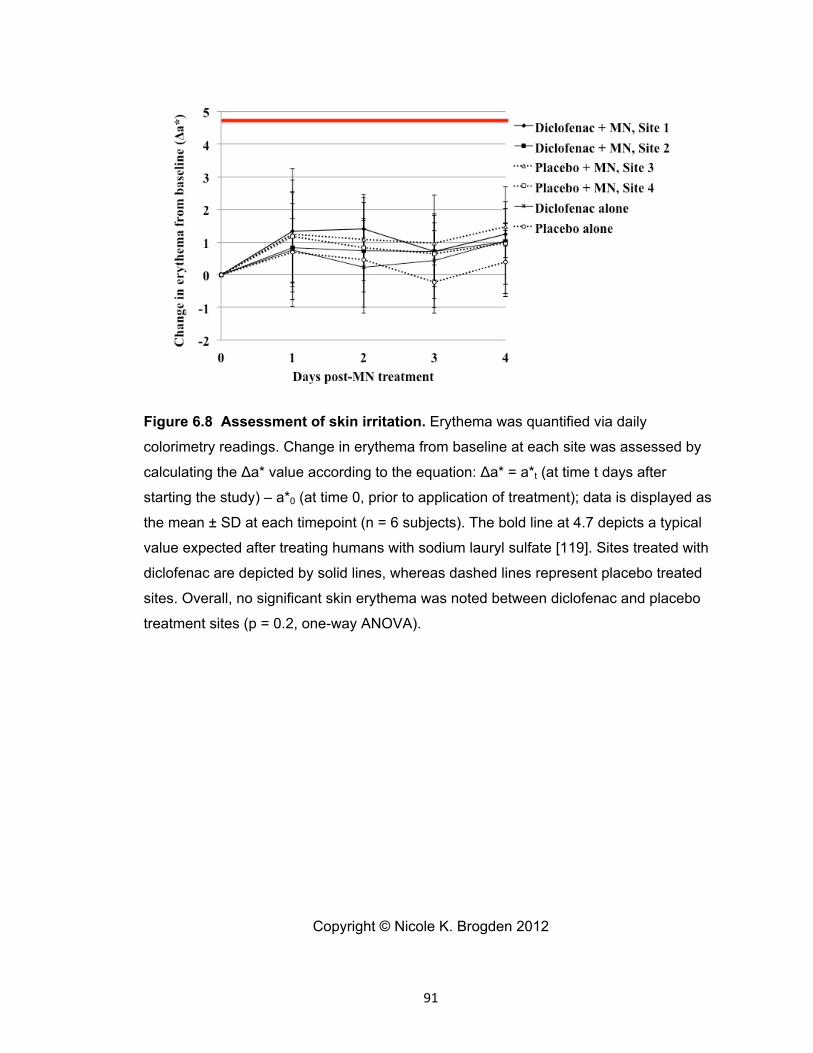
91
Figure 6.8 Assessment of skin irritation. Erythema was quantified via daily
colorimetry readings. Change in erythema from baseline at each site was assessed by
calculating the Δa* value according to the equation: Δa* = a*t (at time t days after
starting the study) – a*0 (at time 0, prior to application of treatment); data is displayed as
the mean ± SD at each timepoint (n = 6 subjects). The bold line at 4.7 depicts a typical
value expected after treating humans with sodium lauryl sulfate [119]. Sites treated with
diclofenac are depicted by solid lines, whereas dashed lines represent placebo treated
sites. Overall, no significant skin erythema was noted between diclofenac and placebo
treatment sites (p = 0.2, one-way ANOVA).
Copyright © Nicole K. Brogden 2012
92
Chapter 7
In vitro determination of naltrexone flux and quantification of diclofenac in
microneedle-treated skin and in vivo assessment of skin irritation
7.1 Introduction
In recent years, microneedle-assisted transdermal delivery has proven to be a
minimally invasive, patient-friendly technique for delivering drug compounds across the
impermeable outer layers of the skin. Application of microneedles (MNs) to the skin
creates micropores in the stratum corneum (SC, the outermost layer of the skin) through
which a drug can diffuse and bypass the barrier functions of the SC. While only microns
in dimension, the micropores allow for percutaneous delivery of macromolecules (insulin,
oligonucleotides, human growth hormone) [47, 53, 56, 57, 132] and compounds that
cannot otherwise permeate the lipophilic structure of the SC (naltrexone, desmopressin)
[9, 11, 48].
This unique physical enhancement method offers immense flexibility for means
of application, and previous reports have described successful drug delivery using
dissolving MNs, coated MNs, hollow MN systems, and solid metal and polymer MN
arrays. In the “poke (press) and patch” technique, a solid MN array is applied to the skin
once and removed, creating a grid of micropores in the SC. A drug gel, solution, or
patch can be applied over the MN-treated skin, permitting the drug to passively diffuse
from the formulation into the micropores, ultimately resulting in systemic delivery. The
first drug to be described in a human pharmacokinetic study using this MN technique
was naltrexone (NTX), an opioid mu-receptor antagonist approved for the treatment of
opioid and alcohol abuse. Therapeutic plasma concentrations of NTX were detectable
for 48 – 72 hours following one application of a MN array with topical application of a
16% NTX gel [9].
While the “poke and patch” technique is both simple and effective, the drug
delivery window is dependent on the lifetime of the newly created micropores. When the
skin remains exposed to air after application of the MNs, the barrier function of the SC is
restored within a period of 15 minutes to 2 hours [10, 13, 14]. That timeframe is
extended to approximately 48 – 72 hours when the skin is occluded beneath a patch or
impermeable membrane, as demonstrated by impedance spectroscopy and
pharmacokinetic plasma data from humans and guinea pigs [9, 12, 14].
93
While the specific physiologic events contributing to micropore re-sealing are not
explicitly understood, it is possible that subclinical inflammation is involved in the early
phases of barrier restoration, as inflammatory responses are one of the first steps of the
skin’s wound healing cascade. In fact, previous work from our lab (Banks, et al) has
demonstrated that application of topical diclofenac sodium (a non-specific anti-
inflammatory drug) to MN-treated skin in hairless guinea pigs allows for delivery of NTX
through the skin for up to 7 days [11]. Additionally, as described earlier, (Research Plan
3.2) this effect can also be achieved in human subjects, as seen by a significant
difference in micropore closure kinetics between diclofenac and placebo gels when
applied to MN-treated skin.
A proof-of-concept human study is necessary (Research Plan 3.6)
to characterize the pharmacokinetics of NTX after application to MN-treated skin in the
presence of diclofenac sodium for extending micropore lifetime. The overall objective of
the studies in this chapter was to optimize the dosing scenario for a pharmacokinetic
study, based on 3 parameters: 1) local concentration of diclofenac sodium in MN-treated
skin in vitro; 2) in vitro flux of NTX in the presence of diclofenac sodium or placebo gel;
3) the irritation potential of the combination of diclofenac sodium and NTX when applied
to the same treatment area. The data presented in this chapter satisfy Research Plans
3.3 and 3.4.
7.2 Methods and materials
7.2.1 Preparation of drug formulations
The following components were purchased through the University of Kentucky:
Solaraze® gel (PharmaDerm, Melville, NY), naltrexone HCl (Mallinkrodt, Mansfield, MA),
propylene glycol (VWR, Atlanta, GA), benzyl alcohol (Fisher Scientific, Hanover Park,
IL), polyethylene glycol methyl ether 350 (Dow Corporation, Louisville, KY), and sterile
water for injection. Hyaluronate sodium (Rita Corporation, Crystal Lake, IL) and
hydroxyethylcellulose (HEC, Ashland Specialty Ingredients, Wilmington, DE) were gifts
from the companies. An 11% NTX•HCl gel was prepared as follows: 110 mg/ml
NTX•HCl, 10% propylene glycol, 1% v/v benzyl alcohol, 89% sterile water, and 2.5%
HEC. The placebo gel was prepared with all components in the same proportions
(minus the diclofenac sodium) as the active Solaraze® gel): 20% polyethylene glycol
methyl ether 350, 1% benzyl alcohol, 79% sterile water, and 2.5% hyaluronate sodium.
94
All of the components were combined, vortexed, and allowed to stir on a stir plate for
approximately 5 minutes before the hyaluronate sodium was added as the gelling agent.
7.2.2 In vitro diffusion studies
Full-thickness Yucatan miniature pig skin was harvested from the dorsal surface
of a euthanized animal (approximately 6 months old). The animal protocol was
approved by the University of Kentucky IACUC. A scalpel was used to remove all
subcutaneous fat, and all skin samples were approximately 1 – 2 mm thick, as measured
by calipers. All skin samples were stored at -20° C until use; a 30 minute thawing period
was allowed before using the skin for diffusion studies. The skin was treated with a solid
metal, 5 MN “in-plane” array (Mark Prausnitz’s lab, Georgia Institute of Technology,
Atlanta, GA) with the following MN dimensions: 750 μm long, 200 μm wide, and 75 μm
thick. For the MN treatment, a polydimethylsiloxane polymer wafer was placed beneath
the skin in order to mimic the natural mechanical support of the tissue underlying the
skin in vivo. MN insertion was achieved by manually pressing the array gently into the
skin and removing it immediately. Twenty applications were applied to create 100 non-
overlapping micropores on a 0.95 cm2 area of skin.
A PermeGear In-Line flow-through diffusion system (Hellertown, PA, USA) was
used for skin diffusion studies. The skin was mounted into the diffusion cells and the
experiments were initiated by charging the cells with 100 or 200 μl of Solaraze® gel ±
500 μl of NTX gel. The Solaraze® gel was rubbed gently into the skin using a Teflon
rod, followed by application of the NTX gel over top. For the studies determining the
local skin concentration of diclofenac in the absence of NTX, the receiver solution
consisted of nanopure water with 20% EtOH, adjusted to a pH of 7.4; the EtOH generally
increases drug solubility in the receiver solution. For the studies containing both
diclofenac and NTX, the receiver solution consisted of isotonic pH 7.4 HEPES-buffered
Hank’s balanced salts with 87 μM gentamicin sulfate (to prevent bacterial growth in the
receiver solution). For all studies the receiver solution was kept at a flow rate of 1.5
ml/min and temperature of 37°C and the skin temperature was maintained at 32 - 35° C
with a circulating water bath. Samples were collected at 6 hour intervals and stored at
4°C until analysis by HPLC.
7.2.2.1 HPLC conditions: The HPLC system consisted of the following
components: Waters 717 plus autosampler, Waters 600 quaternary pump, and a Waters
2487 dual wavelength absorbance detector with Waters Empower™ software. The UV

95
detector was set to wavelengths of 215 or 278 nm and used with a Brownlee (Wellesley,
MA, USA) C-18 reversed phase Spheri-5 μm column (220x4.6 mm) with a C-18 reversed
phase guard column (15x3.2mm, Perkin Elmer®, Waltham, MA, USA). For analyzing
NTX flux, the mobile phase was 70:30 v/v ACN:buffer (0.1% TFA with 0.065% 1-octane
sulfonic acid sodium salt, adjusted to pH 3 with TEA). A flow rate of 1.5 ml/min and run
time of 4 minutes (5 minutes for samples containing only diclofenac sodium) were used,
with an injection volume of 100 μl. Standard curves of diclofenac sodium and NTX in the
linear range of 100 – 10,000 ng/ml were analyzed and displayed excellent linearity under
the above conditions (R2 always ≥ 0.97). NTX had a retention time of 2.55 ± 0.1 min,
while diclofenac sodium had a retention time of 3.78 ± 0.3 minutes.
7.2.3 Quantification of diclofenac in the skin
At the end of each diffusion experiment, the skin was removed from the diffusion
apparatus, rinsed twice with water and blotted gently with Kimwipes® to remove excess
drug from the skin surface. The skin sample was tape stripped twice and the skin weight
was recorded. The skin was suspended in acetonitrile and shaken in a 32°C water bath
overnight. Diclofenac concentration was analyzed by HPLC. Skin concentrations were
expressed as μm/gram of skin.
7.2.4 Determination of naltrexone flux
The cumulative quantity of NTX collected in the receiver solution was plotted as a
function of time and the flux was determined from the slope of the line at steady state.
Fick’s First Law of diffusion was used according to the equation:
Equation 7.1
where A is the area of the skin (0.95 cm2), M is the cumulative amount of NTX
permeating through the skin (nmol) during time (t), Jss is the flux at steady state
(nmol/cm2·hr), P is the effective permeability coefficient (cm/h), and ΔC represents the
difference in NTX concentration between the donor and receiver compartments. Sink
conditions were maintained in the receiver solution throughout the experiment, allowing
ΔC to be approximated by the initial drug concentration applied to the donor
compartment.
96
7.2.5 In vivo assessment of skin irritation
7.2.5.1 Microneedle treatment and gel application: Male and female hairless
guinea pigs weighing approximately 800 - 1000 g each were treated on the dorsal
surface with 50 MN arrays of the following MN dimensions: 750 μm long, 200 μm wide,
and 75 μm thick. The arrays were sterilized before treatment by autoclaving under high
pressure saturated steam at 121° C for 15 minutes. Immediately prior to treatment, the
arrays were assembled into adhesive patches with sterile Arclad adhesive backing
(Adhesives Research, Inc., Glen Rock, PA), allowing for very close contact between the
MNs and the flexible skin during treatment. The treatment sites were cleaned with
isopropyl alcohol wipes and allowed to dry before applying the MN arrays. Each
treatment site received two applications of a MN array, with the 2nd application rotated 45
degrees so as not to overlap the first, to create 100 non-overlapping micropores. MN
application is achieved by gently pressing the array onto the skin for approximately 15 –
20 seconds followed by immediate removal of the array. All MN applications were
performed by the same investigator in order to avoid inter-investigator variability.
Diclofenac sodium (delivered via application of 100 or 200 µl of Solaraze® gel) and 11%
NTX gel (500 µl) were applied to the skin immediately post-MN and then at various
intervals for the remaining days in the study (treatment paradigms described in Table
7.1).
7.2.5.2 Assessment of local erythema: Tristimulus colorimetry was used to
evaluate the skin irritation potential of the gel combination when applied in vivo to MN-
treated hairless guinea pigs. Erythema was quantified with a Konica Minolta meter
(ChromaMeter CR-400, Konica Minolta, Japan) according to previously published
guidelines [115]. Tristimulus colorimetry measures a three-dimensional scale of color
(L*a*b*). The L* value (luminance) represents the black/white axis and the relative
brightness, which is expressed as a range of total black (L* = 0) to pure white (L* = 100).
The red/green axis is represented by the a* value, as increasing redness (i.e. erythema)
results in higher a* values (+100 represents full red); b* describes the yellow/blue axis.
The colorimeter was calibrated daily against a white plate provided by Konica Minolta.
Measurements were made by placing the head of the instrument gently on the skin area
to record the color reflectance. Readings were taken in triplicate at every site at each
time point and the mean a* value was calculated. The change in erythema was reported
as a change from the baseline, Δa*, calculated as Δa* = a*t (at time t days after starting
the study) – a*0 (at time 0, prior to application of treatment).
97
7.2.6 Data analysis
Statistical analysis was performed using Student’s t-tests and one-way ANOVA
with Tukey's post-hoc analysis (GraphPad Prism®, version 5.04); p<0.05 was
considered statistically significant.
7.3 Results
7.3.1 Diclofenac skin concentration, in the absence of naltrexone
Diclofenac in the skin was quantified following the same treatment schedule as
the proof-of-concept human micropore lifetime study (Research Plan 3.2). Two hundred
µl of Solaraze® (equivalent to 6 mg of diclofenac sodium) was applied to MN-treated
skin daily for 5 days, resulting in local skin concentrations ranging from 0.38 to 0.84
μmol/g of skin, from 48 to 96 hours. A second study was also conducted to examine
diclofenac skin concentrations following one-time application of 200 µl of Solaraze®
immediately post-MN treatment. Resulting skin concentrations spanned a range of 0.32
to 0.96 μmol/g of skin, and the concentration steadily increased daily. There was no
significant difference between skin concentrations following daily application vs. one
application of diclofenac immediately post-MN (p > 0.05, one-way ANOVA). All skin
concentrations can be seen in Table 7.1.
7.3.2 Diclofenac skin concentration, in the presence of naltrexone
To determine the local concentration of diclofenac in the skin in the presence of
an 11% NTX gel (to mimic the conditions that will be used in an upcoming
pharmacokinetic study), 100 µl of Solaraze® gel and 500 µl of NTX gel were applied to
MN-treated skin at baseline and then re-applied every 48 hours or just once at 96 hours
post-MN. When applied every 48 hours (a total of 3 re-applications over 7 days), the
skin concentration of diclofenac ranged from 0.96 to 3.14 μmol/g of skin, which was not
significantly different from the concentrations of 0.59 to 2.3 μmol/g of skin observed
when the treatment schedule was prolonged to one re-application at 96 hours post-MN
treatment (p > 0.05, one- way ANOVA).
7.3.3 In vitro flux of naltrexone through microporated skin
The flux of NTX in the presence of diclofenac sodium or placebo was evaluated
to calculate an appropriate number of patches for a human pharmacokinetic study.
Table 7.1 and Figure 7.1 display the mean (± SD) flux values under the various
98
conditions. The flux of NTX alone through microporated skin was 195.66 ± 47.35
nmol/cm2·hr, which was not significantly different from the flux of 170.84 ± 32.12
nmol/cm2·hr, obtained when NTX was applied in the presence of a 2.5% hyaluronate
sodium placebo gel (p = 0.49, Student’s t-test). In contrast, when co-applied with
diclofenac sodium, the resulting NTX flux of 42.58 ± 7.88 nmol/cm2·hr was significantly
lower compared to NTX alone (p = 0.005) or in the presence of a placebo gel (p =
0.003).
7.3.4 Tolerability of microneedle treatments and gels
Three hairless guinea pigs were treated with 100 μl of diclofenac sodium and 500
μl of 11% NTX gel for a total of 6 treatment courses (2 independent courses per guinea
pig). Four sites were evaluated: 2 MN-treated sites, one intact skin site treated with gels
alone, and one non-treated control site that was occluded with a blank patch. The
treatments were well tolerated. An initial increase in erythema was noted across all
animals from baseline to the 48 hour post-MN measurement, as evidenced by a mean (±
SD) Δa* of 2.85 ± 2.97 (range -2.24 to 6.89) at one MN-treated site, and 2.22 ± 2.83
(range -0.01 to 5.04) at the second MN-treated site. Despite the initial increase, the Δa*
quickly subsided and decreased to a mean of 0.63 ± 1.14 (96 hours) and -0.8 ± 0.97
(144 hours) at Site 1 (MN treated) and 0.34 ± 0.62 (96 hours) and 0.41 ± 0.68 (144
hours) at Site 2 (MN treated). There was no significant difference between any of the
applied treatments (p = 0.11, one-way ANOVA). All Δa* values can be seen in Table
7.3, and the trend of Δa* can be seen in Figure 7.2.
7.4 Discussion
Previous animal and human studies have demonstrated that micropore lifetime
(following one-time application of a MN array) can be extended via topical application of
diclofenac sodium [11]. This novel drug delivery principle is only relevant in a clinical
scenario, however, if 2 conditions can be simultaneously achieved: 1) a drug compound
can be delivered to therapeutic plasma concentrations for the duration of the micropore
lifetime (in this case, NTX serving as the model compound for systemic delivery); and 2)
the skin is not irritated by the diclofenac, NTX gel, or the combination of both
compounds. An upcoming pharmacokinetic study is planned to assess these
parameters in human volunteers (Research Plan 3.6) via application of a NTX gel to skin
treated with MNs and diclofenac. The objective of the current studies was to determine
99
the flux of NTX through microporated Yucatan pig skin in vitro, local concentrations of
diclofenac in the skin, and irritation potential of the combination of diclofenac and NTX
gels. The information gained from this work will allow for calculation of an appropriate
patch number, gel volume, and treatment schedule for the human pharmacokinetic
study.
7.4.1 Local diclofenac concentrations under various treatment paradigms
The proof-of-concept human studies described earlier (Research Plan 3.2)
established that daily application of Solaraze® gel significantly extends micropore
lifetime compared to placebo conditions. An additional treatment schedule in that study
also demonstrated that daily application may not be necessary to exhibit effects on
micropore lifetime, as similar results were observed in subjects only treated with
diclofenac once at baseline and again at 96 hours post-MN. Thus, the current studies
determined local concentrations of diclofenac in MN-treated skin under various
schedules of diclofenac application (daily, every 48 hours, or just one re-application at
96 hours post-MN). The concentration of diclofenac in the skin was determined under
similar conditions to the proof-of-concept study, in which 200 µl of Solaraze® gel was
applied to MN-treated skin. The concentration was notably consistent at 48 and 72
hours post-MN, and increased slightly at the 96 hour time point, likely as a result of
increased drug on the skin surface and/or accumulation of the diclofenac within the
viable epidermis. The Solaraze® formulation used to deliver the diclofenac to the
micropores is unique in that the vehicle contains 2.5% hyaluronate sodium, a large
polyanionic polysaccharide that is naturally present in almost all human organs, but is
particularly abundant in human skin. It is present in the SC, epidermis (~0.5 mg/g wet
tissue) and dermis (~0.1 mg/g wet tissue). [120]. This polysaccharide has been used
extensively in cosmetic formulations, and is particularly notable for its ability to promote
formation of a local depot of drug in the skin, allowing for a localized effect of the active
drug moiety. This property is particularly appealing for the purposes of extending
micropore lifetime, as the anti-inflammatory effects of diclofenac are only necessary in
the local micropore environment. Interestingly, there was no significant difference in the
local diclofenac concentrations when daily application of Solaraze® was compared to
one application of 200 µl immediately post-MN treatment, confirming that local drug
concentrations are sufficiently maintained without the need for daily re-application. This

100
is especially encouraging as fewer treatment applications would improve patient
satisfaction and compliance with therapy.
For the purposes of extending micropore lifetime, the diclofenac in these studies
is intended for a local effect at the micropores, and thus the minimum amount of gel that
can be applied to the skin but still achieve similar skin concentrations is desired. The
patch size that can be applied in vivo for irritation studies is somewhat restricted based
on the small size of the hairless guinea pigs, and a smaller patch area is also desirable
for human studies in order to increase patient satisfaction with therapy. As the only
treatment applied, 200 µl of diclofenac gel can be easily contained underneath a small
occlusive patch. However, in combination with the additional NTX gel for a
pharmacokinetic study, the volume of diclofenac gel needs to be reduced to allow for a
sufficient amount of NTX to also be contained under the patches. From a practical
standpoint, 100 µl of gel is sufficient to completely cover the micropore treatment area
and be rubbed into the skin, while allowing enough space under the patch to allow for up
to 500 μl of the NTX gel. The local skin concentrations of diclofenac in microporated
skin were determined following application of 100 µl of Solaraze® at baseline, with re-
application every 48 hours or just once at 96 hours. This was in combination with 500 µl
of an 11% NTX gel, to determine that the presence of another drug moiety would not
affect local diclofenac concentrations. There was no significant difference in diclofenac
concentrations between the treatment schedules, or compared to the application of 200
µl daily. This confirms that application of 100 µl of Solaraze® in the presence of NTX
provides local concentrations of diclofenac sufficient to maintain micropore lifetime,
under a variety of application schedules.
7.4.2 In vitro naltrexone flux in the presence of diclofenac
In order to calculate the appropriate number of NTX patches for safe and
effective delivery in human subjects, it was necessary to determine the flux of NTX in the
presence or absence of diclofenac. In the current study, the local concentrations of
diclofenac were adequately maintained in the presence of the NTX gel, though the
interaction of the 2 active moieties created a hindrance to the flux of NTX through the
micropores, demonstrated by the significant decrease in flux from 195.66 ± 47.35
nmol/cm2•hr (NTX alone) to 42.58 ± 7.88 nmol/cm2•hr (NTX + diclofenac). This
decrease in the flux was not observed in the placebo conditions, in which a 2.5%
hyaluronate sodium placebo was applied to the MN-treated skin in lieu of the diclofenac
101
formulation. The resulting NTX flux under placebo conditions was 170.84 ± 32.12
nmol/cm2•hr, which was not significantly different from the NTX gel alone. All flux values
can be seen in Table 7.2 and Figure 7.1.
The basis for the decrease in flux observed between when Solaraze® and NTX
gels are applied together is likely due to the differing physicochemical characteristics of
the active moieties, diclofenac sodium and NTX•HCl. When co-applied to a small
treatment area, a mild precipitate forms at the interface of the gels, and there are a few
possible explanations for how this might decrease the flux of NTX. First, the precipitate
may initially be physically blocking the micropores, which would impede this drug
pathway to the underlying circulation. Second, the NTX that precipitates out of the gel
formulation would decrease the diffusional gradient, thus reducing the driving force for
the passive diffusion of the NTX. Despite these limitations, the flux of NTX in the
presence of diclofenac is still adequate to allow for therapeutic systemic delivery in
humans; in fact, the flux is similar to that observed in the in vitro studies used for patch
calculations in the first human pharmacokinetic study with NTX (39.0 ± 13.1
nmol/cm2•hr) [9]. The formation of a precipitate between the 2 independent gel
formulations also provides justification for the development of a codrug of diclofenac and
NTX, in which the 2 molecules are joined by a chemical linker. Upon entry into the skin
the linker is enzymatically cleaved by skin enzymes, releasing the active moieties and
allowing for delivery of NTX while providing a local diclofenac concentration from the
same formulation [133]. Thus, the application of 2 separate gels creates some logistical
challenges, but in spite of these limitations the treatments are still appropriate for a
proof-of-concept human study.
7.4.3 Local erythema and tolerability of the treatments
One of the most important components of a successful transdermal delivery
system is negligible skin irritation from the patch and/or drugs applied to the skin. In the
current study we investigated the tolerability of diclofenac and NTX when co-applied to
MN-treated skin. Hairless guinea pigs are often used for studying irritation and
sensitization potential for topical and transdermal therapies, as their skin is more
sensitive to topical xenobiotics, as compared to humans [130]. This allows for a more
conservative estimation of irritation that might be expected in humans under the same
treatment conditions. In the previous diclofenac proof-of-concept human study
(Research Plan 3.2), there was no significant difference in irritation between diclofenac
102
and placebo treatments in human subjects. In the current study, the same result was
observed when diclofenac was co-applied with the NTX gel, as there was no significant
difference in ∆a* values between any treatments. This is very encouraging, as humans
are unlikely to experience irritation to the gels if they are well tolerated by the guinea
pigs. A mild increase in erythema was observed initially (at 48 hours post-MN), though
this was still lower than typical reactions observed in guinea pigs topically treated with a
known skin irritant [134]. The erythema also subsided for the remainder of the study.
Some mild irritation has been noted in previous studies of NTX applied to MN-treated
skin, so the initial increase in erythema is not necessarily surprising [9]. However, a mild
increase in the Δa* value does not necessarily correlate with erythema that would be
clinically significant for human subjects. To demonstrate this point, no subjects withdrew
from the NTX pharmacokinetic study based on local skin irritation, and the irritation
quickly subsided upon completion of the study.
Based on the diclofenac skin concentrations described above, re-application of
the gels every 48 hours is not necessary from a drug delivery standpoint. From a clinical
safety perspective, however, this dosing schedule would be appropriate for a first-in-
human study, as it allows for visual inspection of the skin every 2 days. This adds an
additional conservative safety component to the study, as the gels could be quickly
removed if any significant irritation was observed.
7.5 Conclusions
The studies described in this chapter have demonstrated that co-application of
diclofenac sodium and NTX to MN-treated skin achieves local diclofenac concentrations
suitable for prolonging micropore lifetime and sufficient NTX flux for achieving
therapeutic plasma concentrations in healthy human subjects. A variety of treatment
schedules would be appropriate for a pharmacokinetic study, allowing for a great deal of
flexibility in designing study parameters. These data also allow for calculation of an
appropriate patch number and treatment schedules suitable for human subjects, without
concern for clinically significant skin damage or irritation.
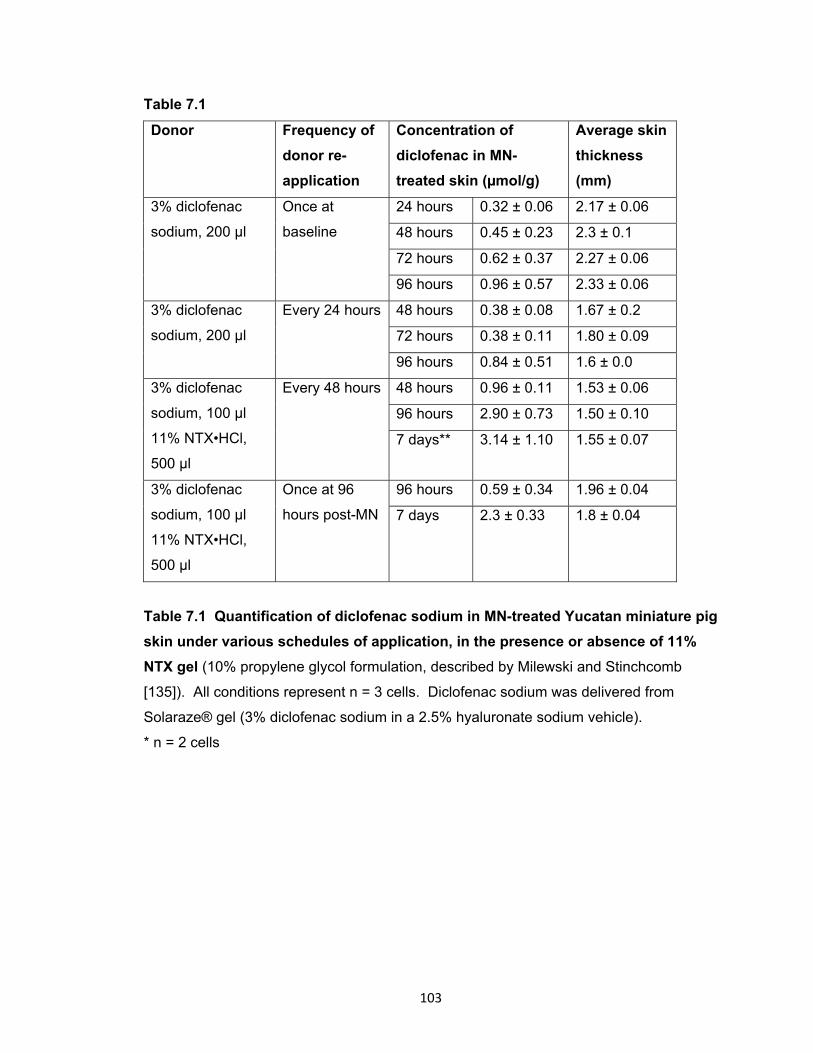
103
Table 7.1
Donor Frequency of
donor re-
application
Concentration of
diclofenac in MN-
treated skin (µmol/g)
Average skin
thickness
(mm)
3% diclofenac
sodium, 200 µl
Once at
baseline
24 hours 0.32 ± 0.06 2.17 ± 0.06
48 hours 0.45 ± 0.23 2.3 ± 0.1
72 hours 0.62 ± 0.37 2.27 ± 0.06
96 hours 0.96 ± 0.57 2.33 ± 0.06
3% diclofenac
sodium, 200 µl
Every 24 hours 48 hours 0.38 ± 0.08 1.67 ± 0.2
72 hours 0.38 ± 0.11 1.80 ± 0.09
96 hours 0.84 ± 0.51 1.6 ± 0.0
3% diclofenac
sodium, 100 µl
11% NTX•HCl,
500 µl
Every 48 hours 48 hours 0.96 ± 0.11 1.53 ± 0.06
96 hours 2.90 ± 0.73 1.50 ± 0.10
7 days** 3.14 ± 1.10 1.55 ± 0.07
3% diclofenac
sodium, 100 µl
11% NTX•HCl,
500 µl
Once at 96
hours post-MN
96 hours 0.59 ± 0.34 1.96 ± 0.04
7 days 2.3 ± 0.33 1.8 ± 0.04
Table 7.1 Quantification of diclofenac sodium in MN-treated Yucatan miniature pig
skin under various schedules of application, in the presence or absence of 11%
NTX gel (10% propylene glycol formulation, described by Milewski and Stinchcomb
[135]). All conditions represent n = 3 cells. Diclofenac sodium was delivered from
Solaraze® gel (3% diclofenac sodium in a 2.5% hyaluronate sodium vehicle).
* n = 2 cells
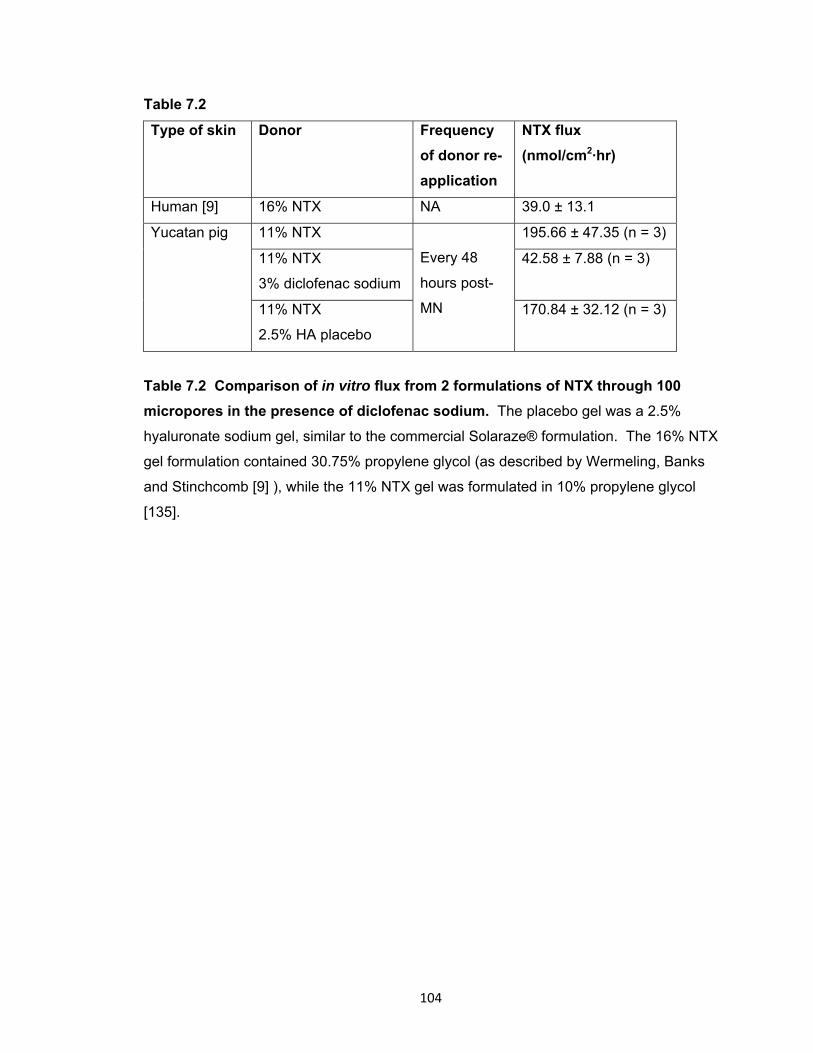
104
Table 7.2
Type of skin Donor Frequency
of donor re-
application
NTX flux
(nmol/cm2·hr)
Human [9] 16% NTX NA 39.0 ± 13.1
Yucatan pig 11% NTX
Every 48
hours post-
MN
195.66 ± 47.35 (n = 3)
11% NTX
3% diclofenac sodium
42.58 ± 7.88 (n = 3)
11% NTX
2.5% HA placebo
170.84 ± 32.12 (n = 3)
Table 7.2 Comparison of in vitro flux from 2 formulations of NTX through 100
micropores in the presence of diclofenac sodium. The placebo gel was a 2.5%
hyaluronate sodium gel, similar to the commercial Solaraze® formulation. The 16% NTX
gel formulation contained 30.75% propylene glycol (as described by Wermeling, Banks
and Stinchcomb [9] ), while the 11% NTX gel was formulated in 10% propylene glycol
[135].
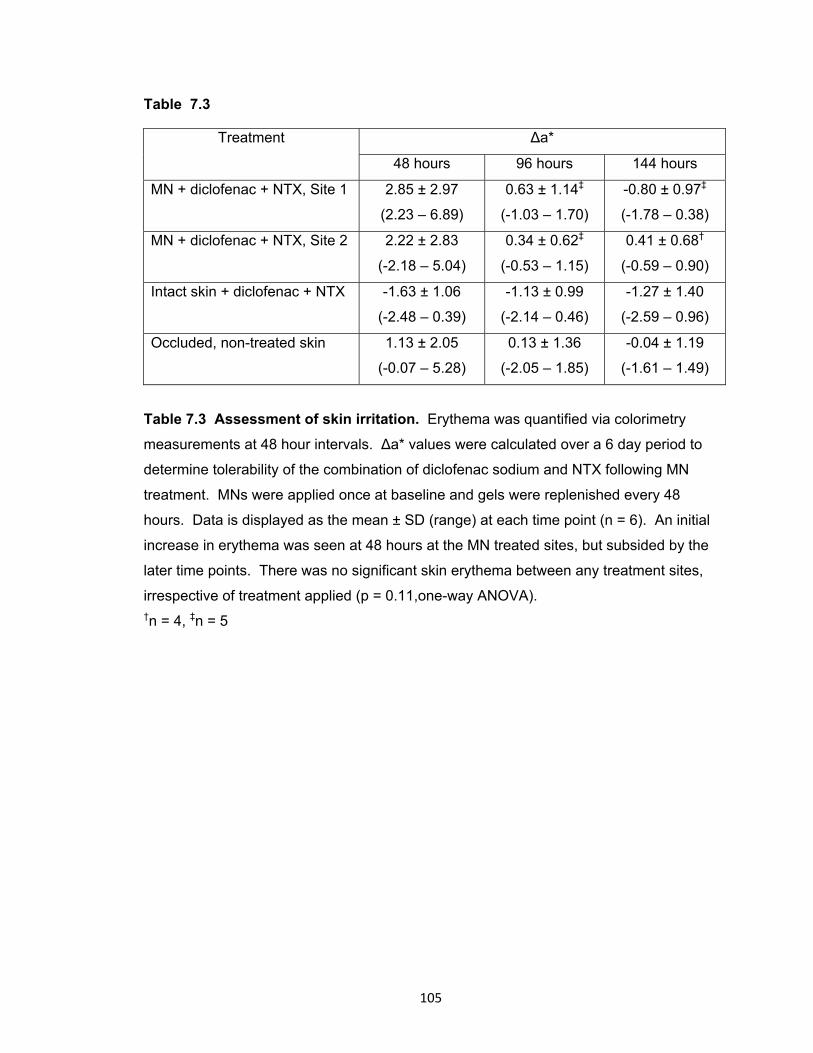
105
Table 7.3
Treatment Δa*
48 hours 96 hours 144 hours
MN + diclofenac + NTX, Site 1 2.85 ± 2.97
(2.23 – 6.89)
0.63 ± 1.14‡
(-1.03 – 1.70)
-0.80 ± 0.97‡
(-1.78 – 0.38)
MN + diclofenac + NTX, Site 2 2.22 ± 2.83
(-2.18 – 5.04)
0.34 ± 0.62‡
(-0.53 – 1.15)
0.41 ± 0.68†
(-0.59 – 0.90)
Intact skin + diclofenac + NTX -1.63 ± 1.06
(-2.48 – 0.39)
-1.13 ± 0.99
(-2.14 – 0.46)
-1.27 ± 1.40
(-2.59 – 0.96)
Occluded, non-treated skin 1.13 ± 2.05
(-0.07 – 5.28)
0.13 ± 1.36
(-2.05 – 1.85)
-0.04 ± 1.19
(-1.61 – 1.49)
Table 7.3 Assessment of skin irritation. Erythema was quantified via colorimetry
measurements at 48 hour intervals. Δa* values were calculated over a 6 day period to
determine tolerability of the combination of diclofenac sodium and NTX following MN
treatment. MNs were applied once at baseline and gels were replenished every 48
hours. Data is displayed as the mean ± SD (range) at each time point (n = 6). An initial
increase in erythema was seen at 48 hours at the MN treated sites, but subsided by the
later time points. There was no significant skin erythema between any treatment sites,
irrespective of treatment applied (p = 0.11,one-way ANOVA). †n = 4, ‡n = 5
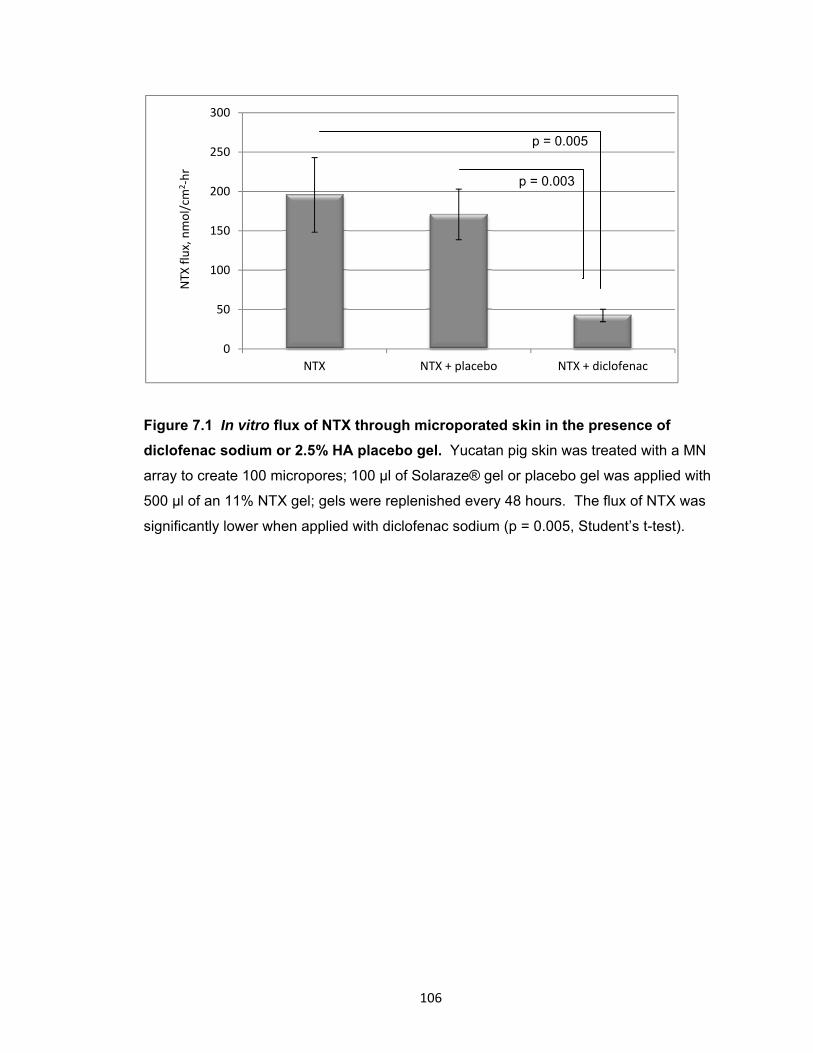
106
Figure 7.1 In vitro flux of NTX through microporated skin in the presence of
diclofenac sodium or 2.5% HA placebo gel. Yucatan pig skin was treated with a MN
array to create 100 micropores; 100 μl of Solaraze® gel or placebo gel was applied with
500 μl of an 11% NTX gel; gels were replenished every 48 hours. The flux of NTX was
significantly lower when applied with diclofenac sodium (p = 0.005, Student’s t-test).
0
50
100
150
200
250
300
NTX NTX + placebo NTX + diclofenac
NTX
flux, nmol/cm
2‐hr
p = 0.003
p = 0.005
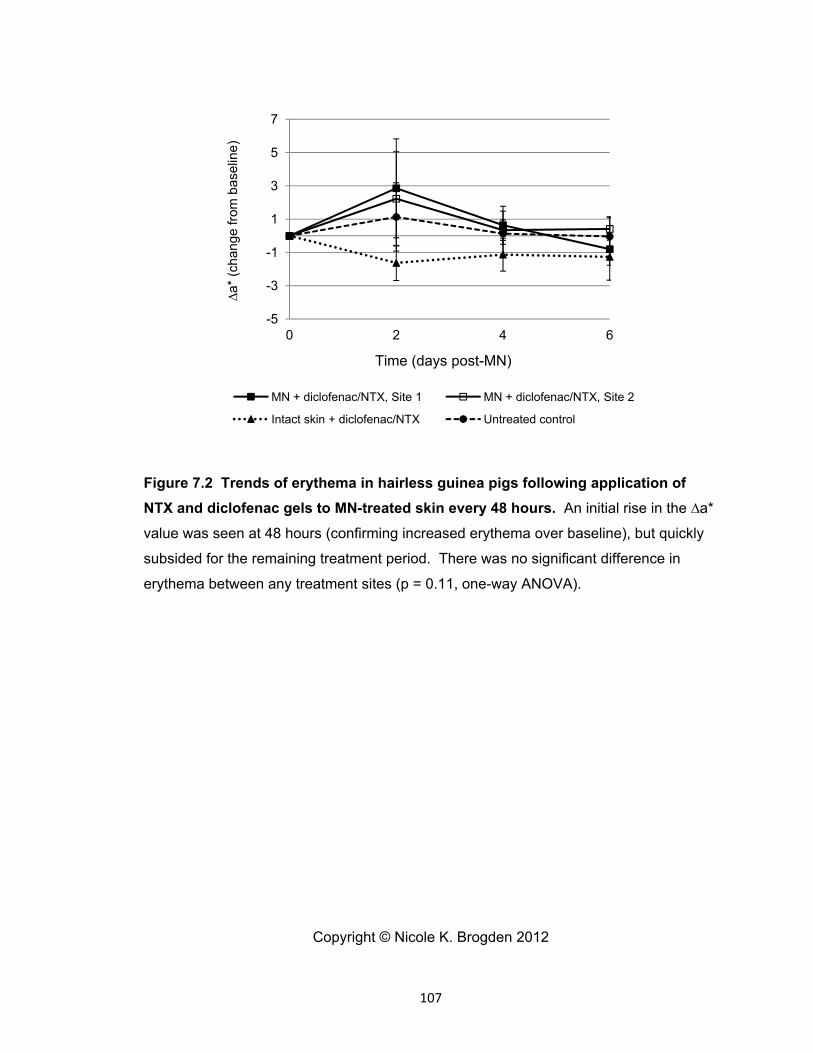
107
Figure 7.2 Trends of erythema in hairless guinea pigs following application of
NTX and diclofenac gels to MN-treated skin every 48 hours. An initial rise in the ∆a*
value was seen at 48 hours (confirming increased erythema over baseline), but quickly
subsided for the remaining treatment period. There was no significant difference in
erythema between any treatment sites (p = 0.11, one-way ANOVA).
Copyright © Nicole K. Brogden 2012
-5
-3
-1
1
3
5
7
0 2 4 6
∆a*
(ch
ange
from
bas
elin
e)
Time (days post-MN)
MN + diclofenac/NTX, Site 1 MN + diclofenac/NTX, Site 2
Intact skin + diclofenac/NTX Untreated control
108
Chapter 8
Pharmacokinetic evaluation of microneedle/diclofenac sodium enhanced 7-day
transdermal delivery of naltrexone HCl in healthy human volunteers
8.1 Introduction
Transdermal drug delivery avoids several major downfalls of other common drug
delivery paradigms (i.e. oral, injectable). Through application of patches that adhere to
the skin and passively deliver drugs into the underlying circulation, transdermal delivery
systems are able to avoid first-pass metabolism through the liver, enzymatic degradation
in the gastrointestinal tract, and the pain of an injection. One substantial challenge with
transdermal systems, however, is the strict physicochemical properties required for a
drug to effectively permeate through the skin (primarily the stratum corneum (SC), the
outermost skin layer). As such, a very limited number of drug moieties can be
successfully delivered via this route (as of 2008, the U.S. market has less than 20 drugs
approved for passive transdermal delivery systems) [2].
In order to expand the transdermal drug delivery field to a larger number of active
drug molecules, a number of physical enhancement techniques have been explored to
temporarily breach the SC, including iontophoresis, electroporation, sonophoresis, and
microneedles. Of these methods, microneedles (MNs) are arguably the most “clinically-
friendly” technique, as there is no requirement for software, equipment, or extensive
training in order to apply the MNs. While there are various application methods, the
simplest MN technique is known as the “poke (press) and patch” method, in which a MN
array is pressed gently into the skin and immediately removed, leaving behind a grid of
micropores in the SC. A drug solution, patch, or gel can be applied over the treatment
area, allowing for passive delivery of the drug through the micropores and into the
underlying circulation.
Two critical factors directly relate to the effectiveness of this method of MN-
enhanced permeation: 1) sufficient breaching of the SC via creation of micropores; and
2) the lifetime of the micropores. The topic of micropore lifetime has recently become of
great interest, as it is now known that the micropores will heal quickly (ranging from 15
minutes to 2 hours) when exposed to air, and this window can be extended to
approximately 48 – 72 hours under occluded conditions [9-12, 14]. The first
pharmacokinetic study using this MN technique (Wermeling, Banks et al) confirmed that
one-time application of MNs allows for transdermal delivery of naltrexone HCl (NTX•HCl)
109
for 48 – 72 hours in healthy human subjects, as determined by plasma concentrations of
both NTX and its active metabolite, 6-β-NTXol [9]. Previous work from this same
research group has demonstrated that topical application of diclofenac sodium, a non-
specific cyclooxygenase (COX) inhibitor, can prolong the lifetime of the micropores in
hairless guinea pigs, allowing for transdermal delivery of NTX•HCl for up to 7 days [11],
and proof-of-concept human studies have demonstrated a similar trend, using
impedance spectroscopy as a surrogate marker (described previously in Research Plan
3.1). The underlying hypothesis of these studies was that subclinical local inflammation
at the micropores contributes to the re-sealing process; as such, inhibition of this
inflammation via a topical COX inhibitor (i.e. diclofenac) blunts the re-sealing process.
Prolonging micropore lifetime alone is not beneficial, however, unless an active drug
moiety can be delivered through the micropores for a clinically relevant timeframe in
humans (7 days of delivery would be ideal for a transdermal system). The objective of
the present studies was to collect pilot pharmacokinetic human data in healthy subjects
to demonstrate delivery of NTX•HCl over a 7 day time period following one-time MN
treatment and application of a transdermal NTX•HCl gel, with co-application of
diclofenac or a placebo gel. These studies satisfy Research Plan 3.6.
8.2 Methods and materials
8.2.1 Preparation of drug formulations
The following gels and components were purchased through the University of
Kentucky: Solaraze® gel (PharmaDerm, Melville, NY), naltrexone HCl
(Covidian/Mallinckrodt, Hazelwood, MO), benzyl alcohol (Fisher Scientific, Hanover
Park, IL), polyethylene glycol monomethyl ether (Dow Chemicals, Louisville, KY),
propylene glycol (VWR, Atlanta, GA), and sterile water for injection. Hyaluronate sodium
powder (Rita Corporation, Crystal Lake, IL) and hydroxyethylcellulose (Ashland
Specialty Ingredients, Wilmington, DE) were gifts from the companies.
An 11% NTX gel was compounded as follows: 110 mg/ml NTX•HCl, propylene
glycol (10% v/v), benzyl alcohol (1% v/v), sterile water (89% v/v), and
hydroxyethylcellulose (2% w/v). A 2.5% hyaluronate sodium placebo gel (containing no
diclofenac sodium) was compounded with polyethylene glycol monomethyl ether (20%
v/v), benzyl alcohol (1% v/v), water (79% v/v), and hyaluronate sodium (2.5% w/v). To
compound the NTX•HCl gel, NTX•HCl was weighed out and allowed to dissolve in the
mixture of propylene glycol, benzyl alcohol, and water. The solution was vortexed and
110
allowed to mix on a stir plate for approximately 5 minutes before addition of the gelling
agent (HEC). The same procedure was followed for the components of the placebo gel
(no diclofenac or NTX•HCl present), with addition of the hyaluronate sodium serving as
the final gelling step. The gels were allowed to sit at room temperature overnight before
being used; no particulates were observed. All gels were compounded in the University
of Kentucky Investigational Drug Services Pharmacy. The commercially available
Solaraze® gel (3% diclofenac sodium, 2.5% hyaluronate sodium) was used to deliver
the diclofenac sodium topically.
8.2.2 Preparation of microneedle arrays and occlusive patches
The design and geometry of the MN arrays was provided by the Prausnitz lab at
the Georgia Institute of Technology. Microneedle arrays were cut into stainless steel
sheets (50 µm thick) in a 5 x 10 array, to provide 50 MNs per array; the MNs were
manually bent perpendicular to the plane of the metal substrate. In order to enhance
contact between the MNs and the skin during treatment (to overcome the mismatch
between the rigid metal of the array and the flexibility of the skin tissue), the arrays were
further assembled into adhesive patches with Arclad (Adhesives Research, Inc., Glen
Rock, PA). Each MN was 800 µm in length and 200 µm in width at the base; all arrays
were ethylene oxide sterilized at University of Kentucky Medical Center prior to use.
Blank occlusive patches were made to allow for full occlusion of the treatment
sites and containment of the drug gels over the microporated skin for the duration of the
study. A rubber ring was fabricated with a drug-impermeable membrane on one side
(Scotchpak 1109 SPAK 1.34 MIL heat-sealable polyester film; 3M, St. Paul, MN) that
was secured to the ring with 3M double-sided medical tape. The other side of the ring
also had a layer of double-sided tape to hold the patches to the skin and prevent leaking
of the gels. The patches were further secured to the skin with waterproof Bioclusive
dressing (Systagenix Wound Management, Quincy, MA).
8.2.3 Microneedle application technique
The same investigator applied all MN treatments in order to eliminate inter-
investigator variability between subjects or treatments. The process of MN insertion is
very simple: the array is pressed gently into the skin for approximately 15 – 20 seconds
and immediately removed, leaving behind a grid of 50 micropores in the SC. A 2nd
111
insertion was applied, rotating the array 45° from the first insertion, so as to create a total
of 100 non-overlapping micropores.
8.2.4 Clinical study procedures
This was an open-label pharmacokinetic study carried out in healthy human
volunteers. All study procedures were approved by the University of Kentucky
Institutional Review Board and complied with the principles set forth by the Declaration
of Helsinki. Healthy volunteers with no history of dermatologic disease were recruited.
Suitability for the study was determined through baseline blood samples (including
chemistries and cell counts), urine samples (urinalysis, pregnancy sample if applicable,
and drug of abuse screen), and a complete drug/medical history and physical exam.
Any subjects with a history of opioid or alcohol abuse or hepatitis were excluded.
Subjects were randomly assigned into 3 groups: MN + diclofenac + NTX (Group
1, n = 6 subjects), MN + placebo + NTX (Group 2, n = 2 subjects), and diclofenac + NTX
applied to intact skin (Group 3, n = 2 subjects). On Day 1 of the study, 8 treatment sites
were marked for MN treatment on the upper arm for subjects in Groups 1 and 3, and 2
treatment sites were marked for subjects in Group 2. All treatment sites (regardless of
treatment group) were wiped with 70% isopropyl alcohol pads and allowed to dry. The
subjects assigned to MN-treated groups were treated with MN arrays at each site before
gel patch application. As described above, an array of 50 MNs was applied twice to
each site, rotating the array by 45 degrees for the second insertion to create a grid of
100 non-overlapping micropores per NTX patch. For Group 1 there were 2x8 MN array
insertions per subject, creating 800 total micropores for 8 patch sites; for the subjects in
Group 2 there were 2 patch sites, and therefore 2X2 MN array insertions per subject,
creating 200 total micropores. Table 8.1 displays all of the patches and treatments
applied to the subjects in each group.
Following MN treatment, each site was treated with diclofenac gel (100 μl,
rubbed gently into the skin), followed by application of the NTX gel (500 μl) and
occlusion with an occlusive patch. The same procedure was followed with Group 2, with
placebo gel replacing the diclofenac gel. Group 3 received application of the same gels
as Group 1, in the absence of MN treatments. In all groups, 2 non-MN treated control
sites on the opposite arm received identical gel applications as the MN sites. Every 48
hours following the initial treatment the patches were removed to allow for visual
inspection of the skin for any irritation or erythema; the gels were then replenished and
112
occluded with clean patches. All gels and patches were completely removed on Day 8
(corresponding to 7 days post-MN), the final day of the study.
8.2.5 Calculation of naltrexone patch number per treatment group
In the first pharmacokinetic study demonstrating delivery of NTX•HCl through
MN-treated skin in human subjects, 4 patches were applied to the upper arm of each
subject [9]. The calculation of the number of patches for that study was based on the
equation: A = Cl * Css * Jss where Cl is the systemic clearance of NTX (3.5 L/min), Css is
the target minimum therapeutic steady state concentration (2 ng/ml) and Jss is the steady
state flux of NTX (39.0 ± 13.1 nmol/cm2•hr for the previous study). In a sample size of 6
subjects treated with MNs, this yielded a mean (± SD) NTX plasma concentration of 2.5
± 1.0 ng/ml over a 72 hour period. For the current study, the in vitro flux for the
Solaraze® + NTX condition was 42.58 ± 7.88 nmol/cm2•hr, and 170.84 ± 32.12
nmol/cm2•hr for placebo gel + NTX. In order to target a higher plasma NTX
concentration (approximately 4 ng/ml), 8 treatments sites were necessary for the
subjects in Group 1, whereas only 2 sites were necessary to achieve the same plasma
concentrations in Group 2, due to the difference in flux between the conditions.
8.2.6 Sampling schedule for pharmacokinetic analysis
On day 1, subjects came to the outpatient research unit in the Center for Clinical
and Translational Science. An indwelling catheter was inserted into the antecubital vein
and a single blood sample was drawn as a blank baseline. Following MN treatment and
NTX patch administration, serial blood samples were obtained at 15, 30, 45, and 60
minutes and at 1.5, 2, 4, 6, and 8 hours. The catheter was removed from the arm and
subjects went home for the evening. They returned to the clinic every day for the
remainder of the study, and individual venipunctures were performed for all additional
time points. For days 2 – 6, one sample was drawn every 24 hours. On days 7 and 8,
samples were drawn at 24 and 30 hours following the previous points. All blood
samples were approximately 4 ml volume, collected into 4 ml green top plastic collection
tubes, spray-coated with 60 USP units of sodium heparin (BD Research, Franklin Lakes,
NJ). Immediately following collection, blood samples were immediately centrifuged at
1308 x g for 10 minutes to separate the plasma from the red blood cells. The plasma
was pipetted off and stored at -80°C until analysis.
113
8.2.7 Plasma extraction procedure and analysis, naltrexone and 6-β-naltrexol
The plasma extraction procedure was similar to that described previously by
Valiveti et al, with minor modifications [93]. Two hundred µl of plasma was added to
1000 µl of 1:1 ethyl acetate:ACN, resulting in protein precipitation. The mixture was
vortexed for 15 seconds and immediately centrifuged for 20 minutes at 12,000 x g.
Following centrifugation, the supernatant was pipetted into glass tubes (with care taken
to not disturb the pellet) and evaporated under nitrogen. The resulting residue was re-
suspended in 200 µl of acetonitrile, vortexed for 15 seconds, and sonicated for 10
minutes. Afterwards the sample was transferred to low volume inserts in glass HPLC
vials, and injected onto the HPLC column. Working NTX•HCl and NTXol standards were
made in acetonitrile over a range of 10 to 750 ng/ml. In order to make plasma
standards, 200 µl of blank human plasma (Innovative Research, http://www.innov-
research.com/1-home) was spiked with 20 µl of the ACN working standard and extracted
as described above for the experimental plasma samples. The resulting concentrations
of the plasma standards were 1 – 75 ng/ml, which displayed excellent linearity over the
whole concentration range (R2 ≥ 0.97).
All plasma samples were analyzed on a LC-MS/MS system consisting of a HPLC
Waters Alliance 2695 Separations Module, Waters Micromass® Quattro MicroTM API
Tandem Mass Spectrometer and Masslynx Chromatography software with Waters
Quanlynx (V. 4.1) analysis software. Positive mode atmospheric pressure chemical
ionization was used for detection of both compounds (APCI+). Multiple reaction
monitoring (MRM) was carried out with the following parent to daughter ion transitions
for NTX•HCl and NTXol•HCl: m/z 341.8→323.8, m/z 343.8→325.8, respectively. The
corona voltage was 3.5 μA, cone voltage 25 V, extractor 2 V, RF lens 0.3 V, source temp
130 °C, APCI probe temperature 575 °C. The collision gas was 20 eV. Nitrogen gas was
used as a nebulization and drying gas at flow rates of 50 and 350 l/h, respectively. The
chromatographic column was a Waters Atlantis Hilic Silica 5 μm, 2.1x150, with a mobile
phase of methanol with 0.1% acetic acid:buffer 95:05 (v/v). Twenty mM ammonium
acetate and 5% methanol comprised the aqueous buffer. The injection volume was 40 μl
for all samples. Liquid chromatography was carried out in the isocratic mode at the flow
rate of 0.5 ml/min with a total run time of 4.5 min.
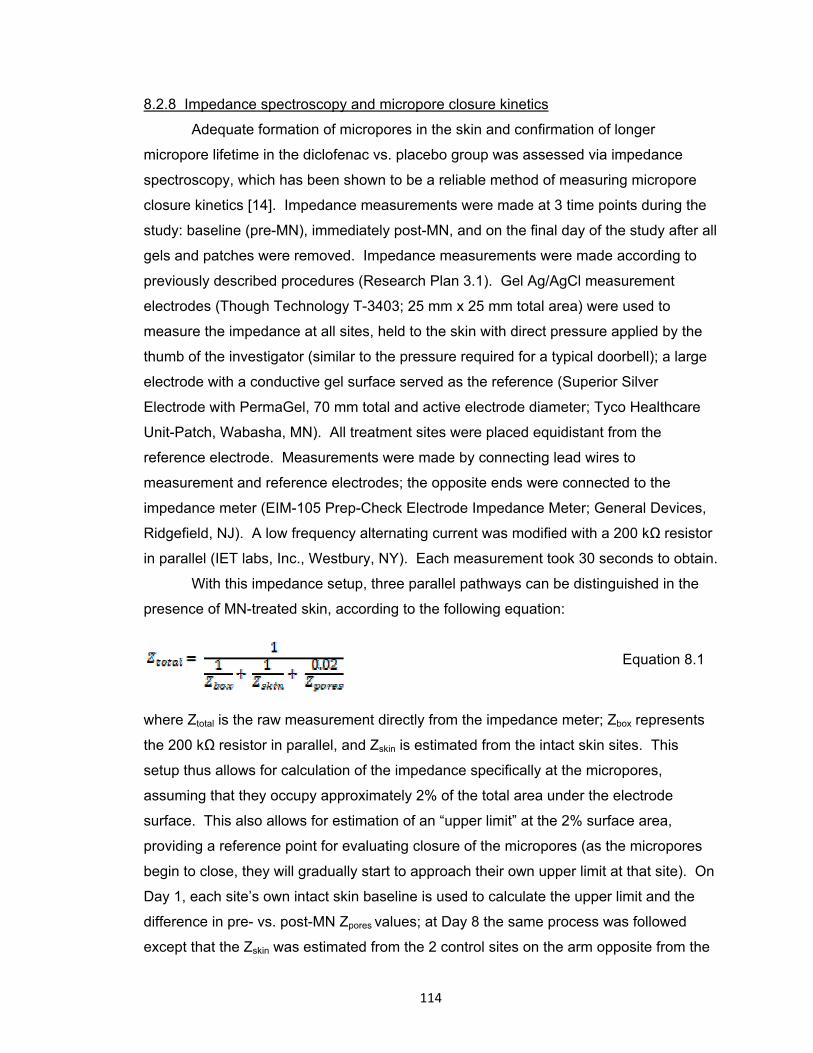
114
8.2.8 Impedance spectroscopy and micropore closure kinetics
Adequate formation of micropores in the skin and confirmation of longer
micropore lifetime in the diclofenac vs. placebo group was assessed via impedance
spectroscopy, which has been shown to be a reliable method of measuring micropore
closure kinetics [14]. Impedance measurements were made at 3 time points during the
study: baseline (pre-MN), immediately post-MN, and on the final day of the study after all
gels and patches were removed. Impedance measurements were made according to
previously described procedures (Research Plan 3.1). Gel Ag/AgCl measurement
electrodes (Though Technology T-3403; 25 mm x 25 mm total area) were used to
measure the impedance at all sites, held to the skin with direct pressure applied by the
thumb of the investigator (similar to the pressure required for a typical doorbell); a large
electrode with a conductive gel surface served as the reference (Superior Silver
Electrode with PermaGel, 70 mm total and active electrode diameter; Tyco Healthcare
Unit-Patch, Wabasha, MN). All treatment sites were placed equidistant from the
reference electrode. Measurements were made by connecting lead wires to
measurement and reference electrodes; the opposite ends were connected to the
impedance meter (EIM-105 Prep-Check Electrode Impedance Meter; General Devices,
Ridgefield, NJ). A low frequency alternating current was modified with a 200 kΩ resistor
in parallel (IET labs, Inc., Westbury, NY). Each measurement took 30 seconds to obtain.
With this impedance setup, three parallel pathways can be distinguished in the
presence of MN-treated skin, according to the following equation:
Equation 8.1
where Ztotal is the raw measurement directly from the impedance meter; Zbox represents
the 200 kΩ resistor in parallel, and Zskin is estimated from the intact skin sites. This
setup thus allows for calculation of the impedance specifically at the micropores,
assuming that they occupy approximately 2% of the total area under the electrode
surface. This also allows for estimation of an “upper limit” at the 2% surface area,
providing a reference point for evaluating closure of the micropores (as the micropores
begin to close, they will gradually start to approach their own upper limit at that site). On
Day 1, each site’s own intact skin baseline is used to calculate the upper limit and the
difference in pre- vs. post-MN Zpores values; at Day 8 the same process was followed
except that the Zskin was estimated from the 2 control sites on the arm opposite from the
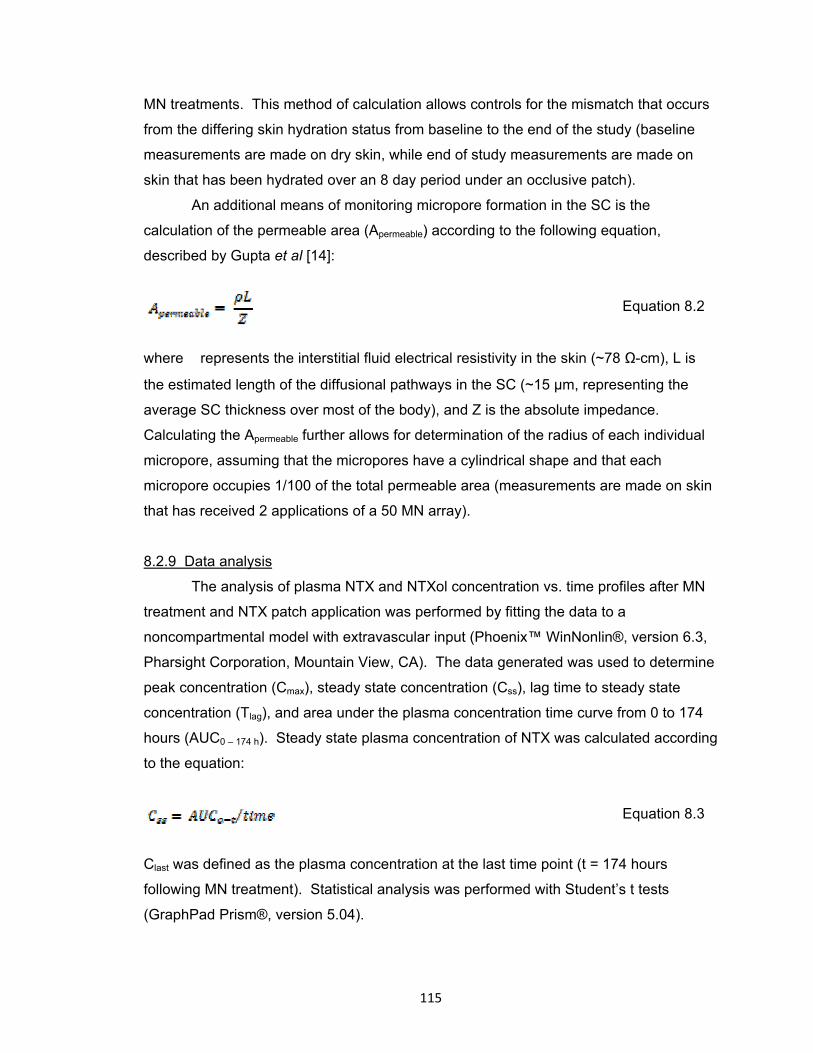
115
MN treatments. This method of calculation allows controls for the mismatch that occurs
from the differing skin hydration status from baseline to the end of the study (baseline
measurements are made on dry skin, while end of study measurements are made on
skin that has been hydrated over an 8 day period under an occlusive patch).
An additional means of monitoring micropore formation in the SC is the
calculation of the permeable area (Apermeable) according to the following equation,
described by Gupta et al [14]:
Equation 8.2
where represents the interstitial fluid electrical resistivity in the skin (~78 Ω-cm), L is
the estimated length of the diffusional pathways in the SC (~15 μm, representing the
average SC thickness over most of the body), and Z is the absolute impedance.
Calculating the Apermeable further allows for determination of the radius of each individual
micropore, assuming that the micropores have a cylindrical shape and that each
micropore occupies 1/100 of the total permeable area (measurements are made on skin
that has received 2 applications of a 50 MN array).
8.2.9 Data analysis
The analysis of plasma NTX and NTXol concentration vs. time profiles after MN
treatment and NTX patch application was performed by fitting the data to a
noncompartmental model with extravascular input (Phoenix™ WinNonlin®, version 6.3,
Pharsight Corporation, Mountain View, CA). The data generated was used to determine
peak concentration (Cmax), steady state concentration (Css), lag time to steady state
concentration (Tlag), and area under the plasma concentration time curve from 0 to 174
hours (AUC0 – 174 h). Steady state plasma concentration of NTX was calculated according
to the equation:
Equation 8.3
Clast was defined as the plasma concentration at the last time point (t = 174 hours
following MN treatment). Statistical analysis was performed with Student’s t tests
(GraphPad Prism®, version 5.04).
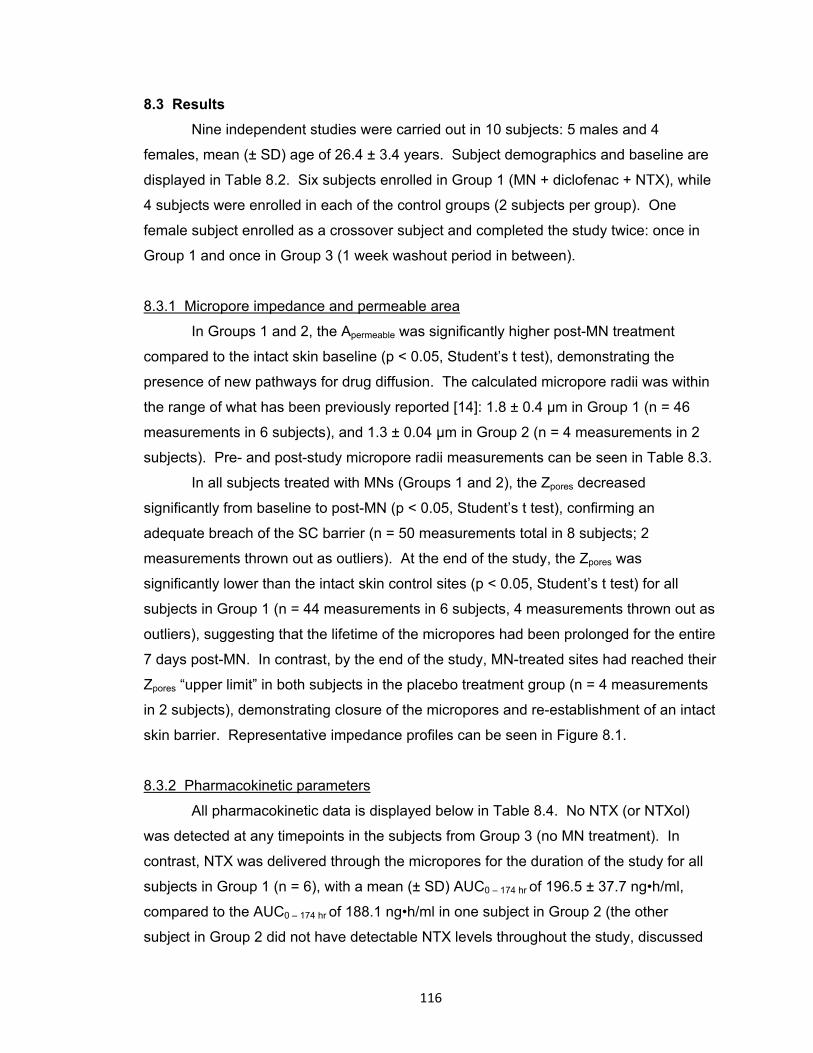
116
8.3 Results
Nine independent studies were carried out in 10 subjects: 5 males and 4
females, mean (± SD) age of 26.4 ± 3.4 years. Subject demographics and baseline are
displayed in Table 8.2. Six subjects enrolled in Group 1 (MN + diclofenac + NTX), while
4 subjects were enrolled in each of the control groups (2 subjects per group). One
female subject enrolled as a crossover subject and completed the study twice: once in
Group 1 and once in Group 3 (1 week washout period in between).
8.3.1 Micropore impedance and permeable area
In Groups 1 and 2, the Apermeable was significantly higher post-MN treatment
compared to the intact skin baseline (p < 0.05, Student’s t test), demonstrating the
presence of new pathways for drug diffusion. The calculated micropore radii was within
the range of what has been previously reported [14]: 1.8 ± 0.4 μm in Group 1 (n = 46
measurements in 6 subjects), and 1.3 ± 0.04 μm in Group 2 (n = 4 measurements in 2
subjects). Pre- and post-study micropore radii measurements can be seen in Table 8.3.
In all subjects treated with MNs (Groups 1 and 2), the Zpores decreased
significantly from baseline to post-MN (p < 0.05, Student’s t test), confirming an
adequate breach of the SC barrier (n = 50 measurements total in 8 subjects; 2
measurements thrown out as outliers). At the end of the study, the Zpores was
significantly lower than the intact skin control sites (p < 0.05, Student’s t test) for all
subjects in Group 1 (n = 44 measurements in 6 subjects, 4 measurements thrown out as
outliers), suggesting that the lifetime of the micropores had been prolonged for the entire
7 days post-MN. In contrast, by the end of the study, MN-treated sites had reached their
Zpores “upper limit” in both subjects in the placebo treatment group (n = 4 measurements
in 2 subjects), demonstrating closure of the micropores and re-establishment of an intact
skin barrier. Representative impedance profiles can be seen in Figure 8.1.
8.3.2 Pharmacokinetic parameters
All pharmacokinetic data is displayed below in Table 8.4. No NTX (or NTXol)
was detected at any timepoints in the subjects from Group 3 (no MN treatment). In
contrast, NTX was delivered through the micropores for the duration of the study for all
subjects in Group 1 (n = 6), with a mean (± SD) AUC0 – 174 hr of 196.5 ± 37.7 ng•h/ml,
compared to the AUC0 – 174 hr of 188.1 ng•h/ml in one subject in Group 2 (the other
subject in Group 2 did not have detectable NTX levels throughout the study, discussed
117
below). The lag time (Tlag) was short, at 0.4 ± 0.8 hours (Group 1) and 0 hours (Group
2). The Cmax and Css were quite similar between the groups: Cmax of 2.6 ± 0.7 ng/ml
(Group 1) and 2.8 ng/ml (Group 2); Css values were 1.2 ± 0.3 ng/ml and 1.1 ng/ml,
respectively. A notable difference between the treatment groups, however, was the
Tmax. This parameter was somewhat variable but amongst the subjects in Group 1, with
a mean of 112.0 ± 62.7 hours, compared to the Tmax of 8 hours observed in the subject
from Group 2. In all subjects in Group 1, however, NTX was detectable until the end of
the study; in contrast, NTX was no longer detectable in the plasma after 72 hours in the
subject from Group 2.
The plasma concentration of the active metabolite, 6-β-NTXol, was also
quantified in all subjects. NTXol was detectable at one timepoint (48 hours) during the
study for the subject in Group 2. However, it was detected from approximately 1 hour
onward for the subjects in Group 1, with a mean AUC of 335.8 ± 103.6 ng•h/ml. In
contrast to the NTX, a longer delay to max NTXol concentration was observed, with a
Tmax of 126 ± 41.3 hours. The profiles for both NTX and NTXol for all subjects in Group
1 can be seen in Figures 8.1 and 8.2.
8.3.3 Tolerability of treatments
Overall, the MN insertion and gel application process were well tolerated. For
most subjects, mild erythema was noted to some degree under the waterproof tape that
was used to secure the patches to the skin, but little (if any) redness was observed at
the MN and gel treatment sites. The mild irritation from the Bioclusive® waterproof tape
resolved over the course of hours to a few days for all subjects. One subject in Group 1
developed a mild contact dermatitis at the MN treatment sites with notable erythema and
pruritus over the MN insertion grid; this subject was withdrawn from the study a day early
at the decision of the study physician. The irritation and pruritus subsided after a short
treatment course with 1% hydrocortisone cream.
The systemic adverse event profile was favorable across all subjects. The most
commonly observed side effects included nausea and general gastrointestinal upset,
mild dysphoria or anxiety, and sleep disturbances (primarily vivid dreams); the incidence
of adverse events can be seen in Table 8.5. No subjects withdrew from the study
because of any intolerable adverse events. All of these systemic adverse events were
consistent with those observed in the previous NTX pharmacokinetic study in human
118
volunteers [9], and are consistent expected adverse events following other routes of
NTX delivery.
8.4 Discussion
Naltrexone is an FDA approved treatment for opioid and alcohol addiction, is
available in an oral and an injectable depot form to help addicts maintain a drug-free
state. Unfortunately, currently available forms of NTX have substantial problems that
lead to problematic side effects and ultimately decreased patient compliance (which
could potentially lead to relapse). Several problems exist with currently available
formulations of NTX, including extensive first-pass metabolism and hepatotoxicity
associated with the oral formulation (ReVia®), and the high cost and inconvenience of
the monthly injectable formulation (Vivitrol®). Transdermal delivery of NTX is desirable
for opioid addicts and alcoholics in order to help reduce side effects and improve
compliance, though the physiochemical properties of the molecule (specifically its
hydrophilicity), do not allow it to pass through the skin barrier and achieve therapeutic
concentrations. Conversely, however, the aqueous solubility of NTX is desirable to allow
the drug to partition into the interstitial fluid once it has passed through the skin. This
creates a significant challenge for delivering NTX via traditional transdermal delivery
approaches. However, these properties make NTX an excellent candidate for MN-
enhanced delivery, as the micropores create aqueous pathways that allow NTX to pass
through the SC, regardless of its hydrophilic nature, allowing it to be readily measured in
the plasma. In fact, NTX was the model compound in the first pharmacokinetic study in
the literature to describe successful delivery of a drug to therapeutic concentrations with
the “poke (press) and patch” method, administered to healthy human volunteers
(described above). While therapeutic concentrations were maintained during the study,
variability began to increase between 48 – 72 hours post-MN, and not all subjects
maintained therapeutic levels beyond 48 hours. These results suggest that the
micropores were beginning to re-seal and the skin was restoring its baseline barrier
properties. A similar timeframe of delivery has also been observed when the active
metabolite of NTX (6-β-NTXol) was administered to hairless guinea pigs with the same
MN treatment approach.
The results of the current study demonstrate that topical application of diclofenac
(a non-specific COX inhibitor) applied to MN-treated skin can maintain micropore viability
and allow for delivery of NTX for 7 days. The shape of the pharmacokinetic profiles (for
119
both NTX and NTXol) demonstrate sustained delivery over the whole timeframe, which
is in stark contrast from the subject who received placebo gel treatment. In that case,
the Cmax was reached at 8 hours, followed by a sharp decline after 72 hours,
demonstrating full closure of the micropores under the predicted timeframe of 2 – 3
days.
While the local skin concentrations of diclofenac are sufficient to maintain
micropore lifetime following just one application immediately post-MN (described in
Chapter 7, Research Plan 3.3), gels were re-applied every 48 hours in the current study
to allow for frequent visual inspection of the skin. The MN and gel treatments were well
tolerated overall; one subject had some local irritation to the gels and her study was
terminated a day early at the decision of the study physician.
8.4.1 Impedance spectroscopy for predicting drug delivery timeframes
The use of impedance spectroscopy has been utilized in previous studies to
monitor the formation and lifetime of micropores available for drug delivery [14]
(Research Plans 3.1 and 3.2, both submitted for publication). This technique is valuable
in that it provides multiple options for monitoring lifetime of the micropores, through
calculation of Zpores (impedance specifically at the microporated skin), radii of individual
micropores, and Apermeable (permeable area of the entire micropore grid). In both groups
that received MN treatment in the current study, adequate formation of the micropores
was confirmed through a significant difference in both Zpores and Apermeable from the intact
skin values, and the micropore radii were also similar to previously reported ranges [14].
From the results described in Research Plan 3.2, a drug delivery window of
approximately 2 – 3 days was predicted from the Zpores calculations in a placebo
treatment setting. This correlates precisely with the data from the placebo subject in the
current study, matches the prediction from Gupta et al examining micropore re-sealing
kinetics under occluded conditions, and is also in agreement with previous
pharmacokinetic studies in humans and guinea pigs [9, 11, 12, 14]. Furthermore, our
previous impedance data also suggested, based on area under the admittance-time
curve, that diclofenac would prolong the drug delivery window approximately 1.76 ± 0.62
times over placebo, resulting in a drug delivery window of 3.4 – 7.1 days (assuming a
placebo micropore half life of 0.76 days). The current pharmacokinetic plasma data is in
agreement with these values, as the placebo subject did not have detectable NTX in the
plasma after 72 hours, whereas the subjects in the diclofenac + NTX group had drug
120
delivery for up to 7 days post-MN. These data demonstrate the capability of impedance
spectroscopy to closely predict a drug delivery window; this valuable technique could be
extrapolated to other drug moieties or physical enhancement techniques that create
pores in the skin (thermal ablation, electroporation, etc.) to expand the possibilities of
prolonging the skin’s re-sealing time after a one-time breach.
8.4.2 In vitro naltrexone flux and in vivo delivery considerations
In the first MN-assisted pharmacokinetic study with NTX, 4 patches were applied
to subjects’ arms, corresponding to a total of 400 micropores (100 micropores/patch) [9].
The patch calculations were based on an in vitro NTX flux of 39.0 ± 13.1 nmol/cm2•hr,
with an estimated systemic clearance of 3.5 L/min and a target plasma NTX
concentration of 2 ng/ml. The in vitro-in vivo correlation was very good, with a predicted
steady state concentration of 1.9 ± 0.7 ng/ml and an observed steady state
concentration of 2.5 ± 1.0 ng/ml [9]. This patch calculation was based on a total
treatment area of 28 cm2 for 400 micropores (thus resulting in 4 patches with 100
micropores under each patch). Because the flux of NTX through intact skin is negligible
[135], it would be more appropriate for future MN studies to calculate a number of
patches based on the number of micropores total.
The in vitro NTX flux from the 11% NTX•HCl gel in this study (in the presence of
diclofenac sodium) was 42.58 ± 7.88 nmol/cm2•hr, which is very similar to the flux from
the previous study (from a 16% NTX•HCl gel in the absence of diclofenac sodium). In
order to achieve higher plasma concentrations, a steady state NTX concentration of
approximately 4 ng/ml was targeted, such that NTX and NTXol could still be detected in
the plasma if the concentrations decreased towards the end of the study. Assuming
similar parameters as those described above to calculate the 4 patch requirement for the
first pharmacokinetic study, 8 patches were required for the current study to achieve
approximately double the NTX plasma concentration (through twice as many
micropores). In contrast, only 2 MN-treated sites with patches were calculated for the
placebo condition (200 micropores total), based on the in vitro flux of 170.84 ± 32.12
nmol/cm2•hr.
In both the active and placebo treatment groups (Groups 1 and 2, respectively),
the trends of NTX delivery were as predicted: delivery for a full week in the presence of
diclofenac, vs. no delivery after 72 hours in the placebo subject. However, in both
groups the plasma concentrations were approximately half of what was predicted from

121
the in vitro studies and patch calculations. For the placebo conditions there is a
reasonably straightforward possibility to explain this discrepancy. Previous work has
described the in vitro flux of this NTX formulation through MN-treated skin as ~70
nmol/cm2•hr, as compared to the value of 170.84 ± 32.12 nmol/cm2•hr that the
calculations were based on for the patch number in the placebo group. Thus,
approximately twice as many patches (i.e. 4 patches total) would likely have achieved
the target of 4 – 5 ng/ml in the placebo subjects. Large amounts of variability (up to
30%) can be observed with in vitro permeation studies, which might have contributed to
the error in patch calculation [24, 124], and biological variability for in vivo studies can
also result in plasma concentrations not achieving the predicted levels. The subject in
the placebo group who did not have detectable levels was at the higher end of the BMI
range across the subjects, and was also the only African American subject in the study.
Both of these factors might have contributed to greater intersubject variability. His blood
volume may have been larger as compared to the other subjects, thus requiring higher
amounts of drug to reach a detectable concentration. Recovery has been shown to be
faster in darker skin following acute barrier perturbation, SC lipid content is higher in
African Americans, and increased electrical resistance of the skin in African Americans
suggests an increased SC thickness as compared to Caucasians [136]. In combination
with too few patches, all of these reasons might have contributed to why this subject did
not have detectable NTX or NTXol levels throughout the study. However, despite not
having a plasma profile that could be compared to the other subjects, his impedance
data followed the expected trend for placebo conditions. The Zpores at the MN-treated
sites reached the upper limits at the end of the study, confirming that the micropores had
sealed as expected in the absence of diclofenac.
The possible explanations for why NTX concentrations only reached
approximately half of the predicted values for the subjects in Group 1 are not quite as
straightforward as for the placebo subjects. The impedance data supports that the
micropores were viable for the whole treatment period; additionally, despite levels being
low, NTX was delivered throughout the full 7 days of the study. Thus, the most logical
explanation for the decreased plasma concentrations is that the NTX did not deliver
through the micropores as efficiently as expected. During the study, movement of the
subjects’ arms with day to day activities could have decreased the contact between the
gels and the skin, as compared to the constant contact that is present in the in vitro
studies. Additionally, the diclofenac gel could have been rubbed into the skin differently
122
on the arms of the subjects as compared to what is achievable for the in vitro studies.
There is a significant difference in the flux of NTX in the presence of diclofenac when
compared to NTX alone (p < 0.05, Student’s t test), suggesting that the active diclofenac
moiety interacts with the NTX•HCl and impedes its flux. This is not entirely unexpected,
as diclofenac is an acid and NTX is a base, thus forming a local precipitate when co-
applied. There are two possibilities that seem likely with regards to how this precipitate
could have affected NTX delivery. While the amount of diclofenac (100 μl) was very
small, an equal amount of NTX precipitating with the diclofenac would significantly
decrease the diffusional gradient, as 100 μl of NTX would represent 1/5th of the total gel
applied at each site. A second possibility is that the precipitate could possibly block
some of the permeable area of the micropores, allowing for less NTX to physically pass
through the newly created pathways. A combination of both of these scenarios is also
possible. Thus, while the diclofenac is effective for inhibiting micropore closure, the
greatest challenge from a therapeutic perspective is to develop a system capable of
delivering diclofenac locally to the micropores without significantly impeding the NTX
flux.
All of the above discussion postulates why the observed concentrations of NTX
alone did not reach predicted values. Upon further examination, however, the sum of
NTX and NTXol together achieves a plasma concentration that is much closer to the
predicted, with a mean Css of 3.18 ± 0.7 ng/ml (Group 1). NTXol is the primary
metabolite of NTX, with a negligible difference in molecular weight from the parent
(341.8 and 343.8 for NTX and NTXol, respectively). This allows the sum of NTX and
NTXol to be compared directly to the predicted NTX concentration, assuming
approximately 1:1 conversion of NTX to NTXol. This also reprsesents the most accurate
overall clinical scenario, as near zero-order delivery of NTX will result in the presence of
the metabolite over the entire treatment course. Thus, the correlation of in vitro
predictions to in vivo plasma concentrations is 79.5%, which is excellent for human
clinical studies.
The flux of NTX from this formulation through intact skin has been described as 8
nmol/cm2•hr, which would be considered negligible from a systemic delivery perspective
[135]. However, due to the increased number of patches in this study compared with
previous studies, 10 patches were applied to intact non-MN treated skin in 2 subjects to
discern if any of the plasma NTX observed in the subjects in MN groups was partially
due to passive diffusion through intact skin. In both control subjects there was no
123
detectable NTX or NTXol at any timepoints, confirming the lack of flux in the absence of
micropores. Thus, the plasma concentrations observed in the MN treatment groups can
be attributed to NTX flux through the micropores, rather than passive diffusion from a
relatively high number of patches. This was also confirmed by the crossover subject
who completed the study twice, once with and once without MN treatment. She had
detectable levels throughout the study following MN treatment, but no detectable NTX or
NTXol when the treatments were applied to intact skin.
8.5 Conclusions
This is the first study in humans to demonstrate that drug delivery can be
achieved for a full week after one application of a MN array, using the “poke (press) and
patch” method. Furthermore, the drug delivery windows were accurately predicted by
impedance spectroscopy as a surrogate technique, allowing for extrapolation of the
technique to other drug moieties and poration techniques. The final challenge for this
type of NTX delivery system will be to achieve a formulation NTX and/or diclofenac that
will allow for therapeutic plasma concentrations (> 2 ng/ml) to be delivered from a
clinically reasonable patch number or size. These data demonstrate the immense
potential of MN technologies for drug delivery over longer periods of time than what has
been shown previously.
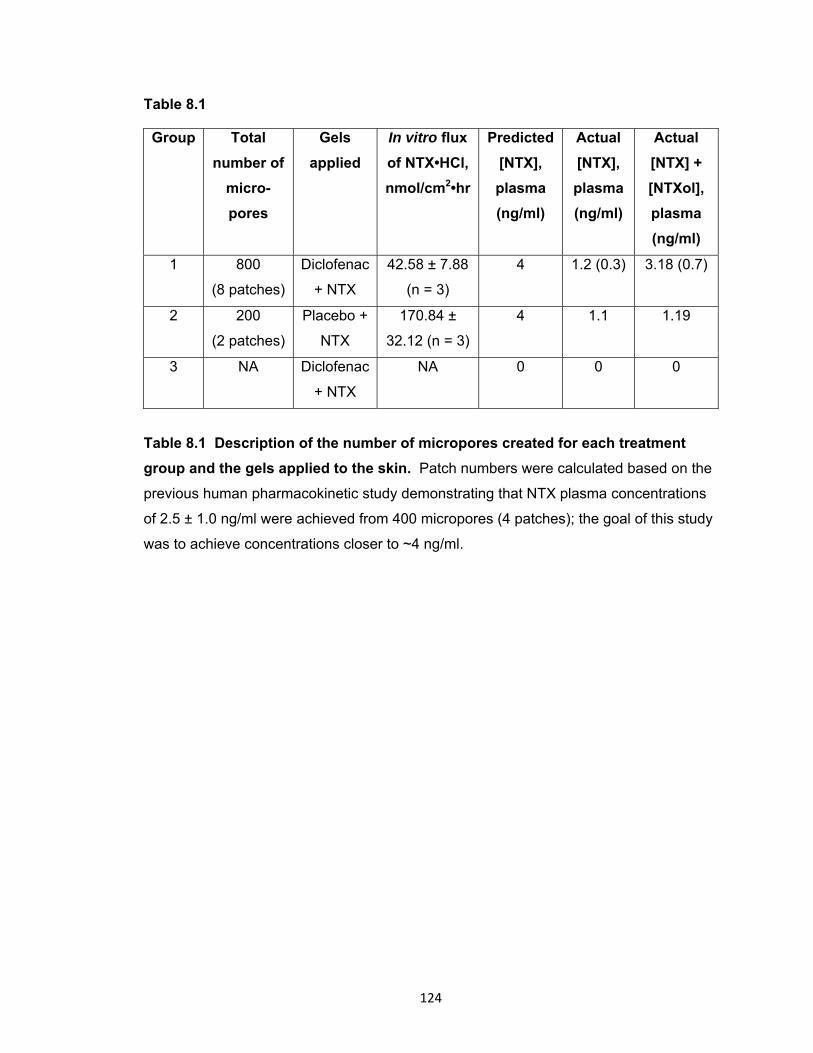
124
Table 8.1
Group Total
number of
micro-
pores
Gels
applied
In vitro flux
of NTX•HCl,
nmol/cm2•hr
Predicted
[NTX],
plasma
(ng/ml)
Actual
[NTX],
plasma
(ng/ml)
Actual
[NTX] +
[NTXol],
plasma
(ng/ml)
1 800
(8 patches)
Diclofenac
+ NTX
42.58 ± 7.88
(n = 3)
4 1.2 (0.3) 3.18 (0.7)
2 200
(2 patches)
Placebo +
NTX
170.84 ±
32.12 (n = 3)
4 1.1 1.19
3 NA Diclofenac
+ NTX
NA 0 0 0
Table 8.1 Description of the number of micropores created for each treatment
group and the gels applied to the skin. Patch numbers were calculated based on the
previous human pharmacokinetic study demonstrating that NTX plasma concentrations
of 2.5 ± 1.0 ng/ml were achieved from 400 micropores (4 patches); the goal of this study
was to achieve concentrations closer to ~4 ng/ml.
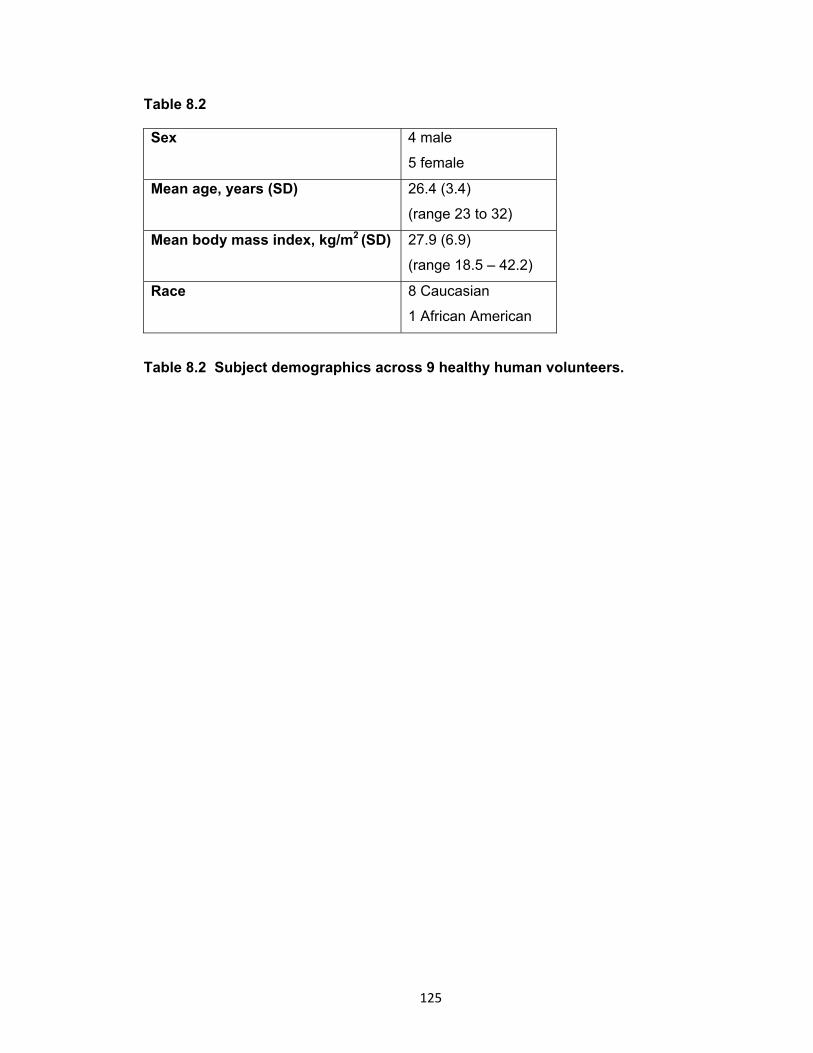
125
Table 8.2
Sex 4 male
5 female
Mean age, years (SD) 26.4 (3.4)
(range 23 to 32)
Mean body mass index, kg/m2 (SD) 27.9 (6.9)
(range 18.5 – 42.2)
Race 8 Caucasian
1 African American
Table 8.2 Subject demographics across 9 healthy human volunteers.
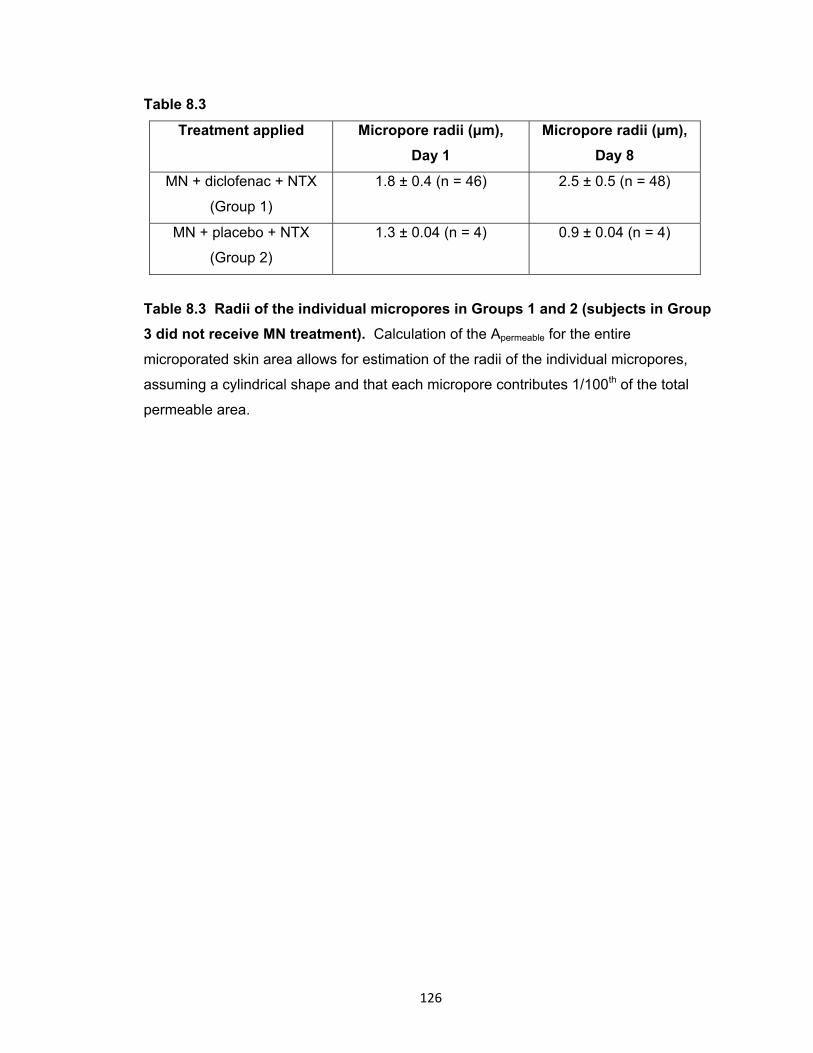
126
Table 8.3
Treatment applied Micropore radii (μm),
Day 1
Micropore radii (μm),
Day 8
MN + diclofenac + NTX
(Group 1)
1.8 ± 0.4 (n = 46) 2.5 ± 0.5 (n = 48)
MN + placebo + NTX
(Group 2)
1.3 ± 0.04 (n = 4) 0.9 ± 0.04 (n = 4)
Table 8.3 Radii of the individual micropores in Groups 1 and 2 (subjects in Group
3 did not receive MN treatment). Calculation of the Apermeable for the entire
microporated skin area allows for estimation of the radii of the individual micropores,
assuming a cylindrical shape and that each micropore contributes 1/100th of the total
permeable area.
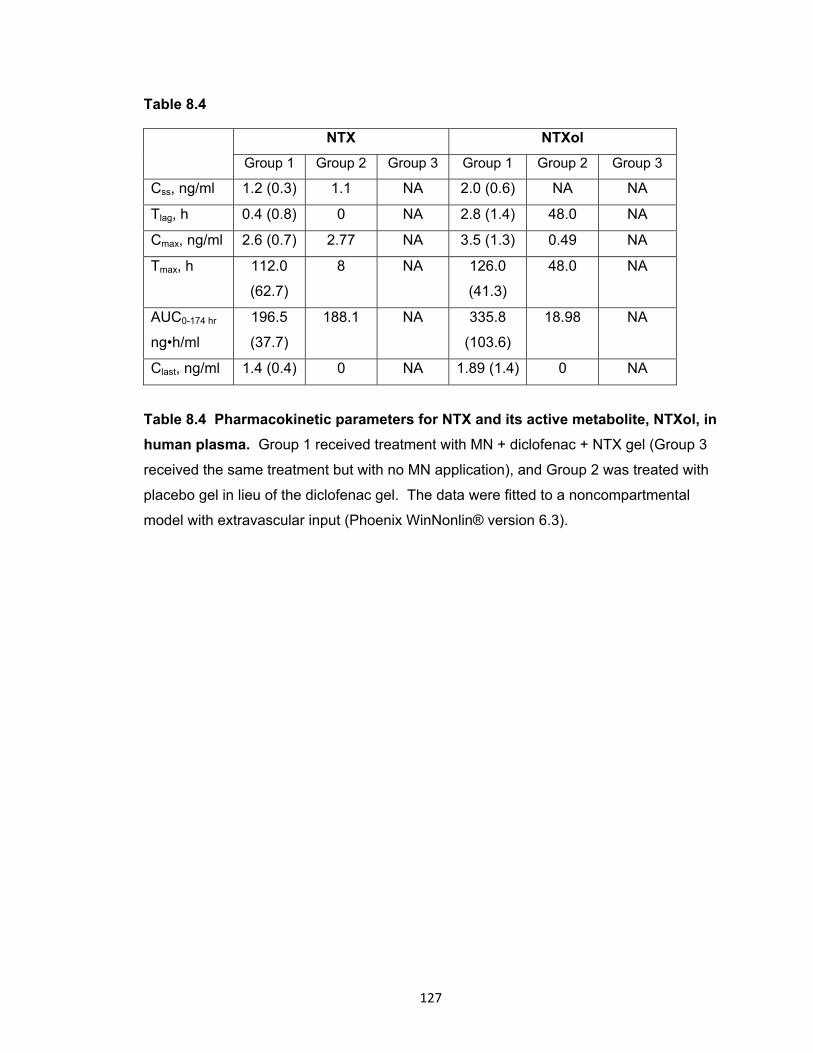
127
Table 8.4
NTX NTXol
Group 1 Group 2 Group 3 Group 1 Group 2 Group 3
Css, ng/ml 1.2 (0.3) 1.1 NA 2.0 (0.6) NA NA
Tlag, h 0.4 (0.8) 0 NA 2.8 (1.4) 48.0 NA
Cmax, ng/ml 2.6 (0.7) 2.77 NA 3.5 (1.3) 0.49 NA
Tmax, h 112.0
(62.7)
8 NA 126.0
(41.3)
48.0 NA
AUC0-174 hr
ng•h/ml
196.5
(37.7)
188.1 NA 335.8
(103.6)
18.98 NA
Clast, ng/ml 1.4 (0.4) 0 NA 1.89 (1.4) 0 NA
Table 8.4 Pharmacokinetic parameters for NTX and its active metabolite, NTXol, in
human plasma. Group 1 received treatment with MN + diclofenac + NTX gel (Group 3
received the same treatment but with no MN application), and Group 2 was treated with
placebo gel in lieu of the diclofenac gel. The data were fitted to a noncompartmental
model with extravascular input (Phoenix WinNonlin® version 6.3).
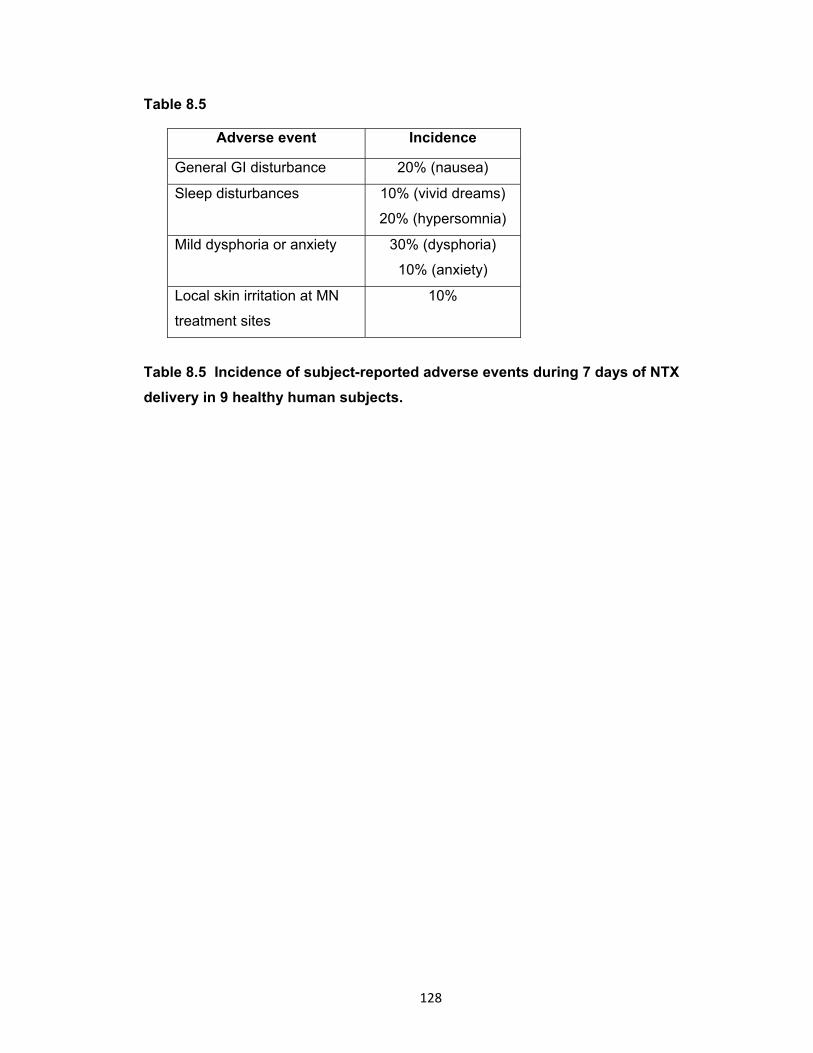
128
Table 8.5
Adverse event Incidence
General GI disturbance 20% (nausea)
Sleep disturbances 10% (vivid dreams)
20% (hypersomnia)
Mild dysphoria or anxiety 30% (dysphoria)
10% (anxiety)
Local skin irritation at MN
treatment sites
10%
Table 8.5 Incidence of subject-reported adverse events during 7 days of NTX
delivery in 9 healthy human subjects.
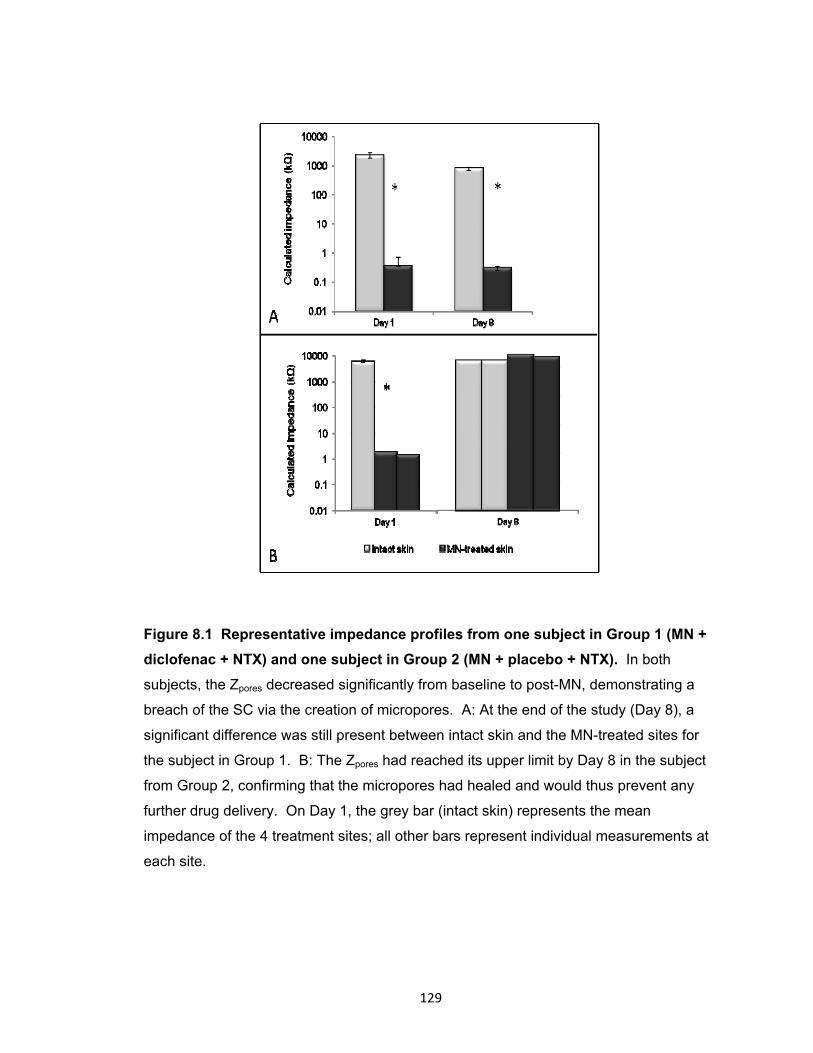
129
Figure 8.1 Representative impedance profiles from one subject in Group 1 (MN +
diclofenac + NTX) and one subject in Group 2 (MN + placebo + NTX). In both
subjects, the Zpores decreased significantly from baseline to post-MN, demonstrating a
breach of the SC via the creation of micropores. A: At the end of the study (Day 8), a
significant difference was still present between intact skin and the MN-treated sites for
the subject in Group 1. B: The Zpores had reached its upper limit by Day 8 in the subject
from Group 2, confirming that the micropores had healed and would thus prevent any
further drug delivery. On Day 1, the grey bar (intact skin) represents the mean
impedance of the 4 treatment sites; all other bars represent individual measurements at
each site.
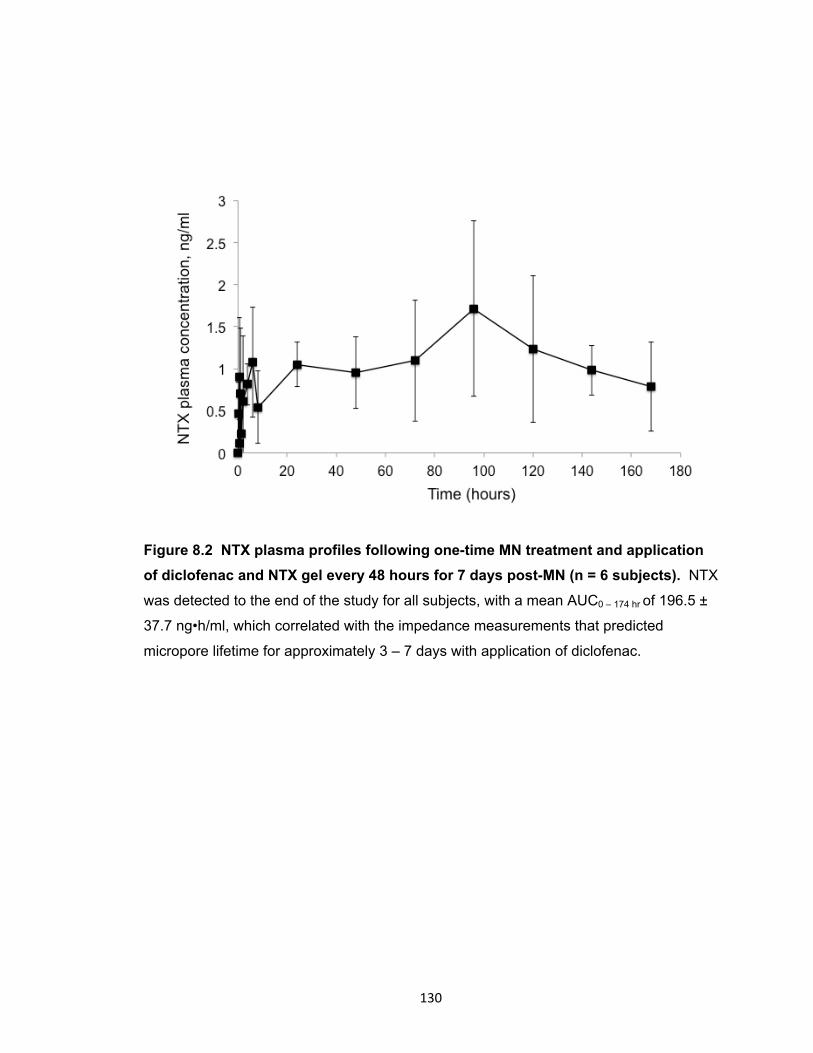
130
Figure 8.2 NTX plasma profiles following one-time MN treatment and application
of diclofenac and NTX gel every 48 hours for 7 days post-MN (n = 6 subjects). NTX
was detected to the end of the study for all subjects, with a mean AUC0 – 174 hr of 196.5 ±
37.7 ng•h/ml, which correlated with the impedance measurements that predicted
micropore lifetime for approximately 3 – 7 days with application of diclofenac.
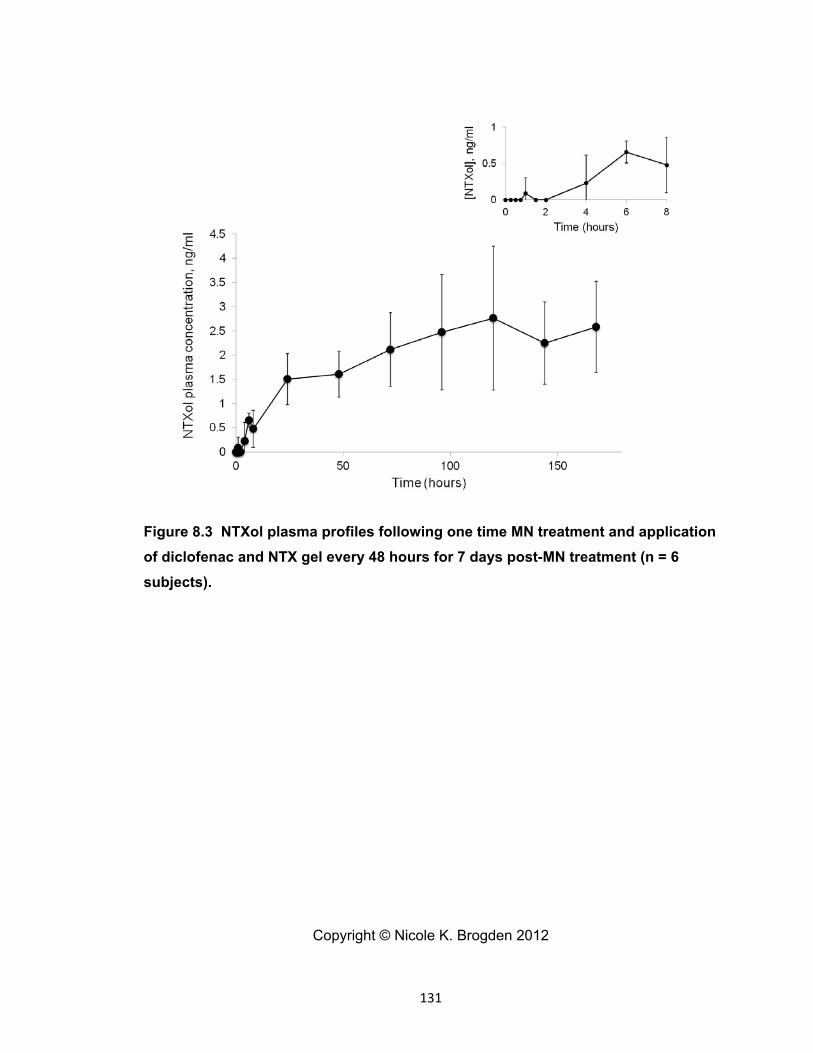
131
Figure 8.3 NTXol plasma profiles following one time MN treatment and application
of diclofenac and NTX gel every 48 hours for 7 days post-MN treatment (n = 6
subjects).
Copyright © Nicole K. Brogden 2012
132
Chapter 9
Pharmacokinetic evaluation of microneedle-enhanced 7-day transdermal delivery
of naltrexone via restoration of the epidermal Ca2+ gradient in
hairless guinea pigs
9.1 Introduction
The stratum corneum (SC) is the outermost layer of the skin, and serves as the
primary permeability barrier to most xenobiotics. The structure of the SC is remarkably
unique in that it exists in a “brick and mortar” conformation, with keratinocytes (bricks)
surrounded by a continuous lipid matrix (mortar). The continuous lipid phase provides
most of the permeability barrier, preventing the outward movement of water and the
inward flux of xenobiotics and chemicals. Following acute disruption of the SC
permeability barrier, a pathway of homeostatic events is initiated to restore the barrier,
and the pathways of repair are the same irrespective of the method of disruption (tape
stripping, solvent treatment, skin irritants etc.) [66-68, 76]. One of the first changes in
the skin that occurs immediately following barrier disruption is increased transepidermal
water loss between the skin and the external environment, which dissipates the
epidermal calcium gradient. Under normal conditions, a steep epidermal calcium
gradient exists such that low concentrations of calcium are found in the basal layer of the
epidermis (~180 mg/kg), and high concentrations are found in the outer layers of the
stratum granulosum (~460 mg/kg, approximately 10 μm from the skin surface); the
gradient drops off sharply and the lowest calcium levels in the skin are found within the
SC [76]. When the skin barrier is disrupted, the movement of water between the internal
and external environment increases, carrying calcium towards the skin surface and
eliminating the steep gradient. Dissipation of this gradient provides a signal for
exocytosis of lamellar bodies into the domain between the SC and the stratum
granulosum [66-68, 76, 137-139]. This response is initiated quickly after barrier
disruption (within 1 hour), and the permeability function of the skin is quickly restored, as
displayed in Figure 9.1 [68].
When the change in the calcium gradient after barrier disruption is prevented via
application of a vapor-impermeable membrane or submersion in a calcium-containing
solution, the secretion of lamellar bodies is not initiated and barrier repair is delayed [66-
68]. This suggests that the dissipation of the gradient from the change in water
movement provides a signal for the repair response. Based on these properties of the
133
skin’s response to barrier perturbation, we hypothesized that blocking dissipation of the
calcium gradient via topical application of calcium gels to microneedle (MN) treated skin
would inhibit barrier restoration, allowing for delivery of naltrexone HCl (NTX•HCl)
through the micropores for up to 7 days. The intent of this study was to determine the
effect of topically applied calcium salts on the kinetics of micropore closure in hairless
guinea pigs; these studies satisfy Research Plan 3.7.
9.2 Methods and materials
The following components were purchased through the University of Kentucky:
naltrexone HCl (Mallinkrodt, Mansfield, MA), propylene glycol (VWR, Atlanta, GA),
benzyl alcohol (Fisher Scientific, Hanover Park, IL), 10% calcium chloride injection, USP
(NDC 0409-1631-10, Hospira, Inc., Lake Forest, IL), calcium gluconate 23% solution
(NDC 57561-802-50, Agri Laboratories, Ltd. St. Joseph, MO), calcium acetate powder,
USP (Spectrum Chemical Mfg. Corporation, ordered through VWR, Atlanta, GA), and
sterile water for injection. Hydroxyethylcellulose (HEC, Ashland Specialty Ingredients,
Wilmington, DE) was a gift from the company.
9.2.1 Preparation of gel formulations
A gel of 8.4% NTX•HCl was prepared with the following components: 84 mg/ml
NTX•HCl, propylene glycol (10%), benzyl alcohol (1%), sterile water (89%), and HEC
(2.5%). Gels were prepared with varying concentrations of 3 calcium salts: calcium
acetate (8.4%), calcium gluconate (2.5 or 5%), and calcium chloride (1mM or 2mM);
each gel only contained one salt form (all gel formulations displayed in Table 9.1). To
deliver the calcium to the skin, the salts were added to a NTX•HCl solution to obtain the
desired end concentration prior to gelling. The calcium gluconate and chloride were
both commercially available as aqueous solutions (23% and 10%, respectively); the
solutions were used to add calcium to the gels prior to the final step of gelling the
solution via addition of HEC. Calcium acetate was available as a raw powder; a 23%
stock solution was made in sterile water and was used to augment the gels to the correct
concentration of calcium acetate. For all gels, the solution of NTX•HCl, propylene glycol,
benzyl alcohol, and calcium was vortexed and allowed to mix on a stir plate for
approximately 5 minute before addition of the HEC. All gels were allowed to sit at room
temperature overnight before being used; no particulates or precipitation was observed
in any of the gels; the viscosity of the gels was not measured.
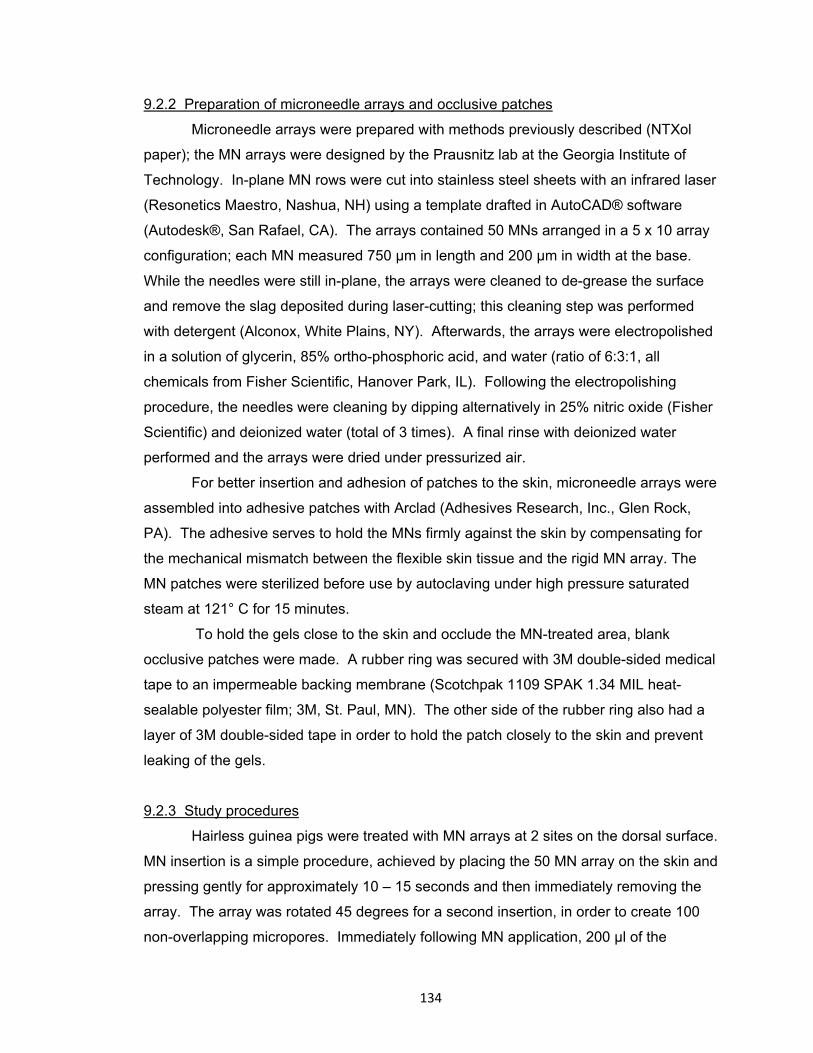
134
9.2.2 Preparation of microneedle arrays and occlusive patches
Microneedle arrays were prepared with methods previously described (NTXol
paper); the MN arrays were designed by the Prausnitz lab at the Georgia Institute of
Technology. In-plane MN rows were cut into stainless steel sheets with an infrared laser
(Resonetics Maestro, Nashua, NH) using a template drafted in AutoCAD® software
(Autodesk®, San Rafael, CA). The arrays contained 50 MNs arranged in a 5 x 10 array
configuration; each MN measured 750 µm in length and 200 µm in width at the base.
While the needles were still in-plane, the arrays were cleaned to de-grease the surface
and remove the slag deposited during laser-cutting; this cleaning step was performed
with detergent (Alconox, White Plains, NY). Afterwards, the arrays were electropolished
in a solution of glycerin, 85% ortho-phosphoric acid, and water (ratio of 6:3:1, all
chemicals from Fisher Scientific, Hanover Park, IL). Following the electropolishing
procedure, the needles were cleaning by dipping alternatively in 25% nitric oxide (Fisher
Scientific) and deionized water (total of 3 times). A final rinse with deionized water
performed and the arrays were dried under pressurized air.
For better insertion and adhesion of patches to the skin, microneedle arrays were
assembled into adhesive patches with Arclad (Adhesives Research, Inc., Glen Rock,
PA). The adhesive serves to hold the MNs firmly against the skin by compensating for
the mechanical mismatch between the flexible skin tissue and the rigid MN array. The
MN patches were sterilized before use by autoclaving under high pressure saturated
steam at 121° C for 15 minutes.
To hold the gels close to the skin and occlude the MN-treated area, blank
occlusive patches were made. A rubber ring was secured with 3M double-sided medical
tape to an impermeable backing membrane (Scotchpak 1109 SPAK 1.34 MIL heat-
sealable polyester film; 3M, St. Paul, MN). The other side of the rubber ring also had a
layer of 3M double-sided tape in order to hold the patch closely to the skin and prevent
leaking of the gels.
9.2.3 Study procedures
Hairless guinea pigs were treated with MN arrays at 2 sites on the dorsal surface.
MN insertion is a simple procedure, achieved by placing the 50 MN array on the skin and
pressing gently for approximately 10 – 15 seconds and then immediately removing the
array. The array was rotated 45 degrees for a second insertion, in order to create 100
non-overlapping micropores. Immediately following MN application, 200 µl of the

135
NTX/calcium gel of interest was applied to the microporated skin at each site and
immediately covered with an occlusive patch. The patches were secured to the skin with
Bioclusive dressing (Systagenix Wound Management, Quincy, MA). The animals were
weighed and temperature was recorded daily to monitor for acute illness or intolerance
of the treatments. Blood samples were obtained over a period of 5 – 7 days after MN
treatment in order to assess NTX plasma concentrations.
9.2.4 Pharmacokinetic sampling
Prior to the studies, all animals underwent surgery to surgically implant indwelling
catheters into the jugular vein; all surgeries were performed by Kalpana Paudel, Ph.D.
All blood samples were drawn from the indwelling catheter during the studies. Before
applying any treatments, a blood sample was drawn as a blank; following MN treatment
and NTX gel administration, serial blood samples (approximately 200 µl each) were
obtained at 15, 30, 45, and 60 minutes and at 1, 2, 4, 7, and 10 hours. Starting at 24
hours post-treatment, samples were taken at 12 hour intervals for the remainder of the
study, collected into tubes coated with a 500 IU/ml heparin solution to prevent blood
coagulation. The blood samples were immediately centrifuged at 10,000 x g for 3
minutes; the plasma was separated and stored at -80° C until analysis.
9.2.5 Plasma extraction procedure
The plasma extraction procedure was similar to that described previously by
Valiveti et al, with minor modifications [93]. One hundred µl of plasma was added to 500
µl of 1:1 ethyl acetate:acetonitrile, resulting in protein precipitation. The mixture was
vortexed for 15 seconds and immediately centrifuged for 20 minutes at 12,000 x g.
Following centrifugation, the supernatant was pipetted into glass tubes (with care to not
disturb the pellet) and evaporated under nitrogen. The resulting residue was re-
suspended in 100 µl of acetonitrile, vortexed for 15 seconds, and sonicated for 10
minutes. Afterwards the sample was transferred to low volume inserts in glass HPLC
vials, and injected onto the HPLC column. Working NTX standards were made in
acetonitrile over a range of 10 to 750 ng/ml. In order to make plasma standards, 100 µl
of blank guinea pig plasma was spiked with 10 µl of the ACN working standard and
extracted as described above for the experimental plasma samples. The resulting
concentrations of the plasma standards were 1 – 75 ng/ml, and displayed excellent
linearity (R2 > 0.98 for all standard curves).
136
9.2.6 Analysis of plasma pharmacokinetic parameters
The analysis of plasma NTX concentration vs. time profiles after MN treatment
and NTX patch application was performed by fitting the data to a noncompartmental
model with extravascular input (Phoenix™ WinNonlin®, version 6.2, Pharsight
Corporation, Mountain View, CA). The data generated was used to determine peak
concentration (Cmax), time to peak concentration (Tmax), lag time (Tlag), and area under
the plasma concentration time curve from 0 to 96 hours (AUC0 – 96 h).
9.2.7 Data analysis
Student’s t tests were used to compare the AUC0-96h and Cmax between all
treatment groups; p < 0.05 was considered statistically significant (GraphPad Prism®
software, version 5.04).
9.3 Results
The effects of different calcium salts (acetate, chloride, and gluconate) on
micropore re-sealing rates were examined in hairless guinea pigs treated once with MN
arrays (total of 200 micropores) followed by application of an 8.4% NTX•HCl gel
containing different concentrations of the various calcium salts. All pharmacokinetic
parameters can be seen in Table 9.2. Three control guinea pigs were treated once with
NTX•HCl gel containing no calcium. Mean (± SD) AUC0 – 96h for these animals was
1,278.3 ± 635.6 ng•hr/ml. NTX was no longer detectable in the plasma after 34, 72, and
96 hours for the 3 control animals.
9.3.1 Calcium acetate
Three guinea pigs (mean ± SD weight of 430 ± 65 g) were treated with MNs + an
8.4% NTX•HCl gel with 8.4% w/v of calcium acetate. AUC was calculated over a period
of 96 hours to allow for direct comparison with the control animals. The AUC0 – 96h was
1204.9 ± 167.5, which was not significantly different from control (p > 0.05, Student’s t
test), and the Cmax of 58.0 ± 13.2 ng/ml was also not significantly different from control.
Despite the AUC0 – 96h not being significantly higher as a result of the calcium acetate
treatment, NTX was detectable in the plasma in all 3 animals up until the end of the
study at 178 hours, demonstrating continued delivery of NTX through the micropores (in
contrast to the control animals, in which NTX was not detectable after 96 hours).
137
9.3.2 Calcium chloride
One guinea pig was treated with an 8.4% NTX•HCl gel containing 1mM CaCl2,
while 3 additional animals were treated with a NTX•HCl gel containing 2mM CaCl2.
Mean ± SD weight of the animals was 435 ± 73 g. AUC was calculated over a period of
96 hours to allow for direct comparison with the control animals. The AUC0 – 96h was
1227.9 ng•hr/ml (n = 1 animal, 1 mM CaCl2) and 1213.9 ± 692.6 ng•hr/ml (2 mM CaCl2,
n = 3), with a mean Cmax of 81.4 ± 28.2 ng/ml (n = 4). Both AUC0 – 96h and Cmax were not
significantly different from control (p > 0.05, Student’s t tests). NTX was not detectable
in the plasma after 48 hours for one animal treated with a 2mM gel, while the other 2
animals receiving the same treatment still had detectable levels at 96 hours. The animal
treated with 1mM CaCl2 had detectable concentrations at 120 hours post-MN.
9.3.3 Calcium gluconate
Three studies were carried out in 3 guinea pigs: 2 studies examining the effect of
a 2.5% calcium gluconate gel on micropore closure (applied either once or re-applied
every 36 hours), and a 5% calcium gluconate gel; mean (± SD) weight of the animals
was 533.3 ± 118.9 g. The AUC0 – 96h for these treatments were 419.1, 570.0, and 479.4
ng•hr/ml, respectively. NTX was detectable in the plasma for 58, 130, or 96 hours (2.5%
gel applied once, 2.5% gel re-applied every 36 hours, and 5% gel applied once,
respectively). The AUC0 – 96h and Cmax were not significantly different from control (p >
0.05, Student’s t test).
9.4 Discussion
The unique structure of the SC provides a barrier to the ingress of noxious
chemicals and xenobiotics, and this lack of permeability is primarily dictated by the lipids
that form the intercellular domain. The calcium gradient across the epidermal skin layers
is a primary signal for stimulating secretion of lamellar bodies, a critical event for
restoring normal barrier homeostasis. These studies sought to inhibit the change in the
calcium gradient (following MN treatment) through the topical application of a NTX•HCl
gel containing various calcium salts. Drug permeability of NTX (measured by plasma
concentrations) was used to assess micropore lifetime. In these studies, no-MN
treatment controls were not included, as the flux of this NTX formulation through intact
skin is negligible [135].

138
Previous studies examining pharmacokinetic parameters of NTX and its
metabolite (6-β-NTXol) following MN-assisted delivery have demonstrated a delivery
window of approximately 48 – 72 hours under occluded conditions [9, 11, 12]. The
control animals in this study demonstrated similar profiles, as NTX was not detectable
after 34 – 96 hours when no calcium was present in the gel formulation. While one
animal had a slightly longer delivery window than what is typically observed NTX
delivery, some biological variation is expected and this particular animal may have had
slightly slower barrier restoration than the other animals.
The AUC was calculated over the timeframe of 0 – 96 hours (rather than the full
0 – 178 hours of the study) because several of the animals loosened their patches or
removed them completely around 96 hours in the calcium acetate studies (discussed
below). Thus, calculating the AUC over 0 – 96 hours allowed for a more consistent
comparison between treatments. None of the calcium salts, regardless of concentration
or salt form, displayed significant differences in AUC0 – 96h or Cmax compared to the
control animals. Furthermore, all of the profiles demonstrated similar shapes, exhibiting
an exponential decay and confirming that the treatments did not alter the re-sealing
mechanisms of the skin significantly. The shape of all of the profiles can be seen in
Figure 11.1. There are various reasons specific to each calcium salt form that may have
contributed to the non-significant difference (i.e. lack of treatment effect).
Previous studies have demonstrated prolonged recovery of barrier function
following restoration of the calcium gradient via submersion in calcium containing
solutions (CaCl2), and a range of calcium concentrations from 0.01 to 10 mM of CaCl2
were effective for delaying repair [67, 139]. The effect of the calcium on barrier repair
was most effective at a concentration of 0.1 mM. As a comparison, the concentrations
of CaCl2 in the present studies were 1 and 2 mM, which falls in the middle of the range
of concentrations studies previously. From the resulting pharmacokinetic profile of NTX
delivery, this concentration was not effective for prolonging micropore lifetime as
compared to control. This particular salt form is highly water soluble and is typically
used in clinical practice as an injectable preparation [90]. It is possible that the high
water solubility resulted in diffusion of the CaCl2 from the gel and into the aqueous
interstitial fluid within the micropores. Over the duration of the entire study this may
have resulted in subtherapeutic concentrations of calcium at the skin surface, therefore
not restoring the gradient as needed to delay barrier recovery. In the earlier studies,
submersion in calcium containing solutions was only for a period of a few hours, and
139
barrier recovery (or its delay) was measured for just hours after the treatment. Thus,
CaCl2 may not be effective for delaying recovery after MN treatment for such a long
period as 7 days. Once the CaCl2 had diffused away from the gel and skin surface, the
skin’s normal paradigms would likely take over and result in near-normal restoration
times.
Calcium gluconate was studied at concentrations of 2.5% w/v and 5% w/v. This
salt form was selected as a potential calcium source due to its known tolerability and
lack of irritation potential in animals and humans, in which it is used to treat hydrofluoric
acid skin burns [140]. In this setting, calcium gluconate is effective for treating
hydrofluoric acid burns because of its ability to bind the dissociated fluoride ions and
form an insoluble salt. However, it has not been investigated if there are other
mechanisms involved in its ability to quickly heal the wounds. While the binding of free
fluoride ions seems to be the primary mechanism, if there are other mechanisms
involved then those pathways may have affected the micropore re-sealing times in the
present studies. Additionally, the elemental calcium component of calcium gluconate is
one of the lowest of the available salt forms (9%), and even at the concentrations of 2.5
and 5%, there may not have been sufficient calcium present at the micropores to allow
for the gradient to be fully restored.
In these studies, calcium acetate was investigated as a salt form as the source of
calcium because of its higher elemental calcium (40%) compared to the other salts. The
concentration of the calcium salt in the gel was the highest of all of the studies
performed, at 8.4% calcium acetate in an 8.4% NTX•HCl gel. While the AUC0 – 96h was
not significantly different from control, NTX was detectable in the plasma for the entire
duration of the study (suggesting prolonged delivery of NTX through the micropores as a
result of a restored calcium gradient). Upon removal of the patches, however, one
notable observation was the odor of vinegar, suggesting the formation of acetic acid
from the acetate within the gel. The treatment sites were flaky, peeling, and dry for 2 – 3
days after study termination; on some animals a slightly raised grid of micropores could
be clearly observed in the skin. The animals appeared to be bothered by the patches, as
many of the guinea pigs chewed or scratched at the patches until they pulled them off
the skin. All of these characteristics suggest some level of nonspecific irritation at the
treatment sites, which likely contributed to the prolonged barrier perturbation during the
treatment period. In fact, 10% acetic acid has been shown to cause skin irritation in
humans after just 4 hours of patch exposure [141, 142]. For these reasons, calcium
140
acetate would not likely be appropriate as a source of calcium for prolonging micropore
lifetime due to the high potential to cause irritation at the treatment sites. Other calcium
salts with reasonably high elemental calcium such a calcium citrate (21%) or calcium
carbonate (40%) might be reasonable targets for future studies, as these formulations
would provide high local calcium concentrations with less irritation potential.
Previous studies demonstrating a delay in barrier repair as a result of masking or
replacing the epidermal calcium gradient examined a delay in barrier recovery over a
period of hours following disruption (2.5 up to 24 hours) [66, 67, 75, 139]. In stark
contrast, the studies in this chapter were carried out over 7 days total (although the AUC
was calculated over 0 – 96 hours in order to be consistent across all conditions). Ahn et
al demonstrated that even under occluded conditions, the epidermal calcium gradient is
restored by 60 hours, suggesting that occlusion may delay the skin’s response to the
altered calcium gradient, but that it will ultimately proceed normally [143]. Following tape
stripping an immediate disappearance of both intra- and extracellular calcium was
observed, demonstrating dissipation of the gradient. By 72 hours after occlusion, re-
accumulation of calcium precipitates could be seen, however, confirming that the skin is
able to re-establish the gradient even in the presence of occlusion. This suggests that
restoring the calcium gradient may not be a suitable method for prolonging micropore
lifetime for a period as long as 7 days, as the skin will ultimately restore the gradient on
its own.
9.5 Conclusion
These studies attempted to delay micropore closure kinetics via restoration of a
dissipated epidermal calcium gradient immediately following disruption. Irrespective of
the calcium salt investigated, the treatments were no more effective than control,
suggesting that calcium modulation may not be an appropriate mechanism to target for
inhibiting micropore re-sealing over a week-long timeframe.
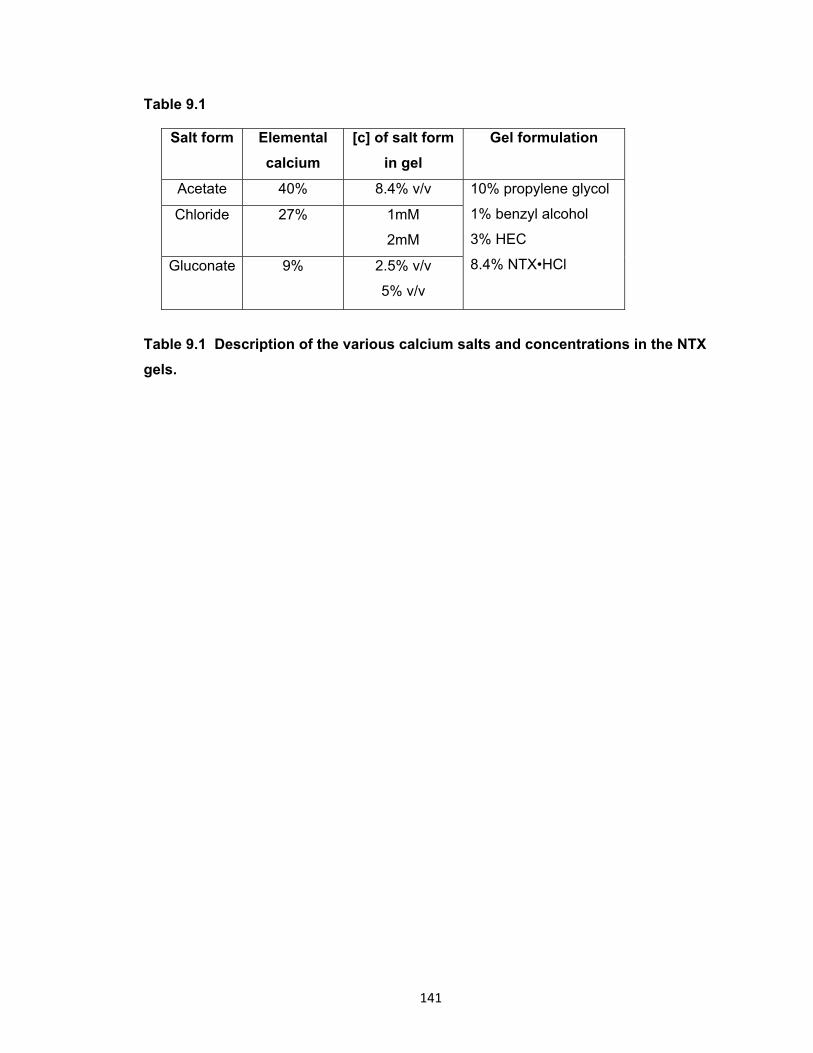
141
Table 9.1
Salt form Elemental
calcium
[c] of salt form
in gel
Gel formulation
Acetate 40% 8.4% v/v 10% propylene glycol
1% benzyl alcohol
3% HEC
8.4% NTX•HCl
Chloride 27% 1mM
2mM
Gluconate
9% 2.5% v/v
5% v/v
Table 9.1 Description of the various calcium salts and concentrations in the NTX
gels.
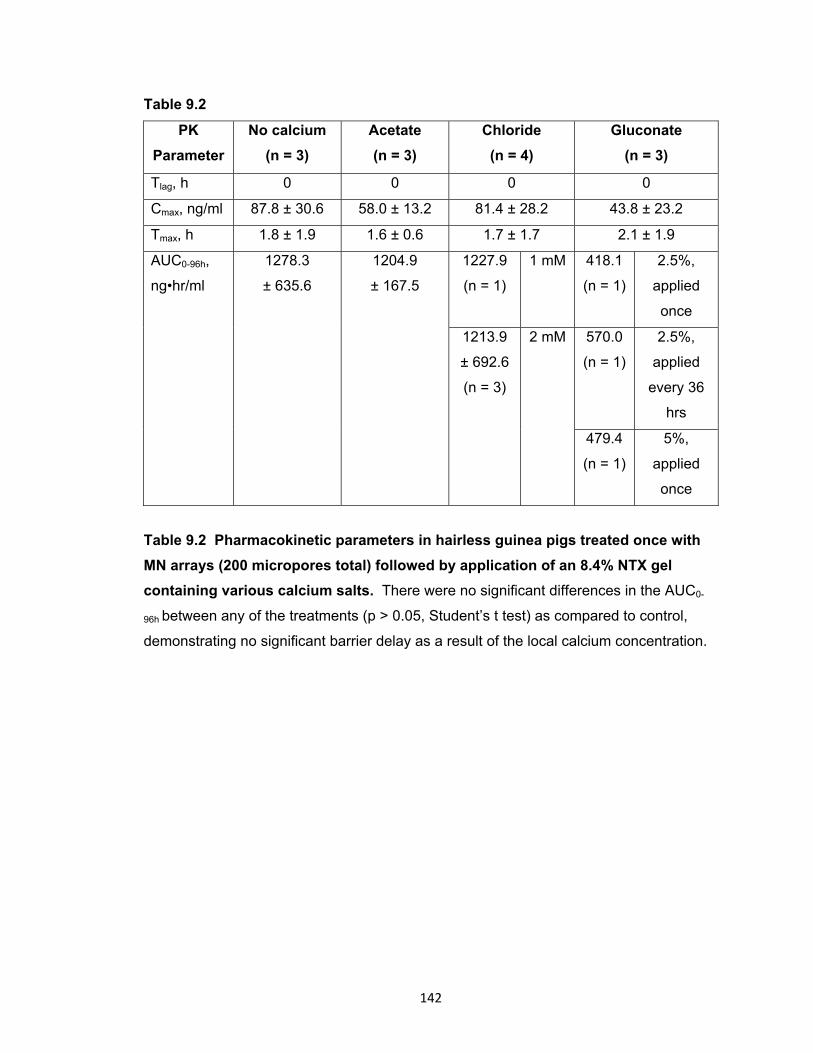
142
Table 9.2
PK
Parameter
No calcium
(n = 3)
Acetate
(n = 3)
Chloride
(n = 4)
Gluconate
(n = 3)
Tlag, h 0 0 0 0
Cmax, ng/ml 87.8 ± 30.6 58.0 ± 13.2 81.4 ± 28.2 43.8 ± 23.2
Tmax, h 1.8 ± 1.9 1.6 ± 0.6 1.7 ± 1.7 2.1 ± 1.9
AUC0-96h,
ng•hr/ml
1278.3
± 635.6
1204.9
± 167.5
1227.9
(n = 1)
1 mM 418.1
(n = 1)
2.5%,
applied
once
1213.9
± 692.6
(n = 3)
2 mM 570.0
(n = 1)
2.5%,
applied
every 36
hrs
479.4
(n = 1)
5%,
applied
once
Table 9.2 Pharmacokinetic parameters in hairless guinea pigs treated once with
MN arrays (200 micropores total) followed by application of an 8.4% NTX gel
containing various calcium salts. There were no significant differences in the AUC0-
96h between any of the treatments (p > 0.05, Student’s t test) as compared to control,
demonstrating no significant barrier delay as a result of the local calcium concentration.

143
Figure 9.1 Visual depiction of the change in the SC barrier as the calcium gradient
is restored after insult.
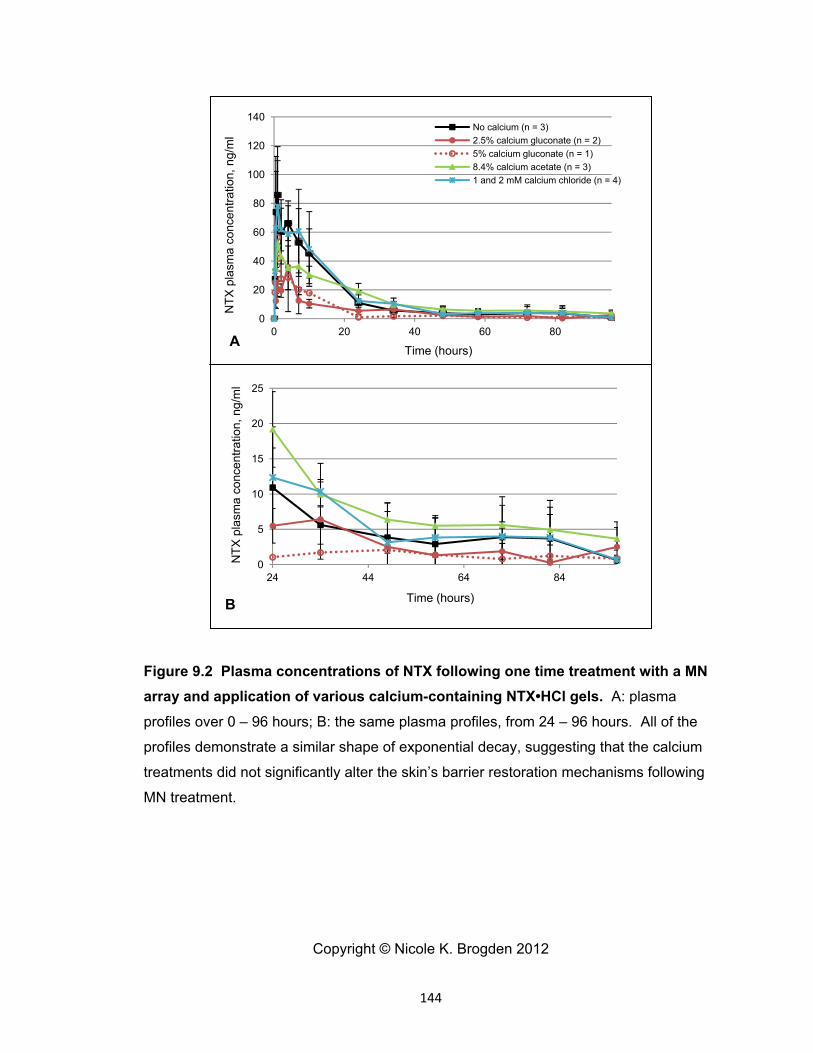
144
Figure 9.2 Plasma concentrations of NTX following one time treatment with a MN
array and application of various calcium-containing NTX•HCl gels. A: plasma
profiles over 0 – 96 hours; B: the same plasma profiles, from 24 – 96 hours. All of the
profiles demonstrate a similar shape of exponential decay, suggesting that the calcium
treatments did not significantly alter the skin’s barrier restoration mechanisms following
MN treatment.
Copyright © Nicole K. Brogden 2012
0
20
40
60
80
100
120
140
0 20 40 60 80
NT
X p
lasm
a co
ncen
trat
ion,
ng/
ml
Time (hours)
No calcium (n = 3)
2.5% calcium gluconate (n = 2)
5% calcium gluconate (n = 1)
8.4% calcium acetate (n = 3)
1 and 2 mM calcium chloride (n = 4)
0
5
10
15
20
25
24 44 64 84
NT
X p
lasm
a co
ncen
trat
ion,
ng/
ml
Time (hours)
A
B
145
Chapter 10
Conclusions and future directions
There were two primary objectives that this body of work sought to address: 1) to
characterize the lifetime and re-sealing kinetics of the micropores created from MN
insertion, and 2) to prolong the lifetime of the micropores via inhibition of the skin’s
normal wound healing and/or barrier restoration processes.
The first pharmacokinetic study in humans using the “poke (press) and patch”
MN approach confirmed that naltrexone, a mu opioid receptor antagonist approved for
the treatment of opioid and alcohol abuse, could be delivered to therapeutic
concentrations for 2 – 3 days in healthy human subjects treated once with MNs [9].
While this confirmed the feasibility of transdermally delivering an otherwise skin-
impermeable drug, the short timeframe of delivery would not be reasonable in clinical
practice, as addicts require lifelong therapy. Thus, a 7-day transdermal delivery system
of NTX would ideal to enhance patient compliance and satisfaction with therapy.
While pharmacokinetic studies are the most relevant method of evaluating drug
diffusion through micropores, these types of studies are very expensive and labor
intensive; as such, it would be impractical to use this type of study design for screening
new MN designs or therapies intended to prolong micropore lifetime. For these reasons,
it was necessary to develop a reliable surrogate technique for predicting micropore
lifetime and drug delivery windows under various conditions. While multiple methods
exist to monitor micropore closure kinetics, impedance spectroscopy is suitable for both
animal and human studies and can be used to evaluate skin in varying hydration states
(which is very important in the transdermal field). Furthermore, this technique has been
used in other MN studies in human subjects, providing good correlation of micropore
closure kinetics with pharmacokinetic data [14]. In the current work various electrodes
and pressure application techniques were examined in animals and humans, to develop
a reproducible method to monitor micropore formation and closure. Gel Ag/AgCl
electrodes applied with direct pressure on microporated skin (human subjects) were able
to detect changes in the SC from baseline to post-MN treatment with low levels of
variability between measurements (demonstrated by %RSD). This method holds great
appeal because it can also be applied to other physical enhancement techniques that
also create pores in the SC, such as electroporation or thermal ablation. Through
calculation of the Zpores or Apermeable, closure of the micropores can be followed over time
and a drug delivery window can be predicted.
146
In order to extend micropore lifetime to a more clinically relevant period of time
(ideally 7 days of drug delivery following one MN application), a non-specific COX
inhibitor (diclofenac sodium) was applied to MN-treated skin in healthy human subjects.
Impedance spectroscopy was utilized as a surrogate technique to monitor micropore
closure rates over time, comparing diclofenac to placebo conditions. Comparison of
area under the curve between treatment groups confirmed that diclofenac prolongs
micropore lifetime, with a predicted drug delivery window of approximately 2 – 3 days
under placebo conditions. These results were in excellent agreement with the drug
delivery window observed from the aforementioned NTX pharmacokinetic study, in
addition to results from Gupta et al [14], demonstrating that under occluded conditions
the micropores will remain viable for approximately 2 days.
Finally, in vitro diffusion studies and in vivo animal skin irritation studies were
completed to design an optimal dosing scheme for a human pharmacokinetic study, with
the objective of delivering NTX through MN-treated skin in the presence of diclofenac.
As predicted from the previous impedance data, NTX and its metabolite were detected in
the plasma for 7 days post-MN in the subjects treated with MN + diclofenac + NTX. In
contrast, NTX and NTXol were only detectable for up to 72 hours in the placebo subject,
confirming closure of the micropores. These results represent an exciting advance in
the MN field, as this is the first study in human subjects to demonstrate such a long drug
delivery window following just one application of a MN array.
The MN field has reached an exciting and pivotal stage of development. We now
know that a variety of MN delivery techniques can be used to successfully deliver drugs
to therapeutic concentrations for a range of timeframes, and the recent introduction of
the Fluzone® intradermal vaccine confirms the commercial potential of MN technologies.
Additionally, large companies such as 3M have begun developing MN products (both
hollow and solid MN systems), suggesting that the commercial market for these devices
will continue to grow. The perception of these techniques by patients and healthcare
workers has been positive [144], and thus this market has immense potential to expand.
One particularly appealing component of MN technologies is the possibility to
individualize therapies based on a therapeutic need, timeframe, or drug moiety. MN
treatments remove the strict physicochemical restrictions on drug compounds that can
be transdermally administered, and it now seems within reach that MN therapy could be
tailored to achieve specific delivery windows, which would further broaden the scope of
appeal. In particular, prolonging micropore lifetime seems particularly well suited for
147
delivery of medications for chronic disease states, as once weekly patch application
would allow for constant therapeutic delivery of a drug while increasing patient
complince. In situations when prolonging micropore lifetime would be desirable for
longer periods of drug delivery, the safety profile is also favorable, as the micropores
exhibit a “switch-like” behavior, as they close rapidly when occlusion is removed, thus
removing the concern of local infection. Additionally, a gel formulation would contain
antimicrobial excipients to further prevent the possibility of infection. Further clinical
investigation will be necessary to determine the safety profile of extending micropore
lifetime in higher risk populations (immunocompromised patients, patients with chronic
skin diseases such as atopic dermatitis or psoriasis, or elderly populations).
Delivering NTX for a week-long timeframe is ideal for the treatment of opioid and
alcohol abuse, both chronic disorders that require lifelong therapy. Transdermal NTX
overcomes some of the most problematic hurdles with the oral and injectable forms of
the drug that are commercially available. The next step in developing a MN-assisted
transdermal NTX system will be to create a formulation that allows for therapeutic
concentrations of NTX to be achieved when delivered in the presence of diclofenac.
Despite achieving 7 days of delivery in the current studies, the plasma concentrations of
NTX were subtherapeutic (< 2 ng/ml) following treatment with 8 patches. The most likely
explanation is the incompatibility of diclofenac and NTX when closely applied, as a
precipitate forms that may be impeding flux through the micropores. There are several
possibilities for how this could be potentially overcome. First, development of a codrug
system (linking diclofenac and NTX together by a chemical moiety that dissociates within
the skin) would allow for application of both moieties from a single formulation that would
deposit diclofenac in the skin and allow NTX to pass through the micropores. Second,
other COX inhibitors with varying specificity for COX-1 and COX-2 could be examined
for effects on prolonging micropore lifetime. If the effects of diclofenac are solely related
to its ability to reduce local inflammation, then other COX inhibitors might be effective in
a similar manner. Finally, it is possible that diclofenac may be exerting its effects
through a pathway other than simply inhibiting the COX enzymes, such as cytokine
expression or the lipooxygenase pathway. Further investigation of its specific
mechanisms of action would allow for better understanding of the micropore re-sealing
process, leading to the development of more specific local therapies that might not
interact as strongly with the NTX moiety.

148
The studies presented herein demonstrate great strides in MN delivery
techniques, through: 1) the development of a measurement technique that is sensitive
enough to monitor micropore lifetime and accurately predict drug delivery windows; and
2) delivery of a model compound through MN-treated skin for 7 days via simple topical
application of a non-specific anti-inflammatory. This provides an exciting clinical
springboard for the development of MN treatment systems that are suitable for a variety
of therapeutics for treating human disorders.
Copyright © Nicole K. Brogden 2012
149
REFERENCES
1. Naik, A., Y.N. Kalia, and R.H. Guy, Transdermal drug delivery: overcoming the skin's barrier function. Pharm Sci Technolo Today, 2000. 3(9): p. 318-326.
2. Prausnitz, M.R. and R. Langer, Transdermal drug delivery. Nat Biotechnol, 2008. 26(11): p. 1261-8.
3. Prausnitz, M.R., S. Mitragotri, and R. Langer, Current status and future potential of transdermal drug delivery. Nat Rev Drug Discov, 2004. 3(2): p. 115-24.
4. Mitragotri, S., Synergistic effect of enhancers for transdermal drug delivery. Pharm Res, 2000. 17(11): p. 1354-9.
5. Prausnitz, M.R., Microneedles for transdermal drug delivery. Adv Drug Deliv Rev, 2004. 56(5): p. 581-7.
6. Arora, A., M.R. Prausnitz, and S. Mitragotri, Micro-scale devices for transdermal drug delivery. Int J Pharm, 2008. 364(2): p. 227-36.
7. Haq, M.I., et al., Clinical administration of microneedles: skin puncture, pain and sensation. Biomed Microdevices, 2009. 11(1): p. 35-47.
8. Vaccine Shoppe. March 7, 2012; Available from: http://www.vaccineshoppe.com/static/FluID2/fluid-video-desktop.html.
9. Wermeling, D.P., et al., Microneedles permit transdermal delivery of a skin-impermeant medication to humans. Proc Natl Acad Sci U S A, 2008. 105(6): p. 2058-63.
10. Bal, S., et al., In vivo visualization of microneedle conduits in human skin using laser scanning microscopy. Laser Physics Letters, 2010. 7(3): p. 242 - 246
11. Banks, S.L., et al., Diclofenac enables prolonged delivery of naltrexone through microneedle-treated skin. Pharm Res, 2011. 28(5): p. 1211-9.
12. Banks, S.L., et al., Transdermal delivery of naltrexol and skin permeability lifetime after microneedle treatment in hairless guinea pigs. J Pharm Sci, 2009. 99(7): p. 3072-80.
13. Enfield, J., et al., In-vivo dynamic characterization of microneedle skin penetration using optical coherence tomography. J Biomed Opt, 2010. 15(4): p. 046001.
14. Gupta, J., et al., Kinetics of skin resealing after insertion of microneedles in human subjects. J Control Release, 2011.
15. Harding, C.R., The stratum corneum: structure and function in health and disease. Dermatol Ther, 2004. 17 Suppl 1: p. 6-15.
16. Flynn, G.L., Cutaneous and Transdermal Delivery: Processes and Systems of Delivery, in Modern Pharmaceutics, C.T.R. G.S. Banker, Editor 1990, Marcel Dekker: New York. p. 239 - 298.
17. Feingold, K.R., Thematic review series: skin lipids. The role of epidermal lipids in cutaneous permeability barrier homeostasis. J Lipid Res, 2007. 48(12): p. 2531-46.
18. Rawlings, A.V. and C.R. Harding, Moisturization and skin barrier function. Dermatol Ther, 2004. 17 Suppl 1: p. 43-8.
19. Bouwstra, J.A., et al., Structure of the skin barrier and its modulation by vesicular formulations. Prog Lipid Res, 2003. 42(1): p. 1-36.
20. Flynn, G.L. and B. Stewart, Percutaneous drug penetration: Choosing candidates for transdermal development. Drug Development Research, 1988. 13: p. 169 - 185.
150
21. Hadgraft, J. and R.H. Guy, Transdermal Drug Delivery. 2nd ed2003, New York: Marcel Dekker, Inc.
22. Milewski, M. and A.L. Stinchcomb, Estimation of Maximum Transdermal Flux of Nonionized Xenobiotics from Basic Physicochemical Determinants. Mol Pharm, 2012.
23. Barry, B.W., Novel mechanisms and devices to enable successful transdermal drug delivery. Eur J Pharm Sci, 2001. 14(2): p. 101-14.
24. Guy, R.H. and J. Hadgraft, Physicochemical aspects of percutaneous penetration and its enhancement. Pharm Res, 1988. 5(12): p. 753-8.
25. Scheuplein, R.J. and I.H. Blank, Permeability of the skin. Physiol Rev, 1971. 51(4): p. 702-47.
26. Sinha, V.R. and M.P. Kaur, Permeation enhancers for transdermal drug delivery. Drug Dev Ind Pharm, 2000. 26(11): p. 1131-40.
27. Sethi, S., et al., Comparative evaluation of the therapeutic efficacy of dermabrasion, dermabrasion combined with topical 5% 5-fluorouracil cream, and dermabrasion combined with topical placentrex gel in localized stable vitiligo. Int J Dermatol, 2007. 46(8): p. 875-9.
28. Ogura, M., S. Paliwal, and S. Mitragotri, Low-frequency sonophoresis: current status and future prospects. Adv Drug Deliv Rev, 2008. 60(10): p. 1218-23.
29. Smith, N.B., Perspectives on transdermal ultrasound mediated drug delivery. Int J Nanomedicine, 2007. 2(4): p. 585-94.
30. Mitragotri, S., Effect of therapeutic ultrasound on partition and diffusion coefficients in human stratum corneum. J Control Release, 2001. 71(1): p. 23-9.
31. Kim, D.K., S.W. Choi, and Y.H. Kwak, The effect of SonoPrep on EMLA cream application for pain relief prior to intravenous cannulation. Eur J Pediatr, 2012. 171: p. 985 - 988.
32. Galinkin, J.L., et al., Lidocaine iontophoresis versus eutectic mixture of local anesthetics (EMLA) for IV placement in children. Anesth Analg, 2002. 94(6): p. 1484-8, table of contents.
33. Runeson, L. and E. Haker, Iontophoresis with cortisone in the treatment of lateral epicondylalgia (tennis elbow)--a double-blind study. Scand J Med Sci Sports, 2002. 12(3): p. 136-42.
34. Gupta, S.K., et al., Fentanyl delivery from an electrotransport system: delivery is a function of total current, not duration of current. J Clin Pharmacol, 1998. 38(10): p. 951-8.
35. Denet, A.R., R. Vanbever, and V. Preat, Skin electroporation for transdermal and topical delivery. Adv Drug Deliv Rev, 2004. 56(5): p. 659-74.
36. Denet, A.R. and V. Preat, Transdermal delivery of timolol by electroporation through human skin. J Control Release, 2003. 88(2): p. 253-62.
37. Lombry, C., N. Dujardin, and V. Preat, Transdermal delivery of macromolecules using skin electroporation. Pharm Res, 2000. 17(1): p. 32-7.
38. Vanbever, R., E. LeBoulenge, and V. Preat, Transdermal delivery of fentanyl by electroporation. I. Influence of electrical factors. Pharm Res, 1996. 13(4): p. 559-65.
39. Vanbever, R., M.A. Leroy, and V. Preat, Transdermal permeation of neutral molecules by skin electroporation. J Control Release, 1998. 54(3): p. 243-50.
40. Gill, H.S. and M.R. Prausnitz, Coated microneedles for transdermal delivery. J Control Release, 2007. 117(2): p. 227-37.
41. Kim, Y.C., J.H. Park, and M.R. Prausnitz, Microneedles for drug and vaccine delivery. Adv Drug Deliv Rev, 2012.
151
42. McAllister, D.V., et al., Microfabricated needles for transdermal delivery of macromolecules and nanoparticles: fabrication methods and transport studies. Proc Natl Acad Sci U S A, 2003. 100(24): p. 13755-60.
43. Mikszta, J.A., et al., Improved genetic immunization via micromechanical disruption of skin-barrier function and targeted epidermal delivery. Nat Med, 2002. 8(4): p. 415-9.
44. Henry, S., et al., Microfabricated microneedles: a novel approach to transdermal drug delivery. J Pharm Sci, 1998. 87(8): p. 922-5.
45. Qiu, Y., et al., Enhancement of skin permeation of docetaxel: a novel approach combining microneedle and elastic liposomes. J Control Release, 2008. 129(2): p. 144-50.
46. Baek, C., et al., Local transdermal delivery of phenylephrine to the anal sphincter muscle using microneedles. J Control Release, 2011. 154(2): p. 138-47.
47. Martanto, W., et al., Transdermal delivery of insulin using microneedles in vivo. Pharm Res, 2004. 21(6): p. 947-52.
48. Cormier, M., et al., Transdermal delivery of desmopressin using a coated microneedle array patch system. J Control Release, 2004. 97(3): p. 503-11.
49. Zhu, Q., et al., Immunization by vaccine-coated microneedle arrays protects against lethal influenza virus challenge. Proc Natl Acad Sci U S A, 2009. 106(19): p. 7968-73.
50. Kim, Y.C., et al., Enhanced memory responses to seasonal H1N1 influenza vaccination of the skin with the use of vaccine-coated microneedles. J Infect Dis, 2010. 201(2): p. 190-8.
51. Gill, H.S., et al., Cutaneous vaccination using microneedles coated with hepatitis C DNA vaccine. Gene Ther, 2010. 17(6): p. 811-4.
52. Matriano, J.A., et al., Macroflux microprojection array patch technology: a new and efficient approach for intracutaneous immunization. Pharm Res, 2002. 19(1): p. 63-70.
53. Lee, J.W., et al., Dissolving microneedle patch for transdermal delivery of human growth hormone. Small, 2011. 7(4): p. 531-9.
54. Ito, Y., et al., Self-dissolving microneedles for the percutaneous absorption of EPO in mice. J Drug Target, 2006. 14(5): p. 255-61.
55. Sullivan, S.P., et al., Dissolving polymer microneedle patches for influenza vaccination. Nat Med, 2010. 16(8): p. 915-20.
56. Gupta, J., E.I. Felner, and M.R. Prausnitz, Minimally invasive insulin delivery in subjects with type 1 diabetes using hollow microneedles. Diabetes Technol Ther, 2009. 11(6): p. 329-37.
57. Davis, S.P., et al., Hollow metal microneedles for insulin delivery to diabetic rats. IEEE Trans Biomed Eng, 2005. 52(5): p. 909-15.
58. Gill, H.S., et al., Effect of microneedle design on pain in human volunteers. Clin J Pain, 2008. 24(7): p. 585-94.
59. Kaushik, S., et al., Lack of pain associated with microfabricated microneedles. Anesth Analg, 2001. 92(2): p. 502-4.
60. Miyano, T., et al., Sugar micro needles as transdermic drug delivery system. Biomed Microdevices, 2005. 7(3): p. 185-8.
61. Sivamani, R.K., et al., Clinical microneedle injection of methyl nicotinate: stratum corneum penetration. Skin Res Technol, 2005. 11(2): p. 152-6.
62. Donnelly, R.F., et al., Microneedle arrays allow lower microbial penetration than hypodermic needles in vitro. Pharm Res, 2009. 26(11): p. 2513-22.
63. Kalluri, H., C.S. Kolli, and A.K. Banga, Characterization of microchannels created by metal microneedles: formation and closure. AAPS J, 2011. 13(3): p. 473-81.
152
64. Kalluri H, B.A., Microneedles and transdermal drug delivery. Journal of Drug Delivery Science and Technology, 2009. 19(5): p. 303-310.
65. Kalluri, H. and A.K. Banga, Formation and Closure of Microchannels in Skin Following Microporation. Pharm Res, 2010.
66. Lee, S.H., et al., A role for ions in barrier recovery after acute perturbation. J Invest Dermatol, 1994. 102(6): p. 976-9.
67. Lee, S.H., et al., Calcium and potassium are important regulators of barrier homeostasis in murine epidermis. J Clin Invest, 1992. 89(2): p. 530-8.
68. Menon, G.K., et al., Localization of calcium in murine epidermis following disruption and repair of the permeability barrier. Cell Tissue Res, 1992. 270(3): p. 503-12.
69. Badran, M.M., J. Kuntsche, and A. Fahr, Skin penetration enhancement by a microneedle device (Dermaroller) in vitro: dependency on needle size and applied formulation. Eur J Pharm Sci, 2009. 36(4-5): p. 511-23.
70. Bal, S.M., et al., Influence of microneedle shape on the transport of a fluorescent dye into human skin in vivo. J Control Release, 2010. 147(2): p. 218-24.
71. Zhai, H. and H.I. Maibach, Occlusion vs. skin barrier function. Skin Res Technol, 2002. 8(1): p. 1-6.
72. Tsai, J.C., et al., Metabolic approaches to enhance transdermal drug delivery. 1. Effect of lipid synthesis inhibitors. J Pharm Sci, 1996. 85(6): p. 643-8.
73. Elias, P.M., et al., The potential of metabolic interventions to enhance transdermal drug delivery. J Investig Dermatol Symp Proc, 2002. 7(1): p. 79-85.
74. Feingold, K.R., et al., The lovastatin-treated rodent: a new model of barrier disruption and epidermal hyperplasia. J Invest Dermatol, 1991. 96(2): p. 201-9.
75. Menon, G.K., et al., Structural basis for the barrier abnormality following inhibition of HMG CoA reductase in murine epidermis. J Invest Dermatol, 1992. 98(2): p. 209-19.
76. Mauro, T., et al., Acute barrier perturbation abolishes the Ca2+ and K+ gradients in murine epidermis: quantitative measurement using PIXE. J Invest Dermatol, 1998. 111(6): p. 1198-201.
77. Denda, M., S. Fuziwara, and K. Inoue, Influx of calcium and chloride ions into epidermal keratinocytes regulates exocytosis of epidermal lamellar bodies and skin permeability barrier homeostasis. J Invest Dermatol, 2003. 121(2): p. 362-7.
78. Singer, A.J. and R.A. Clark, Cutaneous wound healing. N Engl J Med, 1999. 341(10): p. 738-46.
79. Funk, C.D., Prostaglandins and leukotrienes: advances in eicosanoid biology. Science, 2001. 294(5548): p. 1871-5.
80. Dubois, R.N., et al., Cyclooxygenase in biology and disease. FASEB J, 1998. 12(12): p. 1063-73.
81. Ruzicka, T. and M.P. Printz, Arachidonic-Acid Metabolism in Skin - a Review. Reviews of Physiology Biochemistry and Pharmacology, 1984. 100: p. 121-160.
82. Vaheri, A., et al., Nemosis, a novel way of fibroblast activation, in inflammation and cancer. Exp Cell Res, 2009. 315(10): p. 1633-8.
83. Marie L. Foegh, P.W.R., The Eicosanoids: Prostaglandins, Thromboxanes, Leukotrienes, & Related Compounds, in Basic & Clinical Pharmacology, B.G. Katzung, Editor 2004, The McGraw-Hill Companies, Inc: New York. p. 298 - 312.
84. Vane, J.R., Inhibition of prostaglandin synthesis as a mechanism of action for aspirin-like drugs. Nat New Biol, 1971. 231(25): p. 232-5.
85. Lee, J.L., et al., Cyclooxygenases in the skin: pharmacological and toxicological implications. Toxicol Appl Pharmacol, 2003. 192(3): p. 294-306.
153
86. Laulederkind, S.J., et al., Both constitutive and inducible prostaglandin H synthase affect dermal wound healing in mice. Lab Invest, 2002. 82(7): p. 919-27.
87. Leong, J., et al., Cyclooxygenases in human and mouse skin and cultured human keratinocytes: association of COX-2 expression with human keratinocyte differentiation. Exp Cell Res, 1996. 224(1): p. 79-87.
88. Anton, R.F., et al., Naltrexone effects on alcohol consumption in a clinical laboratory paradigm: temporal effects of drinking. Psychopharmacology (Berl), 2004. 173(1-2): p. 32-40.
89. Anton, R.F., et al., Combined pharmacotherapies and behavioral interventions for alcohol dependence: the COMBINE study: a randomized controlled trial. JAMA, 2006. 295(17): p. 2003-17.
90. MICROMEDEX® 2.0. Accessed July 3, 2012; Available from: <http://www.thomsonhc.com/micromedex2/librarian/%3E.
91. Banks, S.L., et al., Flux across [corrected] microneedle-treated skin is increased by increasing charge of naltrexone and naltrexol in vitro. Pharm Res, 2008. 25(7): p. 1677-85.
92. Paudel, K.S., et al., Transdermal delivery of naltrexone and its active metabolite 6-beta-naltrexol in human skin in vitro and guinea pigs in vivo. J Pharm Sci, 2005. 94(9): p. 1965-75.
93. Valiveti, S., et al., Development and validation of a liquid chromatography-mass spectrometry method for the quantitation of naltrexone and 6beta-naltrexol in guinea pig plasma. J Chromatogr B Analyt Technol Biomed Life Sci, 2004. 810(2): p. 259-67.
94. Curdy, C., et al., Non-invasive assessment of the effect of formulation excipients on stratum corneum barrier function in vivo. Int J Pharm, 2004. 271(1-2): p. 251-6.
95. Kalia, Y.N. and R.H. Guy, The electrical characteristics of human skin in vivo. Pharm Res, 1995. 12(11): p. 1605-13.
96. Kawai, E., et al., Skin surface electric potential as an indicator of skin condition: a new, non-invasive method to evaluate epidermal condition. Exp Dermatol, 2008. 17(8): p. 688-92.
97. Yamamoto, T. and Y. Yamamoto, Electrical properties of the epidermal stratum corneum. Med Biol Eng, 1976. 14(2): p. 151-8.
98. Puurtinen, M.M., et al., Measurement of noise and impedance of dry and wet textile electrodes, and textile electrodes with hydrogel. Conf Proc IEEE Eng Med Biol Soc, 2006. 1: p. 6012-5.
99. Barbero, A.M. and H.F. Frasch, Pig and guinea pig skin as surrogates for human in vitro penetration studies: a quantitative review. Toxicol In Vitro, 2009. 23(1): p. 1-13.
100. Fujii, M., et al., Evaluation of Yucatan micropig skin for use as an in vitro model for skin permeation study. Biol Pharm Bull, 1997. 20(3): p. 249-54.
101. Gore, A.V., A.C. Liang, and Y.W. Chien, Comparative biomembrane permeation of tacrine using Yucatan minipigs and domestic pigs as the animal model. J Pharm Sci, 1998. 87(4): p. 441-7.
102. Godin, B. and E. Touitou, Transdermal skin delivery: predictions for humans from in vivo, ex vivo and animal models. Adv Drug Deliv Rev, 2007. 59(11): p. 1152-61.
103. Gill, H.S. and M.R. Prausnitz, Coating formulations for microneedles. Pharm Res, 2007. 24(7): p. 1369-80.
154
104. Smart, W.H. and K. Subramanian, The use of silicon microfabrication technology in painless blood glucose monitoring. Diabetes Technol Ther, 2000. 2(4): p. 549-59.
105. Daddona, P.E., et al., Parathyroid hormone (1-34)-coated microneedle patch system: clinical pharmacokinetics and pharmacodynamics for treatment of osteoporosis. Pharm Res, 2011. 28(1): p. 159-65.
106. Milewski, M., N.K. Brogden, and A.L. Stinchcomb, Current aspects of formulation efforts and pore lifetime related to microneedle treatment of skin. Expert Opin Drug Deliv, 2010. 7(5): p. 617-29.
107. 3M Microneedle Technology. August 16, 2011; Available from: http://solutions.3m.com/wps/portal/3M/en_WW/DrugDeliverySystems/DDSD/technology-solutions/transdermal-technologies/microstructured-transdermal-systems/.
108. Grubauer, G., P.M. Elias, and K.R. Feingold, Transepidermal water loss: the signal for recovery of barrier structure and function. J Lipid Res, 1989. 30(3): p. 323-33.
109. Lackermeier, A.H., et al., In vivo ac impedance spectroscopy of human skin. Theory and problems in monitoring of passive percutaneous drug delivery. Ann N Y Acad Sci, 1999. 873: p. 197-213.
110. Tagami, H., et al., Evaluation of the skin surface hydration in vivo by electrical measurement. J Invest Dermatol, 1980. 75(6): p. 500-7.
111. Karande, P., A. Jain, and S. Mitragotri, Relationships between skin's electrical impedance and permeability in the presence of chemical enhancers. J Control Release, 2006. 110(2): p. 307-13.
112. Kohli, R., et al., Impedance measurements for the non-invasive monitoring of skin hydration: a reassessment. Int J Pharm, 1985. 26: p. 275 - 287.
113. White, E. and A. Bunge. Reporting Skin Resistance and Impedance. in Barrier Function of Mammalian Skin Gordon Research Conference. 2009. Waterville Valley, NH.
114. Milewski, M., Microneedle-assisted transdermal delivery of naltrexone species: in vitro permeation and in vivo pharmacokientic studies, 2011, University of Kentucky Doctoral thesis: Lexington, KY.
115. Fullerton, A., et al., Guidelines for measurement of skin colour and erythema. A report from the Standardization Group of the European Society of Contact Dermatitis. Contact Dermatitis, 1996. 35(1): p. 1-10.
116. Curdy, C., Y.N. Kalia, and R.H. Guy, Post-iontophoresis recovery of human skin impedance in vivo. Eur J Pharm Biopharm, 2002. 53(1): p. 15-21.
117. Gupta, J. and M.R. Prausnitz, Recovery of skin barrier properties after sonication in human subjects. Ultrasound Med Biol, 2009. 35(8): p. 1405-8.
118. Kiptoo, P.K., et al., In vivo evaluation of a transdermal codrug of 6-beta-naltrexol linked to hydroxybupropion in hairless guinea pigs. Eur J Pharm Sci, 2008. 33(4-5): p. 371-9.
119. Schnetz, E., et al., Multicentre study for the development of an in vivo model to evaluate the influence of topical formulations on irritation. Contact Dermatitis, 2000. 42(6): p. 336-43.
120. Brown, M.B. and S.A. Jones, Hyaluronic acid: a unique topical vehicle for the localized delivery of drugs to the skin. J Eur Acad Dermatol Venereol, 2005. 19(3): p. 308-18.
121. Micromedex® 2.0. 2011 Available from: http://www.thomsonhc.com/micromedex2/librarian/.
155
122. Mauro, T., et al., Barrier recovery is impeded at neutral pH, independent of ionic effects: implications for extracellular lipid processing. Arch Dermatol Res, 1998. 290(4): p. 215-22.
123. Potts, R.O. and R.H. Guy, A predictive algorithm for skin permeability: the effects of molecular size and hydrogen bond activity. Pharm Res, 1995. 12(11): p. 1628-33.
124. Potts, R.O. and R.H. Guy, Predicting skin permeability. Pharm Res, 1992. 9(5): p. 663-9.
125. Smith, G., et al., Regulation of cutaneous drug-metabolizing enzymes and cytoprotective gene expression by topical drugs in human skin in vivo. Br J Dermatol, 2006. 155(2): p. 275-81.
126. PharmaDerm, Solaraze® gel package insert., 2009. 127. Muller-Decker, K., et al., Prostaglandin-H-synthase isozyme expression in normal
and neoplastic human skin. Int J Cancer, 1999. 82(5): p. 648-56. 128. Bucks, D. and H. Maibach, Percutaneous Absorption, ed. R.L. Bronaugh and H.I.
Maibach1999, New York: Marcel Dekker, Inc. 129. Swadley, C.L., Investigation of Endocannabinoid System Modulators for
Percutaneous Drug Delivery, 2011, University of Kentucky Doctoral thesis: Lexington, KY.
130. Andersen, F., et al., Comparison of the response to topical irritants in hairless guinea pigs and human volunteers. J Toxicol-Cutan Ocul Toxicol, 2005. 24: p. 31-43.
131. Ghosh, P., et al. Microneedle enhanced transdermal delivery using a codrug approach (abstract accepted for presentation). in American Association of Pharmaceutical Scientists, Annual meeting. 2011. Washington D.C.
132. Levin, G., et al., Transdermal delivery of human growth hormone through RF-microchannels. Pharmaceutical Research, 2005. 22(4): p. 550-555.
133. Ghosh, P., et al. Microneedle enhanced transdermal delivery using a codrug approach (abstract accepted for presentation). in American Association of Pharmaceutical Scientists, Annual meeting. 2011. Washington D.C.
134. Swadley, C.L., Investigation of Endocannabinoid System Modulators for Percutaneous Drug Delivery. , in Pharmaceutical Sciences2011, University of Kentucky: Lexington, KY.
135. Milewski, M. and A.L. Stinchcomb, Vehicle composition influence on the microneedle-enhanced transdermal flux of naltrexone hydrochloride. Pharm Res, 2011. 28(1): p. 124-34.
136. Darlenski, R. and J.W. Fluhr, Influence of skin type, race, sex, and anatomic location on epidermal barrier function. Clin Dermatol, 2012. 30(3): p. 269-73.
137. Choi, E.H., et al., Iontophoresis and sonophoresis stimulate epidermal cytokine expression at energies that do not provoke a barrier abnormality: lamellar body secretion and cytokine expression are linked to altered epidermal calcium levels. J Invest Dermatol, 2003. 121(5): p. 1138-44.
138. Denda, M., et al., The epidermal hyperplasia associated with repeated barrier disruption by acetone treatment or tape stripping cannot be attributed to increased water loss. Arch Dermatol Res, 1996. 288(5-6): p. 230-8.
139. Menon, G.K., et al., Selective obliteration of the epidermal calcium gradient leads to enhanced lamellar body secretion. J Invest Dermatol, 1994. 102(5): p. 789-95.
140. Roblin, I., et al., Topical treatment of experimental hydrofluoric acid skin burns by 2.5% calcium gluconate. J Burn Care Res, 2006. 27(6): p. 889-94.

156
141. Robinson, M.K., Population differences in acute skin irritation responses. Race, sex, age, sensitive skin and repeat subject comparisons. Contact Dermatitis, 2002. 46(2): p. 86-93.
142. Robinson, M.K., M.A. Perkins, and D.A. Basketter, Application of a 4-h human patch test method for comparative and investigative assessment of skin irritation. Contact Dermatitis, 1998. 38(4): p. 194-202.
143. Ahn, S.K., et al., Functional and structural changes of the epidermal barrier induced by various types of insults in hairless mice. Arch Dermatol Res, 2001. 293(6): p. 308-18.
144. Birchall, J.C., et al., Microneedles in clinical practice - an exploratory study into the opinions of healthcare professionals and the public. Pharmaceutical Research, 2011. 28(1): p. 95 - 106.
157
VITA
Nicole K. Brogden, Pharm.D.
Born: May 21, 1981
Birthplace: Ames, IA USA
EDUCATION AND TRAINING
Doctoral Candidate, University of Kentucky College of Pharmacy 2008 – present
Clinical and Experimental Therapeutics Program
Major advisor: Audra Stinchcomb, Ph.D.
Postgraduate Year One (PGY-1) Pharmacy Residency 2007 – 2008
University of Kentucky HealthCare
Program director: George A. Davis, Pharm.D., BCPS
Doctor of Pharmacy, The University of Iowa College of Pharmacy May 2007
Bachelor of Science in Biology, The University of Iowa May 2003
RESEARCH GRANTS AND FUNDING
1F31DA029374, NIH/NIDA 2010 – 2012
Project title: “Clinical evaluation of novel methods for extending microneedle pore
lifetime”
ROLE: Principal Investigator
NIH/NIDA Clinical Loan Repayment Program 2010 – 2012
Project title: “Clinical evaluation of novel methods for extending microneedle pore
lifetime” (2010 – 2012)
ROLE: Principal Investigator
158
Seed Grant, Center for Clinical and Translational Science 2010 – 2012
University of Kentucky
Project title: “Development of impedance spectroscopy as a means of evaluating
extended pore lifetime following topical application of diclofenac sodium to microneedle
treated skin”
ROLE: Principal Investigator
Pilot Research Program, 2009 – 2011
University of Kentucky Center for Clinical and Translational Science
Project title: “Effects of diclofenac gel on pore lifetime following transdermal microneedle
insertion in healthy human subjects”
ROLE: Co-investigator, Research Coordinator
PUBLICATIONS
1. Brogden NK, Mehalick L, Fischer CL, Wertz PW, Brogden KA. (2012) Review - The
emerging role of peptides and lipids as antimicrobial epidermal barriers and
modulators of local inflammation. Skin Pharmacology and Physiology. 25(4): 167 –
81. PMID: 22538862.
2. Brogden NK, Brogden KA. (2011) Review - Will new generations of modified
antimicrobial peptides improve their potential as pharmaceuticals? International
Journal of Antimicrobial Agents. Sep;38(3):217-25. PMID: 21733662
3. Banks SL, Paudel KS, Brogden NK, Loftin CD, Stinchcomb AL. (2011) Diclofenac
enables prolonged delivery of naltrexone through microneedle-treated skin.
Pharmaceutical Research. May;28(5):1211-9. PMID: 21301935
4. Paudel KS, Milewski M, Swadley CL, Brogden NK, Ghosh P, Stinchcomb AL. (2010)
Challenges and opportunities in transdermal delivery. Therapeutic Delivery. 1(1):109
– 131, July 2010.
5. Banks SL, Pinninti RR, Gill HS, Crooks PA, Brogden NK, Prausnitz MR,
Stinchcomb AL. (2010) Transdermal delivery of naltrexol and skin permeability
lifetime after microneedle treatment in hairless guinea pigs in vivo. Journal of
Pharmaceutical Sciences. 99(7):3072-80, July 2010. PMID: 20166200
6. Milewski M, Brogden NK, Stinchcomb AL. (2010) Current aspects of formulation
efforts and pore lifetime related to microneedle treatment of skin. Expert Opinion on
Drug Delivery. 7(5):617-29, May 2010. PMID: 20205604
159
7. Florang VF, Rees JR, Brogden NK, Anderson DG, Hurley TD, and Doorn JA. (2007)
Inhibition of mitochondrial aldehyde dehydrogenase-mediated oxidation of 3,4-
dihydroxyphenylacetaldehyde. In Enzymology and Molecular Biology of Carbonyl
Metabolism 13. (Weiner, E., Maser, E., Lindahl, R. and Plapp, B., Eds.) pp. 33-39,
Purdue University Press, West Lafayette, Indiana.
8. Florang VF, Rees JR, Brogden NK, Anderson DG, Hurley TD, and Doorn JA. (2007)
Inhibition of the oxidative metabolism of 3,4-dihydroxyphenylacetaldehyde, a reactive
intermediate of dopamine metabolism, by 4-hydroxy-2-nonenal. Neurotoxicology.
28(1):76-82, January 2007. PMID: 16956664
PUBLICATIONS SUBMITTED
1. Diclofenac delays micropore closure following microneedle treatment in human
subjects. Submitted to Journal of Controlled Release.
PUBLICATIONS IN PREPARATION
1. Development of in vivo impedance spectroscopy techniques for measurement of
micropore formation
2. Pharmacokinetic evaluation of microneedle/diclofenac sodium enhanced 7-day
transdermal delivery of naltrexone HCl in healthy human volunteers
AWARDS AND HONORS
Pre-Doctoral Fellowship, 2010 – 2012
American Foundation for Pharmaceutical Education (AFPE)
3rd place, Rho Chi Research Day Poster Award, April 2010
Graduate Student category
University of Kentucky College of Pharmacy
Nomination, Cystic Fibrosis Humanitarian Award Spring 2008
Lexington, KY
Class of 2007 Excellence in Research Award Spring 2007
The University of Iowa College of Pharmacy

160
Best Poster, Pharm.D. Student category, Spring 2007
8th Annual Research Achievement Day Symposium and Poster Session
The University of Iowa College of Pharmacy
President’s List, The University of Iowa Spring 2007
Student Leader Spotlight 2006
The University of Iowa College of Pharmacy 2005-2006 Annual Report
Best Presentation Award, Spring 2006
Biological and Health Sciences Division 8th Annual James F. Jakobsen
Graduate Conference
The University of Iowa
Jakobsen Forum Award Winner Spotlight Fall 2006
The University of Iowa Graduate College
Poster Session Award Spring 2006
8th Annual Interdisciplinary Health Research Poster Session
The University of Iowa
The University of Iowa College of Pharmacy Scholarship Spring 2006
APhA-ASP National Patient Counseling Competition local winner Fall 2006
The University of Iowa College of Pharmacy
The National Dean’s List 2005 – 2006
Iowa Pharmacy Foundation Scholarship 2004 – 2005
The University of Iowa Pharmacy Tuition Scholarship 2006 – 2007,
2003 – 2004

161
Student Abstract Award Finalist, May 2003
The American Society for Microbiology
Howard Hughes Research Fellow, The University of Iowa 2001 – 2002
Dean’s List, The University of Iowa 9 semesters, 2000 – 2007
Nicole K. Brogden Student’s signature
July 17, 2011 Date