Embed Size (px)
Citation preview
Clinical Chemistry (CHE 221)
Experiment # 5 Serum-Protein Electrophoresis
Name ______________________________
Date Performed______________________
Date Submitted______________________
Partners Name(s)_____________________
Partners Name(s)_____________________

Experiment title: Serum-Protein Electrophoresis Reading assignment: Tietz 6th edition pages 310-312 or Bishop 6th edition pages 254-258 Sections entitled “Electrophoresis” and Serum Protein Electrophoresis”, pre-lab lecture notes, and the attached protocols. Pre-lab questions
1) Name the five major bands that are seen in a normal serum-protein gel in the order that they elute starting with the band closest to the anode.
2) Name at least one component of each of the five major bands in a normal serum-protein
gel.

Protocol(s) 1) Beckman Serum Protein Electrophoresis gel instructions (with additions below). 2) Analysis of Serum Protein Gels using Image J software.
(Both attached)
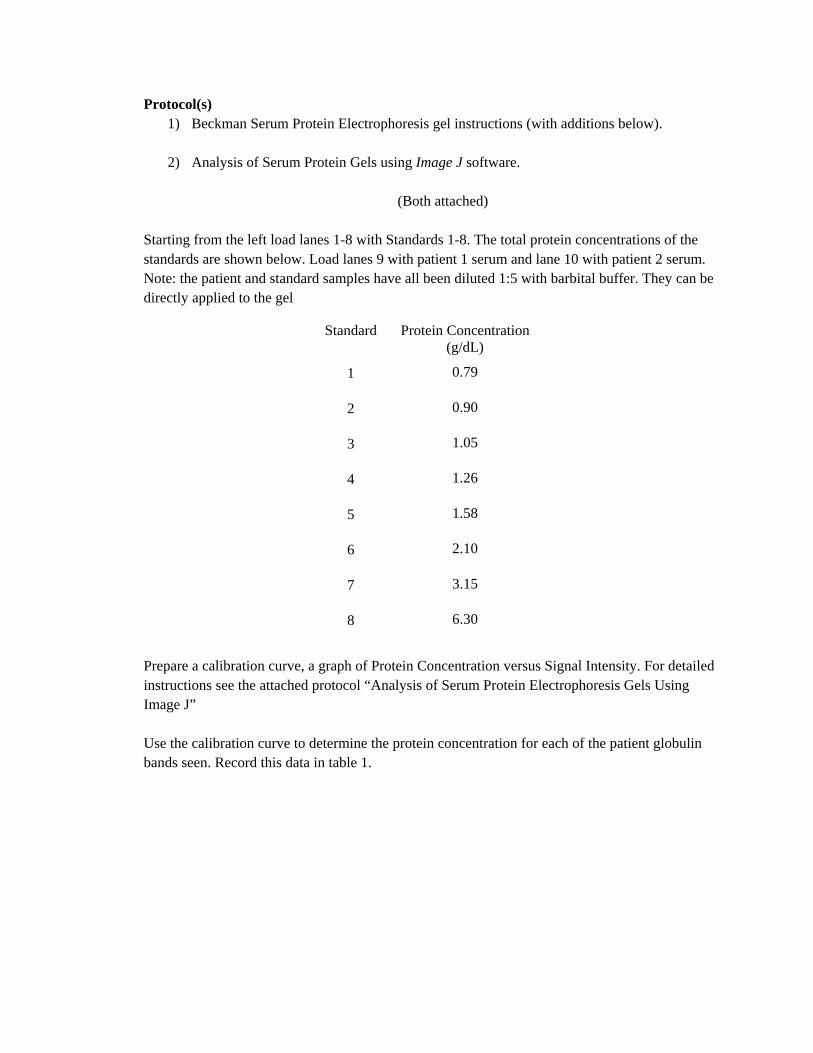
Starting from the left load lanes 1-8 with Standards 1-8. The total protein concentrations of the standards are shown below. Load lanes 9 with patient 1 serum and lane 10 with patient 2 serum. Note: the patient and standard samples have all been diluted 1:5 with barbital buffer. They can be directly applied to the gel
Standard Protein Concentration (g/dL)
1 0.79
2 0.90
3 1.05
4 1.26
5 1.58
6 2.10
7 3.15
8 6.30
Prepare a calibration curve, a graph of Protein Concentration versus Signal Intensity. For detailed instructions see the attached protocol “Analysis of Serum Protein Electrophoresis Gels Using Image J” Use the calibration curve to determine the protein concentration for each of the patient globulin bands seen. Record this data in table 1.
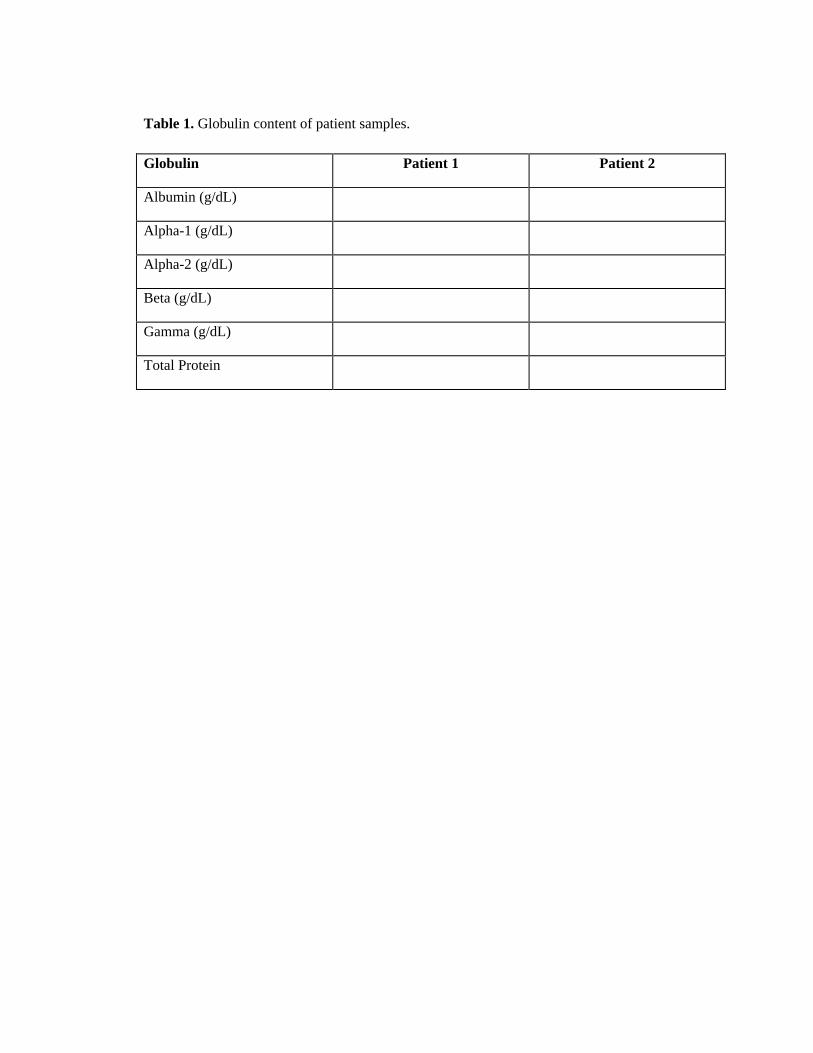
Table 1. Globulin content of patient samples.
Globulin Patient 1 Patient 2
Albumin (g/dL)
Alpha-1 (g/dL)
Alpha-2 (g/dL)
Beta (g/dL)
Gamma (g/dL)
Total Protein

The ImageJ Method for Serum Protein Electrophoresis If you don't have access to a photo editing program such as Photoshop, you can do gel densitometry analyses using ImageJ, which is available free from the National Institutes of Health. You can download it here:
http://rsb.info.nih.gov/ij/index.html Prepare the Image for processing 1. Open the gel image using ImageJ. 2. Under Image>Type click on 8-bit to convert the image to grayscale. 3. Go to the menu Process>Subtract Background. Try a rolling ball radius of 50. This removes some of the background coloration from your image. If the image gets too light to see some bands try using a larger rolling ball radius. 4. Go to Analyze>Set Measurements, and click the boxes for Area, Mean Gray Value, and Integrated Density. 5. Go to Analyze>Set Scale, and enter "pixels" in the box next to unit of length. 6. Go to Edit>Invert (or hit Ctrl+Shift+I) to invert the colors on the image. Now the dark areas are light, and the light areas are dark. This makes the measured values for bands increase with increasing protein concentration. Create a line graph of the protein content of each patient gel lane 1. Go to Edit > Options> Profile Plot Options and check the box for vertical profile. 2. Go to the toolbar and select the leftmost tool (the rectangle).
1. Enclose all of the patient 1 globulin bands in a rectangle. 2. Go to Analyze > Plot Profile. 3. In the new window with the plot profile click on List and in the new window that appears go to File > Save As and save the data.
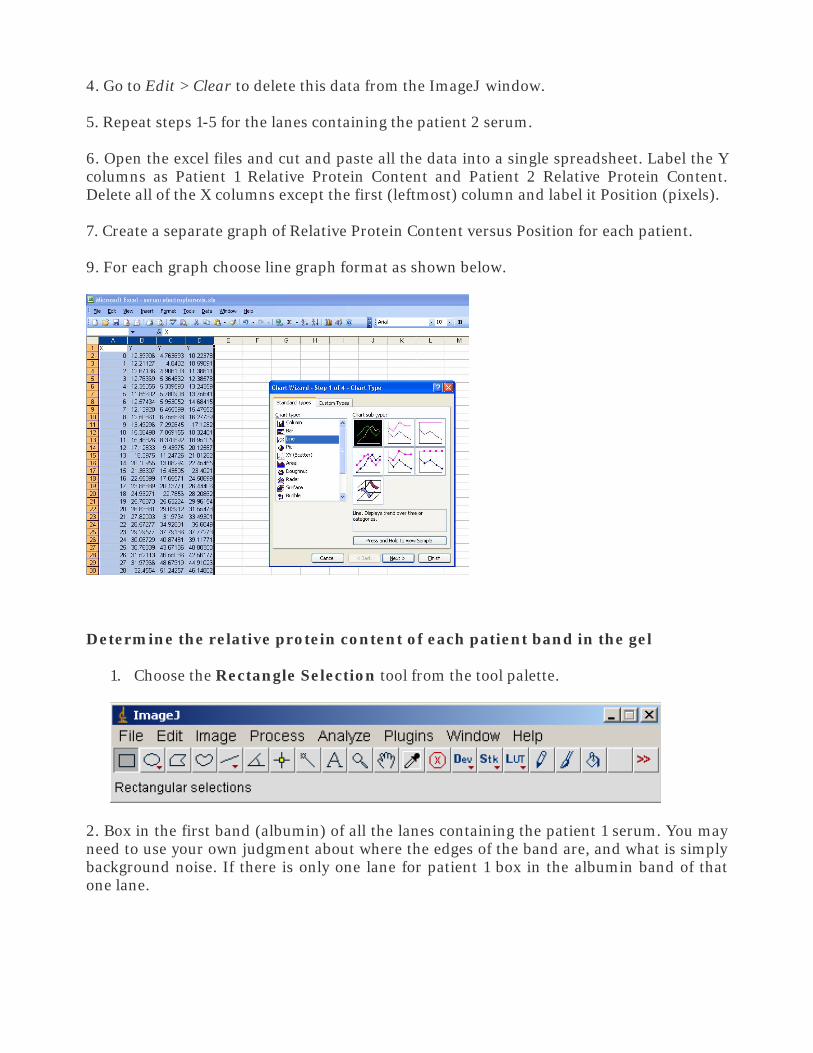
4. Go to Edit > Clear to delete this data from the ImageJ window. 5. Repeat steps 1-5 for the lanes containing the patient 2 serum. 6. Open the excel files and cut and paste all the data into a single spreadsheet. Label the Y columns as Patient 1 Relative Protein Content and Patient 2 Relative Protein Content. Delete all of the X columns except the first (leftmost) column and label it Position (pixels). 7. Create a separate graph of Relative Protein Content versus Position for each patient. 9. For each graph choose line graph format as shown below.
Determine the relative protein content of each patient band in the gel
1. Choose the Rectangle Selection tool from the tool palette.
2. Box in the first band (albumin) of all the lanes containing the patient 1 serum. You may need to use your own judgment about where the edges of the band are, and what is simply background noise. If there is only one lane for patient 1 box in the albumin band of that one lane.
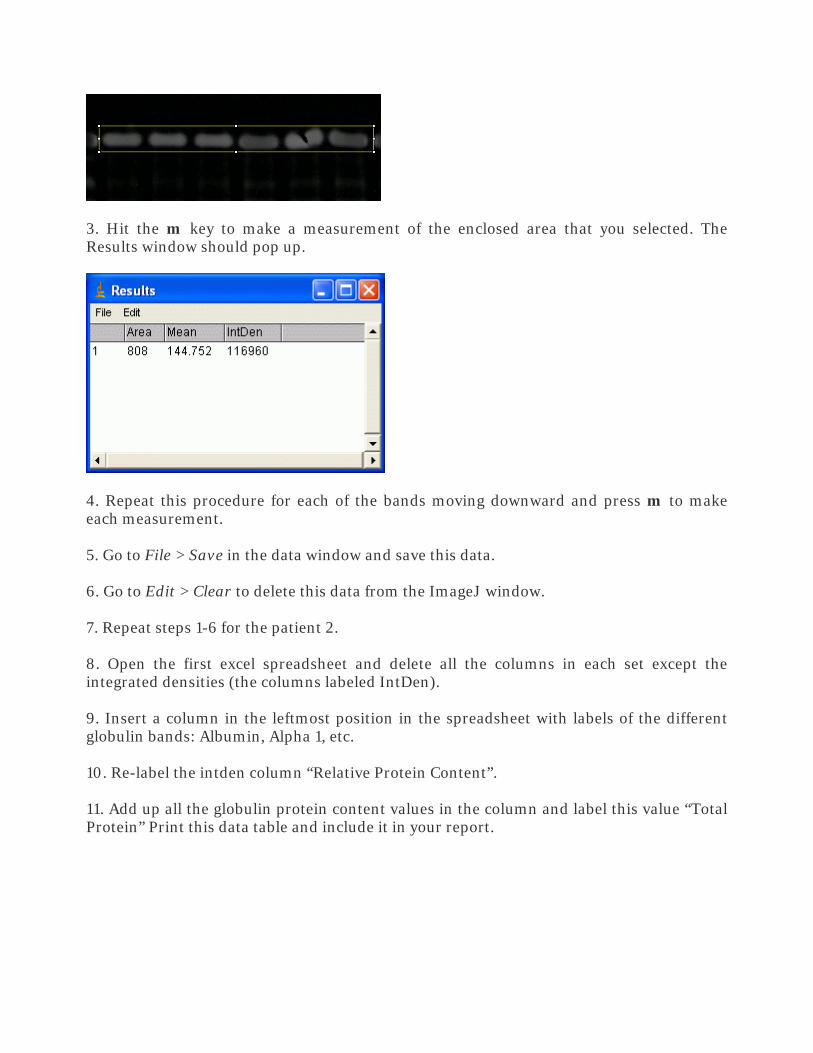
3. Hit the m key to make a measurement of the enclosed area that you selected. The Results window should pop up.
4. Repeat this procedure for each of the bands moving downward and press m to make each measurement. 5. Go to File > Save in the data window and save this data. 6. Go to Edit > Clear to delete this data from the ImageJ window. 7. Repeat steps 1-6 for the patient 2. 8. Open the first excel spreadsheet and delete all the columns in each set except the integrated densities (the columns labeled IntDen). 9. Insert a column in the leftmost position in the spreadsheet with labels of the different globulin bands: Albumin, Alpha 1, etc. 10. Re-label the intden column “Relative Protein Content”. 11. Add up all the globulin protein content values in the column and label this value “Total Protein” Print this data table and include it in your report.
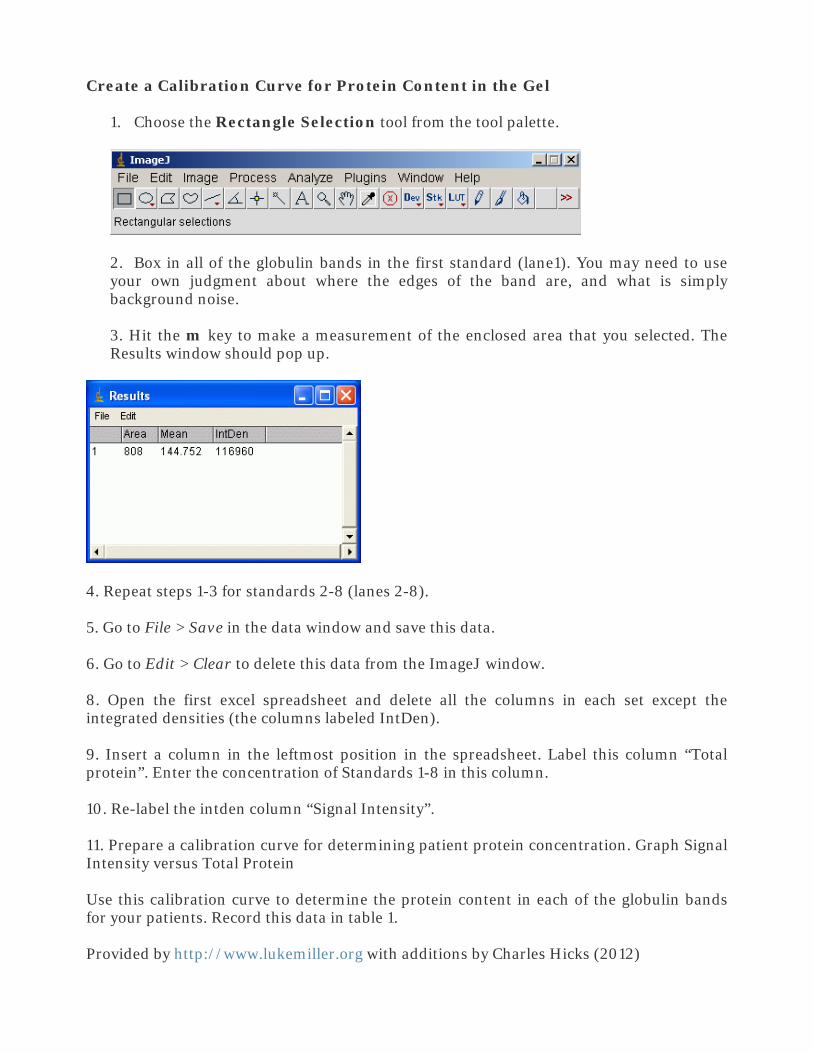
Create a Calibration Curve for Protein Content in the Gel
1. Choose the Rectangle Selection tool from the tool palette.
2. Box in all of the globulin bands in the first standard (lane1). You may need to use your own judgment about where the edges of the band are, and what is simply background noise. 3. Hit the m key to make a measurement of the enclosed area that you selected. The Results window should pop up.
4. Repeat steps 1-3 for standards 2-8 (lanes 2-8). 5. Go to File > Save in the data window and save this data. 6. Go to Edit > Clear to delete this data from the ImageJ window. 8. Open the first excel spreadsheet and delete all the columns in each set except the integrated densities (the columns labeled IntDen). 9. Insert a column in the leftmost position in the spreadsheet. Label this column “Total protein”. Enter the concentration of Standards 1-8 in this column. 10. Re-label the intden column “Signal Intensity”. 11. Prepare a calibration curve for determining patient protein concentration. Graph Signal Intensity versus Total Protein Use this calibration curve to determine the protein content in each of the globulin bands for your patients. Record this data in table 1. Provided by http://www.lukemiller.org with additions by Charles Hicks (2012)
/
f f
BECI{MANPARAGON@ Electrophoresis System
SERUM PROTEIN (SPE)Electrophoresis Kit
Reo rd e r # 65 s eoolHf '39"''X"J:lA'i:.1
Reorder # 446004 (5000 Determinations)
For In Vitro Diagnostic Use
PRINCIPLE
INTENDED USE
The Paragon Serum Ptotein (SPE) Eleclrophoresis Kit is for the electrophoretic separation of proleins in humans€rum, cerebrospinal fluid and urine.
METHODOLOGY
Proteins in an €lectric tield migrate toward one of the electrode pol€s at varying rates. Migration separat€s theproteins for identiticalion and quantitation of relative percentages.
Agarose gel electrophoresis separates human serum proteins into five distinct, well-resolved zones. The livezones or fractions are traditionally designated as albumin, alpha-1 , alpha-2, beta, and gamma. The Paragon SPEKit contains components lor the electrophoretic separation of proteins in a buffered agarose gel, Afterelectrophoresist proleins in the gel are immobilized with a fixative solution. The gel is then dried and stained witha protein-specitic stain for visual interpretation by comparing it to a known reference pattern (control) orquantitalion by densitometry.
CLINICAL SIGNIFICANCE
The electrophoretic separation of serum proteins is apathophysiologic states associated with changes in protein
screening procedure and aids in the diagnosis ofquantity and molecular nature.
ANNUAL REVIEW
@ Copyright 1995 Beckman Instruments, lnc. March 1995 SPE 1 of 15
SPECIMEN
WPE OF SPECIMEN
Biological fluids should be collected in the manner normally used for any clinical laboratory test. Freshly drawnserum is the preferred specimen. CSF (cerebrospinal fluid) or urine may also be used.
SPECIMEN STORAGE AND STABILITY
1 . Keep tubes of blood closed at all times in a vertical, stopper-up position until serum is separated from colls.
2. lf serum samples are not assayed within I hours, samples should be stored at +2"C to +8'C. ll sampl€s arenot assayed within 72 hours, samples should be stor€d trozen at -15"C to -20oC. Frozen samples should be
SAMPLE VOLUME
. 3-5 prl when using a Paragon Sample Applicator:
Diluted serum or control samples (1:5 with B-2 Barbital Buffer)
Undiluted CSF and urine samples (total protein concentration greater than 700 mg/dL)
. 0.5 ;lL when using a Paragon Multi-Range Pipet:
Undiluted serum samples
thawed only once. Analyte deterioration may occur in samples that are repeatedlyfrozen and thawed.
Additional specimen storage and stability conditions as designated by this laboratory:
SPE 2 of 15 March 1995 @ Copyright 1995 Beckman Instruments, Inc.
REACTIVE INGREDIENTS
REAGENTCONSTITUENTS
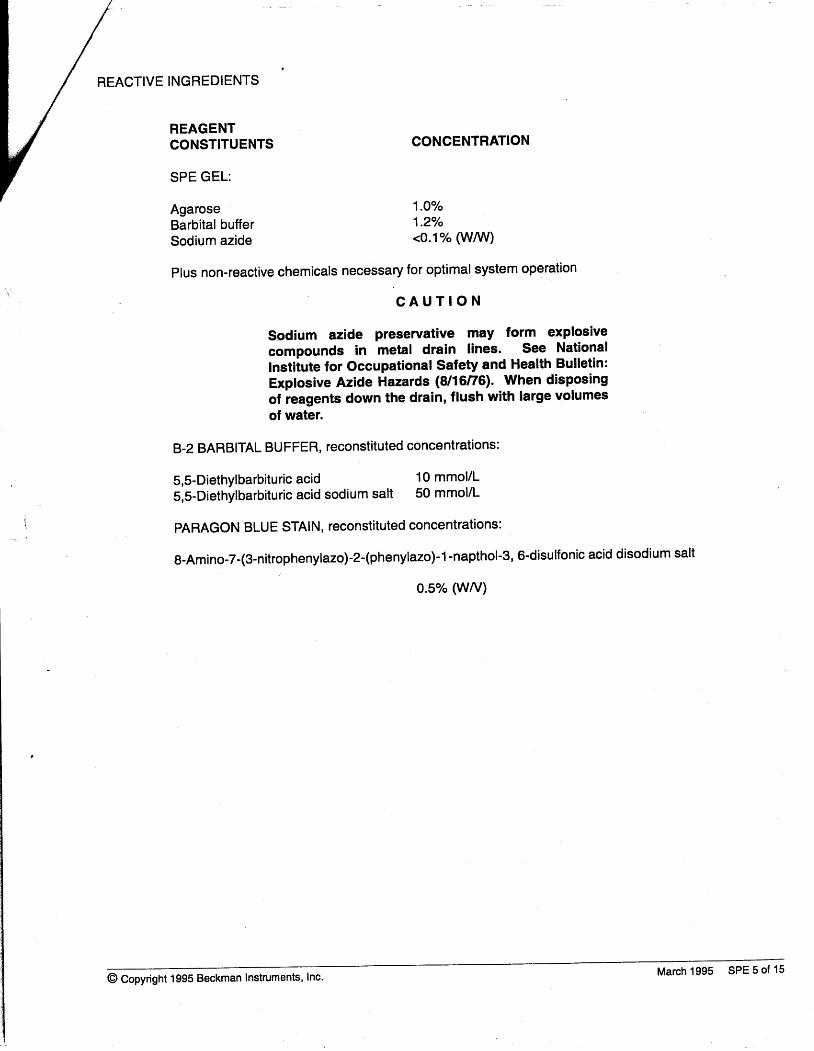
SPE GEL:
AgaroseBarbital bufferSodium azide
CONCENTRATION
1.Oo/o
1.2o/o
<O.1o/o (WAA/)
Plus non-reactive chemicals necessary for optimal system operation
CAUTION
sodium azide preservative may form explosivecompounds in metal drain lines. see Nationallnstiiute for Occupationat Safety and Health Bulletin:Explosive Azide Hazards (8/16176). When disposingof ieagents down the drain, flush with large volumesof water.
B-2 BARBITAL BUFFER, reconstituted concentrations:
S,S-Diethylbarbituric acid 10 mmol/LS,S-Diethylbarbituric acid sodium salt 50 mmol/L
PARAGON BLUE STAIN, reconstituted concentrations:
g-Amino-7-(3-nitrophenylazo)-2-(phenylazo)-1-napthol-3, 6-disulfonic acid disodium salt
o.5o/" (wA/)
@ Gopyright 1995 Beckman Instruments, lnc' March 1995 SPE 5 of 15
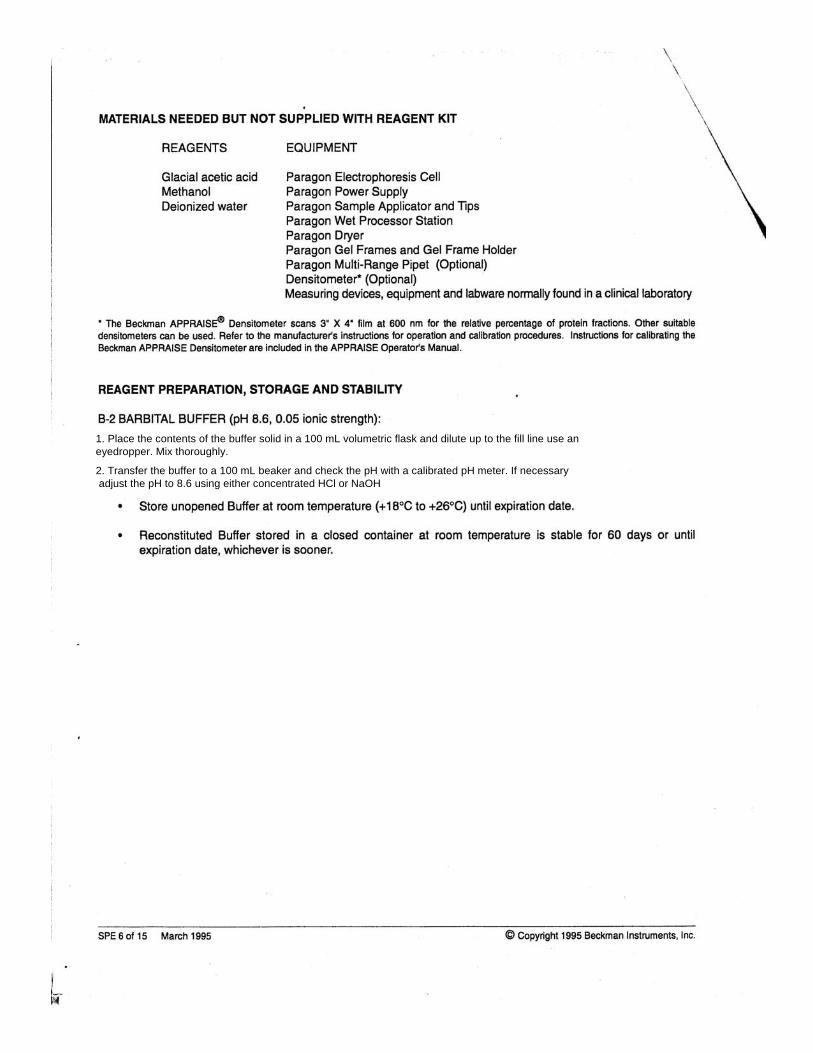
1. Place the contents of the buffer solid in a 100 mL volumetric flask and dilute up to the fill line use aneyedropper. Mix thoroughly.
2. Transfer the buffer to a 100 mL beaker and check the pH with a calibrated pH meter. If necessaryadjust the pH to 8.6 using either concentrated HCl or NaOH
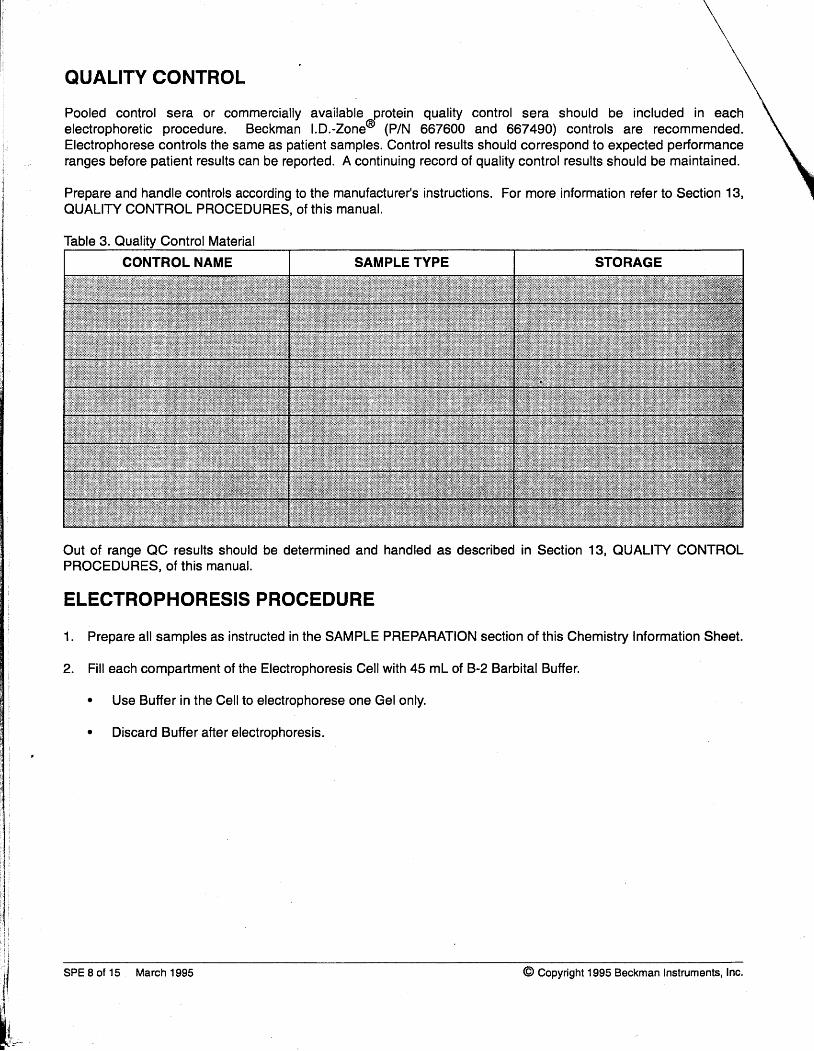
QUALITY CONTROL
Pooled control sera or commercially available -protein quality control sera should be included in eachelectrophoretic procedure. Beckman l.D.-ZonEw (P/N 667600 and 667490) controls are recommended.Electrophorese controls the same as patient samples. Control results should correspond to expected pertormanceranges before patient results can b6 reported. A conlinuing record of quallty conlrol results should be maintained.
Prepare and handle controls according to the manutacture/s inslructions. For more information refer to Section 13,QUALITY CONTROL PROCEDURES. ot this manual.
Out of range QC results should be determined and handled as described in Section 13, QUALITY CONTROLPROCEDURES, of this manual.
ELECTROPHORESIS PROCEDURE
Prepare all sampl€s as instructed in lhe SAMPLE PREPARATION section of this Chemistry Inlormation Sheet.
Fill each compartment of the El€ctrophoresis Cell with 45 mL of B-2 Barbital Buffer.
. Use Buffer in the Cell to electrophorese one Gel only.
. Discard Buffer after electroohoresis.
1 .
2.
i l l, i ;
J i
, j jJ I1 7
iI1 't,lru
SPE I of 15 March 1995 @ Copyright 1995 Beckman Instruments, Inc.
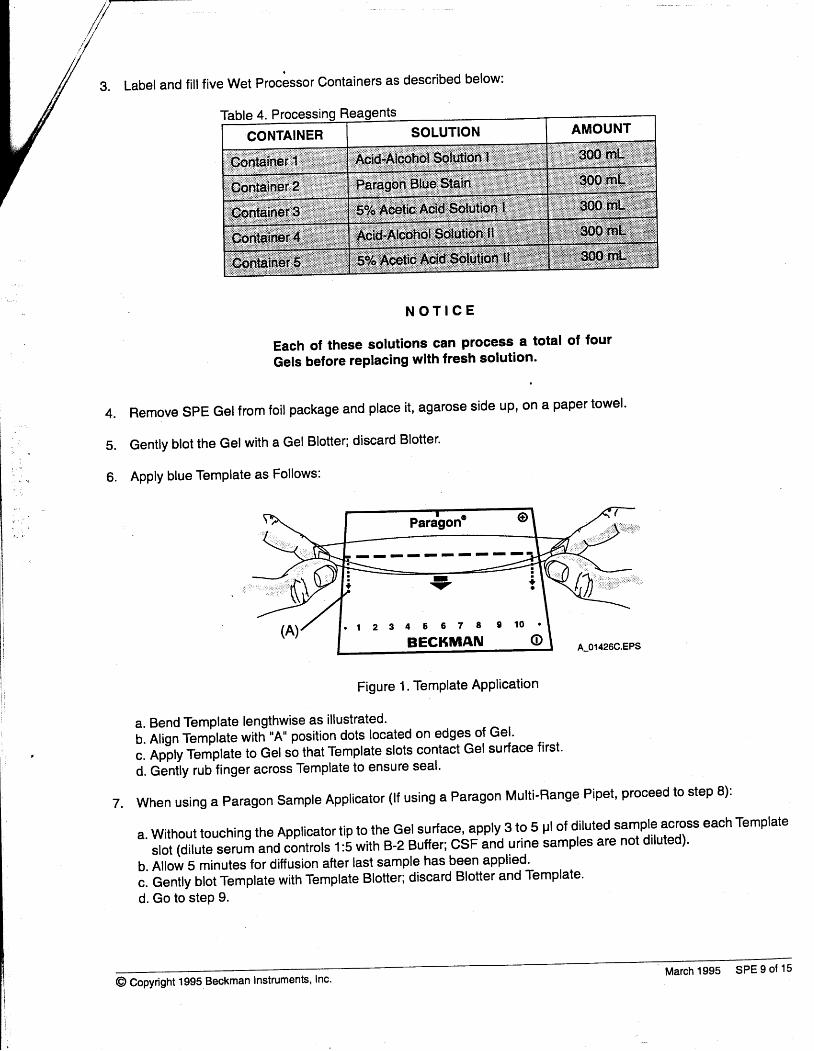
Table 4. Processing ReagenE
4.
Label and fill five Wet Processor Containers as described below:
N O T I C E
Each of these solutions can process a total of four
Gels before replacing with fresh solution'
Remove spE Gel from foil package and place it, agarose side uP, ff a paper towel'
Gently blot the Gel with a Gel Blotter; discard Blotter.
Apply blue TemPlate as Follows:
Figure 1. TemPlate ApPlication
a. Bend Template lengthwise as illustrated'[. nrign r"drd" witli"A" position dots located on edges of Gel'
". ap-prv i"ripr"t" to Gel so that Template slols contact Gel surface first'
d. Gently rub finger across Template to €nsure seal'
7, When using a Paragon Sample Applicator (ll using a Paragon Multi-Range Pipet' proceed to step 8):
a'withouttouchingtheApp|icatortiptotheGe|surface,app|y3to5p|o'di|utedsampleacrosseachTemp|ateslot (ditute serum
"no "ont-Ji. r,5 *ith B-2 Buffer; csF and urine samples are not diluted).
u. nrioin s minutes for diffusion after last sample has been applied'
". e"nttyUnt f"tplate with Template Blotter; discard Blotter and Template'
d. Go to step 9.
5.
6.
o 1 2 g 4 5 6 7 8 9 1 0 '
BECI{MAN O
@ Copyright 1995 Beckman lnstruments, lnc'March 1995 SPE 9 of 15
\\
\\
center of
iiji
i'lrl i
l iiit 1
iti
il: l
fl'
ilI*Ia{III{I
i lrltiHIJ
1 1 .
12.
8. When using a Paragon Multi-Range Pipet:
a. Without touching the pipet tip to the Gel surface, apply 0.5 pL of undiluted serum sample to theeach Template slot.
b. Allow 2 minutes for complete diffusion after last sample has been applied.c. Gently remove Template and discard. Blotting of Template is not required.
NOTICE
lf CSF or urine samples are to be run on the same Gelas undiluted serum samples, apply 3 to 5 pL of eachCSF or urine sample and 0.5 pL of each serumsample to the Template slots. Allow 5 minutes fordiffusion. Gently blot Template with Template Blotter.Discard Template and Blotter.
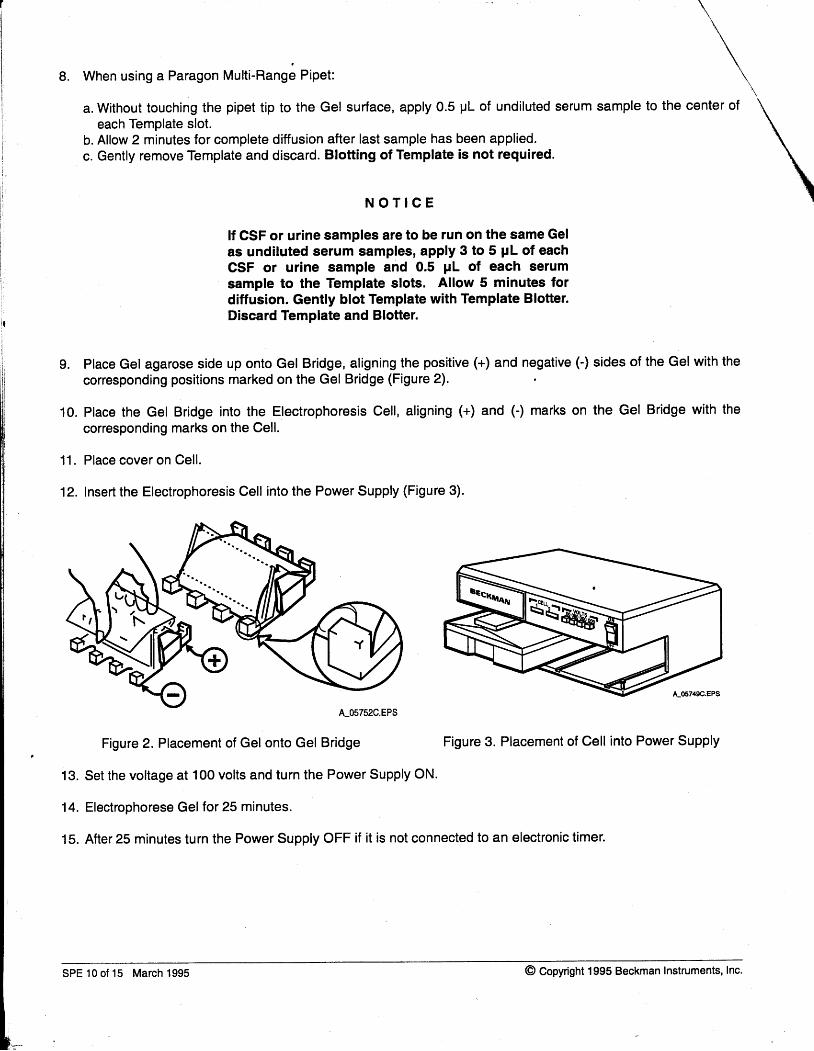
9. Place Gel agarose side up onto Gel Bridge, aligning the positive (+) and negative (-) sides of the Gel with thecorresponding positions markEd on the Gel Bridge (Figure 2)'
10. Place the Gel Bridge into the Electrophoresis Cell, aligning (+) and (-) marks on the Gel Bridge with theconesponding marks on the Cell,
Place cover on Cell.
Insert the Electrophoresis Cell into the Power Supply (Figure 3).
Figure 2. Placement of Gel onto Gel Bridge Figure 3. Placement of Cell into Power Supply
Set the voltage at 100 volts and turn the Power Supply ON.
Electrophorese Gel for 25 minutes.
After 25 minutes turn the Power Supply OFF if it is not connected to an electronic timer.
1 3 .
14 .
1 5 .
A_057s2C.EPS
SPE 10 of 15 March 1995 @ Copyright 1995 Beckman Instruments, Inc.
1 6 .
1 7 .
1 8 .
Remove Cell from Power Supply.
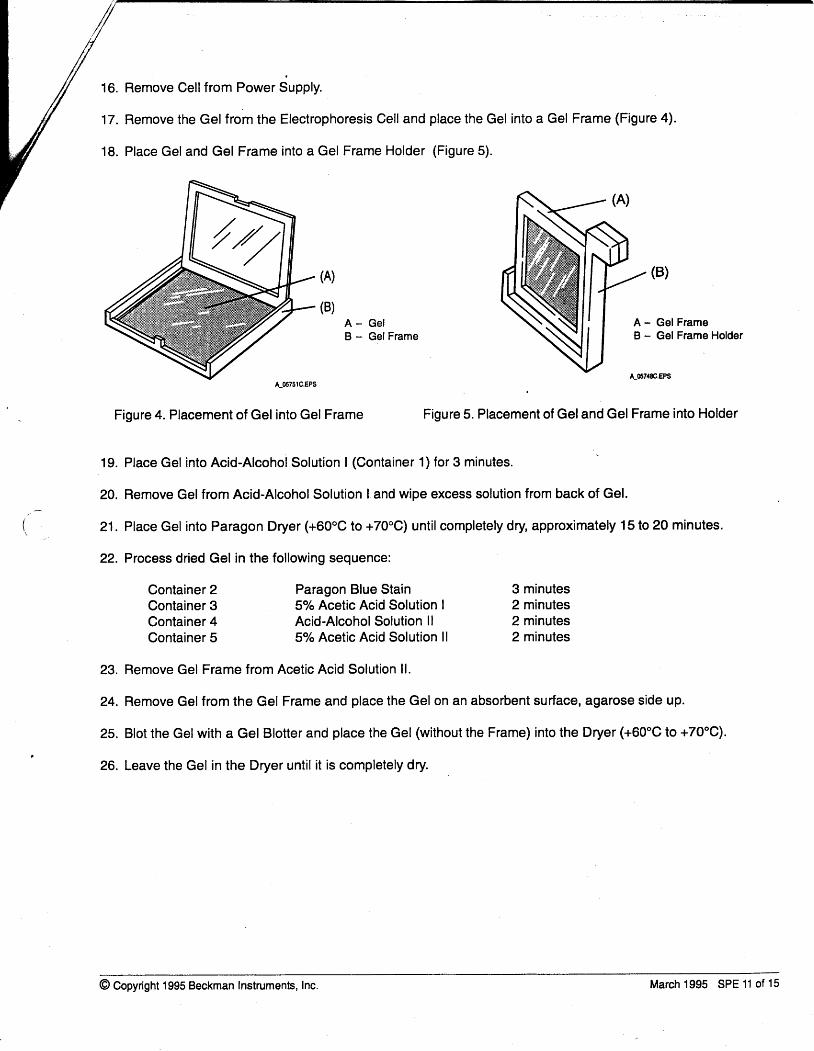
Remove the Gel from the Electrophoresis Cell and place the Gel into a Gel Frame (Figure 4).
Place Gel and Gel Frame into a Gel Frame Holder (Figure 5).
A - G e lB - Gel Frame
Figure 4. Placement of Gel into Gel Frame
A_057{8C.EFS
Figure 5. Placement of Gel and Gel Frame into Holder
19. Place Gel into Acid-Alcohol Solution | (Container 1) for 3 minutes.
20. Remove Gel from Acid-Alcohol Solution I and wipe excess solution from back of Gel.
21. Place Gel into Paragon Dryer (+60'C to +70oC) until completely dry approximately 15to 20 minutes.
22. Process dried Gel in the following sequence:
(A)
(B)
Container 2Container 3Container 4Container 5
Paragon Blue Stain5% Acetic Acid SolutionAcid-Alcohol Solution ll5% Acetic Acid Solution
3 minutes| 2 minutes
2 minutesll 2 minutes
23. Remove Gel Frame from Acetic Acid Solution ll.
24. Remove Gel from the Gel Frame and place the Gel on an absorbent surface, agarose side up.
25. Blot the Gel with a Gel Blotter and place the Gel (without the Frame) into the Dryer (+60"C to +70"C).
26. Leave the Gel in the Dryer until it is completely dry.
A_05rsrc.EPS
@ Copyright 1995 Beckman lnstruments, Inc. March 1995 SPE 11 of 15
2.
3.
ProcEdures lor reporting results to the appropriate personnel are found in Section 14, REPORTING RESULTS'this manual.
Additional reporting information as designated by this
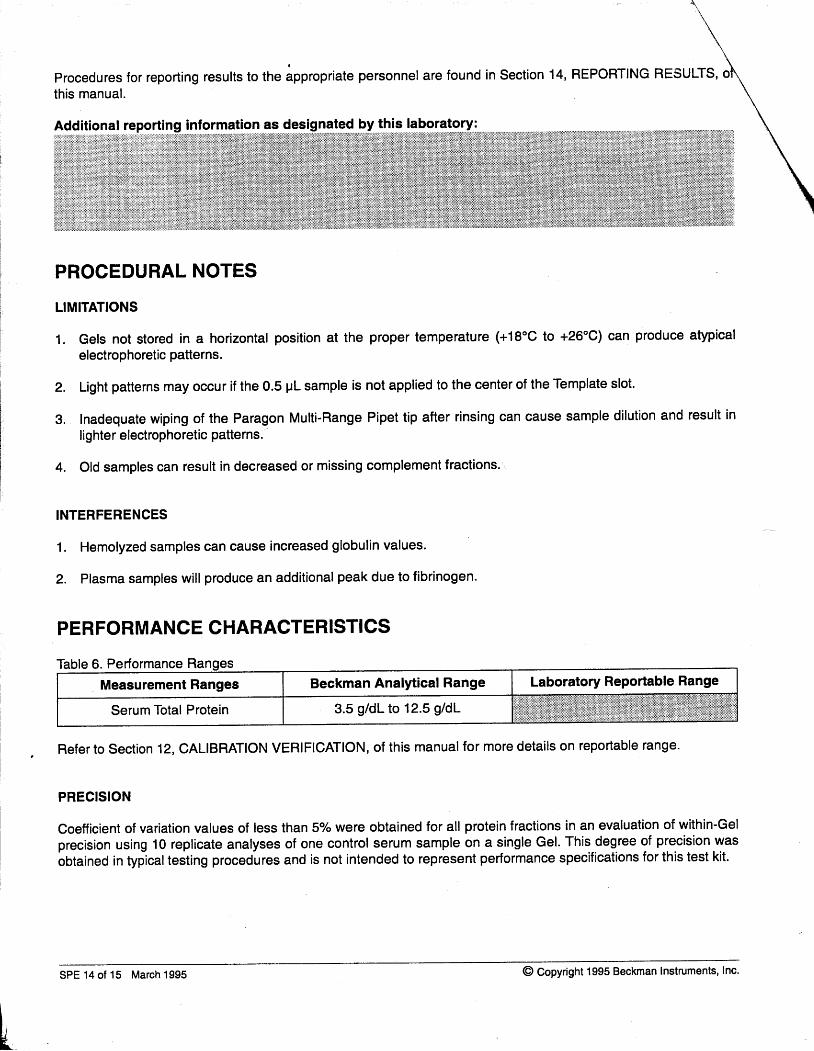
PROCEDURAL NOTES
LIMITATIONS
1. Gels not stored in a horizontal position atelectrophoretic patterns.
the proper temperature (+18'C to +26'C) can produce atypical
Light patterns may occur if the 0.5 pL sample is not applied to the center of the Template slot.
lnadequate wiping of the Paragon Multi-Range Pipet tip after rinsing can cause sample dilution and result inlighter electrophoretic patterns.
4. Old samples can result in decreased or missing complement fractions.
INTERFERENCES
1. Hemolyzed samples can cause increased globulin values.
Z. Plasma samples will produce an additional peak due to fibrinogen.
PERFORMANCE CHARACTERISTICS
Table 6. Performance Ranges
Refer to Section 12. CALIBRATION VERIFICATION, of this manual for more delails on reportable range.
PRECISION
Coetlicient of variation values of less than 57o w€re obtained tor all protgin fractions in an €valuation of within-Gelprecision using 10 replicate analyses of one control serum sample on a single Gel. This-deg.ree of precision wasobtained in typical testing procedures and is not intended to represent performance specifications for this test kit.
t
Measurement Ranges Beckman Analytical Range Laboratory Reportable Range
Serum Total Protein 3.5 g/dl to 12.5 g/dl ui iltiiffi+r$iffir+Hffi
SPE 14 of 15 March 1995 @ Copyright 1995 Beckman lnstruments, lnc.
ADDITIONAL IN FORMATION
Further information can be obtained by contacting Beckman Instruments, Inc., Brea, CA 92621-6249.
BIBLIOGRAPHY,]
'1. Burtis, C.A. and E.R. Ashwood, eds.,'specimen Collection and Processing; Sources of Biological Variation,"T,etz Tertbook of Clinical Chemlstry. W. B. Saunders Co., Philadelphia (199a)' pp. 58-101.
2. Cawfey, L.P., Hecttophoresis and tmmurcatectrcphorcsis' Little, Brown and Co.' Boston (1969).
3. Henry J.8., ed., Clinioal Diagnosis and Management by bboatory Mefhods. W.B. Saunders Co., Philadelphia(1991), pp. 21s-224.
4. Jeppson, J.O., C.B Laurell and B. Franzen, CIin. Chem.25i629 (1979).
5. Johnson, A.M., Plasma Protain Assays in Clinical Diagnasb and Management Beckman Bulletin 6215.
6. Jollifi, C.R.,. Beckman Electrcphoresis lnformation 4i1 (1974
7. Kiffingsworth, L.M., S.K. Cooney, M.D. Tylia and C.E. Killingsworth, Diag. Med.23 (19801.
8. Kiffingsworth, L.M., CIin. Chen.28i1O93 11982).
9. Nationaf Committoe for Clinical Laboratory Standards, Procedures for the Hadling and Prccessing of BloodSpecirnens; Approved Auidelines. NCCLS Publication Hl8-A, Villanova, PA (1990).
10. National Committee for Clinical Laboratory Standards, How to Define, Detemine, and utilize 'Refercn'e
tnteNats in the Clinbat Laboratory; Proposed Guideline. NCCLS Publication C28-B Villanova, PA (1992)' '
@ Copyright 1995 Beckman lnstruments, lnc. March 1995 SPE 15 of 15

Post-lab questions
1) Is your patient sample within the reference range for all the globulin bands seen?
2) If your patient has an abnormal gel attempt to explain the abnormality based on the guidelines discussed in lecture.