Embed Size (px)
Citation preview

W

Manfred WickWulf PinggeraPaul Lehmann
Clinical Aspects and Laboratory –Iron Metabolism, Anemias
Concepts in the anemias of malignancies and renal and rheumatoid diseases
Sixth, revised and updated edition
With contributions byVolker Ehrhardt
Dr. Manfred WickInstitute of Clinical Chemistry, Klinikum Grosshadern,
University of Munich, Germany
Univ.-Prof. Dr. Wulf PinggeraMaria Taferl, Austria
Dr. Paul LehmannMainz, Germany
With contributions byDr. Volker Ehrhardt
Roche Diagnostics GmbH, Mannheim, Germany
Th is work is subject to copyright.All rights are reserved, whether the whole or part of the material is concerned,
specifi cally those of translation, reprinting, re-use of illustrations, broadcasting, repro-duction by photocopying machines or similar means, and storage in data banks.
© 1991, 1995, 1996, 2000, 2003, 2011 Springer-Verlag/WienPrinted in Austria
Th e use of registered names, trademarks, etc. in this publication does not imply, even in the absence of a specifi c statement, that such names are exempt from the relevant protec-
tive laws and regulations and therefore free for general use.
Product Liability: Th e publisher can give no guarantee for information about drug dosage and application thereof contained in this book. In every individual case, the
respective user must check its accuracy by consulting other pharmaceutical literature.
Typesetting: Th omson Press (India) Ltd., ChennaiPrinting: Holzhausen Druck GmbH, 1140 Wien, Austria
Printed on acid-free and chlorine free bleached paperSPIN 12791699
Library of Congress Control Number: 2010942019
With 57 Figures
ISBN 978-3-211-00695-5 5th edn. SpringerWienNewYorkISBN 978-3-7091-0086-8 SpingerWienNewYork
Foreword
Anemias are a worldwide problem. Severe anemia aff ects mainly older women and men. Th e WHO defi nes anemia as a hemoglobin concen-tration of less than 12 g/dL in women and less than 13 g/dL in men (World Health Organization. Nutritional Anemias. Technical Reports Series 1992; 503). According to these criteria, 10–20% of women and 6–30% of men above the age of 65 years are anemic. In this book, we place a new emphasis on the diagnosis and treatment of anemias of chronic disease (ACD) and renal anemias. Nevertheless, iron defi ciency remains globally the most important cause of anemia.
Th ere have been so many advances in the diagnosis and, in particu-lar, the therapy of the anemias in recent years that it appeared necessary to extend the spectrum of therapies and diagnostic methods described. Apart from renal and infl ammatory anemias, new insights regarding the role of transferrin receptor, the physiology of erythropoietin produc-tion, and the genetic defect as well as the pathogenesis of hemochroma-tosis demanded a major update of the book.
Th e authors are grateful to Annett Fahle and Ralf Röddiger of Roche Diagnostics GmbH for their committed cooperation and their support in the publication of this book.
November 2010 M. WickW. PinggeraP. Lehmann

Table of Contents
Introduction . . . . . . . . . . . . . . . . . . . . . . . . . . . . . . . . . . . . . . . . . . . . 1
Iron Metabolism . . . . . . . . . . . . . . . . . . . . . . . . . . . . . . . . . . . . . . . . 3 Absorption of Iron . . . . . . . . . . . . . . . . . . . . . . . . . . . . . . . . . . . . . . . . . . . . . . 3 Iron Transport in the Circulation . . . . . . . . . . . . . . . . . . . . . . . . . . . . . . . . . . . 5 Transferrin, Iron-Binding Capacity and Transferrin Saturation . . . . . . . . . . . 5 Iron Storage – Ferritins, Isoferritins. . . . . . . . . . . . . . . . . . . . . . . . . . . . . . . . . 8 Distribution of Iron in the Body . . . . . . . . . . . . . . . . . . . . . . . . . . . . . . . . . . . 11 Iron Requirement and Iron Balance . . . . . . . . . . . . . . . . . . . . . . . . . . . . . . . . 12 Transferrin Receptor. . . . . . . . . . . . . . . . . . . . . . . . . . . . . . . . . . . . . . . . . 12 Soluble Transferrin Receptor. . . . . . . . . . . . . . . . . . . . . . . . . . . . . . . . . . . 14 Hepcidin . . . . . . . . . . . . . . . . . . . . . . . . . . . . . . . . . . . . . . . . . . . . . . . . . . . . 15
Erythropoiesis. . . . . . . . . . . . . . . . . . . . . . . . . . . . . . . . . . . . . . . . . 17 Physiological Cell Maturation . . . . . . . . . . . . . . . . . . . . . . . . . . . . . . . . . . . . 17 Hemoglobin Synthesis . . . . . . . . . . . . . . . . . . . . . . . . . . . . . . . . . . . . . . . . . . 18 Erythropoietin . . . . . . . . . . . . . . . . . . . . . . . . . . . . . . . . . . . . . . . . . . . . . . 19 Erythrocyte Degradation . . . . . . . . . . . . . . . . . . . . . . . . . . . . . . . . . . . . . . . . 22 Phagocytosis of Old Erythrocytes . . . . . . . . . . . . . . . . . . . . . . . . . . . . . . . 22 Hemoglobin Degradation . . . . . . . . . . . . . . . . . . . . . . . . . . . . . . . . . . . . . . . . 22
Disturbances of Iron Metabolism/Disturbances of Erythropoiesis and Hemolysis . . . . . . . . . . . . . . . . . . . . . . . . . . . 24 Disturbances of Iron Balance. . . . . . . . . . . . . . . . . . . . . . . . . . . . . . . . . . . . . 24 Iron Deficiency . . . . . . . . . . . . . . . . . . . . . . . . . . . . . . . . . . . . . . . . . . . . . . . 25 Disturbances of Iron Distribution . . . . . . . . . . . . . . . . . . . . . . . . . . . . . . . . . . 27 Anemias of Malignancies and Anemias of Chronic Diseases. . . . . . . . . . . . 28 Differentiation between Shortage of Depot Iron
and Functional Iron Deficiency. . . . . . . . . . . . . . . . . . . . . . . . . . . . . . . . . . . . 31
FFund
amen
tals
Table of ContentsVIII
Disturbances of Iron Utilization . . . . . . . . . . . . . . . . . . . . . . . . . . . . . . . . . . . 32 Renal Anemias . . . . . . . . . . . . . . . . . . . . . . . . . . . . . . . . . . . . . . . . . . . . . 32 Pathophysiology of Erythropoietin Synthesis. . . . . . . . . . . . . . . . . . . . . . . 34 Iron Overload. . . . . . . . . . . . . . . . . . . . . . . . . . . . . . . . . . . . . . . . . . . . . . . . . 36 Primary Hemochromatosis . . . . . . . . . . . . . . . . . . . . . . . . . . . . . . . . . . . . 38 Other Hereditary States of Iron Overload . . . . . . . . . . . . . . . . . . . . . . . . . 39 Other Disturbances of Erythropoiesis. . . . . . . . . . . . . . . . . . . . . . . . . . . . . . . 40 Disturbances of Stem Cell Proliferation. . . . . . . . . . . . . . . . . . . . . . . . . . . 40 Vitamin B12 and Folic Acid Deficiency . . . . . . . . . . . . . . . . . . . . . . . . . . . . 41 Hemoglobinopathies . . . . . . . . . . . . . . . . . . . . . . . . . . . . . . . . . . . . . . . . . 43 Disturbances of Porphyrin Synthesis. . . . . . . . . . . . . . . . . . . . . . . . . . . . . 45 Pathologically Increased Hemolysis . . . . . . . . . . . . . . . . . . . . . . . . . . . . . . . . 46 Haptoglobin . . . . . . . . . . . . . . . . . . . . . . . . . . . . . . . . . . . . . . . . . . . . . . . 47 Features of Severe Hemolysis . . . . . . . . . . . . . . . . . . . . . . . . . . . . . . . . . . 47 Causes of Hemolysis (Corpuscular/Extracorpuscular). . . . . . . . . . . . . . . . . 48
Diagnosis of Disturbances of Iron Metabolism . . . . . . . . . . . . . . . . 50 Iron Balance . . . . . . . . . . . . . . . . . . . . . . . . . . . . . . . . . . . . . . . . . . . . . . . . . 50 Case History and Clinical Findings . . . . . . . . . . . . . . . . . . . . . . . . . . . . . . . . . 52 Ferritin, Transferrin, Transferrin Saturation, Soluble Transferrin
Receptor. . . . . . . . . . . . . . . . . . . . . . . . . . . . . . . . . . . . . . . . . . . . . . . . . . 52 Laboratory Diagnostics of Suspected Disturbances of Iron
Metabolism. . . . . . . . . . . . . . . . . . . . . . . . . . . . . . . . . . . . . . . . . . . . . . . . 61 Most Frequent Disturbances of Iron Metabolism and Erythropoiesis . . . . . 66 Hypochromic, Microcytic Anemias. . . . . . . . . . . . . . . . . . . . . . . . . . . . . . . . . 66
Iron Deficiency – Diagnosis and Therapy . . . . . . . . . . . . . . . . . . . . 68 Laboratory Diagnostics in Cases of Suspected Iron Deficiency. . . . . . . . . . . . 68 Clinical Pictures of Iron Deficiency . . . . . . . . . . . . . . . . . . . . . . . . . . . . . . 71 Oral Administration of Iron . . . . . . . . . . . . . . . . . . . . . . . . . . . . . . . . . . . . 74 Parenteral Administration of Iron . . . . . . . . . . . . . . . . . . . . . . . . . . . . . . . 76 Side-Effects and Hazards of Iron Parenteral Therapy. . . . . . . . . . . . . . . . . 78
Disturbances of Iron Distribution and Hypochromic Anemias . . . . . . 80 Iron and Cellular Immunity . . . . . . . . . . . . . . . . . . . . . . . . . . . . . . . . . . . . 82 Activation of the Immunological and Inflammatory Systems . . . . . . . . . . . 85 Therapy with Erythropoietin and i.v. Iron Administration . . . . . . . . . . . . . . 88
FFund
amen
tals
Cli
nica
l Asp
ects
Table of Contents IX
Anemias of Infection and MalignancyAnemias of Infection and Malignancy . . . . . . . . . . . . . . . . . . . . . . . . . . . . . . . . . . . . . . . . . . . . . . 9191 Biological Activity of Tumor Necrosis Factor. . . . . . . . . . . . . . . . . . . . . . . 92 Hemoglobin in Therapies with Cytostatic Drugs . . . . . . . . . . . . . . . . . . . . 93 Erythropoietin and Iron Replacement in Tumor Anemias . . . . . . . . . . . . . . 95 Anemias of Chronic Inflammatory ProcessesAnemias of Chronic Inflammatory Processes . . . . . . . . . . . . . . . . . . . . . . . . . . . . . . . . . . 101101 Anemias of Rheumatoid Arthritis. . . . . . . . . . . . . . . . . . . . . . . . . . . . . . . 102 Erythropoietin and Iron Therapy of Rheumatoid Arthritis . . . . . . . . . . . . . 104
Disturbances of Iron Utilization . . . . . . . . . . . . . . . . . . . . . . . . . . 106 Uremic Anemia . . . . . . . . . . . . . . . . . . . . . . . . . . . . . . . . . . . . . . . . . . . . . . 106 Therapy of Uremic Anemia . . . . . . . . . . . . . . . . . . . . . . . . . . . . . . . . . . . . . 108
Iron Overload . . . . . . . . . . . . . . . . . . . . . . . . . . . . . . . . . . . . . . . . 113 Primary Hematochromatosis . . . . . . . . . . . . . . . . . . . . . . . . . . . . . . . . . . . . 114 Secondary Hematochromatosis . . . . . . . . . . . . . . . . . . . . . . . . . . . . . . . . . . 116
Non-Iron-Induced Disturbances of Erythropoiesis . . . . . . . . . . . . . 117
Macrocytic, Hyperchromic AnemiaMacrocytic, Hyperchromic Anemia . . . . . . . . . . . . . . . . . . . . . . . . . . . . . . . . . . . . . . . . . . . . . . . . 118118 Folic Acid . . . . . . . . . . . . . . . . . . . . . . . . . . . . . . . . . . . . . . . . . . . . . . . . 120 Vitamin B12 . . . . . . . . . . . . . . . . . . . . . . . . . . . . . . . . . . . . . . . . . . . . . . . 123 Normochromic, Normocytic AnemiaNormochromic, Normocytic Anemia . . . . . . . . . . . . . . . . . . . . . . . . . . . . . . . . . . . . . . . . . . . . . . . . 126126 Extracorpuscular Hemolytic Anemia . . . . . . . . . . . . . . . . . . . . . . . . . . . . 128 Corpuscular Anemias . . . . . . . . . . . . . . . . . . . . . . . . . . . . . . . . . . . . . . . 129 Erythropoietin Therapy of Other Diseases . . . . . . . . . . . . . . . . . . . . . . . . 130
Methods of Determination . . . . . . . . . . . . . . . . . . . . . . . . . . . . . . 132
Serum/Plasma ParametersSerum/Plasma Parameters . . . . . . . . . . . . . . . . . . . . . . . . . . . . . . . . . . . . . . . . . . . . . . . . . . . . . . . . . . . . 132132 Iron. . . . . . . . . . . . . . . . . . . . . . . . . . . . . . . . . . . . . . . . . . . . . . . . . . . . . 133 Iron Saturation (Total Iron-Binding Capacity and Latent Iron-Binding Capacity). . . . . . . . . . . . . . . . . . . . . . . . . . . . . . . . . . . . . . . 135 Iron-Binding Proteins. . . . . . . . . . . . . . . . . . . . . . . . . . . . . . . . . . . . . . . . 135 Ferritin . . . . . . . . . . . . . . . . . . . . . . . . . . . . . . . . . . . . . . . . . . . . . . . . . . 137 Transferrin . . . . . . . . . . . . . . . . . . . . . . . . . . . . . . . . . . . . . . . . . . . . . . . 140 Transferrin Saturation . . . . . . . . . . . . . . . . . . . . . . . . . . . . . . . . . . . . . . 141 Soluble Transferrin Receptor. . . . . . . . . . . . . . . . . . . . . . . . . . . . . . . . . . 142 Haptoglobin . . . . . . . . . . . . . . . . . . . . . . . . . . . . . . . . . . . . . . . . . . . . . . 142
Cli
nica
l Asp
ects
Labo
rato
ry
Table of ContentsX
Ceruloplasmin . . . . . . . . . . . . . . . . . . . . . . . . . . . . . . . . . . . . . . . . . . . . . 144 Vitamin B12 . . . . . . . . . . . . . . . . . . . . . . . . . . . . . . . . . . . . . . . . . . . . . . . 145 Holotranscobalamin . . . . . . . . . . . . . . . . . . . . . . . . . . . . . . . . . . . . . . . . 146 Folic Acid . . . . . . . . . . . . . . . . . . . . . . . . . . . . . . . . . . . . . . . . . . . . . . . . 147 Homocysteine . . . . . . . . . . . . . . . . . . . . . . . . . . . . . . . . . . . . . . . . . . . . . 149 Erythropoietin . . . . . . . . . . . . . . . . . . . . . . . . . . . . . . . . . . . . . . . . . . . . . 150 Blood Count Blood Count . . . . . . . . . . . . . . . . . . . . . . . . . . . . . . . . . . . . . . . . . . . . . . . . . . . . . . . . . . . . . . . . . . . . . . . . . . . . . . . . 151151 Automated Cell Counting . . . . . . . . . . . . . . . . . . . . . . . . . . . . . . . . . . . . 153 Flow Cytometry . . . . . . . . . . . . . . . . . . . . . . . . . . . . . . . . . . . . . . . . . . . 153 Impedance-Based Cell Counters . . . . . . . . . . . . . . . . . . . . . . . . . . . . . . . 156 Hemoglobin. . . . . . . . . . . . . . . . . . . . . . . . . . . . . . . . . . . . . . . . . . . . . . . 158 Hematocrit . . . . . . . . . . . . . . . . . . . . . . . . . . . . . . . . . . . . . . . . . . . . . . . 159 Red Blood Cell Count . . . . . . . . . . . . . . . . . . . . . . . . . . . . . . . . . . . . . . . 161 Red Blood Cell Indices. . . . . . . . . . . . . . . . . . . . . . . . . . . . . . . . . . . . . . . 162 Reticulocyte Count . . . . . . . . . . . . . . . . . . . . . . . . . . . . . . . . . . . . . . . . . 165 Hemoglobin Content of Erythrocytes. . . . . . . . . . . . . . . . . . . . . . . . . . . . 170 Erythrocyte Ferritin. . . . . . . . . . . . . . . . . . . . . . . . . . . . . . . . . . . . . . . . . 170 Zinc Protoporphyrin . . . . . . . . . . . . . . . . . . . . . . . . . . . . . . . . . . . . . . . . 171 Tests for the Diagnosis of Chronic Inflammation Tests for the Diagnosis of Chronic Inflammation . . . . . . . . . . . . . . . . . . . . . . . . . . . . 171171 Erythrocyte Sedimentation Rate . . . . . . . . . . . . . . . . . . . . . . . . . . . . . . . 172 C-Reactive Protein . . . . . . . . . . . . . . . . . . . . . . . . . . . . . . . . . . . . . . . . . 172 Interleukin-6 . . . . . . . . . . . . . . . . . . . . . . . . . . . . . . . . . . . . . . . . . . . . . . 173 Interleukin-8 . . . . . . . . . . . . . . . . . . . . . . . . . . . . . . . . . . . . . . . . . . . . . . 174 Tumor Necrosis Factor-α . . . . . . . . . . . . . . . . . . . . . . . . . . . . . . . . . . . . 175
References . . . . . . . . . . . . . . . . . . . . . . . . . . . . . . . . . . . . . . . . . . . 176Further Reading . . . . . . . . . . . . . . . . . . . . . . . . . . . . . . . . . . . . . . . . . . . . . . . . 188Subject Index . . . . . . . . . . . . . . . . . . . . . . . . . . . . . . . . . . . . . . . . . 190
Labo
rato
ry
Introduction
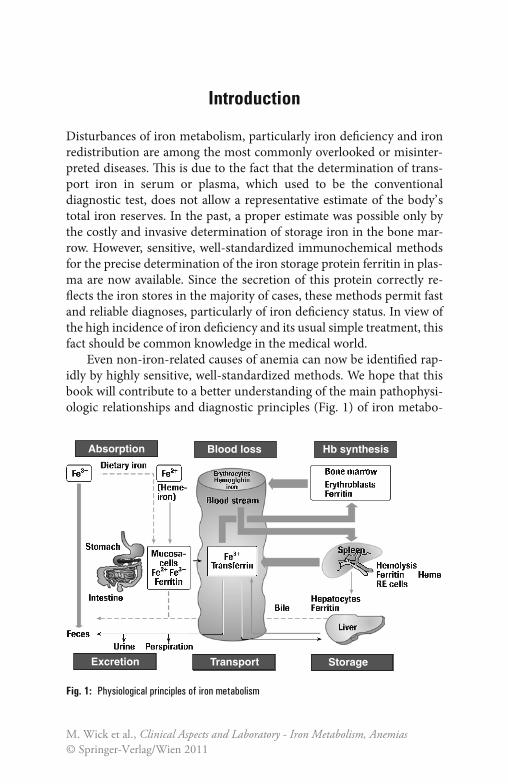
Disturbances of iron metabolism, particularly iron defi ciency and iron redistribution are among the most commonly overlooked or misinter-preted diseases. Th is is due to the fact that the determination of trans-port iron in serum or plasma, which used to be the conventional diagnostic test, does not allow a representative estimate of the body’ s total iron reserves. In the past, a proper estimate was possible only by the costly and invasive determination of storage iron in the bone mar-row. However, sensitive, well-standardized immunochemical methods for the precise determination of the iron storage protein ferritin in plas-ma are now available. Since the secretion of this protein correctly re-fl ects the iron stores in the majority of cases, these methods permit fast and reliable diagnoses, particularly of iron defi ciency status. In view of the high incidence of iron defi ciency and its usual simple treatment, this fact should be common knowledge in the medical world.
Even non-iron-related causes of anemia can now be identifi ed rap-idly by highly sensitive, well-standardized methods. We hope that this book will contribute to a better understanding of the main pathophysi-ologic relationships and diagnostic principles (Fig. 1) of iron metabo-
Absorption Blood loss Hb synthesis
Excretion Transport Storage
Fig. 1: Physiological principles of iron metabolism
M. Wick et al., Clinical Aspects and Laboratory - Iron Metabolism, Anemias© Springer-Verlag/Wien 2011

Introduction2
lism and anemias. However, the diagnosis of bone marrow diseases in the strict sense of the word, particularly if granulopoiesis or throm-bopoiesis is involved, should remain the responsibility of hematologi-cally experienced experts.
FFund
amen
tals
Iron Metabolism
Absorption of Iron
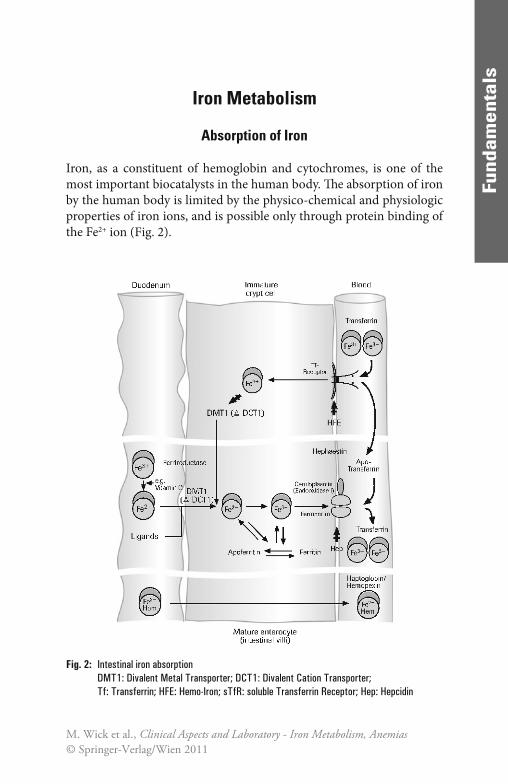
Iron, as a constituent of hemoglobin and cytochromes, is one of the most important biocatalysts in the human body. Th e absorption of iron by the human body is limited by the physico-chemical and physiologic properties of iron ions, and is possible only through protein binding of the Fe2+ ion (Fig. 2).
Fig. 2: Intestinal iron absorptionDMT1: Divalent Metal Transporter; DCT1: Divalent Cation Transporter; Tf: Transferrin; HFE: Hemo-Iron; sTfR: soluble Transferrin Receptor; Hep: Hepcidin
M. Wick et al., Clinical Aspects and Laboratory - Iron Metabolism, Anemias© Springer-Verlag/Wien 2011
Iron Metabolism4
Fund
amen
tals
Fund
amen
tals
Iron is absorbed as Fe2+ in the duodenum and in the upper jejunum. Since iron in food occurs predominantly in the trivalent form it must (apart from the heme-bound Fe2+ component) fi rst be reduced e.g. by ascorbic acid (vitamin C). Th is explains why only about 10% of the iron in food, corresponding to about 1 mg per day, is generally absorbed. Th is daily iron intake represents only about 0.25‰ of the body’ s average total iron pool, which is approximately 4 g; this means that it takes some time to build up adequate reserves of iron. Th e actual iron uptake fl uctuates considerably, depending on the absorption-inhibiting and absorption-promoting infl uences in the upper part of the small intestine. Th e follow-ing factors inhibit absorption in clinically healthy individuals: reduced production of gastric acid, a low level of divalent iron as a result of an unbalanced diet (e.g., in vegetarians), a low level of reducing substances (e.g., ascorbic acid) in the food, or complex formation due to high con-sumption of coff ee or tea. Conversely, absorption is promoted by a com-bination of a meat-rich diet with a plentiful supply of heme-bound iron and an acidic, reducing environment due to a high consumption of fruit and vegetables. Dietary iron is mostly present either as Fe3+ or as heme. Whereas the absorption of heme is less completely characterized by the mechanism of Fe3+ absorption has become clearer. It is assumed that it proceeds in two stages. At fi rst, Fe3+ is reduced by ferric reductase (duo-denal cytochrome b) to Fe2+ which is then transported across the cell membrane by a ferrous iron transporter (divalent metal transporter 1, DMT1 or DCT1). In the cells, Fe2+ is stored bound to ferritin. Before export into the blood plasma by ferroportin, Fe2+ is oxidized to Fe3+ by an endooxidase (ceruloplasmin in macrophages, hephaestin in enterocytes). In the plasma, Fe3+ is bound to transferrin [62].
Th e transport protein for iron, DTC1, is mainly localized in the duodenum within the enterocytic membrane and increases in con-centration during alimentary iron defi ciency. DTC1 is also expressed in the kidneys, liver, brain, and heart [62].
Within certain limits, the absorption of iron can be adjusted to meet the organism’ s iron requirement. Iron defi ciency, anemia, and hypoxia lead via increased transferrin and DCT1 synthesis to an increase in the absorption and transport capacity.
Two models were postulated for the regulation of iron absorption. In the so-called “crypt programming” model, immature crypt cells serve as iron sensors by uptake of Fe3+ bound to transferrin via the basolateral
Iron Metabolism 5
FFund
amen
tals
membrane with the aid of the transferrin receptor. Essential for the normal function of the transferrin receptor is a protein encoded by the HFE gene. Th e amount of iron taken up by the immature enterocytes regulates the expression of the iron transporters described above. In case of iron defi -ciency, more transporters are exprimed; in case of iron overload, the ex-pression of iron transporters is decreased. Consequently, aft er translocation of the matured enterocytes to the villi, iron absorption depends on the number of iron transporters exprimed in the immature cells.
In the second model, the “iron hormone” hepcidin plays a central role in the regulation of iron recycling and iron balance. Hepcidin is a peptide sythesized by the liver. It inhibits iron uptake in the duodenum and the release of iron from intracellular storage pools. It is assumed that the inhi-bition of hepcidin is caused by binding to and inducing the degradation of ferroportin, the sole iron exporter in iron-transporting cells. Th e expres-sion of hepcidin is regulated in response to anemia and hypoxia, and iron load. When oxygen delivery is inadequate, the hepcidin levels decrease and more iron is absorbed in the duodenum, and made available from intracellular iron stores. Th e opposite occurs with iron load. For the nor-mal regulation of hepcidin levels, the intact HFE gene is required [10].
Iron Transport in the Circulation
Iron is normally transported via the specifi c binding of Fe3+ by transferrin in blood plasma [42]. Th e Fe3+-transferrin complex in turn is bound by transferrin receptors to cells of the target organs which allow specifi c iron uptake according to the individual needs of the various cells. Pronounced non-specifi c binding to other transport proteins, such as albumin, occurs in conditions of iron overload with high levels of transferrin saturation.
When there is an excess supply of heme-bound iron, part of the Fe2+-heme complex may escape oxidation in the cells of the mucosa and be transported to the liver aft er being bound by haptoglobin or hemopexin.
Transferrin, Iron-Binding Capacity, and Transferrin Saturation
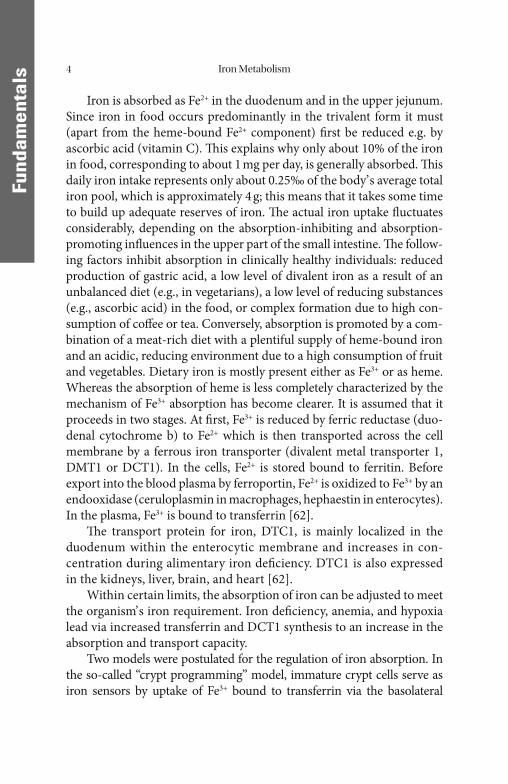
Transferrin (Fig. 3) is the most important and specifi c iron transport protein in the circulation. It is synthesized in the liver, and has a half-life
Iron Metabolism6
FFund
amen
tals
of 8–12 days in the blood. Transferrin is a glycoprotein with a molecular weight of 79.6 kD, and β1 electrophoretic mobility. Its synthesis in the liver may be increased as a corrective measure, depending on iron re-quirements and iron reserves. At present little is known about the de-tails of the regulatory mechanisms involved. Transferrin is detectable not only in blood plasma, but also in many interstitial fl uids, and a lo-cally synthesized variant with a low neuraminic acid content (β2- or τ-transferrin) is found in the cerebrospinal fl uid. Th e functional and im-munologic properties of the many isoforms are substantially the same, the only important diff erence being the isoelectric point [42]. Th ese forms are therefore of no practical interest with regard either to analyti-cal technique or to the assessment of the iron metabolism (except CDT: diagnosis of alcoholism and β2-transferrin: CSF diagnostics). Each transferrin molecule can bind a maximum of 2 Fe3+ ions, corresponding to about 1.41 μg of iron per mg of transferrin.
By measurements of iron and transferrin concentrations, the total specifi c iron-binding capacity in plasma can be determined. Owing to its practicability, its low susceptibility to interference, and its high spec-ifi city, this method should be used to determine the iron transport by
Fig. 3: Transferrin crystals [64]
Iron Metabolism 7
FFund
amen
tals
transferrin. It has made the determination of the iron saturation = total iron-binding capacity (TIBC) and of the latent iron-binding capacity (LIBC) largely redundant.
Under physiologic conditions, transferrin is present in concentra-tions which exceed the iron-binding capacity normally necessary. Th e fraction of transferrin-binding sites that are not occupied by iron is known as the latent iron-binding capacity (LIBC). It is calculated from the diff erence between the total iron-binding capacity and the serum iron concentration.
Th is procedure has been replaced by the determination of the percentage saturation of transferrin (TfS), which does not include non-specifi c binding of iron by other proteins, so that only the physio-logically active iron binding is measured. Fluctuations of the transfer-rin concentration that are not due to the regulatory variations of the iron metabolism can also be eliminated from the assessment in this manner.
Approximately one third of the total iron-binding capacity is nor-mally saturated with iron. Whereas the transferrin concentration re-mains constant in the range from 2.0 to 4.0 g/L, without any appreciable short-term fl uctuations, the transferrin saturation changes quickly with the iron concentration depending on the time of day, the current iron requirement, and the intake of dietary iron. Th e total quantity of trans-ferrin-bound iron in the blood plasma of a healthy adult is only about 4 mg, i.e. only 1‰ of the body’ s total iron pool of about 4 g.
It is clear from the very low plasma iron concentration and its short-term fl uctuations that neither the plasma iron concentration nor the transferrin saturation can provide a true picture of the body’ s total iron reserves. Assessment of the body’ s iron reserves is only possible by de-termination of the storage protein ferritin.
Th e plasma iron concentration and the transferrin saturation only be-come relevant in the second stage of diagnosis for diff erentiation of condi-tions with high plasma ferritin concentrations (see “Disturbances of Iron Distribution and Iron Overload”). Th e determination of the transferrin saturation is preferable to the determination of iron alone, since this elim-inates the eff ects of diff erent blood sampling techniques, diff erent states of hydration of the patient, and diff erent transferrin concentrations. Addi-tionally, the determination of the soluble transferrin receptor (sTfR) has gained importance.
Iron Metabolism8
FFund
amen
tals
Iron Storage – Ferritins, Isoferritins
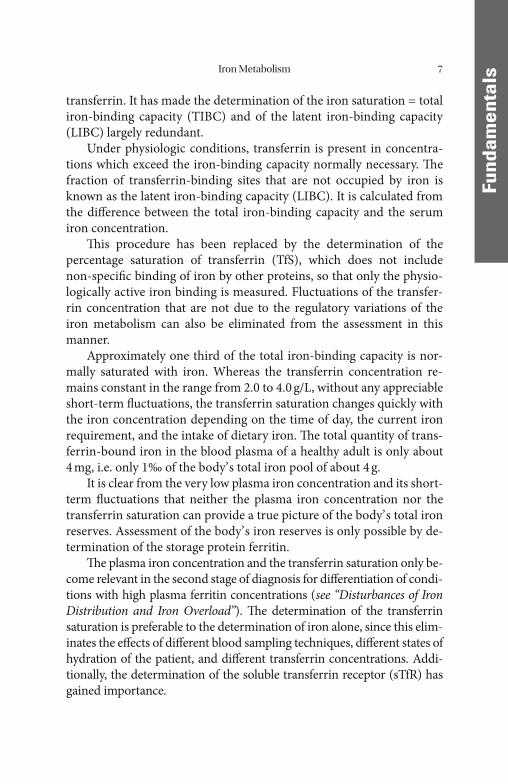
Because of the very limited iron absorption capacity, the average iron requirement can be met only by extremely economical recycling of ac-tive iron. Iron is stored in the form of ferritin or its semi-crystalline condensation product hemosiderin in the liver, spleen, and bone mar-row. In principle, every cell has the ability to store an excess of iron through ferritin synthesis. Th e fundamental mechanisms are identical for all types of cells (Fig. 4).
Iron directly induces the synthesis of apoferritin, the iron-free pro-tein shell of ferritin, on the cytoplasmic ribosomes. In the majority of metabolic situations, a representative fraction of the ferritin synthe-sized is released into the blood plasma. Th e ferritin concentration correctly refl ects the amount of storage iron available (exception: dis-turbances of iron distribution). Th is has been verifi ed experimentally by comparison with iron determinations in bone-marrow aspirates and by monitoring serum ferritin aft er serial blood donations. In clinical diagnosis, ferritin should be determined as the parameter of fi rst choice for the assessment of iron reserves, e.g. in the identifi cation of the cause of an anemia.
Fig. 4: Scheme of cellular iron storage and ferritin synthesis
Iron Metabolism 9
FFund
amen
tals
Th e relationship between iron reserves and serum ferritin is valid for all stages of iron defi ciency, the normal state, and almost all forms of iron overload. Th e rule of thumb is:
1 ng/mL (μg/L) of serum ferritin corresponds to approximately 10 mg of stored iron.
Th is can be used not only to estimate the amount of iron required to replenish stores during iron defi ciency but also to estimate iron excess in the case of iron overload as well as for the monitoring of the course of these disorders.
In addition to the general mechanisms of cellular iron storage and uptake, the liver and the spleen also have specialized metabolic path-ways. Hepatocytes, for example, can convert haptoglobin-bound or hemopexin-bound hemoglobin-Fe2+ or heme-Fe2+ from intravascular hemolysis or from increased heme absorption into ferritin-Fe3+ storage iron. On the other hand, the regular lysis of senescent erythrocytes and the associated conversion of Fe2+-hemoglobin into Fe3+-ferritin storage iron take place mainly in the reticuloendothelial cells of the spleen. Th e decisive role in the intracellular oxidation of Fe2+ into Fe3+ is played by ceruloplasmin.
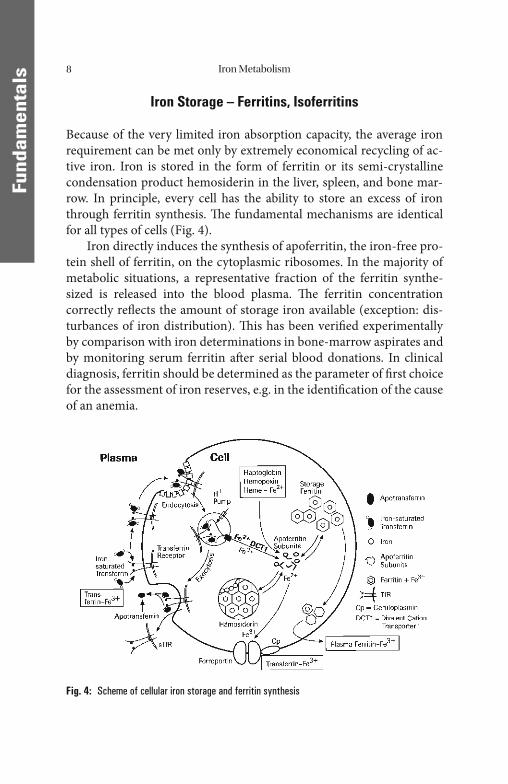
Ferritin has a molecular weight of at least 440 kD (depending on the iron content), and consists of a protein shell (apoferritin) of 24 subunits and an iron core containing an average of about 2500 Fe3+ ions (in liver and spleen ferritin; Fig. 5). Ferritin tends to form stable oligomers (approx. 10–15%), and when present in excess in the cells of the storage organs it tends to condense, with formation of semi-crystalline hemosid-erin in the lysosomes.
Fig. 5: Structure of the ferritin molecule
Iron Metabolism10
FFund
amen
tals
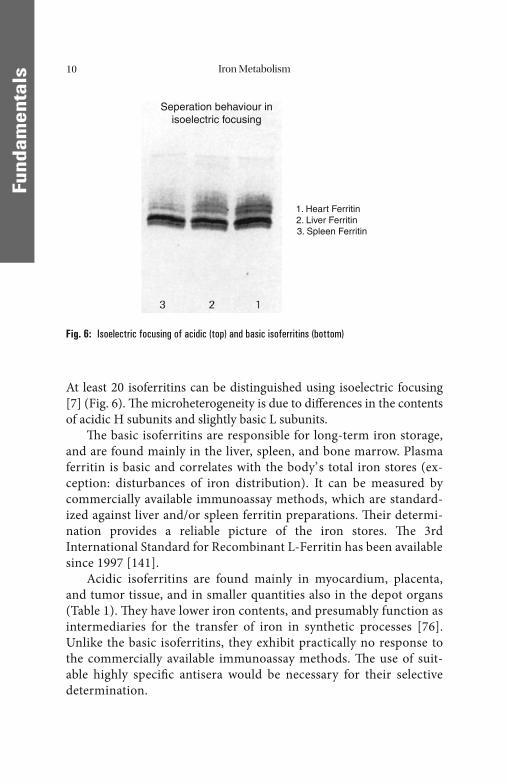
At least 20 isoferritins can be distinguished using isoelectric focusing [7] (Fig. 6). Th e microheterogeneity is due to diff erences in the contents of acidic H subunits and slightly basic L subunits.
Th e basic isoferritins are responsible for long-term iron storage, and are found mainly in the liver, spleen, and bone marrow. Plasma ferritin is basic and correlates with the body’ s total iron stores (ex-ception: disturbances of iron distribution). It can be measured by commercially available immunoassay methods, which are standard-ized against liver and/or spleen ferritin preparations. Th eir determi-nation provides a reliable picture of the iron stores. Th e 3rd International Standard for Recombinant L-Ferritin has been available since 1997 [141].
Acidic isoferritins are found mainly in myocardium, placenta, and tumor tissue, and in smaller quantities also in the depot organs (Table 1). Th ey have lower iron contents, and presumably function as intermediaries for the transfer of iron in synthetic processes [76]. Unlike the basic isoferritins, they exhibit practically no response to the commercially available immunoassay methods. Th e use of suit-able highly specifi c antisera would be necessary for their selective determination.
Fig. 6: Isoelectric focusing of acidic (top) and basic isoferritins (bottom)
Seperation behaviour inisoelectric focusing
1. Heart Ferritin2. Liver Ferritin
3. Spleen Ferritin
Iron Metabolism 11
FFund
amen
tals
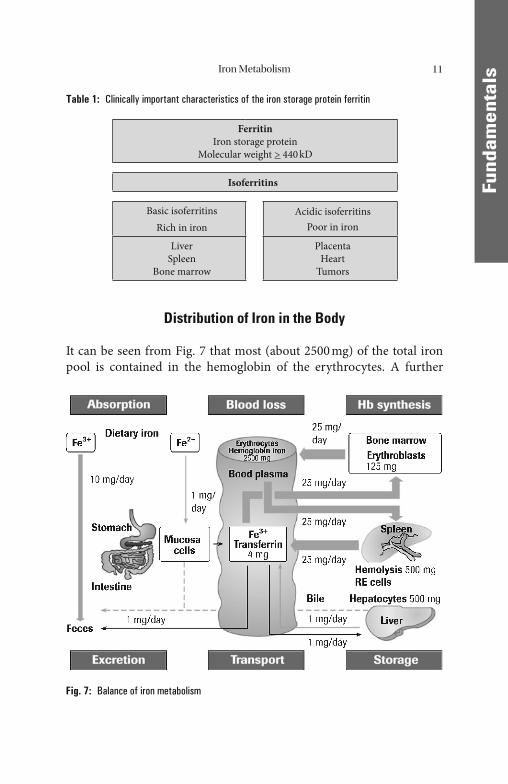
Table 1: Clinically important characteristics of the iron storage protein ferritin
FerritinIron storage protein
Molecular weight > 440 kD
Isoferritins
Basic isoferritinsRich in iron
Acidic isoferritinsPoor in iron
LiverSpleen
Bone marrow
PlacentaHeart
Tumors
Distribution of Iron in the Body
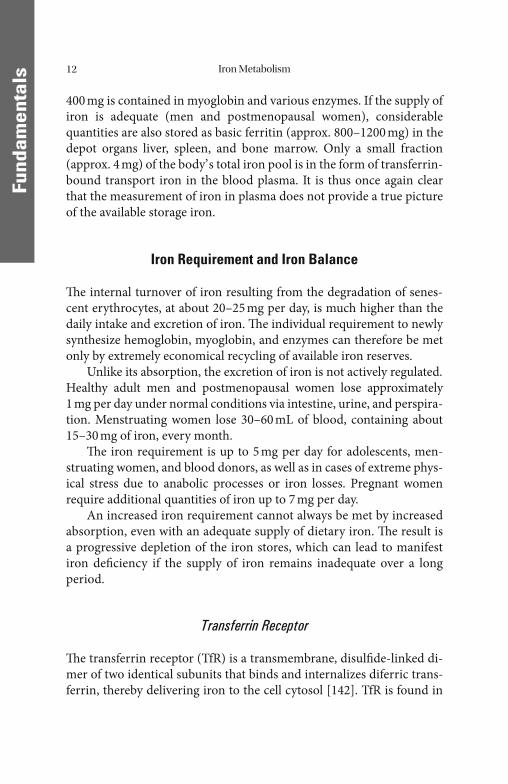
It can be seen from Fig. 7 that most (about 2500 mg) of the total iron pool is contained in the hemoglobin of the erythrocytes. A further
Fig. 7: Balance of iron metabolism
Iron Metabolism12
FFund
amen
tals
400 mg is contained in myoglobin and various enzymes. If the supply of iron is adequate (men and postmenopausal women), considerable quantities are also stored as basic ferritin (approx. 800–1200 mg) in the depot organs liver, spleen, and bone marrow. Only a small fraction (approx. 4 mg) of the body’ s total iron pool is in the form of transferrin-bound transport iron in the blood plasma. It is thus once again clear that the measurement of iron in plasma does not provide a true picture of the available storage iron.
Iron Requirement and Iron Balance
Th e internal turnover of iron resulting from the degradation of senes-cent erythrocytes, at about 20–25 mg per day, is much higher than the daily intake and excretion of iron. Th e individual requirement to newly synthesize hemoglobin, myoglobin, and enzymes can therefore be met only by extremely economical recycling of available iron reserves.
Unlike its absorption, the excretion of iron is not actively regulated. Healthy adult men and postmenopausal women lose approximately 1 mg per day under normal conditions via intestine, urine, and perspira-tion. Menstruating women lose 30–60 mL of blood, containing about 15–30 mg of iron, every month.
Th e iron requirement is up to 5 mg per day for adolescents, men-struating women, and blood donors, as well as in cases of extreme phys-ical stress due to anabolic processes or iron losses. Pregnant women require additional quantities of iron up to 7 mg per day.
An increased iron requirement cannot always be met by increased absorption, even with an adequate supply of dietary iron. Th e result is a progressive depletion of the iron stores, which can lead to manifest iron defi ciency if the supply of iron remains inadequate over a long period.
Transferrin Receptor
Th e transferrin receptor (TfR) is a transmembrane, disulfi de-linked di-mer of two identical subunits that binds and internalizes diferric trans-ferrin, thereby delivering iron to the cell cytosol [142]. TfR is found in
Iron Metabolism 13
FFund
amen
tals
the cytoplasmic membrane of all cells, with the exception of mature erythrocytes. Its molecular weight is about 190 kD. Since the major use of iron is for hemoglobin synthesis, about 80% of total TfR is on eryth-roid progenitor cells, which have a 10–100-fold higher TfR content than other TfR-containing cells. Th e membrane-bound receptor on the pre-cursor cells of erythropoiesis is also called the CD71 antigen. Th e only clearly defi ned function of the transferrin receptor is to mediate cellular uptake of iron from a plasma glycoprotein, transferrin.
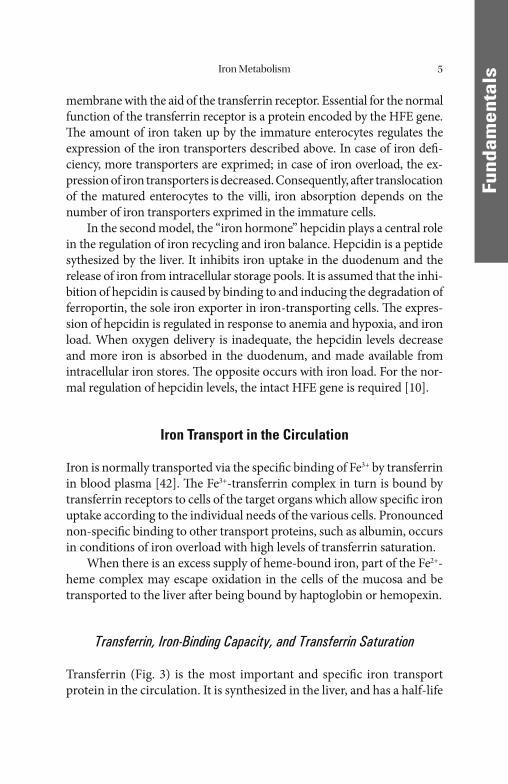
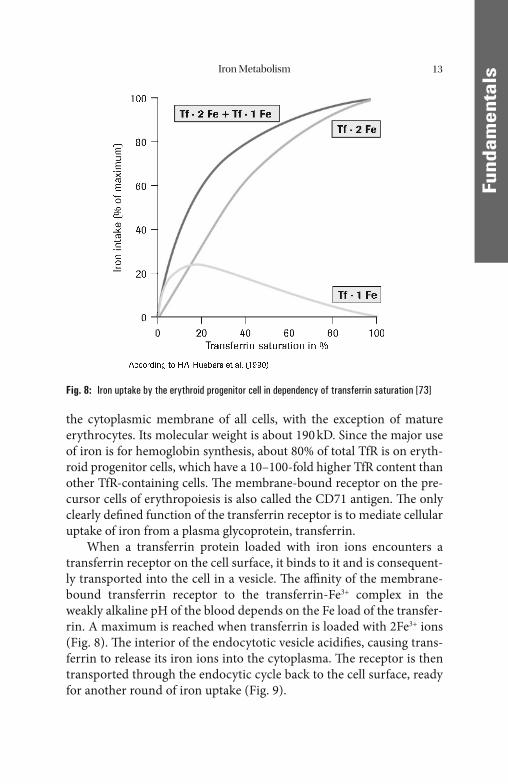
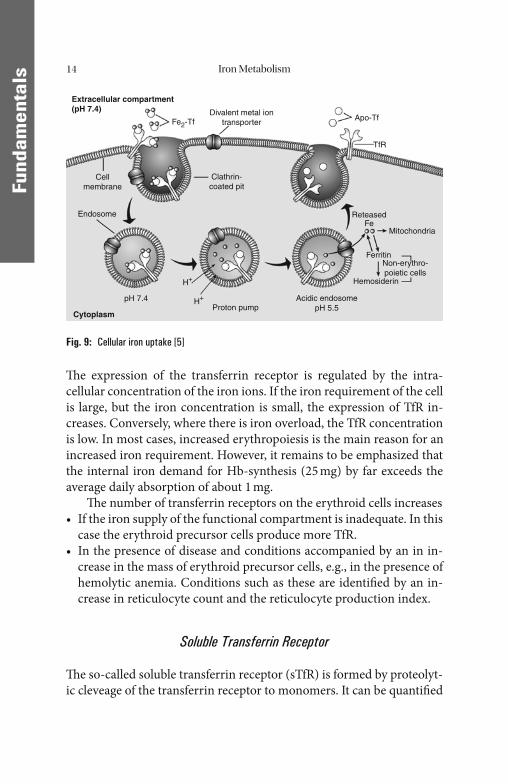
When a transferrin protein loaded with iron ions encounters a transferrin receptor on the cell surface, it binds to it and is consequent-ly transported into the cell in a vesicle. Th e affi nity of the membrane-bound transferrin receptor to the transferrin-Fe3+ complex in the weakly alkaline pH of the blood depends on the Fe load of the transfer-rin. A maximum is reached when transferrin is loaded with 2Fe3+ ions (Fig. 8). Th e interior of the endocytotic vesicle acidifi es, causing trans-ferrin to release its iron ions into the cytoplasma. Th e receptor is then transported through the endocytic cycle back to the cell surface, ready for another round of iron uptake (Fig. 9).
Fig. 8: Iron uptake by the erythroid progenitor cell in dependency of transferrin saturation [73]
Iron Metabolism14
FFund
amen
tals
Th e expression of the transferrin receptor is regulated by the intra-cellular concentration of the iron ions. If the iron requirement of the cell is large, but the iron concentration is small, the expression of TfR in-creases. Conversely, where there is iron overload, the TfR concentration is low. In most cases, increased erythropoiesis is the main reason for an increased iron requirement. However, it remains to be emphasized that the internal iron demand for Hb-synthesis (25 mg) by far exceeds the average daily absorption of about 1 mg.
Th e number of transferrin receptors on the erythroid cells increases• If the iron supply of the functional compartment is inadequate. In this
case the erythroid precursor cells produce more TfR.• In the presence of disease and conditions accompanied by an in in-
crease in the mass of erythroid precursor cells, e.g., in the presence of hemolytic anemia. Conditions such as these are identifi ed by an in-crease in reticulocyte count and the reticulocyte production index.
Soluble Transferrin Receptor
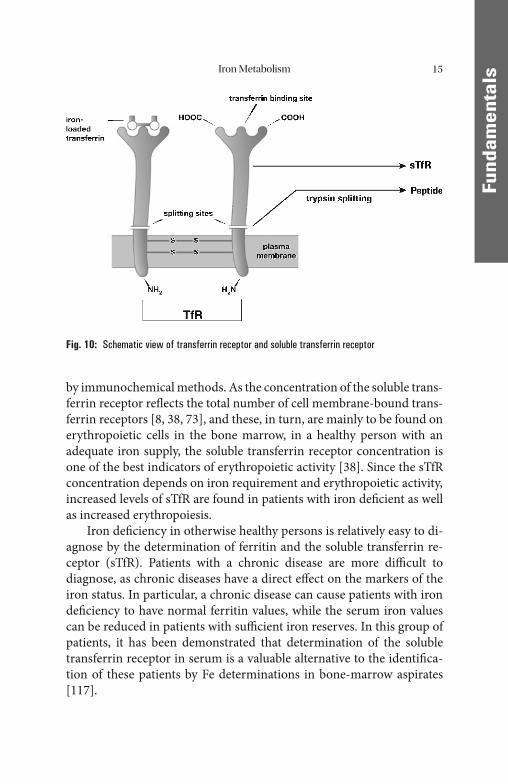
Th e so-called soluble transferrin receptor (sTfR) is formed by proteolyt-ic cleveage of the transferrin receptor to monomers. It can be quantifi ed
Extracellular compartment(pH 7.4)
Cytoplasm
Divalent metal iontransporterFe2-Tf Apo-Tf
TfR
Clathrin-coated pit
Cellmembrane
Endosome
Proton pumpAcidic endosome
pH 5.5
ReteasedFe
Mitochondria
FerritinNon-erythro-poietic cells
HemosiderinH+
H+pH 7.4
Fig. 9: Cellular iron uptake [5]
Iron Metabolism 15
FFund
amen
tals
by immunochemical methods. As the concentration of the soluble trans-ferrin receptor refl ects the total number of cell membrane-bound trans-ferrin receptors [8, 38, 73], and these, in turn, are mainly to be found on erythropoietic cells in the bone marrow, in a healthy person with an adequate iron supply, the soluble transferrin receptor concentration is one of the best indicators of erythropoietic activity [38]. Since the sTfR concentration depends on iron requirement and erythropoietic activity, increased levels of sTfR are found in patients with iron defi cient as well as increased erythropoiesis.
Iron defi ciency in otherwise healthy persons is relatively easy to di-agnose by the determination of ferritin and the soluble transferrin re-ceptor (sTfR). Patients with a chronic disease are more diffi cult to diagnose, as chronic diseases have a direct eff ect on the markers of the iron status. In particular, a chronic disease can cause patients with iron defi ciency to have normal ferritin values, while the serum iron values can be reduced in patients with suffi cient iron reserves. In this group of patients, it has been demonstrated that determination of the soluble transferrin receptor in serum is a valuable alternative to the identifi ca-tion of these patients by Fe determinations in bone-marrow aspirates [117].
Fig. 10: Schematic view of transferrin receptor and soluble transferrin receptor
Iron Metabolism16
FFund
amen
tals
Hepcidin
Human hepcidin is a 25-amino acid peptide fi rst identifi ed in human urine. Th e main site of synthesis is the liver. Th e specifi c role of hepci-din was studied by assessing the eff ects of its defi ciency or excess in transgenic mice. Th e results of these studies suggest that hepcidin con-trols extracellular iron by acting as a negative regulator of iron trans-port in the small intestine and placenta and by inducing iron retention in macrophages. Hepcidin synthesis is increased by iron loading and is decreased by anemia and hypoxia. Since hepcidin is also markedly in-duced during infl ammation, it contributes to the anemia of infl amma-tion. Hepcidin defi ciency due to the dysregulation of its synthesis causes most known forms of hemochromatosis.
Th e applicability of the hepcidin or pro-hepcidin [10] determina-tion in plasma for the diagnostic classifi cation of anemias is not yet clarifi ed. Further studies to validate preanalytic, methodological, and clinical aspects of this parameter are still required [41].
FFund
amen
tals
Erythropoiesis
Physiological Cell Maturation
An adult has on average 5 liters of blood and an erythrocyte count of 5 × 10⁶/μL, giving a total erythrocyte count of 2.5 × 10¹³. Since the mean life span of an erythrocyte is normally 120 days, about 2 × 10¹¹ new eryth-rocytes need to be formed daily to maintain this erythrocyte pool. For this to happen, 20–30% of the medullary stem cells must be diff erentiated to cells of erythropoiesis. Diff erent stages in maturation can be identifi ed on the basis of cell morphology and biochemical capacity. Th e immature nucleated cells, such as proerythroblasts and erythroblasts (macroblasts), with their high DNA, RNA, and protein synthesizing capacity, ensure that there is adequate proliferation of erythrocyte precursors.
However, this requires the availability of suffi cient cobalamin (vita-min B12) and folic acid, which act as carriers of C1 units in the synthesis of nucleic acids. Vitamin B12 (daily requirement about 2 μg) is derived mainly from foods of animal origin. Absorption in the terminal ileum calls for the production of suffi cient intrinsic factor by the parietal cells in the fundus/body region of the stomach. By contrast, folic acid (daily requirement >200 μg) is derived mainly from foods of plant origin and, probably for the most part, via synthesis by intestinal bacteria, and ab-sorbed in the jejunum. Both vitamins are mainly stored in the liver.
Most of the hemoglobin synthesis occurs during the normoblast stage of the erythrocyte precursors. Th is is morphologically visible by the conversion of so-called basophilic into oxyphilic normoblasts (with red cytoplasm). In parallel, the transferrin receptor is expressed at a high rate which is necessary to channel a suffi cient quantity of transfer-rin-bound iron into the cells.
Cell nucleus and mitochondria are then expelled and the cells leave the bone marrow as reticulocytes. At this stage, the cells’ ability to divide and most of their biochemical synthesis capabilities are lost. However, since a considerable amount of Hb-coding mRNA, a high concentration of membrane-bound transferrin receptors, and residual cell organelles persist they are still capable to synhesize Hb for 1–2 days (until mRNA, TfR, and cell organelles are degraded). Within this time about 20% of the mature erythrocyte’ s Hb is synthesized. Subsequently, the cells cir-culate in the peripheral blood as highly specialized, mature erythrocytes
M. Wick et al., Clinical Aspects and Laboratory - Iron Metabolism, Anemias© Springer-Verlag/Wien 2011
Erythropoiesis18
FFund
amen
tals
serving almost exclusively for the transportation of oxygen. Th is whole process of erythropoiesis takes approximately 5 days.
All forms of anemias that are not primarily hemolytic have their roots in disturbances of cell proliferation or hemoglobin synthesis or in defi ciencies at bone-marrow level. Th e simplest indicator of erythropoi-esis is the reticulocyte count.
Hemoglobin Synthesis
In the fetus, hemoglobin (Hb) is made up of 2 α- and 2 γ-polypeptide chains (HbF (αγ)2), whereas in adults it predominantly consists of 2 α- and 2 β-chains (HbA0 (αβ)2), with a small portion of 2 α- and 2 δ- chains (HbA2 (αδ)2).
Each of these chains carries a heme as prosthetic group, which in turn is capable of binding an oxygen molecule. Th e total molecular weight of this tetramer is about 64,500 D.
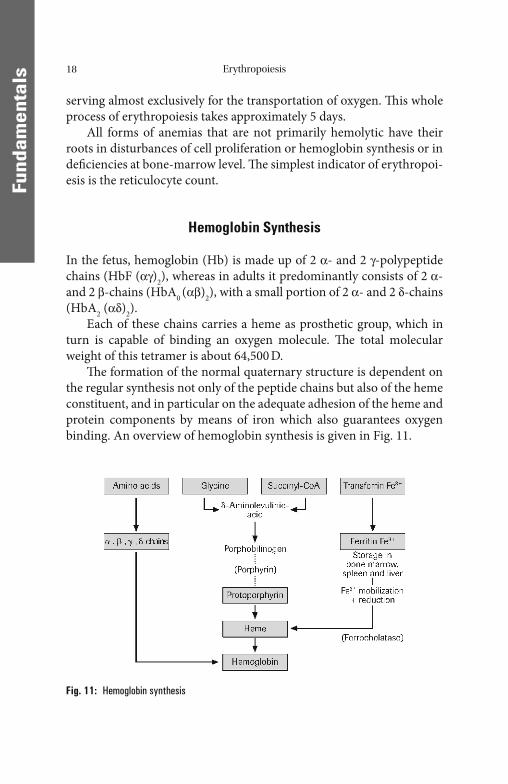
Th e formation of the normal quaternary structure is dependent on the regular synthesis not only of the peptide chains but also of the heme constituent, and in particular on the adequate adhesion of the heme and protein components by means of iron which also guarantees oxygen binding. An overview of hemoglobin synthesis is given in Fig. 11.
Fig. 11: Hemoglobin synthesis
Erythropoiesis 19
FFund
amen
tals
Erythropoietin
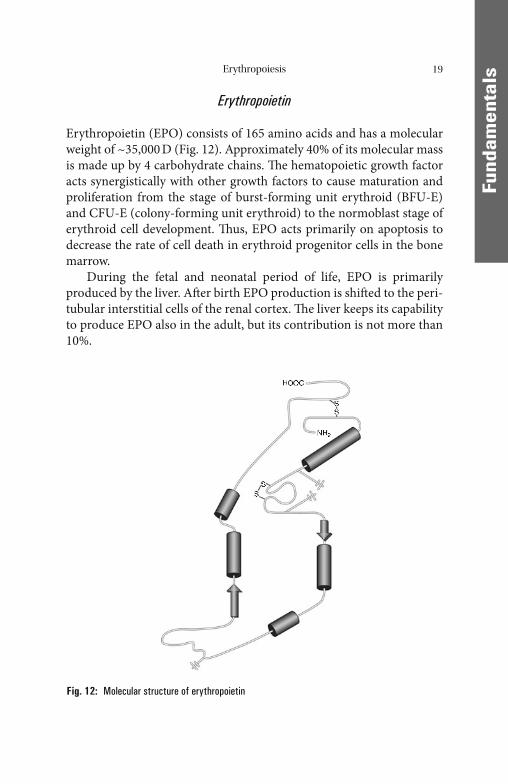
Erythropoietin (EPO) consists of 165 amino acids and has a molecular weight of ~35,000 D (Fig. 12). Approximately 40% of its molecular mass is made up by 4 carbohydrate chains. Th e hematopoietic growth factor acts synergistically with other growth factors to cause maturation and proliferation from the stage of burst-forming unit erythroid (BFU-E) and CFU-E (colony-forming unit erythroid) to the normoblast stage of erythroid cell development. Th us, EPO acts primarily on apoptosis to decrease the rate of cell death in erythroid progenitor cells in the bone marrow.
During the fetal and neonatal period of life, EPO is primarily produced by the liver. Aft er birth EPO production is shift ed to the peri-tubular interstitial cells of the renal cortex. Th e liver keeps its capability to produce EPO also in the adult, but its contribution is not more than 10%.
Fig. 12: Molecular structure of erythropoietin
Erythropoiesis20
FFund
amen
tals
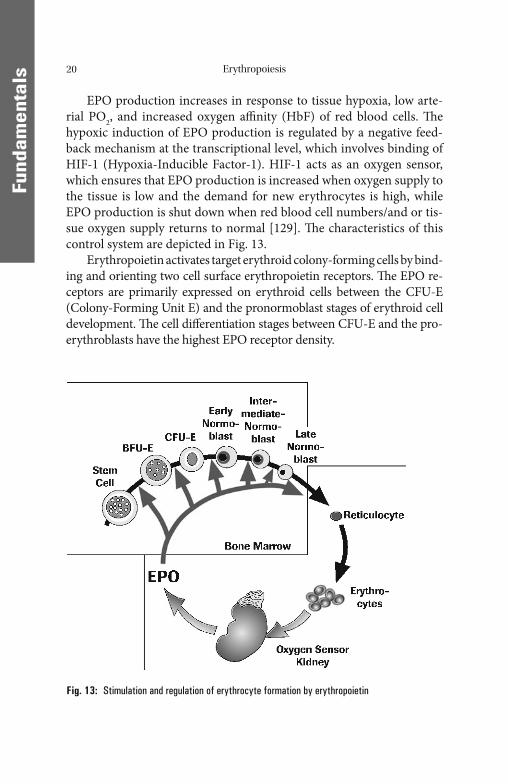
EPO production increases in response to tissue hypoxia, low arte-rial PO2, and increased oxygen affi nity (HbF) of red blood cells. Th e hypoxic induction of EPO production is regulated by a negative feed-back mechanism at the transcriptional level, which involves binding of HIF-1 (Hypoxia-Inducible Factor-1). HIF-1 acts as an oxygen sensor, which ensures that EPO production is increased when oxygen supply to the tissue is low and the demand for new erythrocytes is high, while EPO production is shut down when red blood cell numbers/and or tis-sue oxygen supply returns to normal [129]. Th e characteristics of this control system are depicted in Fig. 13.
Erythropoietin activates target erythroid colony-forming cells by bind-ing and orienting two cell surface erythropoietin receptors. Th e EPO re-ceptors are primarily expressed on erythroid cells between the CFU-E (Colony-Forming Unit E) and the pronormoblast stages of erythroid cell development. Th e cell diff erentiation stages between CFU-E and the pro-erythroblasts have the highest EPO receptor density.
Fig. 13: Stimulation and regulation of erythrocyte formation by erythro poietin
Erythropoiesis 21
FFund
amen
tals
Th e orientation of the EPO receptors is critical for effi cient signal-ing. Proper binding triggers an intracellular phosphorylation cascade, which activates both the Ras/MAP kinase pathway and the STAT (signal transducer and activator of transcription) pathway. Th ese pathways play a major role in cytokine-induced signaling and are involved in increased cell proliferation in response to EPO [52].
Th e erythroid progenitor cells are sensitive to EPO and other growth factors for survival, proliferation, and diff erentiation for only 5 days. Th e young, just matured erythrocytes require EPO for further 9 days, to prevent their cytolysis in the spleen and the reticuloendothelial system (RES).
In adults, the mean endogeneous EPO level is about 8 mU/mL, with a wide range of variation. Th e strongest stimulus of renal EPO production is an anemic condition. EPO levels typically increase when the level of Hb falls below 12 g/dL. By reducing the O2 transport capa-city of Hb, carbon monoxide also leads to a distinct increase of the EPO concentration. Further stimuli of EPO production are an in-creased affi nity of Hb to bind O2 (HbF), an acceleration of the basal metabolic rate by, e.g. thyroid hormones, benignant and malignant kidney tumors, and a decrease in the O2 partial pressure in the arterial blood which occurs e.g. with cardiopulmonary illness or defi ciency of oxygen in the respiratory air. Th e stimulation of EPO production by hypoxia is used, e.g. by athletes to increase their erythrocyte count by high altitude training.
An increase of the erythrocyte mass, renal diseases, fasting and re-section of the hypophysis lead to a decrease of the EPO production.
Up to now the determination of erythropoietin has been of limited diagnostic value. It can be used, for example, to diff erentiate between primary causes of erythrocytosis, polycythemia vera and secondary causes such as increased production of erythropoietin, e.g., in lung dis-eases with hypoxia or certain tumors. In renal anemia, the decreased erythropoietin production can usually be the cause. In every case where a true erythropoietin defi ciency does not exist but rather an adequate erythropoietin response, i.e., anemia with normal erythropoietin lev-els, the determination of erythropoietin is suitable for detecting this inadequate erythropoietin response.
Increased EPO concentrations in serum are measured in patients with cardiac and pulmonary insuffi ciency, for example, and in patients
Erythropoiesis22
FFund
amen
tals
with erythrocytosis with high oxygen affi nity (e.g., HbF). EPO levels typically increase in serum when the Hb level falls below 12 g/dL.
A decrease in EPO concentrations is observed in patients with impaired renal function. Patients with chronic renal insuffi ciency develop anemia and erythropoiesis is inadequate. Additional extracor-poral factors (e.g., hemolysis) can also play a role in the development of anemia.
Erythrocyte Degradation
Phagocytosis of Old Erythrocytes
During the physiologic aging process, the circulating erythrocytes lose more and more of the terminal neuraminic acid residues of their mem-brane glycoproteins, which leads to increased binding of IgG. Th e changed membrane surface structure is the signal in particular to the spleen and liver macrophages to start phagocytosis of the aged erythro-cytes. About 0.8% of the erythrocyte pool or 2 × 10¹¹ erythrocytes are phagocytozed each day, maintaining equilibrium with the daily new for-mation rate.
Hemoglobin Degradation
Th e globin component of the hemoglobin is hydrolyzed by proteases to amino acids which are either available for the synthesis of new proteins or are further degraded. To avoid toxic eff ects, the released Fe2+ is oxi-dized to Fe3+ and incorporated into basic isoferritins for interim storage. In this process, the macrophages of the RES (reticuloendothelial sys-tem) in the spleen in particular serve as short-term stores from which ferritin-bound iron can be remobilized and transported via transferrin to the bone marrow for the synthesis of new hemoglobin. At a physio-logic hemolysis rate, about 6.5 g per day of hemoglobin is degraded, and the corresponding quantity newly synthesized, giving an iron turnover of about 25 mg/24 h [123, 126]. Given a daily iron absorption of 1 mg, this again shows clearly that the iron requirement can be met only by extensive reutilization.
Erythropoiesis 23
FFund
amen
tals
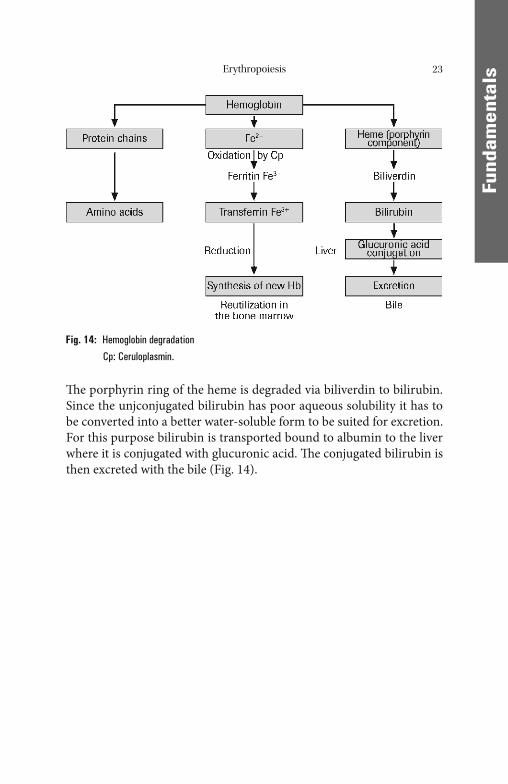
Th e porphyrin ring of the heme is degraded via biliverdin to bilirubin. Since the unjconjugated bilirubin has poor aqueous solubility it has to be converted into a better water-soluble form to be suited for excretion. For this purpose bilirubin is transported bound to albumin to the liver where it is conjugated with glucuronic acid. Th e conjugated bilirubin is then excreted with the bile (Fig. 14).
Fig. 14: Hemoglobin degradation
Cp: Ceruloplasmin.
FFund
amen
tals
Disturbances of Iron Metabolism/Disturbances of Erythropoiesis and Hemolysis
Disturbances of Iron Balance
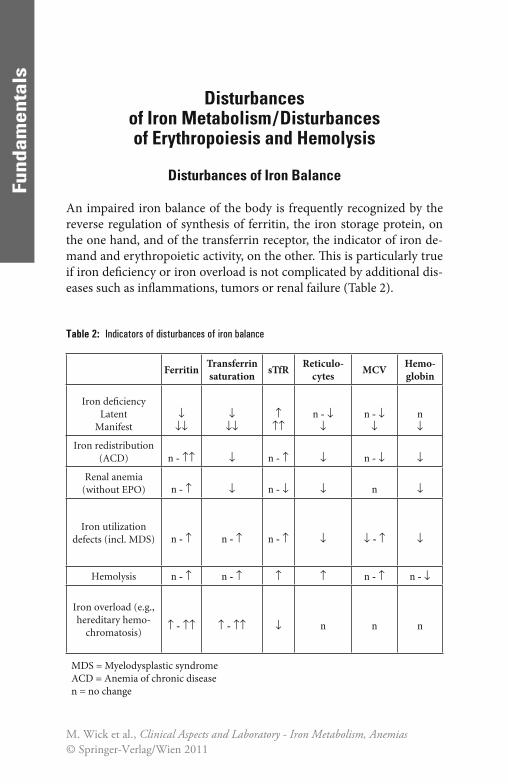
An impaired iron balance of the body is frequently recognized by the reverse regulation of synthesis of ferritin, the iron storage protein, on the one hand, and of the transferrin receptor, the indicator of iron de-mand and erythropoietic activity, on the other. Th is is particularly true if iron defi ciency or iron overload is not complicated by additional dis-eases such as infl ammations, tumors or renal failure (Table 2).
Table 2: Indicators of disturbances of iron balance
Ferritin Transferrin saturation sTfR Reticulo-
cytes MCV Hemo-globin
Iron defi ciencyLatent
Manifest↓
↓↓↓
↓↓↑
↑↑n - ↓
↓n - ↓
↓n↓
Iron redistribution(ACD) n - ↑↑ ↓ n - ↑ ↓ n - ↓ ↓
Renal anemia(without EPO) n - ↑ ↓ n - ↓ ↓ n ↓
Iron utilization defects (incl. MDS) n - ↑ n - ↑ n - ↑ ↓ ↓ - ↑ ↓
Hemolysis n - ↑ n - ↑ ↑ ↑ n - ↑ n - ↓
Iron overload (e.g., hereditary hemo-
chromatosis)↑ - ↑↑ ↑ - ↑↑ ↓ n n n
MDS = Myelodysplastic syndromeACD = Anemia of chronic diseasen = no change
M. Wick et al., Clinical Aspects and Laboratory - Iron Metabolism, Anemias© Springer-Verlag/Wien 2011
Disturbances of Iron Metabolism 25
FFund
amen
tals
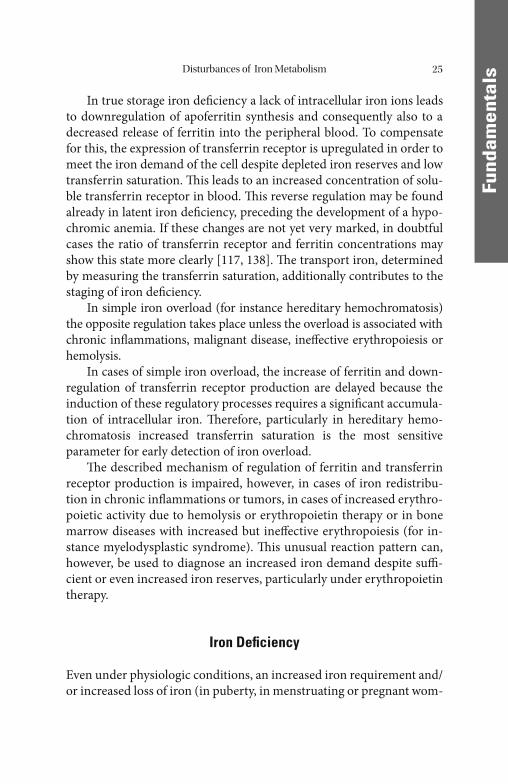
In true storage iron defi ciency a lack of intracellular iron ions leads to downregulation of apoferritin synthesis and consequently also to a decreased release of ferritin into the peripheral blood. To compensate for this, the expression of transferrin receptor is upregulated in order to meet the iron demand of the cell despite depleted iron reserves and low transferrin saturation. Th is leads to an increased concentration of solu-ble transferrin receptor in blood. Th is reverse regulation may be found already in latent iron defi ciency, preceding the development of a hypo-chromic anemia. If these changes are not yet very marked, in doubtful cases the ratio of transferrin receptor and ferritin concentrations may show this state more clearly [117, 138]. Th e transport iron, determined by measuring the transferrin saturation, additionally contributes to the staging of iron defi ciency.
In simple iron overload (for instance hereditary hemochromatosis) the opposite regulation takes place unless the overload is associated with chronic infl ammations, malignant disease, ineff ective erythropoiesis or hemolysis.
In cases of simple iron overload, the increase of ferritin and down-regulation of transferrin receptor production are delayed because the induction of these regulatory processes requires a signifi cant accumula-tion of intracellular iron. Th erefore, particularly in hereditary hemo-chromatosis increased transferrin saturation is the most sensitive parameter for early detection of iron overload.
Th e described mechanism of regulation of ferritin and transferrin receptor production is impaired, however, in cases of iron redistribu-tion in chronic infl ammations or tumors, in cases of increased erythro-poietic activity due to hemolysis or erythropoietin therapy or in bone marrow diseases with increased but ineff ective erythropoiesis (for in-stance myelo dysplastic syndrome). Th is unusual reaction pattern can, however, be used to diagnose an increased iron demand despite suffi -cient or even increased iron reserves, particularly under erythropoietin therapy.
Iron Defi ciency
Even under physiologic conditions, an increased iron requirement and/or increased loss of iron (in puberty, in menstruating or pregnant wom-
Disturbances of Iron Metabolism26
FFund
amen
tals
en, in blood donors or in competitive athletes) can lead to iron defi -ciency. With an unbalanced diet, the iron balance is oft en upset by a shortage of absorbable iron.
Th e fi rst stage is a shortage of depot iron (prelatent iron defi ciency), which is refl ected in a reduced plasma ferritin concentration. When the iron stores are completely empty, a transport iron defi ciency develops, though hemoglobin synthesis is still adequate at this stage (latent iron defi ciency). With additional stress or loss of iron, however, this condi-tion may progress into a manifest iron defi ciency with hypochromic microcytic anemia. Th e latter is more oft en seen with a pathologic chronic loss of blood, especially as a result of ulcers or tumors of the gastrointestinal and urogenital tracts, or with disturbances of iron ab-sorption (e.g., aft er resections in the upper gastrointestinal tract or chronic infl ammatory diseases of the small intestine).
All forms of iron defi ciency can be identifi ed by the following pat-tern of laboratory fi ndings: reduced ferritin concentration with a com-pensating increase in the transferrin concentration and low transferrin saturation (see “Diagnostic Strategies”). Th e reduced ferritin concentra-tion is the only reliable indicator of iron-defi cient conditions. It enables the latter to be distinguished from other causes of hypochromic anemia, such as chronic infl ammations and tumors (Table 2).
Iron defi ciency, of whatever cause, also leads to increased transfer-rin receptor expression and accordingly to an increased concentration of the soluble transferrin receptor in the plasma. In these cases, there is no longer any correlation between transferrin receptor and erythropoi-etic activity. All forms of depot iron defi ciency can be detected with an adequate degree of certainty by a decreased ferritin concentration. But since ferritin is an acute phase protein, iron defi ciency due to infl amma-tions or tumors may be masked. On the other hand, in cases with suffi cient iron reserves and so-called functional iron defi ciency, i.e. dis-turbances of iron utilization, an increased concentration of soluble transferrin receptors may give an early indication of the relative short-age of iron of erythropoiesis or defi cient iron mobilization. In these cases of complicated storage or functional iron defi ciency, sTfR may show the increased iron demand.
A correct diagnosis of iron defi ciency is critical for the successful treatment of anemias. Experience shows that in multimorbid patients iron defi ciency can oft en only be classifi ed as “certain”, “absent”, or “pos-
Disturbances of Iron Metabolism 27
FFund
amen
tals
sible”. Patients classifi ed in the latter category primarily have anemias that occur in conjunction with infections, acute chronic infl ammation, or malignant tumors. A majority of these patients have an acute phase reaction with increased CRP (C-reactive protein) to above 5 mg/L.
Th e objective to laboratory testing is to: Detect the subclinical iron defi ciency and administer early therapy to
prevent systemic complications of this disease; Identify anemias that are based on uncomplicated iron defi ciency
(menstruation increased, chronic intestinal bleeding, nutritive iron defi ciency), because they respond very quickly to iron therapy;
Detect inadequate iron supply of erythropoiesis in anemias where disturbance of iron distribution is paramount (anemias in infections and infl ammations, and tumor anemia).
Disturbances of Iron Distribution
Malignant neoplasias and chronic infl ammations lead to a shortage of transport and active iron, with simultaneous overloading of the iron stores. When tumors are present, the disturbance of the iron distribu-tion is further infl uenced by the increased iron requirement of the tu-mor tissue. Th ese conditions, like manifest iron defi ciency, are characterized by anemia, low iron levels and low transferrin saturation values. Genuine iron defi ciency is distinguished by reduced ferritin and elevated transferrin concentrations.
Th e elevated ferritin concentration in these cases is not representa-tive of the body’ s total iron reserves, but indicates the redistribution to the iron-storing tissue. Th e low transferrin saturation distinguishes dis-turbances of iron distribution from genuine iron overload conditions.
In the presence of tumors, besides a disturbed iron distribution and increased release of iron-rich basic isoferritins into the blood plasma, a separate release of mainly acidic iron-poor isoferritins is observed. Only a small fraction of the acidic isoferritins is normally detected by commercially available immunoassay methods. Th ere-fore, in most cases the total ferritin concentration is underestimated in the presence of tumors. What is recorded is mainly the redistribu-tion of iron, and to a smaller extent the autochthonous tumor synthe-sis products.
Disturbances of Iron Metabolism28
FFund
amen
tals
A non-representative elevation of the plasma ferritin concentration is also found in patients with cell necrosis of the iron-storage organs, e.g. in liver diseases. Transferrin saturation is also elevated in these patients, however.
In most of the iron distribution disturbances, there is a relative shortage in the amount of iron supplied to the erythropoietic cells, to-gether with reduced erythropoietic activity. Correspondingly, transfer-rin receptor expression is usually normal. However, in the case of rapidly growing tumors, transferrin receptor expression can be elevated as a result of the increased iron requirement of the tumor cells.
A very rare hereditary form of iron redistribution is caused by atransferrinemia. Th e lack of transferrin-bound iron transport leads to low iron concentrations in plasma and a reduced supply of all iron con-suming cells. Th e transport function is taken over nonspecifi cally by other proteins such as albumin, leading to an uncontrolled deposition of iron in the cells, which is not regulated according to the demand by transferrin receptor expression.
Anemias of Malignancies and Anemias of Chronic Diseases
As described above, iron redistribution with a relative overloading of iron stores and concomitant relative iron defi ciency of erythropoietic cells (as a consequence of reduced transferrin synthesis) can be seen mainly with tumor anemias and chronic infl ammations (primarily rheu-matic diseases, but also infections). If the disturbance of iron redistribu-tion is predominant, hypochromic anemia is highly probable and can be diff erentiated from iron defi ciency anemia by assaying ferritin and sTfR.
Th e synthesis of the anti-acute phase protein transferrin is down-regulated in the presence of the above-mentioned diseases, which is possibly the result of an evolutionary natural selection process. Suscibil-ity to infections decreases in the presence of reduced transport iron, because bacteria and other pathogens also require iron to replicate. Th e reduced availability of iron therefore acts as a protective mechanism on the one hand and, on the other, it represents a major pathomechanism of the development of anemias of infection and malignancy.
Apart from downregulation of transferrin production, a second cause of iron redistribution in infl ammations was identifi ed [36].
Disturbances of Iron Metabolism 29
FFund
amen
tals
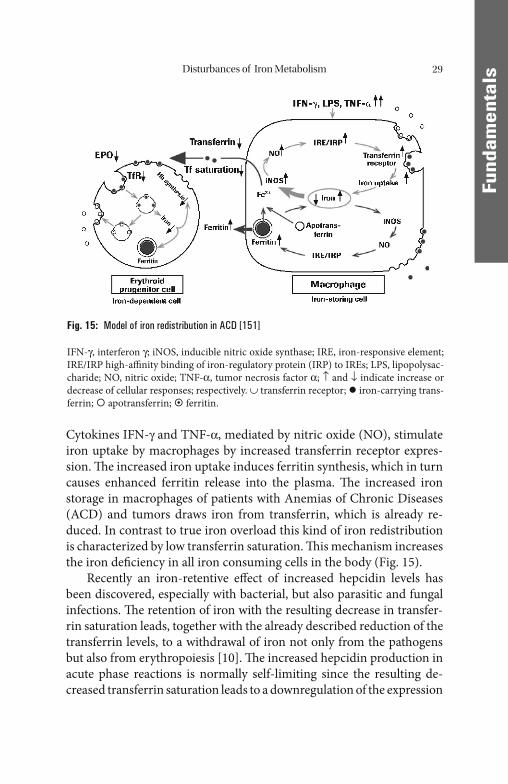
Cytokines IFN-γ and TNF-α, mediated by nitric oxide (NO), stimulate iron uptake by macrophages by increased transferrin receptor expres-sion. Th e increased iron uptake induces ferritin synthesis, which in turn causes enhanced ferritin release into the plasma. Th e increased iron storage in macrophages of patients with Anemias of Chronic Diseases (ACD) and tumors draws iron from transferrin, which is already re-duced. In contrast to true iron overload this kind of iron redistribution is characterized by low transferrin saturation. Th is mechanism increases the iron defi ciency in all iron consuming cells in the body (Fig. 15).
Recently an iron-retentive eff ect of increased hepcidin levels has been discovered, especially with bacterial, but also parasitic and fungal infections. Th e retention of iron with the resulting decrease in transfer-rin saturation leads, together with the already described reduction of the transferrin levels, to a withdrawal of iron not only from the pathogens but also from erythropoiesis [10]. Th e increased hepcidin production in acute phase reactions is normally self-limiting since the resulting de-creased transferrin saturation leads to a downregulation of the expression
Fig. 15: Model of iron redistribution in ACD [151]
IFN-γ, interferon γ; iNOS, inducible nitric oxide synthase; IRE, iron-responsive element; IRE/IRP high-affi nity binding of iron-regulatory protein (IRP) to IREs; LPS, lipopolysac-charide; NO, nitric oxide; TNF-α, tumor necrosis factor α; ↑ and ↓ indicate increase or decrease of cellular responses; respectively. ∪ transferrin receptor; iron-carrying trans-ferrin; apotransferrin; ferritin.
Disturbances of Iron Metabolism30
FFund
amen
tals
of the peptide. Hepatic tumors which excessively produce hepcidin seem to be an exception here.
A further cause of ACD results from reduced erythropoiesis due to the inadequate erythropoietin response to anemia and tissue hypoxia [60, 102]. In contrast to renal anemia, this is a possibly cytokine-medi-ated dysregulation preventing the termination of anemia by increased erythropoietin synthesis. Additionally, erythropoietin eff ects are re-duced. Comparable to absolute erythropoietin defi ciency this function-al relative erythropoietin defi ciency can be substituted with iron and erythropoietin.
In certain cases a hemolytic component also contributes to patho-genesis of anemia, for example due to autoantibodies in the context of a malignant systemic disease or an autoimmune disease.
If hemolysis or a reduced erythropoietin response is the predomi-nant factor in the pathogenesis of the ACD, then the anemia may be normocytic in character rather than microcytic. In the case of marked hemolysis, the reticulocyte count is in the normal to elevated range. If, in contrast, iron redistribution and diminished erythropoietic activity is predominant then a lowered reticulocyte count and microcytic anemia are to be expected.
Th e pathomechanisms responsible for tumor anemia or anemia of chronic infl ammations described above, such as downregulation of transferrin production, iron redistribution into macrophages, and in-suffi cient erythropoietin response fulfi ll a biologic purpose in the patho-genesis also of tumor anemias. Th e tumor cells are growth-inhibited by iron depletion which, however, is bought at the expense of an anemia. Th e iron depletion of erythropoiesis is refl ected in the elevated concen-tration of soluble transferrin receptor, especially in patients with con-comitant iron defi ciency or aft er administration of EPO.
Furthermore, in malignant diseases of the hematopoietic system in-duction of autoantibodies (e.g., cold agglutinins) and splenomegaly may contribute to increased hemolysis, which, as a long-term eff ect, leads to an iron overload in addition to iron redistribution.
In all malignant diseases and hematologic systemic diseases such as leukemias and lymphomas, an infi ltration of the bone marrow by malig-nant cells associated with a reduction of not only erythropoiesis but also hematopoiesis in general may be important. Th is is the prognostically most unfavorable form of a tumor anemia with respect to responsive-
Disturbances of Iron Metabolism 31
FFund
amen
tals
ness to substitution of iron and erythropoietin. Th is is also true for my-elodysplastic syndromes in which an increased but ineff ective erythropoiesis is characterized by a maximal stimulation of erythropoi-etin production which fi nally leads to an iron overload state. Th ese bone marrow diseases can be diagnosed adequately only by bone marrow in-vestigation by hematologically experienced experts.
Anemias of gastrointestinal tumors and infl ammations (celiac dis-ease, M. Crohn, Colitis ulcerosa, stomach and colon carcinomas) repre-sent exceptional cases of anemias of chronic disease (ACD). In addition to the mechanisms of iron redistribution and reduced erythropoietin response outlined above a defi ciency of iron, nutrients, vitamins, and trace elements caused by anorexia, blood loss, diarrhea, and disturbanc-es of iron resorption may play a role here. Since an acute phase reaction associated with non-representative ferritin values is oft en observed in these cases, the diagnosis can be improved by the additional determina-tion of sTfR and, if necessary, with the assessment of the sTfR/log ferritin ratio [138]. Also in this particular situation, increased sTfR con-centrations indicate either an accelerated erythropoiesis with increased iron demand or a shortage of depot iron. Th e same applies to a lesser extent for diseases of the urogenital tract.
Differentiation between Shortage of Depot Iron and Functional Iron Defi ciency
As already outlined, disturbances of iron mobilization and distribution with reduced transferrin saturation and inadequate iron supply (func-tional iron defi ciency) may occur albeit suffi cient depot iron. Especially when associated with an acute phase reaction, this situation may be rec-ognized only conditionally by biochemical testing. Reduced transferrin saturation with normal to increased ferritin and normal to decreased sTfR may be indicative here. In this situation the additional determina-tion of cellular indices, especially of the percentage of hypochromic erythrocytes (% HYPO) or the reticulocyte hemoglobin content (Ret-Hb) has gained increased importance [28] for the sensitive detection of an insuffi cient iron supply of erythropoiesis. Th e combination of Ret-Hb and sTfR/log ferritin in a diagnostic diagram with CRP concen-tration-dependent cut-off values may considerably facilitate the
Disturbances of Iron Metabolism32
FFund
amen
tals
diff erenciation between shortage of depot iron and functional iron defi ciency [139].
However, sensitivity and specifi city of the cellular indices may be hampered by symptoms of malnutrition (e.g., hypochromia caused by hypoproteinosis, hyperchromia caused by folate or vitamin B12 defi cien-cy) or cytostatic therapy (e.g., macrocytosis and hyperchromia caused by treatment with folic acid antagonists).
Disturbances of Iron Utilization
Even with normal serum ferritin concentrations indicative for normal iron reserves and normal iron distribution, disturbances of iron utiliza-tion or incorporation can occur. Th is situation may also lead to micro-cytic or normocytic anemia, simulating the presence of iron-defi ciency anemia.
Ever since erythropoietin has replaced the transfusions previously used to treat renal anemia, dialysis patients represent the largest group. Despite adequate iron reserves, erythropoietin therapy does not always lead to a suffi cient iron mobilization from the iron stores. Th is is demonstrated, e.g. by a reduction in transport iron (low transferritin saturation). Similarly, as in genuine iron defi ciency and disturbances of iron distribution, the reduced availability of iron for heme synthesis leads to an increased incorporation of zinc into the porphyrin ring. Th is can be measured as increased Zn-protoporphyrin in the erythrocytes, and can be used as an additional aid to the diagnosis of iron utilization disturbances with normal or elevated ferritin concentrations. Ferritin and sTfR are suitable means to distinguish between genuine iron defi -ciency and disturbances of iron distribution or utilization.
Renal Anemias
Particular attention should be paid to iron metabolism in patients with renal anemia. Th e substitution of erythropoietin, together with the i.v. administration of iron, has replaced transfusions which used to be per-formed routinely, and has therefore revolutionized therapy.
Disturbances of Iron Metabolism 33
FFund
amen
tals
Transfusions, which previously were performed on a regular basis and the concomitant disturbance of iron utilization due to erythropoi-etin defi ciency almost invariably led to increasing iron overload and its associated consequences. Th e treatment of disturbances of iron metabo-lism in dialysis patients is now fundamentally diff erent since the intro-duction of EPO therapy, however.
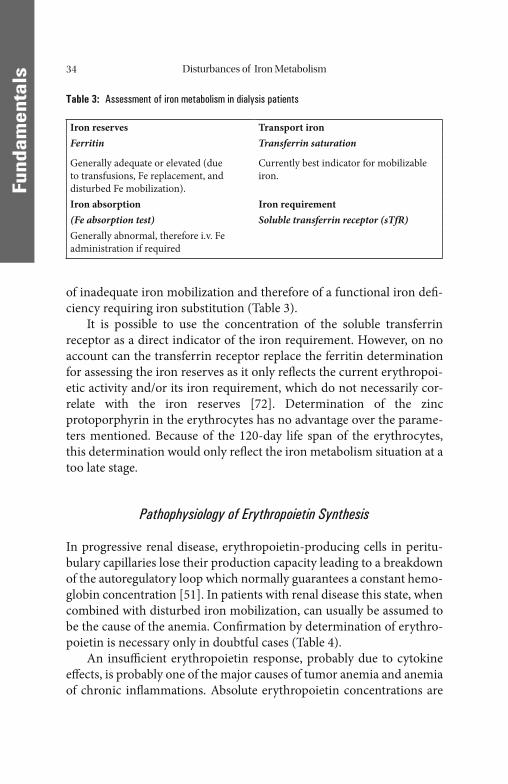
Th e iron reserves are usually adequate, i.e. the plasma ferritin con-centration is normal or possibly even increased. Despite normal iron reserves, iron mobilization is typically disturbed. Th is is indicated by low transferrin saturation, which can lead to relative short supply of iron in erythropoiesis and to so-called functional iron defi ciency. Gen-erally this situation cannot be remedied by oral iron replacement thera-py as, in most cases, iron absorption is also disturbed.
However, as long as the erythropoietin defi ciency typical of renal anemia is not corrected, the erythropoietic activity is reduced to the same extent as the mobilization of iron. Th erefore at a low level, iron turnover and erythropoiesis are in a steady state. Transferrin receptor expression is reduced or normal.
Renal anemia can also be complicated, for example, by a hemolytic component as a result of mechanical damage of the red cells during he-modialysis. If this is the case, a normal or even elevated reticulocyte count is to be expected, and not reduced hematopoiesis, as with simple erythropoietin defi ciency. In this situation the short supply of iron in erythropoiesis is refl ected in the elevated proportion of hypochromic erythrocytes and hypochromic reticulocytes.
If attempts are made to correct the erythropoietin defi ciency by sub-stitution, thereby increasing erythropoietic activity, the poor mobiliza-tion of the iron reserves is apparent as a functional iron defi ciency. Th e cells of erythropoiesis react by increased expression of the transferrin receptor to improve iron provision. Th e ferritin concentration is gener-ally a true refl ection of the iron reserves (an exception to this is when it is immediately preceded by iron substitution or in the presence of a sec-ondary disorder involving iron distribution disturbances) and can therefore be used to recognize any depot iron defi ciency or to avoid iron overload in iron substitution therapy.
Transferrin saturation is currently the best indicator for the amount of mobilizable transport iron and is inversely proportional to the iron requirement. Reduced transferrin saturation in dialysis patients is a sign
Disturbances of Iron Metabolism34
FFund
amen
tals
of inadequate iron mobilization and therefore of a functional iron defi -ciency requiring iron substitution (Table 3).
It is possible to use the concentration of the soluble transferrin receptor as a direct indicator of the iron requirement. However, on no account can the transferrin receptor replace the ferritin determination for assessing the iron reserves as it only refl ects the current erythropoi-etic activity and/or its iron requirement, which do not necessarily cor-relate with the iron reserves [72]. Determination of the zinc protoporphyrin in the erythrocytes has no advantage over the parame-ters mentioned. Because of the 120-day life span of the erythrocytes, this determination would only refl ect the iron metabolism situation at a too late stage.
Pathophysiology of Erythropoietin Synthesis
In progressive renal disease, erythropoietin-producing cells in peritu-bulary capillaries lose their production capacity leading to a breakdown of the autoregulatory loop which normally guarantees a constant hemo-globin concentration [51]. In patients with renal disease this state, when combined with disturbed iron mobilization, can usually be assumed to be the cause of the anemia. Confi rmation by determination of erythro-poietin is necessary only in doubtful cases (Table 4).
An insuffi cient erythropoietin response, probably due to cytokine eff ects, is probably one of the major causes of tumor anemia and anemia of chronic infl ammations. Absolute erythropoietin concentrations are
Table 3: Assessment of iron metabolism in dialysis patients
Iron reserves Transport ironFerritin Transferrin saturation
Generally adequate or elevated (due to transfusions, Fe replacement, and disturbed Fe mobilization).
Currently best indicator for mobilizable iron.
Iron absorption Iron requirement(Fe absorption test) Soluble transferrin receptor (sTfR)Generally abnormal, therefore i.v. Fe administration if required
Disturbances of Iron Metabolism 35
FFund
amen
tals
frequently found to be within the reference range for clinically healthy persons; however, this can be considered to be inadequate in patients with anemia. Inadequate erythropoietin secretion and effi cacy and the corresponding iron redistribution can, however, be corrected by eryth-ropoietin and iron therapy, as in renal anemia.
In contrast to these diseases caused by erythropoietin defi ciency or insuffi cient response (Table 4), all other anemias lead to an increased erythropoietin production. Th is is true for very diff erent causes of ane-mia, for instance iron defi ciency anemia, hemolytic anemias, and many bone marrow diseases with ineffi cient erythropoiesis. In severe bone marrow damage (for instance aplastic anemia, myelodysplasia) this compensatory mechanism is not eff ective anymore because the eryth-roid progenitor cells are missing or fail to mature.
Increased erythropoietin secretion may lead to a secondary eryth-rocytosis, provided a suffi cient iron supply and normal bone marrow function are present. In hypoxia (cardiopulmonary diseases, heavy smokers, staying at high altitude) this is a mechanism of adaptation to oxygen defi ciency. In rare cases, however, carcinomas of the kidney or the liver may produce erythropoietin which also leads to erythrocytosis. In contrast to these secondary forms of erythrocytosis, polycythemia
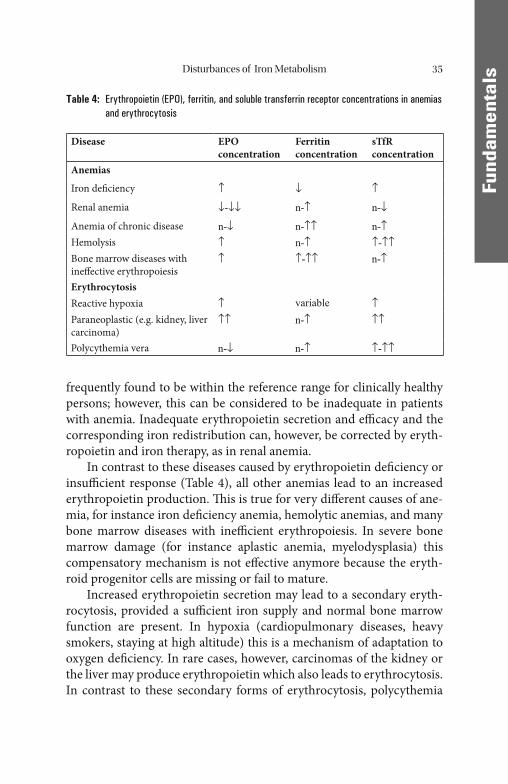
Table 4: Erythropoietin (EPO), ferritin, and soluble transferrin receptor concentrations in anemias and erythrocytosis
Disease EPO concentration
Ferritin concentration
sTfR concentration
Anemias
Iron defi ciency ↑ ↓ ↑
Renal anemia ↓-↓↓ n-↑ n-↓
Anemia of chronic disease n-↓ n-↑↑ n-↑Hemolysis ↑ n-↑ ↑-↑↑Bone marrow diseases with ineff ective erythropoiesis
↑ ↑-↑↑ n-↑
ErythrocytosisReactive hypoxia ↑ variable ↑Paraneoplastic (e.g. kidney, liver carcinoma)
↑↑ n-↑ ↑↑
Polycythemia vera n-↓ n-↑ ↑-↑↑
Disturbances of Iron Metabolism36
FFund
amen
tals
vera is an autonomous proliferation of erythroid cells which leads to a compensatory downregulation of erythropoietin production. Determi-nation of erythropoietin can therefore contribute to the diff erential di-agnosis of erythrocytosis in doubtful cases.
Iron Overload
Genuine iron overload situations arise either through a biologically in-appropriate increase in the absorption of iron despite adequate iron re-serves, or iatrogenically as a result of frequent blood transfusions or inappropriate iron therapy.
Th e former condition occurs mainly as a result of the disturbance of negative feedback mechanisms, which in hemochromatosis is manifest-ed as a failure of the protective mechanism in the mucosa cell (see “Ab-sorption of Iron”).
Conditions characterized by ineff ective erythropoiesis, such as thal-assemia, porphyrias, and sideroachrestic as well as hemolytic anemias, lead to increased synthesis of erythropoietin, transferrin receptor, and absorption of iron, despite adequate iron reserves (utilization of iron to synthesize hemoglobin is impaired). Th e iron overload in these cases is aggravated by the necessary transfusions and by the body’ s inability to actively excrete iron. All the mechanisms mentioned ultimately lead to overloading of the iron stores, and hence redistribution to the parenchy-mal cells of many organs, such as the liver, heart, pancreas, and gonads. Th e storage capacity of ferritin or of the lysosomes may thus be exceed-ed and free iron ions are released into the cytoplasma. Th e free iron ions can lead to the formation of oxygen radicals which then exert their toxic eff ects.
Th e main manifestations in the aff ected organs are liver cirrhosis and primary liver cell carcinoma, heart failure, diabetes or impotence. Phagocytosis and oxidative burst of granulocytes and monocytes may be impaired as well. Epidemiologic investigations have revealed even latent iron overload to be a risk factor for atherosclerosis and type 2 dia-betes due to, among other causes, increased oxidation of low-density lipoproteins (LDL) and the formation of foam cells [54, 143] (Fig. 16).
Th is calls for an increased surveillance of iron overload in the latent phase already by regular ferritin (warning limit: 400 mg/mL) and sTfR
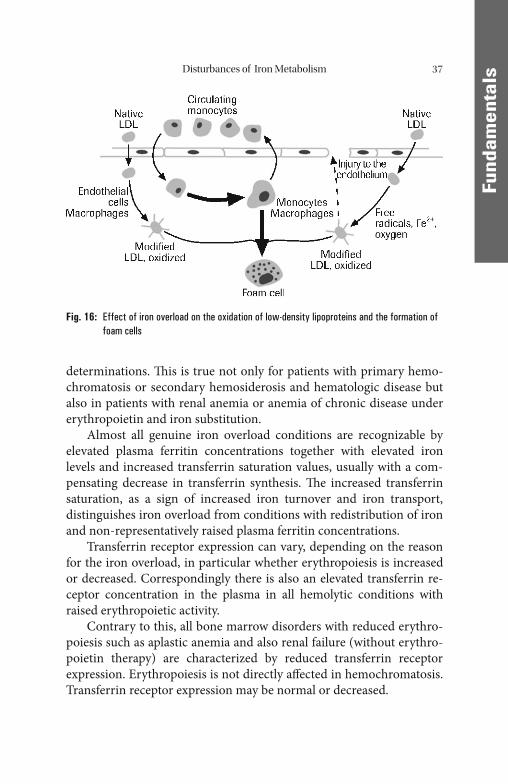
Disturbances of Iron Metabolism 37
FFund
amen
tals
determinations. Th is is true not only for patients with primary hemo-chromatosis or secondary hemosiderosis and hematologic disease but also in patients with renal anemia or anemia of chronic disease under erythropoietin and iron substitution.
Almost all genuine iron overload conditions are recognizable by elevated plasma ferritin concentrations together with elevated iron levels and increased transferrin saturation values, usually with a com-pensating decrease in transferrin synthesis. Th e increased transferrin saturation, as a sign of increased iron turnover and iron transport, distinguishes iron overload from conditions with redistribution of iron and non-representatively raised plasma ferritin concentrations.
Transferrin receptor expression can vary, depending on the reason for the iron overload, in particular whether erythropoiesis is increased or decreased. Correspondingly there is also an elevated transferrin re-ceptor concentration in the plasma in all hemolytic conditions with raised erythropoietic activity.
Contrary to this, all bone marrow disorders with reduced erythro-poiesis such as aplastic anemia and also renal failure (without erythro-poietin therapy) are characterized by reduced transferrin receptor expression. Erythropoiesis is not directly aff ected in hemochromatosis. Transferrin receptor expression may be normal or decreased.
Fig. 16: Effect of iron overload on the oxidation of low-density lipoproteins and the formation of foam cells
Disturbances of Iron Metabolism38
FFund
amen
tals
Primary Hemochromatosis
Primary hemochromatosis represents the most important form of he-reditary iron overload. Until recently its signifi cance has been underes-timated but nevertheless a close association between primary hemochromatosis and certain HLA patterns has been known for a long time. Two mutations of the HFE gene were discovered in the majority of white patients with hemochromatosis in the homozygous or compound heterozygous form. Th e cys-282-tyr mutation is by far the most common mutation and is present in homozygous form in almost 100% of Scandi-navian and as many as 69% of Italian hemochromatosis patients. Th e less common variant is the his-63-asp mutation. Both variations together represent probably the most common of all genetic defects. In the Cau-casian population the frequency of the heterozygous defect is 1:15 and that of the homozygous from 1:200 to 1:300. Th ese mutations can rou-tinely be detected by using PCR analysis.
Obviously the mutations give rise to abnormal HFE proteins in the epithelial cells of the mucosa of the small intestine in the region which is relevant for iron absorption. Th e mutated HFE proteins are not ca-pable to bind to transferrin receptor 2 and the binding of Fe3+ to trans-ferrin at high transferrin saturation is compromised (see “Absorption of Iron”).
More recent fi ndings indicate that the abnormal HFE proteins also aff ect the liver. Th ey prevent the upregulation of hepcidin production, which is normally necessary in the case of iron overload. Th ereby, the direct inhibiting eff ect of hepcidin on the transfer of iron from the intes-tinal cells and macrophages to transferrin is missing [113].
More rare cases of hereditary hemochromatosis have been linked to mutations in the genes encoding hepcidin, hemojuvelin, transferrin re-ceptor 2, and ferroportin. Th e mechanisms underlying the eff ects of the genetic variants of hemojuvelin, transferrin receptor 2, and ferroportin are not yet fully understood [113].
Not all patients who have a homozygous gene defect actually de-velop manifest hemochromatosis. Th e frequency of hemochromatosis in the Caucasian population is in the order of 1:1000 to 1:2000. Th is is probably primarily due to the fact that the precondition for clinical manifestation of hemochromatosis is iron overloading of approximate-ly 10–20 g corresponding to serum ferritin values of approximately
Disturbances of Iron Metabolism 39
FFund
amen
tals
1000–2000 ng/mL. Assuming a positive iron balance of approximately 1 mg per day (2 mg absorption and 1 mg excretion) the time required for the accumulation of an excess of iron reserves is approximately 30–60 years. Th is correlates well with the main age of manifestation of hemochromatosis in men (35–55 years of age). Although the homozy-gous gene defect is more commonly found in women than men, women are mostly protected from the development of hemochromatosis until the onset of menopause. Th is is due to the fact that the excess iron ab-sorption is approximately compensated for by iron loss of the same order of magnitude (15–30 mg) in the course of menstrual bleeding. Th erefore the process of iron accumulation and iron overloading in women with homozygous hemochromatic genes commences only at the onset of menopause and (compared to the process occurring in men) is delayed by decades into old age. Accordingly only about 10% patients with symptomatic hemochromatosis are women. In an evolu-tionary context the hemochromatic genes probably represent a natural selection advantage because they protect women against severe iron defi ciency until at least the onset of menopause. Only aft er the achieve-ment of a signifi cantly longer life-expectancy does iron accumulation may prove to be disadvantageous.
Also patients with hetereozygous forms of hemochromatosis store increased amounts of iron. However, in most of these cases a clinical manifestation of iron overload is not seen.
Th e genetic defects can now be identifi ed in the course of routine diagnostic procedures. Following analysis of ferritin and sTfR concen-trations and particularly transferrin saturation PCR detection of the ap-propriate mutation represents the second level in hematochromatosis diagnostics. However, assaying for ferritin remains the decisive deter-mination for the monitoring of iron reserves.
Other Hereditary States of Iron Overload
Th e copper transport protein ceruloplasmin seems to be important for intracellular oxidation of Fe2+ to Fe3+ which is necessary for the release of iron ions from the cells and the binding to transferrin. Th is is indi-cated by the very rare hereditary aceruloplasminemia where the lack of iron oxidation prevents binding to transferrin and thereby leads to in-
Disturbances of Iron Metabolism40
FFund
amen
tals
tracellular trapping of iron ions and consequently to the development of an iron overload which resembles hereditary hemochromatosis. However, in contrast to hemochromatosis the central nervous system is also aff ected. Due to the impaired binding of iron to transferrin, however, iron concentrations and transferrin saturation in plasma are not elevated, whereas ferritin concentrations are high, refl ecting the impaired iron distribution and release from the cells.
In the so-called “African dietary iron overload” the increased di-etary iron intake from excessive consumption of beer home-brewed in iron drums was long considered the only cause of this iron overload disorder resembling hemochromatosis. However, a non-HLA-linked gene has now additionally been implicated which, as in hemochromato-sis, may impair the protective mechanism in the mucosal cells.
Other Disturbances of Erythropoiesis
Disturbances of Stem Cell Proliferation
Even at stem-cell level, physiologic cell maturation can be compro-mised by numerous noxae and defi ciencies, which in this case leads not only to anemia, but also to disturbances of myelopoiesis and thrombocytopoiesis. Examples that can be cited are medullary aplasia induced by autoimmune (e.g., thymoma), infectious (e.g., hepatitis) or toxic (e.g., antineoplastic drugs and benzene) processes or ionizing ra-diation. Chemical noxae or irradiation can, however, also lead to hy-perregenerative bone-marrow insuffi ciency (myelodysplasia) with iron overload and a possible transition to acute leukemia. Whereas the above-mentioned diseases can be adequately diagnosed only by inva-sive and costly bone-marrow investigations, the causes of vitamin de-fi ciency-induced disturbances of the proliferation and maturation of bone-marrow cells with macrocytic anemia can be detected more sim-ply by the determination of vitamin B12 and folic acid in the serum. However, the diff erentiation of MDS (myelodysplastic syndrome) and vitamin B12, and folic acid defi ciency may be diffi cult due to similar megaloblastic alterations in bone marrow and macrocytic anemia in all these cases.
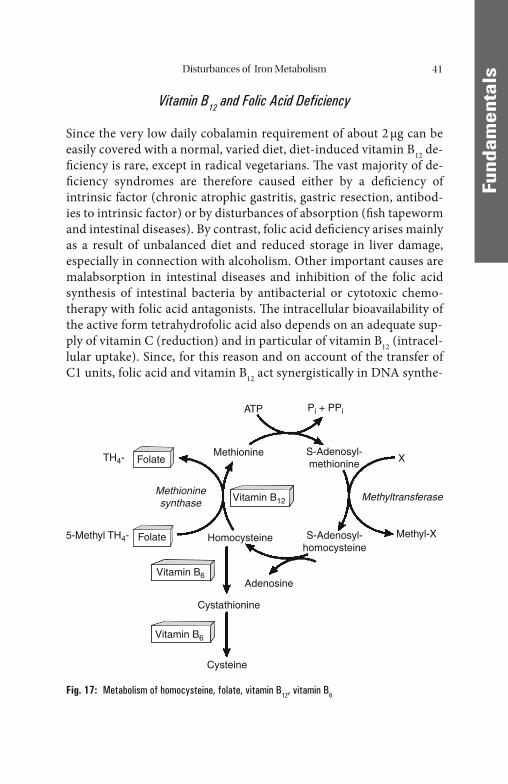
Disturbances of Iron Metabolism 41
FFund
amen
tals
Vitamin B12 and Folic Acid Deficiency
Since the very low daily cobalamin requirement of about 2 μg can be easily covered with a normal, varied diet, diet-induced vitamin B12 de-fi ciency is rare, except in radical vegetarians. Th e vast majority of de-fi ciency syndromes are therefore caused either by a defi ciency of intrinsic factor (chronic atrophic gastritis, gastric resection, antibod-ies to intrinsic factor) or by disturbances of absorption (fi sh tapeworm and intestinal diseases). By contrast, folic acid defi ciency arises mainly as a result of unbalanced diet and reduced storage in liver damage, especially in connection with alcoholism. Other important causes are malabsorption in intestinal diseases and inhibition of the folic acid synthesis of intestinal bacteria by antibacterial or cytotoxic chemo-therapy with folic acid antagonists. Th e intracellular bioavailability of the active form tetrahydrofolic acid also depends on an adequate sup-ply of vitamin C (reduction) and in particular of vitamin B12 (intracel-lular uptake). Since, for this reason and on account of the transfer of C1 units, folic acid and vitamin B12 act synergistically in DNA synthe-
ATP Pi + PPi
XMethionine
5-Methyl TH4-
Methioninesynthase
Methyltransferase
Methyl-X
TH4- Folate
Folate
Vitamin B6
Vitamin B6
S-Adenosyl-methionine
S-Adenosyl-homocysteine
Adenosine
Cystathionine
Cysteine
Homocysteine
Vitamin B12
Fig. 17: Metabolism of homocysteine, folate, vitamin B12, vitamin B6
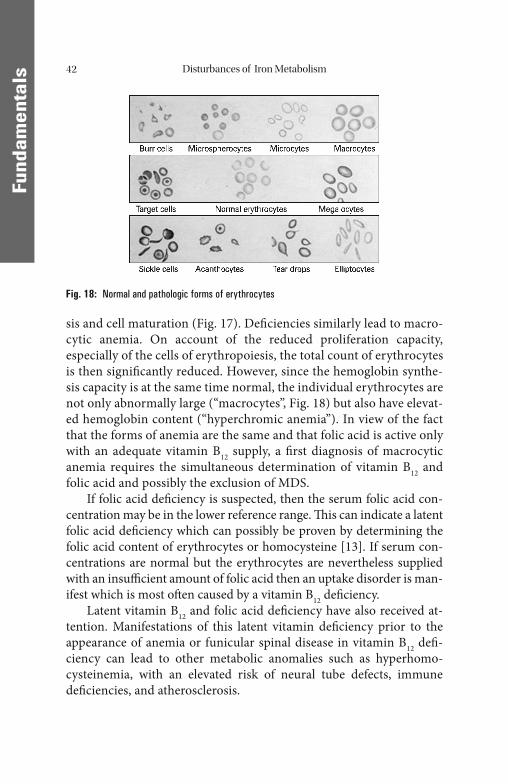
Disturbances of Iron Metabolism42
FFund
amen
tals
sis and cell maturation (Fig. 17). Defi ciencies similarly lead to macro-cytic anemia. On account of the reduced proliferation capacity, especially of the cells of erythropoiesis, the total count of erythrocytes is then signifi cantly reduced. However, since the hemoglobin synthe-sis capacity is at the same time normal, the individual erythrocytes are not only abnormally large (“macrocytes”, Fig. 18) but also have elevat-ed hemoglobin content (“hyperchromic anemia”). In view of the fact that the forms of anemia are the same and that folic acid is active only with an adequate vitamin B12 supply, a fi rst diagnosis of macrocytic anemia requires the simultaneous determination of vitamin B12 and folic acid and possibly the exclusion of MDS.
If folic acid defi ciency is suspected, then the serum folic acid con-centration may be in the lower reference range. Th is can indicate a latent folic acid defi ciency which can possibly be proven by determining the folic acid content of erythrocytes or homocysteine [13]. If serum con-centrations are normal but the erythrocytes are nevertheless supplied with an insuffi cient amount of folic acid then an uptake disorder is man-ifest which is most oft en caused by a vitamin B12 defi ciency.
Latent vitamin B12 and folic acid defi ciency have also received at-tention. Manifestations of this latent vitamin defi ciency prior to the appearance of anemia or funicular spinal disease in vitamin B12 defi -ciency can lead to other metabolic anomalies such as hyperhomo-cysteinemia, with an elevated risk of neural tube defects, immune defi ciencies, and atherosclerosis.
Fig. 18: Normal and pathologic forms of erythrocytes
Disturbances of Iron Metabolism 43
FFund
amen
tals
Recently the term “metabolic” vitamin B12 or folic acid defi ciency has been introduced. It is characterized by the presence of defi ciency symptoms (predominantly macrocytic anemia) already at vitamin B12 or folic acid concentrations in the lower reference range, possibly due to an increased demand sometimes in the context of MDS or neoplasia. Th is may be confi rmed by further laboratory investigations. Latent or func-tional folic acid defi ciency leads to hyperhomocysteinemia, latent and functional vitamin B12 defi ciency mainly to an increased concentration and excretion of methylmalonic acid and possibly also of homocysteine. Vitamin B12 defi ciency can be considered very unlikely, however, if the serum concentration is above 300 ng/L. Th is is also true for folic acid concentrations within a functionally defi ned reference range above 4.4 ng/mL.
Hemoglobinopathies
Hemoglobinopathies are a disturbance in the synthesis of the protein components of hemoglobin [32]. A distinction is made between point mutations with exchange of individual amino acids and defects in whole protein chains.
Of the former, sickle-cell anemia is the most important because it is widespread in the black population of Africa and America. Th e substitu-tion of valine for glutaminic acid at position 6 in the β-chain leads to the formation of so-called sickle-cell hemoglobin (HbS). Th e HbS molecules tend to aggregate aft er unloading oxygen. Th ey form long, rod-like struc-tures that force the red cells to assume a sickle shape. Unlike normal red cells, which are usually smooth and deformable, the sickle red cells (Fig. 18) cannot squeeze through small blood vessels. Th ey are visible under the microscope and can therefore be used diagnostically. HbS can also be detected by hemoglobin electrophoresis. Today, this genetic de-fect is mostly diagnosed using PCR.
Hemoglobinopathies in the broader sense also include the so-called thalassemias. Th alassemia represents a condition in which there is re-duced synthesis or complete absence of entire chains from the hemoglo-bin molecule. Quantitative changes in the synthesis of the - and β-chains are of particular clinical signifi cance, as these make up HbA, the main hemoglobin species occurring in adults. Carriers of β-
Disturbances of Iron Metabolism44
FFund
amen
tals
thalassemia are mostly found in the Mediterranean countries, whereas carriers of α-thalassemia are mostly found in Southeast Asia.
Th e term α-thalassemia refers to hemoglobinopathies in which there is reduced synthesis of the α-chains. Since α-chains are contained in fetal Hb (HbF) as well as in HbA0 and HBA2, α-chain thalassemia has an im-pact on the fetus and patients of all ages. Th e absence of the α-chains is off set in the fetus by the formation of tetramers of γ-chains (Hbγ4 = Bart’ s Hb), aft er birth by the formation of tetramers of β-chains (Hbβ4 = HbH). Erythrocytes containing these pathologic hemoglobins have a tendency to aggregate, however, and are broken down early. Since the synthesis of α-chains is coded for by 2 genes with 4 alleles, 4 clinical pictures of vary-ing severity can be identifi ed, depending on the number of defective genes: a defect in one gene is manifested merely as an increased propor-tion of the above-mentioned pathologic variants of hemoglobin, a 2- allele defect produces mild (α-thalassemia minor), a 3-allele defect pronounced anemia with premature hemolysis (HbH disease). Th e com-plete loss of the α-chains is incompatible with the survival of the fetus.
In contrast to α-thalassemia, β-thalassemia does not have an eff ect until infancy or childhood when the γ-chains are replaced by β-chains. If this is not possible, HbF (with γ-chains) and HbA2 (with δ-chains) are formed by way of compensation. Depending on its mode of inheritance, a distinction can be made between a heterozygous form (thalassemia minor) with reduced β-chain synthesis and correspondingly milder anemia, and a homozygous form (thalassemia major) with more or less complete absence of β-chains and severe anemia.
Th e pathologic variants of hemoglobin in thalassemia lead to charac-teristic abnormalities in the shape of erythrocytes (microcytic anemia with target cells, Fig. 18), which are detectable microscopically. More pre-cise diff erentiation is possible by hemoglobin electrophoresis or PCR.
Pathophysiologically, these structural and morphologic abnormali-ties of erythrocytes result in more or less pronounced insuffi ciency as oxygen carriers and lead to an increased aggregation tendency. In addi-tion, deformation also leads to accelerated destruction of erythrocytes, predominantly in the spleen, with all the signs of corpuscular hemolytic anemia. For signs of hemolysis and hemolytically determined iron over-load, see under “Pathologically Increased Hemolysis”.
Due to immigration from the Mediterranean area β-thalassemia is today also a challenge for the diff erenital diagnosis of microcytic ane-
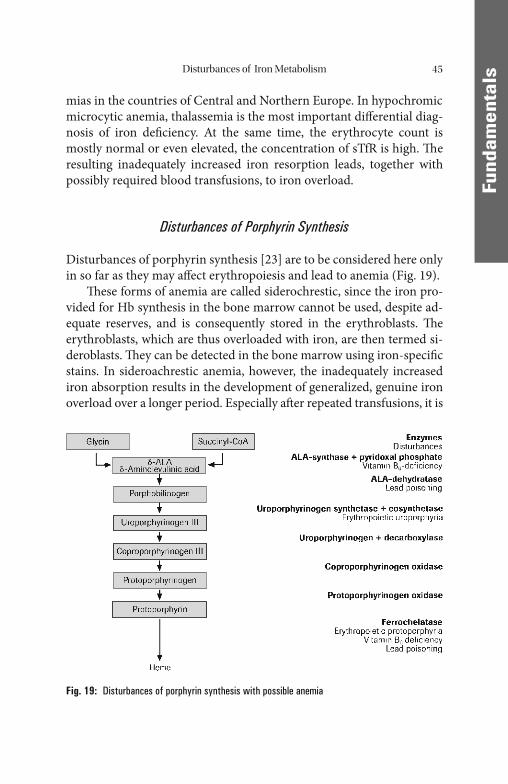
Disturbances of Iron Metabolism 45
FFund
amen
tals
mias in the countries of Central and Northern Europe. In hypochromic microcytic anemia, thalassemia is the most important diff erential diag-nosis of iron defi ciency. At the same time, the erythrocyte count is mostly normal or even elevated, the concentration of sTfR is high. Th e resulting inadequately increased iron resorption leads, together with possibly required blood transfusions, to iron overload.
Disturbances of Porphyrin Synthesis
Disturbances of porphyrin synthesis [23] are to be considered here only in so far as they may aff ect erythropoiesis and lead to anemia (Fig. 19).
Th ese forms of anemia are called siderochrestic, since the iron pro-vided for Hb synthesis in the bone marrow cannot be used, despite ad-equate reserves, and is consequently stored in the erythroblasts. Th e erythroblasts, which are thus overloaded with iron, are then termed si-deroblasts. Th ey can be detected in the bone marrow using iron-specifi c stains. In sideroachrestic anemia, however, the inadequately increased iron absorption results in the development of generalized, genuine iron overload over a longer period. Especially aft er repeated transfusions, it is
Fig. 19: Disturbances of porphyrin synthesis with possible anemia
Disturbances of Iron Metabolism46
FFund
amen
tals
recognizable from an elevated serum ferritin concentration. Most of the causes of sideroachrestic anemia are comparatively uncommon, and therefore rarely need to be considered in practice. Hereditary erythro-poietic porphyrias such as congenital erythropoietic uroporphyria (Günther’ s disease) with a defect of uroporphyrinogen III-synthase and erythropoietic protoporphyria with a defect of ferrochelatase are par-ticularly rare. Acquired forms such as pyridoxal phosphate (vitamin B6) defi ciency are slightly more common. Th is may be of nutritional origin, in alcoholics, for example, or arise as a result of isoniazid therapy in tu-berculosis patients, and leads to a disturbance of iron incorporation via inhibition of δ-amino-levulinic acid synthase and ferrochelatase. Similar pathologic mechanisms are also at the root of lead-induced anemia and disturbance of porphyrin synthesis. Chronic lead intoxication leads to inhibition of δ-amino-levulinic acid dehydratase and of ferrochelatase. All the above-mentioned causes ultimately produce a disturbance of iron utilization via the synthesis of an incomplete porphyrin skeleton or via the direct inhibition of ferrochelatase, with the general features of si-deroachrestic (sideroblastic) anemia described above. If the defect is mainly in the terminal stage of the reaction (incorporation of iron by ferrochelatase), zinc is incorporated into the fi nished protoporphyrin skeleton instead of iron, recognizable from the increased concentration of Zn-protoporphyrin in the erythrocytes. Defects at earlier stages in porphyrin synthesis can be identifi ed by the analysis of the correspond-ing intermediate products; lead and vitamin B6 can also be determined directly for confi rmation of the diagnosis.
Pathologically Increased Hemolysis
“Hemolysis” is the term generally used in clinical medicine to describe the pathologically increased destruction of erythrocytes. Th e cause of this may lie in structural or biochemical defects in the erythrocytes themselves (“corpuscular hemolysis”), in which case it takes place main-ly in the macrophages of the RES in the spleen or the liver. By contrast, extracorpuscular hemolysis takes place mainly intravascularly through the action of autoantibodies, toxins, infective organisms or physical noxae, such as artifi cial heart valves. Intravascular hemolysis can be de-tected very sensitively by means of clinico-chemical investigations, since
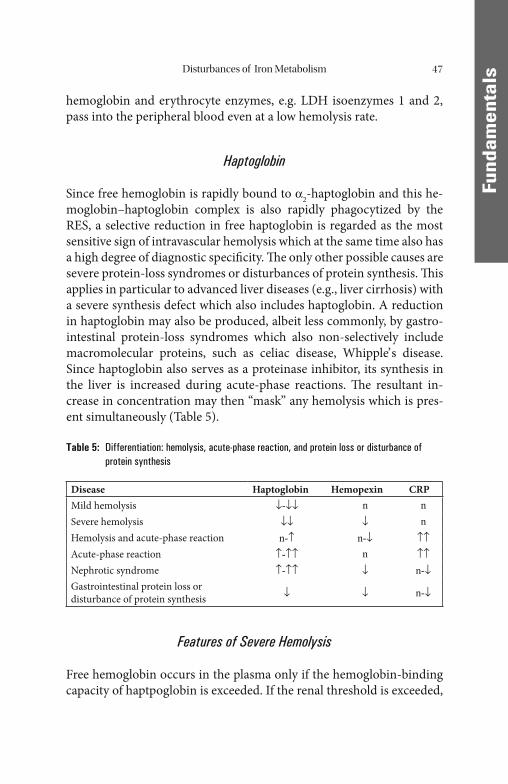
Disturbances of Iron Metabolism 47
FFund
amen
tals
hemoglobin and erythrocyte enzymes, e.g. LDH isoenzymes 1 and 2, pass into the peripheral blood even at a low hemolysis rate.
Haptoglobin
Since free hemoglobin is rapidly bound to α2-haptoglobin and this he-moglobin–haptoglobin complex is also rapidly phagocytized by the RES, a selective reduction in free haptoglobin is regarded as the most sensitive sign of intravascular hemolysis which at the same time also has a high degree of diagnostic specifi city. Th e only other possible causes are severe protein-loss syndromes or disturbances of protein synthesis. Th is applies in particular to advanced liver diseases (e.g., liver cirrhosis) with a severe synthesis defect which also includes haptoglobin. A reduction in haptoglobin may also be produced, albeit less commonly, by gastro-intestinal protein-loss syndromes which also non-selectively include macromolecular proteins, such as celiac disease, Whipple’ s disease. Since haptoglobin also serves as a proteinase inhibitor, its synthesis in the liver is increased during acute-phase reactions. Th e resultant in-crease in concentration may then “mask” any hemolysis which is pres-ent simultaneously (Table 5).
Table 5: Differentiation: hemolysis, acute-phase reaction, and protein loss or disturbance of protein synthesis
Disease Haptoglobin Hemopexin CRPMild hemolysis ↓-↓↓ n nSevere hemolysis ↓↓ ↓ nHemolysis and acute-phase reaction n-↑ n-↓ ↑↑Acute-phase reaction ↑-↑↑ n ↑↑Nephrotic syndrome ↑-↑↑ ↓ n-↓Gastrointestinal protein loss or disturbance of protein synthesis ↓ ↓ n-↓
Features of Severe Hemolysis
Free hemoglobin occurs in the plasma only if the hemoglobin-binding capacity of haptpoglobin is exceeded. If the renal threshold is exceeded,
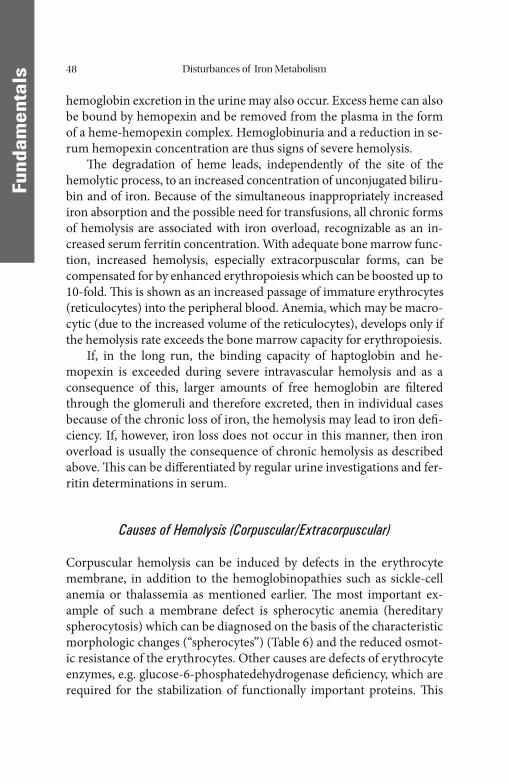
Disturbances of Iron Metabolism48
FFund
amen
tals
hemoglobin excretion in the urine may also occur. Excess heme can also be bound by hemopexin and be removed from the plasma in the form of a heme-hemopexin complex. Hemoglobinuria and a reduction in se-rum hemopexin concentration are thus signs of severe hemolysis.
Th e degradation of heme leads, independently of the site of the hemolytic process, to an increased concentration of unconjugated biliru-bin and of iron. Because of the simultaneous inappropriately increased iron absorption and the possible need for transfusions, all chronic forms of hemolysis are associated with iron overload, recognizable as an in-creased serum ferritin concentration. With adequate bone marrow func-tion, increased hemolysis, especially extracorpuscular forms, can be compensated for by enhanced erythropoiesis which can be boosted up to 10-fold. Th is is shown as an increased passage of immature erythrocytes (reticulocytes) into the peripheral blood. Anemia, which may be macro-cytic (due to the increased volume of the reticulocytes), develops only if the hemolysis rate exceeds the bone marrow capacity for erythropoiesis.
If, in the long run, the binding capacity of haptoglobin and he-mopexin is exceeded during severe intravascular hemolysis and as a consequence of this, larger amounts of free hemoglobin are fi ltered through the glomeruli and therefore excreted, then in individual cases because of the chronic loss of iron, the hemolysis may lead to iron defi -ciency. If, however, iron loss does not occur in this manner, then iron overload is usually the consequence of chronic hemolysis as described above. Th is can be diff erentiated by regular urine investigations and fer-ritin determinations in serum.
Causes of Hemolysis (Corpuscular/Extracorpuscular)
Corpuscular hemolysis can be induced by defects in the erythrocyte membrane, in addition to the hemoglobinopathies such as sickle-cell anemia or thalassemia as mentioned earlier. Th e most important ex-ample of such a membrane defect is spherocytic anemia (hereditary spherocytosis) which can be diagnosed on the basis of the characteristic morphologic changes (“spherocytes”) (Table 6) and the reduced osmot-ic resistance of the erythrocytes. Other causes are defects of erythrocyte enzymes, e.g. glucose-6-phosphatedehydrogenase defi ciency, which are required for the stabilization of functionally important proteins. Th is
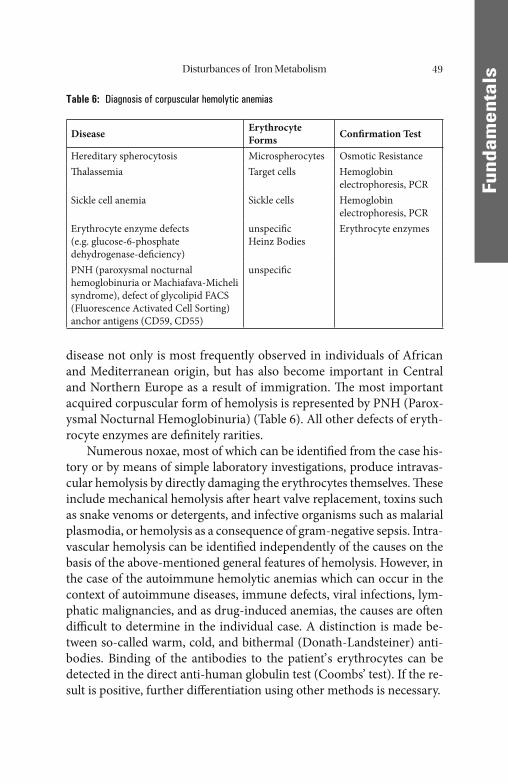
Disturbances of Iron Metabolism 49
FFund
amen
tals
disease not only is most frequently observed in individuals of African and Mediterranean origin, but has also become important in Central and Northern Europe as a result of immigration. Th e most important acquired corpuscular form of hemolysis is represented by PNH (Parox-ysmal Nocturnal Hemoglobinuria) (Table 6). All other defects of eryth-rocyte enzymes are defi nitely rarities.
Numerous noxae, most of which can be identifi ed from the case his-tory or by means of simple laboratory investigations, produce intravas-cular hemolysis by directly damaging the erythrocytes themselves. Th ese include mechanical hemolysis aft er heart valve replacement, toxins such as snake venoms or detergents, and infective organisms such as malarial plasmodia, or hemolysis as a consequence of gram-negative sepsis. Intra-vascular hemolysis can be identifi ed independently of the causes on the basis of the above-mentioned general features of hemolysis. However, in the case of the autoimmune hemolytic anemias which can occur in the context of autoimmune diseases, immune defects, viral infections, lym-phatic malignancies, and as drug-induced anemias, the causes are oft en diffi cult to determine in the individual case. A distinction is made be-tween so-called warm, cold, and bithermal (Donath-Landsteiner) anti-bodies. Binding of the antibodies to the patient’ s erythrocytes can be detected in the direct anti-human globulin test (Coombs’ test). If the re-sult is positive, further diff erentiation using other methods is necessary.
Table 6: Diagnosis of corpuscular hemolytic anemias
Disease Erythrocyte Forms Confi rmation Test
Hereditary spherocytosis Microspherocytes Osmotic ResistanceTh alassemia Target cells Hemoglobin
electrophoresis, PCRSickle cell anemia Sickle cells Hemoglobin
electrophoresis, PCRErythrocyte enzyme defects(e.g. glucose-6-phosphate dehydrogenase-defi ciency)
unspecifi cHeinz Bodies
Erythrocyte enzymes
PNH (paroxysmal nocturnal hemoglobinuria or Machiafava-Micheli syndrome), defect of glycolipid FACS (Fluorescence Activated Cell Sorting) anchor antigens (CD59, CD55)
unspecifi c
Cli
nica
l Asp
ects
Cli
nica
l Asp
ects
Diagnosis of Disturbances of Iron Metabolism
Iron Balance
Disturbances of iron metabolism are mainly due to disturbances in iron balance which, in turn, are mainly due to disturbances in the resorption of iron or iron losses. Th erefore, the uptake of iron occupies the key position in the iron metabolism as a whole.
Th e daily iron requirement depends on age and sex. It is increased in puberty and in pregnancy. Under physiologic conditions, the total iron pool is more or less constant in adults. Th e quantity of iron ab-sorbed is about 10% (1 mg) of the quantity consumed daily in the nor-mal diet, but this fraction can increase from 20 to 40% (2–4 mg) in conditions of iron defi ciency.
Physiologic loss of iron is low, and comparable to the quantity ab-sorbed. It takes place as a result of the shedding of intestinal epithelial cells and through excretion in bile, urine, and perspiration. Since the absorption and the loss of iron are limited under physiologic conditions, the quantity of storage iron can only be increased by massive supplies from outside the body. Th us, every transfusion of one liter of blood in-creases the quantity of storage iron in the body by about 250 mg.
Disturbances in iron absorption can be detected by an iron absorp-tion test. Aft er collecting a blood sample from a fasting patient to determine the baseline value for the serum iron concentration, approxi-mately 200 mg of a bivalent iron preparation is administered. A second blood collection is performed aft er 3 hours. With normal iron absorp-tion, there should be an increase to 2–3 times the baseline value during the observation period.
A reduced or delayed rise indicates a disturbance of iron absorption. An increased rise is found in rare forms of iron defi ciency, and in pri-mary hemochromatosis [88].
Th e excess of iron that is not used for the synthesis of hemoglobin, myoglobin, or iron enzymes is stored in the depot proteins ferritin and hemosiderin.
Th e total iron content of the healthy human body is about 3.5–4 g in women and 4–5 g in men [66]. About 70% of this is stored in hemoglo-bin, 10% is contained in myoglobin and iron-containing and, 20% in the
M. Wick et al., Clinical Aspects and Laboratory - Iron Metabolism, Anemias© Springer-Verlag/Wien 2011
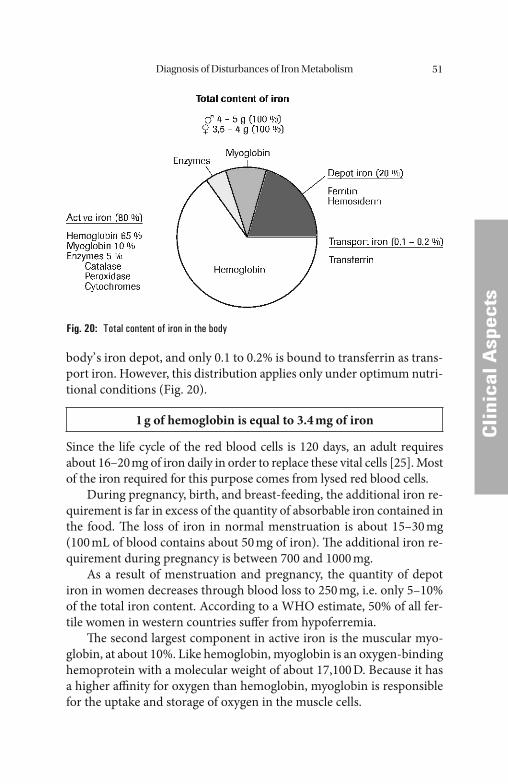
Diagnosis of Disturbances of Iron Metabolism 51
CCli
nica
l Asp
ects
body’ s iron depot, and only 0.1 to 0.2% is bound to transferrin as trans-port iron. However, this distribution applies only under optimum nutri-tional conditions (Fig. 20).
1 g of hemoglobin is equal to 3.4 mg of iron
Since the life cycle of the red blood cells is 120 days, an adult requires about 16–20 mg of iron daily in order to replace these vital cells [25]. Most of the iron required for this purpose comes from lysed red blood cells.
During pregnancy, birth, and breast-feeding, the additional iron re-quirement is far in excess of the quantity of absorbable iron contained in the food. Th e loss of iron in normal menstruation is about 15–30 mg (100 mL of blood contains about 50 mg of iron). Th e additional iron re-quirement during pregnancy is between 700 and 1000 mg.
As a result of menstruation and pregnancy, the quantity of depot iron in women decreases through blood loss to 250 mg, i.e. only 5–10% of the total iron content. According to a WHO estimate, 50% of all fer-tile women in western countries suff er from hypoferremia.
Th e second largest component in active iron is the muscular myo-globin, at about 10%. Like hemoglobin, myoglobin is an oxygen-binding hemoprotein with a molecular weight of about 17,100 D. Because it has a higher affi nity for oxygen than hemoglobin, myoglobin is responsible for the uptake and storage of oxygen in the muscle cells.
Fig. 20: Total content of iron in the body
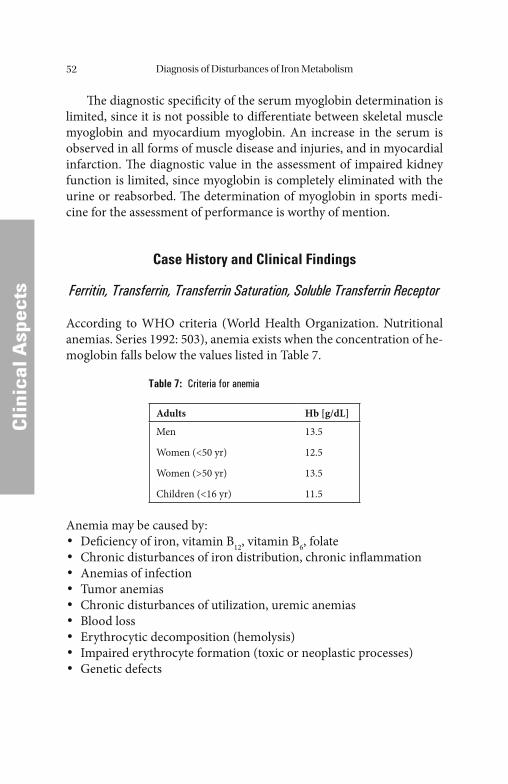
Diagnosis of Disturbances of Iron Metabolism52
CCli
nica
l Asp
ects
Th e diagnostic specifi city of the serum myoglobin determination is limited, since it is not possible to diff erentiate between skeletal muscle myoglobin and myocardium myoglobin. An increase in the serum is observed in all forms of muscle disease and injuries, and in myocardial infarction. Th e diagnostic value in the assessment of impaired kidney function is limited, since myoglobin is completely eliminated with the urine or reabsorbed. Th e determination of myoglobin in sports medi-cine for the assessment of performance is worthy of mention.
Case History and Clinical Findings
Ferritin, Transferrin, Transferrin Saturation, Soluble Transferrin Receptor
According to WHO criteria (World Health Organization. Nutritional anemias. Series 1992: 503), anemia exists when the concentration of he-moglobin falls below the values listed in Table 7.
Table 7: Criteria for anemia
Adults Hb [g/dL]
Men
Women (<50 yr)
Women (>50 yr)
Children (<16 yr)
13.5
12.5
13.5
11.5
Anemia may be caused by:• Defi ciency of iron, vitamin B12, vitamin B6, folate• Chronic disturbances of iron distribution, chronic infl ammation• Anemias of infection• Tumor anemias• Chronic disturbances of utilization, uremic anemias• Blood loss• Erythrocytic decomposition (hemolysis)• Impaired erythrocyte formation (toxic or neoplastic processes)• Genetic defects
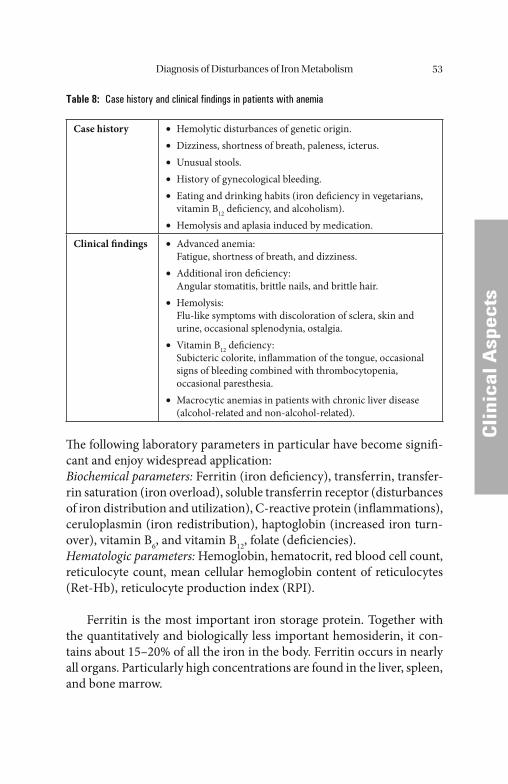
Diagnosis of Disturbances of Iron Metabolism 53
CCli
nica
l Asp
ects
Table 8: Case history and clinical findings in patients with anemia
Case history Hemolytic disturbances of genetic origin.• Dizziness, shortness of breath, paleness, icterus.• Unusual stools.• History of gynecological bleeding.• Eating and drinking habits (iron defi ciency in vegetarians, • vitamin B12 defi ciency, and alcoholism).Hemolysis and aplasia induced by medication.•
Clinical fi ndings Advanced anemia:• Fatigue, shortness of breath, and dizziness.
Additional iron defi ciency:• Angular stomatitis, brittle nails, and brittle hair.
Hemolysis:• Flu-like symptoms with discoloration of sclera, skin and
urine, occasional splenodynia, ostalgia.Vitamin B• 12 defi ciency:
Subicteric colorite, infl ammation of the tongue, occasional signs of bleeding combined with thrombocytopenia, occasional paresthesia. Macrocytic anemias in patients with chronic liver disease • (alcohol-related and non-alcohol-related).
Th e following laboratory parameters in particular have become signifi -cant and enjoy widespread application:Biochemical parameters: Ferritin (iron defi ciency), transferrin, transfer-rin saturation (iron overload), soluble transferrin receptor (disturbances of iron distribution and utilization), C-reactive protein (infl ammations), ceruloplasmin (iron redistribution), haptoglobin (increased iron turn-over), vitamin B6, and vitamin B12, folate (defi ciencies).Hematologic parameters: Hemoglobin, hematocrit, red blood cell count, reticulocyte count, mean cellular hemoglobin content of reticulocytes (Ret-Hb), reticulocyte production index (RPI).
Ferritin is the most important iron storage protein. Together with the quantitatively and biologically less important hemosiderin, it con-tains about 15–20% of all the iron in the body. Ferritin occurs in nearly all organs. Particularly high concentrations are found in the liver, spleen, and bone marrow.
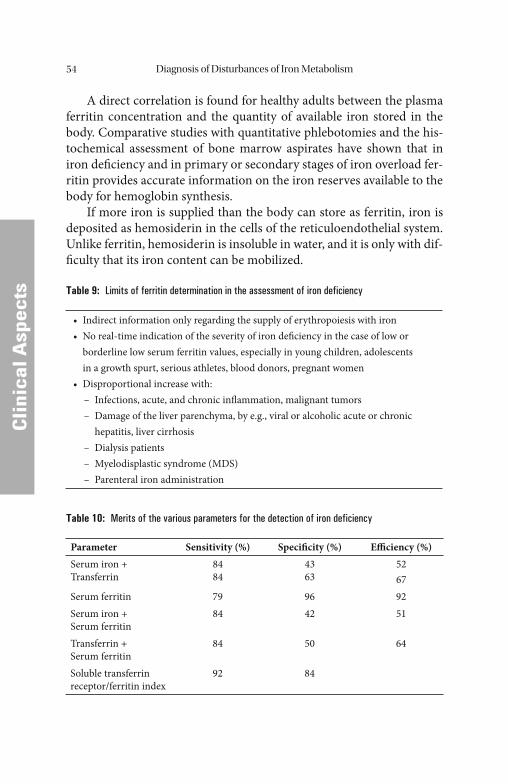
Diagnosis of Disturbances of Iron Metabolism54
CCli
nica
l Asp
ects
A direct correlation is found for healthy adults between the plasma ferritin concentration and the quantity of available iron stored in the body. Comparative studies with quantitative phlebotomies and the his-tochemical assessment of bone marrow aspirates have shown that in iron defi ciency and in primary or secondary stages of iron overload fer-ritin provides accurate information on the iron reserves available to the body for hemoglobin synthesis.
If more iron is supplied than the body can store as ferritin, iron is deposited as hemosiderin in the cells of the reticuloendothelial system. Unlike ferritin, hemosiderin is insoluble in water, and it is only with dif-fi culty that its iron content can be mobilized.
Table 9: Limits of ferritin determination in the assessment of iron deficiency
• Indirect information only regarding the supply of erythropoiesis with iron• No real-time indication of the severity of iron defi ciency in the case of low or
borderline low serum ferritin values, especially in young children, adolescents in a growth spurt, serious athletes, blood donors, pregnant women
• Disproportional increase with: – Infections, acute, and chronic infl ammation, malignant tumors – Damage of the liver parenchyma, by e.g., viral or alcoholic acute or chronic
hepatitis, liver cirrhosis – Dialysis patients – Myelodisplastic syndrome (MDS) – Parenteral iron administration
Table 10: Merits of the various parameters for the detection of iron deficiency
Parameter Sensitivity (%) Specifi city (%) Effi ciency (%)Serum iron +Transferrin
8484
4363
5267
Serum ferritin 79 96 92Serum iron +Serum ferritin
84 42 51
Transferrin +Serum ferritin
84 50 64
Soluble transferrin receptor/ferritin index
92 84
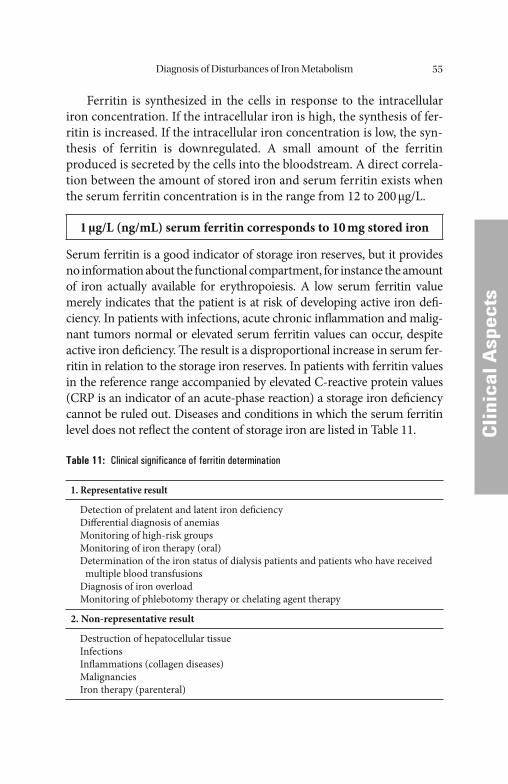
Diagnosis of Disturbances of Iron Metabolism 55
CCli
nica
l Asp
ects
Ferritin is synthesized in the cells in response to the intracellular iron concentration. If the intracellular iron is high, the synthesis of fer-ritin is increased. If the intracellular iron concentration is low, the syn-thesis of ferritin is downregulated. A small amount of the ferritin produced is secreted by the cells into the bloodstream. A direct correla-tion between the amount of stored iron and serum ferritin exists when the serum ferritin concentration is in the range from 12 to 200 μg/L.
1 μg/L (ng/mL) serum ferritin corresponds to 10 mg stored iron
Serum ferritin is a good indicator of storage iron reserves, but it provides no information about the functional compartment, for instance the amount of iron actually available for erythropoiesis. A low serum ferritin value merely indicates that the patient is at risk of developing active iron defi -ciency. In patients with infections, acute chronic infl ammation and malig-nant tumors normal or elevated serum ferritin values can occur, despite active iron defi ciency. Th e result is a disproportional increase in serum fer-ritin in relation to the storage iron reserves. In patients with ferritin values in the reference range accompanied by elevated C-reactive protein values (CRP is an indicator of an acute-phase reaction) a storage iron defi ciency cannot be ruled out. Diseases and conditions in which the serum ferritin level does not refl ect the content of storage iron are listed in Table 11.
Table 11: Clinical significance of ferritin determination
1. Representative result
Detection of prelatent and latent iron defi ciencyDiff erential diagnosis of anemiasMonitoring of high-risk groupsMonitoring of iron therapy (oral)Determination of the iron status of dialysis patients and patients who have received multiple blood transfusionsDiagnosis of iron overloadMonitoring of phlebotomy therapy or chelating agent therapy
2. Non-representative result
Destruction of hepatocellular tissueInfectionsInfl ammations (collagen diseases)MalignanciesIron therapy (parenteral)
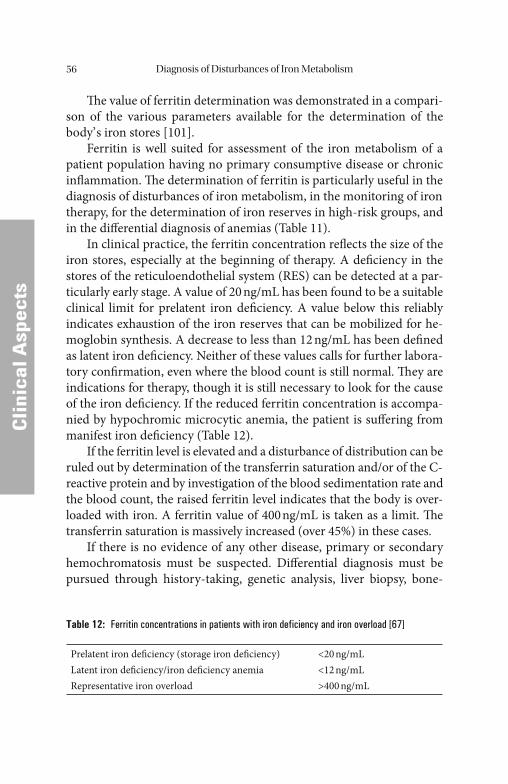
Diagnosis of Disturbances of Iron Metabolism56
CCli
nica
l Asp
ects
Th e value of ferritin determination was demonstrated in a compari-son of the various parameters available for the determination of the body’ s iron stores [101].
Ferritin is well suited for assessment of the iron metabolism of a patient population having no primary consumptive disease or chronic infl ammation. Th e determination of ferritin is particularly useful in the diagnosis of disturbances of iron metabolism, in the monitoring of iron therapy, for the determination of iron reserves in high-risk groups, and in the diff erential diagnosis of anemias (Table 11).
In clinical practice, the ferritin concentration refl ects the size of the iron stores, especially at the beginning of therapy. A defi ciency in the stores of the reticuloendothelial system (RES) can be detected at a par-ticularly early stage. A value of 20 ng/mL has been found to be a suitable clinical limit for prelatent iron defi ciency. A value below this reliably indicates exhaustion of the iron reserves that can be mobilized for he-moglobin synthesis. A decrease to less than 12 ng/mL has been defi ned as latent iron defi ciency. Neither of these values calls for further labora-tory confi rmation, even where the blood count is still normal. Th ey are indications for therapy, though it is still necessary to look for the cause of the iron defi ciency. If the reduced ferritin concentration is accompa-nied by hypochromic microcytic anemia, the patient is suff ering from manifest iron defi ciency (Table 12).
If the ferritin level is elevated and a disturbance of distribution can be ruled out by determination of the transferrin saturation and/or of the C-reactive protein and by investigation of the blood sedimentation rate and the blood count, the raised ferritin level indicates that the body is over-loaded with iron. A ferritin value of 400 ng/mL is taken as a limit. Th e transferrin saturation is massively increased (over 45%) in these cases.
If there is no evidence of any other disease, primary or secondary hemochromatosis must be suspected. Diff erential diagnosis must be pursued through history-taking, genetic analysis, liver biopsy, bone-
Table 12: Ferritin concentrations in patients with iron deficiency and iron overload [67]
Prelatent iron defi ciency (storage iron defi ciency) <20 ng/mLLatent iron defi ciency/iron defi ciency anemia <12 ng/mLRepresentative iron overload >400 ng/mL
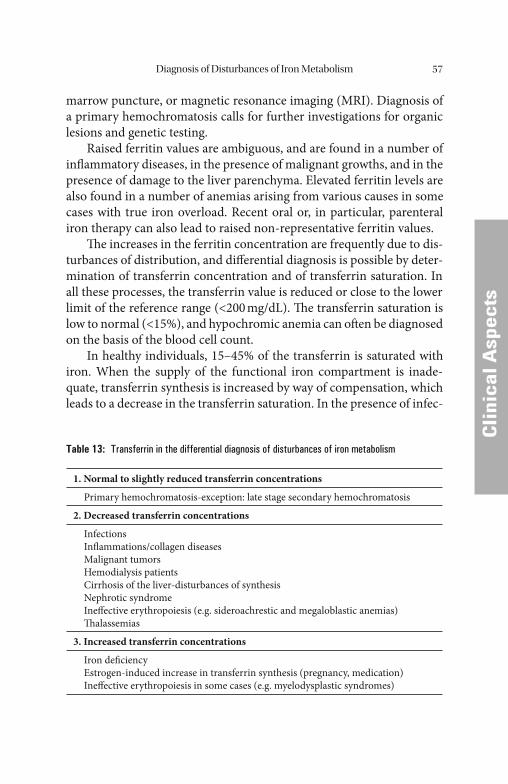
Diagnosis of Disturbances of Iron Metabolism 57
CCli
nica
l Asp
ects
marrow puncture, or magnetic resonance imaging (MRI). Diagnosis of a primary hemochromatosis calls for further investigations for organic lesions and genetic testing.
Raised ferritin values are ambiguous, and are found in a number of infl ammatory diseases, in the presence of malignant growths, and in the presence of damage to the liver parenchyma. Elevated ferritin levels are also found in a number of anemias arising from various causes in some cases with true iron overload. Recent oral or, in particular, parenteral iron therapy can also lead to raised non-representative ferritin values.
Th e increases in the ferritin concentration are frequently due to dis-turbances of distribution, and diff erential diagnosis is possible by deter-mination of transferrin concentration and of transferrin saturation. In all these processes, the transferrin value is reduced or close to the lower limit of the reference range (<200 mg/dL). Th e transferrin saturation is low to normal (<15%), and hypochromic anemia can oft en be diagnosed on the basis of the blood cell count.
In healthy individuals, 15–45% of the transferrin is saturated with iron. When the supply of the functional iron compartment is inade-quate, transferrin synthesis is increased by way of compensation, which leads to a decrease in the transferrin saturation. In the presence of infec-
Table 13: Transferrin in the differential diagnosis of disturbances of iron metabolism
1. Normal to slightly reduced transferrin concentrations
Primary hemochromatosis-exception: late stage secondary hemochromatosis
2. Decreased transferrin concentrations
InfectionsInfl ammations/collagen diseasesMalignant tumorsHemodialysis patientsCirrhosis of the liver-disturbances of synthesisNephrotic syndrome Ineff ective erythropoiesis (e.g. sideroachrestic and megaloblastic anemias)Th alassemias
3. Increased transferrin concentrations
Iron defi ciencyEstrogen-induced increase in transferrin synthesis (pregnancy, medication)Ineff ective erythropoiesis in some cases (e.g. myelodysplastic syndromes)

Diagnosis of Disturbances of Iron Metabolism58
CCli
nica
l Asp
ects
tions, acute or chronic infl ammation, and malignant tumors, transferrin synthesis is downregulated regardless of the status of active iron. For this reason, transferrin saturation is not an indicator of supply of the functional iron compartment and cannot be used in any anemia accom-panied by an increase in C-reactive protein. Conditions and diseases in which the transferrin saturation does not provide relevant results for diagnosing iron defi ciency are listed in Table 14.
Table 14: Disadvantages of the determination of transferrin saturation for assessing iron deficiency
Transferrin is an anti-acute-phase protein, its synthesis is reduced in the presence • of infections, infl ammation, and malignant tumors regardless of iron supply. Transferrin is released in the presence of acute hepatocellular damage, resulting in • serum transferrin concentration that is inadequately high. Pregnancy and estrogen therapy lead to an increase in transferrin synthesis, • independent of iron supply.Transferrin saturation is increased for hours aft er a meal.• Transferrin saturation does not drop below 15% until the iron stores are empty • and Hb is 2 g/dL below its baseline value.
Elevated transferrin values are found in the presence of iron defi ciency and particularly in pregnancy. Th e transferrin level may also be raised as a result of drug induction (administration of oral contraceptives). A de-tailed patient history is essential.
A number of rare anemias with hyperferritinemia and low transfer-rin levels belong to the group of sideroachrestic diseases and may be congenital hypochromic microcytic anemias (atransferrinemia, auto-transferrin antibodies, receptor defects, and porphyrias).
Increased ferritin concentrations together with low transferrin lev-els may also point to anemias with ineff ective erythropoiesis (thalas-semias, megaloblastic, sideroblastic, and dyserythropoietic anemias). Myelodysplastic syndromes, on the other hand, may initially be accom-panied by elevated values for both transferrin and ferritin.
Elevated ferritin concentrations unrelated to the iron stores are of-ten found in patients with malignancies. Possible reasons that have been suggested for this phenomenon are increased ferritin synthesis by neo-plastic cells, release of ferritin on decomposition of neoplastic tissue, and blockage of erythropoiesis as a result of chronic infl ammatory pro-
Diagnosis of Disturbances of Iron Metabolism 59
CCli
nica
l Asp
ects
cesses in and around the tumor tissue. Ferritin determinations on pa-tients with malignant tumors sometimes also record high concentrations of acidic isoferritins.
In the presence of infl ammations, infectious diseases, or malignant tumors, low transferrin concentrations and low transferrin saturation values point to disturbances of iron distribution. Low transferrin con-centrations may be caused either by losses (renal and intestinal) or by reduced synthesis (compensation and liver damage).
Low transferrin values found for patients with cirrhosis of the liver are usually due to the defective protein metabolism. In nephrotic syn-drome, so much transferrin is lost via the urine that low transferrin lev-els are the rule. Th e excretion of transferrin in the urine is also used to determine the selectivity of proteinuria.
Th e transferrin concentration and the transferrin saturation are valuable aids in the diff erential diagnosis of raised ferritin concentra-tions. True iron overload is accompanied by increased transferrin saturation. Non-representative ferritin elevation in patients with dis t-urbances of distribution is characterized by low transferrin saturation and low transferrin concentrations.
Soluble transferrin receptor (sTfR) arises from proteolysis of the intact protein on the cell surface, leading to monomers that can be measured in plasma and serum. Th e concentration of sTfR behaves proportionally to the number of intact TfR molecules on the plasma membrane of the cells. Th us, the concentration of sTfR in plasma or serum is an indirect meas ure of total TfR and refl ects either the cellular need for iron or the rate of erythropoiesis.
Measurement of sTfR is used to diagnose iron defi ciency in indi-viduals with chronic disease (infl ammatory diseases, infections, and ma-lignancies); many of them are anemic. Furthermore, the determination of sTfR is a valuable supplement to the determination of ferritin in indi-viduals known to have limited storage iron, e.g. young children, adoles-cents in a growth spurt, serious athletes, blood donors, and pregnants.
Th e level of sTfR is a summation of the TfR portion regulated by the intracellular iron concentration and a portion correlated to the amount of erythropoietic cells. Since the latter may be reduced in the presence of tumor anemias and anemias of chronic infl ammations the upper refer-ence range value of sTfR is not reached in about 50% of these cases, de-spite functional iron defi ciency.
Diagnosis of Disturbances of Iron Metabolism60
CCli
nica
l Asp
ects
Iron defi ciency, regardless of the cause, leads to an increased expres-sion of the transferrin receptor and, accordingly, to an increased con-centration of the sTfR. All forms of marked storage iron defi ciency can be detected with a great deal of certainty by a low plasma ferritin con-centration. Measuring of sTfR therefore does not off er an advantage in these cases. In cases with adequate iron reserves coupled with function-al iron defi ciency, i.e., disturbances of iron utilization, an increased con-centration of sTfR indicates inadequate supply of iron to erythropoiesis or inadequate iron mobilization [142].
Patients with malignant neoplasias and chronic infl ammation de-velop a defi ciency of transport and active iron accompanied by a simul-taneous relative overloading of the iron stores and a simultaneous relative inadequate supply of iron to the erythropoietic cells (as a consequence of reduced transferrin synthesis, among other things). Th e reduced avail-ability of iron is a protective mechanism as well as one of the major path-omechanisms in anemia of chronic disease (ACD). When the disturbance of iron distribution is pronounced, the presence of a hypochromic ane-mia can be assumed. It can be distinguished from iron defi ciency anemia by ferritin determination. In addition to reduced transferrin synthesis, an increased release of cytokines such as IFN-γ and TNF-α leads to an increased iron uptake in macrophages by means of an increased trans-ferrin receptor expression. In the presence of ACD and tumors, this in-creased iron storage in macrophages also withdraws a portion of the iron from transferrin, which is already reduced. A further cause for the devel-opment of anemia is the reduced erythropoietic activity. Th is is defi ni-tively not due to an erythropoietin defi ciency but rather a possible disturbed regulation induced by cytokines. In the majority of cases of disturbed iron distribution, an inadequate supply of iron to the erythro-poietic cells coupled with a reduced erythropoietic activity is present. Accordingly, the transferrin receptor expression is usually normal.
Disturbances of iron utilization and incorporation that simulate the clinical picture of an iron defi ciency anemia are also possible in the presence of normal iron reserves and normal iron distribution indicated by the presence of a normal ferritin concentration since they can also lead to a microcytic anemia. Since erythropoietin administration has replaced formerly common transfusions used to treat anemias, dialysis patients now represent the largest group of individuals with this type of anemia [61, 130].
Diagnosis of Disturbances of Iron Metabolism 61
CCli
nica
l Asp
ects
Th e ferritin concentration is generally a true refl ection of the iron reserves (an exception to this is when it is immediately preceded by iron replacement or in the presence of a secondary disorder involving iron distribution disturbances) and can therefore be used as a guideline for recognizing any depot iron defi ciency or for avoiding iron overload in iron replacement therapy. Transferrin saturation is currently the best indicator of the presence of mobilized transport iron and is inversely proportional to the iron requirement. Reduced transferrin saturation in dialysis patients is a sign of inadequate iron mobilization and therefore of a functional iron defi ciency requiring iron replacement. It is possible to use the concentration of sTfR as direct indicator of the iron require-ment. On no account can the sTfR replace the ferritin determination for assessing the iron reserves as it only refl ects the current erythropoietic activity and/or its iron requirement, which does not necessarily corre-late with the iron reserves.
All iron overload states can be detected using clinical chemistry methods based on the elevated plasma ferritin concentration, the simul-taneously elevated iron level and the increased transferrin saturation in the presence of transferrin synthesis that is usually reduced by way of compensation. Depending on the cause of iron overload, the transferrin receptor expression can be very diff erent depending on whether the erythropoiesis is increased or reduced. Accordingly, an elevated con-centration of the sTfR is also found in the presence of all hemolytic states with an erythropoietic activity that is increased by way of com-pensation. In patients with renal insuffi ciency (without erythropoietin therapy), a reduced transferrin receptor expression corresponding to a greatly reduced erythropoiesis is found. Erythropoiesis is not immedi-ately aff ected in the presence of hematochromatosis. Transferrin recep-tor expression can be normal or reduced [10, 38].
Laboratory Diagnostics of Suspected Disturbances of Iron Metabolism
Th e following steps are recommended in the diagnosis of disturbances or iron metabolism ([139], Fig. 21):• Blood count to identify an anemia. An anemia exists when the hemo-
globin concentration falls below the following values [67]:
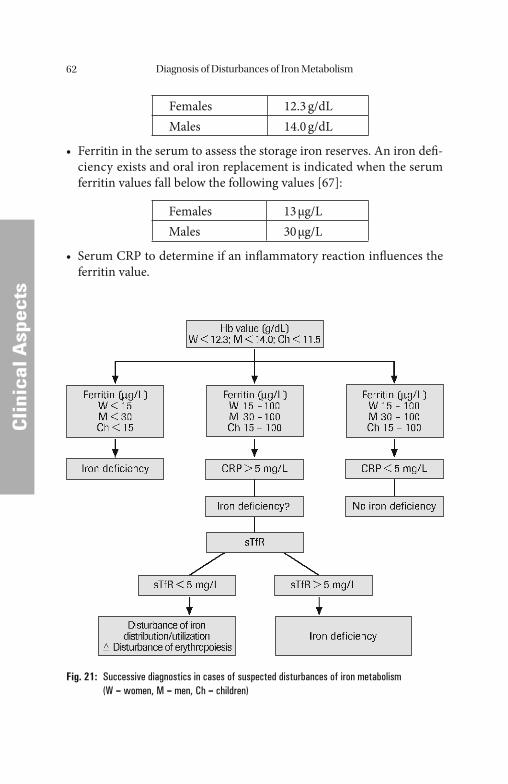
Diagnosis of Disturbances of Iron Metabolism62
CCli
nica
l Asp
ects
Females 12.3 g/dLMales 14.0 g/dL
• Ferritin in the serum to assess the storage iron reserves. An iron defi -ciency exists and oral iron replacement is indicated when the serum ferritin values fall below the following values [67]:
Females 13 μg/LMales 30 μg/L
• Serum CRP to determine if an infl ammatory reaction infl uences the ferritin value.
Fig. 21: Successive diagnostics in cases of suspected disturbances of iron metabolism (W = women, M = men, Ch = children)
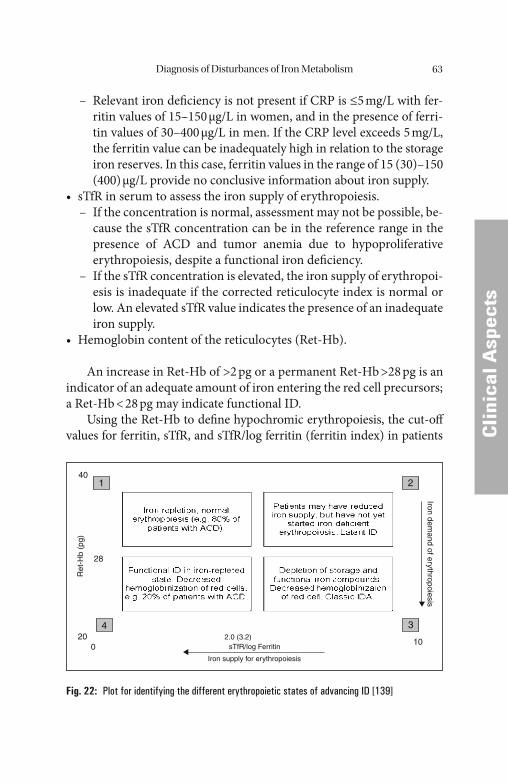
Diagnosis of Disturbances of Iron Metabolism 63
CCli
nica
l Asp
ects
– Relevant iron defi ciency is not present if CRP is ≤5 mg/L with fer-ritin values of 15–150 μg/L in women, and in the presence of ferri-tin values of 30–400 μg/L in men. If the CRP level exceeds 5 mg/L, the ferritin value can be inadequately high in relation to the storage iron reserves. In this case, ferritin values in the range of 15 (30)–150 (400) μg/L provide no conclusive information about iron supply.
• sTfR in serum to assess the iron supply of erythropoiesis. – If the concentration is normal, assessment may not be possible, be-
cause the sTfR concentration can be in the reference range in the presence of ACD and tumor anemia due to hypoproliferative erythropoiesis, despite a functional iron defi ciency.
– If the sTfR concentration is elevated, the iron supply of erythropoi-esis is inadequate if the corrected reticulocyte index is normal or low. An elevated sTfR value indicates the presence of an inadequate iron supply.
• Hemoglobin content of the reticulocytes (Ret-Hb).
An increase in Ret-Hb of >2 pg or a permanent Ret-Hb >28 pg is an indicator of an adequate amount of iron entering the red cell precursors; a Ret-Hb < 28 pg may indicate functional ID.
Using the Ret-Hb to defi ne hypochromic erythropoiesis, the cut-off values for ferritin, sTfR, and sTfR/log ferritin (ferritin index) in patients
1 2
34
Ret
-Hb
(pg)
Iron demand of erythropoiesis
sTfR/log Ferritin
Iron supply for erythropoiesis
2.0 (3.2)
40
28
200
10
Fig. 22: Plot for identifying the different erythropoietic states of advancing ID [139]
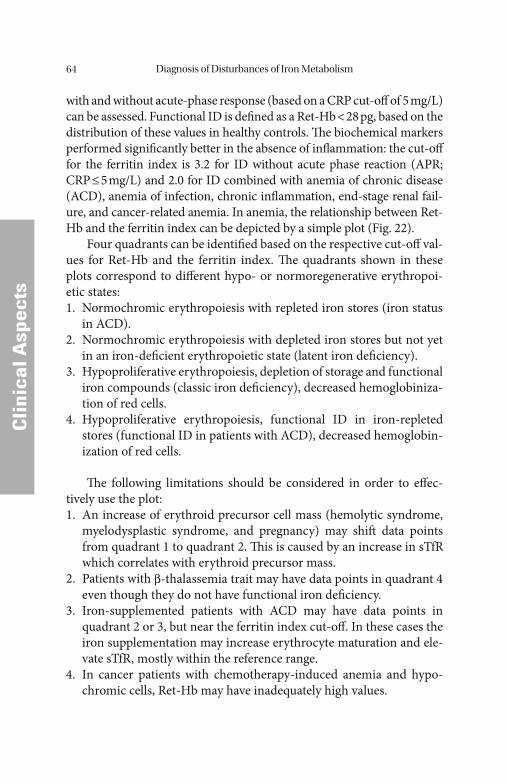
Diagnosis of Disturbances of Iron Metabolism64
CCli
nica
l Asp
ects
with and without acute-phase response (based on a CRP cut-off of 5 mg/L) can be assessed. Functional ID is defi ned as a Ret-Hb < 28 pg, based on the distribution of these values in healthy controls. Th e biochemical markers performed signifi cantly better in the absence of infl ammation: the cut-off for the ferritin index is 3.2 for ID without acute phase reaction (APR; CRP ≤ 5 mg/L) and 2.0 for ID combined with anemia of chronic disease (ACD), anemia of infection, chronic infl ammation, end-stage renal fail-ure, and cancer-related anemia. In anemia, the relationship between Ret-Hb and the ferritin index can be depicted by a simple plot (Fig. 22).
Four quadrants can be identifi ed based on the respective cut-off val-ues for Ret-Hb and the ferritin index. Th e quadrants shown in these plots correspond to diff erent hypo- or normoregenerative erythropoi-etic states:1. Normochromic erythropoiesis with repleted iron stores (iron status
in ACD).2. Normochromic erythropoiesis with depleted iron stores but not yet
in an iron-defi cient erythropoietic state (latent iron defi ciency).3. Hypoproliferative erythropoiesis, depletion of storage and functional
iron compounds (classic iron defi ciency), decreased hemoglobiniza-tion of red cells.
4. Hypoproliferative erythropoiesis, functional ID in iron-repleted stores (functional ID in patients with ACD), decreased hemoglobin-ization of red cells.
Th e following limitations should be considered in order to eff ec-tively use the plot:1. An increase of erythroid precursor cell mass (hemolytic syndrome,
myelodysplastic syndrome, and pregnancy) may shift data points from quadrant 1 to quadrant 2. Th is is caused by an increase in sTfR which correlates with erythroid precursor mass.
2. Patients with β-thalassemia trait may have data points in quadrant 4 even though they do not have functional iron defi ciency.
3. Iron-supplemented patients with ACD may have data points in quadrant 2 or 3, but near the ferritin index cut-off . In these cases the iron supplementation may increase erythrocyte maturation and ele-vate sTfR, mostly within the reference range.
4. In cancer patients with chemotherapy-induced anemia and hypo-chromic cells, Ret-Hb may have inadequately high values.
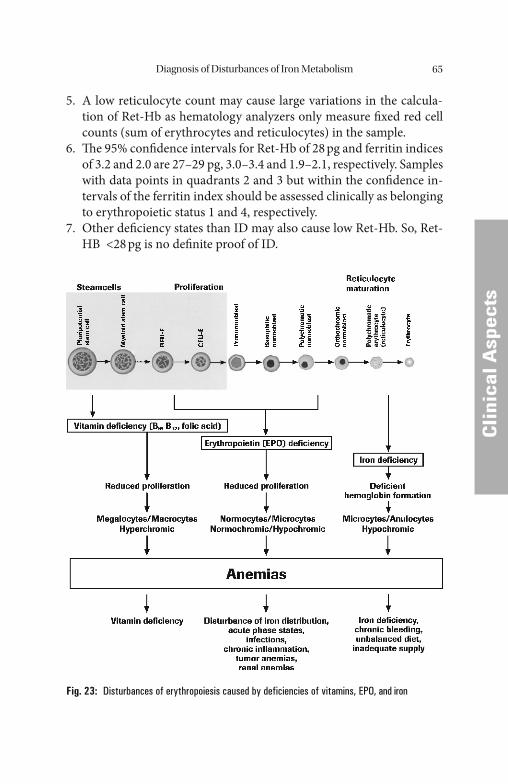
Diagnosis of Disturbances of Iron Metabolism 65
CCli
nica
l Asp
ects
5. A low reticulocyte count may cause large variations in the calcula-tion of Ret-Hb as hematology analyzers only measure fi xed red cell counts (sum of erythrocytes and reticulocytes) in the sample.
6. Th e 95% confi dence intervals for Ret-Hb of 28 pg and ferritin indices of 3.2 and 2.0 are 27–29 pg, 3.0–3.4 and 1.9–2.1, respectively. Samples with data points in quadrants 2 and 3 but within the confi dence in-tervals of the ferritin index should be assessed clinically as belonging to erythropoietic status 1 and 4, respectively.
7. Other defi ciency states than ID may also cause low Ret-Hb. So, Ret-HB <28 pg is no defi nite proof of ID.
Fig. 23: Disturbances of erythropoiesis caused by deficiencies of vitamins, EPO, and iron
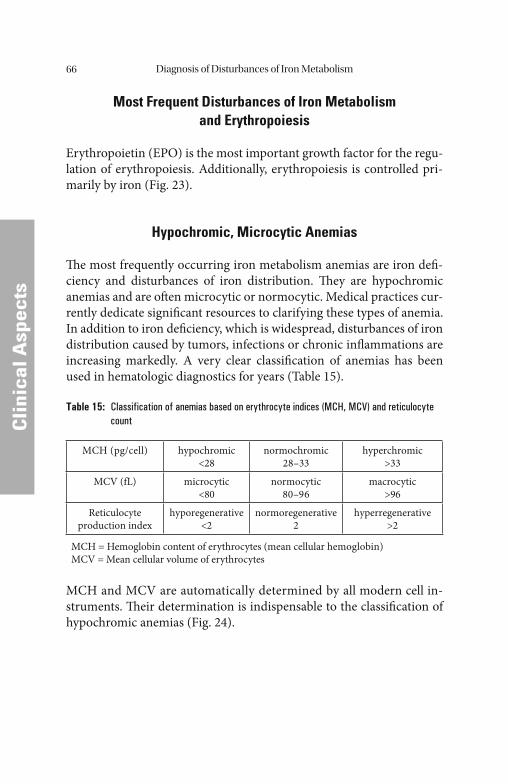
Diagnosis of Disturbances of Iron Metabolism66
CCli
nica
l Asp
ects
Most Frequent Disturbances of Iron Metabolism and Erythropoiesis
Erythropoietin (EPO) is the most important growth factor for the regu-lation of erythropoiesis. Additionally, erythropoiesis is controlled pri-marily by iron (Fig. 23).
Hypochromic, Microcytic Anemias
Th e most frequently occurring iron metabolism anemias are iron defi -ciency and disturbances of iron distribution. Th ey are hypochromic anemias and are oft en microcytic or normocytic. Medical practices cur-rently dedicate signifi cant resources to clarifying these types of anemia. In addition to iron defi ciency, which is widespread, disturbances of iron distribution caused by tumors, infections or chronic infl ammations are increasing markedly. A very clear classifi cation of anemias has been used in hematologic diagnostics for years (Table 15).
Table 15: Classification of anemias based on erythrocyte indices (MCH, MCV) and reticulocyte count
MCH (pg/cell) hypochromic<28
normochromic28–33
hyperchromic>33
MCV (fL) microcytic<80
normocytic80–96
macrocytic>96
Reticulocyte production index
hyporegenerative<2
normoregenerative2
hyperregenerative>2
MCH = Hemoglobin content of erythrocytes (mean cellular hemoglobin)MCV = Mean cellular volume of erythrocytes
MCH and MCV are automatically determined by all modern cell in-struments. Th eir determination is indispensable to the classifi cation of hypochromic anemias (Fig. 24).
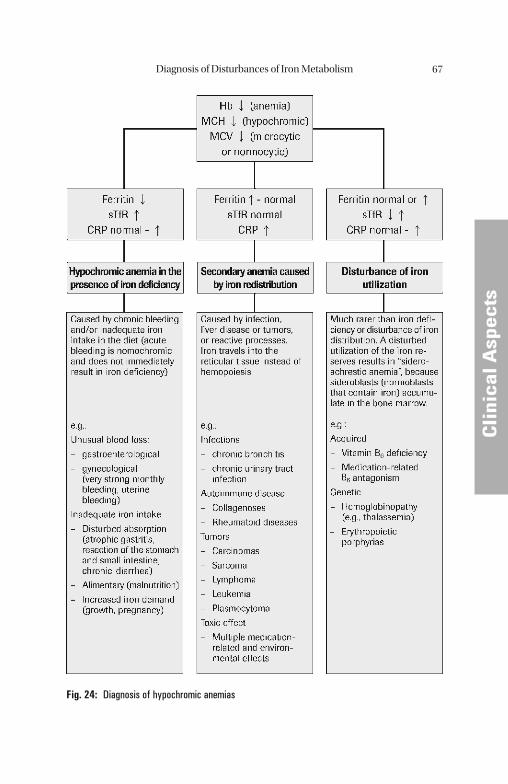
Diagnosis of Disturbances of Iron Metabolism 67
CCli
nica
l Asp
ects
Fig. 24: Diagnosis of hypochromic anemias
Cli
nica
l Asp
ects
Cli
nica
l Asp
ects
Iron Defi ciency – Diagnosis and Therapy
In the case of a negative iron balance, the iron stores are reduced fi rst; this can be seen from the measurement of ferritin. Th e concentration of active iron decreases only at a relatively late stage (as shown by the low-er transferrin saturation or the higher sTfR concentration).
Laboratory Diagnostis of Suspected Iron Defi ciency
Diagnosis of non-manifest iron defi ciency is practically impossible by clinical methods. Th e subjective condition of patients with iron defi -ciency does not reveal any defi nitely attributable changes. Th e familiar clinical symptoms such as pallor, weakness, loss of concentration, exer-tional dyspnea, and reduced resistance to infection appear only with the development of active iron anemia. Th e relatively specifi c changes in the skin and mucous membranes, atrophic glossitis and gastritis, cracks at the corners of the mouth, and atrophy of the hair and nails are late symptoms. An important observation is that iron defi ciency oft en accompanies serious, life-threatening conditions, and can therefore serve as an indicator of such diseases in case of blood loss.
According to the literature, up to 5% of children and adolescents, 10% of premenopausal women, and 1% of men have an iron defi ciency anemia. Approximately 15% of men and women over the age of 60 have iron defi ciency, as do 25–40% of nursing home patients. Intestinal blood loss due to tumors or parasites is the primary cause worldwide as com-pared to nutritive iron defi ciency. If the storage iron reserves are exhaust-ed, the transferrin saturation drops below 15% and the soluble transferrin receptor increases intensively. A decrease in the hemoglobin value usu-ally does not occur until 1–2 months later. In patients on oral iron ad-ministration, the increased sTfR and the decreased ferritin concentrations normalize within 2–4 weeks (<5 mg/L and >30 μg/L, respectively).
Depending on the pattern of the laboratory test results, it is possible to distinguish between prelatent, latent, and manifest iron defi ciencies. In prelatent iron defi ciency, the body’ s iron reserves are reduced. La-tent iron defi ciency is characterized by a reduced supply of iron for erythropoiesis. Th is gives way to manifest iron defi ciency, which is char-acterized by typical iron defi ciency anemia.
M. Wick et al., Clinical Aspects and Laboratory - Iron Metabolism, Anemias© Springer-Verlag/Wien 2011
Iron Defi ciency – Diagnosis and Th erapy 69
CCli
nica
l Asp
ects
Prelatent iron defi ciency, which is equivalent to storage iron defi -ciency, is characterized by a negative iron balance. Th e body’ s reaction is to increase the intestinal absorption of iron. Histochemically, the iron content of bone marrow and of liver tissue decreases. Th e concentration of the iron transport protein transferrin in the blood increases as a mea-sure of the increased intestinal absorption.
Th e consumption of storage iron is most easily detected by quantita-tive determination of the ferritin concentration, which typically falls to less than 20 ng/mL. Th e ferritin that can be detected in the circulating blood is directly related to the iron stores. Its determination has almost entirely replaced the determination of iron in bone marrow for the as-sessment of stocks of reserve iron.Th e determination of the soluble transferrin receptor (sTfR) is becoming increasingly important in the assessment of the erythropoietic activity [117].
With the consumption of reserve iron, or when the iron stores are completely empty, the replenishment of iron for erythropoiesis becomes negative. Th e total loss of storage iron is indicated by a de-crease in the ferritin concentration to less than 12 μg/L. An indication of the inadequate supply of iron for erythropoiesis is a decrease in the transferrin saturation to less than 15%; the sTfR values are above the normal range of >5 mg/L. As a morphologic criterion, the number of sideroblasts in the marrow falls to less than 10%. Th ere are no noticeable changes in the red blood count at this stage of latent iron defi ciency.
Th e laboratory results in the manifest stage are characterized by a fall in the ferritin concentration in the blood to less than 12 μg/L and a fall in the hemoglobin concentration to less than 12 g/dL. A morpho-logic eff ect of manifest iron defi ciency is that the erythrocytes become increasingly hypochromic and microcytic. Th e mean cell volume (MCV) decreases to less than 80 fL, the mean cellular hemoglobin (MCH) is less than 28 pg, and the mean cellular hemoglobin concen-tration (MCHC) may fall to less than 33 g/dL. Th e erythrocytes in the peripheral blood count are smaller than normal, and pale in the center. Th ese altered erythrocytes are known as anulocytes. Th e morphologic change in the blood count does not appear immediately, but only aft er the normochromic erythrocyte population has been replaced by the hypochromic microcytic erythrocytes in the course of the natural process of renewal. Iron defi ciency is by no means ruled out by
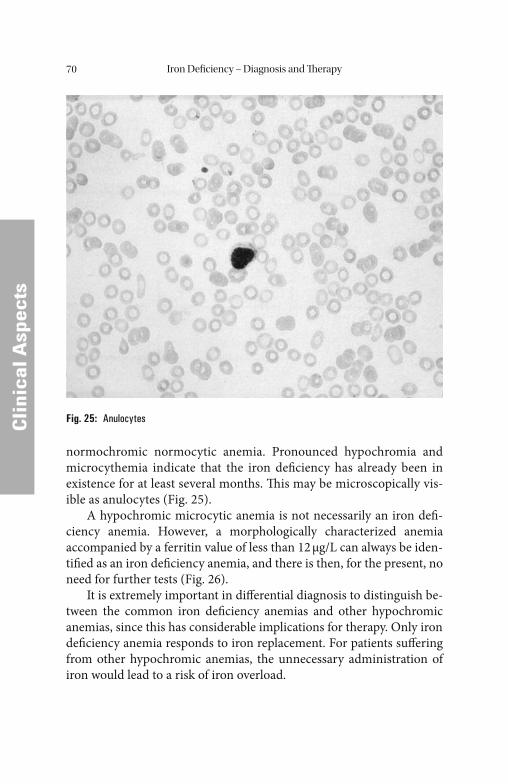
Iron Defi ciency – Diagnosis and Th erapy70
CCli
nica
l Asp
ects
normochromic normocytic anemia. Pronounced hypochromia and microcythemia indicate that the iron defi ciency has already been in existence for at least several months. Th is may be microscopically vis-ible as anulocytes (Fig. 25).
A hypochromic microcytic anemia is not necessarily an iron defi -ciency anemia. However, a morphologically characterized anemia accompanied by a ferritin value of less than 12 μg/L can always be iden-tifi ed as an iron defi ciency anemia, and there is then, for the present, no need for further tests (Fig. 26).
It is extremely important in diff erential diagnosis to distinguish be-tween the common iron defi ciency anemias and other hypochromic anemias, since this has considerable implications for therapy. Only iron defi ciency anemia responds to iron replacement. For patients suff ering from other hypochromic anemias, the unnecessary administration of iron would lead to a risk of iron overload.
Fig. 25: Anulocytes
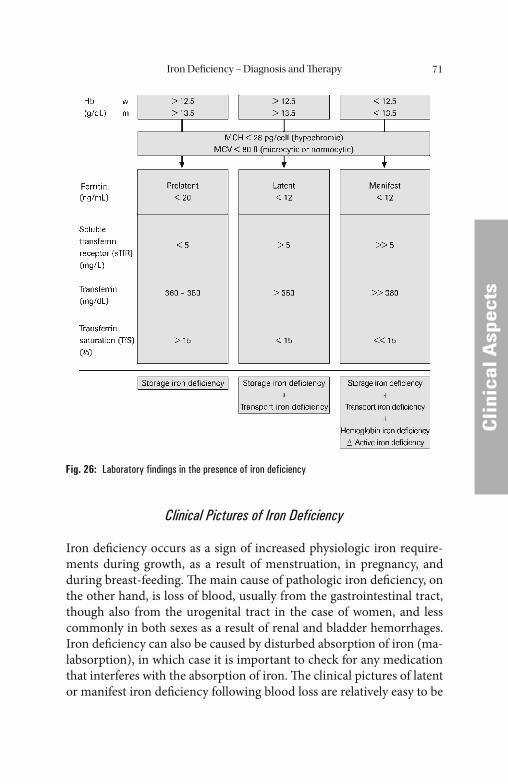
Iron Defi ciency – Diagnosis and Th erapy 71
CCli
nica
l Asp
ects
Clinical Pictures of Iron Deficiency
Iron defi ciency occurs as a sign of increased physiologic iron require-ments during growth, as a result of menstruation, in pregnancy, and during breast-feeding. Th e main cause of pathologic iron defi ciency, on the other hand, is loss of blood, usually from the gastrointestinal tract, though also from the urogenital tract in the case of women, and less commonly in both sexes as a result of renal and bladder hemorrhages. Iron defi ciency can also be caused by disturbed absorption of iron (ma-labsorption), in which case it is important to check for any medication that interferes with the absorption of iron. Th e clinical pictures of latent or manifest iron defi ciency following blood loss are relatively easy to be
Fig. 26: Laboratory findings in the presence of iron deficiency
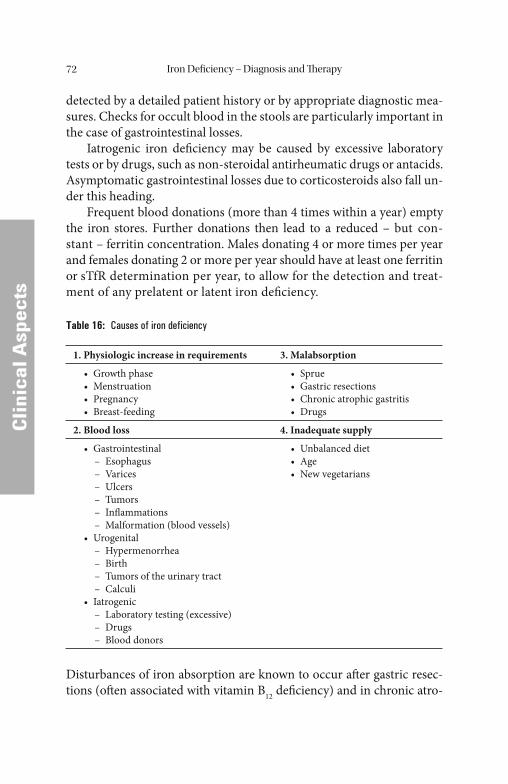
Iron Defi ciency – Diagnosis and Th erapy72
CCli
nica
l Asp
ects
detected by a detailed patient history or by appropriate diagnostic mea-sures. Checks for occult blood in the stools are particularly important in the case of gastrointestinal losses.
Iatrogenic iron defi ciency may be caused by excessive laboratory tests or by drugs, such as non-steroidal antirheumatic drugs or antacids. Asymptomatic gastrointestinal losses due to corticosteroids also fall un-der this heading.
Frequent blood donations (more than 4 times within a year) empty the iron stores. Further donations then lead to a reduced – but con-stant – ferritin concentration. Males donating 4 or more times per year and females donating 2 or more per year should have at least one ferritin or sTfR determination per year, to allow for the detection and treat-ment of any prelatent or latent iron defi ciency.
Table 16: Causes of iron deficiency
1. Physiologic increase in requirements 3. Malabsorption
• Growth phase• Menstruation• Pregnancy• Breast-feeding
• Sprue• Gastric resections• Chronic atrophic gastritis• Drugs
2. Blood loss 4. Inadequate supply
• Gastrointestinal – Esophagus – Varices – Ulcers – Tumors – Infl ammations – Malformation (blood vessels)• Urogenital – Hypermenorrhea – Birth – Tumors of the urinary tract – Calculi• Iatrogenic – Laboratory testing (excessive) – Drugs – Blood donors
• Unbalanced diet• Age• New vegetarians
Disturbances of iron absorption are known to occur aft er gastric resec-tions (oft en associated with vitamin B12 defi ciency) and in chronic atro-
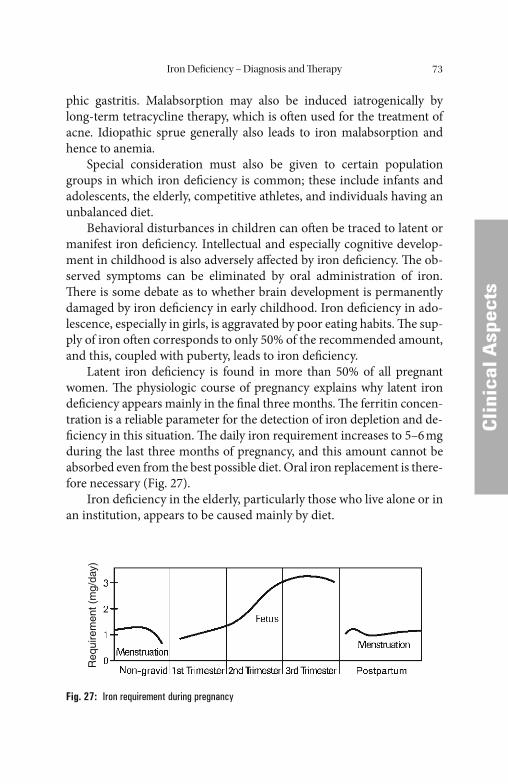
Iron Defi ciency – Diagnosis and Th erapy 73
CCli
nica
l Asp
ects
phic gastritis. Malabsorption may also be induced iatrogenically by long-term tetracycline therapy, which is oft en used for the treatment of acne. Idiopathic sprue generally also leads to iron malabsorption and hence to anemia.
Special consideration must also be given to certain population groups in which iron defi ciency is common; these include infants and adolescents, the elderly, competitive athletes, and individuals having an unbalanced diet.
Behavioral disturbances in children can oft en be traced to latent or manifest iron defi ciency. Intellectual and especially cognitive develop-ment in childhood is also adversely aff ected by iron defi ciency. Th e ob-served symptoms can be eliminated by oral administration of iron. Th ere is some debate as to whether brain development is permanently damaged by iron defi ciency in early childhood. Iron defi ciency in ado-lescence, especially in girls, is aggravated by poor eating habits. Th e sup-ply of iron oft en corresponds to only 50% of the recommended amount, and this, coupled with puberty, leads to iron defi ciency.
Latent iron defi ciency is found in more than 50% of all pregnant women. Th e physiologic course of pregnancy explains why latent iron defi ciency appears mainly in the fi nal three months. Th e ferritin concen-tration is a reliable parameter for the detection of iron depletion and de-fi ciency in this situation. Th e daily iron requirement increases to 5–6 mg during the last three months of pregnancy, and this amount cannot be absorbed even from the best possible diet. Oral iron replacement is there-fore necessary (Fig. 27).
Iron defi ciency in the elderly, particularly those who live alone or in an institution, appears to be caused mainly by diet.
Req
uire
men
t (m
g/da
y)
Fig. 27: Iron requirement during pregnancy
Iron Defi ciency – Diagnosis and Th erapy74
Cli
nica
l Asp
ects
Cli
nica
l Asp
ects
Special note should be given to iron defi ciency in athletes of both sexes who take part in endurance sports. Iron defi ciency in runners is mainly due to gastrointestinal losses aft er long-distance running. Latent iron defi ciency has also been found in long-distance swimmers. In en-durance sports, hemolysis apparently is an additional factor.
Extremely unbalanced diets have recently attracted considerable numbers of adherents. Iron defi ciency anemia develops here mainly if the diet has an extremely high content of indigestible roughage [25].
Oral Administration of Iron
Oral replacement is always indicated in iron defi ciency, which cannot be cured by dietary iron. In spite of various pharmaceutical formulations, the tolerability of oral iron preparations varies a great deal, so that its administration has to be monitored very carefully with regard to patient compliance.
When iron defi ciency is present, the absorption of iron is upregu-lated depending on the iron defi cit. A bioavailability of 80–97% is achieved in the stomach and the proximal duodenum, but this requires that iron be supplied in an aqueous solution or released rapidly from the administered preparation. If iron (ferroglycine sulfate) is administered in enteric-coated pellets, about 83% of it is absorbed. If the iron reserves are depleted, this portion can increase to 95% provided that iron is fully released [68]. A slow release of iron reduces absorption and, therefore, the bioavailability by about one-third, to approximately 60%. Iron(III) complexes administered orally are barely bioavailable and are therefore ineffi cient. Th e cause of the poor bioavailability lies in the fact that, in the case of iron(III) compounds, complete hydrolysis takes place at pH levels of just 2–4 and polymerization takes place in the small intestine at pH 7–pH 8, forming insoluble and non-absorbable polynuclear iron(III)-hydroxide complexes which, due to their high molecular weight, cannot be absorbed. Th is reduces the bioavailability to less than 30%.
Th e bioavailability of oral iron preparations is improved by ingesting it on an empty stomach. Th e simultaneous consumption of tea, coff ee or dairy products in particular reduces the absorption of iron, as demon-strated in absorption studies with ferrous ascorbate solution. In the fast-ing state, about 10% was absorbed, although only about 1% was absorbed
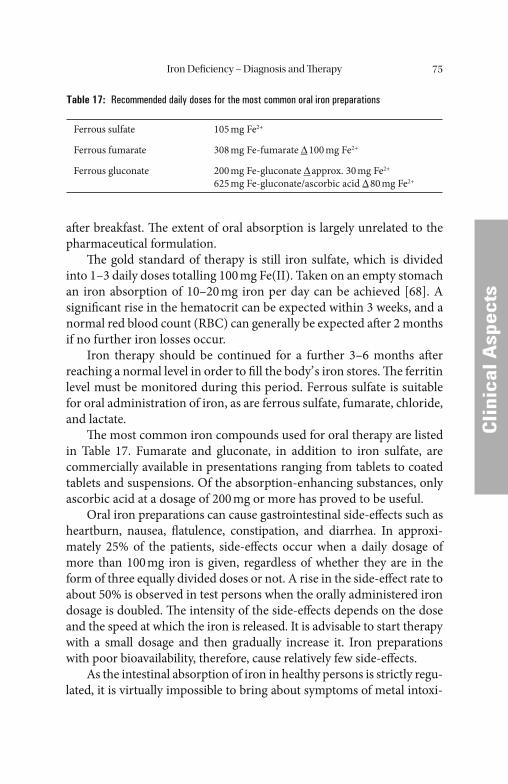
Iron Defi ciency – Diagnosis and Th erapy 75
CCli
nica
l Asp
ects
aft er breakfast. Th e extent of oral absorption is largely unrelated to the pharmaceutical formulation.
Th e gold standard of therapy is still iron sulfate, which is divided into 1–3 daily doses totalling 100 mg Fe(II). Taken on an empty stomach an iron absorption of 10–20 mg iron per day can be achieved [68]. A signifi cant rise in the hematocrit can be expected within 3 weeks, and a normal red blood count (RBC) can generally be expected aft er 2 months if no further iron losses occur.
Iron therapy should be continued for a further 3–6 months aft er reaching a normal level in order to fi ll the body’ s iron stores. Th e ferritin level must be monitored during this period. Ferrous sulfate is suitable for oral administration of iron, as are ferrous sulfate, fumarate, chloride, and lactate.
Th e most common iron compounds used for oral therapy are listed in Table 17. Fumarate and gluconate, in addition to iron sulfate, are commercially available in presentations ranging from tablets to coated tablets and suspensions. Of the absorption-enhancing substances, only ascorbic acid at a dosage of 200 mg or more has proved to be useful.
Oral iron preparations can cause gastrointestinal side-eff ects such as heartburn, nausea, fl atulence, constipation, and diarrhea. In approxi-mately 25% of the patients, side-eff ects occur when a daily dosage of more than 100 mg iron is given, regardless of whether they are in the form of three equally divided doses or not. A rise in the side-eff ect rate to about 50% is observed in test persons when the orally administered iron dosage is doubled. Th e intensity of the side-eff ects depends on the dose and the speed at which the iron is released. It is advisable to start therapy with a small dosage and then gradually increase it. Iron preparations with poor bioavailability, therefore, cause relatively few side- eff ects.
As the intestinal absorption of iron in healthy persons is strictly regu-lated, it is virtually impossible to bring about symptoms of metal intoxi-
Table 17: Recommended daily doses for the most common oral iron preparations
Ferrous sulfate
Ferrous fumarate
Ferrous gluconate
105 mg Fe2+
308 mg Fe-fumarate Δ 100 mg Fe2+
200 mg Fe-gluconate Δ approx. 30 mg Fe2+
625 mg Fe-gluconate/ascorbic acid Δ 80 mg Fe2+
Iron Defi ciency – Diagnosis and Th erapy76
Cli
nica
l Asp
ects
Cli
nica
l Asp
ects
cation by excessive oral administration of iron to adults. Should this nevertheless occur, then hemochromatosis should be looked for. Fatali-ties in adults following oral administration of iron are generally the result of suicidal intent. Th e situation is diff erent in children, particularly small children. A dose of just 1 or 2 g of iron can be fatal. Symptoms of iron intoxication can occur within 30 min but may also not develop until sev-eral hours have elapsed. Th ey consist of cramp-like abdominal pain, diar-rhea, and vomiting of brown or bloody-stained gastric juice. Th e patients become pale or cyanotic, tired, confused, show incipient hyperventila-tion as a result of metabolic acidosis and die of cardiovascular failure.
In uncomplicated iron defi ciency, hemoglobin or ferritin values in-crease 2–4 weeks aft er the start of iron therapy. sTfR reaches a normal level within 2 weeks. Th e sTfR concentration usually normalizes when ferritin levels >13 (females) or >30 μg/L (males) are reached.
In complicated iron defi ciency (infection, infl ammation, and malig-nant tumor), an elevated sTfR concentration decreases as well aft er suc-cessful oral iron therapy. As the ferritin concentration can be normal or increased in the presence of tumor anemia or ACD despite inadequate iron supply for erythropoiesis, the drop in sTfR concentration alone is an indicator that an oral iron therapy is successful.
Parenteral Administration of Iron
Th e indications for i.v. iron administration are:• poor iron absorption• gastrointestinal disorders• the inability to mobilize adequately large iron stores already present
(renal insuffi ciency)• intolerance of oral iron administration
Before administering iron parenterally, it is advisable to carry out an approximate calculation of the iron requirement and to administer it taking the iron reserves into account (Tables 18, 19).
Of the preparations available (iron saccharate, iron gluconate, iron dextran, and ferric carboxymaltose), iron saccharate has proved to be the most popular in Europe for parenteral administration. Th e iron sac-charate complex has the advantage that it is not fi ltered through the
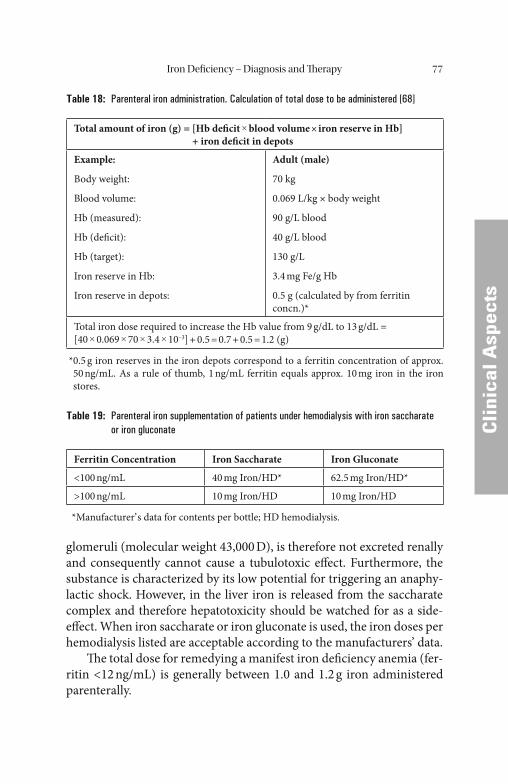
Iron Defi ciency – Diagnosis and Th erapy 77
CCli
nica
l Asp
ects
glomeruli (molecular weight 43,000 D), is therefore not excreted renally and consequently cannot cause a tubulotoxic eff ect. Furthermore, the substance is characterized by its low potential for triggering an anaphy-lactic shock. However, in the liver iron is released from the saccharate complex and therefore hepatotoxicity should be watched for as a side-eff ect. When iron saccharate or iron gluconate is used, the iron doses per hemodialysis listed are acceptable according to the manufacturers’ data.
Th e total dose for remedying a manifest iron defi ciency anemia (fer-ritin <12 ng/mL) is generally between 1.0 and 1.2 g iron administered parenterally.
Table 18: Parenteral iron administration. Calculation of total dose to be administered [68]
Total amount of iron (g) = [Hb defi cit × blood volume × iron reserve in Hb] + iron defi cit in depots
Example:
Body weight:
Blood volume:
Hb (measured):
Hb (defi cit):
Hb (target):
Iron reserve in Hb:
Iron reserve in depots:
Adult (male)
70 kg
0.069 L/kg × body weight
90 g/L blood
40 g/L blood
130 g/L
3.4 mg Fe/g Hb
0.5 g (calculated by from ferritin concn.)*
Total iron dose required to increase the Hb value from 9 g/dL to 13 g/dL =[40 × 0.069 × 70 × 3.4 × 10–3] + 0.5 = 0.7 + 0.5 = 1.2 (g)
* 0.5 g iron reserves in the iron depots correspond to a ferritin concentration of approx. 50 ng/mL. As a rule of thumb, 1 ng/mL ferritin equals approx. 10 mg iron in the iron stores.
Table 19: Parenteral iron supplementation of patients under hemodialysis with iron saccharate or iron gluconate
Ferritin Concentration Iron Saccharate Iron Gluconate
<100 ng/mL 40 mg Iron/HD* 62.5 mg Iron/HD*
>100 ng/mL 10 mg Iron/HD 10 mg Iron/HD
*Manufacturer’ s data for contents per bottle; HD hemodialysis.
Iron Defi ciency – Diagnosis and Th erapy78
CCli
nica
l Asp
ects
Megaloblastic and macrocytic anemias as well as iron distribution disturbances, with or without iron defi ciency, require more complex therapy.
Side-Effects and Hazards of Parenteral Iron Therapy
During intravenous administration, intolerance reactions (immediately during or aft er intravenous administration) can occur. Undesired long-term side-eff ects in various systems of the body have also been de-scribed. Accordingly, intravenous iron therapy should only be carried out with strict adherence to the indications.
Immediate reactions include malaise, fever, acute generalized lymph adenopathy, joint pains, urticaria, and occasionally exacerbation of symptoms in patients with rheumatoid arthritis.
Th ese fairly harmless but unpleasant adverse reactions diff er from the rare but feared anaphylactic reactions which can be fatal despite im-mediate therapy. Such reactions with fatal outcome have been reported occasionally particularly for iron dextran. Th ese occurrences necessitate very strict indications for i.v. therapy [31].
Th ere is confi rmed evidence that infections, cardiovascular diseases, and carcinogenesis can be infl uenced by the intravenous administration of iron.
Th ere is a close relationship between the availability of iron and the virulence of bacterial infections. Th is can be explained by the fact that iron is a precondition for the multiplication of bacteria in the infected body. Excessive iron can therefore increase the risk of infection. It has al-ready been shown in human and animal studies that the intravenous ad-ministration of iron during infection causes deterioration of the clinical picture. It has in the meantime been shown that hydroxyl radicals, which are formed during iron therapy, are responsible for the negative eff ects of iron. In other words, iron defi ciency hinders not only bacterial growth but also adequate defense against infection in the aff ected organism. Particu-larly in dialysis patients or patients with end-stage renal disease, intrave-nous iron therapy can negatively infl uence not only the activity of the phagocytes, but also that of the T- and B-lymphocytes [110].
In patients with malignoma, iron therapy is clearly indicated when iron defi ciency exists. However, these patients frequently suff er from ACD in which it is known that functional iron is depressed even though
Iron Defi ciency – Diagnosis and Th erapy 79
CCli
nica
l Asp
ects
the iron reserves are in the normal or elevated range. Administration of iron when not indicated cannot only have a detrimental eff ect on various organ systems of the sick person, but may also contribute to increased proliferation of neoplastic cells. Various studies have demon-strated that high transferrin saturation is associated with an elevated risk of carcinoma in general and of cancer of the lungs and colon in particular [93]. In a study comparing the relative cancer risk in blood donors and non-donors, there was a signifi cant increase in the relative risk of non-donors for developing carcinoma [82].
Th e hypothesis that iron depletion has a protective action against coro- nary heart disease was advanced as early as 1996 [135] to explain the stri king diff erence between the genders regarding the incidence of coronary heart disease. However, it is still a controversial point of discussion if iron plays a role in the pathogenesis of cardiovascular disease and atherosclerosis.
Ascherio et al. has published a report stating that reduced levels of depot iron do not prevent the risk of coronary disease [8]. Th e same author reports that an increased dietary intake of hemoglobin iron in men leads to an increased risk of coronary disease even when choles-terol and fat intake are included in the risk assessment [9]. Kiechl et al. observed that serum ferritin values above 50 μg/L lead to an increase in atherosclerosis of the carotids in both men and women [81]. Corti et al. [40] reported that the mortality risk and the risk of coronary heart dis-ease increase with low iron levels in individuals over 70 years of age. In dialysis patients it was found that intravenous iron in combination with erythropoietin in dialysis patients increases the cardiovascular risk and, therefore, mortality [21]. Other publications, however, failed to demon-strate signifi cant associations between serum ferritin, transferrin or di-etary iron and the developmental stage of an atherosclerosis [54].
Th e observations supporting the promotion of atherogenesis during intravenous iron therapy led to considerations on the simultaneous use of erythropoietin and desferrioxamine in order to mobilize the iron de-pots and thus make intravenous administration of iron unnecessary. Th e diffi culty associated with this therapy concept lies in the fact that the mobilization of depot iron cannot be predicted.
In the light of the aspects discussed here, namely the infl uence of iron on infectious disease, carcinogenesis and the development of ath-erosclerosis, it seems that stored iron is toxic. Every form of iron therapy therefore requires careful monitoring. Th e therapeutic goal is the achievement of normal values for hematocrit and hemoglobin.
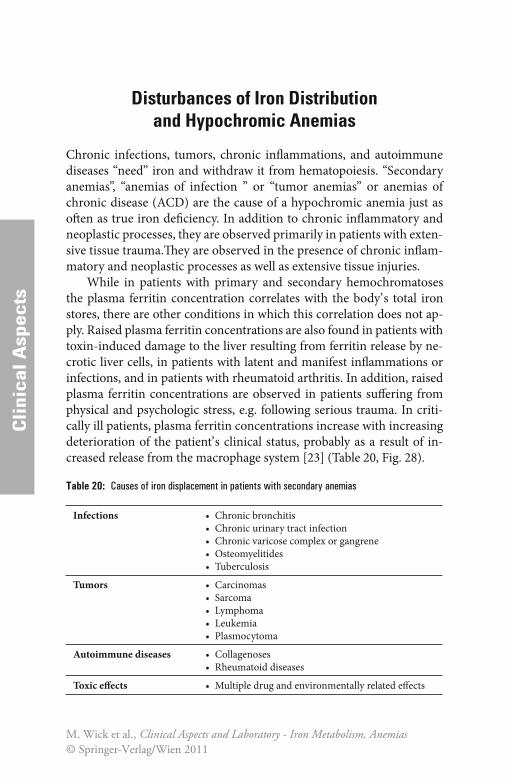
Cli
nica
l Asp
ects
Cli
nica
l Asp
ects
Disturbances of Iron Distribution and Hypochromic Anemias
Chronic infections, tumors, chronic infl ammations, and autoimmune diseases “need” iron and withdraw it from hematopoiesis. “Secondary anemias”, “anemias of infection ” or “tumor anemias” or anemias of chronic disease (ACD) are the cause of a hypochromic anemia just as oft en as true iron defi ciency. In addition to chronic infl ammatory and neoplastic processes, they are observed primarily in patients with exten-sive tissue trauma.Th ey are observed in the presence of chronic infl am-matory and neoplastic processes as well as extensive tissue injuries.
While in patients with primary and secondary hemochromatoses the plasma ferritin concentration correlates with the body’ s total iron stores, there are other conditions in which this correlation does not ap-ply. Raised plasma ferritin concentrations are also found in patients with toxin-induced damage to the liver resulting from ferritin release by ne-crotic liver cells, in patients with latent and manifest infl ammations or infections, and in patients with rheumatoid arthritis. In addition, raised plasma ferritin concentrations are observed in patients suff ering from physical and psychologic stress, e.g. following serious trauma. In criti-cally ill patients, plasma ferritin concentrations increase with increasing deterioration of the patient’ s clinical status, probably as a result of in-creased release from the macrophage system [23] (Table 20, Fig. 28).
Table 20: Causes of iron displacement in patients with secondary anemias
Infections • Chronic bronchitis• Chronic urinary tract infection• Chronic varicose complex or gangrene• Osteomyelitides• Tuberculosis
Tumors • Carcinomas• Sarcoma• Lymphoma• Leukemia• Plasmocytoma
Autoimmune diseases • Collagenoses• Rheumatoid diseases
Toxic eff ects • Multiple drug and environmentally related eff ects
M. Wick et al., Clinical Aspects and Laboratory - Iron Metabolism, Anemias© Springer-Verlag/Wien 2011
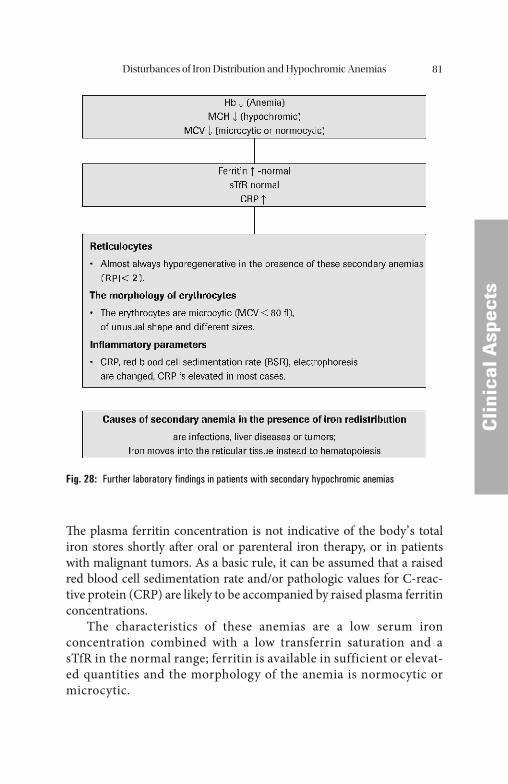
Disturbances of Iron Distribution and Hypochromic Anemias 81
CCli
nica
l Asp
ects
Th e plasma ferritin concentration is not indicative of the body’ s total iron stores shortly aft er oral or parenteral iron therapy, or in patients with malignant tumors. As a basic rule, it can be assumed that a raised red blood cell sedimentation rate and/or pathologic values for C-reac-tive protein (CRP) are likely to be accompanied by raised plasma ferritin concentrations.
The characteristics of these anemias are a low serum iron concentration combined with a low transferrin saturation and a sTfR in the normal range; ferritin is available in sufficient or elevat-ed quantities and the morphology of the anemia is normocytic or microcytic.
Fig. 28: Further laboratory findings in patients with secondary hypochromic anemias
Disturbances of Iron Distribution and Hypochromic Anemias82
CCli
nica
l Asp
ects
Iron and Cellular Immunity
Th e purpose of the immune system is to protect the organism from mi-croorganisms, foreign substances, harmful substances, toxins, and ma-lignant cells. A non-specifi c and a specifi c immune defense can be distinguished.
Th e non-specifi c immune system consists primarily of the acid mantle of the skin, intact epidermis, intact complement system, antimi-crobial enzyme systems, and non-specifi c mediators such as interferons and interleukins. Granulocytes and monocytes/macrophages act at the cellular level.
Th e most important non-specifi c defense is the infl ammatory reac-tion. As the fi rst step in an infl ammatory reaction, mediators (IL-1, IFN-γ) are released and increase the permeability of the capillary walls. Granulocytes and macrophages then enter the source of infl ammation in order to phagocytize the causative agent.
Th e purpose of the specifi c immune system is to expand the antigen by cloning when infl ammation occurs to enable a memory reaction in the future. T-lymphocytes formed in the thymus and B-lymphocytes formed in the bone marrow are specialized for this in particular. Th e maturation of T-lymphocytes takes place upon contact with dendritic cells and macrophages. Th is maturation process in the IL-12/IFN-γ cy-tokine environment results in CD4+-THO cells and, fi nally, TH1 cells. Th e TH1 cells play a key role in the pathogenesis of disturbances of iron utilization in the presence of tumor anemias and anemias of infection, and chronic infl ammation (Fig. 29).
Dendritic cells (DC) are the most important cells of non-specifi c immunity in the body. T-cells are able to stimulate immature DC to a limited extent; they are fi nally induced to mature into dendritic cells when aff ected by the infl ammatory-acting cytokines TNF-c, IL-1, IL-6, LPS (lipopolysaccharide), bacteria, and viruses.
Only terminally mature dendritic cells (DC) that were stimulated by CD40/CD40 ligands are able to produce large amounts of IL-12. Th is cytokine, in turn, induces the diff erentiation of CD4+-THO cells in the direction of TH1 with the release of interferon. Interferon-γ stimulates the antimicrobial and proinfl ammatory activity of macrophages and helps further the activation of cytotoxic T-cells (cytotoxic T-lympho-cytes, CTL).
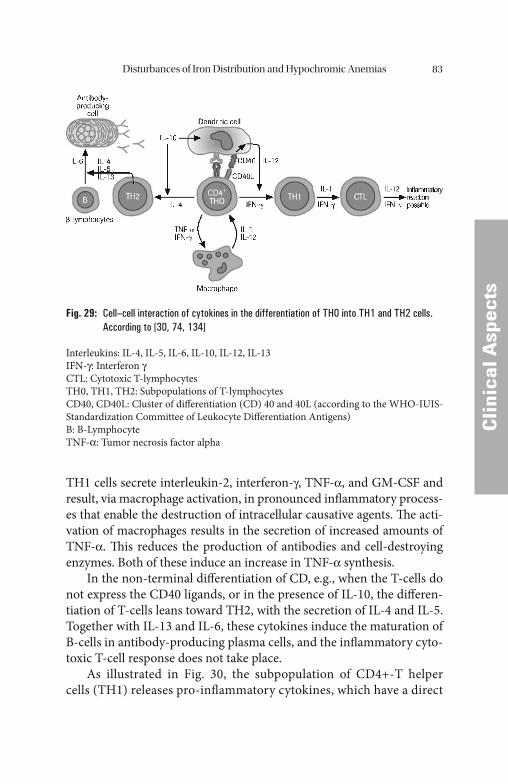
Disturbances of Iron Distribution and Hypochromic Anemias 83
CCli
nica
l Asp
ects
TH1 cells secrete interleukin-2, interferon-γ, TNF-α, and GM-CSF and result, via macrophage activation, in pronounced infl ammatory process-es that enable the destruction of intracellular causative agents. Th e acti-vation of macrophages results in the secretion of increased amounts of TNF-α. Th is reduces the production of antibodies and cell-destroying enzymes. Both of these induce an increase in TNF-α synthesis.
In the non-terminal diff erentiation of CD, e.g., when the T-cells do not express the CD40 ligands, or in the presence of IL-10, the diff eren-tiation of T-cells leans toward TH2, with the secretion of IL-4 and IL-5. Together with IL-13 and IL-6, these cytokines induce the maturation of B-cells in antibody-producing plasma cells, and the infl ammatory cyto-toxic T-cell response does not take place.
As illustrated in Fig. 30, the subpopulation of CD4+-T helper cells (TH1) releases pro-infl ammatory cytokines, which have a direct
Fig. 29: Cell–cell interaction of cytokines in the differentiation of TH0 into TH1 and TH2 cells. According to [30, 74, 134]
Interleukins: IL-4, IL-5, IL-6, IL-10, IL-12, IL-13IFN-γ: Interferon γCTL: Cytotoxic T-lymphocytesTH0, TH1, TH2: Subpopulations of T-lymphocytesCD40, CD40L: Cluster of diff erentiation (CD) 40 and 40L (according to the WHO-IUIS-Standardization Committee of Leukocyte Diff erentiation Antigens)B: B-LymphocyteTNF-α: Tumor necrosis factor alpha
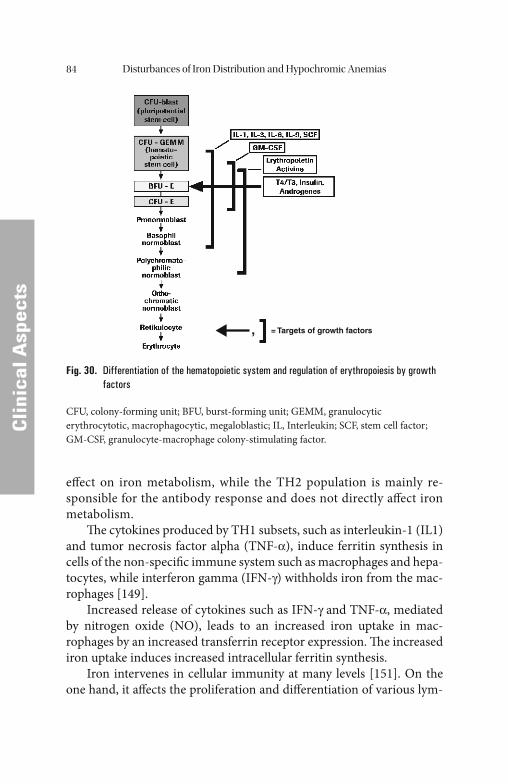
Disturbances of Iron Distribution and Hypochromic Anemias84
CCli
nica
l Asp
ects
eff ect on iron metabolism, while the TH2 population is mainly re-sponsible for the antibody response and does not directly aff ect iron metabolism.
Th e cytokines produced by TH1 subsets, such as interleukin-1 (IL1) and tumor necrosis factor alpha (TNF-α), induce ferritin synthesis in cells of the non-specifi c immune system such as macrophages and hepa-tocytes, while interferon gamma (IFN-γ) withholds iron from the mac-rophages [149].
Increased release of cytokines such as IFN-γ and TNF-α, mediated by nitrogen oxide (NO), leads to an increased iron uptake in mac-rophages by an increased transferrin receptor expression. Th e increased iron uptake induces increased intracellular ferritin synthesis.
Iron intervenes in cellular immunity at many levels [151]. On the one hand, it aff ects the proliferation and diff erentiation of various lym-
, = Targets of growth factors
Fig. 30. Differentiation of the hematopoietic system and regulation of erythropoiesis by growth factors
CFU, colony-forming unit; BFU, burst-forming unit; GEMM, granulocytic erythrocytotic, macrophagocytic, megaloblastic; IL, Interleukin; SCF, stem cell factor; GM-CSF, granulocyte-macrophage colony-stimulating factor.
Disturbances of Iron Distribution and Hypochromic Anemias 85
CCli
nica
l Asp
ects
phocyte subsets. On the other, it aff ects the immunopotential of mac-rophages [26, 43] by blocking the IFN-γ-transmitted immune response in macrophages. Iron-overloaded macrophages react more poorly to IFN-γ, produce more TNF-α, and form more NO.
Th e ceruloplasmin/haptoglobin system lowers NO and directly af-fects the proliferation of the precursor cells of erythropoiesis. Addition-ally, the resistance to viruses and other intracellular pathogens is weakened. Th e withdrawal of metabolically active iron and its deposit as storage iron strengthen the organism’ s immune response to IFN-stimu-lation [22, 103].
Th e regulatory antagonist of this stimulation mechanism lies in the decrease of the TH1-mediated immune reaction by IL-4 and IL-13. Th is is accomplished when these interleukins raise the intracellular concen-tration of iron by stimulating transferrin receptor expression. Th is is one of the basic mechanisms of the anti-infl ammatory and macrophage-inhibiting eff ect [103].
Activation of the Immunological and Inflammatory Systems
Anemias of chronical disease (ACD) are the result of a multifactorial process in which activation of the immune and infl ammatory systems and the iron metabolism in monocytes/macrophages play an important role (Fig. 31).
Th e anti-infl ammatory and anti-neoplastic defense mechanisms draw iron from microorganisms and neoplastic cells and store it in the reticuloendothelial system. Th is is complicated by the development of a normo-chromic or hypochromic anemia. Th ese types of anemia are caused by tumors, malignant growths, and chronic infl ammations. Due to various cytokines, erythropoiesis is compromised primarily at the CFU-E level in this process.
Erythropoietin (EPO) is the most important and specifi c erythro-poiesis-stimulating factor. It acts on early progenitor cells up to the maturation levels aft er the erythroblast stage. Without EPO, erythroid diff erentiation does not progress past the level of burst-forming units (BFU-E).
Th e progenitor cells of the red line proliferate and diff erentiate only under optimal local conditions. Th e blood formation islands in
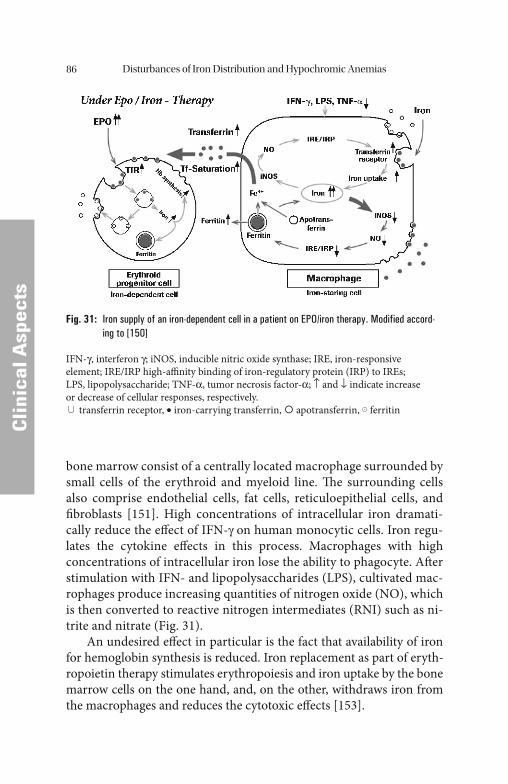
Disturbances of Iron Distribution and Hypochromic Anemias86
CCli
nica
l Asp
ects
bone marrow consist of a centrally located macrophage surrounded by small cells of the erythroid and myeloid line. Th e surrounding cells also comprise endothelial cells, fat cells, reticuloepithelial cells, and fi broblasts [151]. High concentrations of intracellular iron dramati-cally reduce the eff ect of IFN-γ on human monocytic cells. Iron regu-lates the cytokine eff ects in this process. Macrophages with high concentrations of intracellular iron lose the ability to phagocyte. Aft er stimulation with IFN- and lipopolysaccharides (LPS), cultivated mac-rophages produce increasing quantities of nitrogen oxide (NO), which is then converted to reactive nitrogen intermediates (RNI) such as ni-trite and nitrate (Fig. 31).
An undesired eff ect in particular is the fact that availability of iron for hemoglobin synthesis is reduced. Iron replacement as part of eryth-ropoietin therapy stimulates erythropoiesis and iron uptake by the bone marrow cells on the one hand, and, on the other, withdraws iron from the macrophages and reduces the cytotoxic eff ects [153].
Fig. 31: Iron supply of an iron-dependent cell in a patient on EPO/iron therapy. Modified accord-ing to [150]
IFN-γ, interferon γ; iNOS, inducible nitric oxide synthase; IRE, iron-responsive element; IRE/IRP high-affi nity binding of iron-regulatory protein (IRP) to IREs; LPS, lipopolysaccharide; TNF-α, tumor necrosis factor-α; ↑ and ↓ indicate increase or decrease of cellular responses, respectively.
transferrin receptor, • iron-carrying transferrin, apotransferrin, ferritin
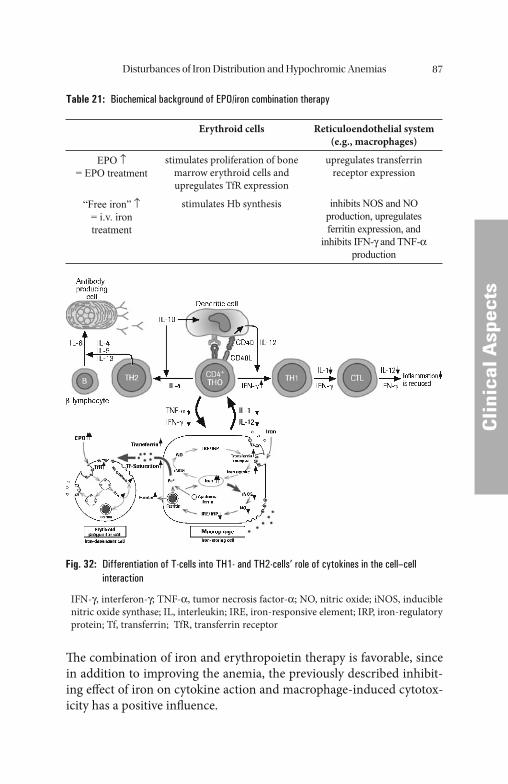
Disturbances of Iron Distribution and Hypochromic Anemias 87
CCli
nica
l Asp
ects
Th e combination of iron and erythropoietin therapy is favorable, since in addition to improving the anemia, the previously described inhibit-ing eff ect of iron on cytokine action and macrophage-induced cytotox-icity has a positive infl uence.
Table 21: Biochemical background of EPO/iron combination therapy
Erythroid cells Reticuloendothelial system(e.g., macrophages)
EPO ↑= EPO treatment
stimulates proliferation of bone marrow erythroid cells and upregulates TfR expression
upregulates transferrin receptor expression
“Free iron” ↑= i.v. iron treatment
stimulates Hb synthesis inhibits NOS and NO production, upregulates ferritin expression, and
inhibits IFN-γ and TNF-α production
Fig. 32: Differentiation of T-cells into TH1- and TH2-cells’ role of cytokines in the cell–cell interaction
IFN-γ, interferon-γ; TNF-α, tumor necrosis factor-α; NO, nitric oxide; iNOS, inducible nitric oxide synthase; IL, interleukin; IRE, iron-responsive element; IRP, iron-regulatory protein; Tf, transferrin; TfR, transferrin receptor
Disturbances of Iron Distribution and Hypochromic Anemias88
CCli
nica
l Asp
ects
With erythropoietin administration, the transferrin receptor on erythroid precursor cells is upregulated. A sequential administration of erythropoietin and iron (at intervals of 48 hours) is recommended [149].
It is possible that a combination of EPO/i.v. iron leads to a reduction of iron deposits in the macrophages and downregulates the cytokine interaction and the infl ammatory reaction, primarily of IL-1, IL-12, and IFN-γ, while the infl ammatory activity is simultaneously inhibited (Fig. 32). Th is would explain the infl ammation-inhibiting eff ect of com-bined EPO therapy and i.v. iron administration. When one considers that the therapy has no side-eff ects and that it leads not only to correc-tion of anemia in patients with tumors and infections and in patients with chronic infl ammation (e.g., rheumatoid arthritis), but also to a cor-rection in the infl ammatory activity, it becomes clear that an important milestone in the therapy of these diseases has been reached.
Therapy with Erythropoietin and i.v. Iron Administration
Th e fi rst ESAs (erythropoiesis-stimulating agents) were recombinant human erythropoietin (epoietin alpha and beta) which could be admin-istered either intraveneously (i.v.) or subcutaneously (s.c.), and were generally given two or three times a week. Th e frequency of administra-tion was dictated partly by the short biologic half-life of these prod-ucts – about 6–8 hours following a single i.v. injection [95].
In addition to rhu-EPO (recombinant human erythropoietin), re-combinant DNA technology has made it possible to synthesize an ana-log to rhu-EPO, the Novel Erythropoiesis-Stimulating Protein (NESP), darbopoietin alpha [47, 94]. Th is molecule was created by the addition of two extra N-linked carbohydrate chains, increasing the total number of sialic acid residues and conferring additional metabolic stability on the molecule. Th us, the elimination half-life of i.v. darbopoietin alpha in humans was three times longer than that of standard epoietin, which makes longer administration intervals possible [47]. 200 IU rhu-EPO is roughly equivalent to 1 μg NESP. Antibodies to NESP have yet to be detected in the serum of treated patients [58].
Even more recently, a third generation erythropoietic molecule, Continuous Erythropoietin Receptor Activator (C.E.R.A.), was created
Disturbances of Iron Distribution and Hypochromic Anemias 89
CCli
nica
l Asp
ectsby integrating a large polymer chain into the molecule, thus increasing
the molecular weight to twice of that of epoietin at approximately 60 kD. Th is methoxy-polyethylene glycol polymer chain is integrated via amide bonds between the N-terminal amino group or the ε-amino group of lysine (predominantly lysine-52 or lysine-45), using a single succinimi-dyl butanoic acid linker [95].
Evidence is accumulating that C.E.R.A. has very diff erent receptor-binding characteristics and pharmacokinetic properties from either epoietin or darbopoietin alpha. It has a much lower affi nity for the erythropoietin receptor compared with the natural ligand, leading to reduced specifi c activity in vitro. Because the elimination of half-life is so prolonged, however, C.E.R.A. has increased erythropoietic activity in vivo.
Th e clinical picture of renal anemia is a “classic” example for re-placement therapy with rhu-EPO. Nor is it surprising that over 95% of dialysis patients are successfully treated with rhu-EPO [136].
Under physiologic conditions, the neogenesis of erythropoietin takes place in the peritubular fi broblasts of the kidney. Under hypoxic conditions, synthesis of the hormone – mediated by a cellular oxygen sensor – increases (rise in the expression of the EPO gene). In patients with chronic renal insuffi ciency, these kidney cells lose their ability to adequately increase EPO formation.
Th ere are a number of forms of anemia that are not due primarily to a defi cit of EPO, but which can be corrected using rhEPO therapy. Al-most all chronic infl ammatory or malignant diseases are associated with an anemia. Many factors are signifi cant with these anemias. First and
Table 22: Mean half-lives of erythropoiesis-stimulating agents. Continuous Erythropioietion Re-ceptor Activator (C.E.R.A.), darbopoietin alpha, epoietin beta, and epoietin alpha [95]
Agent Administration route Mean (± SEM) half-life (h)
Epoietin α IntravenousSubcutanous
6.8 ± 0.619.4 ± 2.5
Epoietin β IntravenousSubcutanous
8.8 ± 0.524.2 ± 2.6
Darbopoietin α IntravenousSubcutanous
25.3 ± 2.248.8 ± 5.2
C.E.R.A. IntravenousSubcutanous
134 ± 19 139 ± 20
Disturbances of Iron Distribution and Hypochromic Anemias90
CCli
nica
l Asp
ects
foremost, the formation of red blood cells in the bone marrow is dis-turbed. Circulating cytokines released as part of the infl ammatory pro-cess are responsible for causing the inhibition of erythropoiesis (TNF-α, IL-1, and IL-6).
In patients with tumor anemias, anemias of infection, or anemias of chronic infl ammatory diseases, the direct inhibition of erythropoiesis and the reduced formation of erythropoietin caused by the circulating cytokines, or the reduced release of iron from the reticuloendothelial system means that higher EPO doses are required to correct the anemia as compared to renal anemia. In many patients with carcinomas, infec-
Table 23: Summary of EPO features
Formation site • Specialized kidney cells• Regenerating human liver cells
Regulation by • Hormones such as renin, angiotensin II or epinephrine• Cytokines such as IL-1, IL-6 or TNF• Oxygen supply at the site of EPO production
Biologic function • Growth factor• Promotion of proliferation and diff erentiation of erythrocyte
precursor cells
EPO in disease • In patients with certain forms of anemia, especially aplastic anemia, the regulation of EPO formation in the kidneys appears to be intact. Th is leads to extremely high EPO concentrations in the serum of the individuals aff ected (up to 4 U/mL). Other forms of anemia, especially renal anemia, are characterized by serum EPO concentrations that are lower than expected for the severity of the anemia. Th e regulation of EPO formation is apparently disturbed in these individuals.
• Forms of anemia that may or may not be based on a defi cit of erythropoietin. Th is question can be clarifi ed by determining the erythropoietin concentration in serum and by relating the results to the hemoglobin concentration (or the hematocrit).
• Elevated values of erythropoietin accompanied by a normal or even raised hemoglobin concentration (and/or hematocrit values) were found in a number of diseases such as kidney and liver tumors or in patients with secondary forms of polycythemia. Polycythemia vera is characterized by an abnormally high number of red blood cells accompanied by a reduced serum titer of erythropoietin.
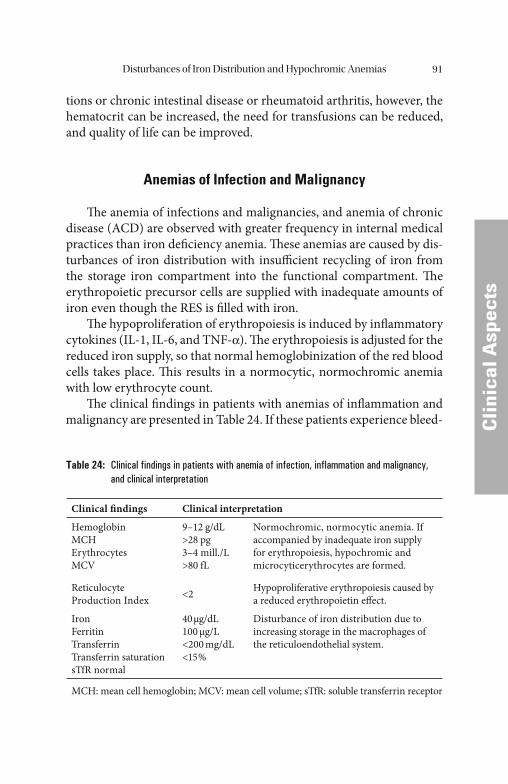
Disturbances of Iron Distribution and Hypochromic Anemias 91
Cli
nica
l Asp
ects
Cli
nica
l Asp
ects
tions or chronic intestinal disease or rheumatoid arthritis, however, the hematocrit can be increased, the need for transfusions can be reduced, and quality of life can be improved.
Anemias of Infection and Malignancy
Th e anemia of infections and malignancies, and anemia of chronic disease (ACD) are observed with greater frequency in internal medical practices than iron defi ciency anemia. Th ese anemias are caused by dis-turbances of iron distribution with insuffi cient recycling of iron from the storage iron compartment into the functional compartment. Th e erythropoietic precursor cells are supplied with inadequate amounts of iron even though the RES is fi lled with iron.
Th e hypoproliferation of erythropoiesis is induced by infl ammatory cytokines (IL-1, IL-6, and TNF-α). Th e erythropoiesis is adjusted for the reduced iron supply, so that normal hemoglobinization of the red blood cells takes place. Th is results in a normocytic, normochromic anemia with low erythrocyte count.
Th e clinical fi ndings in patients with anemias of infl ammation and malignancy are presented in Table 24. If these patients experience bleed-
Table 24: Clinical findings in patients with anemia of infection, inflammation and malignancy, and clinical interpretation
Clinical fi ndings Clinical interpretation
HemoglobinMCHErythrocytesMCV
9–12 g/dL>28 pg3–4 mill./L>80 fL
Normochromic, normocytic anemia. If accompanied by inadequate iron supply for erythropoiesis, hypochromic and microcyticerythrocytes are formed.
Reticulocyte Production Index <2 Hypoproliferative erythropoiesis caused by
a reduced erythropoietin eff ect.
IronFerritinTransferrinTransferrin saturationsTfR normal
40 μg/dL100 μg/L<200 mg/dL<15 %
Disturbance of iron distribution due to increasing storage in the macrophages of the reticuloendothelial system.
MCH: mean cell hemoglobin; MCV: mean cell volume; sTfR: soluble transferrin receptor
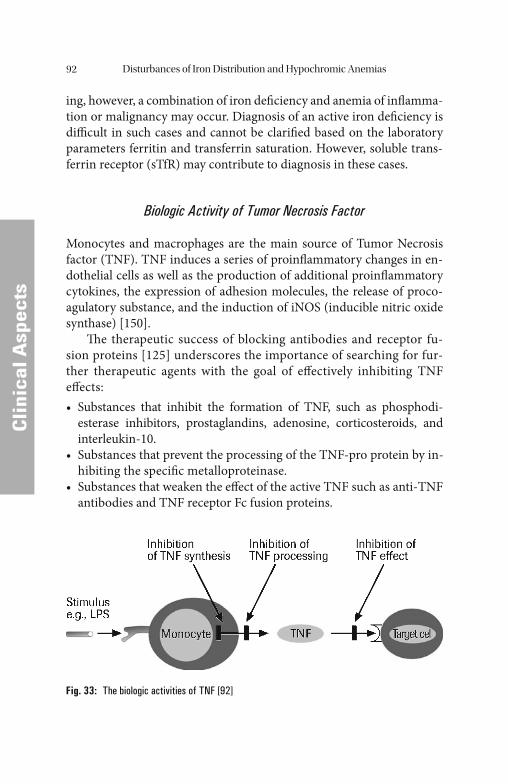
Disturbances of Iron Distribution and Hypochromic Anemias92
CCli
nica
l Asp
ects
ing, however, a combination of iron defi ciency and anemia of infl amma-tion or malignancy may occur. Diagnosis of an active iron defi ciency is diffi cult in such cases and cannot be clarifi ed based on the laboratory parameters ferritin and transferrin saturation. However, soluble trans-ferrin receptor (sTfR) may contribute to diagnosis in these cases.
Biologic Activity of Tumor Necrosis Factor
Monocytes and macrophages are the main source of Tumor Necrosis factor (TNF). TNF induces a series of proinfl ammatory changes in en-dothelial cells as well as the production of additional proinfl ammatory cytokines, the expression of adhesion molecules, the release of proco-agulatory substance, and the induction of iNOS (inducible nitric oxide synthase) [150].
Th e therapeutic success of blocking antibodies and receptor fu-sion proteins [125] underscores the importance of searching for fur-ther therapeutic agents with the goal of eff ectively inhibiting TNF eff ects:• Substances that inhibit the formation of TNF, such as phosphodi-
esterase inhibitors, prostaglandins, adenosine, corticosteroids, and interleukin-10.
• Substances that prevent the processing of the TNF-pro protein by in-hibiting the specifi c metalloproteinase.
• Substances that weaken the eff ect of the active TNF such as anti-TNF antibodies and TNF receptor Fc fusion proteins.
Fig. 33: The biologic activities of TNF [92]
Disturbances of Iron Distribution and Hypochromic Anemias 93
Cli
nica
l Asp
ects
Cli
nica
l Asp
ects
Hemoglobin in Therapies with Cytostatic Drugs
Randomized studies in patients with multiple myeloma (MM), non- Hodgkin’ s lymphoma (NHL) or chronic lymphatic leukemia (CLL) have made it clear that administration of EPO can raise hemoglobin and reduce a patient’ s need for transfusions [34, 91].
Th e hemoglobin value (Hb) is apparently an important factor in the quality of life in patients on virtually any cytostatic therapy. A large mul-ticentric, randomized study conducted by Littlewood et al. [91] investi-gated the infl uence of EPO on the need for transfusions and the quality of life of patients with solid tumors and hematologic system diseases under chemotherapy that does not include cis-platinum. Th e study in-cluded patients with solid tumors or hematologic neoplasias in which anemia (Hb < 10.5 g/dL) was diagnosed or in which the Hb value fell by more than 1.5 g/dL in the fi rst four weeks of chemotherapy. Th e patients were treated with rhEPO (3 × 150 IU/kg/week) for 28 weeks in parallel with chemotherapy. Despite the chemotherapy, treatment with erythro-poietin led to an increase in the hemoglobin value by 2 g/dL, in patients with solid tumors as well as patients with hematologic neoplasias.
Anemias in the presence of malignant tumors are therefore the re-sult of a multifactorial process in which the immune system and the infl ammatory process play a dominant role [93].
Known causes of anemias in patients with neoplasias are tumor-in-duced bleeding, hemolysis or infi ltration of the bone marrow by tumor cells. Th e majority of anemias that occur in conjunction with malignant neoplasias are caused either directly or indirectly by the tumor itself, however. Anemia is the result of an imbalance between the rate of pro-duction of erythrocytes in the bone marrow and their residence time in the blood. Th e tumor impairs the proliferation and life span of red blood cells. It is known that the life span of erythrocytes is shortened from 120 days to 60–90 days in patients with malignancies. Th e activation of the immune system in tumor-induced anemia apparently leads to a sup-pression of erythropoiesis, for which cytokines are responsible (TNF-α, IL-1, and IFN-γ).
Th e activation of erythropoiesis is regulated by erythropoietin produced in the proximal tubuli of the kidney. In patients with tu-mor-induced anemias, exogenously supplied recombinant erythro-poietin stimulates the proliferation and diff erentiation of the red
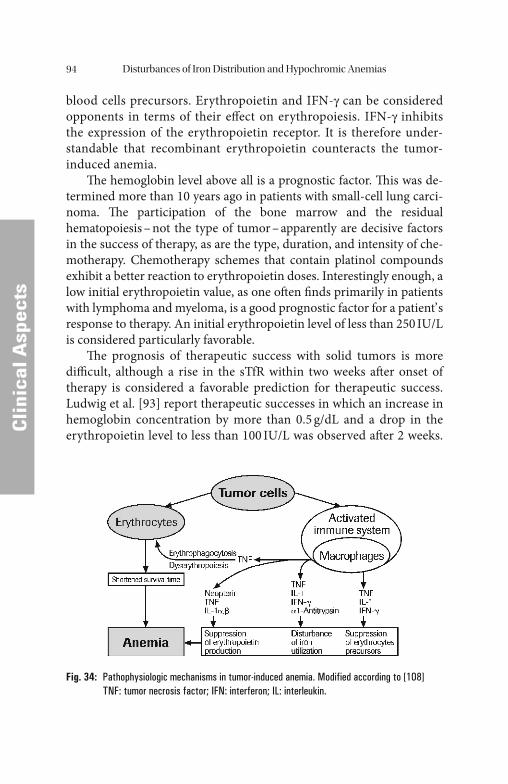
Disturbances of Iron Distribution and Hypochromic Anemias94
CCli
nica
l Asp
ects
blood cells precursors. Erythropoietin and IFN-γ can be considered opponents in terms of their eff ect on erythropoiesis. IFN-γ inhibits the expression of the erythropoietin receptor. It is therefore under-standable that recombinant erythropoietin counteracts the tumor-induced anemia.
Th e hemoglobin level above all is a prognostic factor. Th is was de-termined more than 10 years ago in patients with small-cell lung carci-noma. Th e participation of the bone marrow and the residual hematopoiesis – not the type of tumor – apparently are decisive factors in the success of therapy, as are the type, duration, and intensity of che-motherapy. Chemotherapy schemes that contain platinol compounds exhibit a better reaction to erythropoietin doses. Interestingly enough, a low initial erythropoietin value, as one oft en fi nds primarily in patients with lymphoma and myeloma, is a good prognostic factor for a patient’ s response to therapy. An initial erythropoietin level of less than 250 IU/L is considered particularly favorable.
Th e prognosis of therapeutic success with solid tumors is more diffi cult, although a rise in the sTfR within two weeks aft er onset of therapy is considered a favorable prediction for therapeutic success. Ludwig et al. [93] report therapeutic successes in which an increase in hemoglobin concentration by more than 0.5 g/dL and a drop in the erythropoietin level to less than 100 IU/L was observed aft er 2 weeks.
Fig. 34: Pathophysiologic mechanisms in tumor-induced anemia. Modified according to [108]TNF: tumor necrosis factor; IFN: interferon; IL: interleukin.
Disturbances of Iron Distribution and Hypochromic Anemias 95
Cli
nica
l Asp
ects
Cli
nica
l Asp
ects
A drop in serum ferritin is also interpreted as a favorable sign for the therapy.
In the mean time, patients on radiotherapy have also been treated with erythropoietin. It was observed that the hemoglobin value in-creased among the patients with EPO, but it did not in the untreated control group.
Hypoxic regions exhibit increased resistance to radiation therapy. Apparently there is a correlation between the Hb value and the median oxygen partial pressure in the tumors. Since the hemoglobin concentra-tion is the most important oxygen-supply-determining parameter, an increase in the Hb value with EPO to over 12 g/dL in oncologic patients appears reasonable, even if non-oncologic patients typically are still ca-pable of tolerating lower Hb values.
Erythropoietin and Iron Replacement in Tumor Anemias
Patients with malignant diseases oft en develop an anemia that is caused by the malignant process itself or the therapy. Various factors such as the type of tumor and the duration of illness, as well as the type and inten-sity of chemotherapy and/or radiotherapy infl uence the anemia rate.
Nearly 50–60% of patients who undergo aggressive chemotherapy to treat a malignant lymphoma, bronchial carcinoma, gynecologic tu-mors or a carcinoma of the urogenital tract require blood transfusions. Blood transfusions are associated with numerous side-eff ects and risks, however (such as allergic reactions or infections such as hepatitis, HIV, bacterial contamination of the blood product or a blood group incom-patibility). An unavoidable side-eff ect of blood transfusions is chronic immune suppression. Th is is fatal in tumor patients in particular, as it can encourage tumor progression. Other side-eff ects include iron and volume overload.
Th ese disadvantages can be prevented by administering recombi-nant human erythropoietin. EPO increases the Hb value in the physio-logic pathway and leads to improved quality of life in patients. EPO administration is therefore better tolerated and has a favorable infl uence on the results of cancer treatment. Tumor hypoxia and anemia are nega-tive prognostic indicators in terms of the results of treatment of solid and hematologic tumors.
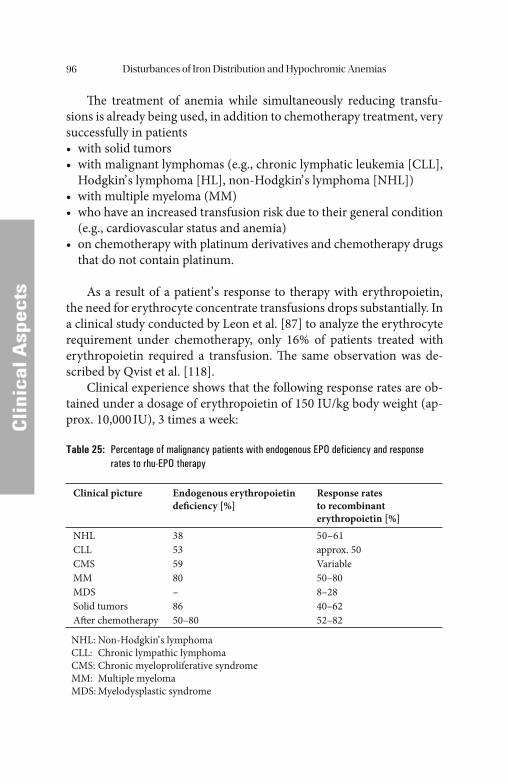
Disturbances of Iron Distribution and Hypochromic Anemias96
CCli
nica
l Asp
ects
Th e treatment of anemia while simultaneously reducing transfu-sions is already being used, in addition to chemotherapy treatment, very successfully in patients• with solid tumors• with malignant lymphomas (e.g., chronic lymphatic leukemia [CLL],
Hodgkin’ s lymphoma [HL], non-Hodgkin’ s lymphoma [NHL])• with multiple myeloma (MM)• who have an increased transfusion risk due to their general condition
(e.g., cardiovascular status and anemia)• on chemotherapy with platinum derivatives and chemotherapy drugs
that do not contain platinum.
As a result of a patient’ s response to therapy with erythropoietin, the need for erythrocyte concentrate transfusions drops substantially. In a clinical study conducted by Leon et al. [87] to analyze the erythrocyte requirement under chemotherapy, only 16% of patients treated with erythropoietin required a transfusion. Th e same observation was de-scribed by Qvist et al. [118].
Clinical experience shows that the following response rates are ob-tained under a dosage of erythropoietin of 150 IU/kg body weight (ap-prox. 10,000 IU), 3 times a week:
Table 25: Percentage of malignancy patients with endogenous EPO deficiency and response rates to rhu-EPO therapy
Clinical picture Endogenous erythropoietin defi ciency [%]
Response rates to recombinant erythropoietin [%]
NHLCLLCMSMMMDSSolid tumorsAft er chemotherapy
38535980–8650–80
50–61approx. 50Variable50–808–2840–6252–82
NHL: Non-Hodgkin’ s lymphomaCLL: Chronic lympathic lymphomaCMS: Chronic myeloproliferative syndromeMM: Multiple myelomaMDS: Myelodysplastic syndrome
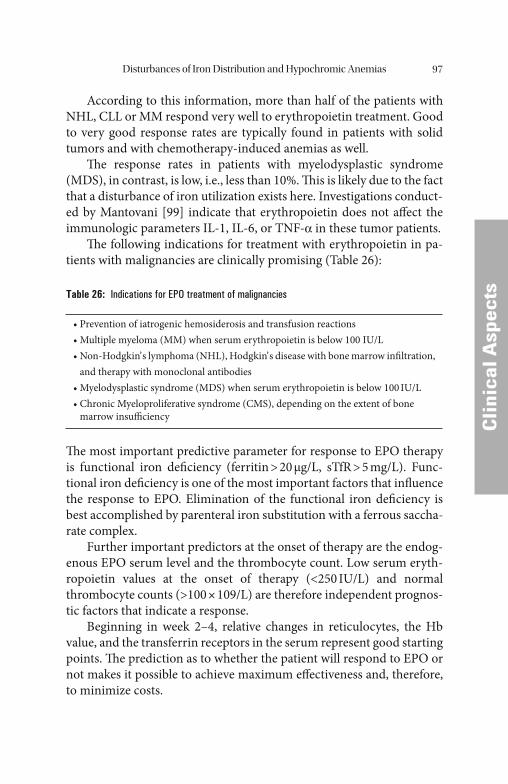
Disturbances of Iron Distribution and Hypochromic Anemias 97
CCli
nica
l Asp
ects
According to this information, more than half of the patients with NHL, CLL or MM respond very well to erythropoietin treatment. Good to very good response rates are typically found in patients with solid tumors and with chemotherapy-induced anemias as well.
Th e response rates in patients with myelodysplastic syndrome (MDS), in contrast, is low, i.e., less than 10%. Th is is likely due to the fact that a disturbance of iron utilization exists here. Investigations conduct-ed by Mantovani [99] indicate that erythropoietin does not aff ect the immunologic parameters IL-1, IL-6, or TNF-α in these tumor patients.
Th e following indications for treatment with erythropoietin in pa-tients with malignancies are clinically promising (Table 26):
Table 26: Indications for EPO treatment of malignancies
• Prevention of iatrogenic hemosiderosis and transfusion reactions• Multiple myeloma (MM) when serum erythropoietin is below 100 IU/L• Non-Hodgkin’ s lymphoma (NHL), Hodgkin’ s disease with bone marrow infi ltration,
and therapy with monoclonal antibodies• Myelodysplastic syndrome (MDS) when serum erythropoietin is below 100 IU/L• Chronic Myeloproliferative syndrome (CMS), depending on the extent of bone
marrow insuffi ciency
Th e most important predictive parameter for response to EPO therapy is functional iron defi ciency (ferritin > 20 μg/L, sTfR > 5 mg/L). Func-tional iron defi ciency is one of the most important factors that infl uence the response to EPO. Elimination of the functional iron defi ciency is best accomplished by parenteral iron substitution with a ferrous saccha-rate complex.
Further important predictors at the onset of therapy are the endog-enous EPO serum level and the thrombocyte count. Low serum eryth-ropoietin values at the onset of therapy (<250 IU/L) and normal thrombocyte counts (>100 × 109/L) are therefore independent prognos-tic factors that indicate a response.
Beginning in week 2–4, relative changes in reticulocytes, the Hb value, and the transferrin receptors in the serum represent good starting points. Th e prediction as to whether the patient will respond to EPO or not makes it possible to achieve maximum eff ectiveness and, therefore, to minimize costs.
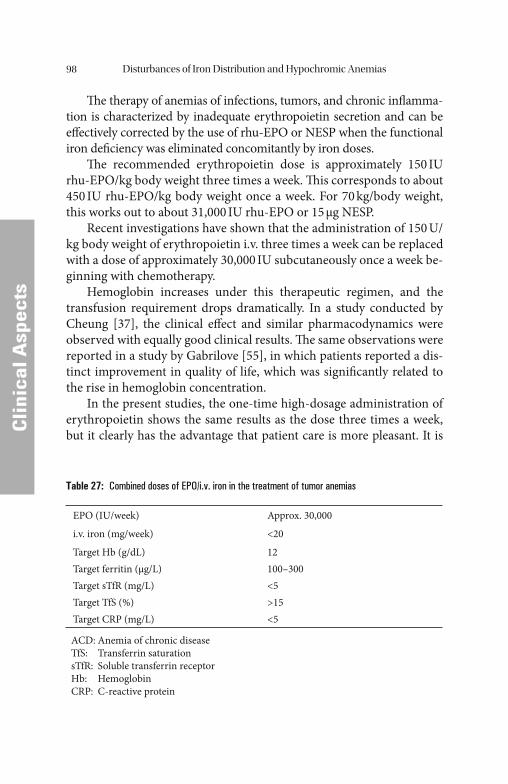
Disturbances of Iron Distribution and Hypochromic Anemias98
CCli
nica
l Asp
ects
Th e therapy of anemias of infections, tumors, and chronic infl amma-tion is characterized by inadequate erythropoietin secretion and can be eff ectively corrected by the use of rhu-EPO or NESP when the functional iron defi ciency was eliminated concomitantly by iron doses.
Th e recommended erythropoietin dose is approximately 150 IU rhu-EPO/kg body weight three times a week. Th is corresponds to about 450 IU rhu-EPO/kg body weight once a week. For 70 kg/body weight, this works out to about 31,000 IU rhu-EPO or 15 μg NESP.
Recent investigations have shown that the administration of 150 U/kg body weight of erythropoietin i.v. three times a week can be replaced with a dose of approximately 30,000 IU subcutaneously once a week be-ginning with chemotherapy.
Hemoglobin increases under this therapeutic regimen, and the transfusion requirement drops dramatically. In a study conducted by Cheung [37], the clinical eff ect and similar pharmacodynamics were observed with equally good clinical results. Th e same observations were reported in a study by Gabrilove [55], in which patients reported a dis-tinct improvement in quality of life, which was signifi cantly related to the rise in hemoglobin concentration.
In the present studies, the one-time high-dosage administration of erythropoietin shows the same results as the dose three times a week, but it clearly has the advantage that patient care is more pleasant. It is
Table 27: Combined doses of EPO/i.v. iron in the treatment of tumor anemias
EPO (IU/week) Approx. 30,000
i.v. iron (mg/week) <20
Target Hb (g/dL)Target ferritin (μg/L)Target sTfR (mg/L)Target TfS (%)Target CRP (mg/L)
12100–300<5>15<5
ACD: Anemia of chronic diseaseTfS: Transferrin saturationsTfR: Soluble transferrin receptorHb: HemoglobinCRP: C-reactive protein
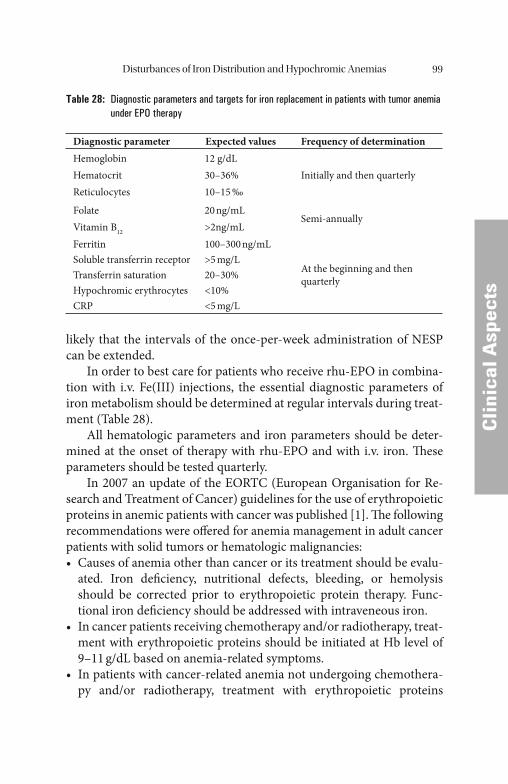
Disturbances of Iron Distribution and Hypochromic Anemias 99
CCli
nica
l Asp
ects
likely that the intervals of the once-per-week administration of NESP can be extended.
In order to best care for patients who receive rhu-EPO in combina-tion with i.v. Fe(III) injections, the essential diagnostic parameters of iron metabolism should be determined at regular intervals during treat-ment (Table 28).
All hematologic parameters and iron parameters should be deter-mined at the onset of therapy with rhu-EPO and with i.v. iron. Th ese parameters should be tested quarterly.
In 2007 an update of the EORTC (European Organisation for Re-search and Treatment of Cancer) guidelines for the use of erythropoietic proteins in anemic patients with cancer was published [1]. Th e following recommendations were off ered for anemia management in adult cancer patients with solid tumors or hematologic malignancies:• Causes of anemia other than cancer or its treatment should be evalu-
ated. Iron defi ciency, nutritional defects, bleeding, or hemolysis should be corrected prior to erythropoietic protein therapy. Func-tional iron defi ciency should be addressed with intraveneous iron.
• In cancer patients receiving chemotherapy and/or radiotherapy, treat-ment with erythropoietic proteins should be initiated at Hb level of 9–11 g/dL based on anemia-related symptoms.
• In patients with cancer-related anemia not undergoing chemothera-py and/or radiotherapy, treatment with erythropoietic proteins
Table 28: Diagnostic parameters and targets for iron replacement in patients with tumor anemia under EPO therapy
Diagnostic parameter Expected values Frequency of determinationHemoglobinHematocritReticulocytes
12 g/dL30–36%10–15 ‰
Initially and then quarterly
FolateVitamin B12
20 ng/mL>2ng/mL
Semi-annually
FerritinSoluble transferrin receptorTransferrin saturationHypochromic erythrocytesCRP
100–300 ng/mL>5 mg/L20–30%<10%<5 mg/L
At the beginning and then quarterly
Disturbances of Iron Distribution and Hypochromic Anemias100
CCli
nica
l Asp
ects
should be initiated at Hb level of 9–11 g/dL based on anemia-related symptoms.
• Patients whose Hb level is below 9 g/dL should be evaluated for need of transfusions, in addition to erythropoietc proteins.
• Erythropoietic proteins may be considered in asymptomatic, ane-mic patients with a Hb level of <11.9 mg/dL to prevent a further decline in Hb, according to individual factors (e.g., type/intesity of chemotherapy, baseline Hb) and the duration and type of further planned treatment.
• Th e prophylactic use of erythropoietic proteins to prevent anemia in patients undergoing chemotherapy and/or radiotherapy is not recom-mended.
• Th ere is no evidence to increased response to erythropoietic proteins with the addition of oral iron supplementation. Th ere is evidence of improved response to erythropoietic proteins with i.v. iron supple-mentation.
• Based on clinical evidence, elderly patients experience the same benefi ts from treatment with erythropoietic proteins as younger patients.
• Th e target Hb concentration should be 12–13 g/dL.• Th e administration of erythropoietic proteins according to Fig. 35 is
recommended. Dose-escalation as a general approach in patients not responding within 4–8 weeks is not recommended.
• Treatment should be continued until the 12–13 g/dL level of Hb is reached and patients show symptomatic improvement. For patients reaching the target Hb, individualized treatment with increased inter-vals of dosing and/or titration of the lowest eff ective maintenance dose should be made repeatedly.
• Th e use of higher than licensed initial doses of epoietin alpha, epoie-tin beta, or darbopoietin alpha is not recommended.
• Th ere are no predictive factors of response to erythropoietic proteins that can be routinely used in clinical practice if functional iron defi -ciency or vitamin defi ciency is ruled out. A low serum EPO level (in particular in hematologic malignancies) is the only verifi ed predictive factor of some importance. Values must be interpreted relative to the degree of anemia present. Further studies are needed to defi ne the value of hepcidin and CRP.
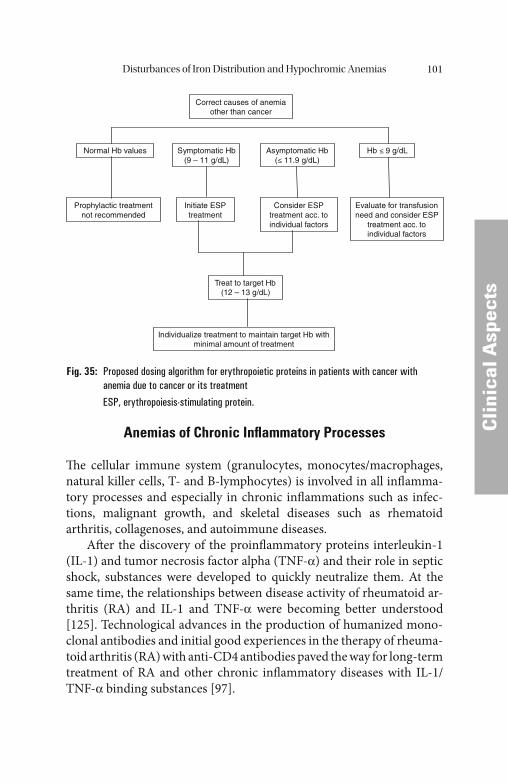
Disturbances of Iron Distribution and Hypochromic Anemias 101
Cli
nica
l Asp
ects
Cli
nica
l Asp
ects
Anemias of Chronic Infl ammatory Processes
Th e cellular immune system (granulocytes, monocytes/macrophages, natural killer cells, T- and B-lymphocytes) is involved in all infl amma-tory processes and especially in chronic infl ammations such as infec-tions, malignant growth, and skeletal diseases such as rhematoid arthritis, collagenoses, and autoimmune diseases.
Aft er the discovery of the proinfl ammatory proteins interleukin-1 (IL-1) and tumor necrosis factor alpha (TNF-α) and their role in septic shock, substances were developed to quickly neutralize them. At the same time, the relationships between disease activity of rheumatoid ar-thritis (RA) and IL-1 and TNF-α were becoming better understood [125]. Technological advances in the production of humanized mono-clonal antibodies and initial good experiences in the therapy of rheuma-toid arthritis (RA) with anti-CD4 antibodies paved the way for long-term treatment of RA and other chronic infl ammatory diseases with IL-1/TNF-α binding substances [97].
Correct causes of anemia other than cancer
Normal Hb values Symptomatic Hb(9 – 11 g/dL)
Asymptomatic Hb (≤ 11.9 g/dL)
Hb ≤ 9 g/dL
Prophylactic treatment not recommended
Initiate ESPtreatment
Consider ESP treatment acc. to individual factors
Evaluate for transfusion need and consider ESP
treatment acc. to individual factors
Treat to target Hb (12 – 13 g/dL)
Individualize treatment to maintain target Hb with minimal amount of treatment
Fig. 35: Proposed dosing algorithm for erythropoietic proteins in patients with cancer with anemia due to cancer or its treatment
ESP, erythropoiesis-stimulating protein.
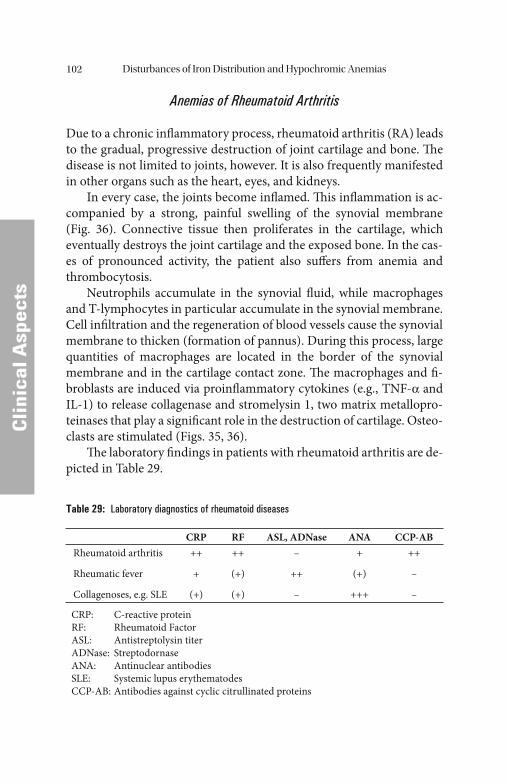
Disturbances of Iron Distribution and Hypochromic Anemias102
CCli
nica
l Asp
ects
Anemias of Rheumatoid Arthritis
Due to a chronic infl ammatory process, rheumatoid arthritis (RA) leads to the gradual, progressive destruction of joint cartilage and bone. Th e disease is not limited to joints, however. It is also frequently manifested in other organs such as the heart, eyes, and kidneys.
In every case, the joints become infl amed. Th is infl ammation is ac-companied by a strong, painful swelling of the synovial membrane (Fig. 36). Connective tissue then proliferates in the cartilage, which eventually destroys the joint cartilage and the exposed bone. In the cas-es of pronounced activity, the patient also suff ers from anemia and thrombocytosis.
Neutrophils accumulate in the synovial fl uid, while macrophages and T-lymphocytes in particular accumulate in the synovial membrane. Cell infi ltration and the regeneration of blood vessels cause the synovial membrane to thicken (formation of pannus). During this process, large quantities of macrophages are located in the border of the synovial membrane and in the cartilage contact zone. Th e macrophages and fi -broblasts are induced via proinfl ammatory cytokines (e.g., TNF-α and IL-1) to release collagenase and stromelysin 1, two matrix metallopro-teinases that play a signifi cant role in the destruction of cartilage. Osteo-clasts are stimulated (Figs. 35, 36).
Th e laboratory fi ndings in patients with rheumatoid arthritis are de-picted in Table 29.
Table 29: Laboratory diagnostics of rheumatoid diseases
CRP RF ASL, ADNase ANA CCP-ABRheumatoid arthritis
Rheumatic fever
Collagenoses, e.g. SLE
++
+
(+)
++
(+)
(+)
–
++
–
+
(+)
+++
++
–
–
CRP: C-reactive proteinRF: Rheumatoid FactorASL: Antistreptolysin titerADNase: StreptodornaseANA: Antinuclear antibodiesSLE: Systemic lupus erythematodesCCP-AB: Antibodies against cyclic citrullinated proteins
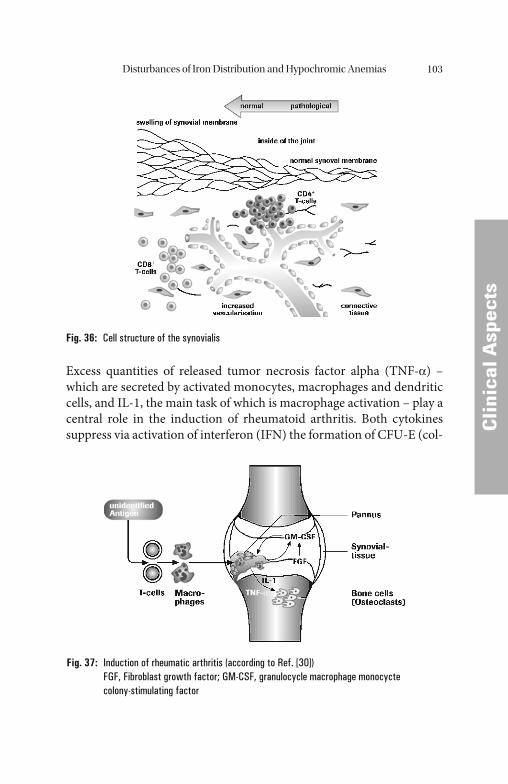
Disturbances of Iron Distribution and Hypochromic Anemias 103
Cli
nica
l Asp
ects
Cli
nica
l Asp
ects
Excess quantities of released tumor necrosis factor alpha (TNF-α) – which are secreted by activated monocytes, macrophages and dendritic cells, and IL-1, the main task of which is macrophage activation – play a central role in the induction of rheumatoid arthritis. Both cytokines suppress via activation of interferon (IFN) the formation of CFU-E (col-
Fig. 36: Cell structure of the synovialis
Fig. 37: Induction of rheumatic arthritis (according to Ref. [30])FGF, Fibroblast growth factor; GM-CSF, granulocycle macrophage monocycte colony-stimulating factor
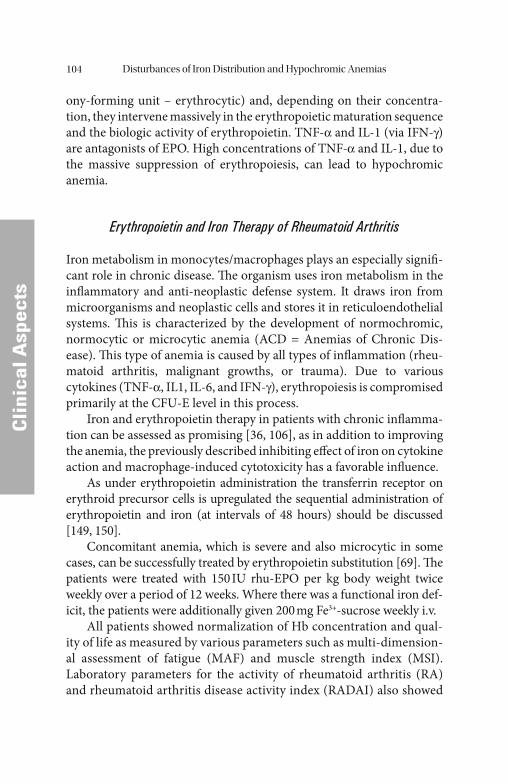
Disturbances of Iron Distribution and Hypochromic Anemias104
CCli
nica
l Asp
ects
ony-forming unit – erythrocytic) and, depending on their concentra-tion, they intervene massively in the erythropoietic maturation sequence and the biologic activity of erythropoietin. TNF-α and IL-1 (via IFN-γ) are antagonists of EPO. High concentrations of TNF-α and IL-1, due to the massive suppression of erythropoiesis, can lead to hypochromic anemia.
Erythropoietin and Iron Therapy of Rheumatoid Arthritis
Iron metabolism in monocytes/macrophages plays an especially signifi -cant role in chronic disease. Th e organism uses iron metabolism in the infl ammatory and anti-neoplastic defense system. It draws iron from microorganisms and neoplastic cells and stores it in reticuloendothelial systems. Th is is characterized by the development of normochromic, normocytic or microcytic anemia (ACD = Anemias of Chronic Dis-ease). Th is type of anemia is caused by all types of infl ammation (rheu-matoid arthritis, malignant growths, or trauma). Due to various cytokines (TNF-α, IL1, IL-6, and IFN-γ), erythropoiesis is compromised primarily at the CFU-E level in this process.
Iron and erythropoietin therapy in patients with chronic infl amma-tion can be assessed as promising [36, 106], as in addition to improving the anemia, the previously described inhibiting eff ect of iron on cytokine action and macrophage-induced cytotoxicity has a favorable infl uence.
As under erythropoietin administration the transferrin receptor on erythroid precursor cells is upregulated the sequential administration of erythropoietin and iron (at intervals of 48 hours) should be discussed [149, 150].
Concomitant anemia, which is severe and also microcytic in some cases, can be successfully treated by erythropoietin substitution [69]. Th e patients were treated with 150 IU rhu-EPO per kg body weight twice weekly over a period of 12 weeks. Where there was a functional iron def-icit, the patients were additionally given 200 mg Fe3+-sucrose weekly i.v.
All patients showed normalization of Hb concentration and qual-ity of life as measured by various parameters such as multi-dimension-al assessment of fatigue (MAF) and muscle strength index (MSI). Laboratory parameters for the activity of rheumatoid arthritis (RA) and rheumatoid arthritis disease activity index (RADAI) also showed
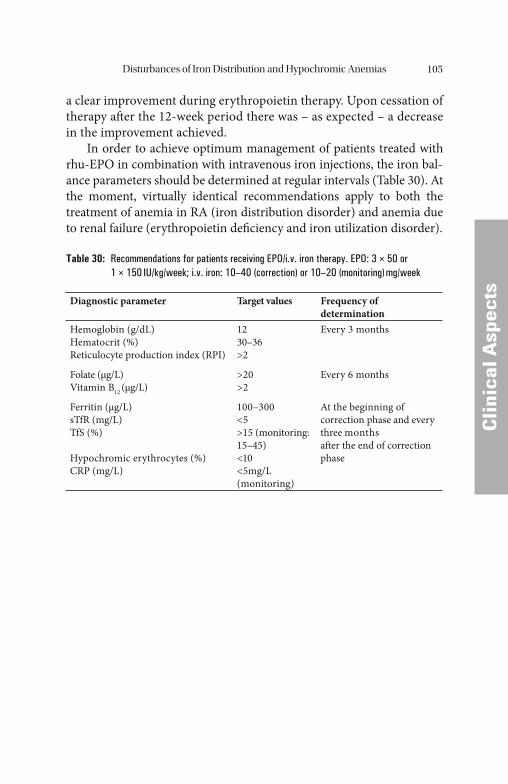
Disturbances of Iron Distribution and Hypochromic Anemias 105
Cli
nica
l Asp
ects
Cli
nica
l Asp
ects
a clear improvement during erythropoietin therapy. Upon cessation of therapy aft er the 12-week period there was – as expected – a decrease in the improvement achieved.
In order to achieve optimum management of patients treated with rhu-EPO in combination with intravenous iron injections, the iron bal-ance parameters should be determined at regular intervals (Table 30). At the moment, virtually identical recommendations apply to both the treatment of anemia in RA (iron distribution disorder) and anemia due to renal failure (erythropoietin defi ciency and iron utilization disorder).
Table 30: Recommendations for patients receiving EPO/i.v. iron therapy. EPO: 3 × 50 or 1 × 150 IU/kg/week; i.v. iron: 10–40 (correction) or 10–20 (monitoring) mg/week
Diagnostic parameter Target values Frequency of determination
Hemoglobin (g/dL)Hematocrit (%)Reticulocyte production index (RPI)
1230–36>2
Every 3 months
Folate (μg/L)Vitamin B12 (μg/L)
>20>2
Every 6 months
Ferritin (μg/L)sTfR (mg/L)TfS (%)
Hypochromic erythrocytes (%)CRP (mg/L)
100–300<5>15 (monitoring: 15–45)<10<5mg/L (monitoring)
At the beginning of correction phase and every three monthsaft er the end of correction phase
Cli
nica
l Asp
ects
Cli
nica
l Asp
ects
Disturbances of Iron Utilization
In patients with disturbances of iron utilization, the individual erythro-cyte contains a normal amount of hemoglobin despite the lowering of the patient’ s hemoglobin value. MCH and MCV are normal. Iron defi -ciency is apparently not the problem in this case, but rather the erythro-cyte balance between formation and decomposition. Th is balance is refl ected in the reticulocyte count (as a measure of the regeneration of erythropoiesis) with normal reticulocyte values between 5 and 15‰.
• Normochromic and normoregenerative anemias are usually based on inadequate stimulation of erythropoiesis. In patients with renal ane-mia, erythropoietin synthesis is greatly reduced when chronic renal insuffi ciency is present.
• Increased reticulocyte production index values > 2 are measured in patients with hyperregeneration. It is the response to the increased decomposition of erythrocytes by hemolysis. When erythrocyte decomposition is elevated, haptoglobin is used as the transport protein for hemoglobin and it drops rapidly. Haptoglobin is therefore a marker for the diagnosis of hemolysis. Bilirubin increases notice-ably only in the presence of acute or relatively intense erythrocyte decomposition.
• Lowered reticulocyte production index values < 2 are measured pri-marily in the presence of hyporegeneration, i.e., hypoplasia or even aplasia in the bone marrow, or in defi ciency anemias.
Uremic Anemia
Uremic anemia is an important special form of normochromic nor-mocytic anemia. Th e clinical fi nding that plasma erythropoietin is lower in uremic patients than in non-uremic patients with a compa-rable degree of anemia suggests that uremic anemia is caused by the inadequate production of erythropoietin in renal failure.
Although uremic anemia is obviously multifactorial in origin and can be partially improved by appropriate hemodialysis therapy, the role played by the extracorporeal hemolytic component must not be under-estimated. Many patients have developed a defect in the hexose mono-
M. Wick et al., Clinical Aspects and Laboratory - Iron Metabolism, Anemias© Springer-Verlag/Wien 2011
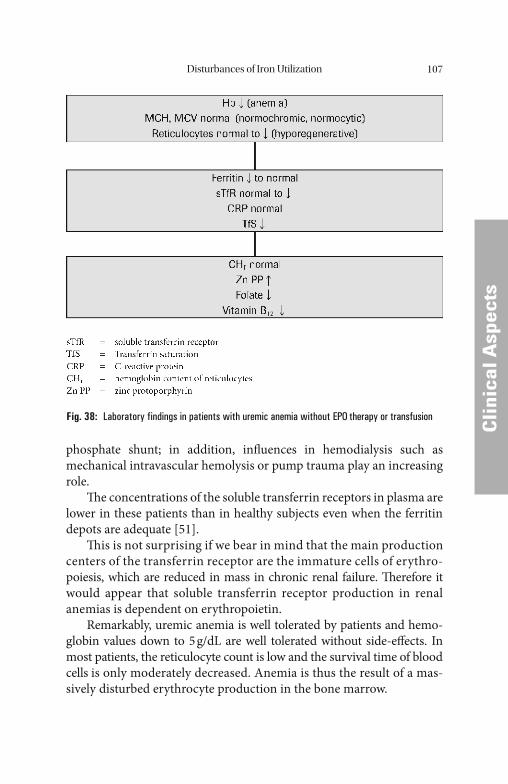
Disturbances of Iron Utilization 107
Cli
nica
l Asp
ects
Cli
nica
l Asp
ects
phosphate shunt; in addition, infl uences in hemodialysis such as mechanical intravascular hemolysis or pump trauma play an increasing role.
Th e concentrations of the soluble transferrin receptors in plasma are lower in these patients than in healthy subjects even when the ferritin depots are adequate [51].
Th is is not surprising if we bear in mind that the main production centers of the transferrin receptor are the immature cells of erythro-poiesis, which are reduced in mass in chronic renal failure. Th erefore it would appear that soluble transferrin receptor production in renal anemias is dependent on erythropoietin.
Remarkably, uremic anemia is well tolerated by patients and hemo-globin values down to 5 g/dL are well tolerated without side-eff ects. In most patients, the reticulocyte count is low and the survival time of blood cells is only moderately decreased. Anemia is thus the result of a mas-sively disturbed erythrocyte production in the bone marrow.
Fig. 38: Laboratory findings in patients with uremic anemia without EPO therapy or transfusion
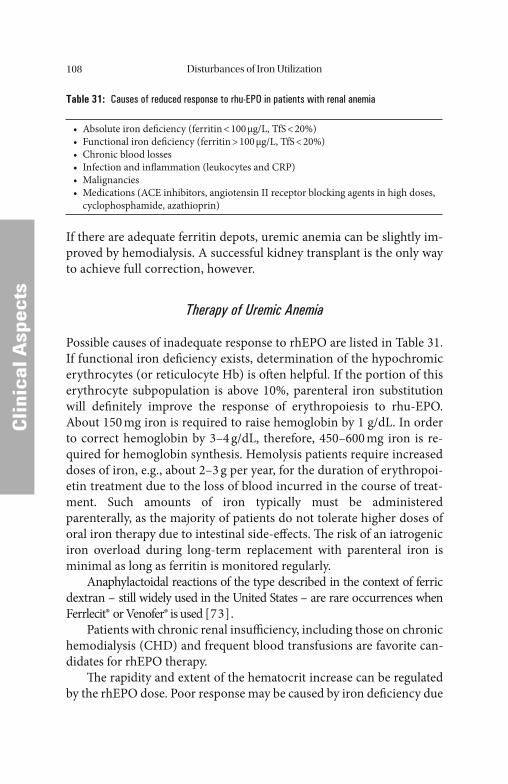
Disturbances of Iron Utilization108
CCli
nica
l Asp
ects
Table 31: Causes of reduced response to rhu-EPO in patients with renal anemia
• Absolute iron defi ciency (ferritin < 100 μg/L, TfS < 20%)• Functional iron defi ciency (ferritin > 100 μg/L, TfS < 20%)• Chronic blood losses• Infection and infl ammation (leukocytes and CRP)• Malignancies• Medications (ACE inhibitors, angiotensin II receptor blocking agents in high doses,
cyclophosphamide, azathioprin)
If there are adequate ferritin depots, uremic anemia can be slightly im-proved by hemodialysis. A successful kidney transplant is the only way to achieve full correction, however.
Therapy of Uremic Anemia
Possible causes of inadequate response to rhEPO are listed in Table 31. If functional iron defi ciency exists, determination of the hypochromic erythrocytes (or reticulocyte Hb) is oft en helpful. If the portion of this erythrocyte subpopulation is above 10%, parenteral iron substitution will defi nitely improve the response of erythropoiesis to rhu-EPO. About 150 mg iron is required to raise hemoglobin by 1 g/dL. In order to correct hemoglobin by 3–4 g/dL, therefore, 450–600 mg iron is re-quired for hemoglobin synthesis. Hemolysis patients require increased doses of iron, e.g., about 2–3 g per year, for the duration of erythropoi-etin treatment due to the loss of blood incurred in the course of treat-ment. Such amounts of iron typically must be administered parenterally, as the majority of patients do not tolerate higher doses of oral iron therapy due to intestinal side-eff ects. Th e risk of an iatrogenic iron overload during long-term replacement with parenteral iron is minimal as long as ferritin is monitored regularly.
Anaphylactoidal reactions of the type described in the context of ferric dextran – still widely used in the United States – are rare occurrences when Ferrlecit® or Venofer® is used [73].
Patients with chronic renal insuffi ciency, including those on chronic hemodialysis (CHD) and frequent blood transfusions are favorite can-didates for rhEPO therapy.
Th e rapidity and extent of the hematocrit increase can be regulated by the rhEPO dose. Poor response may be caused by iron defi ciency due
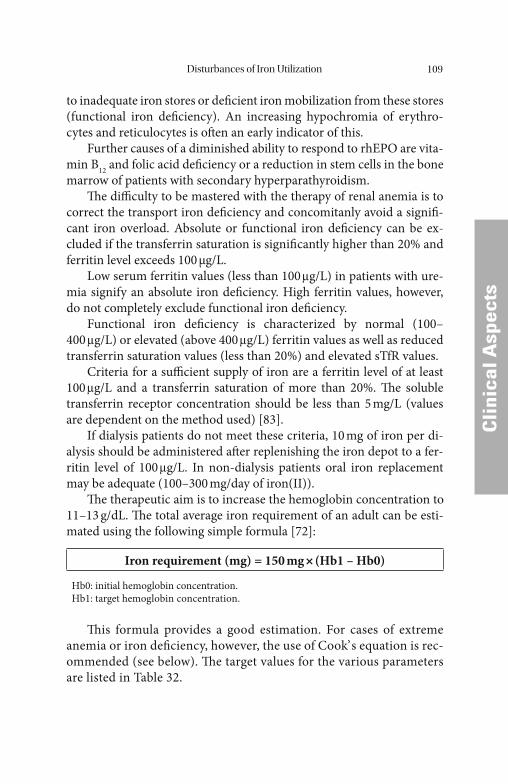
Disturbances of Iron Utilization 109
Cli
nica
l Asp
ects
Cli
nica
l Asp
ects
to inadequate iron stores or defi cient iron mobilization from these stores (functional iron defi ciency). An increasing hypochromia of erythro-cytes and reticulocytes is oft en an early indicator of this.
Further causes of a diminished ability to respond to rhEPO are vita-min B12 and folic acid defi ciency or a reduction in stem cells in the bone marrow of patients with secondary hyperparathyroidism.
Th e diffi culty to be mastered with the therapy of renal anemia is to correct the transport iron defi ciency and concomitanly avoid a signifi -cant iron overload. Absolute or functional iron defi ciency can be ex-cluded if the transferrin saturation is signifi cantly higher than 20% and ferritin level exceeds 100 μg/L.
Low serum ferritin values (less than 100 μg/L) in patients with ure-mia signify an absolute iron defi ciency. High ferritin values, however, do not completely exclude functional iron defi ciency.
Functional iron defi ciency is characterized by normal (100–400 μg/L) or elevated (above 400 μg/L) ferritin values as well as reduced transferrin saturation values (less than 20%) and elevated sTfR values.
Criteria for a suffi cient supply of iron are a ferritin level of at least 100 μg/L and a transferrin saturation of more than 20%. Th e soluble transferrin receptor concentration should be less than 5 mg/L (values are dependent on the method used) [83].
If dialysis patients do not meet these criteria, 10 mg of iron per di-alysis should be administered aft er replenishing the iron depot to a fer-ritin level of 100 μg/L. In non-dialysis patients oral iron replacement may be adequate (100–300 mg/day of iron(II)).
Th e therapeutic aim is to increase the hemoglobin concentration to 11–13 g/dL. Th e total average iron requirement of an adult can be esti-mated using the following simple formula [72]:
Iron requirement (mg) = 150 mg × (Hb1 – Hb0)
Hb0: initial hemoglobin concentration.Hb1: target hemoglobin concentration.
Th is formula provides a good estimation. For cases of extreme anemia or iron defi ciency, however, the use of Cook’ s equation is rec-ommended (see below). Th e target values for the various parameters are listed in Table 32.
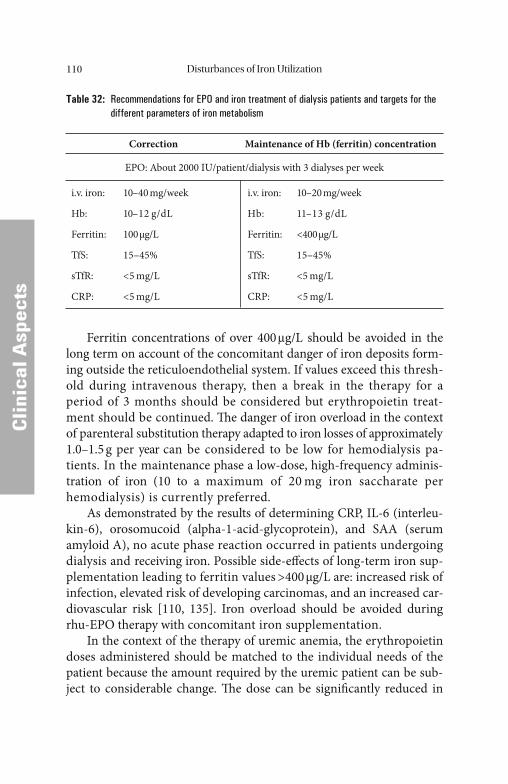
Disturbances of Iron Utilization110
CCli
nica
l Asp
ects
Table 32: Recommendations for EPO and iron treatment of dialysis patients and targets for the different parameters of iron metabolism
Correction Maintenance of Hb (ferritin) concentration
EPO: About 2000 IU/patient/dialysis with 3 dialyses per week
i.v. iron: 10–40 mg/week
Hb: 10–12 g/dL
Ferritin: 100 μg/L
TfS: 15–45%
sTfR: <5 mg/L
CRP: <5 mg/L
i.v. iron: 10–20 mg/week
Hb: 11–13 g/dL
Ferritin: <400 μg/L
TfS: 15–45%
sTfR: <5 mg/L
CRP: <5 mg/L
Ferritin concentrations of over 400 μg/L should be avoided in the long term on account of the concomitant danger of iron deposits form-ing outside the reticuloendothelial system. If values exceed this thresh-old during intravenous therapy, then a break in the therapy for a period of 3 months should be considered but erythropoietin treat-ment should be continued. Th e danger of iron overload in the context of parenteral substitution therapy adapted to iron losses of approximately 1.0–1.5 g per year can be considered to be low for hemodialysis pa-tients. In the maintenance phase a low-dose, high-frequency adminis-tration of iron (10 to a maximum of 20 mg iron saccharate per hemodialysis) is currently preferred.
As demonstrated by the results of determining CRP, IL-6 (interleu-kin-6), orosomucoid (alpha-1-acid-glycoprotein), and SAA (serum amyloid A), no acute phase reaction occurred in patients undergoing dialysis and receiving iron. Possible side-eff ects of long-term iron sup-plementation leading to ferritin values >400 μg/L are: increased risk of infection, elevated risk of developing carcinomas, and an increased car-diovascular risk [110, 135]. Iron overload should be avoided during rhu-EPO therapy with concomitant iron supplementation.
In the context of the therapy of uremic anemia, the erythropoietin doses administered should be matched to the individual needs of the patient because the amount required by the uremic patient can be sub-ject to considerable change. Th e dose can be signifi cantly reduced in
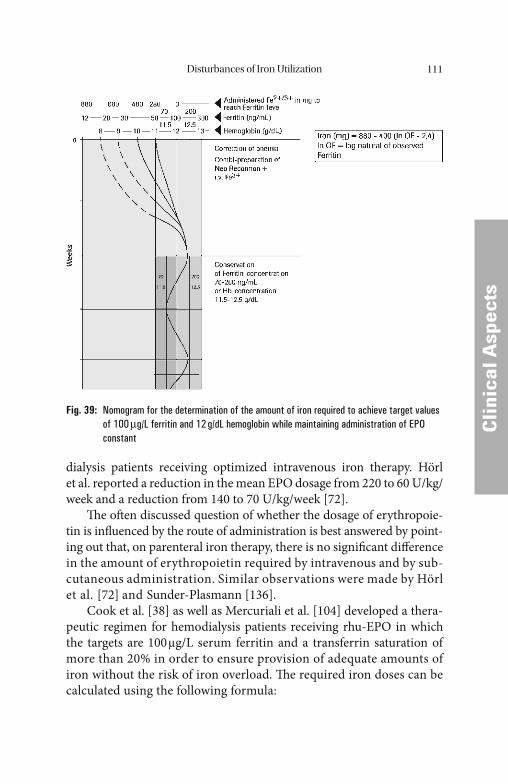
Disturbances of Iron Utilization 111
CCli
nica
l Asp
ects
dialysis patients receiving optimized intravenous iron therapy. Hörl et al. reported a reduction in the mean EPO dosage from 220 to 60 U/kg/week and a reduction from 140 to 70 U/kg/week [72].
Th e oft en discussed question of whether the dosage of erythropoie-tin is infl uenced by the route of administration is best answered by point-ing out that, on parenteral iron therapy, there is no signifi cant diff erence in the amount of erythropoietin required by intravenous and by sub-cutaneous administration. Similar observations were made by Hörl et al. [72] and Sunder-Plasmann [136].
Cook et al. [38] as well as Mercuriali et al. [104] developed a thera-peutic regimen for hemodialysis patients receiving rhu-EPO in which the targets are 100 μg/L serum ferritin and a transferrin saturation of more than 20% in order to ensure provision of adequate amounts of iron without the risk of iron overload. Th e required iron doses can be calculated using the following formula:
Fig. 39: Nomogram for the determination of the amount of iron required to achieve target values of 100 μg/L ferritin and 12 g/dL hemoglobin while maintaining administration of EPO constant
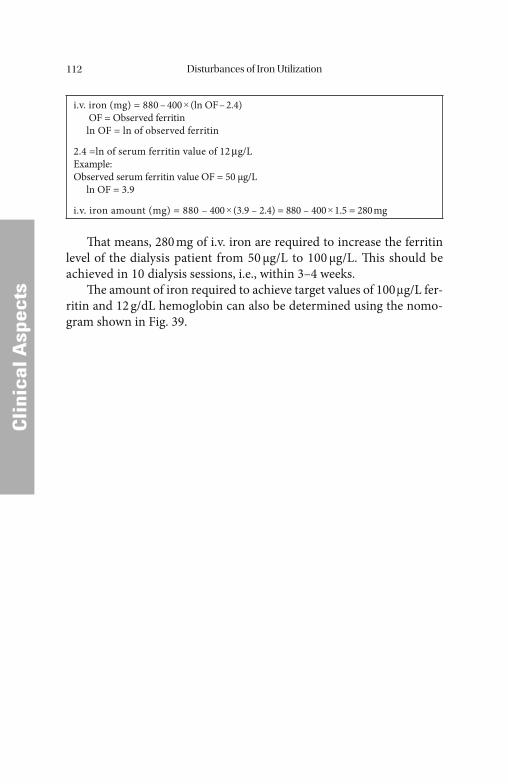
Disturbances of Iron Utilization112
CCli
nica
l Asp
ects
i.v. iron (mg) = 880 – 400 × (ln OF – 2.4) OF = Observed ferritin ln OF = ln of observed ferritin
2.4 =ln of serum ferritin value of 12 μg/LExample:Observed serum ferritin value OF = 50 μg/L ln OF = 3.9
i.v. iron amount (mg) = 880 – 400 × (3.9 – 2.4) = 880 – 400 × 1.5 = 280 mg
Th at means, 280 mg of i.v. iron are required to increase the ferritin level of the dialysis patient from 50 μg/L to 100 μg/L. Th is should be achieved in 10 dialysis sessions, i.e., within 3–4 weeks.
Th e amount of iron required to achieve target values of 100 μg/L fer-ritin and 12 g/dL hemoglobin can also be determined using the nomo-gram shown in Fig. 39.
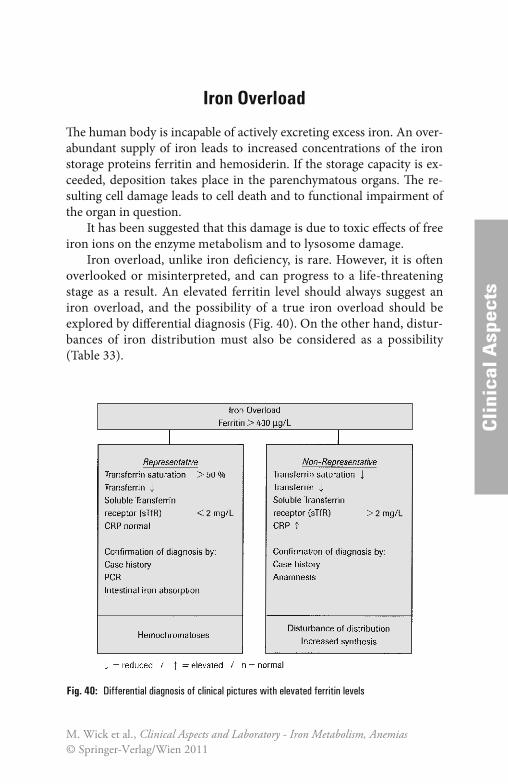
CCli
nica
l Asp
ects
Iron Overload
Th e human body is incapable of actively excreting excess iron. An over-abundant supply of iron leads to increased concentrations of the iron storage proteins ferritin and hemosiderin. If the storage capacity is ex-ceeded, deposition takes place in the parenchymatous organs. Th e re-sulting cell damage leads to cell death and to functional impairment of the organ in question.
It has been suggested that this damage is due to toxic eff ects of free iron ions on the enzyme metabolism and to lysosome damage.
Iron overload, unlike iron defi ciency, is rare. However, it is oft en overlooked or misinterpreted, and can progress to a life-threatening stage as a result. An elevated ferritin level should always suggest an iron overload, and the possibility of a true iron overload should be explored by diff erential diagnosis (Fig. 40). On the other hand, distur-bances of iron distribution must also be considered as a possibility (Table 33).
Fig. 40: Differential diagnosis of clinical pictures with elevated ferritin levels
M. Wick et al., Clinical Aspects and Laboratory - Iron Metabolism, Anemias© Springer-Verlag/Wien 2011
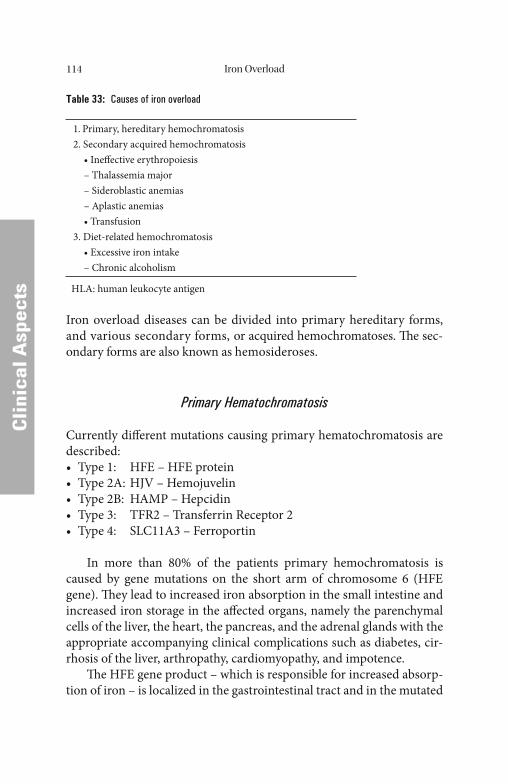
Iron Overload114
CCli
nica
l Asp
ects
Table 33: Causes of iron overload
1. Primary, hereditary hemochromatosis2. Secondary acquired hemochromatosis • Ineff ective erythropoiesis – Thalassemia major – Sideroblastic anemias – Aplastic anemias • Transfusion3. Diet-related hemochromatosis • Excessive iron intake – Chronic alcoholism
HLA: human leukocyte antigen
Iron overload diseases can be divided into primary hereditary forms, and various secondary forms, or acquired hemochromatoses. Th e sec-ondary forms are also known as hemosideroses.
Primary Hematochromatosis
Currently diff erent mutations causing primary hematochromatosis are described:• Type 1: HFE – HFE protein• Type 2A: HJV – Hemojuvelin• Type 2B: HAMP – Hepcidin• Type 3: TFR2 – Transferrin Receptor 2• Type 4: SLC11A3 – Ferroportin
In more than 80% of the patients primary hemochromatosis is caused by gene mutations on the short arm of chromosome 6 (HFE gene). Th ey lead to increased iron absorption in the small intestine and increased iron storage in the aff ected organs, namely the parenchymal cells of the liver, the heart, the pancreas, and the adrenal glands with the appropriate accompanying clinical complications such as diabetes, cir-rhosis of the liver, arthro pathy, cardiomyopathy, and impotence.
Th e HFE gene product – which is responsible for increased absorp-tion of iron – is localized in the gastrointestinal tract and in the mutated
Iron Overload 115
CCli
nica
l Asp
ects
form it is not capable of migrating out of the cell. Th e prevalence of the disease is between 4 and 14% in Europe with a signifi cant divide be-tween North and South.
Men are aff ected approximately 10 times more oft en than women by primary hemochromatosis which becomes clinically manifest between the ages of 35 and 55 and causes liver function disorders, diabetes mel-litus, dark pigmentation of the skin, cardiomyopathy, and resulting ar-rhythmia. Furthermore, complaints of the joints and symptoms due to secondary hypogonadism as well as adrenal gland insuffi ciency have been observed. In about 15% of those aff ected by the illness, liver cell carcinoma arises, which represents a 300-fold risk.
In primary hemochromatosis, the plasma ferritin level rises at a relatively late stage. Initially parenchymal cells of the liver, heart, and pancreas as well as other organs are overloaded with iron and only thereaft er is the reticuloendothelial system saturated. Ferritin values above 400 μg/L and a transferrin saturation of more than 50% signify existing iron overload. In the manifest stage of primary hemochroma-tosis, ferritin concentrations in serum are usually over 700 μg/L. Trans-ferrin is almost completely saturated.
Liver biopsy was the most appropriate in the past to conclusively diagnose primary hyperchromatosis, but a major advance has been made recently by the advent of identifying specifi c genetic changes for diagnosing the disease. Th e genetic defect can be identifi ed using a molecular biologic test. Hemochromatosis can be identifi ed in 80% of the cases using the simple and relatively economically feasible PCR and DNA sequencing technologies before the manifestation of clini-cal symptoms. Th is opens up the possibility of timely treatment such that late-stage complications like cirrhosis of the liver and cancer of the liver can be prevented.
Phlebotomy is still of widespread use. Th e aim of the therapy is to deplete iron stores as much as possible. Th e determination of the body iron status should be performed frequently at short intervals and in he-reditary hemochromatosis the determination of plasma ferritin has proven to be of worth. Th e progression of the clinical parameter deter-mines the necessity of continuing phlebotomy therapy. Phlebotomy at weekly, monthly or quarterly intervals may be necessary; however, the therapy should never completely cease. As described above, the aim of phlebotomy is to prevent a negative progression of the disease.
Iron Overload116
CCli
nica
l Asp
ects
Early identifi cation of patients at risk which has become possible by virtue of the molecular biologic detection of genetic defects can proba-bly drastically reduce the incidence of hepatocellular carcinomas. Careful monitoring is required using imaging procedures (sonography, computer tomography [CT], nuclear magnetic resonance [NMR]), and regular determination of the α-fetoprotein (AFP).
Secondary Hemochromatosis
Hematopoietic disorders with concomitant ineff ective or hypoplastic erythropoiesis such as thalassemia major, sideroblastic anemia or aplastic anemia are considered to be secondary or acquired hemochro-matoses. In contrast to primary hemochromatosis in the secondary form the cells of the reticuloendothelial system are initially overloaded with iron. Organ damage occurs at a relatively late stage. Th ey arise because of a redistribution of iron from the cells of the reticuloen-dothelial system into parenchymal cells of individual organs. Th e dura-tion of chronic iron overloading in secondary iron storage disorders is therefore a critical factor.
Acquired hemochromatoses can also develop from alimentary iron overload, parenteral administration of iron, and transfusions or other chronic diseases with ineff ective erythrocytopoiesis.
Alcoholics with chronic liver disease in whom iron deposits have been detected aft er liver biopsies but whose total body iron levels are within the non-pathologic range present a particular diagnostic challenge. Th e body’ s total iron reserves are normal. Such patients probably suff er from an alcohol-induced liver disease (toxic nutritive cirrhosis) and seem to acquire iron deposits as a result of cell necroses and iron up-take from such necrotic cells.
However, a second group of alcoholics has been identifi ed who have extremely high deposits of iron in their bodies and massive iron depos-its in the cirrhotic liver. Such patients may suff er from congenital pri-mary hemochromatosis with concomitant toxic nutritive liver disease. Th e molecular biologic detection of causative primary hemochromato-sis makes diff erential diagnosis more straightforward.
Patients suff ering from renal insuffi ciency on dialysis were fi rst treated with erythropoietin in 1988 and for this group of patients, iron overloading caused by transfusions should belong fi rmly to the past.
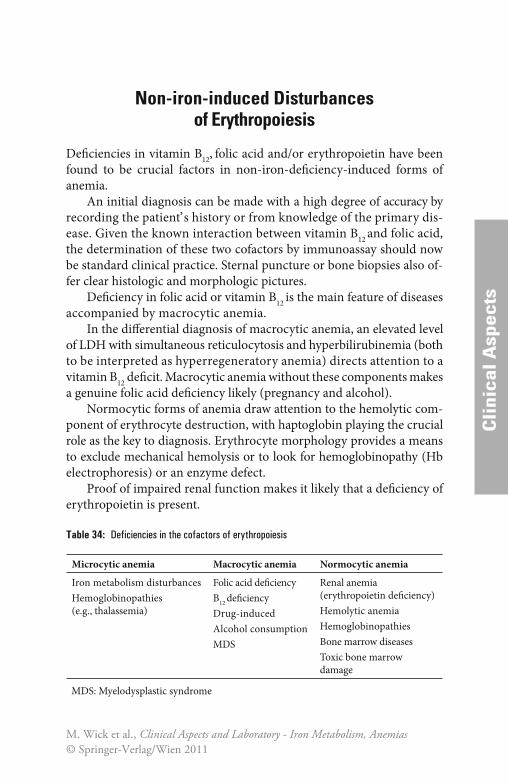
Cli
nica
l Asp
ects
Cli
nica
l Asp
ects
Non-iron-induced Disturbances of Erythropoiesis
Defi ciencies in vitamin B12, folic acid and/or erythropoietin have been found to be crucial factors in non-iron-defi ciency-induced forms of anemia.
An initial diagnosis can be made with a high degree of accuracy by recording the patient’ s history or from knowledge of the primary dis-ease. Given the known interaction between vitamin B12 and folic acid, the determination of these two cofactors by immunoassay should now be standard clinical practice. Sternal puncture or bone biopsies also of-fer clear histologic and morphologic pictures.
Defi ciency in folic acid or vitamin B12 is the main feature of diseases accompanied by macrocytic anemia.
In the diff erential diagnosis of macrocytic anemia, an elevated level of LDH with simultaneous reticulocytosis and hyperbilirubinemia (both to be interpreted as hyperregeneratory anemia) directs attention to a vitamin B12 defi cit. Macrocytic anemia without these components makes a genuine folic acid defi ciency likely (pregnancy and alcohol).
Normocytic forms of anemia draw attention to the hemolytic com-ponent of erythrocyte destruction, with haptoglobin playing the crucial role as the key to diagnosis. Erythrocyte morphology provides a means to exclude mechanical hemolysis or to look for hemoglobinopathy (Hb electrophoresis) or an enzyme defect.
Proof of impaired renal function makes it likely that a defi ciency of erythropoietin is present.
Table 34: Deficiencies in the cofactors of erythropoiesis
Microcytic anemia Macrocytic anemia Normocytic anemia
Iron metabolism disturbancesHemoglobinopathies(e.g., thalassemia)
Folic acid defi ciencyB12 defi ciencyDrug-inducedAlcohol consumptionMDS
Renal anemia(erythropoietin defi ciency)Hemolytic anemiaHemoglobinopathiesBone marrow diseasesToxic bone marrow damage
MDS: Myelodysplastic syndrome
M. Wick et al., Clinical Aspects and Laboratory - Iron Metabolism, Anemias© Springer-Verlag/Wien 2011
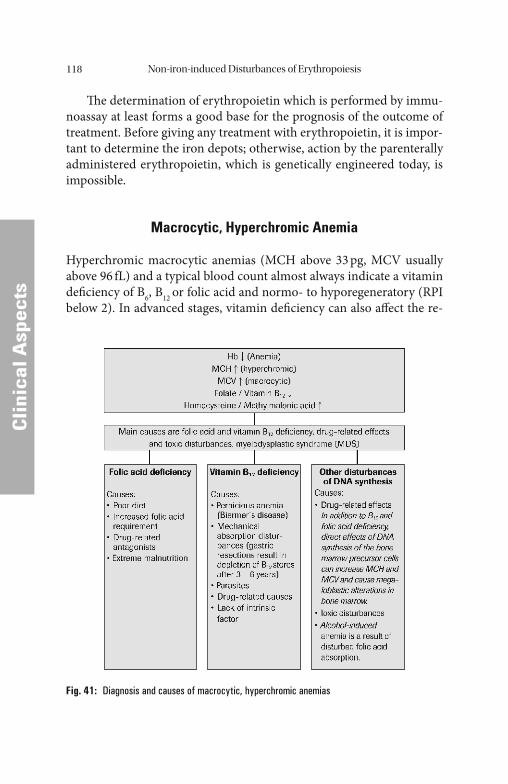
Non-iron-induced Disturbances of Erythropoiesis118
CCli
nica
l Asp
ects
Th e determination of erythropoietin which is performed by immu-noassay at least forms a good base for the prognosis of the outcome of treatment. Before giving any treatment with erythropoietin, it is impor-tant to determine the iron depots; otherwise, action by the parenterally administered erythropoietin, which is genetically engineered today, is impossible.
Macrocytic, Hyperchromic Anemia
Hyperchromic macrocytic anemias (MCH above 33 pg, MCV usually above 96 fL) and a typical blood count almost always indicate a vitamin defi ciency of B6, B12 or folic acid and normo- to hyporegeneratory (RPI below 2). In advanced stages, vitamin defi ciency can also aff ect the re-
Fig. 41: Diagnosis and causes of macrocytic, hyperchromic anemias
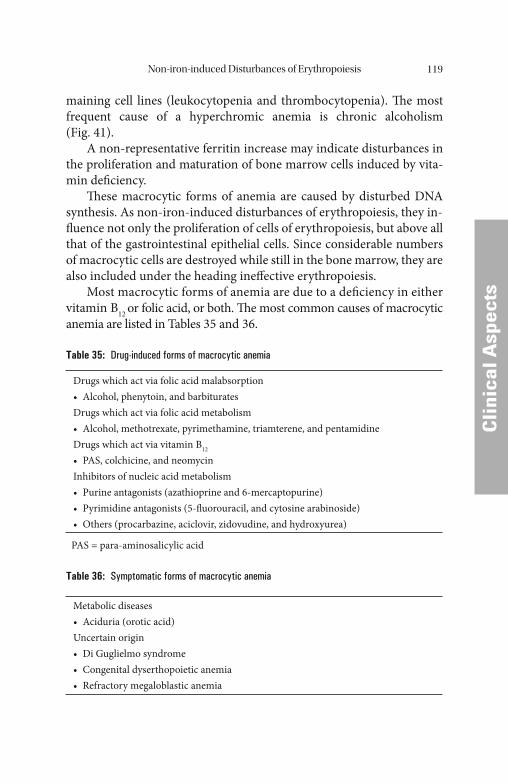
Non-iron-induced Disturbances of Erythropoiesis 119
CCli
nica
l Asp
ects
maining cell lines (leukocytopenia and thrombocytopenia). Th e most frequent cause of a hyperchromic anemia is chronic alcoholism (Fig. 41).
A non-representative ferritin increase may indicate disturbances in the proliferation and maturation of bone marrow cells induced by vita-min defi ciency.
Th ese macrocytic forms of anemia are caused by disturbed DNA synthesis. As non-iron-induced disturbances of erythropoiesis, they in-fl uence not only the proliferation of cells of erythropoiesis, but above all that of the gastrointestinal epithelial cells. Since considerable numbers of macrocytic cells are destroyed while still in the bone marrow, they are also included under the heading ineff ective erythropoiesis.
Most macrocytic forms of anemia are due to a defi ciency in either vitamin B12 or folic acid, or both. Th e most common causes of macrocytic anemia are listed in Tables 35 and 36.
Table 35: Drug-induced forms of macrocytic anemia
Drugs which act via folic acid malabsorption• Alcohol, phenytoin, and barbituratesDrugs which act via folic acid metabolism• Alcohol, methotrexate, pyrimethamine, triamterene, and pentamidineDrugs which act via vitamin B12
• PAS, colchicine, and neomycinInhibitors of nucleic acid metabolism• Purine antagonists (azathioprine and 6-mercaptopurine)• Pyrimidine antagonists (5-fl uorouracil, and cytosine arabinoside)• Others (procarbazine, aciclovir, zidovudine, and hydroxyurea)
PAS = para-aminosalicylic acid
Table 36: Symptomatic forms of macrocytic anemia
Metabolic diseases• Aciduria (orotic acid)Uncertain origin• Di Guglielmo syndrome• Congenital dyserthopoietic anemia• Refractory megaloblastic anemia
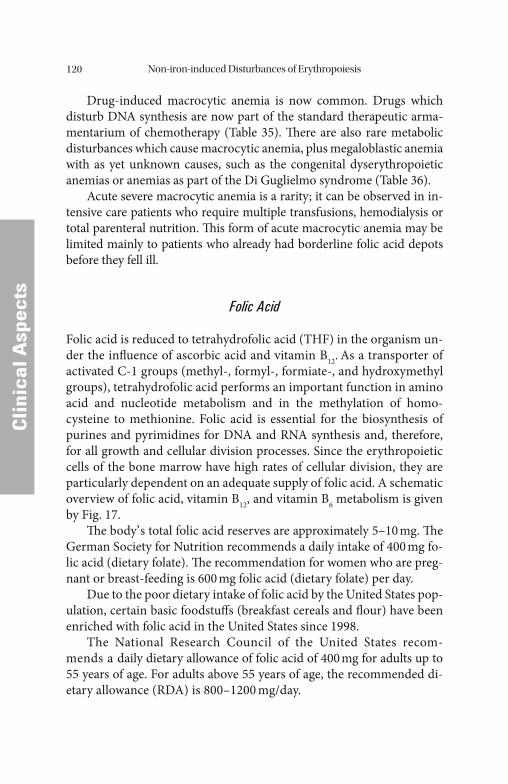
Non-iron-induced Disturbances of Erythropoiesis120
CCli
nica
l Asp
ects
Drug-induced macrocytic anemia is now common. Drugs which disturb DNA synthesis are now part of the standard therapeutic arma-mentarium of chemotherapy (Table 35). Th ere are also rare metabolic disturbances which cause macrocytic anemia, plus megaloblastic anemia with as yet unknown causes, such as the congenital dyserythropoietic anemias or anemias as part of the Di Guglielmo syndrome (Table 36).
Acute severe macrocytic anemia is a rarity; it can be observed in in-tensive care patients who require multiple transfusions, hemodialysis or total parenteral nutrition. Th is form of acute macrocytic anemia may be limited mainly to patients who already had borderline folic acid depots before they fell ill.
Folic Acid
Folic acid is reduced to tetrahydrofolic acid (THF) in the organism un-der the infl uence of ascorbic acid and vitamin B12. As a transporter of activated C-1 groups (methyl-, formyl-, formiate-, and hydroxymethyl groups), tetrahydrofolic acid performs an important function in amino acid and nucleotide metabolism and in the methylation of homo-cysteine to methionine. Folic acid is essential for the biosynthesis of purines and pyrimidines for DNA and RNA synthesis and, therefore, for all growth and cellular division processes. Since the erythropoietic cells of the bone marrow have high rates of cellular division, they are particularly dependent on an adequate supply of folic acid. A schematic overview of folic acid, vitamin B12, and vitamin B6 metabolism is given by Fig. 17.
Th e body’ s total folic acid reserves are approximately 5–10 mg. Th e German Society for Nutrition recommends a daily intake of 400 mg fo-lic acid (dietary folate). Th e recommendation for women who are preg-nant or breast-feeding is 600 mg folic acid (dietary folate) per day.
Due to the poor dietary intake of folic acid by the United States pop-ulation, certain basic foodstuff s (breakfast cereals and fl our) have been enriched with folic acid in the United States since 1998.
The National Research Council of the United States recom-mends a daily dietary allowance of folic acid of 400 mg for adults up to 55 years of age. For adults above 55 years of age, the recommended di-etary allowance (RDA) is 800–1200 mg/day.
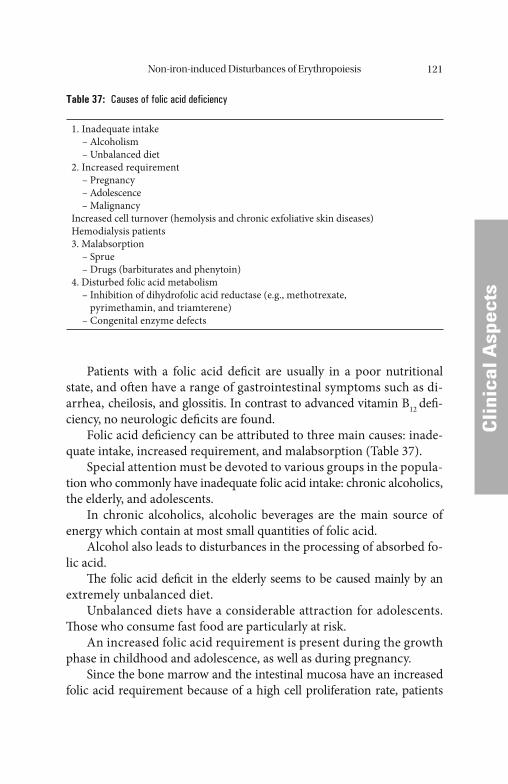
Non-iron-induced Disturbances of Erythropoiesis 121
CCli
nica
l Asp
ects
Patients with a folic acid defi cit are usually in a poor nutritional state, and oft en have a range of gastrointestinal symptoms such as di-arrhea, cheilosis, and glossitis. In contrast to advanced vitamin B12 defi -ciency, no neurologic defi cits are found.
Folic acid defi ciency can be attributed to three main causes: inade-quate intake, increased requirement, and malabsorption (Table 37).
Special attention must be devoted to various groups in the popula-tion who commonly have inadequate folic acid intake: chronic alcoholics, the elderly, and adolescents.
In chronic alcoholics, alcoholic beverages are the main source of energy which contain at most small quantities of folic acid.
Alcohol also leads to disturbances in the processing of absorbed fo-lic acid.
Th e folic acid defi cit in the elderly seems to be caused mainly by an extremely unbalanced diet.
Unbalanced diets have a considerable attraction for adolescents. Th ose who consume fast food are particularly at risk.
An increased folic acid requirement is present during the growth phase in childhood and adolescence, as well as during pregnancy.
Since the bone marrow and the intestinal mucosa have an increased folic acid requirement because of a high cell proliferation rate, patients
Table 37: Causes of folic acid deficiency
1. Inadequate intake – Alcoholism – Unbalanced diet2. Increased requirement – Pregnancy – Adolescence – MalignancyIncreased cell turnover (hemolysis and chronic exfoliative skin diseases)Hemodialysis patients3. Malabsorption – Sprue – Drugs (barbiturates and phenytoin)4. Disturbed folic acid metabolism – Inhibition of dihydrofolic acid reductase (e.g., methotrexate,
pyrimethamin, and triamterene) – Congenital enzyme defects
Non-iron-induced Disturbances of Erythropoiesis122
CCli
nica
l Asp
ects
with hematologic diseases, especially those with increased erythropoiesis, may not be able to meet their increased folic acid requirement from their dietary intake.
Disturbances in the absorption of folic acid occur in both tropical sprue and gluten enteropathy. Manifest macrocytic anemia may develop in both clinical pictures. Other signs of malabsorption may also occur. Alcohol-induced folic acid defi ciency may to a certain extent also be caused by malabsorption. Diseases of the small intestine may also pre-vent the absorption of folic acid.
Th e folic acid absorption test is used as a general, practical means for detecting malabsorption. For this test the patient is given 1 mg folic acid i.v. or i.m. per day on the 4 days preceding the examination. Th is serves to make up any folic acid defi ciency in the tissue which could af-fect the absorption test and produce a false positive result (no measur-able increase in the serum folic acid concentration aft er oral ingestion). On the day of the examination the fasting patient is given 40 mg/kg folic acid orally, and the serum folic acid concentration is determined at the following times: 0, 60, and 120 minutes. In normal patients the serum concentration rises to over 7 mg/L.
Folic acid is absorbed in the entire small intestine, so that the sub-stance is suitable for a test of small-intestine absorption. Data on nor-mal serum concentrations vary from laboratory to laboratory, but do not diverge to any great extent [44]. Findings by Brouwer [27], however, suggest that the currently used reference range should be corrected.
Low levels of folic acid in the serum or in the erythrocytes are a defi nite indication of folic acid defi ciency. Th is condition is treated by oral replacement therapy, with 1 mg folic acid being administered dai-ly. Th e reaction to the replacement therapy is similar to that in B12 de-fi ciency, i.e. within 5–7 days there is an increase in the number of reticulocytes and the blood count returns to normal within 2–3 months.
Due to the disturbed development of erythrocyte, a defi ciency of folic acid or vitamin B12 can lead to the formation of a macrocytic or megaloblastic anemia. Cell division in the erythropoietic cells in the bone marrow is slowed, so that megalocytes, instead of normal erythro-cytes (normocytes), are formed. Megalocytes contain too much hemo-globin as compared to normal red blood cells.
Non-iron-induced Disturbances of Erythropoiesis 123
CCli
nica
l Asp
ects
To prevent neural tube defects, women who desire to become preg-nant are recommended to begin early replacement of 0.4–0.8 mg folic acid per day.
Folic acid replacement can mask a defi ciency of vitamin B12 (sec-ondary folic acid defi ciency in patients with pernicious anemia). Vita-min B12 returns N-methyl-tetrahydrofolic acid to tetrahydrofolic acid, which is important for DNA synthesis. Although inhibition of this con-version by vitamin B12 defi ciency can be compensated by administering folic acid, the danger of severe neurologic damage remains. Th e main cause of folic acid defi ciency is an inadequate supply in the food (alco-holism, unbalanced diets, and drugs). If these factors are not present in the patient’ s history, a B12 defi ciency should also be ruled out.
Vitamin B12
Cobalamin contained in food is taken up as methyl-cobalamin, hy-droxy-cobalamin, and deoxyadenosyl-cobalamin. In the acid environ-ment of the stomach cobalamin is released from the food proteins bound to the R-protein which is produced by the salivary glands and is present in the gastric juice. Cobalamin has a severalfold higher affi nity to R-protein than to intrinsic factor.
In the duodenum, given a neutral pH, the R-protein is broken down by pancreatic peptidases and cobalamin is released. Th e latter now binds to intrinsic factor and the intrinsic factor-cobalamin complex moves on to the ileum. Once there, the complex binds to a specifi c receptor of the mucosal cell. Cobalamin is absorbed, reaches the portal venous blood, and then a portion of it binds to transcobalamin II which is synthesized by the endothelial cells of the blood vessels. Th e major portion of coba-lamin, however, is bound to transcobalamins I and III; both of these proteins are synthesized by granulocytes. However, the tissue only takes up cobalamin bound to transcobalamin II. In the cells, cobalamin II is transformed into its active forms (5 -deoxyadenosyl-cobalamin and methylcobalamin).
Th ese substances are involved in the biosynthesis of purine and py-rimidine bases, the synthesis of methionine from homocysteine, in the regeneration of N-methyl-tetrahydrofolic acid (secondary folic acid de-fi ciency in patients with pernicious anemia) and the formation of my-
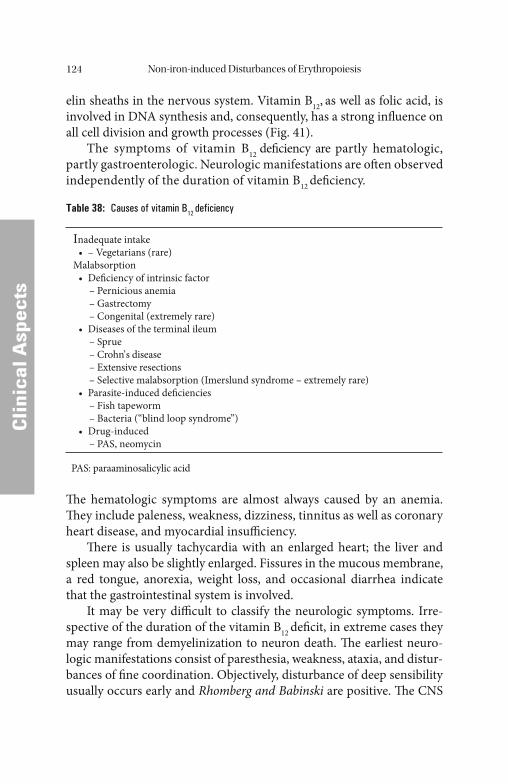
Non-iron-induced Disturbances of Erythropoiesis124
Cli
nica
l Asp
ects
Cli
nica
l Asp
ects
elin sheaths in the nervous system. Vitamin B12, as well as folic acid, is involved in DNA synthesis and, consequently, has a strong infl uence on all cell division and growth processes (Fig. 41).
The symptoms of vitamin B12 defi ciency are partly hematologic, partly gastroenterologic. Neurologic manifestations are oft en observed independently of the duration of vitamin B12 defi ciency.
Table 38: Causes of vitamin B12 deficiency
Inadequate intake • – Vegetarians (rare)Malabsorption • Defi ciency of intrinsic factor – Pernicious anemia – Gastrectomy – Congenital (extremely rare) • Diseases of the terminal ileum – Sprue – Crohn’ s disease – Extensive resections – Selective malabsorption (Imerslund syndrome – extremely rare) • Parasite-induced defi ciencies – Fish tapeworm – Bacteria (“blind loop syndrome”) • Drug-induced – PAS, neomycin
PAS: paraaminosalicylic acid
Th e hematologic symptoms are almost always caused by an anemia. Th ey include paleness, weakness, dizziness, tinnitus as well as coronary heart disease, and myocardial insuffi ciency.
Th ere is usually tachycardia with an enlarged heart; the liver and spleen may also be slightly enlarged. Fissures in the mucous membrane, a red tongue, anorexia, weight loss, and occasional diarrhea indicate that the gastrointestinal system is involved.
It may be very diffi cult to classify the neurologic symptoms. Irre-spective of the duration of the vitamin B12 defi cit, in extreme cases they may range from demyelinization to neuron death. Th e earliest neuro-logic manifestations consist of paresthesia, weakness, ataxia, and distur-bances of fi ne coordination. Objectively, disturbance of deep sensibility usually occurs early and Rhomberg and Babinski are positive. Th e CNS
Non-iron-induced Disturbances of Erythropoiesis 125
Cli
nica
l Asp
ects
Cli
nica
l Asp
ects
symptoms range from forgetfulness to severe forms of dementia or psy-choses. Th ese neurologic conditions may long precede the hematologic manifestations, but as a rule hematologic symptoms predominate in the average patient.
Th e main cause of vitamin B12 defi ciency, the pernicious anemia, is a defi ciency of intrinsic factor. It is generally accompanied by atrophy of the gastric mucosa.
Vitamin B12 defi ciency shows geographical clustering in Northern Europe. It is generally a disease aff ecting the elderly beyond the age of 60; it is less common in children younger than 10 years old. It is found with striking frequency in black patients.
Th e current view about the pathogenesis of pernicious anemia is that it is produced by an autoimmune process directed against the pari-etal cells of the stomach. It is therefore most marked in patients with clinical pictures attributed to autoimmune diseases, such as immune hy-perthyroidism, myxedema, idiopathic adrenal insuffi ciency, vitiligo, and hypoparathyroidism. Antibodies against parietal cells can be detected in 90% of patients with pernicious anemia. Th e detection of these antibod-ies does not however mean that the pernicious anemia is necessarily manifest. Th e incidence of antibodies to intrinsic factor is about 60%.
Given the pathologic mechanism involved, hypoacidity or anacidity is the rule, patients oft en have gastric polyps, and the incidence of stom-ach cancer doubles that in the normal population. If the source of the intrinsic factor is destroyed such as by total gastrectomy or by extensive destruction of the gastric mucosa (for example by corrosion) megalo-blastic anemia may develop.
It should also not be forgotten that a number of bacteria in the in-testinal fl ora require vitamin B12. Defi ciency syndromes may thus de-velop aft er anatomical lesions as a result of massive bacterial proliferation. Defi ciency symptoms may also occur as a result of stric-tures, diverticula, and the blind loop syndrome. Th ey may also occur with pseudo-obstruction in diabetes mellitus as a result of amyloid de-posits, or in scleroderma. Vitamin B12-defi ciency anemia is also known to occur as a result of tropical sprue and the fi sh tapeworm. Most of these clinical pictures are also accompanied by malabsorption syn-dromes, oft en with steatorrhea.
Regional enteritis, Whipple’ s disease and tuberculosis may be accom-panied by disturbances of vitamin B12 absorption. Th is also applies to
Non-iron-induced Disturbances of Erythropoiesis126
Cli
nica
l Asp
ects
Cli
nica
l Asp
ects
chronic pancreatitis, in rare instances to Zollinger-Ellison syndrome, and segmental diseases of the ileum.
Defects of absorption of vitamin B12 used to be detected by the Schilling test. Th is test has been replaced by the determination of pari-etal cell antibodies and antibodies against intrinsic factor.
Hereditary megaloblastic anemia is extremely rare; it is caused by congenital disturbances of orotic acid metabolism or, in Lesch-Nyhan syndrome, by the disturbance of enzymes involved in folic acid metabolism.
Th e most frequent cause of B12 defi ciency is a lack of intrinsic factor, as in pernicious anemia or aft er a total gastrectomy. Reduced absorption in the ileum aft er extensive surgical resection or in Crohn’ s disease may also be a cause. All other causes have little practical relevance. Vitamin B12 must therefore be administered parenterally.
On account of the neurologic and neuropsychiatric syndromes, which may also occur without blood count changes, and which are only then are defi nitely reversible if they have been present for less than 6 months, an initial high-dose treatment regimen has been established. Th is is a stepped regimen, in which 200 μg vitamin B12 is administered intramuscularly daily during the fi rst week of therapy, followed by one intramuscular in-jection per week for 1 month and then monthly i.m. administration of 200 μg for the rest of the patient’ s life. It should be pointed out again that pernicious anemia is a life-long disease and that if the monthly treatment is interrupted, inevitably a vitamin defi ciency will develop.
Clinical improvement is usually seen immediately aft er the admin-istration of vitamin B12. Between the 5th and 7th day, if there are suffi -cient iron reserves, the so-called reticulocytic crisis appears and within 2 months the peripheral blood count returns to normal. Th e CNS symp-toms and their neurologic manifestations return to normal as well.
Normochromic, Normocytic Anemia
If the individual erythrocyte contains a normal amount of hemoglobin (MCH 28–33 pg/cell) despite the lowering of the patient’ s hemoglobin value, then iron defi ciency is apparently not the problem in this case, but rather the erythrocyte balance between formation and decomposi-tion. Th is balance is refl ected in the reticulocyte count:
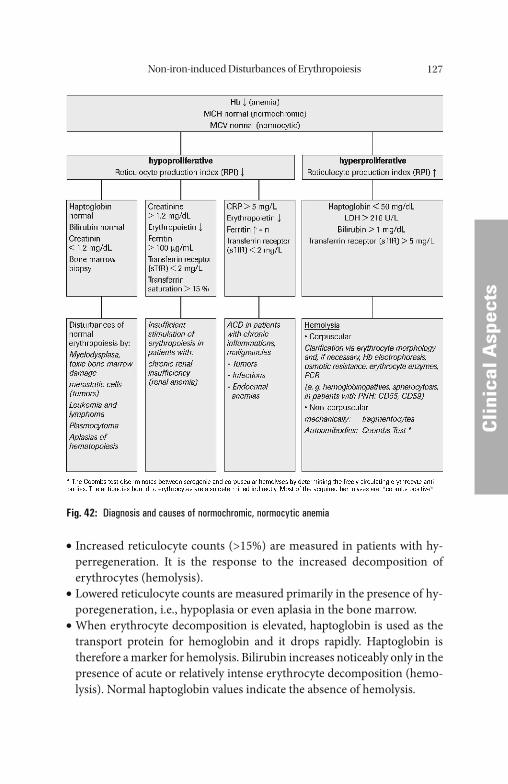
Non-iron-induced Disturbances of Erythropoiesis 127
Cli
nica
l Asp
ects
Cli
nica
l Asp
ects
Increased reticulocyte counts (>15%) are measured in patients with hy-• perregeneration. It is the response to the increased decomposition of erythrocytes (hemolysis). Lowered reticulocyte counts are measured primarily in the presence of hy-• poregeneration, i.e., hypoplasia or even aplasia in the bone marrow. When erythrocyte decomposition is elevated, haptoglobin is used as the • transport protein for hemoglobin and it drops rapidly. Haptoglobin is therefore a marker for hemolysis. Bilirubin increases noticeably only in the presence of acute or relatively intense erythrocyte decomposition (hemo-lysis). Normal haptoglobin values indicate the absence of hemolysis.
“ ”
Fig. 42: Diagnosis and causes of normochromic, normocytic anemia
Non-iron-induced Disturbances of Erythropoiesis128
CCli
nica
l Asp
ects
Normocytic anemia generally occurs during acute blood loss, in hemolysis and as a result of renal failure or endocrine disturbances.
Besides the formal pathologic classifi cation of anemia into microcyt-ic, macrocytic and normocytic, diff erentiation by origin has now become established, especially in disturbances of erythropoiesis. Th e hemolytic anemias (cell trauma and membrane abnormality), enzyme disturbances (glucose-6-phosphate-dehydrogenase defect), and disturbances of hemo-globin synthesis have become clinically the most important.
Extracorpuscular Hemolytic Anemias
Hemolytic anemia is generally an acquired autoimmune hemolytic ane-mia. A common form of diff erentiation is based on the thermal behav-ior of the antibodies, as warm or cold antibodies.
Th e most common clinical pictures of symptomatic hemolytic ane-mia are summarized in Table 39.
Table 39: Antibody-induced hemolytic anemia
Warm antibodies • Idiopathic • Lymphomas • Other neoplasms (rare) • SLE (systemic lupus erythrematodes) • DrugsCold antibodies • Cold agglutininsInfections (generally acute)LymphomaIdiopathic • Paroxysmal cold hemoglobinuriaAlloantibodies • Blood transfusionsPregnancies
In the detection of hemolysis, the determination of haptoglobin and LDH in particular has proved to be diagnostically useful test. Aft er the occurrence of intravascular hemolysis, the serum haptoglobin concen-tration drops rapidly. Th is is attributable to the very short half-life of the haptoglobin-hemoglobin complex of only about 8 minutes. In its
Non-iron-induced Disturbances of Erythropoiesis 129
CCli
nica
l Asp
ects
function as a transport (and acute-phase) protein it binds free hemo-globin and transports it extremely rapidly to the reticuloendothelial system for degradation.
Haptoglobin is therefore well suited for the diagnosis and assessment of the course of hemolytic diseases. Sharply decreased haptoglobin levels indicate intravascular hemolysis which may have immunohemolytic, mi-croangiopathic, mechanical, drug (G-6-P-dehydrogenase defi ciency) or infectious causes (e.g., malaria). Extravascular hemolysis (e.g., ineff ective erythropoiesis and hypersplenism), on the other hand, shows a drop in haptoglobin only in hemolytic crises. Reduced haptoglobin levels may also be congenital (albeit rarely in Europe). Th ey may also be observed in other, non-hemolytic diseases, e.g. in liver diseases and in malabsorption syndrome. Since the LDH concentration in the erythrocytes is about 360 times higher than in the plasma, with hemolytic processes there is a rise in LDH. Th e LDH increase stands in direct relationship to the erythro-cyte destruction. A particularly large rise in LDH can be observed in hemolytic crises. Hemolytic anemia caused by a circulatory trauma is characterized by the occurrence of burr and helmet cells. Th e most im-portant causes of hemolytic anemia are listed in Table 40.
Table 40: Mechanically induced forms of hemolytic anemia
Microangiopathies• Splenomegaly• Hemolytic uremic syndrome (HUS)• Th rombotic thrombocytopenic purpura (TTP)• Cirrhosis of the liver• EclampsiaProsthetic heart valvesExtracorporeal pump systems• Hemodialysis• Hemofi ltration• Extracorporeal oxygenation
Corpuscular Anemias
Th e most important of the enzyme defects is glucose-6-phosphate de-hydrogenase defi ciency with all its genetically fi xed variants, of which favism is now clinically the best known form.
Non-iron-induced Disturbances of Erythropoiesis130
CCli
nica
l Asp
ects
Th e hemoglobinopathy that has attained most importance is sickle cell anemia in all its variants; Met-hemoglobin (met-Hb) is also worthy of mention as the cause of familiar cyanosis. Th e hemoglobinopathies also include all variants of thalassemia, a disorder which is gaining im-portance with the increasing mobility of the world’ s population. Th ese hemoglobinopathies generally present a variable morphologic picture with target cells. A clear diagnosis can be made only by hemoglobin elec-trophoresis or by high-pressure liquid chromatography (HPLC).
Erythropoietin Therapy of Other Diseases
Erythropoietin is used successfully in patients with disturbances of iron utilization and distribution, chronic diseases and to promote erythropoi-esis in individuals donating blood for their own use in planned orthope-dic surgery.
EPO is now produced using recombinant genetic engineering tech-niques. When expressed in mammalian cells, EPO receives the neces-sary high portion of carbohydrates. Th e half-life of intravenously administered EPO is about 5 hours [61].
A very successful therapy with erythropoietin is used with anemic AIDS patients. In patients with hemoblastoses and malignancies on chemotherapy, the suppression of erythropoiesis – which is oft en a re-sult of intensive chemotherapy – can be overcome with erythropoietin therapy.
A new therapeutic strategy using EPO has been used successfully in treating anemic newborns. Due to the relative hypoxia during intrauter-ine growth, newborns have a polycythemia. In adapting to the environ-mental conditions, erythropoiesis is slowed greatly aft er birth. Th e reduced erythropoiesis leads to physiologic anemia in newborns aft er 8–12 weeks. Aft er that, the level of erythropoietin rises once more, and erythropoiesis reaches a normal level. Symptoms of anemia are rarely observed in ma-ture newborns, although aggravating factors occur with premature in-fants. Th e number of erythrocytes is lower at birth than in mature newborns, and their erythrocyte life span is shorter. Premature infants therefore oft en tend to develop anemias.
Approximately 50% of all premature infants have a Hb concentra-tion less than 9 g/dL. Th is development of anemia can be bridged by the
Non-iron-induced Disturbances of Erythropoiesis 131
CCli
nica
l Asp
ects
administration of erythropoietin, and it can replace the transfusion ther-apy used in the past. Additional iron replacement is recommended.
Increasingly, autologous blood donations are being set aside by patients before they undergo a planned surgical procedure in order to avoid the risk of contracting HIV or hepatitis if they should require a blood transfusion. Th e risk of contracting an infection from a homologous conserved blood donation is about 1:106 for an HIV in-fection, 1:50,000 for a hepatitis B infection, and 1:5000 for a hepatitis C infection.
Th e indications for replacement therapy with erythropoietin are in-creasing. Th e eff ectiveness of the therapy must be monitored at all times, however, in order to determine the response rate and to control the therapy.
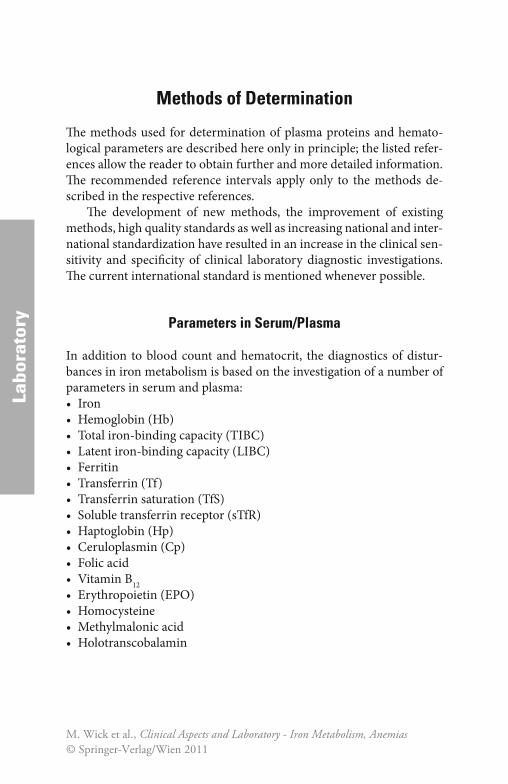
Labo
rato
ryLa
bora
tory
Methods of Determination
Th e methods used for determination of plasma proteins and hemato-logical parameters are described here only in principle; the listed refer-ences allow the reader to obtain further and more detailed information. Th e recommended reference intervals apply only to the methods de-scribed in the respective references.
Th e development of new methods, the improvement of existing methods, high quality standards as well as increasing national and inter-national standardization have resulted in an increase in the clinical sen-sitivity and specifi city of clinical laboratory diagnostic investigations. Th e current international standard is mentioned whenever possible.
Parameters in Serum/Plasma
In addition to blood count and hematocrit, the diagnostics of distur-bances in iron metabolism is based on the investigation of a number of parameters in serum and plasma:• Iron• Hemoglobin (Hb)• Total iron-binding capacity (TIBC)• Latent iron-binding capacity (LIBC)• Ferritin• Transferrin (Tf)• Transferrin saturation (TfS)• Soluble transferrin receptor (sTfR)• Haptoglobin (Hp)• Ceruloplasmin (Cp)• Folic acid• Vitamin B12• Erythropoietin (EPO)• Homocysteine• Methylmalonic acid• Holotranscobalamin
M. Wick et al., Clinical Aspects and Laboratory - Iron Metabolism, Anemias© Springer-Verlag/Wien 2011
Methods of Determination 133
LLabo
rato
ry
Iron
In addition to the colorimetric methods, which are by far the most com-monly used, atomic absorption spectrophotometry (AAS) and poten-tiostatic coulometry are also available as special techniques. More than 95% of all iron determinations in clinical laboratories are performed colorimetrically using routine analyzers.
All the colorimetric methods developed for the determination of iron have the following steps in common:• Liberation of the Fe3+ ions from the transferrin complex by acids or
tensides.• Reduction of Fe3+ ions to Fe2+ ions by ascorbate, thioglycolate, or
hydroxylamine.• Reaction of the Fe2+ ions to form a colored complex
Th e complexing agents used nowadays are bathophenanthroline and FerroZine® (Hach Chemical Co., Ames, Iowa/USA). FerroZine® has a higher extinction coeffi cient than bathophenanthroline and its solu-bility is also better.
Reference methods for the determination of serum/plasma iron have been proposed by the International Committee for Standardiza-tion in Hematology (ICSH) [75] and more recently by the Center of Disease Control (CDC) [144].
Th e method recommended in 1972 by the ICSH uses 2 mol/L hy-drochloric acid for the liberation and thioglycolic acid for the reduction of the Fe3+ ions. Th e complexing agent in the ICSH reagent is batho-phenanthroline-disulfonate.
Th e CDC proposal is a method with sample deproteinization by trichloroacetic acid, and with reduction by ascorbic acid. Th e complex-ing agent is FerroZine®.
Th e various methods available for the determination of iron on routine clinical chemistry analyzers generally do not involve a precipitation step.
Th e serum iron level shows a distinct circadian rhythm. Th ere is also a considerable day-to-day variation. In serum, iron is bound to proteins. Th e collection of blood samples must therefore be standardized with respect to time, body position, and venous occlusion.
Iron is one of the trace elements, with a concentration in the serum similar to those of copper and zinc. Contamination must therefore be avoided during the collection and preparation of samples.
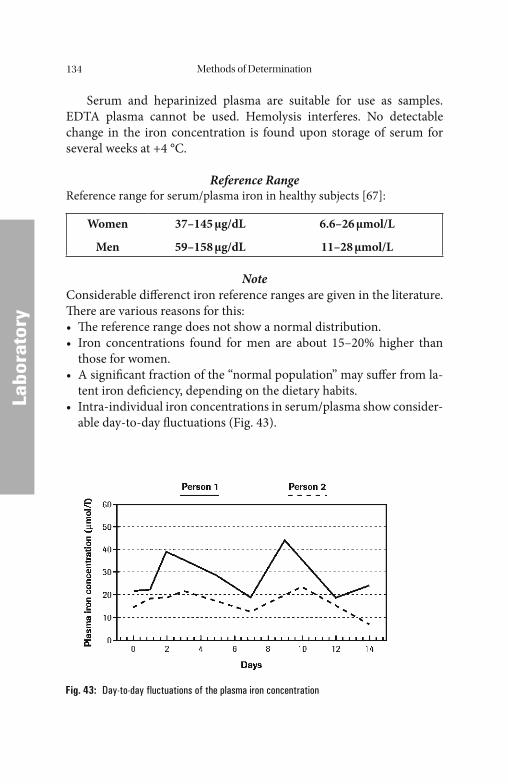
Methods of Determination134
LLabo
rato
ry
Serum and heparinized plasma are suitable for use as samples. EDTA plasma cannot be used. Hemolysis interferes. No detectable change in the iron concentration is found upon storage of serum for several weeks at +4 °C.
Reference RangeReference range for serum/plasma iron in healthy subjects [67]:
Women
Men
37–145 μg/dL
59–158 μg/dL
6.6–26 μmol/L
11–28 μmol/L
NoteConsiderable diff erenct iron reference ranges are given in the literature. Th ere are various reasons for this:• Th e reference range does not show a normal distribution.• Iron concentrations found for men are about 15–20% higher than
those for women.• A signifi cant fraction of the “normal population” may suff er from la-
tent iron defi ciency, depending on the dietary habits.• Intra-individual iron concentrations in serum/plasma show consider-
able day-to-day fl uctuations (Fig. 43).
Fig. 43: Day-to-day fluctuations of the plasma iron concentration
Methods of Determination 135
LLabo
rato
ry
Iron Saturation (Total Iron-Binding Capacity and Latent Iron-Binding Capacity)
Th ese methods have now been largely replaced by the determination of transferrin and of the transferrin saturation.
Th e Total Iron-Binding Capacity (TIBC) is the quantity of iron that can be bound by transferrin in a specifi ed volume of serum.
Th e Latent Iron-Binding Capacity (LIBC) is the result obtained when the quantity of iron actually present is subtracted from the TIBC.
Th e following relation exists:
TIBC = LIBC + Plasma Iron
Th e TIBC is measured in the routine laboratory according to Ram-say, and is performed in parallel with the determination of iron: An ex-cess of Fe3+ ions is added to the serum to saturate the transferrin. Th e unbound Fe3+ ions are then precipitated with basic magnesium carbon-ate. Aft er centrifugation, the iron in the clear supernatant is measured.
Iron-Binding Proteins
All methods for the determination of plasma proteins such as ferritin and transferrin are based on the reaction between an antigen and an antibody. Th is reaction leads to the formation of an immune complex of antigen.
Th e initially formed antigen-antibody complex cannot be observed directly if the antigen concentration is very low. In this case either the antigen or the antibody must be labeled in order to make a measure-ment possible. Th e label may be, e.g. an enzyme, a radioactive isotope, a luminescence-producing substance, or a fl uorescent dye. Th ese indirect methods are particularly suitable for the determination of very low an-tigen concentrations, as in the case of ferritin. Th e indirect methods re-quire an extra step to remove unbound antibody or antigen usually from a solid phase reagent (heterogeneous immunoassay).
With higher antigen concentrations, the initial reaction between the antigen and the antibody may be followed by agglutination or precipita-tion as a secondary reaction. Th e results can then be measured directly, and are oft en visible. Th ese direct methods are particularly suitable for
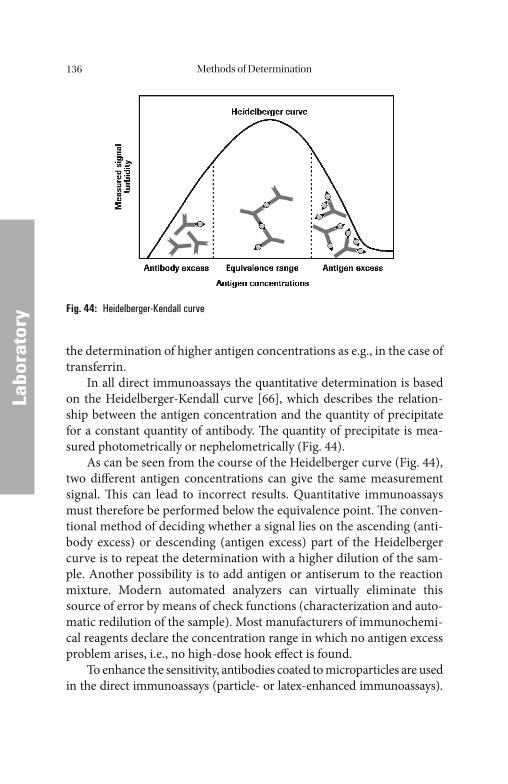
Methods of Determination136
LLabo
rato
ry
the determination of higher antigen concentrations as e.g., in the case of transferrin.
In all direct immunoassays the quantitative determination is based on the Heidelberger-Kendall curve [66], which describes the relation-ship between the antigen concentration and the quantity of precipitate for a constant quantity of antibody. Th e quantity of precipitate is mea-sured photometrically or nephelometrically (Fig. 44).
As can be seen from the course of the Heidelberger curve (Fig. 44), two diff erent antigen concentrations can give the same measurement signal. Th is can lead to incorrect results. Quantitative immunoassays must therefore be performed below the equivalence point. Th e conven-tional method of deciding whether a signal lies on the ascending (anti-body excess) or descending (antigen excess) part of the Heidelberger curve is to repeat the determination with a higher dilution of the sam-ple. Another possibility is to add antigen or antiserum to the reaction mixture. Modern automated analyzers can virtually eliminate this source of error by means of check functions (characterization and auto-matic redilution of the sample). Most manufacturers of immunochemi-cal reagents declare the concentration range in which no antigen excess problem arises, i.e., no high-dose hook eff ect is found.
To enhance the sensitivity, antibodies coated to microparticles are used in the direct immunoassays (particle- or latex-enhanced immunoassays).
Fig. 44: Heidelberger-Kendall curve
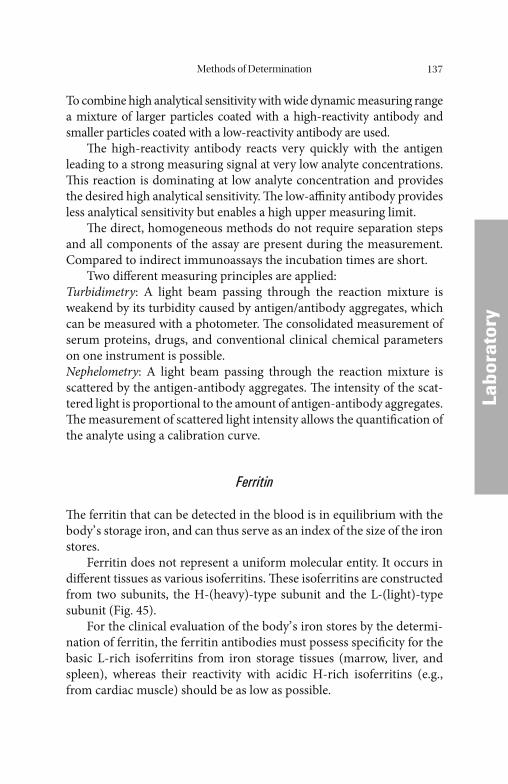
Methods of Determination 137
LLabo
rato
ry
To combine high analytical sensitivity with wide dynamic measuring range a mixture of larger particles coated with a high-reactivity antibody and smaller particles coated with a low-reactivity antibody are used.
Th e high-reactivity antibody reacts very quickly with the antigen leading to a strong measuring signal at very low analyte concentrations. Th is reaction is dominating at low analyte concentration and provides the desired high analytical sensitivity. Th e low-affi nity antibody provides less analytical sensitivity but enables a high upper measuring limit.
Th e direct, homogeneous methods do not require separation steps and all components of the assay are present during the measurement. Compared to indirect immunoassays the incubation times are short.
Two diff erent measuring principles are applied:Turbidimetry: A light beam passing through the reaction mixture is weakend by its turbidity caused by antigen/antibody aggregates, which can be measured with a photometer. Th e consolidated measurement of serum proteins, drugs, and conventional clinical chemical parameters on one instrument is possible.Nephelometry: A light beam passing through the reaction mixture is scattered by the antigen-antibody aggregates. Th e intensity of the scat-tered light is proportional to the amount of antigen-antibody aggregates. Th e measurement of scattered light intensity allows the quantifi cation of the analyte using a calibration curve.
Ferritin
Th e ferritin that can be detected in the blood is in equilibrium with the body’ s storage iron, and can thus serve as an index of the size of the iron stores.
Ferritin does not represent a uniform molecular entity. It occurs in diff erent tissues as various isoferritins. Th ese isoferritins are constructed from two subunits, the H-(heavy)-type subunit and the L-(light)-type subunit (Fig. 45).
For the clinical evaluation of the body’ s iron stores by the determi-nation of ferritin, the ferritin antibodies must possess specifi city for the basic L-rich isoferritins from iron storage tissues (marrow, liver, and spleen), whereas their reactivity with acidic H-rich isoferritins (e.g., from cardiac muscle) should be as low as possible.
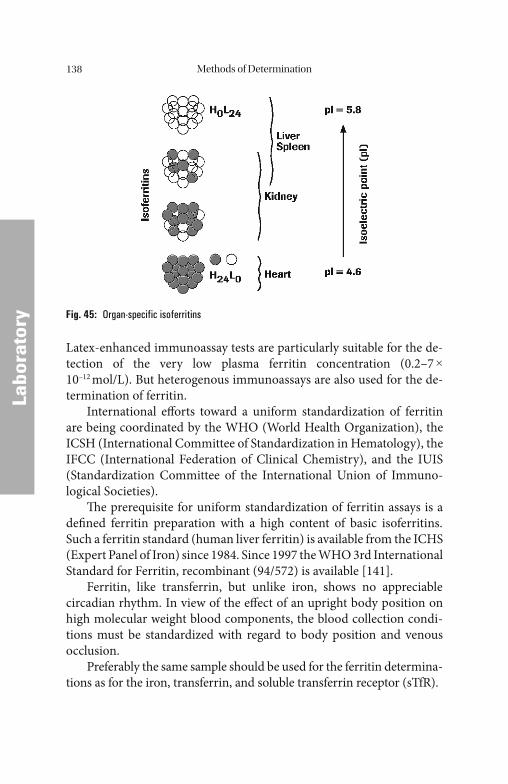
Methods of Determination138
LLabo
rato
ry
Latex-enhanced immunoassay tests are particularly suitable for the de-tection of the very low plasma ferritin concentration (0.2–7 × 10–12 mol/L). But heterogenous immunoassays are also used for the de-termination of ferritin.
International eff orts toward a uniform standardization of ferritin are being coordinated by the WHO (World Health Organization), the ICSH (International Committee of Standardization in Hematology), the IFCC (International Federation of Clinical Chemistry), and the IUIS (Standardization Committee of the International Union of Immuno-logical Societies).
Th e prerequisite for uniform standardization of ferritin assays is a defi ned ferritin preparation with a high content of basic isoferritins. Such a ferritin standard (human liver ferritin) is available from the ICHS (Expert Panel of Iron) since 1984. Since 1997 the WHO 3rd International Standard for Ferritin, recombinant (94/572) is available [141].
Ferritin, like transferrin, but unlike iron, shows no appreciable circadian rhythm. In view of the eff ect of an upright body position on high molecular weight blood components, the blood collection condi-tions must be standardized with regard to body position and venous occlusion.
Preferably the same sample should be used for the ferritin determina-tions as for the iron, transferrin, and soluble transferrin receptor (sTfR).
Fig. 45: Organ-specific isoferritins
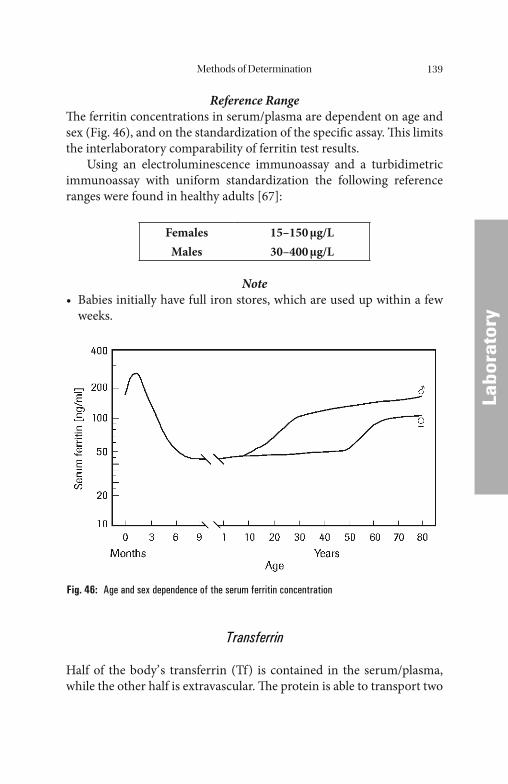
Methods of Determination 139
LLabo
rato
ry
Reference RangeTh e ferritin concentrations in serum/plasma are dependent on age and sex (Fig. 46), and on the standardization of the specifi c assay. Th is limits the interlaboratory comparability of ferritin test results.
Using an electroluminescence immunoassay and a turbidimetric immunoassay with uniform standardization the following reference ranges were found in healthy adults [67]:
FemalesMales
15–150 μg/L30–400 μg/L
Note• Babies initially have full iron stores, which are used up within a few
weeks.
Transferrin
Half of the body’ s transferrin (Tf) is contained in the serum/plasma, while the other half is extravascular. Th e protein is able to transport two
Fig. 46: Age and sex dependence of the serum ferritin concentration
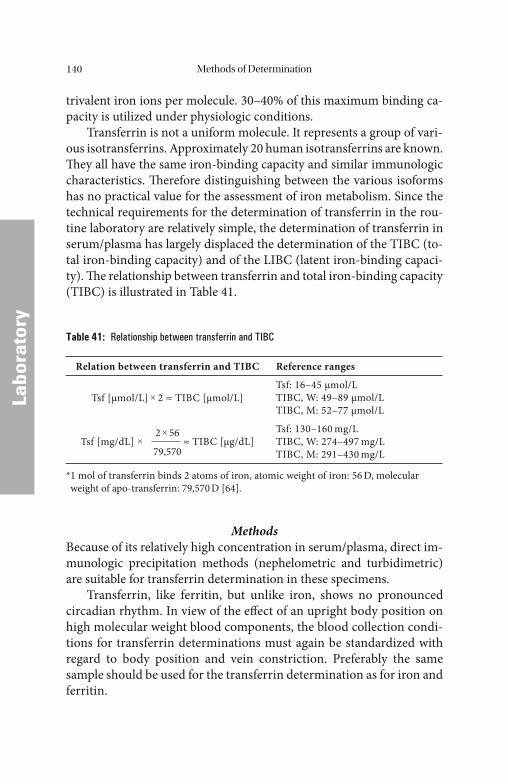
Methods of Determination140
LLabo
rato
ry
trivalent iron ions per molecule. 30–40% of this maximum binding ca-pacity is utilized under physiologic conditions.
Transferrin is not a uniform molecule. It represents a group of vari-ous isotransferrins. Approximately 20 human isotransferrins are known. Th ey all have the same iron-binding capacity and similar immunologic characteristics. Th erefore distinguishing between the various isoforms has no practical value for the assessment of iron metabolism. Since the technical requirements for the determination of transferrin in the rou-tine laboratory are relatively simple, the determination of transferrin in serum/plasma has largely displaced the determination of the TIBC (to-tal iron-binding capacity) and of the LIBC (latent iron-binding capaci-ty). Th e relationship between transferrin and total iron-binding capacity (TIBC) is illustrated in Table 41.
MethodsBecause of its relatively high concentration in serum/plasma, direct im-munologic precipitation methods (nephelometric and turbidimetric) are suitable for transferrin determination in these specimens.
Transferrin, like ferritin, but unlike iron, shows no pronounced circadian rhythm. In view of the eff ect of an upright body position on high molecular weight blood components, the blood collection condi-tions for transferrin determinations must again be standardized with regard to body position and vein constriction. Preferably the same sample should be used for the transferrin determination as for iron and ferritin.
Table 41: Relationship between transferrin and TIBC
Relation between transferrin and TIBC Reference ranges
Tsf [μmol/L] × 2 ≈ TIBC [μmol/L]Tsf: 16–45 μmol/LTIBC, W: 49–89 μmol/LTIBC, M: 52–77 μmol/L
2 × 56Tsf [mg/dL] × ≈ TIBC [μg/dL]
79,570
Tsf: 130–160 mg/LTIBC, W: 274–497 mg/LTIBC, M: 291–430 mg/L
* 1 mol of transferrin binds 2 atoms of iron, atomic weight of iron: 56 D, molecular weight of apo-transferrin: 79,570 D [64].
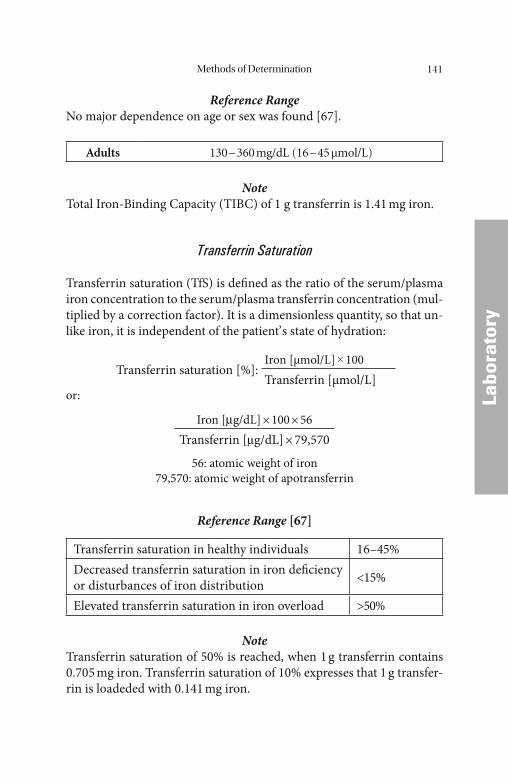
Methods of Determination 141
LLabo
rato
ry
Reference RangeNo major dependence on age or sex was found [67].
Adults 130 – 360 mg/dL (16 – 45 μmol/L)
NoteTotal Iron-Binding Capacity (TIBC) of 1 g transferrin is 1.41 mg iron.
Transferrin Saturation
Transferrin saturation (TfS) is defi ned as the ratio of the serum/plasma iron concentration to the serum/plasma transferrin concentration (mul-tiplied by a correction factor). It is a dimensionless quantity, so that un-like iron, it is independent of the patient’ s state of hydration:
Transferrin saturation [%]:Iron [μmol/L] × 100Transferrin [μmol/L]
or:
Iron [μg/dL] × 100 × 56Transferrin [μg/dL] × 79,570
56: atomic weight of iron79,570: atomic weight of apotransferrin
Reference Range [67]
Transferrin saturation in healthy individuals 16–45%Decreased transferrin saturation in iron defi ciency or disturbances of iron distribution <15%
Elevated transferrin saturation in iron overload >50%
NoteTransferrin saturation of 50% is reached, when 1 g transferrin contains 0.705 mg iron. Transferrin saturation of 10% expresses that 1 g transfer-rin is loadeded with 0.141 mg iron.
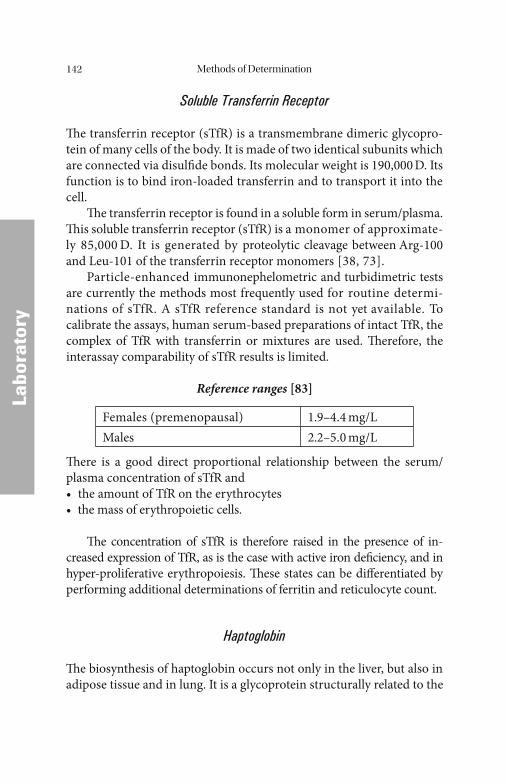
Methods of Determination142
LLabo
rato
ry
Soluble Transferrin Receptor
Th e transferrin receptor (sTfR) is a transmembrane dimeric glycopro-tein of many cells of the body. It is made of two identical subunits which are connected via disulfi de bonds. Its molecular weight is 190,000 D. Its function is to bind iron-loaded transferrin and to transport it into the cell.
Th e transferrin receptor is found in a soluble form in serum/plasma. Th is soluble transferrin receptor (sTfR) is a monomer of approximate-ly 85,000 D. It is generated by proteolytic cleavage between Arg-100 and Leu-101 of the transferrin receptor monomers [38, 73].
Particle-enhanced immunonephelometric and turbidimetric tests are currently the methods most frequently used for routine determi-nations of sTfR. A sTfR reference standard is not yet available. To calibrate the assays, human serum-based preparations of intact TfR, the complex of TfR with transferrin or mixtures are used. Th erefore, the interassay comparability of sTfR results is limited.
Reference ranges [83]
Females (premenopausal) 1.9–4.4 mg/LMales 2.2–5.0 mg/L
Th ere is a good direct proportional relationship between the serum/plasma concentration of sTfR and• the amount of TfR on the erythrocytes• the mass of erythropoietic cells.
Th e concentration of sTfR is therefore raised in the presence of in-creased expression of TfR, as is the case with active iron defi ciency, and in hyper-proliferative erythropoiesis. Th ese states can be diff erentiated by performing additional determinations of ferritin and reticulocyte count.
Haptoglobin
Th e biosynthesis of haptoglobin occurs not only in the liver, but also in adipose tissue and in lung. It is a glycoprotein structurally related to the
Methods of Determination 143
LLabo
rato
ry
immunoglobulins, and is made up of 2 (α) light chains with a molecular weight of 9000 D and two heavier (β) chains (molecular weight: 16,000 D). Th ree phenotypes with diff erent molecular weights are known: Hp1–1, Hp2–1 and Hp2–2. Hp1–1 has a molecular weight of 100,000 D. Hp2–1 and Hp2–2 are high-molecular-weight polymers with a molecular weight ranging from 200,000 to 400,000 D. Th e site of hap-toglobin synthesis is the liver.
Haptoglobin is an acute-phase protein. One of its functions is to bind free hemoglobin in the blood resulting from hemolysis thus pre-venting iron loss and renal damage. A stable 1:1 haptoglobin-hemoglo-bin (Hp-Hb) complex is formed which is eliminated from the circulation with a half-life of 8 min by receptor-mediated uptake into the cells of the RES. Th e hemoglobin is then intracellularly degraded, the iron con-tained in the heme is liberated and recirculated to the metabolism. Th e haptoglobin released is returned to the serum with a half-life of about 3 days.
Since with pathologically increased hemolysis the production of haptoglobin does not keep pace with its consumption, a decrease in the concentration of free haptoglobin in serum/plasma thus can serve as an indicator of intravascular hemolysis.
In the presence of massive hemolysis – when no haptoglobin con-centration is detectable – hemopexin (Hpx) should be measured.
MethodsBecause of the relatively high haptoglobin concentration in the serum, immunonephelometric and turbidimetric tests are currently the meth-ods most frequently used for routine determinations.
Reference RangeLike ferritin and transferrin, haptoglobin shows no appreciable circadi-an rhythm. Th ere are no major diff erences based on age or sex [67].
Adults 0.30–2.00 g/L
Note• Neonates have no measurable haptoglobin levels in the fi rst 3 months;
the reference range for adults applies from the 4th month of life.
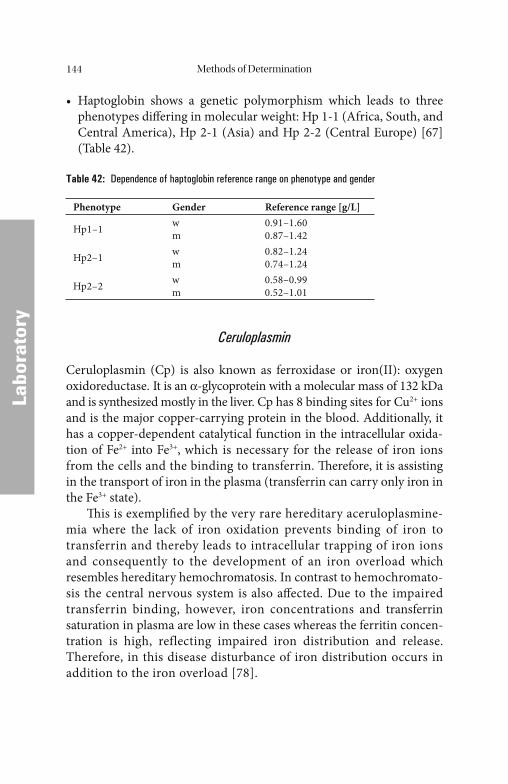
Methods of Determination144
LLabo
rato
ry
• Haptoglobin shows a genetic polymorphism which leads to three phenotypes diff ering in molecular weight: Hp 1-1 (Africa, South, and Central America), Hp 2-1 (Asia) and Hp 2-2 (Central Europe) [67] (Table 42).
Table 42: Dependence of haptoglobin reference range on phenotype and gender
Phenotype Gender Reference range [g/L]
Hp1–1 wm
0.91–1.600.87–1.42
Hp2–1 wm
0.82–1.240.74–1.24
Hp2–2 wm
0.58–0.990.52–1.01
Ceruloplasmin
Ceruloplasmin (Cp) is also known as ferroxidase or iron(II): oxygen oxidoreductase. It is an α-glycoprotein with a molecular mass of 132 kDa and is synthesized mostly in the liver. Cp has 8 binding sites for Cu2+ ions and is the major copper-carrying protein in the blood. Additionally, it has a copper-dependent catalytical function in the intracellular oxida-tion of Fe2+ into Fe3+, which is necessary for the release of iron ions from the cells and the binding to transferrin. Th erefore, it is assisting in the transport of iron in the plasma (transferrin can carry only iron in the Fe3+ state).
Th is is exemplifi ed by the very rare hereditary aceruloplasmine-mia where the lack of iron oxidation prevents binding of iron to transferrin and thereby leads to intracellular trapping of iron ions and consequently to the development of an iron overload which resembles hereditary hemochromatosis. In contrast to hemochromato-sis the central nervous system is also aff ected. Due to the impaired transferrin binding, however, iron concentrations and transferrin saturation in plasma are low in these cases whereas the ferritin concen-tration is high, reflecting impaired iron distribution and release. Therefore, in this disease disturbance of iron distribution occurs in addition to the iron overload [78].
Methods of Determination 145
LLabo
rato
ry
MethodsIn the routine clinical chemistry laboratory immunoturbidimetric or immunonephelometric methods are used for the determination of Cp.
Reference RangeThere are no major diff erences based on age or sex [67].
Adults 15–60 mg/dL (0.15–0.6 g/L)
Vitamin B12
Vitamin B12 has a molecular weight of 1355 daltons and, as cyanocobala-min, belongs to a group of biologically active substances which have as common structural element a porphyrin ring with cobalt(III) as the central ion.
Th e vitamin B12 taken up with food or synthesized by intestinal bacteria (“extrinsic factor”) forms a complex with the “intrinsic fac-tor”, a glycoprotein secreted by the gastric mucosa. Formation of this complex serves to protect the vitamin from degradation in the intes-tine and facilitates its receptor-dependent absorption by the mucosa of the small intestine. Aft er dissociation of the vitamin B12 – “intrinsic factor” complex the vitamin can be transported to the liver, where it is stored. In the cells, the vitamin is present mainly as 5´-deoxyadenosyl-cobalamin, whereas methylcobalamin predominates in the plasma. Th e main transport protein for vitamin B12 in plasma is transcobala-min II (TC-II).
MethodsA microbiologic assay is recommended by the NCCLS as reference method for the research laboratory. Th e concentration of vitamin B12 is determined as measured in relation to its biologic activity to promote the growth of Euglena gracilis or Lactobacillus leichmannii. However, this method is not suitable for wider use because of the apparatus re-quired and the cumbersome technique.
Before the determination is performed, vitamin B12 is released from the endogenous binding proteins by heating or by pretreatment in an alkaline solution.
Methods of Determination146
LLabo
rato
ry
Radioassays were fi rst reported for vitamin B12 in 1961 [12]. Th ey utilized 57Co-cyanocobalamin-labeled tracers and intrinsic factor for binding vitamin B12. Th e presence of endogenous serum-binding proteins for cyanocobalamin (transcobalamins including R protein) and of im-munoglobulins directed against intrinsic factor require that specimens are either boiled or treated at an alkaline pH to release the vitamin B12.
In the late 1970s, radioassays using serum-binding proteins or par-tially purifi ed intrinsic factor measured levels of vitamin B12 which ex-ceeded those determined by the microbiologic methods. Th is was caused by the presence of the R proteins in the assay. R protein specifi c-ity is poor compared to that of intrinsic factor and vitamin B12 analogs were being measured in addition to vitamin B12 itself [153]. Since that time, recommendations have been established for the use of highly pu-rifi ed intrinsic factor throughout the industry.
Th e various commercial assays diff er in their detection system, free versus bound separation techniques, and choice of specimen pretreat-ment.
Reference RangeTh ere are no major diff erences based on age or sex [67].
Adults 220–925 pg/mL (162–683 pmol/L)
Note• The body’ s vitamin B12 pool is approximately 3–7 mg. Given a re-
quirement of 30 μg/d, parental administration of vitamin B12 oft en leads to raised concentrations aft er a few months.
• In about 20% of pregnant women, the vitamin B12 concentration in serum falls to values of <125 pmol/L despite adequate depots.
• Reference ranges for vitamin B12 given in the literature may diff er considerably. Th is is undoubtedly due to the diff erences in method-ologies.
Holotrancobalamin
About 70–90% of vitamin B12 in serum is bound to haptocorrin (HC). Th is transport form of vitamin B12 (HoloHC) can be taken up only by
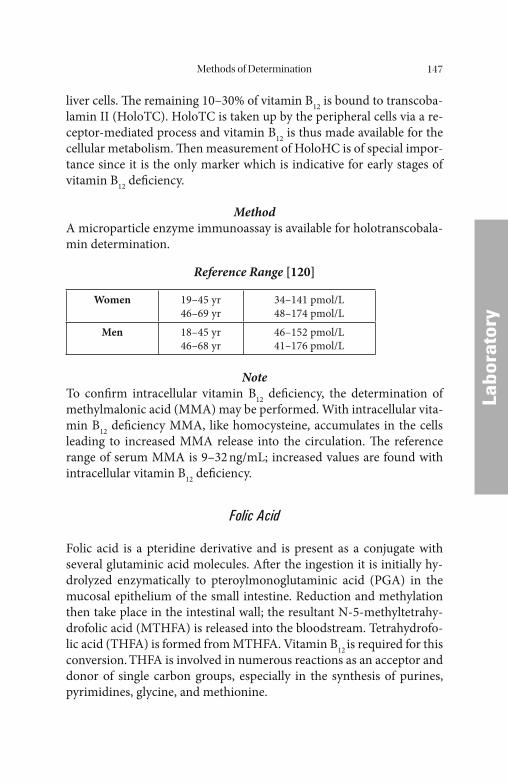
Methods of Determination 147
LLabo
rato
ry
liver cells. Th e remaining 10–30% of vitamin B12 is bound to transcoba-lamin II (HoloTC). HoloTC is taken up by the peripheral cells via a re-ceptor-mediated process and vitamin B12 is thus made available for the cellular metabolism. Th en measurement of HoloHC is of special impor-tance since it is the only marker which is indicative for early stages of vitamin B12 defi ciency.
MethodA microparticle enzyme immunoassay is available for holotranscobala-min determination.
Reference Range [120]
Women 19–45 yr46–69 yr
34–141 pmol/L48–174 pmol/L
Men 18–45 yr46–68 yr
46–152 pmol/L41–176 pmol/L
NoteTo confi rm intracellular vitamin B12 defi ciency, the determination of methylmalonic acid (MMA) may be performed. With intracellular vita-min B12 defi ciency MMA, like homocysteine, accumulates in the cells leading to increased MMA release into the circulation. Th e reference range of serum MMA is 9–32 ng/mL; increased values are found with intracellular vitamin B12 defi ciency.
Folic Acid
Folic acid is a pteridine derivative and is present as a conjugate with several glutaminic acid molecules. Aft er the ingestion it is initially hy-drolyzed enzymatically to pteroylmonoglutaminic acid (PGA) in the mucosal epithelium of the small intestine. Reduction and methylation then take place in the intestinal wall; the resultant N-5-methyltetrahy-drofolic acid (MTHFA) is released into the bloodstream. Tetrahydrofo-lic acid (THFA) is formed from MTHFA. Vitamin B12 is required for this conversion. THFA is involved in numerous reactions as an acceptor and donor of single carbon groups, especially in the synthesis of purines, pyrimidines, glycine, and methionine.
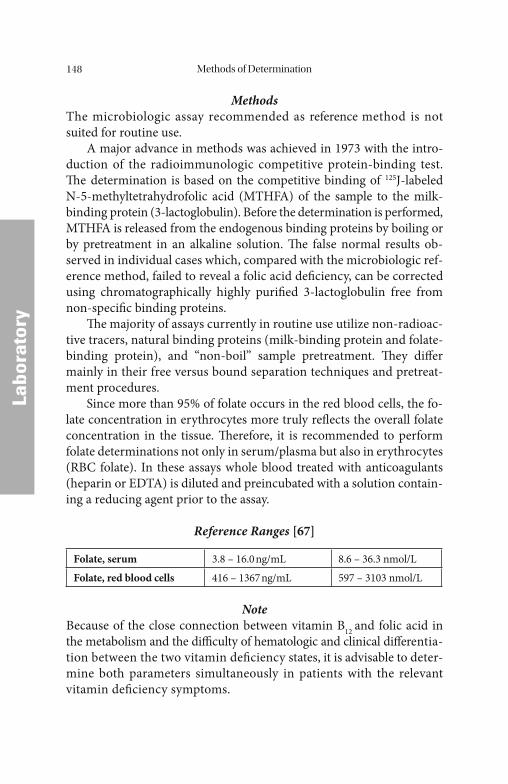
Methods of Determination148
LLabo
rato
ry
MethodsThe microbiologic assay recommended as reference method is not suited for routine use.
A major advance in methods was achieved in 1973 with the intro-duction of the radioimmunologic competitive protein-binding test. Th e determination is based on the competitive binding of 125J-labeled N-5-methyltetrahydrofolic acid (MTHFA) of the sample to the milk-binding protein (3-lactoglobulin). Before the determination is performed, MTHFA is released from the endogenous binding proteins by boiling or by pretreatment in an alkaline solution. Th e false normal results ob-served in individual cases which, compared with the microbiologic ref-erence method, failed to reveal a folic acid defi ciency, can be corrected using chromatographically highly purifi ed 3-lactoglobulin free from non-specifi c binding proteins.
Th e majority of assays currently in routine use utilize non-radioac-tive tracers, natural binding proteins (milk-binding protein and folate-binding protein), and “non-boil” sample pretreatment. Th ey diff er mainly in their free versus bound separation techniques and pretreat-ment procedures.
Since more than 95% of folate occurs in the red blood cells, the fo-late concentration in erythrocytes more truly refl ects the overall folate concentration in the tissue. Th erefore, it is recommended to perform folate determinations not only in serum/plasma but also in erythrocytes (RBC folate). In these assays whole blood treated with anticoagulants (heparin or EDTA) is diluted and preincubated with a solution contain-ing a reducing agent prior to the assay.
Reference Ranges [67]
Folate, serum 3.8 – 16.0 ng/mL 8.6 – 36.3 nmol/LFolate, red blood cells 416 – 1367 ng/mL 597 – 3103 nmol/L
NoteBecause of the close connection between vitamin B12 and folic acid in the metabolism and the diffi culty of hematologic and clinical diff erentia-tion between the two vitamin defi ciency states, it is advisable to deter-mine both parameters simultaneously in patients with the relevant vitamin defi ciency symptoms.
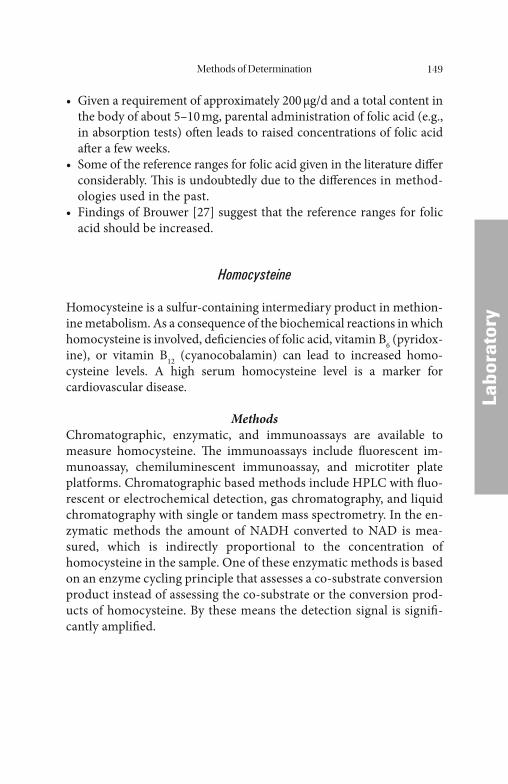
Methods of Determination 149
LLabo
rato
ry
• Given a requirement of approximately 200 μg/d and a total content in the body of about 5–10 mg, parental administration of folic acid (e.g., in absorption tests) oft en leads to raised concentrations of folic acid aft er a few weeks.
• Some of the reference ranges for folic acid given in the literature diff er considerably. Th is is undoubtedly due to the diff erences in method-ologies used in the past.
• Findings of Brouwer [27] suggest that the reference ranges for folic acid should be increased.
Homocysteine
Homocysteine is a sulfur-containing intermediary product in methion-ine metabolism. As a consequence of the biochemical reactions in which homocysteine is involved, defi ciencies of folic acid, vitamin B6 (pyridox-ine), or vitamin B12 (cyanocobalamin) can lead to increased homo-cysteine levels. A high serum homocysteine level is a marker for cardiovascular disease.
MethodsChromatographic, enzymatic, and immunoassays are available to measure homocysteine. Th e immunoassays include fl uorescent im-munoassay, chemiluminescent immunoassay, and microtiter plate platforms. Chromatographic based methods include HPLC with fl uo-rescent or electrochemical detection, gas chromatography, and liquid chromatography with single or tandem mass spectrometry. In the en-zymatic methods the amount of NADH converted to NAD is mea-sured, which is indirectly proportional to the concentration of homocysteine in the sample. One of these enzymatic methods is based on an enzyme cycling principle that assesses a co-substrate conversion product instead of assessing the co-substrate or the conversion prod-ucts of homocysteine. By these means the detection signal is signifi -cantly amplifi ed.
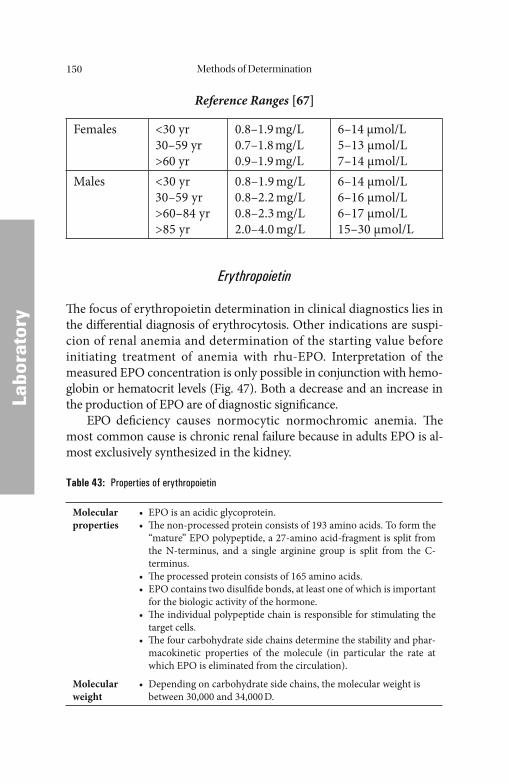
Methods of Determination150
LLabo
rato
ry
Reference Ranges [67]
Females <30 yr30–59 yr>60 yr
0.8–1.9 mg/L0.7–1.8 mg/L0.9–1.9 mg/L
6–14 μmol/L5–13 μmol/L7–14 μmol/L
Males <30 yr30–59 yr>60–84 yr>85 yr
0.8–1.9 mg/L0.8–2.2 mg/L0.8–2.3 mg/L2.0–4.0 mg/L
6–14 μmol/L6–16 μmol/L6–17 μmol/L15–30 μmol/L
Erythropoietin
Th e focus of erythropoietin determination in clinical diagnostics lies in the diff erential diagnosis of erythrocytosis. Other indications are suspi-cion of renal anemia and determination of the starting value before initiating treatment of anemia with rhu-EPO. Interpretation of the measured EPO concentration is only possible in conjunction with hemo-globin or hematocrit levels (Fig. 47). Both a decrease and an increase in the production of EPO are of diagnostic signifi cance.
EPO defi ciency causes normocytic normochromic anemia. Th e most common cause is chronic renal failure because in adults EPO is al-most exclusively synthesized in the kidney.
Table 43: Properties of erythropoietin
Molecular properties
• EPO is an acidic glycoprotein.• Th e non-processed protein consists of 193 amino acids. To form the
“mature” EPO polypeptide, a 27-amino acid-fragment is split from the N-terminus, and a single arginine group is split from the C- terminus.
• Th e processed protein consists of 165 amino acids.• EPO contains two disulfi de bonds, at least one of which is important
for the biologic activity of the hormone.• Th e individual polypeptide chain is responsible for stimulating the
target cells.• Th e four carbohydrate side chains determine the stability and phar-
macokinetic properties of the molecule (in particular the rate at which EPO is eliminated from the circulation).
Molecular weight
• Depending on carbohydrate side chains, the molecular weight is between 30,000 and 34,000 D.
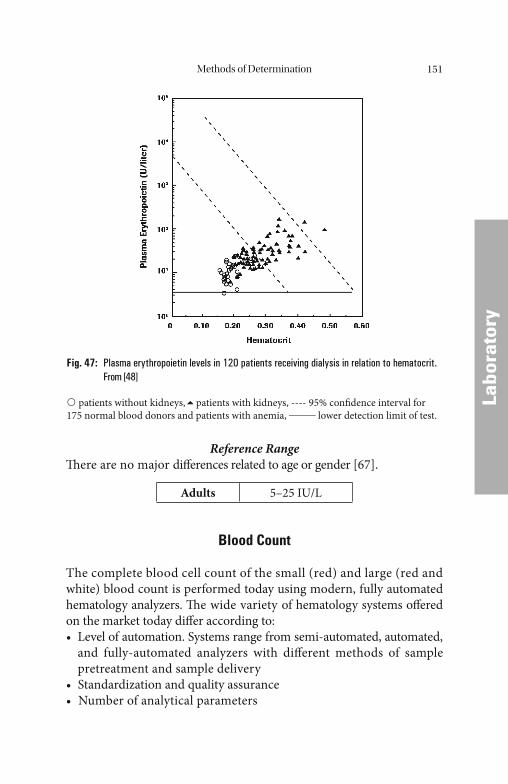
Methods of Determination 151
LLabo
rato
ry
Reference RangeTh ere are no major diff erences related to age or gender [67].
Adults 5–25 IU/L
Blood Count
The complete blood cell count of the small (red) and large (red and white) blood count is performed today using modern, fully automated hematology analyzers. Th e wide variety of hematology systems off ered on the market today diff er according to:• Level of automation. Systems range from semi-automated, automated,
and fully-automated analyzers with diff erent methods of sample pretreatment and sample delivery
• Standardization and quality assurance• Number of analytical parameters
Fig. 47: Plasma erythropoietin levels in 120 patients receiving dialysis in relation to hematocrit. From [48]
patients without kidneys, patients with kidneys, ---- 95% confi dence interval for 175 normal blood donors and patients with anemia, _____ lower detection limit of test.
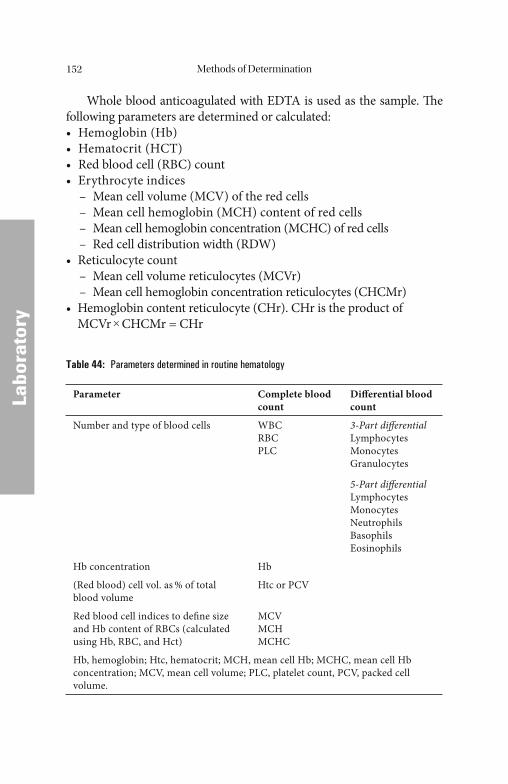
Methods of Determination152
LLabo
rato
ry
Whole blood anticoagulated with EDTA is used as the sample. Th e following parameters are determined or calculated:• Hemoglobin (Hb)• Hematocrit (HCT)• Red blood cell (RBC) count• Erythrocyte indices – Mean cell volume (MCV) of the red cells – Mean cell hemoglobin (MCH) content of red cells – Mean cell hemoglobin concentration (MCHC) of red cells – Red cell distribution width (RDW)• Reticulocyte count – Mean cell volume reticulocytes (MCVr) – Mean cell hemoglobin concentration reticulocytes (CHCMr)• Hemoglobin content reticulocyte (CHr). CHr is the product of
MCVr × CHCMr = CHr
Table 44: Parameters determined in routine hematology
Parameter Complete blood count
Diff erential blood count
Number and type of blood cells WBCRBCPLC
3-Part diff erentialLymphocytesMonocytesGranulocytes
5-Part diff erentialLymphocytesMonocytesNeutrophilsBasophilsEosinophils
Hb concentration Hb
(Red blood) cell vol. as % of total blood volume
Htc or PCV
Red blood cell indices to defi ne size and Hb content of RBCs (calculated using Hb, RBC, and Hct)
MCVMCHMCHC
Hb, hemoglobin; Htc, hematocrit; MCH, mean cell Hb; MCHC, mean cell Hb concentration; MCV, mean cell volume; PLC, platelet count, PCV, packed cell volume.
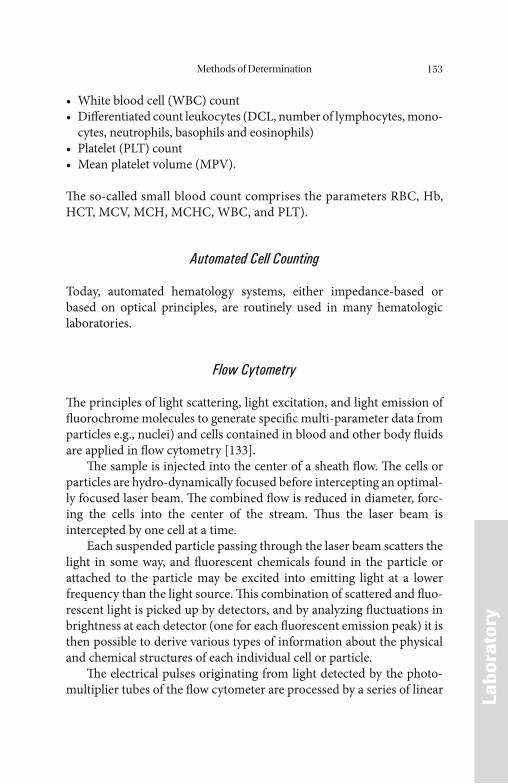
Methods of Determination 153
LLabo
rato
ry
• White blood cell (WBC) count• Diff erentiated count leukocytes (DCL, number of lymphocytes, mono-
cytes, neutrophils, basophils and eosinophils)• Platelet (PLT) count• Mean platelet volume (MPV).
Th e so-called small blood count comprises the parameters RBC, Hb, HCT, MCV, MCH, MCHC, WBC, and PLT).
Automated Cell Counting
Today, automated hematology systems, either impedance-based or based on optical principles, are routinely used in many hematologic laboratories.
Flow Cytometry
Th e principles of light scattering, light excitation, and light emission of fl uorochrome molecules to generate specifi c multi-parameter data from particles e.g., nuclei) and cells contained in blood and other body fl uids are applied in fl ow cytometry [133].
Th e sample is injected into the center of a sheath fl ow. Th e cells or particles are hydro-dynamically focused before intercepting an optimal-ly focused laser beam. Th e combined fl ow is reduced in diameter, forc-ing the cells into the center of the stream. Th us the laser beam is intercepted by one cell at a time.
Each suspended particle passing through the laser beam scatters the light in some way, and fl uorescent chemicals found in the particle or attached to the particle may be excited into emitting light at a lower frequency than the light source. Th is combination of scattered and fl uo-rescent light is picked up by detectors, and by analyzing fl uctuations in brightness at each detector (one for each fl uorescent emission peak) it is then possible to derive various types of information about the physical and chemical structures of each individual cell or particle.
Th e electrical pulses originating from light detected by the photo-multiplier tubes of the fl ow cytometer are processed by a series of linear
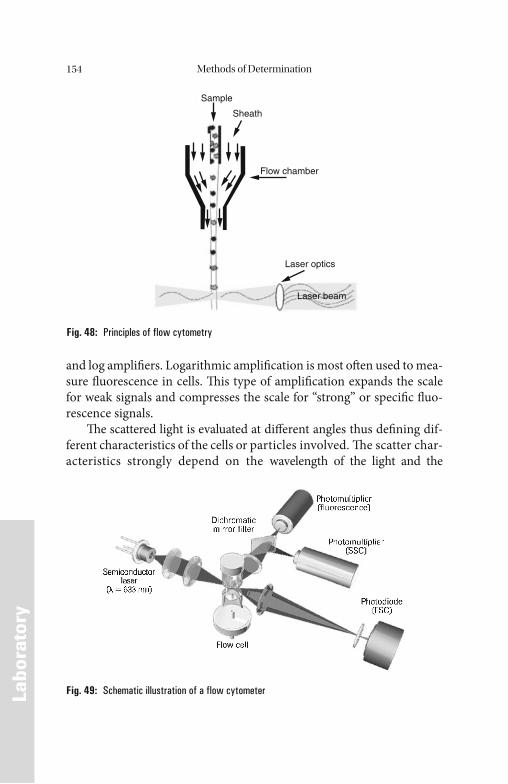
Methods of Determination154
LLabo
rato
ry
and log amplifi ers. Logarithmic amplifi cation is most oft en used to mea-sure fl uorescence in cells. Th is type of amplifi cation expands the scale for weak signals and compresses the scale for “strong” or specifi c fl uo-rescence signals.
Th e scattered light is evaluated at diff erent angles thus defi ning dif-ferent characteristics of the cells or particles involved. Th e scatter char-acteristics strongly depend on the wavelength of the light and the
Fig. 48: Principles of flow cytometry
Sample
Sheath
Flow chamber
Laser optics
Laser beam
Fig. 49: Schematic illustration of a flow cytometer
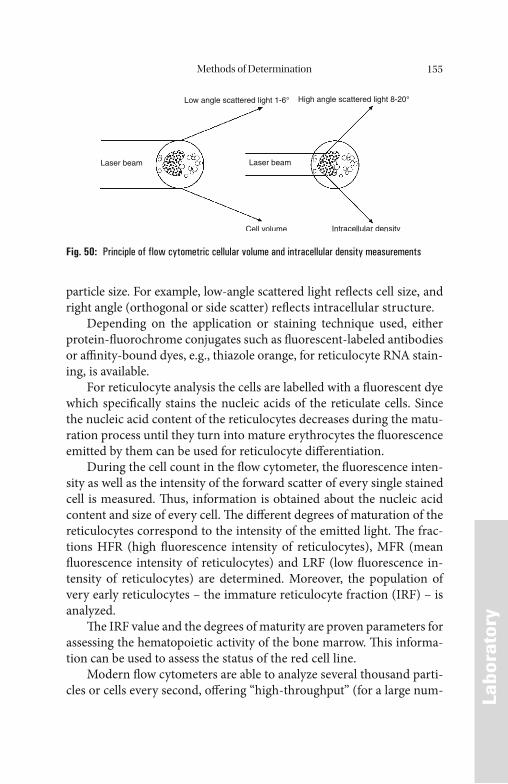
Methods of Determination 155
LLabo
rato
ry
particle size. For example, low-angle scattered light refl ects cell size, and right angle (orthogonal or side scatter) refl ects intracellular structure.
Depending on the application or staining technique used, either protein-fl uorochrome conjugates such as fl uorescent-labeled antibodies or affi nity-bound dyes, e.g., thiazole orange, for reticulocyte RNA stain-ing, is available.
For reticulocyte analysis the cells are labelled with a fl uorescent dye which specifi cally stains the nucleic acids of the reticulate cells. Since the nucleic acid content of the reticulocytes decreases during the matu-ration process until they turn into mature erythrocytes the fl uorescence emitted by them can be used for reticulocyte diff erentiation.
During the cell count in the fl ow cytometer, the fl uorescence inten-sity as well as the intensity of the forward scatter of every single stained cell is measured. Th us, information is obtained about the nucleic acid content and size of every cell. Th e diff erent degrees of maturation of the reticulocytes correspond to the intensity of the emitted light. Th e frac-tions HFR (high fl uorescence intensity of reticulocytes), MFR (mean fl uorescence intensity of reticulocytes) and LRF (low fl uorescence in-tensity of reticulocytes) are determined. Moreover, the population of very early reticulocytes – the immature reticulocyte fraction (IRF) – is analyzed.
Th e IRF value and the degrees of maturity are proven parameters for assessing the hematopoietic activity of the bone marrow. Th is informa-tion can be used to assess the status of the red cell line.
Modern fl ow cytometers are able to analyze several thousand parti-cles or cells every second, off ering “high-throughput” (for a large num-
Low angle scattered light 1-6° High angle scattered light 8-20°
Laser beam Laser beam
Cell volume Intracellular density
Fig. 50: Principle of flow cytometric cellular volume and intracellular density measurements
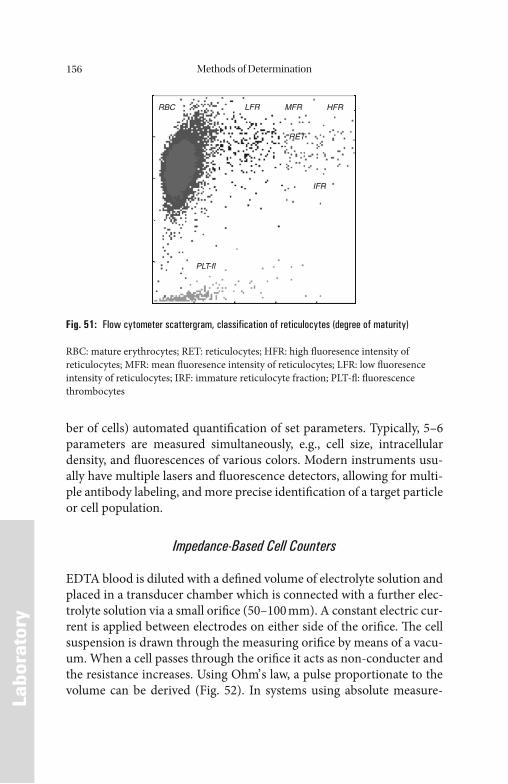
Methods of Determination156
LLabo
rato
ry
ber of cells) automated quantifi cation of set parameters. Typically, 5–6 parameters are measured simultaneously, e.g., cell size, intracellular density, and fl uorescences of various colors. Modern instruments usu-ally have multiple lasers and fl uorescence detectors, allowing for multi-ple antibody labeling, and more precise identifi cation of a target particle or cell population.
Impedance-Based Cell Counters
EDTA blood is diluted with a defi ned volume of electrolyte solution and placed in a transducer chamber which is connected with a further elec-trolyte solution via a small orifi ce (50–100 mm). A constant electric cur-rent is applied between electrodes on either side of the orifi ce. Th e cell suspension is drawn through the measuring orifi ce by means of a vacu-um. When a cell passes through the orifi ce it acts as non-conducter and the resistance increases. Using Ohm’ s law, a pulse proportionate to the volume can be derived (Fig. 52). In systems using absolute measure-
RBC LFR HFR
RET
IFR
MFR
PLT-fl
Fig. 51: Flow cytometer scattergram, classification of reticulocytes (degree of maturity)
RBC: mature erythrocytes; RET: reticulocytes; HFR: high fl uoresence intensity of reticulocytes; MFR: mean fl uoresence intensity of reticulocytes; LFR: low fl uoresence intensity of reticulocytes; IRF: immature reticulocyte fraction; PLT-fl : fl uorescence thrombocytes
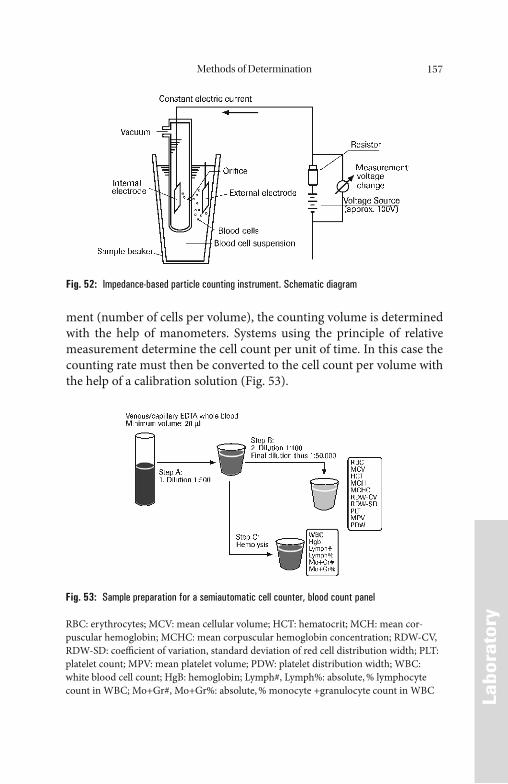
Methods of Determination 157
LLabo
rato
ry
ment (number of cells per volume), the counting volume is determined with the help of manometers. Systems using the principle of relative measurement determine the cell count per unit of time. In this case the counting rate must then be converted to the cell count per volume with the help of a calibration solution (Fig. 53).
Fig. 52: Impedance-based particle counting instrument. Schematic diagram
Fig. 53: Sample preparation for a semiautomatic cell counter, blood count panel
RBC: erythrocytes; MCV: mean cellular volume; HCT: hematocrit; MCH: mean cor-puscular hemoglobin; MCHC: mean corpuscular hemoglobin concentration; RDW-CV, RDW-SD: coeffi cient of variation, standard deviation of red cell distribution width; PLT: platelet count; MPV: mean platelet volume; PDW: platelet distribution width; WBC: white blood cell count; HgB: hemoglobin; Lymph#, Lymph%: absolute, % lymphocyte count in WBC; Mo+Gr#, Mo+Gr%: absolute, % monocyte +granulocyte count in WBC
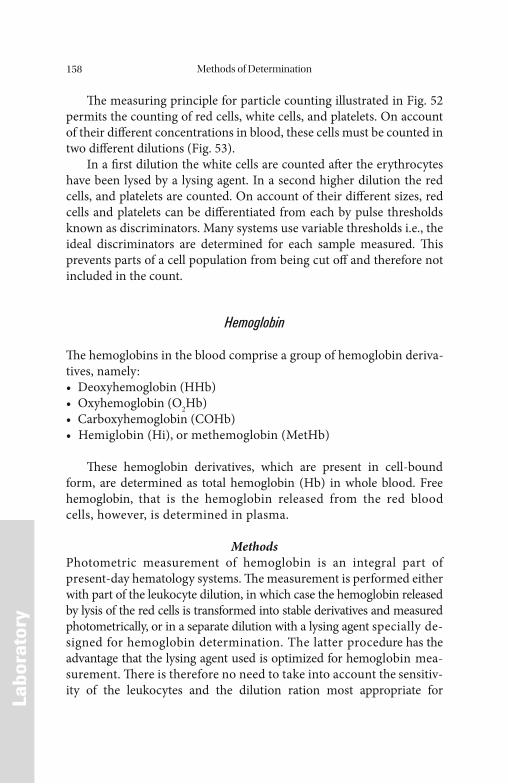
Methods of Determination158
LLabo
rato
ry
Th e measuring principle for particle counting illustrated in Fig. 52 permits the counting of red cells, white cells, and platelets. On account of their diff erent concentrations in blood, these cells must be counted in two diff erent dilutions (Fig. 53).
In a fi rst dilution the white cells are counted aft er the erythrocytes have been lysed by a lysing agent. In a second higher dilution the red cells, and platelets are counted. On account of their diff erent sizes, red cells and platelets can be diff erentiated from each by pulse thresholds known as discriminators. Many systems use variable thresholds i.e., the ideal discriminators are determined for each sample measured. Th is prevents parts of a cell population from being cut off and therefore not included in the count.
Hemoglobin
Th e hemoglobins in the blood comprise a group of hemoglobin deriva-tives, namely:• Deoxyhemoglobin (HHb)• Oxyhemoglobin (O2Hb)• Carboxyhemoglobin (COHb)• Hemiglobin (Hi), or methemoglobin (MetHb)
Th ese hemoglobin derivatives, which are present in cell-bound form, are determined as total hemoglobin (Hb) in whole blood. Free hemoglobin, that is the hemoglobin released from the red blood cells, however, is determined in plasma.
MethodsPhotometric measurement of hemoglobin is an integral part of present-day hematology systems. Th e measurement is performed either with part of the leukocyte dilution, in which case the hemoglobin released by lysis of the red cells is transformed into stable derivatives and measured photometrically, or in a separate dilution with a lysing agent specially de-signed for hemoglobin determination. The latter procedure has the advantage that the lysing agent used is optimized for hemoglobin mea-surement. Th ere is therefore no need to take into account the sensitiv-ity of the leukocytes and the dilution ration most appropriate for
Methods of Determination 159
LLabo
rato
ry
hemoglobin determination can be used. Th erefore, a separate hemoglo-bin channel with a separate hemoglobin lysing agent is subject to less interference by high leukocyte concentrations than hemoglobin pho-tometry as part of the WBC counting.
For hemoglobin determination the cyanmethemoglobin method can be used. Th is technique has the disadvantage that the solution con-tains cyanide and must therefore be disposed of as toxic waste.
In this method, the Fe2+ of hemoglobin is oxidized to Fe3+ by potas-sium ferricyanide [K3Fe(CN)6] forming hemiglobin (Hi). Th is reacts with the cyanide ions (CN-), forming cyanmethemoglobin (HiCN). Th e absorbance of HiCN is measured at 540 nm. Th e hemiglobincyanide method is the reference method.
Reference Range [67]
Women 12.3–15.3 g/dL (7.6–9.5 mmol/L)Men 14.0–17.5 g/dL (8.7–10.9 mmol/L)
Hematocrit
Th e hematocrit (Hct), or packed cell volume (PCV), is the ratio of the volume of red cells to the volume of whole blood in a sample of venous or capillary blood. Th e ratio is measured aft er appropriate centrifugation. In laboratory practice the hematocrit is usually expressed as a percentage:
Hct (%)=VolumeErythrocytes × 100VolumeWhole blood
Th e hematocrit is a further important parameter in laboratory he-matology. Th is value is also determined automatically by many hematol-ogy systems today. Figure 54 shows a schematic comparison of pulse height summation, the method used by many hematology systems, and the centrifugal hematocrit. Th e cells which pass through the measuring orifice generate pulses which are proportionate to their volume. The hematocrit is obtained by summation of the individual pulses which are between an upper and lower discriminator. Th e result is multiplied by a constant factor which takes into account the dilution ratio. The
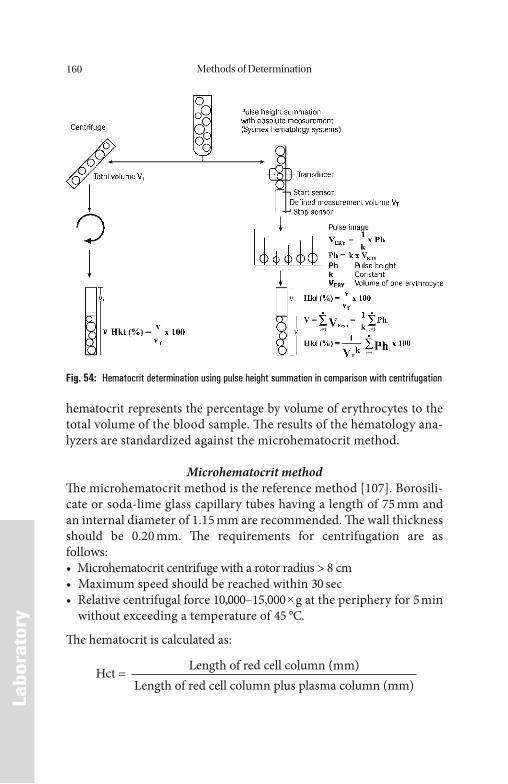
Methods of Determination160
LLabo
rato
ry
hematocrit represents the percentage by volume of erythrocytes to the total volume of the blood sample. Th e results of the hematology ana-lyzers are standardized against the microhematocrit method.
Microhematocrit methodTh e microhematocrit method is the reference method [107]. Borosili-cate or soda-lime glass capillary tubes having a length of 75 mm and an internal diameter of 1.15 mm are recommended. Th e wall thickness should be 0.20 mm. Th e requirements for centrifugation are as follows:• Microhematocrit centrifuge with a rotor radius > 8 cm• Maximum speed should be reached within 30 sec• Relative centrifugal force 10,000–15,000 × g at the periphery for 5 min
without exceeding a temperature of 45 °C.
Th e hematocrit is calculated as:
Hct = Length of red cell column (mm)Length of red cell column plus plasma column (mm)
Fig. 54: Hematocrit determination using pulse height summation in comparison with centrifugation
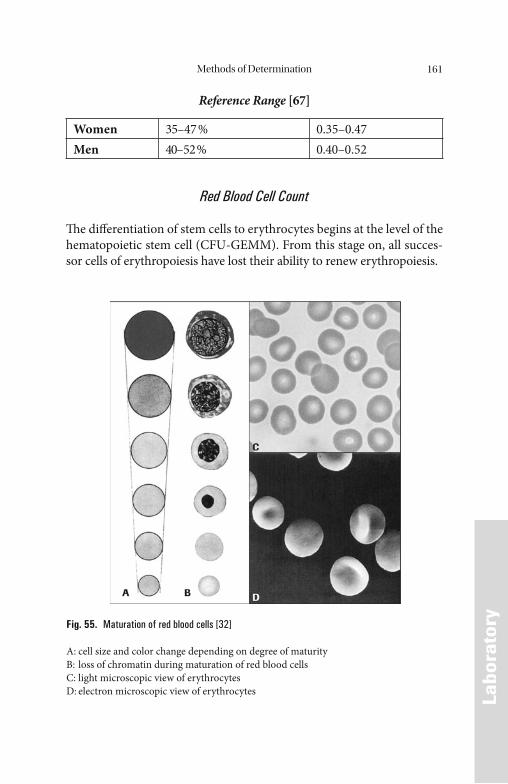
Methods of Determination 161
LLabo
rato
ry
Reference Range [67]
Women 35–47 % 0.35–0.47Men 40–52 % 0.40–0.52
Red Blood Cell Count
Th e diff erentiation of stem cells to erythrocytes begins at the level of the hematopoietic stem cell (CFU-GEMM). From this stage on, all succes-sor cells of erythropoiesis have lost their ability to renew erythropoiesis.
Fig. 55. Maturation of red blood cells [32]
A: cell size and color change depending on degree of maturityB: loss of chromatin during maturation of red blood cellsC: light microscopic view of erythrocytesD: electron microscopic view of erythrocytes
Methods of Determination162
LLabo
rato
ry
As the erythrocytes age, they decrease in volume and deformability and their density increases. Changes in the cell membrane lead to loss of carbohydrates on the cell surface. Th e normal red cell is removed from the blood stream by the reticuloendothelial system by phagocytosis aft er 100–120 days.
Th e hematopoietic stem cell (CFU-GEMM) diff erentiates into the burst-forming unit erythroid (BFU-E). This stage is followed by the colony-forming unit erythroid (CFU-E). Aft er various divisions, which take several days in vivo, the cells go through a process of typical mor-phologic and functional diff erentiation in the process of which they lose their proliferative capacity step by step (Fig. 55).
Th e red blood cell count (RBC) is a basic examination for the evalu-ation of disorders of erythropoiesis. Alone it is of little diagnostic value. Only the combination of this parameter with the hematocrit permits diff erentiation between erythrocytopenia, erythrocytosis or a normal erythrocyte count with reference to the red cell mass of the body.
Reference Range [67]
Women 4.1–5.1 × 10⁶/μL
Men 4.5–5.9 × 10⁶/μL
Red Blood Cell Indices
Hematology analyzers calculate the following parameters from the mea-sured red red blood cell count and hemoglobin concentration:• Mean corpuscular volume (MCV)• Mean corpuscular hemoglobin (MCH)• Mean corpuscular hemoglobin concentration (MCHC)
Th e MCV, MCH, and MCHC are called red cell indices and are used for the description of red cell changes and the diff erentiation of distur-bances of erythropoiesis.
Th e MCV is expressed in femtoliters (fL, 10–15 L or 10–9 μL). Hema-tology analyzers either measure this parameter directly or calculate it according to the following equation:
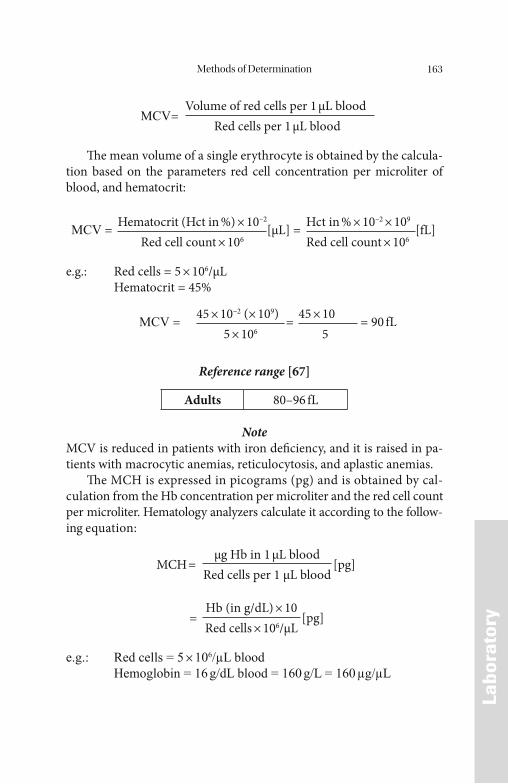
Methods of Determination 163
LLabo
rato
ry
MCV=Volume of red cells per 1 μL blood
Red cells per 1 μL blood
Th e mean volume of a single erythrocyte is obtained by the calcula-tion based on the parameters red cell concentration per microliter of blood, and hematocrit:
MCV = Hematocrit (Hct in %) × 10–2[μL] = Hct in % × 10–2 × 10⁹
[fL] Red cell count × 106 Red cell count × 106
e.g.: Red cells = 5 × 10⁶/μL Hematocrit = 45%
MCV = 45 × 10–2 (× 109) = 45 × 10 = 90 fL5 × 106 5
Reference range [67]
Adults 80–96 fL
NoteMCV is reduced in patients with iron defi ciency, and it is raised in pa-tients with macrocytic anemias, reticulocytosis, and aplastic anemias.
Th e MCH is expressed in picograms (pg) and is obtained by cal-culation from the Hb concentration per microliter and the red cell count per microliter. Hematology analyzers calculate it according to the follow-ing equation:
MCH = μg Hb in 1 μL blood
[pg]Red cells per 1 μL blood
=Hb (in g/dL) × 10
[pg]Red cells × 106/μL
e.g.: Red cells = 5 × 10⁶/ L blood Hemoglobin = 16 g/dL blood = 160 g/L = 160 g/ L
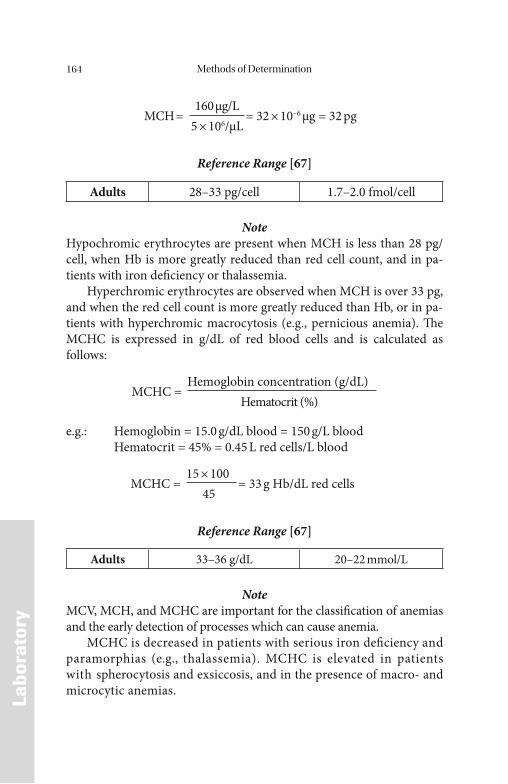
Methods of Determination164
LLabo
rato
ry
MCH = 160 μg/L
= 32 × 10–6 μg = 32 pg5 × 106/μL
Reference Range [67]
Adults 28–33 pg/cell 1.7–2.0 fmol/cell
NoteHypochromic erythrocytes are present when MCH is less than 28 pg/cell, when Hb is more greatly reduced than red cell count, and in pa-tients with iron defi ciency or thalassemia.
Hyperchromic erythrocytes are observed when MCH is over 33 pg, and when the red cell count is more greatly reduced than Hb, or in pa-tients with hyperchromic macrocytosis (e.g., pernicious anemia). Th e MCHC is expressed in g/dL of red blood cells and is calculated as follows:
MCHC =Hemoglobin concentration (g/dL)
Hematocrit (%)
e.g.: Hemoglobin = 15.0 g/dL blood = 150 g/L blood Hematocrit = 45% = 0.45 L red cells/L blood
MCHC =15 × 100
= 33 g Hb/dL red cells45
Reference Range [67]
Adults 33–36 g/dL 20–22 mmol/L
NoteMCV, MCH, and MCHC are important for the classifi cation of anemias and the early detection of processes which can cause anemia.
MCHC is decreased in patients with serious iron defi ciency and paramorphias (e.g., thalassemia). MCHC is elevated in patients with spherocytosis and exsiccosis, and in the presence of macro- and microcytic anemias.
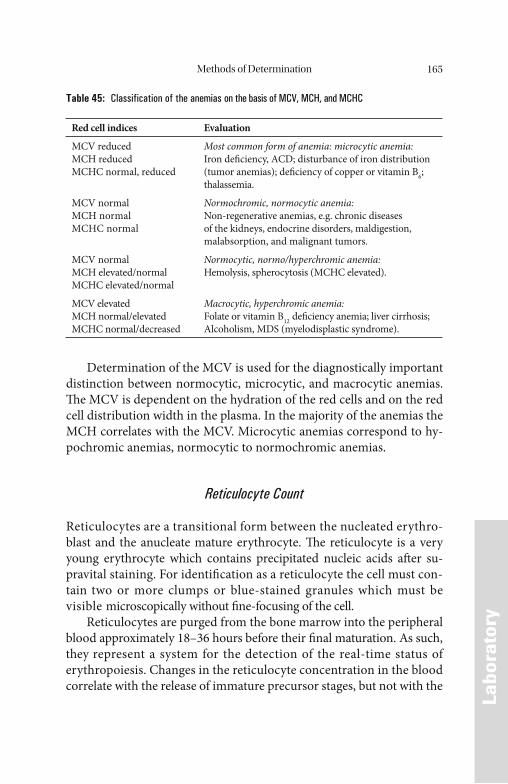
Methods of Determination 165
LLabo
rato
ry
Determination of the MCV is used for the diagnostically important distinction between normocytic, microcytic, and macrocytic anemias. Th e MCV is dependent on the hydration of the red cells and on the red cell distribution width in the plasma. In the majority of the anemias the MCH correlates with the MCV. Microcytic anemias correspond to hy-pochromic anemias, normocytic to normochromic anemias.
Reticulocyte Count
Reticulocytes are a transitional form between the nucleated erythro-blast and the anucleate mature erythrocyte. Th e reticulocyte is a very young erythrocyte which contains precipitated nucleic acids aft er su-pravital staining. For identifi cation as a reticulocyte the cell must con-tain two or more clumps or blue-stained granules which must be visible microscopically without fi ne-focusing of the cell.
Reticulocytes are purged from the bone marrow into the peripheral blood approximately 18–36 hours before their fi nal maturation. As such, they represent a system for the detection of the real-time status of erythropoiesis. Changes in the reticulocyte concentration in the blood correlate with the release of immature precursor stages, but not with the
Table 45: Classification of the anemias on the basis of MCV, MCH, and MCHC
Red cell indices Evaluation
MCV reducedMCH reducedMCHC normal, reduced
Most common form of anemia: microcytic anemia:Iron defi ciency, ACD; disturbance of iron distribution (tumor anemias); defi ciency of copper or vitamin B6; thalassemia.
MCV normalMCH normalMCHC normal
Normochromic, normocytic anemia:Non-regenerative anemias, e.g. chronic diseases of the kidneys, endocrine disorders, maldigestion, malabsorption, and malignant tumors.
MCV normalMCH elevated/normalMCHC elevated/normal
Normocytic, normo/hyperchromic anemia:Hemolysis, spherocytosis (MCHC elevated).
MCV elevatedMCH normal/elevatedMCHC normal/decreased
Macrocytic, hyperchromic anemia:Folate or vitamin B12 defi ciency anemia; liver cirrhosis;Alcoholism, MDS (myelodisplastic syndrome).
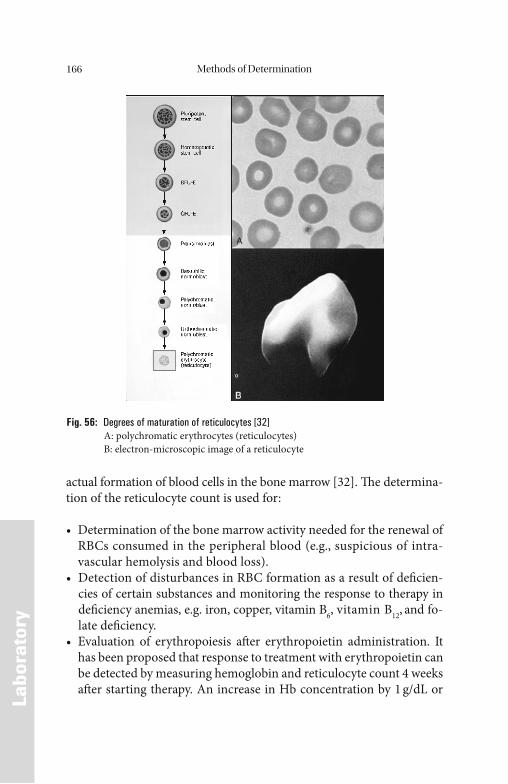
Methods of Determination166
LLabo
rato
ry
actual formation of blood cells in the bone marrow [32]. Th e determina-tion of the reticulocyte count is used for:
• Determination of the bone marrow activity needed for the renewal of RBCs consumed in the peripheral blood (e.g., suspicious of intra-vascular hemolysis and blood loss).
• Detection of disturbances in RBC formation as a result of defi cien-cies of certain substances and monitoring the response to therapy in defi ciency anemias, e.g. iron, copper, vitamin B6, vitamin B12, and fo-late defi ciency.
• Evaluation of erythropoiesis aft er erythropoietin administration. It has been proposed that response to treatment with erythropoietin can be detected by measuring hemoglobin and reticulocyte count 4 weeks aft er starting therapy. An increase in Hb concentration by 1 g/dL or
Fig. 56: Degrees of maturation of reticulocytes [32] A: polychromatic erythrocytes (reticulocytes) B: electron-microscopic image of a reticulocyte
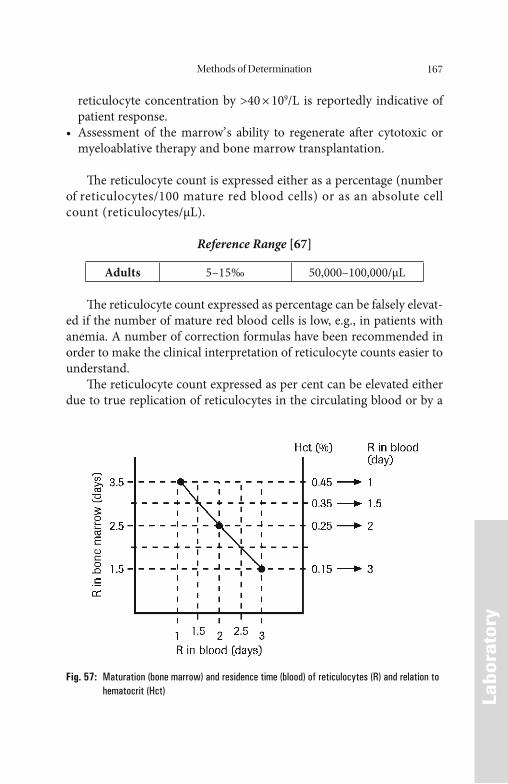
Methods of Determination 167
LLabo
rato
ry
reticulocyte concentration by >40 × 109/L is reportedly indicative of patient response.
• Assessment of the marrow’ s ability to regenerate aft er cytotoxic or myeloablative therapy and bone marrow transplantation.
Th e reticulocyte count is expressed either as a percentage (number of reticulocytes/100 mature red blood cells) or as an absolute cell count (reticulocytes/μL).
Reference Range [67]
Adults 5–15‰ 50,000–100,000/μL
Th e reticulocyte count expressed as percentage can be falsely elevat-ed if the number of mature red blood cells is low, e.g., in patients with anemia. A number of correction formulas have been recommended in order to make the clinical interpretation of reticulocyte counts easier to understand.
Th e reticulocyte count expressed as per cent can be elevated either due to true replication of reticulocytes in the circulating blood or by a
Fig. 57: Maturation (bone marrow) and residence time (blood) of reticulocytes (R) and relation to hematocrit (Hct)
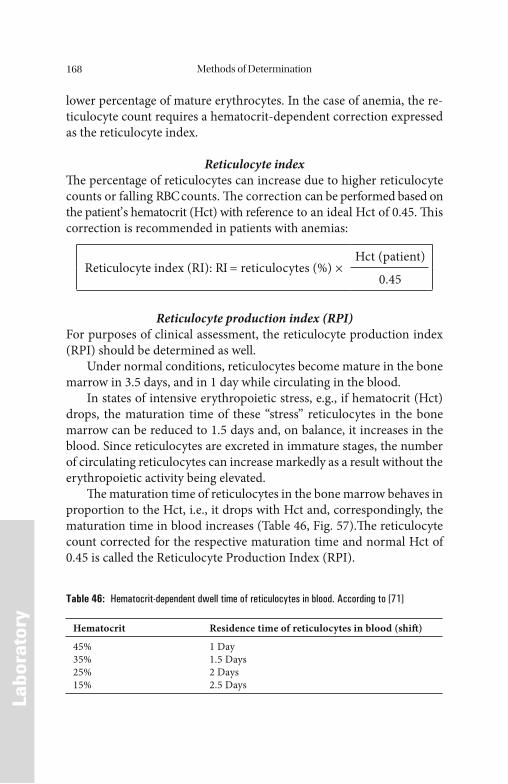
Methods of Determination168
LLabo
rato
ry
lower percentage of mature erythrocytes. In the case of anemia, the re-ticulocyte count requires a hematocrit-dependent correction expressed as the reticulocyte index.
Reticulocyte indexTh e percentage of reticulocytes can increase due to higher reticulocyte counts or falling RBC counts. Th e correction can be performed based on the patient’ s hematocrit (Hct) with reference to an ideal Hct of 0.45. Th is correction is recommended in patients with anemias:
Reticulocyte index (RI): RI = reticulocytes (%) ×Hct (patient)
0.45
Reticulocyte production index (RPI)For purposes of clinical assessment, the reticulocyte production index (RPI) should be determined as well.
Under normal conditions, reticulocytes become mature in the bone marrow in 3.5 days, and in 1 day while circulating in the blood.
In states of intensive erythropoietic stress, e.g., if hematocrit (Hct) drops, the maturation time of these “stress” reticulocytes in the bone marrow can be reduced to 1.5 days and, on balance, it increases in the blood. Since reticulocytes are excreted in immature stages, the number of circulating reticulocytes can increase markedly as a result without the erythropoietic activity being elevated.
Th e maturation time of reticulocytes in the bone marrow behaves in proportion to the Hct, i.e., it drops with Hct and, correspondingly, the maturation time in blood increases (Table 46, Fig. 57).Th e reticulocyte count corrected for the respective maturation time and normal Hct of 0.45 is called the Reticulocyte Production Index (RPI).
Table 46: Hematocrit-dependent dwell time of reticulocytes in blood. According to [71]
Hematocrit Residence time of reticulocytes in blood (shift )
45%35%25%15%
1 Day1.5 Days2 Days2.5 Days
Methods of Determination 169
LLabo
rato
ry
Reticulocyte Production Index (RPI)
RPI = Reticulocyte count in % × Hct (patient)Maturation time in blood in days 0.45 (ideal Hct)
Example: Hct = 25%, R = 20%, maturation time in blood: 2 days
RPI = 20 × 0.25
= 5.52 × 0.45
In this case, erythrocyte production is increased 5.5-fold.Th e reticulocyte production index is normally 1 when erythrocyte
formation and degradation are in balance. In the presence of anemia, an index value of > 2 indicates adequate renewal. Depending on the sever-ity of the anemia, an RPI value of < 2 indicates hypoplasia or ineff ective erythropoiesis. A bone marrow swab must also be obtained in order to perform a quantitative and qualitative assessment of erythropoiesis for a clinical assessment of the RPI.
In the case of normal, i.e., effective erythropoiesis, the number of reticulocytes correlates directly with the renewal of red cell forma-tion. Under an intensified effect of erythropoietin, reticulocyte mat-uration is shifted. The physiologic maturation time of reticulocytes is four days, three of which are spent in the bone marrow and one in the peripheral blood. The assessment of reticulocyte counts in clini-cal practice is based on this behavior. In the presence of anemia and depending on the hematocrit, maturation of the reticulocytes is moved to the peripheral blood with a correspondingly longer pres-ence in the circulating blood. The changed residence time of the re-ticulocytes in the peripheral blood is called the “shift”. The number of reticulocytes determined in the blood must be reduced by this number for making a clinical statement about the actual renewal ability of erythropoiesis. Without this shift correction, the reticulo-cyte values determined would be too high. The real numbers are cal-culated independence on the hematocrit with the aid of the reticulocyte production index.
Th e RPI can be useful in clarifying the causes of anemia. An RPI > 2.0 is associated with chronic hemolysis, bleeding or an eff ective thera-py of existing anemia. Indices < 2.0 are associated with marrow insuf-
Methods of Determination170
LLabo
rato
ry
fi ciency or ineff ective erythropoiesis such as vitamin B12 or folic acid defi ciency anemias.
Th e automated reticulocyte count ensures high counting precision. In addition, the maturation index (RNA content) and the cell indices (volume and Hb content) of the reticulocytes are determined. As a re-sult, their counting and analytical testing are gaining in clinical signifi -cance and acceptance for various diagnostic issues, especially in terms of the count results in the low range.
Hemoglobin Content of Reticulocytes
Many studies in the diff erentiation of anemias and for monitoring erythropoietin therapy demonstrated that the hemoglobin content of the reticulocytes (Ret-Hb) is an early indicator of iron-defi cient eryth-ropoiesis even when serum ferritin or transferrin saturation is still nor-mal [28]. Th e Ret-Hb increases markedly in dialysis patients who receive i.v. iron simultaneously with EPO during therapy. In the fi eld of pediatrics as well, Ret-Hb has proven to be a good indicator for iron defi ciency in children [28]. Ret-Hb can be provided using modern hematology systems. Th e normal range for Ret-Hb is 28–35 pg per reticulocyte.
Erythrocyte Ferritin
In a few studies, erythrocyte ferritin is proposed in place of serum fer-ritin as a parameter for anemia patients with chronic disease. Th e deter-mination is not as easy to perform as for serum ferritin, and erythrocyte ferritin responds very late to dynamic changes. If, in the case of iron defi ciency, practically the entire population of red blood cells has been replaced with erythrocytes having a low Hb content, erythrocyte ferritin fi rst drops to pathologically low values. Th e determination of erythro-cyte ferritin has not become part of daily routine testing.
Methods of Determination 171
LLabo
rato
ry
Zinc Protoporphyrin
Th e measurement of zinc protoporphyrin (ZPP) is a rapid method, but it requires a special hematofl uorimeter. An elevated ZPP value in un-treated blood is non-specifi c.
False positive values are observed primarily in patients with liver disease, infectious disease, and malignomas. Hastka found greatly ele-vated ZPP values caused by drug interferences [63]. Elevated values of bilirubin cause interference as well, as in the presence of cholestase, hepatitis or hemolytic anemias. ZPP contents that were apparently ele-vated were also found in patients with chronic kidney disease.
An apparently elevated ZPP concentration in the blood is caused by fl uorescence interference of drugs, bilirubin or – as in the case of kidney disease – in non-dialyzable, high molecular-weight plasma components. Th e yellow, red or brown intrinsic colors are described as particularly disturbing [63]. On the other hand, ZPP values that are too low are mea-sured when blood is stored. Th is is due to the shift in the absorbance spectrum of deoxygenated hemoglobin.
Before measuring ZPP in hematofl uorimeters, it is therefore recom-mended that the red cells be washed. Th is reduces ZPP normal values from 50 to 32 μmol/mol heme. Although the ZPP determination in-creases in specifi city as a result, the washing procedure must be per-formed manually. Th is cancels out the advantage of the rapid automated ZPP determination.
Tests for the Diagnosis of Chronic Infl ammation
Infl ammation can be detected using the following tests:• Erythrocyte sedimentation rate (ESR)• Quantitative determination of C-reactive protein (CRP) and/or serum
amyloid A protein (SAA)• Interleukin-6 (IL-6), Interleukin-8 (IL-8), and Tumor Necrosis
factor-α (TNF-α) determination• Diff erential blood count and leukocyte count.
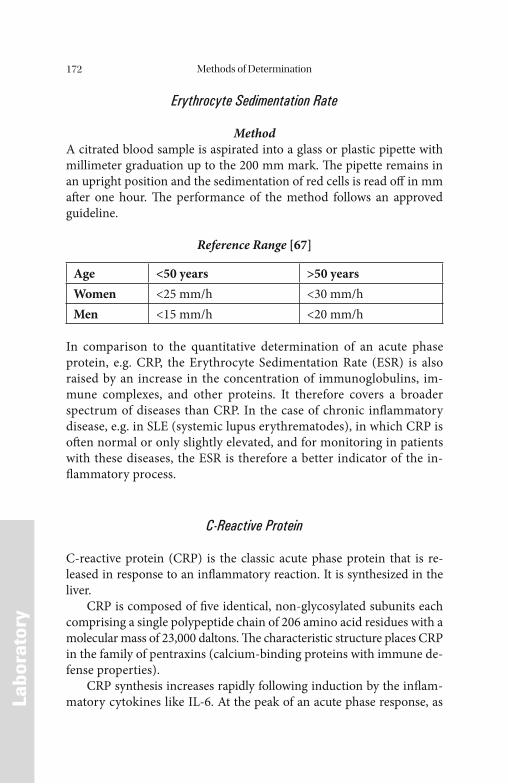
Methods of Determination172
LLabo
rato
ry
Erythrocyte Sedimentation Rate
MethodA citrated blood sample is aspirated into a glass or plastic pipette with millimeter graduation up to the 200 mm mark. Th e pipette remains in an upright position and the sedimentation of red cells is read off in mm aft er one hour. Th e performance of the method follows an approved guideline.
Reference Range [67]
Age <50 years >50 yearsWomen <25 mm/h <30 mm/hMen <15 mm/h <20 mm/h
In comparison to the quantitative determination of an acute phase protein, e.g. CRP, the Erythrocyte Sedimentation Rate (ESR) is also raised by an increase in the concentration of immunoglobulins, im-mune complexes, and other proteins. It therefore covers a broader spectrum of diseases than CRP. In the case of chronic infl ammatory disease, e.g. in SLE (systemic lupus erythrematodes), in which CRP is oft en normal or only slightly elevated, and for monitoring in patients with these diseases, the ESR is therefore a better indicator of the in-fl ammatory process.
C-Reactive Protein
C-reactive protein (CRP) is the classic acute phase protein that is re-leased in response to an infl ammatory reaction. It is synthesized in the liver.
CRP is composed of fi ve identical, non-glycosylated subunits each comprising a single polypeptide chain of 206 amino acid residues with a molecular mass of 23,000 daltons. Th e characteristic structure places CRP in the family of pentraxins (calcium-binding proteins with immune de-fense properties).
CRP synthesis increases rapidly following induction by the infl am-matory cytokines like IL-6. At the peak of an acute phase response, as
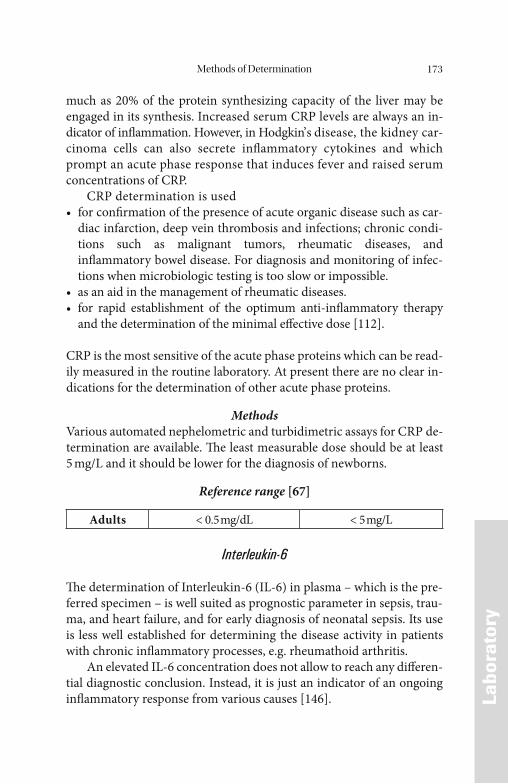
Methods of Determination 173
LLabo
rato
ry
much as 20% of the protein synthesizing capacity of the liver may be engaged in its synthesis. Increased serum CRP levels are always an in-dicator of infl ammation. However, in Hodgkin’ s disease, the kidney car-cinoma cells can also secrete infl ammatory cytokines and which prompt an acute phase response that induces fever and raised serum concentrations of CRP.
CRP determination is used• for confi rmation of the presence of acute organic disease such as car-
diac infarction, deep vein thrombosis and infections; chronic condi-tions such as malignant tumors, rheumatic diseases, and infl ammatory bowel disease. For diagnosis and monitoring of infec-tions when microbiologic testing is too slow or impossible.
• as an aid in the management of rheumatic diseases.• for rapid establishment of the optimum anti-infl ammatory therapy
and the determination of the minimal eff ective dose [112].
CRP is the most sensitive of the acute phase proteins which can be read-ily measured in the routine laboratory. At present there are no clear in-dications for the determination of other acute phase proteins.
MethodsVarious automated nephelometric and turbidimetric assays for CRP de-termination are available. Th e least measurable dose should be at least 5 mg/L and it should be lower for the diagnosis of newborns.
Reference range [67]
Adults < 0.5 mg/dL < 5 mg/L
Interleukin-6
Th e determination of Interleukin-6 (IL-6) in plasma – which is the pre-ferred specimen – is well suited as prognostic parameter in sepsis, trau-ma, and heart failure, and for early diagnosis of neonatal sepsis. Its use is less well established for determining the disease activity in patients with chronic infl ammatory processes, e.g. rheumathoid arthritis.
An elevated IL-6 concentration does not allow to reach any diff eren-tial diagnostic conclusion. Instead, it is just an indicator of an ongoing infl ammatory response from various causes [146].
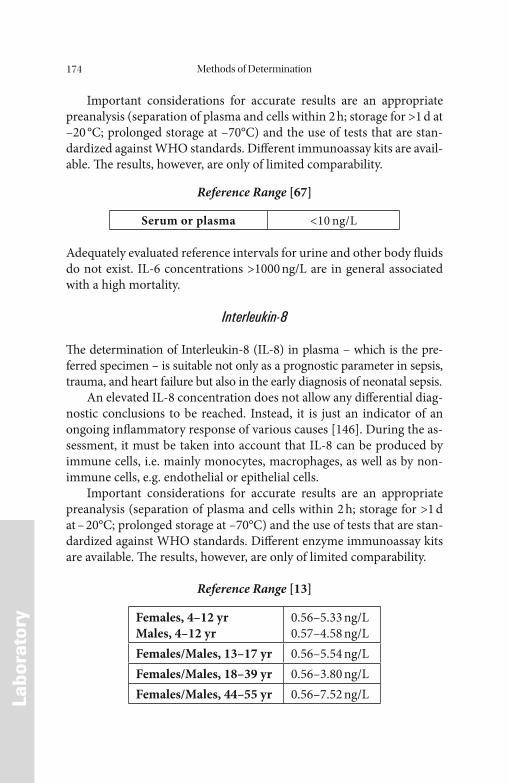
Methods of Determination174
LLabo
rato
ry
Important considerations for accurate results are an appropriate preanalysis (separation of plasma and cells within 2 h; storage for >1 d at –20 °C; prolonged storage at –70°C) and the use of tests that are stan-dardized against WHO standards. Diff erent immunoassay kits are avail-able. Th e results, however, are only of limited comparability.
Reference Range [67]
Serum or plasma <10 ng/L
Adequately evaluated reference intervals for urine and other body fl uids do not exist. IL-6 concentrations >1000 ng/L are in general associated with a high mortality.
Interleukin-8
Th e determination of Interleukin-8 (IL-8) in plasma – which is the pre-ferred specimen – is suitable not only as a prognostic parameter in sepsis, trauma, and heart failure but also in the early diagnosis of neonatal sepsis.
An elevated IL-8 concentration does not allow any diff erential diag-nostic conclusions to be reached. Instead, it is just an indicator of an ongoing infl ammatory response of various causes [146]. During the as-sessment, it must be taken into account that IL-8 can be produced by immune cells, i.e. mainly monocytes, macrophages, as well as by non-immune cells, e.g. endothelial or epithelial cells.
Important considerations for accurate results are an appropriate preanalysis (separation of plasma and cells within 2 h; storage for >1 d at – 20°C; prolonged storage at –70°C) and the use of tests that are stan-dardized against WHO standards. Diff erent enzyme immunoassay kits are available. Th e results, however, are only of limited comparability.
Reference Range [13]
Females, 4–12 yrMales, 4–12 yr
0.56–5.33 ng/L0.57–4.58 ng/L
Females/Males, 13–17 yr 0.56–5.54 ng/LFemales/Males, 18–39 yr 0.56–3.80 ng/LFemales/Males, 44–55 yr 0.56–7.52 ng/L
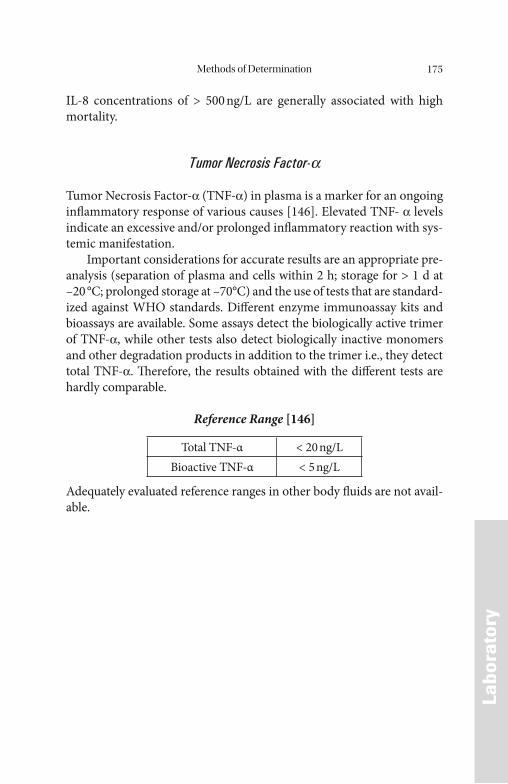
Methods of Determination 175
LLabo
rato
ry
IL-8 concentrations of > 500 ng/L are generally associated with high mortality.
Tumor Necrosis Factor-a
Tumor Necrosis Factor-α (TNF-α) in plasma is a marker for an ongoing infl ammatory response of various causes [146]. Elevated TNF- α levels indicate an excessive and/or prolonged infl ammatory reaction with sys-temic manifestation.
Important considerations for accurate results are an appropriate pre-analysis (separation of plasma and cells within 2 h; storage for > 1 d at –20 °C; prolonged storage at –70°C) and the use of tests that are standard-ized against WHO standards. Diff erent enzyme immunoassay kits and bioassays are available. Some assays detect the biologically active trimer of TNF-α, while other tests also detect biologically inactive monomers and other degradation products in addition to the trimer i.e., they detect total TNF-α. Th erefore, the results obtained with the diff erent tests are hardly comparable.
Reference Range [146]
Total TNF-α < 20 ng/LBioactive TNF-α < 5 ng/L
Adequately evaluated reference ranges in other body fl uids are not avail-able.
References176
References
[1] Aapro MS and Link H (2009) September 2007 update on EORT guidelines and anemia managent with erythropoiesis-stimulating agents. Oncologist 13 (suppl): 33–36
[2] Aisen P (1998) Transferrin, the transferrin receptor, and the up-take of iron by cells. In: Siegel S and Siegel H (eds) Metal ions in biological systems, Vol. 35. Marcel Dekker, New York, pp 585–631
[3] Albertini A, Arosio P, Chiancone E and Drysdale J (eds) (1984) Ferritins and isoferritins as biochemical markers. Elsevier, Amsterdam NewYork Oxford
[4] Alford CE, King TTE and Campell PA (1991) Role of transferrin, transferrin receptors and iron in macrophage listericidal activity. J Med 174: 459–466
[5] Andrews NC (1999) Disorders of iron metabolism. N Engl J Med 341: 1986–1995
[6] Arnett FC, Edworthy SM, Bloch DA, McShane DJ, Fries JF, Coo-per NS, et al. (1988) Th e American Rheumatism Association 1987 revised criteria for the classifi cation of rheumatoid arthritis. Ar-thritis Rheum 31: 315–324
[7] Arosio P, Levi S, Gabri E, et al. (1984) Heterogeneity of ferritin II: immunological aspects. In: Albertini A, Arosio P, Chiancone E and Drysdale J (eds) Ferritins and isoferritins as biochemical markers. Elsevier, Amsterdam New York Oxford, pp 33–47
[8] Ascherio A, Rimm EB, Giovanucci E, Willet WC and Stampfer MJ (2001) Blood donation and risk of coronary heart disease. Circu-lation 103: 52–57
[9] Ascherio A, Rimm EB, Giovanucci E and Stampfer MJ (1994) Di-etary iron intake and risk of coronary disease among men. Circu-lation 89: 969–974
[10] Ashrafi an H (2003) Hepcidin: the missing link between hemo-chromatosis and infections. Infect Immun 71: 6693–6700
[11] Baker EN and Lindley PF (1992) New perspectives on the struc-ture and function of transferrin. J Inorg Biochem 47: 147–160
[12] Barakat RM and Ekins RP (1961) Assay of vitamin B12 in blood. A simple method. Lancet 2: 25–26
[13] Barrahmoune H, Lamont JU, Herbeth B, FitzGerald PS and Visvikis-Siest S (2006) Biological determinants of and reference
References 177
values for plasma interleukin-8, monocyte chemoattractant protein-I, epidermal growth factor, and vascular endothelial growth factor: results from the STANISLAS cohort. Clin Chem 52: 504–510
[14] Baynes RD (1994) Iron defi ciency. In: Brock JH, Halliday JW, Pippard MJ and Powell LW (eds) Iron metabolism in health and disease. WB Saunders Co, London, pp 189–198
[15] Baynes RD (1996) Assessment of iron status. Clin Biochem 29: 209–215
[16] Begemann H and Rastetter J (1993) Klinische Haematologie, [4] Aufl . Th ieme, Stuttgart-New York
[17] Beguin Y (1998) Prediction of response to treatment with recom-binant human erythropoietin in anemia associated with cancer. Med Oncol 15 (Suppl 1): 38–46
[18] Beguin Y (1992) Th e soluble transferrin receptor: biological as-pects and clinical usefulness as quantitative measure of erythro-poiesis. Haematologica 77: 1–10
[19] Beguin Y, Clemons GK, Pootrakul P and Fillet G (1993) Quantita-tive asessment of erythropoiesis and functional classifi cation of anemia based on measurement of serum transferrin receptor and erythropoietin. Blood 81: 1067–1076
[20] Beguin Y (2003) Soluble transferrin receptor for the evaluation of erythropoisis and iron status. Clin Chim Acta 329: 9–22
[21] Besarab A, Bolton WK, Browne JK, Egrie JC, Nissenson AR, Okamato DM et al. (1998) Th e eff ect of normal as compared with low hemat-ocrit values in patients with cardiac disease who are receiving hemo-dialysis and Erythropoietin. N Engl J Med 339: 584–590
[22] Beutler E (1997) Genetic irony beyond haemochromatosis: clini-cal eff ects of HLA-H mutations. Lancet 349: 296–297
[23] Bobbio-Pallavicini F, Verde G, Spriano B, Losi R, Bosatra MG and Brasch A (1989) Body iron status in critically ill patients: signifi -cance of serum ferritin. Int Care Med 15: 171–178
[24] Boelaert JR, Weinberg GA and Weinberg ED (1996) Altered iron metabolism in HIV infection: Mechanisms, possible consequenc-es and proposals for management. Inf Dis Agents 5: 36–46
[25] Bothwell TH, Baynes RD, MacFarlane BJ and MacPhail AP (1989) Nutritional iron requirements and food iron absorption. J Intern Med 226: 357–365
References178
[26] Brock JH (1994) Iron in infection, immunity, infl ammation and neoplasia. In: Brock JH, Halliday JW, Pippard MJ, Powell LW and London WB (eds) Iron metabolism in health and disease. Saunders, London, pp 353–389
[27] Brouwer DAJ, Welten HTME, Reijngoud DJ, van Doormaal JJ and Muskiet FAJ (1998) Plasma folic acid cutoff value, derived from its relationship with homocyst(e)ine. Clin Chem 44: 1545–1550
[28] Brugnara C (2000) Reticulocyte cellular indices: a new approach in the diagnosis of anemias and monitoring of erythropoietic function. Critical Rev in Clin Lab Sci 37: 93–130
[29] Bunn HF (1991) Anemia associated with chronic disorders. In: Harrison’ s principles of internal medicine, 12th ed. McGraw-Hill, New York, pp 1529–1531
[30] Burmester G (1998) Taschenatlas der Immunologie: Grundlagen, Labor; Klinik. Th ieme, Stuttgart, New York
[31] Burns DL and Pomposelli JJ (1999) Toxicity of parenteral iron dextran therapy. Kid Int 55 (Suppl 69): 119–124
[32] Carr H and Rodak BF (1999) Clinical hematology atlas. WB Saunders, Philadelphia
[33] Carmel R (1997) Cobalamin, the stomach and aging. Am J Clin Nutr 66: 750–759
[34] Cazzola M, Mercuriali F and Brugnara C (1997) Use of recombi-nant human erythropoietin outside the setting of uraemia. Blood 89: 4248–4267
[35] Cazzola M, Ponchio L, de Benedetti F, Ravelli A, Rosti V, Beguin Y, et al. (1996) Defective iron supply for erythropoiesis and ade-quate endogenous erythropoietin production in anemia associat-ed with systemic onset invenile chronic arthritis. Blood 87: 4824–4830
[36] Cazzola M, Ponchio L, Pedrotti C, Farina G, Cerani P, Lucotti C, et al. (1996) Prediction to response of recombinant human eryth-ropoietin (rh-EPO) in anaemia of malignancy. Haematologica 81: 434–441
[37] Cheung W, Minton N, Gunawardena K and Frey K (2001) Th e pharmacokinetics and pharmacodynamics of epoietin alfa once weekly versus 3 times weekly. Eur J Clin Pharmacol 57: 411–418
[38] Cook JD, Skikne BS and Baynes RD (1993) Serum transferrin re-ceptor. Ann Rev Med 44: 63–74
References 179
[39] Cook JD, Skikne BS and Baynes RD (1986) Estimates of iron suf-fi ciency in the US population. Blood 68: 726–731
[40] Corti MC, Gaziano M and Hennekeus CH (1997) Iron status and risk of cardiovascular disease. Ann Epidemiol 7: 62–68
[41] Dallalio G, Fleury T and Means RT (2003) Serum hepcidin in clinical specimens. Brit J Haematol 122: 996–1000
[42] De Jong G, von Dijk IP and van Eijk HG (1990) Th e biology of transferrin. Clin Chim Acta 190: 1–46
[43] De Sousa M, Reimao R, Porto G, Grady RW, Hilgartner MW and Giardina P (1992) Iron and lymphocytes: reciprocal regulatory interactions. Curr Stud Hematol Blood Transf 58: 171–177
[44] Pointner H (1992) Folsäure-Resorptionstest. In: Deutsch E, Geyer G and Wenger R (eds) Laboratoriumsdiagnostik. Karger, Basel, pp 91–93
[45] Dietzfelbinger H (1993) Korpuskuläre hamolytische Anämien. In: Begemann H und Rastetter J (Hrsg) Klinische Haematologie, 4. Aufl . Th ieme, Stuttgart-New York, S 248–252
[46] Dinant JC, de Kock CA and van Wersch JWJ (1995) Diagnostic value of C-reactive protein measurement does not justify replace-ment of the erythrocyte sedimentation rate in daily general prac-tice. Eur J Clin Invest 25: 353–359
[47] Egrie JC, Dwyer E, Lykos M, Hitz A and Browne JK (1997) Novel erythropoiesis stimulating protein (NESP) has a longer serum half-life and greater in vitro biological activity compared to re-combinant human erythropoietin (rHU EPO). Blood 90: 56 A (abstract)
[48] Erslev AJ (1991) Erythropoietin. New Engl J Med 324: 1339–1344
[49] Eschbach JW, Haley NR and Adamson JW (1990) Th e anemia of chronic renal failure: pathophysiology and eff ects of recombinant erythropoietin. Contrib Nephrol 78: 24–37
[50] Feelders RA, Kuiper-Kramer EPA and van Eijk HG (1999) Struc-ture, function and clinical signifi cance of transferrin receptors.Clin Chem Lab Med 37: 1–10
[51] Ferguson BJ, Skikne BS, Simpson KM, Baynes RD and Cook JD (1992) Serum transferrin receptor distinguishes the anemia of chronic disease from iron defi ciency anemia. J Lab Clin Med 19: 385–390
References180
[52] Fisher JW (2003) Erythropoietin. Erythropoietin: physiology and pharmacology update. Exp Biol Med 228: 1–14
[53] Folkman J (1997) Addressing tumor blood vessels. Nat Biotechnol 15: 110–115
[54] Frishman WH (1998) Biologic markers as predictors of cardiovas-cular disease. Am J Med 104: 18s–27s
[55] Gabrilove JL, Cleeland CS, Livingston RB, et al. (2001) Clinical evaluation of once-weekly dosing of epoietin Alfa in chemothera-py patients: improvements in hemoglobin and quality of life are similar to three-times-weekly dosing. J Clin Oncol 19: 2875–2882
[56] Gargano G, Polignano G, De Lena M, Brandi M, Lorusso V and Fanizza G (1999) Th e utility of a growth factor: rHU-EPO as a treatment for pre-operative autologous blood donation in gy-naecological tumor surgery. Int J Oncol 4 (1): 157–160
[57] Goldberg MA, Dunning SP and Bunn HF (1988) Regulation of the erythropoietin gene: evidence, that the oxygen sensor is a hemo protein. Science 24w: 1412–1415
[58] Graf H, Lacombe JL, Braun J, Gomes da Costa AA and on behalf of the European/Australian NESP 970 290 study group (2000) Novel erythropoiesis stimulating protein (NESP) eff ectively main-tains hemoglobin (Hgb) when administered at a reduced dose frequency compared with recombinant human erythropoietin (r-HuEPO) in dialysis patients. J Am Soc Nephrol 11: A1317
[59] Graziadei I, Gaggl S, Kaserbacher R, Braunsteiner H and Vogl W (1994) Th e acute phase protein alpha-1 antitrypsin inhibits growth and proliferation on human early erythroid progenitor cells and of human erythroleucemic cells by interfering with transferrin iron uptake. Blood 83: 260–268
[60] Greendyke RM, Sharma K and Giff ord FR (1994) Serum levels of erythropoietin and selected cytokines in patients with anemia of chronic disease. Am Clin Path 101: 338–341
[61] Grützmacher P, Ehmer B, Messinger D, et al. (1991) Th erapy with recombinant human Erythropoietin (rEPO) in hemodialysis pa-tients with transfusion dependent anemia. Report of a European multicenter trial. Nephrologia 11: 58–65
[62] Gunshin H, Mackenzie B, Berger UV, et al. (1997) Cloning and characterization of a mammalian proton-coupled metal-ion transporter. Nature 388: 482–488
References 181
[63] Hastka J, Lasserre JJ, Schwarzbeck A, Strauch M and Hehlmann R (1992) Washing erythrocyte to remove interferents in measure-ments of zinc protoporphyrin by front-face hematofl uorometry. Clin Chem 11: 2184–2189
[64] Haupt H and Baudner S (1990) Chemie und klinische Bedeutung der Human Plasma Proteine. Behring Institut Mitteilungen 86: 1–66
[65] Haverkate F, Th ompson SG, Pyke SD, Gallimore JR and Pepys MB (1997) Production of C-reactive protein and risk of coronary events in stable and unstable angina. European Concerted Action on Th rombosis and Disabilities Angina Pectoris Study Group. Lancet 349: 462–466
[66] Heidelberger M and Kendall FE (1935) Th e precipitin reaction between type III pneumococcus polysaccharide and homologous antibody III. A quantitative study and theory of the reaction mechanism. J Exp Med 61: 563–591
[67] Heil W and Ehrhardt V (2008) Reference ranges for adults and children, 9th edn. Roche Diagnostics Ltd., Rotkreuz, Switzerland
[68] Heinrich HC (1986) Bioverfügbarkeit und therapeutische Wirk-samkeit oraler Eisen (2)- und (3) Praparate. Schweiz. Apotheker-Zeitung 22: 1231–1256
[69] Henke M, Guttenberger R, Barke A, Pajonk F, Potter R and From-mhold H (1999) Erythropoietin for patients undergoing radio-therapy: a pilot study. Radiother Oncol 502: 185–190
[70] Herrmann W, Schorr H, Purschwitz K, Rassoul F and Richter V (2001) Total homocysteine, vitamin B12, and total antioxidant status in vegetarians. Clin Chem 47: 1094–1101
[71] Hillman RS and Finch CA (1985) Red cell manual, 5th edn. Davis, Philadelphia
[72] Hörl WH, Cavill I, Macdougall IC, Schaefer RM and Sunder-Plassmann G (1996) How to diagnose and correct iron defi ciency during rhEPO therapy, a consensus report. Nephrol Dial Trans-plant 11: 246–250
[73] Huebers HA, Beguin Y, Pootrakne P, Einspahr D and Finch CA (1990) Intact transferrin receptors in human plasma and their re-lation to erythropoiesis. Blood 75: 102–107
[74] http://www.biocarta.com/pathfi les/h_TH1TH2Pathway.asp
References182
[75] International Committee for Standardisation in Haematology (1988) Recommendations for measurement of serum iron in blood. Int J Hematol 6: 107–111
[76] Jacobs A, Hodgetts J and Hoy TG (1984) Functional aspects of isoferritins. In: Albertini A, Arosio P, Chiancone E and Drysdale J (eds) Ferritins and isoferritins as biochemical markers. Elsevier, Amsterdam New York Oxford, pp 113–127
[77] Jiang R, Manson JE, Meigs JB, Ma J, Rifai N and Hu FB (2004) Body iron stores in relation to risk of type 2 diabetes in appar-ently healthy women. JAMA 291: 711–717
[78] Johnson AM (1996) Other proteins: ceruloplasmin. In: Ritchie RF and Navolotskaia O (eds) Serum proteins in clinical medicine. Foundation for Blood Research, Scarborough, MA
[79] Jouanolle AM, Gandon G, Jézéquel P, Blayau M, et al. (1996) Hae-mochromatosis and HLA-H. Nature Genet 14: 251–252
[80] Kaltwasser JP, Kessler U, Gottschalk R, Stucki G and Moller B (2001) Eff ect of rHU-erythropoietin and i.v. iron on anaemia and disease activity in rheumatoid arthritis. J Rheumatol 28: 2430–2437
[81] Kiechl S, Willeit J, Egger G, et al. (1997) Body iron stores and the risk of carotid atherosclerosis: prospective results from the Bruneck Study. Circulation 96: 3300–3307
[82] Knekt P, Reunanen A, Takkunen H, Aromaa A, Heliövaara M and Hakuunen T (1994) Body iron stores and the risk of cancer. Int J Cancer 56: 379–382
[83] Kolbe-Busch S, Lotz J, Hafner G, Blanckaert J, Claeys G, Togni G, Carlsen J, Röddiger R and Th omas L (2002) Multicenter evalua-tion of a fully mechanized soluble transferrin receptor assay on the Hitachi and COBAS INTEGRA analyzers and determination of reference ranges. Clin Chem Lab Med 40: 529–536
[84] Kubasik NP, Ricotta M and Sine HE (1980) Comercially supplied binders for plasmacobalamin (vitamin B12) analysis – “purifi ed” intrinsic factor, “cobinamide”-blocked R-protein binder, and non-purifi ed intrinsic factor-R-protein binder – compared to micro-biological assay. Clin Chem 26: 598–600
[85] Leedman PJ, Stein AR, Chin WW and Rogers JT (1996) Th yroid hormone modulates the interaction between iron regulatory pro-teins and the ferritin mRNA iron responsive element. J Biol Chem 271: 12017–12023
References 183
[86] Lejeune FJ, Rüegg C and Liénard D (1998) Clinical applications on TNF-alpha in cancer. Curr Opin Immunol 10: 573–580
[87] Leon P, Jimence M, Barona P and Sierrasesumaga L (1998) Re-combinant human erythropoietin for the treatment of anemia in children with solid malignant tumors. Med Pediatr Oncol 30 (2): 110–116
[88] Lichtman MA (2001) William’ s hematology, 6th edn. McGraw-Hill, New York
[89] Linkesch W (1986) Ferritin bei malignen Erkrankungen. Spring-er, Wien-NewYork
[90] Linker CA (2009) Blood disorders. In: McPhee SJ and Papadakis MA (eds) Current medical diagnosis and treatment, 48th edn. McGraw-Hill, New York, pp 427–464
[91] Littlewood TJ, Bajetta E, Nortier JW, Vercammen E and Rapoport B (2001) Epoetin Alfa Study Group: eff ects of epoetin alfa on he-matologic parameters and quality of life in cancer patients receiv-ing nonplatinum chemotherapy: results of a randomized, doubleblind, placebo-controlled trial. J Clin Oncol 19: 2865–2874
[92] Loher F and Endress S (2001) Suppression of synthesis of tumor necrosis factor. Internist 42: 28–34
[93] Ludwig H, Fritz E, Leitgeb C, Pecherstorfer M, Samonigg H and Schuster J (1994) Prediction of response to erythropoietin treat-ment in chronic anemia of cancer. Blood 84: 1056–1063
[94] MacDougall IC, Gray SJ, Elston O, Breen C, Jenkins B, Browne J and Egrie J (1999) Pharmaco-kinetics of novel erythropoiesis stimulating protein compared with erythropoietin alfa in dialysis patients. J Am Soc Nephrol 10: 2392–2395
[95] Macdougall IC and Eckart K (2006) Novel strategies for stimulat-ing erythropoiesis and potential new treatments for anemia. Lan-cet 368: 947–953
[96] Macdougall IC, Robson R, Oparna S, et al. (2006) Pharmacokinet-ics and pharmacodynamics of intravenous and subccoutaneous erythropoietin receptor activator (C.E.R.A.) in patients with chronic kidney disease. Clin J Am Soc Nephrol 1: 1211–1215
[97] Maini RN, Breedveld FC, Kalden JR, Smolen JS, Davis D, Macfar-lane JD, et al. (1998) Th erapeutic effi cacy of multiple intravenous infusions of anti-tumor necrosis factor monoclonal antibody combined with low-dose weekly methotrexate in rheumatoid ar-thritis. Arthritis Rheum 41: 1552–1563
References184
[98] Mangold C (1998) Th e causes and prognostic signifi cance of low hemoglobin levels in tumor patients. Strahlenther Onkol 174 (suppl 4): 17–19
[99] Mantovani G, Ghiani M, Curreli L, Maccio A, Massa D, Succu G, et al. (1999) Assessment of the effi cacy of two dosages and sche-dules of human recombinant erythropoietin in prevention and correction of cisplatin induced anemia in cancer patients. Oncol Rep 6: 421–426
[100] Massey AC (1992) Microcytic anemia. Diff erential diagnosis and management of iron defi cient anemia. Med Clin North Am 76: 549–566
[101] Mast AE, Blinder MA, Gronowski AM, Chumley C, Scott MG, et al. (1998) Clinical utility of the soluble transferrin receptor and comparison with serum ferritin in several populations. Clin Chem 44: 45–51
[102] Means RT (1995) Pathogenesis of the anemia of chronic disease: A cytokine mediated anemia. Stem Cells (Dayt) 13: 32–37
[103] Menacci A, Cenci E, Boelaert JR, et al. (1997) Iron overload alters T helper cell responses to Candida albicans in mice. J Infect Dis 175: 1467–1476
[104] Mercuriali F, Gualtieri G, Sinigaglia L, et al. (1994) Use of recom-binant human erythropoietin to assist autologous blood donation by anemic rheumatiod arthritis patients undergoing major ortho-pedic surgery. Transfusion 34: 501–506
[105] Moldawer LL and Copeland EM (1997) Proinfl ammatory cyto-kines, nutritional support, and the cachexia syndrome: interactions and therapeutic options. Cancer 79: 1828–1839
[106] Mutane J, Piug-Parellada P and Mitjavila MT (1995) Iron metabo-lism and oxidative stress during acute and chronic phases of ex-perimental infl ammation. Eff ect of iron dextran and desferoxamine. J Lab Clin Med 126: 435–443
[107] NCCLS (1993) Procedure for determining packed cell vol-ume by the microhematocrit method, 2nd edn.; approved standard. NCCLS Document H7 – A2, Vol. 13, no. 9. Villano-va: NCCLS
[108] Nowrousian MR (2002) Pathophysiology of cancer-related ane-mia. In: Nowrousian MR (ed) Recombinant human erythropoie-tin in clinical oncology: scientifi c and clinical aspects of anemia in cancer. Springer Medicine, New York, pp 13–34
References 185
[109] Park JE, Lentner MC, Zimmermann RN, et al. (1999) Fibroblast activation protein, a dual specifi city serine protease expressed in reactive human tumor stromal fi broblasts. J Biol Chem 274: 36505–36512
[110] Paruta S and Hörl WH (1999) Iron and infection. Kidney Int 55: 125–130
[111] Peeters HRM, Jongen-Lavrencic M and Bakker CH (1999) Re-combinant human Erythropoetin improves health-related quality of life in patients with rheumatoid arthritis and anaemia of chron-ic disease; utility measures correlate strongly with disease activity measures. Rheumatol Int 18: 201–206
[112] Pepys MB (1995) Th e acute phase response and C-reactive pro-tein. In: Weatherall DJ, Kuller LH, Tracy RP, Shaten J and Meilahn EN (eds) Oxford textbook of medicine, 3rd edn. Oxford University Press, Oxford, England, pp 1527–1533
[113] Pietranglo A (2004) Hereditary hemochromatosis – a new look at an old disease. N Engl J Med 350: 2383–2397
[114] Pincus T, Olsen NJ, Russell IJ, et al. (1990) Multicenter study of recombinant human Erythropoietin in correction of anemia in rheumatoid arthritis. Am J Med 89: 161–168
[115] Ponka P (1999) Cellular iron metabolism. Kidney Int 55 (Suppl 69): S2–S11
[116] Ponka P, Beaumont C and Richardson R (1998) Function and regulation of transferrin and ferritin. Semin Hematol 35: 35–54
[117] Punnonen K, Irjala K and Rajamaki A (1994) Iron defi ciency ane-mia is associated with high concentrations of transferrin receptor in serum. Clin Chem 40: 774–776
[118] Qvist N, Boesby S, Wolff B and Hansen CP (1999) Recombinant human erythropoietin and hemoglobin concentrations at op-eration and during the postoperative period. World J Surg 23: 30–35
[119] Rauramaa R, Väisänen S, Mercuri M, Rankinen T, Penttilä I and Bond MG (1994) Association of risk factors and body iron status to carotid atherosclerosis in middle aged eastern Finnish men. Eur Heart J 15: 1020–1027
[120] Refsum H, Johnston C, Guttormsen AB and Nexo E (2006) Ho-lotranscobalamin and total transcobalamin in human plasma: de-termination, determinants, and reference values in healthy adults. Clin Chem 52: 129–137
References186
[121] Richardson DR and Ponka P (1997) Th e molecular mechanisms of the metabolism and transport of iron in normal and neoplastic cells. Biochim Biophys Acta 1331: 1–40
[122] Roberts AG, Whatley SD, Morgan RR, Worwood M and Elder GH (1997) Increased frequency of the haemochromatosis cys 282 tyr mutation in sporadic prophyria cutanea tarda. Lancet 349: 321–323
[123] Robinson SH (1990) Degradation of hemoglobin. In: Williams WJ, Beutler W, Erslev AJ and Lichtman MA (eds) Hematology, 4th edn. McGraw-Hill, New York
[124] Roth D, Smith RD, Schulman G, et al. (1994) Eff ects of recombi-nant human erythropoietin on renal function in chronic renal failure predialysis patients. Am J Kidney Dis 24: 777–784
[125] Sandborn WJ and Hanauer SB (1999) Antitumor necrosis factor therapy for infl ammatory bowel disease: a review of agents, pharma-cology, clinical results and safety. Infl amm Bowel Dis 5: 119–133
[126] Sassa S (1990) Synthesis of heme. In: Williams WJ, Beutler E, Er-slev AJ and Lichtman MA (eds) Hematology, 4th edn. McGraw-Hill, New York, pp 332–335
[127] Schilling RE and Williams WJ (1995) Vitamin B12 defi ciency: under-diagnosed, overtreated? Hosp Pract 30: 47–52
[128] Schulze-Osthoff K, Ferrari D, Los M, Wesselborg S and Peter ME (1998) Apoptosis signaling by death receptors. Eur J Biochem 254: 439–459
[129] Schurek HJ (1992) Oxygen shunt diff usion in renal cortex and its physiological link to erythropoietin production. In: Pagel H, Weiss C and Jelkmann W (eds) Pathophysiology and pharmacol-ogy of erythropoietin. Springer, Berlin Heidelberg New York Tokyo, pp 53–55
[130] Scigalla P, Ehmer B, Woll EM, et al. (1990) Zur individuellen Ans-prechbarkeit terminal niereninsuffi zienter Patienten auf die RhE-PO-Th erapie. Nieren-Hochdruckerkrankungen 19: 178–183
[131] Scott JM and Weir DG (1980) Drug induced megaloblastic change.Clin Haematol 9: 587–606
[132] Sears D (1992) Anemia of chronic disease. Med Clin North Am 76: 567–579
[133] Shapiro HM (1995) Practical fl ow cytometry, 3rd edn. Wiley-Liss, New York
References 187
[134] Shinozuka N, Koyama J, Anzai H, et al. (2000) Autologous blood transfusion in patients with hepatocellular carcinoma undergoing hepatectomy. Am J Surg 179: 42–45
[135] Sullivan JL (1996) Perspectives on the iron and heart disease de-bate. J Clin Epidermial 49: 1345–1352
[136] Sunder-Plassmann G and Hörl WH (1997) Erythropoietin and iron. Clin Nephrol 47: 141–157
[137] Suominen P, Punnonen P, Rajamaki A and Irjala K (1997) Evalu-ation of new immunoenzymometric assay for measuring soluble transferrin receptor to detect iron defi ciency in anaemic patients. Clin Chem 43: 1641–1646
[138] Suominen P, Punnonen K, Rajamaki A and Irjala K (1998) Serum transferrin receptor and transferrin receptor-ferritin index identity healthy subjects with subclinical iron defi cits. Blood 92: 2934–2939
[139] Th omas C and Th omas L (2007) Biochemical and hematoligical indices in the diagnosis of functional iron defi ciency. Clin Chem 48: 1066–1076
[140] Th omas L (2005) Porphyrine. In: Th omas L (Hrsg) Labor und Di-agnose, 6. Aufl . TH-Books, Frankfurt/Main, pp 646–659
[141] Th orpe SJ, Walker D, Arosio P, Heath A, Cook JD and Worwood M (1997) International collaborative study to evaluate a recombi-nant ferritin preparation as an international standard. Clin Chem 43: 1582–1587
[142] Th orstensen K and Romslo I (1993) Th e transferrin receptor: its diagnostic value and its potential as therapeutic target. Scand J Clin Lab Invest 53 (suppl 215): 113–120
[143] Tuomainen T, Punnonen K, Nyyssönen K and salvonen JT (1998) Association between body iron stores and the risk of myocardial infarction in men. Circulation 97: 1461–1466
[144] Valcour AA, Krzymowski G, Onoroski M, Bowers GN Jr and McComb RB (1990) Proposed reference method for iron in se-rum used to evaluate two automated iron methods. Clin Chem 36: 1789–1792
[145] Vanrenterghem Y, Barany P, Mann J and on behalf of the Europe-an/Australian NESP 970290 Study Group (2000) Novel erythro-poiesis stimulating protein (NESP) maintains hemoglobin (Hgb) in ESRD patients when administered once weekly or once every other week. J Am Soc Nephrol 11 (suppl): A1365 (abstract)
References188
[146] Volk HD, Keyßer G and Burmester GR (2007) Zytokine und Zy-tokinrezeptoren. In: Th omas L (ed) Labor und Diagnose, 6. Aufl . TH Books Verlagsgesellschaft , Frankfurt, pp 1039–1051
[147] Waheed A, Parkkila S, Saarnio J, et al. (1999) Association of HFE protein with transferrin receptor in crypt enterocytes of human duodenum. Proc Nat Acad Sci USA 96: 1579–1584
[148] Ware CF, Santee S and Glass E (1998) Tumor necrosis factor-relat-ed ligands and receptors. In: Th omson AW (ed) Cytokine hand-book. Academic Press, San Diego, pp 549–593
[149] Weiss G (1999) Iron and anemia of chronic disease. Kidney Int 55: 12–17
[150] Weiss G, Houston T, Kastner S, Johrer K, Grunewald K and Brock JH (1997) Regulation of cellular iron metabolism by erythropoi-etin: activation of iron-regulatory protein and upregulation of transferrin receptor expression in erythroid cells. Blood 89: 680–687
[151] Weiss G, Wachter H and Fuchs D (1995) Linkage of cell-mediated immunity to iron metabolism. Immunol Today 6: 495–500
[152] Weiss G, Werner-Felmayer G, Werner ER, Grunewald K, Wachter H and Hentze MW (1994) Iron regulates nitric oxide synthase ac-tivity by controlling nuclear transcription. J Exp Med 180: 969–976
[153] Witherspoon LR (1981) Vitamin B12: Are serum radioassay mea-surements reliable? J Nuc Med 22: 474–477
[154] Yap GS and Stevenson MM (1994) Inhibition of in vitro erythro-poiesis by soluble mediators of Plasmodium chalandi AS malaria: lack of a major role of interleukin l, TNF-alpha and gamma-inter-feron. Infect Immun 62: 357–362
Further Reading
Andrews NC (1999) Disorders of iron metabolism. N Engl J Med 341: 1986–1995
Beck N (2009) Diagnostic hematology. Springer, Berlin Crichton R (2009) Inorganic biochemistry of iron metabolism. From mo-
lecular mechanisms to clinical consequences. Wiley, Chichester New York Weinheim Brisbane Singapore Toronto

References 189
Lichtman MA (2001) William’ s hematology, 6th edn. McGraw-Hill, New York
Malyszko J (2009) Hemojuvelin: the hepcidin story continues. Kidney Blood Press Res 32: 71–76
Meyers RA (ed) (2007) Immunology: from cell biology to disease. Wiley-VCH, Weinheim
Kidney Int 1999, Vol. 55, Suppl 69Th omas L (ed) (2007) Labor und Diagnose, 7. Aufl . TH Books Verlags-
gesellschaft , Frankfurt Weiss G, Gordeuk VR, Heshko C (eds) (2005) Anemia of chronic dis-
eases. CRC Press, Boca Raton, FL
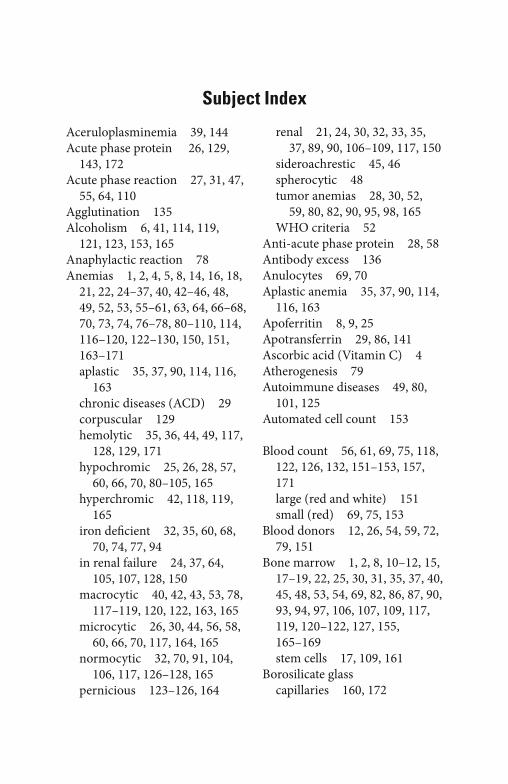
Subject Index
Aceruloplasminemia 39, 144Acute phase protein 26, 129, 143, 172Acute phase reaction 27, 31, 47, 55, 64, 110Agglutination 135Alcoholism 6, 41, 114, 119, 121, 123, 153, 165Anaphylactic reaction 78Anemias 1, 2, 4, 5, 8, 14, 16, 18,
21, 22, 24–37, 40, 42–46, 48, 49, 52, 53, 55–61, 63, 64, 66–68, 70, 73, 74, 76–78, 80–110, 114, 116–120, 122–130, 150, 151, 163–171
aplastic 35, 37, 90, 114, 116, 163
chronic diseases (ACD) 29 corpuscular 129 hemolytic 35, 36, 44, 49, 117,
128, 129, 171 hypochromic 25, 26, 28, 57,
60, 66, 70, 80–105, 165 hyperchromic 42, 118, 119,
165 iron defi cient 32, 35, 60, 68,
70, 74, 77, 94 in renal failure 24, 37, 64,
105, 107, 128, 150 macrocytic 40, 42, 43, 53, 78,
117–119, 120, 122, 163, 165 microcytic 26, 30, 44, 56, 58,
60, 66, 70, 117, 164, 165 normocytic 32, 70, 91, 104,
106, 117, 126–128, 165 pernicious 123–126, 164
renal 21, 24, 30, 32, 33, 35, 37, 89, 90, 106–109, 117, 150
sideroachrestic 45, 46 spherocytic 48 tumor anemias 28, 30, 52,
59, 80, 82, 90, 95, 98, 165 WHO criteria 52Anti-acute phase protein 28, 58Antibody excess 136Anulocytes 69, 70Aplastic anemia 35, 37, 90, 114,
116, 163Apoferritin 8, 9, 25Apotransferrin 29, 86, 141Ascorbic acid (Vitamin C) 4Atherogenesis 79Autoimmune diseases 49, 80,
101, 125Automated cell count 153
Blood count 56, 61, 69, 75, 118, 122, 126, 132, 151–153, 157, 171
large (red and white) 151 small (red) 69, 75, 153Blood donors 12, 26, 54, 59, 72,
79, 151Bone marrow 1, 2, 8, 10–12, 15,
17–19, 22, 25, 30, 31, 35, 37, 40, 45, 48, 53, 54, 69, 82, 86, 87, 90, 93, 94, 97, 106, 107, 109, 117, 119, 120–122, 127, 155, 165–169
stem cells 17, 109, 161Borosilicate glass
capillaries 160, 172
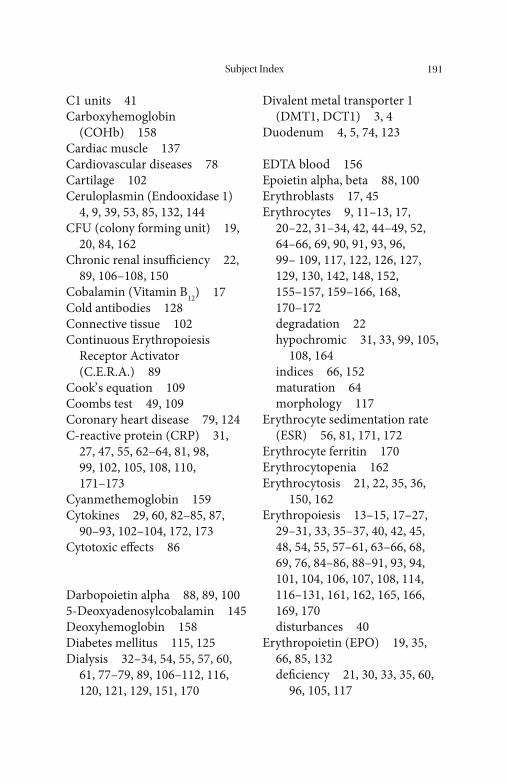
Subject Index 191
C1 units 41Carboxyhemoglobin
(COHb) 158Cardiac muscle 137Cardiovascular diseases 78Cartilage 102Ceruloplasmin (Endooxidase 1)
4, 9, 39, 53, 85, 132, 144CFU (colony forming unit) 19,
20, 84, 162Chronic renal insuffi ciency 22,
89, 106–108, 150Cobalamin (Vitamin B12) 17Cold antibodies 128Connective tissue 102Continuous Erythropoiesis
Receptor Activator (C.E.R.A.) 89
Cook’ s equation 109Coombs test 49, 109Coronary heart disease 79, 124C-reactive protein (CRP) 31,
27, 47, 55, 62–64, 81, 98, 99, 102, 105, 108, 110, 171–173
Cyanmethemoglobin 159Cytokines 29, 60, 82–85, 87,
90–93, 102–104, 172, 173Cytotoxic eff ects 86
Darbopoietin alpha 88, 89, 1005-Deoxyadenosylcobalamin 145Deoxyhemoglobin 158Diabetes mellitus 115, 125Dialysis 32–34, 54, 55, 57, 60,
61, 77–79, 89, 106–112, 116, 120, 121, 129, 151, 170
Divalent metal transporter 1(DMT1, DCT1) 3, 4
Duodenum 4, 5, 74, 123
EDTA blood 156Epoietin alpha, beta 88, 100Erythroblasts 17, 45Erythrocytes 9, 11–13, 17,
20–22, 31–34, 42, 44–49, 52, 64–66, 69, 90, 91, 93, 96, 99– 109, 117, 122, 126, 127, 129, 130, 142, 148, 152, 155–157, 159–166, 168, 170–172
degradation 22 hypochromic 31, 33, 99, 105,
108, 164 indices 66, 152 maturation 64 morphology 117Erythrocyte sedimentation rate
(ESR) 56, 81, 171, 172Erythrocyte ferritin 170Erythrocytopenia 162Erythrocytosis 21, 22, 35, 36,
150, 162Erythropoiesis 13–15, 17–27,
29–31, 33, 35–37, 40, 42, 45, 48, 54, 55, 57–61, 63–66, 68, 69, 76, 84–86, 88–91, 93, 94, 101, 104, 106, 107, 108, 114, 116–131, 161, 162, 165, 166, 169, 170
disturbances 40Erythropoietin (EPO) 19, 35,
66, 85, 132 defi ciency 21, 30, 33, 35, 60,
96, 105, 117
Subject Index192
determination 150 dose 94, 98, 110 recombinant human (rhu-
EPO) 88, 89, 96, 98, 99, 104, 105, 108, 110, 111, 150
Extrinsic factor 145
Ferric carboxymaltose 76Ferritin 1, 4, 7–12, 14, 15, 22,
24–29, 31–40, 46, 48, 50, 52–65, 68–70, 72, 73, 75–77, 79–81, 84, 86, 87, 91, 92, 95, 97–99, 105, 107–113, 115, 119, 132, 135, 137–140, 142–144, 170
apoferritin 8, 9, 25 determination 34, 48, 54–56,
59–61, 138 isoferritin (acidic, basic) 8,
10, 11, 22, 27, 59, 137, 138 non-representative 31, 57,
59, 119 subunits 9, 10, 12, 137, 142,
172 synthesis 8, 25, 29, 58, 84 clinical interpretation 91, 167 ferritin release 29, 80Ferrochelatase 46Ferroportin 4, 5, 38, 114Ferrous fumarate 75Ferrous gluconate 75Ferrous sulfate 75Flow cytometry 153–156Folic acid 17, 32, 40–43, 109,
117, 120–123, 126, 132, 147–149, 170
antagonists 32, 41
defi ciency 40–43, 109, 117, 121–123, 148, 170
requirement 121, 122Functional iron defi ciency 26,
31–33, 59–61, 63, 64, 97–99, 108, 109
Glucuronic acid 23Glucose-6-phosphate-dehydroge-
nase 48, 49, 128, 129
Haptoglobin 5, 9, 47, 48, 53, 85, 106, 117, 127–129, 132, 142–144
Heidelberger-Kendall curve 136Hematocrit (Hct) 53, 75, 79, 90,
91, 99, 105, 108, 132, 150–152, 157, 159, 160, 162–164, 167–169
Hematologic system diseases 93Hematology analyzer 65, 151,
160–163Heme 4, 5, 8, 9, 18, 23, 32, 48,
94, 143, 171Hemiglobin 158, 159Hemochromatosis 16, 24, 25,
36–40, 50, 56, 57, 76, 114–116, 144
acquired 114 primary 37, 38, 50, 57,
114–116 secondary 56, 57, 116Hemoglobin (Hb) 3, 9, 11–13,
17, 18, 22–24, 26, 31, 34, 36, 42–44, 47–53, 56, 61, 63, 66, 68, 69, 76, 79, 86, 90, 91, 93–95, 98, 99, 105–109, 111, 112, 122, 126–130, 132, 143, 150, 152,
Subject Index 193
157–159, 162–164, 166, 170, 171
degradation 22, 23 derivatives 158 determination 158, 159
electrophoresis 43, 44, 49, 130
free Hb 47, 48, 129, 143, 158 globin content 31, 42, 53, 63,
66, 152, 170Hemoglobinopathies 43, 44, 48,
117, 130Hemoglobinuria 48, 49, 128Hemojuvelin 38, 114Hemolysis 9, 22, 24, 25, 30, 35,
44, 46–49, 52, 53, 74, 93, 99, 106–108, 117, 121, 127–129, 134, 143, 165, 166, 169
autoimmune 30, 40, 49, 80, 101, 125, 128
corpuscular 44, 46, 48, 49, 129, 157, 162
extracorpuscular 46, 48, 128Hemopexin 5, 9, 47, 48, 143Hemosiderin 8, 9, 14, 50, 53, 54,
113Hemosiderosis 37, 97Hepcidin 3, 5, 16, 29, 30, 38,
100, 114HFE gene 5, 38, 114HFE protein 38, 114HLA 38, 40, 114Hodgkin’ s disease 97, 173Homocysteine 42, 43, 120, 149, 150Hyperhomocysteinemia 43Hypermenorrhea 72Hypoferremia 51
Impedance-based cell counters 156–158
Infections 27–29, 49, 54, 55, 57–59, 66, 78, 80, 88, 91, 95, 98, 101, 128, 173
Interferon (IFN) 29, 82–87, 94, 103
Interleukin-1 (IL-1) 84, 92, 101Interleukin-6 (IL-6) 110, 171,
173Interleukin-8 (IL-8) 171, 174Intrinsic factor 17, 41, 123–126,
145, 146Iron 1, 3–18, 22, 24–135,
137–144, 163–166, 170 absorption 3–5, 8, 22, 26, 33,
34, 38, 39, 45, 48, 50, 72, 75, 76, 114
administration 54, 68, 76, 77, 88
balance 5, 12, 24, 26, 39, 50, 68, 69, 105
binding proteins 135 circadian rhythm 133, 138,
140, 143 distribution 7, 8, 10, 27, 28,
32, 33, 40, 52, 53, 59–61, 66, 78, 80–105, 113, 141, 144, 165
defi ciency 1, 4, 9, 12, 15, 24–33, 35, 39, 45, 50, 53–61,
63, 64, 68–80, 91, 92, 97–99, 108, 109, 113, 117, 126, 134, 141, 142, 163–165, 170
determination 8, 133 functional 26, 31–34, 57–61,
63, 64, 78, 97–100, 104, 108, 109
Subject Index194
loss 12, 39, 48, 50, 75, 110, 143
metabolism 1, 3–16, 24–67, 84, 85, 99, 104, 110, 117,
132, 140 overload 5, 7, 9, 14, 24, 25,
27, 29, 30, 31, 33, 36–40, 44, 45, 48, 53–57, 59, 61, 70, 85, 108–111, 113–116, 141, 144
oxidation 39, 144 redistribution 1, 24, 25,
28–31, 35, 53 requirement 4, 6–8, 12, 14,
15, 22, 25, 27, 28, 33, 34, 50, 51, 61, 71, 73, 76, 109,
saturation 7, 135 storage iron 1, 8, 9, 12, 25,
50, 55, 56, 59, 60, 62, 63, 68, 69, 85, 91, 137
storage tissues 137 therapy 27, 35, 36, 55–57, 75,
76, 78, 79, 81, 86, 104, 105, 108, 111
transport 4–6, 16, 28, 37, 69 transport iron 1, 12, 25, 26,
28, 32–34, 51, 61, 109 uptake 4, 5, 13, 14, 29, 60,
84, 86, 116 utilization 24, 26, 32, 33, 46,
60, 82, 97, 105–112, 130Iron absorption test 50Iron-binding capacity 5–7, 132,
135, 140, 141 latent (LIBC) 7, 132, 135,
140 total (TIBC) 7, 132, 135, 140,
141Iron gluconate 75, 76
Iron saccharate 75–77, 110Iron sulfate 75
Kidney 4, 21, 35, 52, 89, 90, 93, 102, 106, 108, 150, 151, 165, 171, 173
Lactic acid dehydrogenase (LDH) 47, 117, 128, 129
Low densitity lipoprotein (LDL) 36, 37
Lesch-Nyhan syndrome 126Leukocyte dilution 158Liver 4–12, 16, 17, 19, 22, 23,
28, 35, 36, 38, 41, 46, 47, 53, 54, 56, 57, 59, 69, 77, 80, 90, 114–116, 124, 129, 137, 138, 142, 143, 144, 145, 147, 151, 165, 171, 172, 173
Lipopolysaccharide (LPS) 29, 82, 86
Macrocytes 42Macrophages 4, 16, 22, 29, 30,
38, 46, 60, 82–84, 86–88, 91, 92, 101–104, 174
Magnesium carbonate 135Malaria 49, 129Malignancy 28, 91, 92, 96, 121Mean cellular hemoglobin
content of erythrocytes (MCH)66, 69, 91, 106, 118, 126, 152, 153, 157, 162–164, 165
Mean cellular hemoglobin concentration of erythrocytes (MCHC) 69, 152, 153, 157, 162, 164, 165
Subject Index 195
Mean cell volume of erythrocytes (MCV) 24, 66, 69, 91, 106, 118, 152, 153, 157, 162–165
Mean platelet volume 153, 157Megaloblastic anemias 57Met-hemoglobin (Met Hb) 130Methylmalonic acid 43, 132, 147Microhematocrit method 160Monocytes 36, 82, 85, 92, 101,
103, 104, 152, 153, 174Mucosa cell 36Myelodysplastic syndrome
(MDS) 24, 31, 40, 57, 58, 64, 96, 97, 117
Myoglobin 12, 50–52
N-5-methyltetrahydrofolic acid (MTHFA) 147, 148
Neoplasias 27, 60, 93NO (nitrogen oxide) 84, 86Normoblasts 17 basophilic 17 oxyphilic 17Novel erythropoiesis stimulating
protein (NESP) 88
Orotic acid 119, 126Oxygen radicals 36Oxyhemoglobin 158
Pannus 102Parietal cells 17, 125Particle count 157, 158Pentraxin 172Phagocytosis 22, 36, 162Phlebotomy 55, 115Porphyrin 23, 32, 34, 45, 46,
145, 171
Placenta 10, 11, 16Polycythemia 21, 35, 90, 130Proerythroblasts 17, 20Pteromylonoglutaminic acid
(PGA) 147
Red blood cell count (RBC) 75, 148, 152, 153, 156, 157, 161, 162, 166, 168
Red blood cell indices 162–165Reticulocyte 14, 17, 18, 24, 30,
31, 33, 48, 53, 63, 65, 66, 91, 97, 99, 105–107, 109, 118, 122, 126, 127, 142, 152, 155, 156, 165–170
Hb content 170 production index (RPI) 53,
105, 168, 169Reticulocyte count 14, 18, 30,
33, 53, 65, 66, 106, 107, 126, 127, 142, 152, 165–170
Reticuloendothelial system (RES) 21, 22, 54, 56, 85, 87, 90, 91, 104, 110, 115, 116, 129, 162
Rheumatoid arthritis (RA) 78, 80, 88, 91, 101–104
Serum amyloid A (SAA) 110, 171
Sickle cell anemia 43, 48, 49, 130
Soluble transferrin receptor (sTfR) 3, 7, 14, 15, 25, 26, 30, 34, 35, 52–54, 59, 68, 69, 91, 92, 98, 99, 107, 109, 132, 138, 142
Stem cells 17, 109, 161
Subject Index196
Target cells 44, 49, 130, 150Tetrahydrofolic acid (THFA)
41, 120, 123, 147, 148Th alassemia 36, 43, 44, 45, 48,
58, 64, 114, 116, 117, 130, 164, 165
Th rombosis 173Th rombocyte count 97Tissue hypoxia 20, 30Transcobalamin 123, 132, 145,
146, 147Transferrin 3–7, 12–15, 17, 22,
24–31, 33–40, 51–54, 56–61, 68, 69, 79, 81, 84–88, 91, 92, 97–99, 104, 107, 109, 111, 114, 115, 132, 133, 135, 136, 138–144, 170
Transferrin receptor 3, 5, 7, 12–15, 17, 24–26, 28–30, 33–38, 52–54, 59–61, 68, 69, 84, 86–88, 91, 92, 97–99, 104, 107, 109, 114, 132, 138, 142
Transferrin saturation 5, 7, 13, 24–29, 31, 33, 34, 37–40, 52, 53, 56–59, 61, 68, 69, 79, 81, 91, 92, 98, 99, 109, 111, 115, 132, 135, 141, 144, 170
Tumor anemias 28, 30, 52, 59, 80, 82, 90, 95, 98, 165
Tumor necrosis factor-α (TNF-α) 29, 83, 84, 86, 87, 92, 94, 101, 103, 171, 175
Tumor Necrosis factor receptor Fc fusion proteins 92
Uroporphyria 46
Vitamin B12 17, 32, 40–43, 46, 52, 53, 72, 99, 105, 109, 117, 119–126, 132, 145–149, 165, 166, 170
Warm antibodies 128
Zinc protoporphyrin 34, 171Zollinger-Ellison syndrome 126