Embed Size (px)
Citation preview

CLINICAL APPLICATION OF CAPNOGRAPHY
IN CHRONIC OBSTRUCTIVE PULMONARY DISEASE
Klinische toepassing van capnografie
bij chronisch obstructieve longziekten
PROEFSCHRIFT
tef verkrijging van de graad van Doctor
aan de Erasmus Universtiteit Rotterdam
op gezag van de Rector Magniflcus
Prof Dr. P.wc. Ald(ermans M.A.
en volgcns het besluit van het College voar Promoties.
De openbare verdediging zal plaatsvinden op
woensdag 26 april 1995 om 13.45 UUf.
door
Alice Hilda Kars
geboren te Breda
Rotterdam - 1995

PROMOTIECOMMISSIE:
PROMOTORES:
LEDEN:
Prof. dr. J .M. Bogaard Prof. dr. C. Hilvering
Prof. dr. ].H. Dijkman Prof. dr. S.C.M. Luijendijk Prof. dr. A. Versprille
This study was supported by a grant from the Medical Board of the University Hospital Dijkzigt, Rorrerdam, The Netherlands

aan allen die dit onderzoek mogelijk hebben gemaakt


CONTENTS
Chaptet 1 Introduction
1.1. 1.2. 1.3. 1.4.
1.5. 1.6.
Histotical development of capnography Models used to explain the shape of the single breath test Definitions of emphysema and asthma Correlation between morphologic findings of emphysema and pulmonary function tests Aim of the study References
Chapter 2 Study population and methods
2.1. 2.2. 2.3. 2.4. 2.5. 2.6.
2.7.
Study population Clinical diagnosis Pulmonary function tests Measuring equipment Experimental protocol Analysis of the causes of volume drift during continuous recording of flow by a pneumotachograph References
Chapter 3 Does phase 2 of the expiratory PC02 versus volume curve have diagnostic value in emphysema patients compared to astma patients and healthy controls?
3.1. Abstract 3.2. Introduction 3.3. Methods 3.3.1. Data analysis 3.3.2. Statistical methods 3.4. Results 3.5. Discussion 3.6. Conclusion 3.7- References
3 6 8
10 14 14
20 22 23 23 24
24 25
29 29 30 30 31 31 36 38 38

Chapter 4 Slopes of the alveolar plateau of the volume and time based capnogram. Discriminatory power and tidal volume dependency in healthy controls, asthma and emphysema patients
4.1. Abstract 4.2. Introduction 4.3. Methods 4.3.1. Data analysis 4.3.2. Statistical method 4.4. Results 4.5. Discussion 4.6. Conclusion 4.7. References 4.8. Appendix
Chapter 5
41 41 42 42 45 46 50 53 53 54
Discriminatory power of dead space estimates from the expiratory pe02 versus volume curve during spontaneous breathing in healthy controls, asthma and emphysema patients
5.1. 5.2. 5.3. 5.3.1. 5.3.2. 5.3.4. 5.4. 5.5. 5.6. 5.7. 5.8.
Abstract Introduction Methods Dead space estimates Data analysis Statistical methods Results Discussion Conclusion References Appendix
Chapter 6 General discussion
6.1 References
Chaptet 7 Summary Samenvatting en conclusies
Dankwoord
Curriculum Vitae
61 61 62 62 64 64 65 70 72 72 74
79
83


Chapter 1
Introduction


Introduction
1.1. Historical development of capnography [IJ
Jean Baptiste van Helmont (1577-1644) of Brussels discovered carbonic acid gas. Adding acids to limestone (CaC03) or potash (K2CO,) resulted in the production of "air", which he collected. He found that this "air" extinguished flame and that it was the same as the "air" produced by fermentation, and as that present in the Grotto del Cane in Italy, a cave where dogs perished although their taller masters survived. He named this "gas sylvestre", gas deriving from the word "chaos" which was used to describe the air generated by adding acid to limestone. Joseph Black (1728-1799) of Glasgow described "fixed air", which was produced by burning of charcoal, fermentation of beer and respiration. He confirmed the last point in an experiment carried out in 1764 on a grand scale in Glasgow, where he had gone as professor of chemistry in 1757. In a spiracle (air duct) in the ceiling of a church where 1500 persons remained congegrated for religious devotions for the extraordinary period of ten hours, he caused a solution oflimewater (Ca(OH)2) to drip over rags, which ultimately produced a considerable quantity of crystalline lime: Ca(OH), + CO, 0 CaCO, + H 20. He realized that it was the "gas sylvestre", described by Van Helmont. Lavoisier (1743-1794), a scientist in Paris, and Laplace (1749-1827), a mathematician, used an ice calorimeter - the idea for which was proposed in 1761 by Black - to measure at first the heat produced by chemical reactions, and then the heat produced by a living animal in an ice container. They collected the melted ice and the "fixed air" during a 10 hour period, The animal melted 13 ounces of ice and produced an amount of "fixed air" which, if provided by the burning of carbon, would have accounted for the melting of 10 ounces of ice. They concluded that "respiration is therefore a combustion, admittedly very slow, but otherwise very similar to that of charcoa1." Gustav Magnus (1802-1870) derermined CO, and 02 in blood and found that arterial blood contained more O 2 and less CO2 than venous blood, thus providing evidence that oxidations occur peripherally and not in the lungs. CO2 was calculated by the increase of weight of caustic potash. John Dalton (1766-1844), a chemist, developed the concept of partial pressures of gases in the atmosphere, In 1802 he stated: "The atmosphere, or to speak more properly the compound of atmospheres, may exist together in the most intimate mixture, without any regard to their specific gravities, and without any pressure upon one another. Oxygenous gas, azotic gas (nitrogen), hydrogenous gas, carbonic gas, aquaeous vapors, and probably several other elastic fluids may exist in company under any pressure and in any temperature, whilst each of them, however paradoxical it may appear, occupies the whole space allotted for them al1." He also carried out respiratory experiments in man, including a study entitled "Respiration and animal heat," in which he stated: "The carbonic acid generated by respiration is 82 for 100 oxygen in volume." In an article entitled "On the gradual deterioration of the atmosphere by respiration and combustion," he demonstrated the similarity of the two processes. Christian Bohr (1855-1911) in Copenhagen, was interested in absorption of gases by rhe blood and transport of oxygen and carbon dioxide across the lung. He published the first oxygen dissociation curve in 1886 and demonstrated in 1904 that adding carbon dioxide to blood drives oxygen out, a phenomenon since referred to as the "Bohr effect". In 1891
.3

Chapter 1
he published a study in dogs in which he measured the peo l in alveolar expiratory air and mixed expiratory air and calculated the volume without CO2, the dead space, according to the "Bohr equation". He considered expiratory air derived at the trachea bifurcation as alveolar expiratory air. Later on the arterial peo2 was considered as the representative of the alveolar Peoz [2]. In 1928 [3] Aitken and Clark-Kennedy used six successive samples of expiratory air collected at the mouth in man and determined the POz and peol values. From these samples they calculated the Respiratory Quotient (RQ), which decreased gradually during the expiration. They plotted the CO2 values versus expiratory volume and from this plot the dead space wa-', calculated in the way Fowler did in 1949 with Nz. During exercise they found values related to breath size, breath size being between 1890 and 3525 ml and dead space values varying from 283 to 392 m!. In 1939 [4] RoeIsen, in Copenhagen, published his results on "The composition of alveolar air investigated by fractional sampling" in normal persons, patients with asthma bronchiale and pulmonary emphysema. He found a considerable decrease in RQ during expiration in emphysema patients compared to normals, which he explained by unequal lung velltilation in these patients.
In 1952 [5] Dubois, Fowler, Sofler and Fenn, in New York, described the results obtained by the use of a rapid infrared CO2 analyzer, developed by RC Fowler, and found a gently sloping alveolar plateau in healthy people and a curved shape in patients with emphysema. Further developments in capnography both stressed and were aimed at quantifying the striking difference in pattern between healthy controls, asthma and emphysema patients. For the PE,C02 versus time curve these developments were:
1953 - Dornhorst, Semple and Young, in London [6]. Using a commercially available rapid infrared CO2 analyzer, they described the curved shape of the expiratory CO2 in patients with emphysema and showed that the curvature parallels the curvature of the volume recording plotted versus time.
1957 - Visser (thesis) [7] Clinical gas analysis, based on heat conduction, by newly developed measuring equipment is described (katapherometer). In this way 02' CO2, He and Ar can be mea.sured and used for calculation ofFRC. Comparison of He and CO2 curves gives information about unequality of perfusion, because the intrapulmonary distribution of He is practically independent of the perfusion. The distribution of CO2 depends on the ventilation/perfusion ratio.
1960 - Greve (rhesis) [8] Inhomogeneous ventilation increases the slope of the alveolar plateau, measured in rhe last second, and expressed as percentage of the end-tidal value, Comparison between inert ga.ses and CO2 is important to exclude the influence of perfusion,
1966 - van Meerten [9] The minimum radius of curvature of expiratory curves for He and CO2 versus time is larger in emphysema patients than in healthy controls and a.sthma patients,
1969 - Poppius [10]
4

Introduction
The minimum radius of curvature, as developed in 1966 by van Meerten, and the difference between end-tidal peo2 and peo2 of a deep expiration to residual volume level, can discriminate between moderate and severe airways obstruction.
1976 - Smidt [II] The time interval between 25 and 75% of PET,eo2 , expressed as percentage of time of the whole curve (minus dead space time) is larger in emphysema patients than in controls. Stratification and series inhomogeneity are a better explanation than ventilation perfusion inequality with sequential emptying of parallel units, as suggested by Fowler and Otis, because the same deformations can be found in controls, breathing He and SF 6' A problem is the increase of the index by increase of expiratory flow or breathing frequency. This can be prevented by plotting the curve versus volume.
1994 - You, Peslin, Ouvivier, Dang Vu and Grillat [12] A quantitative relationship of various indices from phase 2 and phase 3, and the angle between them, with the degree of airways obstruction exists in asthma patients.
Research was also done on the PE,e02 versus volume curve, especially concerning its diagnostic value for the diagnosis emphysema:
1978 - Smidt and Worth [13] The expiratory volume between 25 and 50% of the PET,e02 is correlated in a linear way to breath size in 6 healthy controls and 6 emphysema patients. The increase per I tidal volume (VT), however, in emphysema patients is larger (105 mIl I VT, SO: 25) than in healthy controls (43 mil I VT, SO: 10). An explanation for the difference is the trumpet model for the lung: V 25-50 is located near the terminal bronchiole, the area which is enlarged by destruction of alveolar walls in centrilobular emphysema.
1980 - Fletcher (thesis) [14] Use of the capnogram during anaesthesia and artificial ventilation. He developed the concept of efficiency: the part of the the expiratory volume, from the start of phase 2, which contains alveolar air. PET,e02 is considered to be representative for the alveolar value. In 5 emphysema patients efficiency was lower than in healthy controls: 0.75, SO: 0.03 versus 0.81, SO: 0.02.
1984 - Wolff and Brunner [15] Differentiation of phase 2 of the PE,co2-voiume curve, followed by calculation of the mean of the distribution function, was regarded as a measure of the airways dead space (Pre Intetface Expitate: PIE). PIE was usefull during anaesthesia.
1985 - Worth (thesis) [16] The volume V2S_SO ' as developed in 1978, and the volume between 25 and 750/0 of PET,C02, V25-75 and their increase with VT are able to discriminate between emphysema patients on the one hand and healthy controls and asthma patients on the other hand. There is, however, overlap.
5

Chapter 1
1.2. Models and mechanisms used to explain the shape of the single breath test [17-38].
Inhalation of air results in convection through the airways where no gas exchange occurs - the airways dead space - and diffusion with mixing of gas in the alveoli. During expiration first the gas from the airways results in a flat phase 1 of the expirogram and then the alveolar air appears, giving a steep phase 2 and a slightly sloping alveolar plateau. If in a monoalveolar compartment gas mixing is complete and there is a sharp boundary with the airways dead space, the result is a 90 degrees steep phase 2 and a completely flat phase 3 [17]. In reality phase 2 is less steep and phase 3 shows a slightly upward slope, which is different for test gases with varying diffusion properties. The transition between gas in the airways and alveoli, where convection and diffusion meet, has been called "static front" by Cumming [1B] and depends on diffusion properties of the test gas used. This front moves inward by inspiratory flow and outward during breathholding at the end of inspiration by diffusion, causing increase and decrease of airways dead space, respectively. Models developed to explain the behaviour of the airways dead space and the slope of the alveolar plateau (the dependence on diffusion properties ofa test gas, on inspiratory volume and post-inspiratory breath holding) as caused by ventilatory mechanisms, are summarized by, among others, Visser and Luijendijk [17]:
1. Two compartment model with different mechanical properties for the compartments [19], in which the best ventilated one empties first, which has been assumed from the very beginning of single breath analysis [5,20]' Each compartment has its own time constant in seconds (compliance x resistance = lIkPa x kPa/l.sec l ), the one with the smaller time constant emptying first. In case of equal compliances and different resistances, the compartment with a high resistance empties last. Due to obstructed flow during inspiration into this compartment, there is less dilution with a test gas free inspiratory mixture and the CO2 or test gas content will be higher than in the nonobstructed compartment. In case of equal resistances, but different compliances, the compartment with the larger compliance empties last. A larger compliance means more dilution, which entails that now the compartment with the lower test gas concentration empties last. A negative slope of the alveolar plateau may develop. Although this model is able to show increase of dead space with increase of volume, it is not able to show the differences between different test gases and the effect of post inspiratory breath holding [17].
2. Asymmetric branching of small airways [21] with the same mechanical properties, but different length, represented by a two-trumpet model. Due to the length, and branching difference, there are different flows and positions of diffusion fronts. At the branching point there is, after wash-in of a test gas during an inspiration of a wash-out procedure, due to concentration differences, diffusion from the smaller into the larger unit resulting in a decrease of concentration in the smaller unit. During the expiratory phase the test gas diffuses back from the larger into the smaller unit also by concentration difference, resulting in a gradual increase of concentration in the smaller unit which gives a sloping alveolar plateau [21J.
6

Introduction
This model is able to show the sloping alveolar plateau and dead space, and the effects of different test gases, inspiratory volume and post-inspiratory breathholding [17].
3. Symmetric branching of small airways or trumpet model [16,18,22,23,]' This model is only able to show dead space and the effects upon it by volume, different test gases and post inspiratory breath holding. It does not show an alveolar plateau [17J.
Another way to look at the expirogram is from the view point of the ventilation perfusion relationships, which have been investigated since 1949, when Riley and Cournand [24,25] published their study on 'ideal' alveolar air and the analysis of ventilation-perfusion relationships in the lungs. The model they supposed consisted of three compartments: ideal alveolar, dead space and shunting. Although the composition of inspired air and mixed venous blood is the same at entry in each alveolus, the composition of gas and blood leaving them is variable, depending on the ventilation perfusion relationships. In case of ventilation with no perfusion (ventilation/perfusion ratio infinite) or bad perfusion (ventilation/perfusion ratio high), dead space ventilation occurs, which coincides with a high RQ. In case of no ventilation and ongoing perfusion shunting or venous admixture occurs, which is accompanied by a low RQ. Venous admixture also results in increase of dead space ventilation. West and colleagues [26] calculated RQ and ventilation-perfusion inequality from single expirates with a mass spectrometer, using COz' Ar and N z. They stated that "the peGz sampled at the lips, rises during expiration for two quite different reasons; first, because alveoli having a low ventilation-perfusion ratio and therefore a high Peoz empty last, and secondly because COz is continually excreted into the alveolar gas gas during expiration." In 1962 a study was published by West [27J on the regional differences in gas exchange in the erect man. Calculations of ventilation and perfusion were done using radioactive COz from top to base in sitting men. In nine slices ventilation and perfusion increased from top to bottom, but the perfusion increased more. At the top the ventilation was relatively better than the perfusion, resulting in more COz production than 0z resorption, which means a high RQ. At the base the perfusion was relatively better, resulting in less COz production than 0z resorption, which includes a low RQ. The calculations resulted in alveolar gas tensions at the top of 132 mm Hg and 28 mm Hg for 0z and COz, respectively. At the base the values were 89 and 42 mm Hg, respectively. According to the calculations and statements of West the basal compartments then empty last. Regional differences in distribution of ventilation and perfusion were also investigated with other radioactive test gases as Xe 133. These studies confirmed the top to base differences with relatively overventilation of the top and overperfusion of the base in the sitting position [28-32J. With increase ofinspiratOlyvolume increased contribution of ventilation of lower lung compartments was found, which appeared to be gravity dependent as the posture of the subject influenced both ventilation and perfusion in such a way that the depending lung parts behaved as the lung base in sitting position [31,32]. From RV to FRC level most inspiratory air went to the upper lung parts, whereas above FRC level volume changes were larger in the lower lung parts [30]. The consequences of the level of inhalation and the volume inhaled, in standing position, upon the slope of the alveolar plateau was investigated by Dollfuss et aL [33]: when a bolus of radioactive Xe was inhaled
7

Chapter 1
at RV level the highest concentration at TLC level was at the top, whereas inhalation of the bolus at 25% VC, which is about FRC level, or above resulted in the highest concentration at the base. The subsequent expiration until RV level showed a positive (inhalation at RV level) and negative slope (inhalation at FRC level or above) of the alveolar plateau and phase 4, proving that the basal lung parts empty first and that near RV level the basal lung parts close. Because they found the same top to base gradients for all levels of bolus inhalation above 25% of TLC they concluded that gravity had an important effect. Sequential filling was assumed to occur, when inhalation of the bolus took place between RV and FRe, because this resulted in a gradual reversal of concentration gradient at TLC leveL With the use of radioactive Xc, Anthonisen et al. [34] stressed the influence of gravity upon the sequential emptying oflung compartments in another way. After a deep expiration to RV level the inhalation of a bolus of radioactive Xe, and 100% Oz until TLC level (VC manoeuvre) resulted at expiration in a slightly positive alveolar plateau for Xe and Nz. Doing the same experiment, but turning the patient upside down between in- and expiration resulted in a negative slope of the alveolar plateau for Xe and N2 . They explained these findings by gravity-dependent sequential emptying of lung compartments, the upper compartments contributing more at the end of expiration. The influence of expiratory flow has been studied with inert gases, inhaled at RV level. At slow expiratory flows from TLC level there was a marked terminal rise in tracer gas concentration near residual volume due to preferential emptying of the upper zones. With higher flow rates the relative contribution of the upper zone increased in the early and middle phase of the vital capacity, leading to a progressive diminution of terminal rise and slope of the alveolar plateau [35,36].
Apart from the regional ventilation perfusion differences in the lung the ongoing CO2 production, or the ongoing metabolism plays a role. This has been studied by Cormier for the slope of the single breath N2 tests by comparing the slope of phase 3 of the SB-N2 test befor and after exercise [37], and Cochrane et a1. [38] for the slope of phase 3 of the PE,COz time curve. The latter found that in the steady state, expiratory alveolar PC02 rises at a rate which is directly proportional to the rate of CO2 production.
1.3. Definitions of emphysema and asthma
For the diagnosis emphysema we used the ATS criteria from the "Standards for the diagnosis and care of patients with chronic obstructive pulmonary disease (CaPO) and asthma" [39] and the X-ray criteria for emphysema described by Pratt [40].
Emphysema is defined as "a condition of the lung characterized by abnormal permanent enlargement of the airspaces distal to the terminal non-respiratory bronchiole, accompanied by destruction of their walls, and without obvious fibrosis". The enlargement of respiratory airspaces in human lungs was first illustrated by the Dutch physician Ruysch [41] in 1691.
Three subtypes of emphysema are recognized:
8

Introduction
a) centriacinar b) panacinar c) distal acinar or paraseptal
a) centriacinar emphysema or proximal acinar emphysema because the proximal part of the acinus (respiratory bronchiole) is dominantly involved. There are two subdivisions of this form of emphysema according to their pathogenesis. The first is classically associated with cigarette smoking and airflow obstruction, and is also referred to as centrilobular emphysema. The second is related to inhalation of coal dust and other mineral dust, which also results in dilatation of respiratory bronchioles with accumulation of dust-laden macrophages in and around respiratory bronchioles, and has been referred to as focal emphysema. However, in those exposed to coal dust, the term coal pneumoconiosis is preferable.
b) panacinar emphysema. In this subtype, all components of the acinus tend to be involved equally. It is the form of emphysema commonly associated with alpha-1-antipfOtease deficiency [42]. It may also occur in the bases of the lung in patients with centrilobular emphysema, and as an incidental finding in older subjects.
c) distal acinar emphysema. In this subtype the distal part of the acinus, alveolar ducts and sacs, are predominantly involved. Because of the association of this form with the secondary interlobular septa, it is also known as paraseptal emphysema; the distal acinus also abuts on pleuras, vessels, and airways, and the emphysema may be worse in these regIOns.
Additional types of emphysema have been suggested, but considerable overlap exists even with the types already described, and there seems to be little reason for further subdivisions. When emphysema becomes severe, it is difficult to classify, and expert pathologists often disagree on the classification of such emphysematous lungs.
Emphysema, being a histologic diagnosis, can be detected best during life, without taking a biopsy, by computed tomography (CT scan), which provides coronal images that are able to resolve emphysematous foci in the lungs with much greater sensitivity and specificity than standatd radiograph [41J. High resolution computed tomography (HRCT) which uses 1 or 1.5 mm collimation, instead of 10 mm collimation of conventional CT, further enhances the resolving power of the image. The limit of detection of emphysematous microbullae by HRCT appears to be 5 mm [41], but the sensitivity ofHRCT appears to be approximately 900/0 and correlations with pathologic extent range from 0.6 to 0.8 [41]. Correlations between the histologic extent of emphysema and HRCT quantification are better in excised lungs than in vivo [41]. CT done in expiration may be more sensitive than CT performed during full inspiration [41]. The standard chest radiograph has low sensitivity [43]. However, if certain signs are present, there was always histologically proven emphysema [40], i.e. the positive predictive value is 100%.
9

Chapter 1
These signs are:
on the posteroanterior chest X-ray: - depression and flattening of the diaphragm with blunting of cosrophrenic angles - irregular radiolucency of lung fields
on the lateral chest X-ray: - abnormal retrosternal space - flattening or even concavity of the diaphragm
The diagnosis emphysema was made if two or more criteria were present.
Asthma is a clinical syndrome characterized by increased responsiveness of the tracheobronchial tfee to a variety of stimuli, with symptoms of paroxysmal dyspnea, wheezing and cough, and as a physiologic manifestation of this hyperresponsiveness variable airways obstruction [39].
1.4. Correlation between morphologic findings of emphysema and pulmonary function tests
Chronic obstructive pulmonary disease (COPD) comprises emphysema, peripheral airways disease, and chronic bronchitis, all having in common impairment or limitation of expiratory airflow [39]. Due to destruction of alveolar walls in emphysema and the occurrence of expanded bullae, which cannot discharge their air by compression of the ainvays during expiration, some characteristic adaptations take place: the chest is kept in inspiration position during expiration (known as hyperinflation) to prevent the ainvays collapsing and pursed lip breathing is used during expiration to generate less flow and therefore pressure gradient along the ainvays, aimed at prevention of peripheral airways collapse as well.
The typical findings in an advanced stage are [44]: in spirometry: increased TLC, PRe and RV as signs of hyperinflation, with reduced VC, FEV l and FEV/VC. The sudden decrease of expiratoty flow in the beginning of a forced expiration is known as a sign of ainvays collapse. increased compliance of the lung with reduced pleural pressure at TLC level. reduced diffusion capacity for carbon monoxide attributed to reduced alveolo-capillary surface area with ideal gas exchange.
None of these tests, however, is diagnostic on its own, but the combination of abnormal tests in combination with radiologic findings is the best approach to a clinical diagnosis [44,45].
Histologic-functional comparison studies, considering the extent of emphysema can be divided in [46]:
10

Introduction
1. studies with pulmonary function tests during life, performed before a lobectomy or pneumonectomy for a tumor, having the advantage of recent function tests and the disadvantage of histology of only a part of the lung.
2. studies with pulmonary function tests during life and whole lungs post mortem, having the advantage of histology of the whole lung, but the disadvantage of endstage disease or other disease involved, whereas function tests might be of earlier dates.
3. studies with both pulmonary function tests and whole lungs post mortem. In this case it should be noted that the values obtained may differ from those obtained in vivo, because it is difficult to simulate the manner in which the lung is suspended in the thorax.
4. studies in experimental animals, with the disadvantage that in many instances the histologic lesions produced are not identical to those of human disease.
QuantifYing the degree of emphysema can be done macroscopically in the way it was first described byThurlbeck et aI. [47J, and later slightly modified [48]. They used inflation ftxed paper mounted mid-sagittal lung slices of 1 cm thickness, a technique ftrst described in 1949 by Gough and Wentworth [49], and formed a panel of slices with degrees, 10 apart, between 0 and 100. Degree 0 was no emphysema, 20 mild, 50 moderate and 80 severe emphysema, whereas 100 was the score of the most emphysematous lung seen by Thurlbeck. The modification included a subdivision in degrees,S apart, below grade 50 [48]. This grading scale was composed by comparing the extent of emphysema in different slices and does not include the percentage of surface involved. Another macroscopic method is the Dunnill point counting [50,51]: sagittal slices of 1 cm thickness of inflation ftxed lungs are covered with a grid of equilateral triangles, all sides being 1 cm. At the corners the lung is evaluated and can consist of no-parenchyma, including bloodvessels and bronchi down to 2 mm diameter, normal parenchyma and abnormal airspaces. Counting results in a percentage of abnormally dilated airways. Microscopically the mean linear intercept (Lm), a measure of mean interalveolar wall distances [52], inrcrnalsurface area [53], and Destructive Index, representing the percentage disrupted or destroyed alveolar structures [54], in inflation ftxed lungs have been developed. Although no emphysematous lung is alike, the panel of standards ofThurlbeck proved to be simple, not requiring undue skill and experience of the observer and showing low inter- and intra-observer variation compared to other macroscopic and microscopic methods [47,48].
Emphysema severity, as assessed morphologically, has been accepted as the single best correlate with an index of airflow obstruction such as the forced expiratory volume in one second (FEY,) [39J. However, in 1970, Thurlbeck reviewed the literature on tests of pulmonary function and the amount of emphysema at necropsy: conflicting data about the relationship between the severity of emphysema and FEV\ reduction were reported, whereas a negative relationship with diffusing capacity was found in 3 studies, one of them showing no relationship with FEY, [44J.
11

Chaptet 1
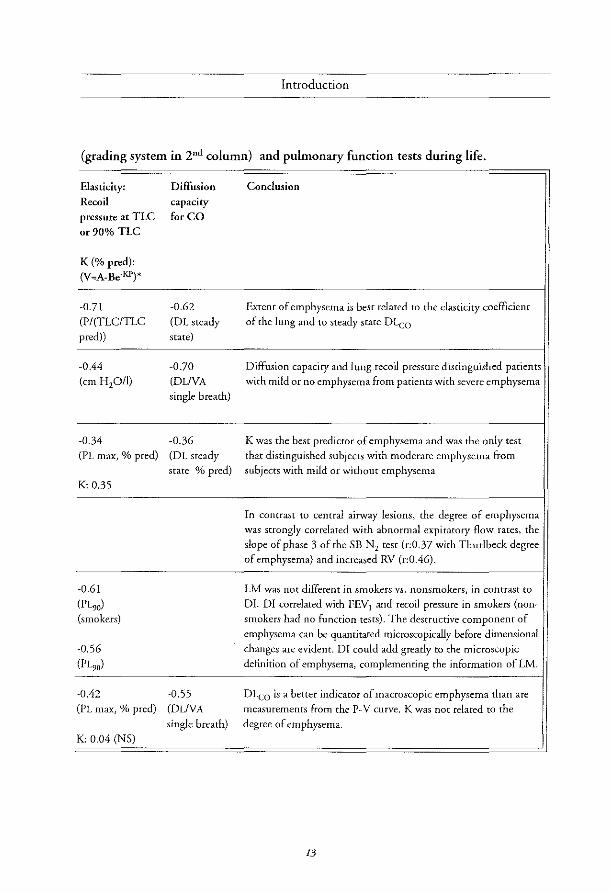
Table 1.1 Mean correlation coefficients between histologically quantitated emphysema
First author [ref] P.A. grading system
year of publication
number of subjects
Pack [55J own macroscopic system: 0-4, in 2x2 em square grid
1970 over coronal slices of both lungs. final index:
26; autopsies percent of max. number 4: 0-100%
Bomhy [56J Dunnill point counting
1972 [50,51J 73; autopsy, lobectomy mild: <20% / moderate: 20-49% I severe: ;:::':50%
Of pneumonectomy
Pm [57J Thudb"k [58J 1982 no emphysema: 0 55; lobectomy or mild: <20 I moderate: ~20
pneumonectomy
N'g,i [59J Thmlbeck [48J 1985 48; autopsies
LM [52J
Saetta [54] Destructive
1985 Index [54J
31; autopsy nonsmokers
(0:8), lobectomy or
pneumonectomy LM [52J smokers (n:23)
Morrison [60] Thudbeck [48J,
1989 no/minor emphysema: ,,5 (n,18)
37; lobectomy or emphysema: ~10 (n:19)
pneumonectomy
*: exponential analysis ofhmg P-V data, in which V = volume and P = pressure. A, Band K are COllSt,UitS,
K Geing the exponential constant describing the shape of the curve
12
FEY, (% pred)
-0.50
-0.53
-0.37 (FEF25_75%
% pred)
-0.46
-0.33
-0.43 (smokers)
-0.42 (smokers)
-0.54
Introduction
(grading system in 2nd column) and pulmonary function tests during life.
Elasticity: Diffusion Conclusion
Recoil capacity pressure at TLC for CO
or 90% TLC
K (% pred): (V=::A-Be-KP)*
-0.71 -0.62 Extent of emphysema is best related to the elasticity coefficient
(PI (TLCITLC (OL steady of the lung and to steady state DLeo
peed» state)
-0.44 -0]0 Diffusion capacity and lung recoil pressure distinguished patients (em H 2O/I) (DLiVA with mild or no emphysema from patients with severe emphysema
single breath)
-0.34 -0.36 K was the best predictor of emphysema and was the only test (PL max, % pred) (OL steady that distinguished subjects with moderate emphysema from
state % pred) subjects with mild or without emphysema K 0.35
In contrast to central airway lesions, the degree of emphysema was strongly correlated with abnormal expiratory flow rates, the
slope of phase 3 of the 5B N2 test (r:0.37 with Thurlbeck degree
of emphysema) and increased RV (r:0.46).
-0.61 LM was not different in smokers vs. nonsmokers, in contrast to
(PL,,) OJ. DI correlated with FEV j and recoil pressure in smokers (non-(smokers) smokers had no function tests). The destructive component of
emphysema can be quantitated microscopically before dimensional
-0.56 changes are evident. DI could add greatly to the microscopic
(PL,o) definition of emphysema, complementing the information of LM.
-0.42 -0.55 DLeo is a better indicator of macroscopic emphysema than are
(PL max, % pred) (DLiVA measurements from the P-V curve. K was not related to the
single breath) degree of emphysema. K 0.04 (NS)
13

Chaptet 1
Studies, published after Thurlbeck's comparison between clinical, roentgenological, functional and morphological criteria in chronic bronchitis, emphysema and bronchiectasis [44], correlating the degree of emphysema with pulmonary function tests during life are summarized in Table 1.1. They generally show a negarive relationship with FEVl (% pred) as well as with diffusing capacity and recoil pressure at (90%) TLC level. Compliance is positively related with the degree of emphysema [42,54-58,60].
1.5. Aim of the study
Because of the importance to diagnose emphysema with non-invasive pulmonary function methods, investigation was done on the discriminating value of indices derived from the peo2 versus volume curve during spontaneous breathing. The promising results reported by Worth [16] for selecting emphysema patients on basis of phase 2 variables, formed the basis for investigation of the same variables, V 25-50 and V25-75 in relation to VT (Chapter 3), in more patients with emphysema, and a second group of less severely affected patients. The results from the emphysema patients were compared with those of healthy controls and asthma patients during exacerbation. Because increases of the slopes of the alveolar plateaus of PE,C02 versus time and versus volume curves are involved in both asthma and emphysema their values and dependences on VT and FEV l (% predicted) and FEV/VC were compared to investigate which one discriminated best between healthy controls and patients (Chapter 4). Combination of phase 2 and phase 3 of the PE,C02 led to the calculation of three dead space estimates; these were compared and investigated for their discriminating value in the same patient groups and healthy controls as reported in Chapters 3 and 4. These estimates were VD,Bohr, VD,Fowler and Pre Interface Expirate (Chapter 5).
1.6. References
1 Perkins JF Historical development of respiratory physiology. Handbook of Physiology 1964; Section 3: Respiration - volume 1:1-62.
2 EnghoffH Volumen inefficax. Bemerkungen zur Frage des schadlichen Raumes. Upsala Lakaref Forh 1938; 44;191-218.
3 Aitken RS, Clark-Kennedy AE. On the fluctuation in the composition of the alveolar air during the respiratory cycle in muscular exercise. J Physiol1928; 64:389-411.
4 Roelsen E. The composition of the alveolar air investigated by fractional sampling. Acta Med Scand 1939; 98;143-171.
5 Dubois AB, Fowler RC, Soffir A, Fenn Wo. Alveolar CO2 measured by expiration into the rapid infrared gas analyzer. ] Appl Physiol1952; 4;526-534.
14

Introduction
6 Dornhorst AC, Semple SjG, Young 1M. Automatic fractional analysis of expired air as a clinical test. Lancet 1953; 1:370-372
7 Visser BE Clinical gas analysis based on thermal conductivity. Thesis. 1957; Kemink en Zoon, Utrecht, the Netherlands.
8 Greve LH. Unequal ventilation. Thesis. 1960; Kemink en Zoon, Utrecht, the Netherlands.
9 van Meerten RJ Concentratiecurven van expiratiegassen. Thesis. 1966; Thoben Offiet, Nijmegen, the Netherlands.
10 Poppius H Expiratory CO2 curve in pulmonary diseases. ScandI Resp Dis 1969; 50:135-146.
11 Smidt U. Emphysema as possible explanation for the alteration of expiratory P02 and PC02 curves. Bull Eur Physiopathol Respir 1976; 12:605-624.
12 You B, Peslin R, Duvivier C, Dang Vu V, Grillat IP. Expiratory capnography in asthma: evaluation of various shape indices. Eur Respir I 1994; 7:318-323.
13 Smidt U, Worth H. Diagnostik des Lungenemphysems aus exspiratorischen COr Partialdrttckkurven mit Hi/fe eines Mikroprozessors. Biomed Tech 1978; 22:357-358.
14 Fletcher R. The single breath test for carbon dioxide. Thesis. 1980; Berlings, Arlov, Sweden.
15 Wo!ff G, Brunner IX Series dead space volume assessed as the mean value of a distribution fonction. Int] Clin Mon Comp 1984; 1:177-181.
16 Worth H Zur Diagnostik des Lungenemphysema. Analyse des Mischluftanteils exspiratorischer Partialdruckkurven von He, Ar, SF6 und CO2 , Thesis. Copythek, Thieme, 1985, StuttgartNew York.
17 Visser BE Luijendijk SCM Gas mixing in the small airways, described by old and new models. Eur] Respir Dis 1982; 63. 5uppI121:26-35.
18 Cumming G, Crank j, Horsfield K Parker I Gaseous diffusion in the airways of the human lung. Respir Physiol1966; 1:58-74.
19 Otis AB, McKerrow CB, Bartlett RA. Mechanicalfactors in distribution of pulmonary ventilation. ] Appl Physio11956; 8:427-443.
20 Fowler WS. Lung/unction studies. III Uneven pulmonary ventilation in normal subjects and in patients with pulmonary disease. ] Appl Physiol1949; 2:283-299.
21 Luijendijk SCM, Zwart A, de Y,'ies WR, Salet WM. The sloping alveolar plateau at synchronous ventilativn. Pflugers Arch 1980; 384:267-277.
15

Chapter 1
22 Paiva M. Cas transport in the human lung. J Appl Physiol1973; 35:401-410.
23 Hansen jE, Ampaya EP. Lung morphometry: a follacy in the use afthe countingprinciple.} Appl Physiol1974; 37:951-954.
24 Riley RL, CournandA. Ideal' alveolar air and the analysis a/ventilation-perfosion relationships in the lungs. J Appl Phpio11949; 1:825-847.
25 Riley RL, Cow'nand A, Donald KW Analysis of factors afficting partial pressures of oxygen and carbon dioxide in gas and blood o[lungs: methods. J Appl Physiol1951; 4:102-120.
26 West jB, Fowler KT, Hugh-Jones R O'Donnell Tv. The measurement ofthe inequality o/ventilation and ofperfosion in the lung by the analysis a/single ex pirates. Clin Sci 1957; 16:549-565.
27 West JB. Regional diffirences in gas exchange in the lung of the erect man. J Appl Physiol1962; 17:893-898.
28 Ball we, Stewart PE, Newsham LGS, Bates DV Regional pulmonary jitnction studied with Xenon133. J Clin Invest 1962; 41:519-531.
29 Anthonisen NR, Milic-Emili J Distribution of pulmonary perfusion in erect man. j Appl Physiol 1966; 21:760-766.
30 Milic-Emili j, Henderson JAM, Dolovich ME, Kaneko K Regional distribution of inspired gas in the lung. J Appl PhysioI1966.· 21:749-759.
31 Kaneko K, Milic-Emili j, Dolovich ME, Dawson A, Bates DV, Regional distribution of ventilation and perfosion as a fUnction o[body position. J App! Physiol1966; 21:767-777.
32 BryanAC, Bentvoglio LG, Beerel E MacLeish H, ZidulkaA, Bates DV. Factors afficting regional distribution of ventilation and perfusion in the lung. j Appl Physio11964; 19:395-402.
33 DollfilSS RE, Milic-Emili j, Bates DV, Regional ventilation in the lung, studied with boluses of Xenon I33 Resp Physiol 1967.' 2:234-246.
34 Anthonisen NR, Robertson pc, Ross WRD. Gravity-dependent sequential emptyingoflung regions. J Appl Physiol1970; 28:589-595.
35 Milette B, Robertson pc, Ross WRD, Anthonisen NR. Effict of expiratory flow rate on emptying o[lung "gions. J App! Physiol1969; 5:587-591.
36 jones jG~ Clarke SW The effect of expiratory flow rate on regional lung emptying. Clin Sci 1969; 37:343-356.
16

Introduction
37 Cormier YE Belanger}. The influence of active gas exchange on the slope of phase III at rest and during exercise. Am Rev Respir Dis 1981; 123:213-216.
38 Cochrane GM, Newstead CG, Nowell RV, Openshaw E Wolff CB. The rate of rise of carbon dioxide pressure during expiration in man.} Physiol1982; 333:17-27.
39 American Thoracic Society. Standards for the diagnosis and care of patients with chronic obstructive pulmonary disease (COPD) a"d asthma. Am Rev Respir Dis 1987; 136· 225-243.
40 Pratt PC Role of conventional chest radiography in diagnosis and exclusion of emphysema. Am} Med 1987; 82: 998-1006
41 Snider GL. State of the art. Emphysema: the first two centuries-and beyond. A historical overview, with suggestions for foture research: part 1. Am Rev Respir Dis 1992; 146.'1334-1344.
42 Laurell CB, Eriksson E. The electrophoretic _rglobulin pattern of serum in _rantitrypsin deficie"cy. Scand j Cli" Lab Invest 1963; 15:355-363.
43 Thurlbeck WM, Simon G. Radiographic appearance of the chest in emphysema. Am} Roentgenol 1978; 130:429-440.
44 Thurlbeck WM, Henderson }A, Fraser RG, Bates DV. Chronic obstructive lung disease. Medicine 1970; 49:81-145.
45 Yernault}C, Paiva M The in vivo diagnosis of emphysema: an uncompletely resolved issue. Bull Eur Physiopathol Respir 1986; 22:95-97.
46 Berend N The correlation of lung structure with fimction. Review. Lung 1982; 160:115-130.
47 Thurlbeck WM, Anderson AE, Janis M, lvlitchell RS, Pratt P, Restrepo G, Ryan SE Vincent T. A cooperative study of certain measurements o/emphysema. Am Rev Respir Dis 1968; 98:217-228.
48 Thurlbeck WM, Dunnill MS, Hartung W, Heard BE, Hepplestone AG, Ryder RC. A comparison of three methods of measuring emphysema. Human Pathology 1970; 1:215-226.
49 Gough}, Wentworth jW The tise of thin sections of entire organs in morbid anatomical studies. j Micros Soc 1949; 69:231-235.
50 Dunnill M5. Quantitative methods o/the study o/pulmonary pathology. Thorax 1962; 17:320-328.
51 Dunnill MS. Evaluations of a simple method o/sampling the lungfor quantitative histological a"alysis. Thorax 1964; 19:443-448.
17

Chapter 1
52 Thurlbeck WM The internal surface area of nonemphysematous lungs. Am Rev Respir Dis 1967; 95:765-773.
53 Campbell H, TomkeiejJSI. Calculation o/the internalsurfoce o/the lung. Naturel952; 170:117
54 Saetta M, Shiner Rj, Angus £. Kim WD, Ulttng N-S, King M, Ghezzo H, Cosio MG. Destructive Index: a measurement of lung parenchymal destruction in smokers. Am Rev Respir Dis 1985; 131:764-769.
55 Park 55, janis M, Shim CS, Williams MH Relationship o/bronchitis and emphysema to altered pulmonary fUnction. Am Rev Respir Dis 1970; 102:927-936.
56 Boushy SE Aboumrad MH, North LB, Helgason AH Lung recoil pressure, airway resistance, and forced flows related to morphologic emphysema. Am Rev Respir Dis 1971; 104:551-561.
57 Pare PD, Brooks LA, Bates j, Lawson LM, Nelcms JMB, Wright JL. Hogg JC Exponential analysis of the lung pressure-volume curve as a predictor of pulmonary emphysema. Am Rev Respir Dis 1982; 126:54-61.
58 Thurlbeck WM Measurement of pulmonary emphysema. Am Rev Respir Dis 1967; 95:752-764.
59 Nagai A, West"W'w, Thurlbeck WM. The National Institutes of Health Intermittent Positive Pressure Breathing Trial: Pathology studies. II Correlation between morphologic findings, clinical findings, and evidence of expiratory air-flow obstruction. Am Rev Respir Dis 1985; 132:946-953.
60 Morrison Nj, Abboud RT, Ramadan E Miller RR, Gibson NN, Evans KG, Nelems B, Muller NL. Comparison of single breath carbon monoxide diffusing capacity and pressure-volume curves in detecting emphysema. Am Rev Respir Dis 1989: 139:1179-1187.
18

Chapter 2
Study population and methods

Chapter 2
Table 2.1 Data on the study population
healthy controls asthma patients eml2h~ema l2atients
during moderately severely
exacerbation obstructed obstructed
17<3-11~ 4 <3 - 8 ~ 7 is - 2 ~ 18 <3 - 2 9
mean SD Inean SD mean SD mean SD
age (years) 51 17 36' 14 54 10 60 12
height (m) 1.72 0.10 1.72 0.13 1.78 0.08 1.73 0.08
B.M.1. (kg/m') 24.8 2.7 23.7 2.9 21.7* 2.9 21.1 * 3.5
TLC (%p"d) 102 8 103 11 132* 15 123* 11
TLC (I) 6.4 1.4 6.3 2.0 9.2* 1.7 8.2* 1.1
FRC/TLC (%pced) 88 12 101* 15 118* 9 126* 14
FRC/TLC (%) 47 6 51 10 65' 5 70' 8
RV/TLC (%pced) 87 12 101* 22 138* 22 150* 34
RV/TLC (%) 30 7 30 12 48 7 54' 10
VC (%pred) 114 13 89* 18 106 13 87' 16
VC (I) 4.6 1.2 3.7* 1.4 4.8 1.0 3.6* 0.8
FEVl (%pred) 106 11 57' 17 61' 12 29* 11
FEV, (I) 3.3 1.0 2.0* 0.9 2.1 * 0.5 0.9* 0.3
FEV,IVC (%) 74 7 53' 9 44' 6 25' 7
Pa02 (kPa) 8.8 0.9
Poe02 (kP,) 5.6 0.7
*: significant difference (p<O.05) compared to controls

Study population and methods
2.1. Study population
The healthy controls were 28 persons with no history of disease from cardiopulmonary origin. When they were older than 50 years, they had a chest X-ray to exclude pulmonary pathology. The patient group consisted of 12 asthma patients during exacerbation and 29 emphysema patients, 20 of them being severely obstructed (FEV! values below 1.41) and 9 moderately obstructed. Mean values for anthropometric data, including age, sex, length and bodymass index (B.M.I.: weight in kg/(heighr in m)2) are reported in Table 2.1. Significant differences compared to the healthy controls (p<O.05) are indicated with an asterix. The controls had a relatively high weight and normal spirometric values, although RV and FRe values were relatively low. The asthma patients during exacerbation were significantly younger and mostly female. They had an obvious airways obstruction during exacerbation and normal FEV 1 (difference from the mean reference [1] value wirhin 1.5 SO) and FEV/VC after recovery. The majority of the moderately obstructed emphysema patients and the severely obstructed emphysema patients were men. They were comparable in age with the healthy controls. Both emphysema groups, however, had a relatively low body weight, a significantly increased TLC (% predicted), FRCITLC (% predicted) and RV/TLC (% predicted). They only differed by the degree of airways obstruction, which was less severe in the moderately obstructed emphysema patients, at the same time being in the same range as the airways obstruction of the asthma patients during exacerbation. Both emphysema patients groups showed only slight and comparable improvement after bronchodilator inhalation (0.75 mg terbutalin by MDI). Mean improvements in % of initial FEV1 were 6.1 % (SO: 5.5) and 5.9% (SO: 6.7) for the severely and moderarely obstrucred emphysema patients, respectively. Arterial blood gas analysis was done in all severely obstructed patients in a stable fase and indicated primarily hypoxemia without alveolar hypoventilation.
2.2. Clinical diagnosis
For rhe diagnosis of emphysema the ATS criteria for COPO [2] and the X-ray criteria described by Pratt [3J were used: the latter are based on signs of hyperinflation and tissue loss on the posteroanterior and lateral chest X-ray. On the posteroanterior X-ray two signs can be present: 1) depression and flattening of the diaphragm with blunting of costophrenic angles; and 2) irregular radiolucency of lung fields. On the lateral X-ray there are also 2 signs: 1) abnormal retrosternal space; and 2) flattening or even concavity of the diaphragm. The diagnosis emphysema was made if two or more of these criteria were present. Asthma was diagnosed according to theATS criteria: a clinical syndrome characterized by increased responsiveness of the tracheo-bronchial tree to a variety of stimuli, with symptoms of paroxysmal dyspnoea, wheezing and cough, and, as a physiological manifestation of this hyperresponsiveness, variable airways obstruction [2J. Our clinical diagnosis of emphysema may be subject to criticism. Emphysema is a histologic diagnosis [2] and in its early stage this disease is often difficult to diagnose. Use of computer tomography [5-7] and more recemly high resolution CT l8-11], with estimation of density
21

Study population and methods
is currently the golden standard. These techniques enable to diagnose the disease at an earlier stage, but are costly and nowadays no standardized procedure has been established [12]. Characteristic chest X-ray abnormalities usually develop in a later stage of the disease l13]. Diagnostic chest X-ray criteria related to histologic findings were described by Pratt in 1987, who claimed good sensitivity and specificity [3]. Although chest X-ray signs failed to be present in some emphysema patients in his study, which is a well known disadvantage of the chest X-ray [12], X-ray signs never were positive in normal lungs and positive signs of emphysema always coincided with histologically proven emphysema. The positive predictive value thus can be considered as 100 % and this has never been disproved by the new golden standard, the high resolution CT scan. Although increased lung compliance and reduced pulmonary diffusion capacity are considered to be most indicative pulmonary function indices for emphysema [14-17], they were not performed in all patients because of technical reasons (single breath diffusion capacity test requires a minimum FEVj of 11) and burdelling of the patients (compliance). As a late stage of the disease is accompanied by severe airways obstruction the chest X-ray and FEV j were chosen to characterize the patients and thus defined the severely obstructed emphysema group with FEV} values of about 1 1. Some patients, however, were clearly less obstructed and were separated at the beginning of the study to serve as a second emphysema group with moderate emphysema. Their FEV] values were larger than 1.41. As airways obstruction also occurs in asthma patients, our second check on the validity of the test as a diagnostic test for emphysema was made using this group of patients during exacerbation. They had normal FEVj and VC values after recovery, with no signs of emphysema on the chest X-ray, and were considered to have no emphysema.
2.3. Pulmonary function tests
Pulmonary function tests in healthy controls and patients were performed with a wet spirometer (model D53/R, Lode, Nl.) for estimation of total lung capacity (TLC), functional residual capacity (FRC), residual volume (RV), vital capacity (VC) and forced expiratory volume in one second (FEV1); FRC was estimated using the dosed circuit Helium dilution method.
2.4. Measuring equipment
The measuring equipment for the expiratory peo2 and volume registrations consisted of a CO2 analyser (Hewlett Packard, 4721 OA capnometer) in series with a pneumotachometer head (Jaeger,Wlirzburg, Germany) connected to a Validyne transducer, model P46 (Validyne Corp., Northridge, CA, USA). A pneumotachometer was used in view of its dynamic properties, thus avoiding distortion of phase 2 and synchronisation difficulties, which are to be expected when a spirometer system is used. Both signals, peo2 and flow, were sampled with a frequency of 50 Hz and analyzed by the lung function computer network at our laboratory [4J. Flow was integrated to volume. A time delay, inherent to the capnometer, of 160 msec was needed to synchronize the CO2 signal with the flow
22

Chaptet 2
signal. The pneumorachorneter head was maintained at a constant temperature of 3i)C. As the humidity and temperature of the gas in the pneumotachometer head are difficult to estimate, a humidity of 500/0 and a mean temperature of 30°C were assumed. From these values and the current barometric pressure a BTPS correction was made for the inspired air. For the expiratory gas BTPS conditions were present. Before each measurement, calibration with all syringe was performed. The dead space volume of mouthpiece, CO2 analyser and pneumotachometer head was 50 mI. The 90 % respons time of the capnometer was 82 IDS. A set up of the measuring system is shown in fig. 2.1.
G02
r-SENSOR
Fig. 2.1
LIP -.. U
GAPNO-METER
PNEUMOTAGHOMETER HEAD
AMPLIFIER cr: w f-
ocr: :::c~
z 0 ()
Schematic representation of the measuring equipment.
2.5. Experimental protocol
cr: W f-:::J "-::;; 0 ()
Each test consisted of a series of 40-80 consecutive breaths with natural breathing. With intervals of 3-5 normal breaths the subject took a voluntary deep breath from FRC with return to FRC (fig. 2.2). The control subjects repeated these manoeuvers at fixed frequencies of 10, 15 and 20 bteaths pef minute.
23
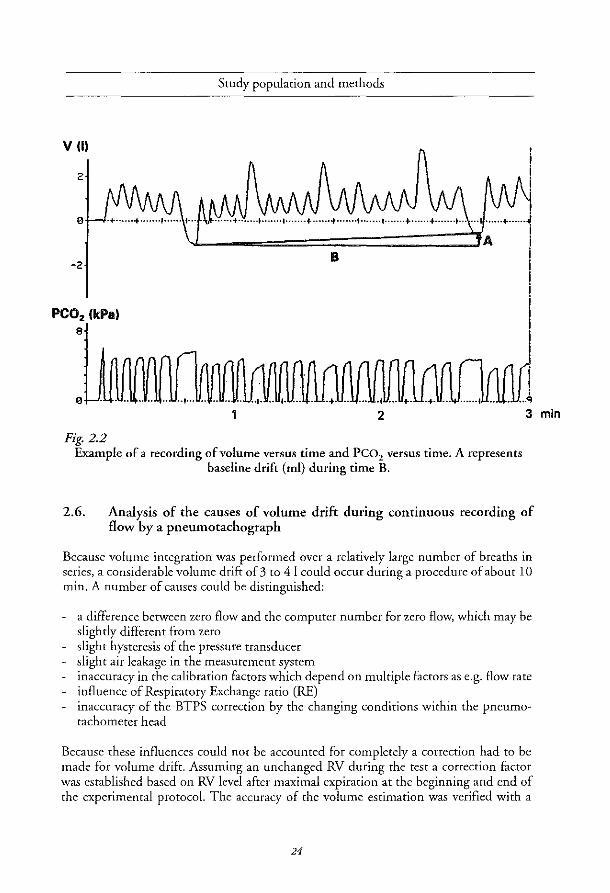
Study population and methods
VIII
2
o ............... , ••••... , ...... -+ ..•.•• + ....... , ....... , ......................... , ...... , ............... J
-2
peo. (kPa) e
B
I o . '" ........ , ...... . ., .. - ... q
1 2
Fig. 2.2 Example of a recording of volume versus time and peo2 versus time. A represents
baseline drift (ml) during time B.
3
2.6. Analysis of the causes of volume drift during continuous recording of flow by a pneumotachograph
Because volume integration was performed over a relatively large number of breaths in series, a considerable volume drift of 3 to 41 could occur during a procedure of about 10 min. A number of causes could be distinguished:
a difference between zero flow and the computer number for zero flow, which may be slightly different from zero slight hysteresis of the pressure transducer slight air leakage in the measurement system inaccuracy in the calibration factors which depend on multiple factors as e.g. flow rate influence of Respiratory Exchange ratio (RE) inaccuracy of the BTPS correction by the changing conditions within the pneumotachometer head
Because these influences could not be accounted for completely a correction had to be made for volume drift. Assuming an unchanged RV during the test a correction factor was established based on RV level after maximal expiration at the beginning and end of the experimental protocol. The accuracy of the volume estimation was verified with a
24
min
Chapter 2
spirometer in series. The volume measured by the pneumotachometer was slightly (but randomly) different from the volume measured by the spirometer and within a range of about 5%.
2.7 Reftrences
1 Quanjer PH Standardized lung function testing. Report: Working Party 'Standardization of lungfonction tests: European Community for Coal and Steel, Luxembourg. Bull Eur Physiopath Resp 1983; 19: 1-95.
2 American Thoracic Society Standards for the diagnosis and care afpatients with chronic obstructive pulmonary dise",e (COPD) and asthma. Am Rev Respir Dis 1987; 13& 225-243.
3 Pratt Pc. Role a/conventional chest radiography in diagnosis and exclusion of emphysema. Am J Med 1987; 82: 998-1006.
4 Verbraak AFM, Roorn E, de Vries j, Bogaard fM, Versprille A. A lung jUnction information 'Ystem. j Biomed Eng 1991; 13: 27-34.
5 Hayhurst MD, Macnee IT{ Flenley DC, Wright D, McLeanA, Lamb D, WightmanAJA. Diagnosis of pulmonary emphysema by computed tomography. Lancet 1984; 2: 320-322.
6 Bergin e; Muller N, Nichols DM. Lillington G. Hoggje; Mullen B. Grymalski MR. O,borne S. Pare PD. The diagnosis of emphysema: a computed tomographic pathologic correlation. Am Rev Re;p Dis 1986; 133: 541-546.
7 Foster WL, Pratt PC, Roggli VL, Godwin jD, Halvorson RA, Putman CE. Centrilobuar emphysema: a CT-pathologic correlation. Radiology 1986; 159: 27-32.
8 Murata K, Itoh H, Todo G, Kanaoka M, Noma S, Itoh T, Fumta M, kamoto H, Torizuka K Centrilobular lesions of the lung: demonstratz'on by high resolutuion CT and pathologic correlation. Radiology 1986; 161: 641-645
9 Hmban RH, Mesiane JI.iA, Zerhouni EA. High resolution CT of inflation -fixed lungs:pathologicradiologic correlation of centrilobular emphysema. Am Rev Respir Dis 1987; 136: 935-940.
10 Kuwano K, Matsuba K, Ikeda T, Murakami j, Araki A, Nishitani H, Ishida T, Yasumoto K, Shigematsu N The diagnosis of mild emphysema. Correlation of computed tomography and pathology scores. Am Rev Respir Dis 1990; 141: 169-78.
11 KkinjS. Gamsu G. Webb WR. Golden jA. Muller NL. High-resolution CT diagnosi, o/emphysema in symptomatic patients with normal chest radiographs and isolated low diffusing capacity. Radiology 1992; 182: 817-821.
25

Study population and methods
12 Snider GL Emphysema: The first two centuries-and beyond. A historical overview, with suggestions for foture research: Part 1. State o[the Art. Am Rev Respir Dis 1992; 146: 1334-1344.
13 Thurlbeck WM, Simon C. Radiographic appearance of the chest in emphysema. Am] Roentgenol 1978; 130: 429-440.
14 Macklem PT, Becklake MR. The relationship between the mechanical and dijfusingproperties of the lung in health and disease. Am Rev Respir Dis 1963; 87: 47-56.
15 Morrison NJ, Abboud RT, Ramadtn F, Miller RR, Gibson NN, Evans KG, Nelems B, Muller NL. Comparison of single breath carbon monoxide diiJitsing capacity and pressure-volume curves in detecting emphysema. Am Rev Respir Dis 1989; 139: 1179-1187.
16 Pare PD, Brooks LA, Bates J, Lawson LM, Nelems JMB, Wright JL, Hogg Le. Exponential analysis o/the lungpressure-volume curve as a predictor o/pulmonary emphysema. Am Rev Resp Dis 1982; 126· 54-61.
17 Yernault Ie, Paiva M. The in vivo diagnosis of emphysema: an uncompletely resolved issue. Bull Eur Physiopathol Respir 1986; 22: 95-97.
26

Chapter 3
Does phase 2 of the expiratory peo2 versus volume curve
have diagnostic value in emphysema patients compared to
asthma patients and healthy controls?
A.H. Kars, C. Coorden, T. Stijnen, ].M. Bogaard,
A.F.M. Verbraak, C. Hilvering.
Eur Respir] 1995; 8:86-92


Phase 2 of the expiratory peo2 versus volume curve
3.1. Abstract
The volumes between 25 and 50% (V25-50) and 25 and 75% (V25-75) of end tidal peo2 of the expiratory peo2 versus volume curve were determined in 29 emphysema patients (20 severely obstructed and 9 moderately obstructed), 12 asthma patients during exacerbation of their asthma and 28 healthy controls, to test their diagnostic value in case of emphysema. A plot of intercept versus slope of the relationships ofV25_5o and V 25-75 versus inspiratory volume from FRC (VI), obtained during natutal breathing, proved to be most discriminating in the separation berw-een healthy controls and severely obstructed emphysema patients. On basis of the discriminant line for V25-50 , separating healthy controls and severely obstructed emphysema patients, 9 of the 12 asthma patients during exacerbation were classified as normal and only 5 of the 9 moderately obstructed emphysema patients as emphysema. For V25-7S involvement of phase 3 (the alveolar part) in asthma patients during exacerbation even caused a marked overlap with the severely obstructed emphysema patients. In the healthy controls a fixed breathing frequency of20.min-I led to an increase of both volumes. For V25_50 this resulted in an overlap with the severely obstructed emphysema patients. We conclude that V25-50 and V25_75 are not sensitive enough parameters for further diagnostic application.
3.2. Introduction
In capnography three phases can be observed: phase 1 corning from the airways, without CO2, followed by a steep rise (phase 2) to the alveolar part, which shows an almost horizontal plateau: phase 3.
The abnormal shape of the expiratory peo2 versus time curve in emphysema patients has been studied often [1-5J. The time between 25 and 75% of the end-tidal Peo2 [4J and the minimum radius of curvature [5] resulted in abnormally high values in emphysema patients compared to astma patients and healthy controls. The dependence of the expiratory peo2 versus time curve on expiratory flow has led to the use of the peo2 versus volume curve [6-8]. Worth [7,8J focused on phase 2, and determined the volume expired between 25 and 50% (V25-50)' and 25 and 75% (V25-75) of the inspiratory to end-tidal partial pressure differences for He, SF 6' 02 and CO2, He found that the slopes of the relationships berw-een V25-SO or V25-75 and inspiratory volume (VI) for these gases increased more in emphysema than in healthy controls and asthma patients, which he explained on basis of a different airway morphology. The aim of the present study was to further evaluate the diagnostic value ofV25_so (C02)
and V 25-75 (C02) versus VI by comparing at first severely obstructed emphysema patients with healthy controls - as has been done in earlier studies - and subsequently, on basis of the former results, to investigate whether emphysema patients with less airway obstruction
29
Chapter 3
could be separated from healthy controls and whether asthma patients during exacerbation could be distinguished from emphysema patients. Moreover we investigated the influence of breathing pattern on V 25-50 and V 25-75 in the first 10 severely obstructed emphysema patients and healthy controls who entered the study. Breathing pattern was characterized by inspiratory volume (VI), expiratory volume (VE), inspiratory time (TI), expiratory time (TE), mean inspiratory and expiratory flow (VI/TI and VElTE), and end-tidal pco2 (PET, CO2), respectively. The relationship of V 25-50 and V 25-75 at a fixed inspiratory volume of 1 1 with height and the influence of a fixed breathing frequency was evaluated in all healthy controls.
3.3. Methods
Study population, pulmonary fonction tests, measuring equipment and experimental protocol as reported in Chapter 2.
3.3.1. Data analysis
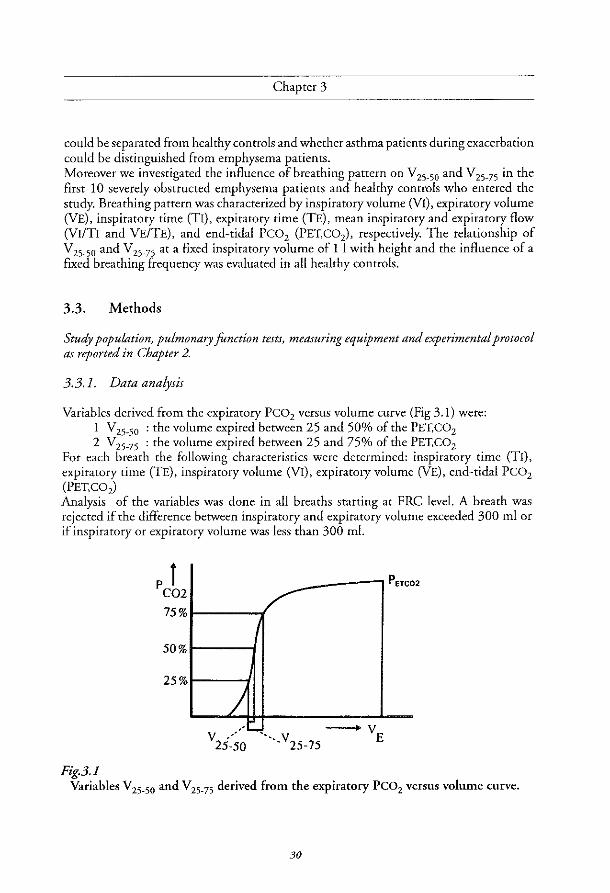
Variables derived from the expiratory Peo2 versus volume curve (Fig 3.1) were: 1 V,5-50 : the volume expired between 25 and 50% of the PET,C02 2 V25-75 : the volume expired between 25 and 75% of the PET,CO,
For each breath the following characteristics were determined: inspiratory time (TI), expiratory time (TE), inspiratory volume (VI), expiratory volume (VE), end-tidal Peo, (PET,C02) Analysis of the variables was done in all breaths starting at PRe level. A breath was rejected if the difference between inspiratory and expiratory volume exceeded 300 ml or if inspiratory or expiratory volume was less than 300 ml.
PETCO 2
50%
25%
/ ", L....,.~ -v v.' . V E
25-50 ". 25-75
Fig.3.} Variables V25_50 and V25_75 derived from the expiratory peoz versus volume curve.
30

Phase 2 of the expiratory peo2 versus volume curve
3.3.2. Statistical methods
Linear regression analysis was used to determine the linear relationship and correlation coefficient (R) ofV25_5o and V25-75 with VI and the other breath characteristics. Multiple linear regression analysis was used to investigate whether a second breath characteristic -the first being VI - could improve the linear relationships (expressed as R2, the coefficient of determination). Discriminant analysis was applied to investigate whether two groups could be separated on the basis of intercept and slope of the linear relationships. T-tests, unpaired and paired, were applied to detect differences between and within groups, respectively. For statistical analysis the commercial computer programs Statgraphics and SPSS were used.
3.4. Results
v:.5-50 and V25-75 versus VI in the study groups Examples of the relationship between V 25-50 and VI, and V 25-75 and VI with their regression lines for a healthy control and severely obstructed emphysema patient are shown in Figs. 3.2A and 3.3A, respectively. The X-Y-plots of inrercept versus slope of the individual regression lines of all healthy controls and severely obstructed emphysema patients showed that both groups had only a slight overlap (Figs. 3.2B and 3.3B). Discriminant lines, determined by discriminant analysis, are drawn in these figures. These lines yielded a sensitivity of 80-90% for both volume indices and a specificity of 89% for V25-50 versus VI and 100% for V25-75 versus VI relationship.
In Figs. 3.2C and 3.3C the discriminant lines separating healthy controls and severely obstructed emphysema patients were drawn, together with plots of intercept and slope of the regression lines for the asthma patients during exacerbation and the moderately obstructed emphysema patients. In Fig 3.2C the symbols, representing intercept and slope of the regression lines for the asthma patients during exacerbation were predominantly on the 'control' side of the discriminant line. In case ofV25_75 versus VI there was more overlap with the emphysema patients, which disappeared after recovery in 2 of the 5 asthma patients, who repeated the resr after recovery (Fig 3.3C). Only 5 of the 9 moderately obstructed emphysema patients were located on the emphysema side of the discriminant lines.
Influence of breathing frequency in the controls Fixed breathing frequencies of 10, 15 and 20 per minute in the controls showed generally an increase ofV25_5o and VZ5-75 in relation to VI with increase of breathing frequency (Figs. 3.4 and 3.5). At a breathing frequency of 20 per minute the position of intercepts and slopes of the regression lines ofV25_50 showed a marked overlap with those of the severely obstructed emphysema patients.
31

Chapter 3
250
200
E 150 .~ 0
~I 100 '" >
+ -t+ 50
0
0 2000 3000 4000
Fig.3.2A
Fig.3.2B
0.06
E :0,
E .~ 0.04 Q) Cl. 0 iii
0.02
Examples ofV25_50 versus VI with regression lines in a severely obstructed emphysema patient (0) and
a healthy control (+). -- : linear regression line.
0 0
-10 50 80 110
Intercept in ml
140
Slope versus intercept of linear regression lines ofV25_50 versus VI in 20 severely obstructed emphysema patients (0) and 28 healthy controls (+). -- : discriminant line.
32

Fig.3.3A
Fig.3.3B
Phase 2 of the expiratory peo2 versus volume curve
600
E .~
"' 400 r--I
"' N >
200
0.55
0.45
E 0.35 0,
E .~ 0.25 " c-0 Vi 0.15
0.05
-D.05
o 1000 2000 3000
V_insp in ml
Examples ofV25_75 versus VI with regression lines in a severely obstructed emphysema patient (D) and
a healthy control (+). -- : linear regression line.
+
0 0
+ GJ,
+ + 0 + on
d=b +
00 + + 0
+ +
-!f~ 0 + *+ +
0
-550 -300 -50 200
Intercept in ml
4000
450
Slope versus intercept of linear regression lines ofV25_75 versus VI in 20 severely obstructed emphysema patients (D) and
28 healthy controls (+). --: discriminant line.
33

Chaptet 3
0.12 ............. ... '
'.
0.10
~ ,
~ 0.08
E .~ 0.06 Q)
"-0 Uj
0.04
0.02
0
~ ~ 0
, .... • !2 ......• ...,
.' l::'\ ... ... ..... ~-,-.ou
~ 0
• . .... T
0 .. ' , ................. -70 -40 -10 20 50 80 110 140
Fig.3.2C Intercept in ml
Slope versus intercept of linear regression lines ofV25_50 versus VI in 9 moderately obstructed emphysema patients (D), 12 asthma patients
during exacerbation (II) andS asthma patients after recovery (<», -- : discriminant line as in Fig. 3.2B.
0.55
0.45
~ 0.35
E .5 0.25 Q) c. 0
Uj 0.15
0.05
-0.05
·550
Intercept in ml
Fig.3.3C Slope versus intercept of linear regression lines ofV25_75 versus VI in
9 moderately obstructed emphysema patients (D), 12 asthma patients during exacerbation (II) and 5 asthma patients after recovery (<> ).
-- : discriminant line as in Fig.3.3B.
34

Fig.3.4
0.08
0.06
~ E .J: 0.04 Q) c. o en
0.02
Phase 2 of the expiratory peo2 versus volume curve
o
°0" + + +0. "!?-;.. +
; Q> 0 +:t;':<t ",..................... , ............................... , ..... .
20 50 80 110 140
Intercept in ml
Slope versus intercept of linear regression lines of V 25-50 versus VI in 28 healthy controls with breathing frequencies 10 (0), 15 (+) and 20 ( 0 ) per min.
-- : discriminant line as in Fig. 3.2B.
0.55
0.45
~ 0.35
E .~ 0.25 Q) c. 0 en 0.15
0.05
-0.05
-550
Intercept in ml Fig.3.5
Slope versus intercept of linear regression lines of V 25-75 versus VI in 28 healthy controls with breathing frequencies 10 (0),15 (+) and 20 (0) per min.
-- : discriminant line as in Fig.3.3B .
.35

Chapter 3
Influence of breath characteristics and height In the 10 controls in all cases V25_50 and V25-75 were significantly correlated with VI' but also with VE, VI/TI and VElTE, the last variables representing mean inspiratory and mean expiratory flow, respectively. The correlation coefficients (r) were in a range between 0.80 and 0.90 with a mean SD of 0.10. Mulriple regression analysis did not show, however, an appreciable increase of R2 Of reduction of residual variance when either of the other breath characteristics (TI, TE, VE, VIITI, VElTE or PET, CO2) was added as second variable - the first being VI. In the 10 severely obstructed emphysema patients V25-50 and V25-75 were significantly correlated with VI in 8 cases, two patients showing no significant correlations with R< 0.30. This was the reason that the mean correlation coefficients were lower with values of 0.59 (SD 0.28) and 0.73 (SD 0.30) for V25-SO and VZS-7S ' respectively. Because in the two patients, mentioned above, a significant correlation ofV25_S0 only existed with TI and VII TI, a multiple regression analysis adding these variables, increased R2. At a fixed inspiratory volume of 1 1 there was a positive correlation ofV25_50 and V25-75 with height in the 28 controls with correlation coefficients of 0.56 (p-value: 0.002) and 0.43 (p-value: 0.022), respectively.
3.5 Discussion
This study was aimed at the diagnostic value of phase 2 indices of the Peo2 versus volume curve in case of pulmonary emphysema.
The results showed that a: severely obstructed emphysema patients could be separated from healthy controls and
asthma patients after recovery on basis of a plot of intercept versus slope of the relationships of V 25-SO or V25-75 versus VI. Separation of asthma patients during exacerbation and severely obstructed emphysema patients was only possible for the relationship ofVz5_5o versus VI.
b: moderately obstructed emphysema patients showed a marked overlap with healthy controls.
c: increasing breathing frequency in healthy controls caused an overlap with the severely obstructed emphysema patients for the relationship ofVZ5_50 versus VI.
d: in healthy controls both V25_50 and V25_75 showed a positive correlation with height at an inspiratory volume of 1 1.
For the alveolar plateau of the capnogram, it is generally accepted that primarily parallel ventilation-perfusion inhomogeneity, in combination with sequential emptying of the lung units, defines its value, slightly modified by the ongoing COz excretion [6]. The alveolar plateau slope values and PET,COz influence the magnitude ofVZ5_50 and V25-75 undoubtedly, which means that these mechanisms contribute to the values as well. Worth postulated that serial inhomogeneity in a trumpet model was the main determining mechanism [7,8]. Thus increased serial inhomogeneity due to morphological changes in peripheral airways in emphysema patients then provides an explanation for the increase
36

Phase 2 of the expiratory peo2 versus volume curve
of both V25_50 and V25-75 and, moreover, for the increase of these variables with increasing VI. The work of Worth has been extended in the present study by enlarging the number of patients and using not only the change with VI, but both the intercept and slope of the relationships. For the discrimination of severely obstructed emphysema patients and controls it appeared in our data that a plot of slope versus intercept of the relationship of either V25_50 or V25-75 versus VI was most discriminating, if compared with the slope alone (fig 3.2B, 3.3B). For both the V25-50 and V25-75 versus VI relationships we found on average a two times smaller increase in slope in emphysema patients compared to controls than Worth [7,8]. The differences between our results and those of Worth could be due to the different study populations, our study group being three times larger and moreover age-matched with the controls, which was not the case in Worth's study.
The results in the 9 moderately obstructed emphysema patients did not support the discriminating value of slope and intercept, whereas the asthma patients during exacerbation were only classified properly for the V 25-50 versus VI relationship. If morphological lesions alone were responsible for the observed differences, as found in the severely obstructed emphysema patients, it was to be expected that the 9 emphysema patients with less airways obstruction could be discriminated from the healthy controls as wel1. In asthma patients during exacerbation airways obstruction is expected to occur with narrowing of peripheral airways, which explains the lack of difference compared to controls for V25_50 . The lesser discriminatory power for the V25 -75 versus VI relationship in the case of asthma, may be explained by the influence of an increased slope of the alveolar plateau on this volume, causing extension of V 25-75 into the alveolar phase. This same mechanism may explain that in severely obstructed emphysema patients versus controls V 25-75 was slightly better than V 25-50'
Influence of breath characteristics, breathing ji-equency and height. The first 10 healthy controls and first 10 severely obstructed emphysema patients who entered the study, confirmed that during natural breathing frequency (and fixed breathing frequencies in the controls) V25-50 and V25-75 were mainly dependent on VI. So the discriminatory power of the relationships with VI will not increase if more breath characteristics are taken into account. Fixed breathing frequency with varying VI implies higher in- and expiratory flows, whereas during natural breathing the respiratory cycle time increased with increasing VI. The increase of V 25-50 and V 25-75 versus VI with increase of frequency is in agreement with the results in Worth's controls and can be attributed physiologically to movement of the diffusion front in a peripheral direction by increased inspiratory flow, which results in an increased cross diameter of this front [7,8J. The increased cross diameter causes an increase in phase 2 volumes. Worth [7,8] found no relationship between the slopes ofV2s. so and V2S.75 versus VI and height in controls. At a fixed inspiratory volume, however, chosen because of the volume dependence, we found a significantly positive correlation ofV25_50 and V25-75 with height in the controls, which is a new finding. This linear correlation is certainly based, as for the anatomical dead space [9J on the relationship with the anatomical dimensions of the brochial tree, being body size dependent.
37

Chapter 3
3.6 Conclusion
The results of our study make the use of phase 2 indices for the diagnosis of emphysema, as suggested earlier [7,8], doubtful. Moderately obstructed emphysema patients could not be distinguished sufficiently from healthy controls as was the case for asthma patients during exacerbation versus severely obstructed emphysema ifV2S_75 was considered. Most probably the explanation of differences between patient groups, on basis of serial inhomogeneity in a trumpet model of the lung, means an oversimplification of the complex interaction with parallel ventilation perfusion inhomogeneity and asynchronism. The variables are not sensitive enough for further diagnostic application and certainly the use of more refined clinical indices for emphysema as obtained by for instance a high resolution CT scan will not influence this conclusion.
3.7 References
1 Dornhorst AC Semple SjG, Young 1M, Automatic fractional analysis of expired air as a clinical test. Lancet 1953; 1: 370-372.
2 Marshall R, Bates D V. Christie RV. Fractional analysis of the alveolar air in emphysema. Clin Sci 1952; 11: 297-307.
3 Kelsey jE, Oldham EC, Horvath SM. Expiratory carbon dioxide concentration curve, A test of pulmonaryfonction. Di, Che;t 1962; 41: 498-503.
4 Smidt U. Emphysema as possible explanation for the alteration of expiratory P02 and PC02
curve,. Bull Enr Phpiopath Resp 1976; 12: 605-624.
5 Vtm Meerten RJ Expiratory gas concentration curves for examination of uneven distribution of ventilation and perfusion in the lung, Second communication: experiments, Respiration 1971; 28: 167-185.
6 Fletcher R. The single breath test for carbon dioxide. Thesis, Berlings, Arlov, Sweden, 1980.
7 Worth H Zur diagnostik des lungenemphysems. Analyse des mischluftanteils expiratorischer partialdruckkurven von He, Ar, SF6 und CO2, Copythek, Thieme, Stuttgart - New York, 1985.
8 Worth H, Expiratory partial pressure curves in the diagnosis of emphysema. Bull Bur Physiopathol Re.p 1986; 22: 191-199.
9 Bouhuys A. Respiratory dead space. Handbook of Physiology; American Physiological Society, Wa,hington, D.C. 1964. Section 3: Respiration: 1: 28: 699-714.
38

Chapter 4
Slopes of the alveolar plateau of the time and
volume based capnogram.
Discriminatory power and tidal volume dependency
in healthy controls, asthma and emphysema patients
A.H. Kars, ].M. Bogaard, T. Stijnen,]. de Vries,
A.F.M. Verbraak, C. Hilvering.
Submitted for publication


Slopes of the alveolar plateau of the time and volume based capnogram
4.1 Abstract
The study aimed to compare the slopes of the alveolar plateaus of the PE,COz versus time and versus volume curves with respect to their discriminatory power between 28 healthy controls and 41 patients with obstructive lung diseases (asthma and emphysema) and also to investigate the influence of tidal volume on the slopes. In the controls other breathing characteristics as frequency, in- and expiratory flow, and anthropometric data as height and age were evaluated.
During natural breathing the slopes of the alveolar plateau of the PE,COz versus volume curves decreased with increasing VT in all groups, whereas in the PE,COz versus time curves this was only present in the emphysema patients. For the emphysema patients the linearity of the slope of the alveolar plateau improved in all cases when the PE,COz versus time curves were converted to PE,COz versus volume equivalents. In the controls an increased breathing frequency and increased expiratory flow resulted in an increase of the slopes of the alveolar plateaus of the PE,eoz time curves and a decrease of the slopes of the PE,eoz versus volume curves.
Because of the influence ofVT, imposed fixed breathing frequencies and expiratory flow, the slopes were compared at 1 I VT and at natural breathing frequency. The slopes of the PE,C02 versus volume curves, so obtained, discriminated markedly better between healthy controls and obstructive patients than those of the PE,e02 versus time curves. Also a markedly berter correlation with FEV, (% predicted) and FEV/VC existed (correlarion coefficient: -0.77, p-value < 0.001) for the Peo2 versus volume curve than for the peo2-
time slopes (correlation coefficient: -0.52, p-value < 0.001). In the controls a significant relationship with height was found. We conclude that the slope of the alveolar plateau of the PE,C02 versus volume curve, obtained at a standardized VT of 1 I during natural breathing is to be preferred as an index of ventilation-perfusion inequality, related to airways obstruction.
4.2 Introduction
The alveolar part of the expiratory partial pressure curve for CO2 (capnogram), denoted as phase 3, is influenced by ongoing CO2 production and sequential emptying of lung units with unequal ventilation perfusion ratios; the relatively less ventilated and more perfused parts with a high CO2 fraction. empry last [IJ. The slope of rhe alveolar plateau. being slightly positive in normal controls, has been used mostly as a qualitative measure for ventilation perfusion inequality. The increase of the slope of the alveolar plateau of the time based capnogram has been recently described to be related to increasing impairment of ventilatory function in asthma patients [2J. A characteristic curvilinear shape in emphysema patients [3-5J, related to the curvilinear shape of the expiratory volume versus time pattern [3], interferes with the definition of the position of an alveolar plateau, which led to determination of variables such as the minimum radius of curvature [6J and the time interval between 25% and 75% ofPET,eo2
41

Chapter 4
[7], both being increased in emphysema patients compared to healthy controls and asthma patients. Because of the influence of flow on the slope of the capnogram it has been long recognized that plotting the PE,C02 versus volume increases the diagnostic applicability compared with a plot versus time [8]. In that case, the characteristic curvilinear appearance in emphysema patients partly disappears and the interpretation of the slope becomes more accurate [9]. Although much research has been done on the slopes of the alveolar plateau with inert gases, data on the slopes of the alveolar plateau of the PE,C02 versus volume curve in men in health and disease are scarce [9,10]'
The aim of the study was to determine the discriminatory power of the slopes of the alveolar plateaus of the PE,C02 versus volume and PE,C02 versus time curves in healthy controls, asthma and emphysema patients. Analysis was done on curves obtained in one session with a number of consecutive breaths with varying tidal volumes (VT), which led to investigate the relationship with VT. In healthy controls and emphysema patients the influence of previous manoeuvers was evaluated. In the emphysema patients improvement of linearity of the slope of the alveolar plateau of the PE,C02 versus volume curve compared to its equivalent part of the PE,COz versus time curve was quantified. In the healthy controls the influence of breathing frequency as well as height and age dependency were evaluated. In three healthy controls the influence of in- and expiratory flow, separately, was evaluated in breaths of equal size.
4.3 Methods
Study population, clinical diagnosis, pulmonary function tests, measuring equipment, experimental protocol as reported in Chapter 2
4.3.1. Data analysis
For each tidal volume equal to or larger than 750 ml the slope of the alveolar plateau was determined between 600/0 and 90% of the expiratory volume in the PE,COz-time and PE,COz-volume curve (fig. 4.1). The values were expressed as a percentage ofPET,COz per sec and per 1. Negative slopes, which occurred incidentally in the controls, were discarded. Analysis was done in all breaths in which the inspiratory manoeuvre started at PRe level. A breath was rejected if there was a difference between in- and expiratory volume of more than 300 ml.
Data analysis in controls (natural breathing and breathing with fixed frequencies) and patients (natural breathing only) included:
1: Calculation, by linear regression analysis, of the linear relationships of the slopes of the alveolar plateaus of PE,C02 versus time and PE,COz versus volume curves and VT: the relationships were determined from the linear correlation coefficients and expressed as zero (0), positive (+) or negative (-), indicating no significant linear correlation or a significantly positive or negative correlation, respectively.
42

b' ()
"-
A
c Fig. 4.1
Slopes of the alveolar plateau of the time and volume based capnogram
6
4
o 200 400 600 800 Expiratory volume in ml
.~ :; , 2 ......... ;-
~:
o ~ .. o 1000 2000 3000
Expiratory volume in ml
B
D
o 2 3 4 Time in sec
8
6 H ,............ +"r' ......... +··············H
o 2 4 6 8 10 Time in sec
Examples of a small and large expiratory PE,C02 curve in a healthy control and emphysema patient;
the upper curve belongs to the emphysema patient in all figures and 60 and 90% of the expiratory volume are marked with a small vertical line in each curve. A: A PE,co2-volume curve of a small breath in a healthy control and
emphysema patient during natural breathing frequency. B: The same breaths as in figure 4.1A, now the PE,COz-time version. C: A PE,cO,-volume curve of a large breath in a healthy control and
emphysema patient. D: The same breaths as in figure 4.1 C, now the PE,COz-time version.
43

6.9
6.7
'" 6.5 Il. -" .S 63
N • 0 () Il.
6.1
5.9
5.7
A
6.9
6.7
fE 6.5 -" c ·~"'6.3 () Il.
6.1
5.9
0
0
0
0
0
5 6 7 Time in sec
8
Chapter 4
0
9
900
850
E 800 oS
~ 750 :J "0 > 700
650
600
B
6.9
6.7
fE 6.5 -" c ·SC'J6.3 Il.
6.1
5.9
*
5 6 7 8 9 Time in sec
c 600 650 700 750 800 850 900
Volume in ml o 600 650 700 750 800 850 900
Volume in ml
Fig. 4.2 Schematic representation of the volume based rearrangement of data points,
sampled with a frequency of 50 Hz. A: PE,C02 versus time with curvilinear shape as occurs in the slope of the
alveolar plateau of an emphysema patient; B: volume versus time with decreasing flow; C: PE,C02 versus volume with time based data points; D: PE,C02 versus volume; between the time based data points the volume
based rearranged points are indicated with crosses.
44

Slopes of the alveolar plateau of the time and volume based capnogram
2: Calculation of the mean values of the slopes of the alveolar plateaus of the PE,COz versus time and PE,cOz versus volume curve at 1 I tidal volume from the regression equations as described above.
3: Analysis of the improvement of linearity of the slope in emphysema patients by comparison of the linear correlation coefficients of the slopes of the PE,cOz versus time and volume curve in 20 severely obstructed emphysema patients: in the PE,cOz versus volume curve the time based data, sampled at 50 Hz, were converted into volume based equivalents to avoid attributing too much weight to the last part of the alveolar plateau. This was done because, due to a low flow at end-expiration, most time based data points were collected in this part of the curve. A simplified example of the slope of the alveolar plateau of the PE,cOz versus time curve with a curvilinear shape is shown in figure 4.2a. The volume versus time curve, with decreasing flow, as occurs in an emphysema patient, is shown in figure 4.2b. In figure 4.2c PE,c02 is plotted versus the volume data of figure 4.2b and shows the different distances as well as the more linear appearance. An equal number equidistant volume points, marked with crosses, are plotted in between the time based volume points in figure 4.2d.
4: Calculation of the mean values of the slopes at 11 VT during fixed frequencies of 10, 15 and 20 per min in all healthy controls. A consequence of this procedure was a concomitant change in mean in- and expiratory flow, which led to:
5: Evaluation of the influence of changing in- or expiratory flow, separately, upon the slopes of the alveolar plateaus in 3 healthy controls: for standardization of a fixed VT in the analysis of flow influences on the slope of the alveolar plateau VT equal to the inspiratory capacity was chosen. In the 3 volunteers this meant a VT of about 3 1.
6: Evaluation in the healthy controls of the relationships between TLC, FRe, height and age and the values of the slopes at 1 I VT during natural breathing.
7: Evaluation of the influence of preceding breaths by calculating the mean values of PET, CO2 and the slopes of the alveolar plateau in breaths of about equal size at the start of the procedure and after 5 min: tidal breaths of about equal size were selected equal to or greater than 750 ml and within a range of 250 m!. This was done only in the healthy controls during na'tural breathing and in the severely obstructed emphysema patients.
4.3,2, Statistical methods
Linear regtession analysis was used to determine the relationships of the slopes of the alveolar plateaus with VT. Linear correlation coefficients were used to express the linear relat.ionships betvveen variables. The two-sample t-test was applied to investigate differences between tvvo groups. The paired t-test was applied to investigate differences within a group.
45
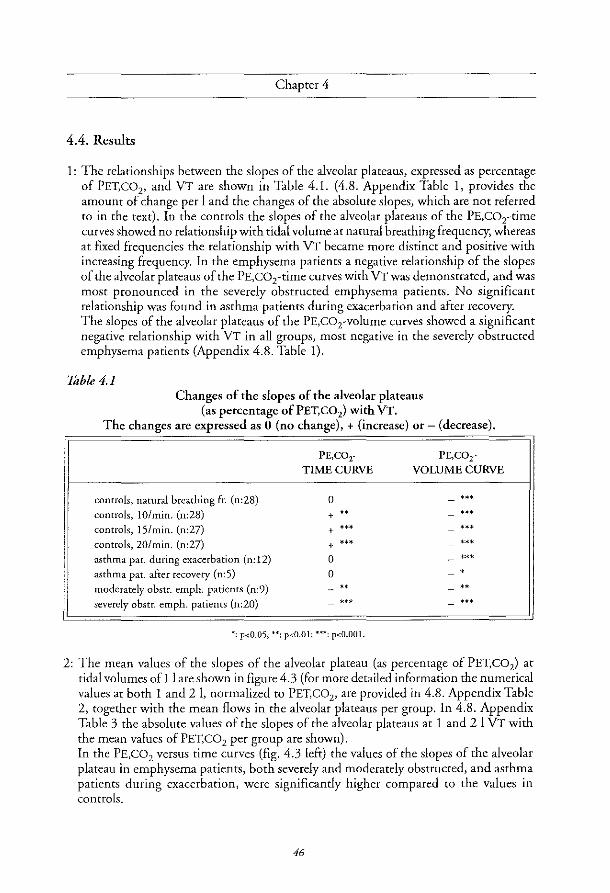
Chaptet 4
4.4. Results
1: The relationships between the slopes of the alveolar plateaus, expressed as percentage of PET,C02• and VT are shown in Table 4.1. (4.8. Appendix Table 1. provides the amount of change per 1 and the changes of the absolute slopes, which are not referred to in the text), In the controls the slopes of the alveolar plateaus of the PE,C02-time curves showed no relationship with tidal volume at natural breathing frequency, whereas at fixed frequencies the relationship with VT became more distinct and positive with increasing frequency, In the emphysema patients a negative relationship of the slopes of the alveolar plateaus of the PE,C02-time curves with VT was demonstrated, and was most pronounced in the severely obstructed emphysema patients. No significant relationship was found in asthma patients during exacerbation and after recovery. The slopes of the alveolar plateaus of the PE,co2-volume curves showed a significant negative relationship with VT in all groups, most negative in the severely obstructed emphysema patients (Appendix 4.8. Table I).
Table 4.1 Changes of the slopes of the alveolar plateaus
(as percentage of PET, CO2) with VT. The changes are expressed as 0 (no change), + (increase) or - (decrease).
controls, natural bteathing fro (n:28)
controls, IO/min. (n:28)
controls, IS/min. (n:27)
controls, 20/min. (n:27)
asthma pat. during exacerbation (n: 12)
asthma pat. after recovery (n:S)
moderately obstr. emph. patients (n:9)
severely obstr. emph. patients (n:20)
PE,COr TIME CURVE
0
+ .. + '" + '" 0
0 .. ."
*: p<O.05; **; p<O.Ol; ***; p<O.OOI.
PE,C02-
VOLUME CURVE
".
2: The mean values of the slopes of rhe alveolar plareau (as percentage of PET,C02) at tidal volumes of 1 I are shown in figure 4.3 (for more detailed information the numerical values at both 1 and 21. normalized to PET,C02 , are provided in 4.8. Appendix Table 2, together with the mean flows in the alveolar plateaus per group. In 4.8. Appendix Table 3 the absolute values of rhe slopes of the alveolar plateaus at 1 and 2 I VT with the mean values of PET, CO2 per group are shown). In the PE,C02 versus time curves (fig. 4.3 left) the values of the slopes of the alveolar plateau in emphysema patients, both severely and moderately obstructed, and asthma patients during exacerbation, were significantly higher compared to the values in controls.
46

Slopes of the alveolar plateau of the time and volume based capnogram
50
~ i; 40 "-
"C C
'" -0 30 c 0 0
" "' i; "- 20 ~
0 ()
r' w "-'0 10
'" 0
0
Fig. 4.3 Mean values of slopes (SEM) of the alveolar plateaus, at 1 I tidal volume of
PE,C02-time (left) and PE,co,-volume curves (right) per group: first bar: healthy controls; second bar: asthma patients during relapse; third bar: asthma patients after recovery; fourth bar: moderately obstructed emphysema patients; fifth bar: severely obstructed emphysema patients.
Significant differences compared to the values in controls are marked: * p<O.OS; ** p<O.Ol; *** p<O.OOl.
The PE,C02 versus volume curves (fig. 4.3 right) showed significantly higher values for the slopes of the alveolar plateaus in the patient groups with airways obstruction than in the controls, the largest difference (2.5 times higher values) occurring in the severely obstructed emphysema patients. The SEM values, indicated with vertical lines on top of the bars, were relatively (in relation to the mean values) lower for the slopes of the alveolar plateaus of the PE,C02 versus volume curves than for those of the PE,C02 versus time curves. These values were in the controls during natural breathing, asthma patients during exacerbation, moderately obstructed emphysema patients and severely obstructed emphysema patients 6.1, 7.5, 9.8 and 5.6% of the mean values for the slopes of the PE,CO, versus volume curves and 7.2, 12.8, 8.4 and 8.3% for the slopes of the PE,C02 versus time curves. The increase of slope values in the asthma patients during exacerbation compared to the values in controls, was more significant for the PE,C02 versus volume curve (p<O.OO 1) than for the slope of the plateau of the PE,CO, versus time curve (p<O.05), indicating less overlap with the controls. Duplicate measurements, which were done in the patients, did not show a significant difference.
47

<.>
" U) -;R 0
U)
'" :>
'" * Q.
" (5
~ «
A
-;f'-U)
'" :>
'" * Q.
.!!i 0
" > «
B
Fig. 4.4
24
20
16
12
8
4
0 0 30
60
50
40
30
20
10
0
0 30
Chaptet 4
60 90 FEV 1 as % predicted
o
+
+ o Dc;,
60 90 FEV 1 as % predicted
120
o
120
o DO
150
150
Relationship between slopes of the alveolar plateaus at 1 I VT of the PE.C02-time (a) and -volume (b) curves with FEV, in all subjects.
D Healthy controls; $- patients with airways obstruction. A: slope (%/sec) = 14.58 - 0.067 x FEV, (% predicted)
correlation coefficient: -0.52, R2: 27 %, p-value:<O.OOl. B: slope (%11) = 47.97 - 0.28 x FEV, (% predicted)
correlation coefficient: -0.77, R2: 59 %, p-value<O.OOl.
48

Slopes of the alveolar plateau of the time and volume based capnogram
When all healthy controls and patients were taken together, there was a significantly negative linear relationship with FEV! (% predicted) and FEV/Ve for both types of slopes, the correlation coefficients being -0.77 (p-value < 0.001) for the PE,CO, versus volume curve in case of FEV! (% predicted) and FEV/Ve, and -0.52 and -0.53 (pvalues < 0.001) for the pea, versus time curve in case of FEV! (% predicted) and FEV/ Vc. As the relationships with FEV! (% predicted) were almost equal to those with FEV/Ve in figures 4.4a and 4.4b only the relationships with FEV! (% predicted) are shown.
3: In 20 severely obstructed emphysema patients the linear correlation coefficients of the slopes of the PE,C02 versus volume curves showed in all cases a significantly better linear correlation for the PE,C02 versus volume curves than for the PE,C02 versus time curves. Representative examples are shown in fig. 4.1.
20
~ iii 16 "-'C c
'" -c 12 c 0
" OJ
"' iii "- 8 N a
()
I--' w "-a 4 ~ 0
0
Fig. 4.5 Mean values of slopes (SEM) of the alveolar plateaus at 1 I VT of
PE,COz-time (left) and PE,co,-volume curves (right)in healthy controls during natural breathing (first bar) and at fixed frequencies of 10 (second bar), 15 (third bar) and 20 per min (fourth bar).
Significant differences compared to the mean values during natural breathing are marked: * p<O.05; ** p<O.OI; *** p<O.OOl.
4: In the controls, the influence on the slopes at 1 I VT of a fixed breathing frequency during the same manoeuvres as during natural breathing, is shown in figure 4.5. (the numerical values are shown in 4.8. Appendix Table 2 and 3). Compared to the values during natural breathing frequency, which meant a mean frequency of 15 per min

Chapter 4
before breathing exercises were done, there was a significant decrease of both type of slopes at a frequency of 10 per min. At a frequencyof20 per min there was a significant increase of the slope of the PE,C02 versus time curves only.
5: The results in 3 healthy controls changing inspiratory flow in breaths of about 31 (and keeping expiratory flow as constant as possible) showed, in 30 inspiratory capacity manoeuvres, no relationship with inspiratory flow. However, when expiratory flow changed and inspiratory flow was kept constant, in 29 manoeuvres of 3 1 there was a significantly positive relationship of the slopes of the alveolar plateaus of the PE,COz versus time curves with expiratory flow and, moreover, a significantly negative relationship of the slopes of the alveolar plateaus of the PE,C02
versus volume curves with expiratory flow. This resulted for tidal breaths of 3 1 for the slope of alveolar plateau of PE,C02 versus time curve (correlation coefficient 0.69, p<O.OOl), in slope values between 3.0 and 10.6%/sec, when expiratory flow increased from 15 IImin to 110 11m in. For the slope of the alveolar plateau of the PE,C02 versus volume curve (%/1), the relationship (correlation coefficient - 0.38, p<0.05) resulted in a decrease from 9.6% to 4.9%/1, when expiratory flow increased from 1511min to 110 lImin.
6: At a fIxed tidal volume of 11 there was in the healthy controls a positive linear relationship of the slopes of the alveolar plateaus of the PE,C02 versus volume curves with TLC (r:o.66, p<O.OOI), PRC (r:0.64, p<O.OOI) and height (r:0.55, p<O.OI). For the PE,C02 versus volume curve, height ranging between 1.50 m and 1.90 m, the relationship resulted in values between II %/1 and 24.5%/1. The slopes of the alveolar plateaus of the PE,C02 versus time curves at a tidal volume of II also showed a positive relationship with TLC (r:0.60, p<O.OI), PRC (r:0.49, p<0.05) and height (r:0.61, p<O.OOI) This resulted, heights ranging between 1.50 m and 1.90 m, for the slope of alveolar plateau ofPE,C02 versus time curve, in values ranging from 3.5%/sec to 11 %/sec. No relationship with age was found.
7: In 22 healthy controls and 15 severely obstructed emphysema patients a sufficient number (7 or more) of tidal breaths with volumes equal to or greater than 750 ml, and within a range of250 ml, could be analyzed. In both groups a significant mean decrease of PET,C02, with 0.97 kPa (SEM:0.14) and 0.33 kPa (SEM:0.08) in healthy controls (p<O.OOI) and emphysema patients (p<O.OOI), respectively, occurred within 5 minutes. In both groups the increasing hyperventilation during the test did not result in any significant changes in slope, expressed in %/sec or %/1, respectively. Also the mean VT values showed no significant differences.
4.5 Discussion
Comparison of the slopes of the alveolar plateaus ofPE,C02 versus time curves and PE,C02 versus volume curves, normalized to PET,C02 (%.sec1 and 0/0.1-1) in healthy controls and
50

Slopes of the alveolar plateau of the time and volume based capnogram
two distinct patient groups with airway obstruction (asthma and emphysema) resulted in a tidal volume dependence of the slopes during natural breathing. Discrimination between patients and controls was best with the PE,C02 versus volume curve at 1 1 tidal volume; this because with larger breaths the values of the slopes decreased more in the obstructive patients than in the healthy controls. A quantitative relationship with the severity of the obstruction existed, which was most pronounced for the slopes of the alveolar plateaus of the PE,C02 versus volume curves. In the healthy controls increase of breathing frequency and expiratory flow was positively related to the slopes of the PE,CO[time curves, whereas the slopes of the alveolar plateaus of the PE,cO[voiume curves decreased with increase of expiratory flow. At a breathing frequency of 20.min-1 did not result in a significant change. At 1 I volumes there was a significantly positive relationship with height for both types of slopes. Although one cannot distinguish asthma from emphysema on the ba..<;is of the slope of the alveolar plateau, the different groups enabled to investigate the effect of reversibility in case of asthma and the severity of the obstruction in the emphysema groups. Only recently, indices from the capnogram versus time curve appeared to be quantitatively related to airways obstruction in asthma patients [2]. Our data stress the sensitivity of the PE,C02 versus time curve for breathing pattern characteristics as frequency and expiratory flow in healthy controls and VT in patients with airways obstruction. Our data show that the PE,C02 versus volume curve at 1 I VT is to be preferred to the PE,C02 versus time curve for diagnostic purposes, because differences between healthy controls and patients with airways obstruction are more clearly shown and a closer relationship with FEV! as % predicted exists.
The main mechanisms determining the slopes of the alveolar plateaus are continuing gas exchange, ventilation perfusion inhomogeneity combined with sequential emptying, and serial inhomogeneity or stratification [11]. Although the question whether the main cause of distortion of the expirogram in emphysema is ventilation perfusion inhomogeneity with sequential emptying [12] or serial inhomogeneity [7], has not yet been resolved, the improvement of linearity of the alveolar plateau of the PE,COz versus volume curve compared to PE,C02 versus time curve indicates an influence of flow pattern on the shape of the curve as well (figs. 4.1 and 4.2). The resemblance of the shape of the expiratory volume versus time and PE,C02 versus time curves in emphysema patients was described by Dornhorst in 1953 [3]. The influence of decreasing flow during expiration, resulting in curving and flattening of the PE,C02 versus time curve compared to the volume curve, was reported by Fletcher [9].
In healthy controls the negative relationship of the slope of the alveolar plateaus of the PE,COz versus volume curves with VT during natural breathing can be explained by an increased contribution of the lower lung parts to the end of expiration during a deep bteath from FRe [13]. During a deep bteath from FRe level in sitting position the top of the lung is already rather inflated by air entering when inhalation is done from RV to FRe level, and the fteshly inspited air preferentially goes to the expanding lower lung, which is very distensible at the lower rib cage and the diaphragm. The dilution of CO2 is maximal there.
51

Chapter 4
At the subsequent expiration to FRC level gas will come mainly, bur not exclusively, from the lower lung. The larger the inspiratory manoeuvre, the larger is the contribution of dilution by the lower lung parts, and the flatter the slope. The difference between low and high CO2 containing lung parts, which empty last, then decreases. In patients with obstructive lung disease less ventilated, relatively well perfused areas with a high alveolar COzlevel empty last [1,12]. As there is more inhomogeneity of ventilation and perfusion throughout the lung, the differences between regions with different peo2 are larger resulting in steeper slopes of the alveolar plateaus of bath types of curves compared to controls. An increased tidal breath will then preferentially increase the ventilation of parts that are to
be ventilated best, with a high ventilation-perfusion ratio. Dilution and an increased contribution of the well-ventilated parts during the whole expiration will decrease both types of slopes.
From these data it must be concluded that it is important to standardize to a fixed VT during natural breathing to increase the discriminatory power of both types of curves. In the PE,COz versus time curve in healthy controls the slopes of the alveolar plateaus at 1 I VT appeared to increase with frequency and expiratory flow (Results: 5). During steady state breathing the slope of the alveolar plateau of the PE,COz versus time curve is directly related to CO2 production [14]. Low frequency breathing, breath holding or low expiratory flows are known to result in reduced slope versus time values, most probably because an equilibrium is then approached between alveolar and mixed-venous partial pressures [11]. High frequencies and high expiratory flows result in larger slope values, probably because more volume displacement (= increased washout of CO2) prevents the establishment of an equilibrium between partial pressures of COz in alveolar air and mixed venous blood. High frequency and expiratory flow thus result in increases of the values in the direction of curves with airways obstruction.
The negative influence of increase of expiratory flow on the slope of the PE,COz versus volume curve in the controls can be explained on the basis of earlier investigations on regional emptying of the lung, performed with Xenon!33 [15]. Upper lung regions with high ventilation perfusion ratios then empty in an early phase of expiration, causing less change in the PE,COz versus volume course during the plateau phase. In artificially ventilated dogs the same influences of expiratory flow on the slopes of the PE,C02 versus time and volume curves have been described [11].
Because of the relationship with tidal volume we studied the relationship with TLC, FRC, height and age at a fixed volume. At 11 there appeared to be a significant relationship with TLC, FRC and height for both types of slopes in the healthy controls. TLC and FRC are well known for their relationship with height. No relationship was found with age, in contrast to other studies [8,9]; this may be because our study population was relatively small, and because a relatively large number of shorter persons were in the older age group, possibly influencing the statistical analyses. The study of age and height dependency needs to be further investigated in a larger group of healthy controls.
52

Slopes of the alveolar plateau of the time and volume based cap no gram
4.6. Conclusion
The slopes of the alveolar plateaus of PE,C02 versus time and PE,C02 versus volume curves are dependent on tidal volume, expiratory flow and height. The slope of the alveolar plateau of the PE,C02 versus volume curve at 1 I VT during natural breathing is preferable for the discrimination between healthy controls and patients with airways obstruction and shows a better quantitative relationship with the degree of airways obstruction. The relationship with height and age in healthy controls should be the subject of further study.
4.7. Refirenees
1 West JB, Fowler KT, Hugh-jones R O'Donnell IT Measurement of the ventilation-perfusion ratio inequality in the lung by the analysis of a single ex pirate. Clin Sci 1957; 16:529-547.
2 You B, Peslin R, Duvivier C, Dang Vu V, Grillat JP. Expiratory capnography in asthma: evaluation of various shape indices. Eur Respir J 1994; 7:318-323.
3 Dornhorst AC, Semple SJG. Automatic fractional analysis of expired air as a clinical test. Lancet 1353; :370-372.
4 Marshall R, Bates DV, Christie RV Fractional analysis of the alveolar air in emphysema. Clin Sci 1352; 11:237-307.
5 Kelsey JE, Oldham EC, Horvath SM. Expiratory Carbon dioxide concentration curve. A test of pulmonary jUnction. Dis Che>t 1362; 41: 438-503.
6 Vim Meerten RJ Expiratory gas concentration curves for examination of uneven distribution of ventilation and perfusion in the lung. Second communication: experiments. Respiration 1971; 28:167-185.
7 Smidt U. Emphysema as possible explanation for the alteration of expiratory P02 and peo2 curves. Bull Eur Physiopath 1376; 12: 605-624.
8 Hoffbrand BI The expiratory capnogram: a measure of ventilation-perfusion inequalities. Thorax 1366; 21:518-523.
9 Fletcher R. The single breath test for carbon dioxide. Thesis. Berlings, Arliiv, Sweden, 1980.
10 Fletcher R, Jonson B. Deadspace and the single breath test for carbon dioxide during anaesthesia and artificial ventilation. Efficts of tidal volume and frequency of respiration. Br J Anaesth 1384; 56:103-113.
53
Chaptet 4
11 Meyer M, Mohr M, Schulz H, Piiper J Sloping alveolar plateaus o/C02, O2, and intravenously info>ed Cft2 and CHCIF2 in the dog. Respir Physio11990; 81:137-152.
12 Fowler WS. Lungfilction studies. III Uneven pulmonary ventilation in normal subjects and in patients with pulmonary disease. J Appl Physiol1949; 2:283-299.
13 Dollfuss RE, Milic-Emilif, Bates DV. Regional ventilation o/the lung, studied with boluses of Xenon!33. Resp Physiol1967; 2:234-246.
14 Cochrane GM, Newstead CG, Nowell RV, Openshaw P. Wof/J CB. The rate of ri" of alveolar carbon dioxide pressure during expiration in man. ] Physio/1982; 333:17-27.
15 Milette B, Robertson pc, Ross WRD, Anthonisen NR. Effect of expiratory flow rate on emptying of lung regions. J Appl Physiol1969; 5:587-591.
4.8. Appendix
Table 1 Changes of the mean values of slopes (SEM) of the alveolat plateaus per I increase ofVT.
Table 2 Mean values of the slopes of the alveolar plateaus at 1 and 2 I VT in healthy controls and patient groups, expressed as percentage of PET, CO2 per second and per liter, and the mean expiratory flows between 60% and 90% of the expiratory volume.
Table 3 Mean values of the slopes of the alveolar plateaus at 1 and 2 I VT in healthy controls and patient groups, expressed as kPa.sec-1 and kPa.l- I , and the mean values of PET,C02 •
54

Slopes of the alveolar plateau of the time and volume based capnogram
Table 1 Mean changes pec second oc pec I (SEM) of the slopes of the alveolar plateaus
per I increase of tidal volume.
PE,C02 -Time abs. -Time norm.
(kPa.sec·1) (%.sec-1)
controls, -0.02 -0.03
nat.br.fr. (0.01) (0.33)
n:28
controls, 0.02 1.14
10.min-1 (0.01) (0.31)
n:27 .. controls, 0.03 1.70
I5.min- l (0.02) (0.44)
n:26 ... controls, 0.06 2.70 20.min- l (0.02) (0.47)
n:26 .. ... asthma patients -0.06 -1.20
during exacerbation (0.03) (0.76)
n:12 . asthma patients -0.04 -0.71
after recovery (0.03) (0.71)
n:5
moderately obstr. -0.15 -3.73 emphys. patients (0.03) (0.85)
n:9 .. .,
severely obstr. -0.32 -7.00
emph. patients (0.05) (1.07)
n:20 ... ... • p-value for test of hypothesis that the mean slope is zero:
*p<O.05; **p<O.Ol; **"p<O,OOl. Otherwise N.S.
55
-Vol. abs. -Vol. norm. (kPa.l~l) (%.l~l)
-0.22 -4.44
(0.03) (-0.72) .,. ... -0.19 -3.76 (0.02) (0.49) ... ... -0.20 -4.36
(0.02) (0.54) ... ... -0.17 -4.04
(0.03) (0.74) ... ... -0.51 -11.75
(0.06) (1.63) ... ... -0.39 -8.59 (0.11) (2.83) • •
-0.54 -13.72 (0.12) (2.81) ... .. -1.35 -29.07 (0.20) (-3.80) ... ...

Chapter 4
Table 2 Mean values (SEM) of the slopes of the alveolar plateaus in %.sec-' and%.I-'
and mean values of flow in the alveolar plateaus at 1 and 2 1 volumes.
Subjects slopes of alveolar slopes of alveolar flow in alveolar
plateaus in %sec1 plateaus in %.!"l plateaus in ml.sec 1
il 21 il 21 il 21
controls, 6.84(0.49) 6.81(0.46) 16.98(1.03) 12.53(0.63) 429(18) 627(40)
nat. br. &. n:28
controls, 5.61 (0.26) 6.75(0.30) 13.92(0.59) 10.15(0.432) 401(15) 748(29) IO.min- i
n:27 " " ... '"
controls, 7.48(0.41) 9.18(0.42) 15.40(0.77) 11.04(0.60) 509(19) 977(41) IS.min- l
0:26 " " '"
controls, 9.95(0.60) 12.64(0.63) 17.07(0.98) 13.03(0.59) 619(23) 1155(52) 20.min- i
n:26 '" " ... "
asthma patients 9.78(1.25) 8.59(0.97) 29.54(2.21) 17.79(1.78) 343(29) 507(45) during exacerbation
n:12 , ... " ,
asthma patients 7.39(1.05) 6.68(1.05) 21.24(3.61) 12.65(1.74) 375(59) 572(76) after recovery
n:5
moderately obstr. 13.38(1.12) 9.65(1.03) 32.51 (3.20) 18.80(1.05) 439(52) 572(71)
emph. patients
n:9
severely obstr. 12.89(1.07) 7.87(0.90) 41.47(2.32) 19.76(1.72) 323(22) 379(34)
emph. patients
n:20; at 21 n: 13 '" '" '" '" '"
• : p-valt1e given if there is a signjficant difference compared to mean values ill controls during natural breathing frequency.
* p<O.05; ** p<O.Ol:"u p<O.OOl.
56

Slopes of the alveolar plateau of the time and volume based capnogram
Table 3 Mean values (SEM) of the slopes of the alveolar plateaus in kPa.sec·1 and kPa.l· 1
and mean values of PET, CO2 at 1 and 21 volumes.
Subjects slopes of alveolar slopes of alveolar PETCOz in kPa
plateaus in kPa.sec l plateaus in kPa.I-1
11 21 11 21 11 21
controls, 0.30(0.02) 0.28(0.02) 0.75(0.05) 0.53(0.03) 4.42(0.13) 4.21(0.12)
oat.br.fr.
0:28
controls, 0.24(0.01) 0.26(0.01) 0.59(0.03) 0.40(0.02) 4.27(0.14) 3.92(0.14) 10.min-1
n:27 ... ... ... • m
controls, 0.30(0.02) 0.33(0.02) 0.60(0.03) 0.40(0.02) 3.97(0.13) 3.65(0.12) 15.min-l
n:26 • .. ... ... ... controls, 0.35(0.03) 0.41(0.02) 0.60(0.04) 0.43(0.02) 3.52(0.12) 3.29(0.12) 20.mio·1
n:26 .. ... ... ... ... ... asthma patients 0.39(0.04) 0.33(0.03) 1.22(0.09) 0.70(0.08) 4.19(0.20) 3.95(0.15)
during exacerbation
n:12 ... •
asthma patients 0.32(0.04) 0.28(0.03) 0.94(0.15) 0.55(0.07) 4.52(0.21) 4.35(0.17)
after recovery
n:5
moderately 0.51 (0.06) 0.36(0.04) 1.25(0.18) 0.71(0.09) 3.75(0.30) 3.67(0.31)
obstr. emph. patients
0:9 ... ... • •
severely obstr. 0.56(0.06) 0.31(0.03) 1.88(0.18) 0.82(0.11) 4.46(0.26) 4.13(0.30) emph. patients
n:20; at 21 n: 13 *** ... .. .. : p-value given jf there is a significant difference compared to mean values of controls during natural breathing frequency
* p<O.05; H p<O.Ol; *** p<O.OOI.
57


Chapter 5
Discriminatory power of dead space estimates from the
expiratory PC02 versus volume curve during spontaneous
breathing in healthy controls, asthma and emphysema patients
A.H. Kars, J.M. Bogaard, T. Stijnen, J. de Vries,
A.EM. Verbraak, C. Hilvering.
Submitted for publication


Discriminatory power of dead space estimates
5.1 Abstract
The discriminatory power of non-invasively determined dead space estimates was investigated in 28 healthy control subjects, 12 asthma and 29 emphysema patients (9 moderately obstructed and 20 severely obstructed). In one measurement session the relationship with tidal volume (VT) was assessed for the Bohr dead space (VD,Bohr), the Fowler dead space (VD,Fowb) and Pre Interface Expirate (PIE), obtained from the expiratory peol versus volume (PE,eOrvolume) curve. From the relationships with VT dead space values at I I were estimated. VD,Bohr at VT of I I showed the most significant difference between controls and patients with asthma and emphysema compared to the other two dead space estimates. Discrimination between no-emphysema (asthma and controls) and emphysema patients appeared to be possible on basis of a plot of intercept and slope of the relationship between VD,Bohr and VT, yielding a misclassification of one asthma patient and one moderately obstructed emphysema patient. VD,Bohr at I I vr showed a significantly better quantitative relationship with the degree of obstruction than the other two estimates. The influence of an enhanced frequency of20.min-1 in the controls resulted in an increase of the dead space estimates and overlap with the mean values in the emphysema patients for VD,Fowb and PIE.
The conclusion is that VD,Bohr derived from the expiratory PE,eo2-volume curve, in relation to VT is more informative than the other two estimates because it is better related to the degree of airways obstruction, is less liable to overlap with values in emphysema patients by changes in breathing pattern, and might have diagnostic value for the diagnosis emphysema.
5.2 Introduction
Expiratory partial pressure curves for CO2 can be characterized by three phases: phase 1 without alveolar air; phase 2 with rapidly increasing amounts of alveolar air; and phase 3, the alveolar plateau, which has a slightly positive slope in healthy persons. When plotted versus volume attempts can be made to divide the expired volume in a volume containing alveolar gas and a volume, called dead space without CO2 , Some approaches have been described to obtain dead space estimates non invasively. The first approach, using the single breath test for COl to determine the airway dead space, was published in 1928 by Aitken and Clark-Kennedy [IJ. They applied the same method on the expiratory peo2 versus volume curve as was done 20 years later by Fowler in the N2 versus volume curve [2]. Six fractions of expiratory gas were sampled, in each of which the peo2 was determined. The values were plotted versus the expiratory volume. A slight increase of Vo with the increase of tidal volume during exercise was found. In 1954 Bartels et al. compared dead space estimates with the Fowler method applied on curves ofN" He. CO2 and 02 [3]. For all gases they found almost the same values. Dead space decreased with increasing time of post-inspiratory breathholding. In 1980 Fletcher [4-6J advocated the use of the single breath test for CO2 , from which the Bohr
61
Chapter 5
dead space can be derived. In 1984 Wolff and Brunner described Pre Interface Expirate (PIE), a new method of series dead space estimation, based on differentiation of phase 2 [7,8]. PIE showed no dependence on VT under controlled ventilation [7]. The aim of our study was to investigate the discriminatory power of three types of dead space estimates, derived non invasively from the PET,C02 versus volume curve, VD,Bohr [4], VD,Fowler [2,3] and Pre-Interface-Expirate (PIE) [7], in healthy controls, asthma patients and emphysema patients. In one measurement session the dead space estimates were obtained both at fixed tidal volume and in relation to tidal volume (VT). In all healthy controls during natural breathing frequency and all severely obstructed emphysema patients the influence of previous manoeuvres was evaluated in breaths of about equal size, whereas in the controls also the effect of breathing frequency was investigated. Moreover, in the healthy control group the relationship between the three dead space measurements, at a fixed VT, and height and age, respectively; was investigated.
5.3 Methods
Study population, clinical diagnosis, pulmonary function tests, measuring equipment, experimental protocol as reported in Chapter 2
5.3.1 Dead space estimates
The three dead space estimates derived from the PET,C02 versus volume curve were calculated as follows:
1 (fig.5.la) VD,Boh, is the part of the expiratory volume (VE) without CO2, The assumption is made that PET, CO2 is equal to the alveolar PCOz.
A+B VEX-
A+B+C
C = VE X (1 - )
A+B+C
2 (fig. 5.1 b) VD,Fowler is calculated by forming a trapezium with the same surface area as the CO2 area under the curve, which is known (area C in fig. 5.1A)j the height of the trapezium decides the position of the line, which equals a and b. The slope of the alveolar plateau, the oblique side of the trapezium, is calculated between 60 and 90% of the expiratory volume. As the transition to phase 2 might be included in small breaths, only tidal volumes equal to or larger than 750 ml were selected for determination ofVD,Fowler.
3 (fig. 5.lc) Fot our PIE estimation, according to Wolff and Brunner [7], the following steps were performed: The data points of the Pco2-volume curve, used in the analysis, ranged from the start of expiration up to twice the volume defined by halfPET,C02.
62

Discriminatory power of dead space estimates
For the succeeding volume intervals (.1 V), the corresponding curve slopes were calculated. In this way a distribution function was estimated of .1P/ .1 V versus expired volume. PIE was defined as the mean volume, according to the distribution function.
r ~---.----------------~~, PET. C02 r
A
Fig.5.la
FeD2
1/2
1/2
FeD2
Fig.5.le
Fig. 5.1
--+V,
.... ~ H
:·1 H VE
, , .. ., .. . ,
VO.Fowler D --+V,
Fig.5.1b
FeD2
.F N
, ... ., . , , rP,Fi
• ",Vi
VE
m
LJlWllLW-----------_VE <Pie>
Graphic representations ofVD,Boh, (a), VD,Fowle< (b) and PIE (e). The PIE figures are copies of the late Prof. G. Wolff,
who gave permission to use his figures.
63
c

Chapter 5
5.3.2. Data analysis
Analysis of VD,Bohc, VD,Fowlec and PIE (figs. 5.1A,B,C) was done by computer in all breaths. A breath was rejected if there was a difference between in- and expiratory volume of more than 300 ml. In case ofVD,Fowler only tidal volumes equal to Of larger than 750 011 were evaluated, as has been explained before. Data analysis in controls (natural breathing and fixed frequencies) and patients (natural breathing only) included:
1. Calculation of the linear relationships between the three dead space estimates and VT, resulting in an intercept and slope (expressed a..<.:; the change in ml per 1 VT) of these relationships for each individual.
2. Comparison of the values of the respective dead spaces at 11 expiratory volume during natural breathing in the healthy controls with those of the patient groups. These values were obtained from the linear relationships with VT. Evaluation of the relationships of these values with FEVj (% predicted) and FEV/VC. Comparison of the values of the respective dead spaces at 1 I expiratory volume during natural breathing in the healthy controls with the values at 11 during fixed frequencies.
3. Evaluation of the influence of preceding breaths by calculating the mean values of endtidal PC02 and dead space values at start and after 5 min. Tidal volumes of about equal size were selected. This was only done in the healthy controls during natural breathing and in the severely obstructed emphysema patients.
4. Evaluation in the control group of the linear relationship between the three dead space estimates, at 11 VT, and height and age, respectively.
5.3.3. Statistical methods
Linear regression analysis was used to determine the relationship between the dead space estimates and VT, which resulted in an intercept and slope for each individual. From these linear regression equations the mean values of dead spaces at 1 and 2 I tidal volumes were calculated. To evaluate the influence of previous manoeuvres the linear relationship with time was determined for PET,C02 and the dead space estimates in VT ~ 750 ml and within a range of250 m!. The mean values at time 0 and after 5 min were compared. The relationships between dead space estimates at a fixed volume and respectively FEV I (% predicted), FEVJVC, height and age, were also evaluated with linear regression analysis. The two-sample t-test was applied to investigate differences between two groups. The paired t-test was applied to investigate differences within a group. Discriminant analysis was applied on intercept and slope of the relationships between the three dead space estimates and VT in healthy controls and severely obstructed emphysema patients.
64

Discriminatory power of dead space estimates
5.4. Results
1. The average increase per I VT (slope value of the linear regression analysis) of the three dead space estimates are presented in Table 5.1. In all cases, except VD,Fowler in the severely obstructed emphysema patients, the mean slopes of the regression lines relating the dead space estimate with VT were positive and significantly different from zero (p values ranging from <0.05 to <0.001). The increase ofVD,Bohr was in all groups in the same range and markedly larger compared to the increase per liter of VD,Fowler and PIE. Significantly larger values (p<O.05) compared to the values in healthy controls during natural breathing were found only for the increase in VD,Bohr in asthma patients during exacerbation. The increase per liter of the other two dead space estimates did not differ significantly in the patient groups compared to the controls. Although in the emphysema patients the increases of VD,Fowler and PIE with VT were lower than in the other patient groups, no significance was reached for the differences with the controls during natural breathing frequency.
Table 5.1 Mean changes (b) with SEM of dead space estimates per I VT: VD= a + b x VT
VD,Bohr in mlli VD,Fowler in mIll PIE in mlli (SEM) (SEM) (SEM)
controls, 184 (10) 30 (4) 39 (7) natural breathing (n=28)
asthma patients 225 (16) • 36 (11) 30 (8) during exacerbation (n= 12)
asthma patients 192 (19) 35 (10) 41 (5) after recovery (n=5)
moderately obstructed 180 (16) 26 (7) 14 (5) emphysema patients (n=9)
severely obstructed 185 (14) 11 (12) 21 (9) emphysema patients (n=20)
" : significant difference compared to the valucs in hcalthy controls (p<O.05).
In Table 5.2 the mean values of the intercepts are presented. For all dead space estimates there were significant differences of the mean values of both groups of emphysema patients.
65

Chapter 5
Table 5.2 Mean intercepts (a) with SEM of relationship between dead space estimates and VT:
controls,
natural breathing (n=28)
asthma patients
during exacerbation (n'" 12)
asthma patients
after recovery (n=5)
moderately obstructed
emphysema patients (n=9)
severely obstructed
emphysema patients (0=20)
VD=a+bxVT
VD,Bohr in ml VD,Fowler in ml
(SEM) (SEM)
26 (12) 125 (6)
11 (12) 97 (13)'
31 (9) 117 (14)
115 (27)" 185 (28)"
115 (14)*** 18500***
PIE in rul (SEM)
113 (9)
97 (12)
118 (28)
215 (36)***
196 (13)***
significant differences compared to the values in controls: *: p<O.OS; .*: p<O.O I; ***: p<O.OO I
400
300 @
0
0
++ ~ 0
+ + m 200 t C-O Ui • +-0 + X 0
0 0
100 0 X + 0
+ + 0
-110 -10 90 190 290 390
Fig. 5.2 Intercept (ml)
Slope versus intercept of the relationships ofVD,Bohr with VT in healthy controls (D), asthma patients during exacerbation ( 0 ) and emphysema patients (severely obstructed
emphysema patients (+); moderately obstructed emphysema patients (x». --- : discriminant line, determined with discriminant analysis
applied on intercept and slope of the relationships between VD,Bohr and VT in healthy controls and severely obstructed emphysema patients.

Discriminatory power of dead space estimates
On the basis of slope and intercept of the relationships of the dead spaces with VT discriminant analysis was best for VD,Bohr in separating healthy controls from severely obstructed emphysema patients (fig. 5.2). Thtee of the healthy controls wete misdassified, as were 2 of the severely obstructed emphysema patients (in case of VD,Fowl" 5 and 4, in case of PIE 4 healthy controls and 4 sevetely obstructed emphysema patients). The discriminant line appeared to locate all but one moderately obstructed emphysema patient at the emphysema side of the line, and all but one asthma patient with exacerbation at the healthy control side of the line (for VD,Fowler misdassification: 4-1, and PIE: 3-1, for moderately obstructed emphysema patients and asthma exacerbation patients, respectively).
400
300
E 200
100
VO,Bohr VD,Fowler Pie
Fig. 5.3 Bar histogram of mean values with SEM (vertical line) for
VD,Boh" VD,Fowle, and PIE at 1 I VT in healthy controls (first bar), asthma patients during exacerbation (second bar) and after recovery (third bar),
moderately obstructed emphysema patients (fourth bar) and severely obstructed emphysema patients (fifth bar), respectively.
Significant differences compared to the values in healthy controls are indicated: *:p<O.05; **:p<O.Ol; ***:p<O.OOl.
2. In fig. 5.3 the mean values and SEM of the three types of dead space estimates at 11 VT are presented for healthy controls and patient groups (5.8. Appendix, Table 1 shows the numerical data at 1 I VT, and at 21 VT to illustrate the effects of volume increase).
67

Chapter 5
The mean VD,Bohr values at 1 I were significantly higher than those for VD,Fowler and PIE (p<O.OOl), the latter estimates showing no significant difference. Compared to the values in healthy controls during natural breathing significant differences were present in all patient groups with airways obstruction only for VD,Bohr; thus on average, VD,Bohr was most discriminating. The relationship between the volumes of the three dead spaces at 11 VT and FEV} expressed as a percentage of predicted and as a percentage of the actual VC was significantly negative. The best correlation was found between VD,Bohr and FEV,IVC (fig. 5.4) with r:-0.66 (p value<O.OOOI) versus -0.32 (p<O.01) and -0.43 (p<O.OOI) for VD,Fowler and PIE, respectively.
530
0
430 >-> 0
D~ ~ ~ ~
10 0
330 " .c 0 0
0 0 "' OJ Dci' DOD DO D' c:r > 0
0 '" DO '" 'b
230 . ". . DoD "" 0 DO 0
0 00 dl 00 1>. 00 0
0 0
0 ' . • .p.
130
0 20 40 60 80 100 FEV, Ive (%)
Fig, 5.4 Relationship between VD,Bohr at II VT and FEV1IVC in the study population.
The relationship is: VD,Boh, (ml)= 342 - 1.71 x FEV/VC (%), p<O.OOOI, R2: 0.43.
In figure 5.5 the effects of breathing frequency on the three dead space estimates at 1 I VT in the controls are presented (5.8. Appendix, Table 1 shows the numerical data). Comparison is made with the values during natural breathing, which included a frequency of about 15 per min in the short period before the breathing manoeuvres (fig. 2.1). At a breathing frequency of 10 per min a slight decrease of all dead space estimates at 1 1 VT was found. This was significant for VD,Fowler and PIE. At a frequency of 15 per min changes were not significant, whereas during an increased breathing frequency of 20 per min a significant increase of all dead space estimates was found, resulting in overlap with the values of emphysema patients for VD,Fowler and PIE, but not for VD,Bohr.
68

Discriminatory power of dead space estimates
250
200
150
100
50
o
VO,Bohr VO,Fowler Pie Fig. 5.5
Bar histogram of the mean values with SEM for VD,Bohr, VD,Fowler and PIE at 1 I VT in healthy controls during natural breathing (first bar)
and at fixed frequencies of 10,15 and 20 per minute (second, third and fourth bar). Significant differences compared to the values during natural breathing frequency
are marked: * ::: p<O.05; ** ::: p<O.Ol; *** ::: p<O.OOl.
3. In 22 healthy controls and 15 severely obstructed emphysema patients enough (7 or more) breaths with volumes of about equal size could be obtained for evaluation. In both groups aJter 5 min there was a significant decrease of PET , CO" 0.97 kPa (SEM:0.14) and 0.33 kPa (SEM:0.08) in healthy controls (p<O.OO 1) and emphysema patients (p<O.OOI), respectively. In the 22 healthy controls the calculated mean value of the selected VTs was 896 ml (SEM: 24). In the 15 emphysema patients the mean value of VT was 1004 ml (SEM: 76). The values of the three dead spaces were not changed after 5 minutes.
4. In the healthy controls there was at 1 I VT a significantly positive correlation of the three dead spaces with height. The increase per 10 em height was about 20 m!. The linear regression equations were:
VO,Boh, (ml) -123 + (194 x height in m); r:0.67, p value <0.001 VO,Fowlec (m!) -219 + (218 x height in m); r:0.68, p value <0.001 PIE (ml) -300 + (263 x height in m); r:0.70, p value <0.001
No relationship between the dead spaces at 1 I VT and age was found.
69

Chapter 5
5.5. Discussion
Comparison of the three dead space estimates in healthy controls, asthma and emphysema patients in relation to VT resulted in higher values with more increase per 1 VT for VD,Bohr in all groups. The relationship between intercept and slope ofVD,Bohr versus VT allowed to discriminate rather well between no emphysema (healthy controls and asthma patients) and emphysema. The dead space values at 1 I VT were significantly higher in all groups with airways obstruction only for VD,Bohr, which also showed the most significant relarionship with airways obsrruction expressed as FEVj (% predicred) or FEVj/VC. Increased breathing frequency in the controls resulted in an overlap with the values in emphysema patients for VD,Fowler and PIE, but not for VD,Bohr. All estimates showed an increase af20 ml per 10 em increase of height in the controls. VD,Bohr, VD,Fowler and the more recently described PIE were chosen as estimates because they can be obtained noninvasively and are applicable in routine pulmonary function testing. The varying VT in one measurement session was chosen to increase the discriminatory power.
The results can be interpreted as follows:
1. The increase of anatomic dead space in healthy controls, estimated with the Fowler method in N2 and CO2 versus volume curves has been reported as 20-30 ml per I VT increase [9,10], which is in agreement with the values we found for VD,Fowler and PIE. The increase per liter for VD,Bohr is larger, but we are not aware of published reports, probably because VD,Bohr is usually expressed as VD/VT with normal values below 30%, which decrease with increase ofVT [9,10], The larger values for the increase per I VT ofVD,Bohr can be explained by the fact that besides the conducting airways, a part of the alveolar dead space contributes to its value. Although in fig. S.lA phase 1 will only increase slightly with increasing VT, the area outside the remaining PC02-
volume curve will increase progressively and so cause an increase in YD. As can be seen in fig. 5.1 Band 5.1 C, VD,Fowb and PIE are more closely related to rhe volume of the conducting airways. This also explains the lower increase with VT compared with VD,Bohr. The increase per liter was not significantly different in the patient groups, compared to the controls, for any of the three separate dead space estimates except for the significantly larger increase per liter of VD,Bohr in asthma patients during exacerbation. This may be due to an increased contribution of the alveolar dead space in these patients compared to the other groups. The lack of significant differences for the increase per liter in the emphysema patients may be explained by the similar behaviour of the conducting airways in case ofVD,Fowler and PIE. The lack of differences for VD,Bohr, despite the larger absolute values in the emphysema patients, may be explained by a comparable behaviour of the alveolar dead space component at increasing VT in healthy controls and emphysema patients. Maximal discrimination between healthy controls and severely obstructed emphysema patients was possible when the slopes were plotted against the intercepts of the relarionship between VD.Boh, and VT (fig. 5.2). In that case, both the differences in absolute values for VD,Bohr at equal lung volumes and the changes with VT have an additive effect on the discriminatory power. Almost all moderately obstructed
70

Discriminatory power of dead space estimates
emphysema patients were located at the emphysema side of the line, whereas the asthma patients were located at the healthy control side of the line, suggesting diagnostic value of this dead space measurement for the diagnosis emphysema. The steeper slopes of the relationship ofVD,Bohr with VT of the asthma patients with exacerbation. as shown in Table 5.1, are also seen in figure 5.2.
2. The values for VD,Bohr at 11 volume showed the most significant differences between controls and the pathologic states with airways obstruction, including asthma exacerbation (fig. 5.3). whereas a quantitative relationship was found w.ith the degree of airways obstruction (fig. 5.4). The higher VD,Boh, values at fixed VT in the obstructive patients compared to the healthy controls can be attributed mainly to the steeper slopes of the alveolar plateau in these patients compared to healthy controls, which result in larger contribution of alveolar dead space to VD,Boh, (fig. 5.1A). A quantitative relationship between the slope of the alveolar plateau and VD/VT was described by Fletcher [4] and Hoffbrand [II] in COPO patients, whereas in emphysema patients also a larger contribution of phase 2 to the expired volume was found [12.13]. The "effective" or physiologic dead space as most reliable index of effective dead space ventilation requires arterial blood sampling [14]. Because our study was aimed at the comparison of non invasively determined dead space estimates. physiologic dead space was not determined.
The values for VD,Fowler and PIE at 1 I VT were almost identical; this is not suprising as they are both related to analysis based on phase 2, and aimed at an anatomical separation between alveolar and airway gas. Distension of central airways and peripheral movement of the diffusion front at increasing VT cause the increase of both VD,Fowler and PIE. The resulting PE,co2-voiume pattern then shows an increase of the phase 2 volume [12,13J. At 1 I volumes there were significant differences compared to the controls only in the emphysema patients. This may be explained by the increased volume of phase 2 in these patients [12,13], increasing both the PIE and VD,Fowle, estimate. Wolff et al. [8J recently compared their PIE estimates with, among others, VD,Bobe. In spontaneously breathing subjects they found mean values for PIE and VD.Bohr of 179 ml (SO: II) and 236 ml (SO: 26), respectively at a VT of 967 ml (SO: 134), which did not differ significantly from the data we found at I I VT: 152 ml (SEM:7) and 210 ml (SEM:6), respectively. In 8 COPO patients Wolff's group found in breaths of 569 ml (SO: 55) for PIE and VD,Boh, 183 ml (SO: 8) and 217 ml (SO: 15), respectively. If we extrapolate our dead space estimates in the severely obstructed emphysema patients to a VT of 600 ml, we find comparable values: 209 ml (SO: 50) and 226 ml (SO: 42) for PIE and VD,Boh" respectively.
Although an absence of breathing rate dependence on anatomic dead space estimates has been reported [15], mostly a slight increase with breathing frequency has been found [2,10,16], which is in accordance with our data. In healthy controls an increased breathing frequency of 20 min-1 even resulted in overlap of the values at 1 1 with the values of emphysema patients for VD,Fowler and PIE. An explanation can be given by
71

Chapter 5
assuming a shift of the diffusion front, the area where gas convection and diffusion meet, in peripheral direction during fast inspiration, and in central direction during relatively breathholding. During artificial ventilation in dogs Meyer et al. found an effect of expiratory flow on the anatomic dead space, which increased with a flow increase. Slow expiration was found to exert similar effects as breathholding [17].
3. Although a significant decrease of PET,C02 occurred during the manoeuvres in both healthy controls and severely obstructed emphysema patients, no significant change could be detected concerning the mean values of the three dead space estimates at the selected tidal volumes?: 750 ml and within a range of 250 ml. This means that our measurement procedure aimed at the estimation of a wide range ofVD measurements in relation to VT did not influence the accuracy of the final results.
4. Assuming that in healthy controls the physiologic dead space almost equals the anatomic dead space, the relationship with height is in agreement with reports in the literature, which show an increase of the physiologic dead space in healthy controls of 17 ml per 10 cm height [10], whereas we found about 20 m!. In the ptesent study no significant relationship with age was found, but increase in physiologic dead space was reported in one study to be 8 and 9 ml per 10 years of age in healthy women and men respectively [18].
5.6. Conclusion
VD,Bohr, derived from the PE,coz-volume curve, at a standardized volume of 1 I VT as derived from the relation with VT is more informative than VD,Fowler and PIE in the discrimination of patients with airways obstruction from healthy controls during spontaneous breathing. VD,Bohr appeared to be most significantly related to the degree of airways obstruction and is less sensitive to overlap with values in healthy controls by variation in breathing frequency. A plot of intercept versus slope of the relationship between VD,Bohr and VT was most discriminating in the separation of healthy controls and asthma patients on the one hand and emphysema patients on the other hand. In this way valuable diagnostic information can be obtained within one measurement session. VD,Fowler and PIE are almost identical derivates of the PE,cOz-volume curve, both linked to the volume of the conducting airways, whereas VD,Bohr is strongly influenced by the alveolar dead space, which causes at the same time the larger diagnostic applicability.
5.7. References
1 Aitken RS, Clark-Kennedy AE. On the fluctuation in the composition of the alveolar air during the respiratory cycle in muscular exercise. J Physiol, London 1928; 65:389-411.
2 Fowler WS. Lungfonctiom studies. II The respiratory dead space. Am J Physiol1948; 154:405-416
72
Discriminatory power of dead space estimates
3 Bartels j, Severinghaus]V« Forster HE, Briscoe WA, Bates DV The respiratory dead space measured by single breath analysis of oxygen, carbon dioxide, nitrogen or helium. J Clin Invest 1954; 33..41-48.
4 Fletcher R. The single breath testforcarbon dioxide. Thesis. Berlings, Arlov, Sweden,1980.
5 Fletcher R, Jonson B, Cumming G, Brew J The [Oncept of deadspace with special reference to the single breath test for carbon dioxide. Br J Anaesth 1984; 56-77-87.
6 Fletcher R, Jonson B. Deadspace and the single breath test for carbon dioxide during anaesthesia and artificial ventilation. Efficts of tidal volume and ftequency of respiration. Br J Anaesth 1984; 56;109-119.
7 Wo!ff G, Brunner JX Series dead space volume assessed as the mean value of a distribution fonction.lntfClinMon &Comp 1984; 1;177-181.
8 Wo!ffG, Brunner Jx, Weibel W, Bowes CL, Muchenberger R, Bertschmann W Anatomical and series dead space volume: concept and measurement in clinical praxis. Appl Cardiopulm Pathophys 1989; 2.299-307
9 Bouhuys A. Respiratory dead space. Handbook of Physiology; American Physiological SociefJ\ Washington, D.C. 1964. Section 3: Respiration: 1: 28:699-714.
10 Nunn JF Nunn's Applied Respiratory Physiology. Fourth edition 1993. Butterworth-Heinemann Ltd., Oxford, England.
11 Hoffbrand BI The expiratory capnogram: a measure ofventilation-perfosion inequalities. Thorax 1966; 21.518-523.
12 Worth H. Expiratory partial pressure curves in the diagnosis of emphysema. Bull Eur Physiopathol Resp 1986; 22; 191-199.
13 KarsAH, Goorden G, Stijnen T, BogaardJM, VerbraakAFM, HilveringC. Doesphase 2 of the expiratory PC02 versus volume curve have diagnostic value in emphysema patients compared to asthma patients and healthy controls? Eur Respir J 1995; 8:86-92.
14 EnghoffH. Volumen inefficax. Bemerkungen zur Frage des schiidlichen Raumes. Upsala Liikaref Forh 1938; 44;191-218.
15 Hatch T, Cook J(fof, Palm PE. Respiratory dead space. f Appl Physiol1953; 5341-347
16 Lifihay A, Fast Cw, Glazier JB. Effiets of changes in respiratory pattern on physiological dead space. f Appl Physiol1971; 31;478-483.
73

Chapter 5
17 Meyer M, Mohr M, Schulz H, Piiper J Sloping alveolar plateaus o/C02> °2> and intravenously infosed C2H2 and CHCIF2 in the dog. Resp Physiol1990; 81:137-152.
18 Harris £4, Hunter ME, Seelye ER, Vedder M, Whitlock RML. Prediction of the physiological dead space in resting normal subjects. Clin Sci 1973; 45:375-386
5.8. Appendix
Table 1 mean values ofVD,Boh<, VD,Fowlec and PIE at 1 and 21 VT in healthy controls and patient groups.
74

Discriminatory power of dead space estimates
Table 1 Mean values (SEM) ofVD,Boh" VD,Fowl., and PIE in ml at 1 and 21 volumes.
Subjects VD,Bohr in ml VD,Fowler in ml PIE in ml (SEM) (SEM) (SEM)
II 21 II 21 II 21
controls, 210(6) 394(11) 154(6) 184(9) 152(7) 190(11)
nat.br.fr.
n:28
controls, 195(9) 369(10) 136(7) 179(8) 132(7) 166(9)
10/min
n:27 .. .. • .. controls, 213(6) 399(11) 159(7) 201(10) 162(11) 222(28) I5/min
n:26 •••
controls, 236(6) 427(9) 175(9) 228(12) 187(9) 232(10)
20/min
n:26 **. ** *' '*. .*' **
asthma patients 237(8) 462(23) 133(9) 168(15) 127(14) 157(20) during exacerbation
n:12 • .. asthma patients 223(17) 415(35) 153(16) 188(23) 158(27) 199(27) after recovery
n:5
moderately obstr. 295(22) 475(28) 212(29) 238(31) 229(37) 243(38)
emph. patients
n:9 '*. '* *' • *'
severely obstr. 300(9) 490(26) 196(7) 214(18) 218(12) 246(18)
emph. patients
n:20; at 21 VT n:13 *'. ... *'. ... '*
: significant difference compared [Q mean values of controls during natural breathing frequency
* p<O.OS; ** p<O.OI; H. p<O.OOl.Chapref 6
75


Chapter 6
General discussion

General discussion
The studies described in this thesis were performed in order to establish the role of capnography as a non-invasive pulmonary function test by investigating whether it is possible to distinguish by capnography emphysema patients on the one hand ftom healthy controls and asthma patients on the other, as was suggested in earlier reports [I -4]. In capnogtaphy three phases can be recognized: phase 1 without alveolar air, followed by a steep rise, the transition (phase 2) to the next phase, the almost horizontal alveolar plateau (phase 3). Computerization of data made it possible to analyze each breath in many ways with only COz versus time and flow versus time in store (5). An example is shown in figures 6.1 and 6.2 with data obtained ftom a healthy control subject and a patient with severe pulmonary emphysema.
In these figures, A shows volume versus time and B shows PE,eoz versus time. Data obtained from the last breath are presented in the legends and in C, D, E, F and G. C represents the PE,eoz versus time curve and D represents the PE,eoz versus volume curve; 60 and 90% levels of expired volume are indicated by vertical lines. E shows the first derivative of the entire PE,e0z-volume curve (dP/ d V) versus volume. F shows the flow-volume curve and G shows an extended version of that part of the first derivative of the PE,eOz versus volume curve which is used for the calculation of PIE.
An early diagnosis of emphysema is important because destruction of alveolar walls is irreversible and progress can be delayed by a change of lifestyle, particularly by cessation of smoking. Emphysema may be suspected in an elderly smoker or ex-smoker with dyspnoea on exertion, coughing and wheezing together with pulmonary function tests demonstrating airways obstruction and a chest roentgenograph showing signs of hyperinflation and alveolar destruction. However, the sensitivity of the plain roentgenograph of the chest is low and can demonstrate severe degrees of pulmonary emphysema unequivocally [6J. High resolution computed tomography (HRCT) is a far more sensitive roentgenographic technique for demonstration of pulmonary emphysema; however, it is expensive and not always available whereas its results are as yet difficult to express quantitatively [7-1 OJ.
A combination of pulmonary function tests may show a characteristic pattern in moderate to severe emphysema, but no single pulmonary function test is diagnostic by itself [11-l3J. Though the capnogram shows a characteristic shape in emphysema patients, quantitation of these changes is difficult [1,2]. The latest promising developments were calculations on phase 2 of the PE,eOrvolume curve. The volumes expired betvleen 25 and 50% and betvleen 25 and 75% of PET,eOz were larger and increased more with increase of tidal volume in the chest X-ray of selected emphysema patients than in asthma patients and healthy conttols [3,4]. These results formed the basis for the evaluation of the diagnostic applicability of capnography in emphysema patients. Besides phase 2 variables, also phase 3 and dead space estimates derived from the peoz versus volume curve were compared in healthy controls and patient groups.
79
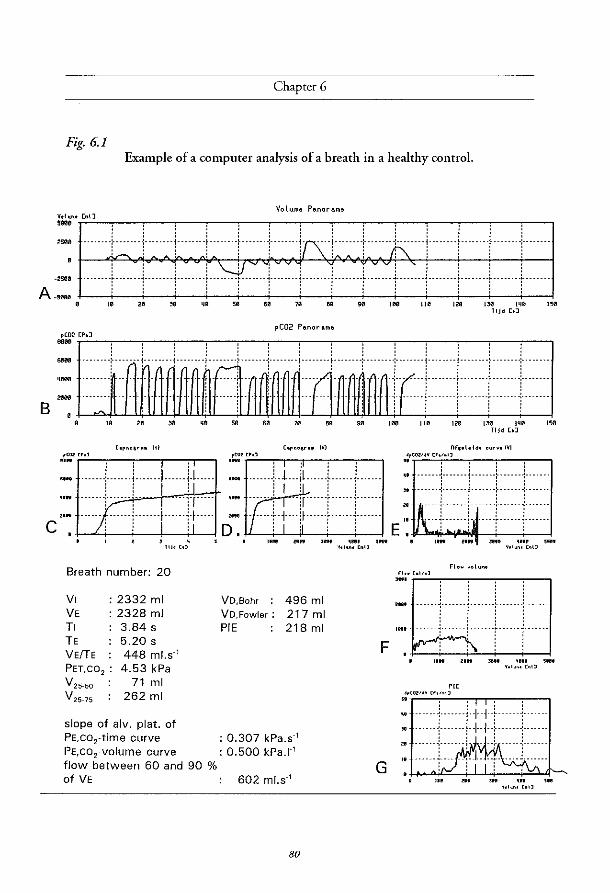
Chapter 6
Fig. 6.1 Example of a computer analysis of a breath in a healthy control.
" " "
, , ! , ~
c:}:ii! Breath number: 20
VI : 2332 ml VE : 2328 ml TI 3.84 s TE VElTE PET,C0 2 : V
25_50
V 25-75
5.20 s 448 ml.s" 4.53 kPa
71 ml 262 ml
slope of alv. plat. of PE,co2-time curve PE,co 2-volume curve flow between 60 and 90 % of VE
VolUfII! Panorama
pC02 Pallor Ilflla
" " " " , .. '" '" 1311 1111'1 '" C'po.sr,,. IV)
.~! tM
: ~ l~ : : ._ _._._.+.l_._jl._._.+_._._.+._._._
, I Jl-' ,
~~ Ir:+:-;:::::r:: 110\1 .. " J", '''' ""
VO,Bohr :
VD,Fowler :
PIE
496 ml 217 ml 218 ml
: 0.307 kPa.s" : 0.500 kPa.I"
602 ml.s"
80
•• "ft, [n"
F
G
11 Jd [.J
IIf,.I.IM ourv.IVI
~'r'~c.:":':"c.:"FiR''''' -",--,,--,,---, .. -'-"'1""-----l--""-i---"-1"-'-'-'
E ~ i:r::r::::r::::r:: 1.,11 n.. J'" ~""~ 5'"
•• '"ft, ["'~
~;'T"::':"::"--,----,---,--",,---,
, , ,
:: "']"":--'r:·i ··
11011 U"
'" •• '"~"v [','n')
::!Hmi~""';'++r""+""'L 31 ···.--r-.-.··l-+-i--i···----r------ZII ..... -~-"-"-.-; - --} -----~-------
I •. _---+--- __ ;_-1.. .. ~ .... -~.-.-.-. II , 0' , , ,
• 'II ... ,... UII , ..
• ,,"", [n"
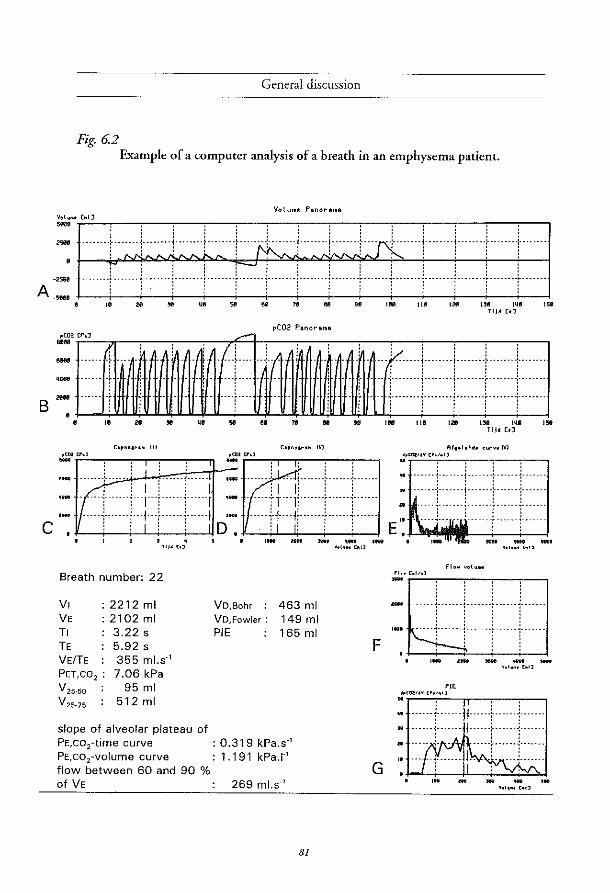
General discussion
Fig. 6.2 Example of a computer analysis of a breath in an emphysema patient.
Volu .. e Panora .. a V.IO ... ;'::.'.:.'_.,-_-, __ .,-_-, __ .,-_-, __ .,-_-, __ .,-_-, __ .,-_-, __ ..,.-_-,,-_,
:: I'" . i ..... +~~ 1 =1' ~. i .... j ..... ; ~. ~. i' .... i .... IS· .... ! .... "i" ... L .... i .. · .. ·1 A:::: . F J .}. E ... r:±J·· Ill .... j ...... T" ... ~ .... f ...
S
c
10 20 ~ ijll 51! 8e 78 811 911 Ililil 1111 12fI 1311 I~II 158 TlJd c.J
pC02 Panorama pC02 [P.J ....
.... . .... j ........ , ........ } ........ : ....... .
. - . .. ~ ........ L. ...... L ..... j ...... ".L .... " . "" • • " "
c.p ....... IH ,0,,", cr.J .-
" " ,enl cr.J .-
.. .. "
, , , .-1 ·.· .... ·.: .. ·':,',,',.·· .. :: ..... :1 D'-: ' 1 .•. r"!"!"" ... ·· .. ·,,! .. II -iT·lj···r···j···· ..... 1+ .. 11 ..... [ ...... 1 ..... .
~-+--i-.L.j..---i----l1 . -
. , "I' (,J
Breath number: 22
I"'" lIH _, "" I_ •• , ... [~!l
: : : : i ~ ........ ~ ........ : ........ ~ ........ : ....... . i j iii
, .. '" '" ". Rf •• loldo curvo IVI
~'T'~"'''''.!:'':; .. :::·'.c' -,--.,---,---,
........ : ....... !"" .... :- ..... : ..
·····+······1······+·····+······ : : : : ,. . ::::L:····i::::::r:::::~::::::·
EI:~""~III
fl._ C.I/,J - fl ... v.lu ...
, , , VI 2212 ml VE 2102 ml TI 3.22 s TE 5.92 s
355 ml.s·'
VD,Bohr
VD,Fow!er :
PIE
463011 149011 165 ml F ~~···r ..
VElTE PET, CO 2 : 7.06 kPa V 25.50 95011 V25-75 512 ml
slope of alveolar plateau of PE,co 2-time curve PE,co2-volume curve flow between 60 and 90 % of VE
: 0.319 kPa.s·' 1.191 kPa.I·'
269 ml.s·'
'" ~':;.'.::'::: .. ..:"c; .. ;::"'..:'-~-..,.--....,.-...,
. 1: •••• [ •••... j ..... . "
... '-i'-'::: 1::::::: G
'" o.
81

Chapter 6
The emphysema patients were selected on the basis of chest X-ray signs described by Pratt [14], and could be divided in patients with severe (FEV, < 1.41) and moderate airways obstruction (FEV] ~ 1.4 1), suggesting more and less extensive emphysema respectively [13]. Because in asthma patients during an exacerbation the same degree of airways obstruction may be present, a number of these patients was investigated as a check on the validity of the tests: these patients have no emphysema; their reversible airways obstruction is caused by narrowing of airways due to inflammation, muscle contraction and mucus. A group of healthy subjects of different ages served as the control group. In this group the effect of different breathing frequencies upon the variables involved was evaluated, to see whether the breathing pattern might cause abnormal values or even overlap with the emphysema patients.
The results of investigations concerning the phase 2 variables V 25-50 and V 25-75 in relation to VT showed that by application of the V25-50 versus VT telationship, only the severely obstructed - and not the moderately obstructed - emphysema patients could be separated from healthy controls and asthma patients during exacerbation. A breathing frequency of 20.min-1 in the controls resulted in an overlap with the severely obstructed emphysema patients. V25-75 appeared not to be restricted to phase 2, but to extend into phase 3, which resulted in overlap of asthma patients during exacerbation and emphysema patients. Both variables were considered to be unsuited to diagnostic application. Deviation of the trumpet model, held responsible by some authors [1,3.4] for the increase of the phase 2 variables in emphysema patients, probably means an oversimplification. Moreover the phase 2 variables depend on the slope of phase 3 as well.
The slopes of the alveolar plateaus (Phase 3), of the time and volume based capnogram were compared in the four groups. The slopes of the alveolar plateaus of the two types of curves showed a negative relationship with VT in the emphysema patients, which promted us to compare the values obtained in the patient groups and controls at fixed tidal volumes of 1 and 2 I. The slopes of the alveolar plateaus of the volume based capnogram showed significant differences in all patient groups with airways obstruction compared to controls for both volumes. However, the differences were less evident at 21 than at 11. In the time based capnogram the values of the slopes showed significant differences only at 1 I VT, whereas the differences almost disappeared at tidal volumes of 2 1. The slopes of the alveolar plateaus of the volume based capnogram were more linear than the slopes of the time based capnogram, due to the elimination of the influence of the typical flow pattern in emphysema patients. An increased breathing frequency of 20.min-1 in the healthy controls caused an increase of the slopes of the alveolar plateaus of the time based capnogram, i.e. in the direction of airways obstruction, in contrast to the slopes of the alveolar plateaus of the volume based capnogram, which did not change. At 1 I VT in the controls there was a significant relationship with height for both types of slopes, but not with age. When all subjects were taken together there was a significant relationship for both types of slopes at 1 I VT with FEV, (%pred) or FEV/VC, the relationship of the slopes of the alveolar plateaus of the volume based capnogram being closer. For clinical application,
82

General discussion
these data suggest that the slope of the alveolar plateau of the volume based capnogram in a small tidal volume discriminates better than the slope of the alveolar plateau of the time based capnogram. The relationship with height deserves evaluation in additional healthy controls of different heights and ages.
Dead space estimates, derived from the PE,COz versus volume curve, VD,Bohr [15]. VD,Fowler [16,17] and Pre Interface Expirate (PIE) [18,19], were evaluated in the same groups. On the basis of a plot of slope versus intercept of the relationship between VD,Bohr and VT, it was possible to separate emphysema patients (severely obstructed as well as moderately obstructed) from healthy controls and asthma patients. VD,Bohr at 1 I VT showed a higher degree of correlation with severity of airways obstruction than the other two estimates. The higher VD,Bohr values at fixed VT in the obstructive patients compared to healthy controls can mainly be attributed to the steeper slope of the alveolar plateau in these patients, which coincides with an increase of alveolar dead space. Alveolar dead space contributes more to VD,Bohr than to any of the other two dead space estimates. These latter estimates are more closely related to the morphology of conducting airways, which explains their similar behaviour in relation to tidal volume.
In this study, the diagnostic application of capnography was extended by making use of the volume dependency of either phase 2 variables, slopes of the alveolar plateaus or dead space variables, in one measurement session. Because a prolonged and sequential performance of breathing manoeuvres causes a person to hyperventilate, it is of the utmost importance, that the derived variables are not influenced by the procedure itself. Although PET, COl indeed decreased gradually during the procedure, we found no influence on the slopes of the alveolar plateaus and the dead space estimates.
The results of these studies indicate the value to further investigate the usefulness of VD,Bohr as a diagnostic indicator for the presence of emphysema. To this end, patients with less severe emphysema, who are to undergo surgery for bronchial carcinoma, should be examined. For these patients, CT-scans as well as histologic material are available for comparison with the results of physiological findings.
Clinical application of capnography can be worthwile in patients who are not able to
perform maximal effort [20], because a good relationship with the degree of airways obstruction exists for the slope of the alveolar plateau of the volume based capnogram and VD,Bohr at a fixed tidal volume.
6.1. Refirences
1 Smidt U. Emphysema as possible explanation for the alteration of expiratory P02 and peD2 curves. Bull Eue Physiopathol Resp 1976; 12: 605-624.
83

Chapter 6
2 Vtin Meerten RJ Expiratory gas concentration curves for examination of uneven distribution of ventilation and perfusion in the lung. Second communication: experiments. Respiration 1971; 28: 167-185.
3 Worth H Zur diagnostik des lungenemphysems. Analyse des mischluftanteils expiratorischer partialdruckkurven von He, Ar, SF6 und CO2, Copythek Thieme, Stuttgart - New York, 1985.
4 Worth H. Expiratory partial pressure curves in the diagnosis o/emphysema. Bull Eur Physiopathol R"p 1986; 22: 191-199.
5 Verbraak AFM, Roorn E, de Vries j, Bogaard JM, Versprille A. A lung function information system. j Biomed Eng 1991; 13: 27-34.
6 Thurlbeck WM, Simon G. Radiographic appearance a/the chest in emphysema. Am J Roentgenol 1978; 130: 429-440.
7 Murata 1(, ftoh H, Todo G, Kanaoka M, Noma S, !toh T, Furuta Ai Asamoto H, Torizuka K Centrilobular lesions o/the lung: demonstration by high resolutuion CT and pathologic correlation. Radiology 1986; 161: 641-645
8 Hruban RH, Mesiane AiA, Zerhouni EA. High resolution CT o/inflation-fixed lungs:pathologicradiologic correlation o/centrilobular emphysema. Am Rev Respir Dis 1987; 136: 935-940.
9 Kuwano K, Matsuba 1(, Ikeda T, Murakami J, Araki A, Nishitani H, Ishida T, Yasumoto K, Shigematsu N The diagnosis 0/ mild emphysema. Correlation 0/ computed tomography and pathology scores. Am Rev Respir Dis 1990; 141: 169-178.
10 Klein jS, Gamsu G, Webb WR, Golden jA, Muller NL. High-resolution CT diagnosis o[emphysema in symptomatic patients with normal chest radiographs and isolated low diJfi.tsing capacity. Radiology 1992; 182: 817-821.
11 Snider GL Emphysema: The first two centuries-and beyond. A historical overview, with suggestions for foture research: Part 1. State o/the Art. Am Rev Respir Dis 1992; 146: 1334-1344.
12 Yernault}C, Paiva M. The in vivo diagnosis 0/ emphysema: an uncompletely resolved issue. Bull Enr Physiopathol Respir 1986; 22: 95-97.
13 American Thoracic Society. Standards for the diagnosis and care o/patients with chronic obstructive pulmonary disease (COPD) and asthma. Am Rev Respir Dis 1987; 136: 225-243.
14 Pratt Pc. Role 0/ conventional chest radiography in diagnosis and exclusion 0/ emphysema. Am} Med 1987; 82: 998-1006.
15 Fletcher R. The single breath test for carbon dioxide. Thesis. Berlings, Arlov, Sweden, 1980.
B4
General discussion
16 Fowler ws. Lungfunctions studies. 11. The respiratory dead space. Am] Physioll948; 154:405-416
17 Bartels j, Severinghaus JW, Forster R£ Briscoe WA, Bates D V The respiratory dead space measured by single breath analysis of oxygen, carbon dioxide, nitrogen or helium. J Clin Invest 1954; 33.41-48.
18 WoW G, Brunner JX Series dead space volume assessed as the mean value of a distribution fimction. Int J Clin Monit Comput 1984; 1:177-181.
19 WoWG, Brunner JX Weibel W, Bowes CL, Muchenberger R, Bertschmann W. Anatomical and series dead space volume: concept and measurement in clinical pntxis. Appl Cardiopulm Pathophys 1989; 2:299-307.
20 You B, Peslin R, Duvivier C, Dang Vu V, Grillat JP. Expiratory capnography in asthma: evaluation of various shape indices. Eur Respir j 1994; 7:318-323.
85


Chapter 7
Summary


Summary
In Chapter 1 the historical development of capnography, especially with regard to its diagnostic value, as well as the theories which have been developed to explain the shape of PE,c02 versus time and volume curves, are discussed. In addition asthma and emphysema are defined and an overview is given of studies in which the histologically validated degree of pulmonary emphysema is compared with results of pulmonary function tests.
In Chapter 2 the study populations consisting of healthy controls, patients with asthma (during exacerbation and after recovery), moderately obstructed and severely obstructed emphysema patients, are introduced and defined. Lung function data are shown and roentgenographic criteria for emphysema as applied in these patients are discussed. The measuring equipment, consisting of a capnometer and a pneumotachometer showed a volume drift for which a correction procedure was applied.
In Chapter 3 the results on V25-50 and V25-75 are presented in relation to VT as a possible diagnostic test in emphysema, as reported previously [3,4J. Healthy controls could be distinguished from severely obstructed emphysema patients on basis of discriminant analysis applied on intercept and slope of the relationship between V25-50 and VT, and V25-75 and VT. However, the resulting discriminant line of the V25-50 versus VT relationship was not able to locate 4 of9 moderately obstructed emphysema patients at the emphysema side of the discriminant line. Moreover, a breathing frequency of 20 per min in the healthy controls moved the data points of the healthy controls into the area of the severely obstructed emphysema patients. The conclusion was that V25-50 versus VT is not of practical use for the diagnosis emphysema. V25-75 appeared not to be restricted to phase 2 in asthma and emphysema patients, but comprised - due to the steep slope of the alveolar part - part of this phase as well, causing the asthma patients to overlap with 2the severely obstructed emphysema patients.
In Chapter 4 the slopes of the alveolar plateaus of the PE,c02 versus time and PE,c02 versus volume curves, which were expressed as percentages of PET, CO2 per second and per liter, respectively, and their relationship with V T are compared with each other and between the study groups. In the emphysema patients, the slopes of the alveolar plateaus of the PE,c02 versus volume curves were more linear than those of the PE,c02 versus time curves, which can probably be attributed to the influence of decreasing flow during expiration. In patients with airways obstruction a negative relationship of both types of slopes with VT was demonstrated. The slopes of the alveolar plateaus of the PE,c02 versus volume curves at 1 1 VT during natural breathing frequency discriminated better between healthy controls and patients with airways obstruction than the slopes of the alveolar plateaus of the PE,c02 versus time curves, and were better related with the degree of airways obstruction. In the healthy controls there proved to be a significantly positive relationship of the slopes of the alveolar plateaus of both PE,C02 versus time and PE,C02 versus volume curves at 1 1 VT with height, but not with age.
89

Chapter 7
The negative relationship between the steepness of the slopes of the PE,C02 versus time and PE,C02 versus volume curves with VT is attributed to an increased contribution of areas with high ventilation/perfusion ratios during breathing with larger tidal volumes, compared to breathing with small tidal volumes.
In Chapter 5 three types of death space estimates, derived from the PE,C02 versus volume curve are compared: VD,Boh, [15]. VD,Fowb [16,17] and Pre Interface Expirate (PIE) [18,19]. On the basis of a plot of slope versus intercept of the relationship between VD,Boh, and VT, it was possible to separate emphysema patients from healthy controls and asthma patients. VD,Bohr at 1 1 VT showed a higher degree of correlation with the severity of airways obstruction than the other two estimates. The higher VD,Bohr values at fixed VT in the obstructive patients compared to healthy controls can mainly be attributed to the steeper slope of the alveolar plateau in these patients which results in an increase of alveolar dead space. Alveolar dead space contributes more to VD,Bohr than to any of the other two dead space estimates.
Chapter 6 presents a general discussion on the clinical applications based on the former results, together with suggestions for future research.
References: as in 6.1.
90

Samenvatting en condusies
Her onderzoek dar wordt beschreven in dit proefschrift kwam rot stand om de betekenis van capnografie als niet-invasieve longfunctierest te bepalen door na te gaan ofhet rnogelijk is om met behulp van variabelen onrleend aan capnogrammen emfyseempatienten te onderscheiden van gezonde proefpersonen en van patienten met astma, zoals dar in her verleden in eerdere onderzoeken weed gesuggereerd [1-4]. Een capnogram is een registratie van koolzuurgas (C02) in de uitademlucht, uitgedrukt in concentratie van de uitgeademde lucht of, zoals in dit onderzoek, koolzuurspanning (PE,C02 in kPa). Her kan geregistreerd worden regen de tijd of regen her uitgeademde volume. Na een inaderning van kamerlucht verschijnt eerst uit de luchtwegen kamerlucht waarin (vrijwel) geen CO2 zit: fase 1 van het capnogram. Dan voIgt een snelle stijgingvan CO2 (fase 2, of overgangsfase), gevolgd door een vrijwel horizontaal deel: het alveolaire plateau (fase 3).
Het gebruik van computers maakte gedetailleerde signaal analyse, bewerking en opslag van data mogelijk en was de conditio sine qua non van dit onderzoek [5]. Elke ademteug kon achteraf op allerlei manieren bewerkt worden dankzij de opslag van de peo2 tegen de tijd en de flow tegen de tijd. Een voorbee1d met data en plaatjes van een ademteug van een gezonde proefpersoon en een patient met emfyseem ziet u in figuur 6.1 en 6.2:
A laat het volume tegen de tijd zien en B de PE,e02 tegen de tijd; de laatste ademteug hiervan is de bewerkte ademteug, waarvan plaatjes C, D, E, Fen G. C is de PE,e0z-tijd curve en D de PE,eoz-volume curve; 60 en 90 % van het uitgeademde volume (over dit dee! werd de heIling van het alveolaire plareau bepaald) zijn gemarkeerd door verticale Hjnen. E beeldt de eerste afge1eide af van de he1e PE,co2-volume curve met nu op de Y-as de verandering van PE,COz per volume eenheid (~P/~ V) en op de X-as het volume. F laat de flow-volume curve zien en G de eerste afgeleide van de PE,co2-voiume curve versus het volume, zoals dat gebruikt werd voor de berekening van PIE.
Een vroege diagnose van emfyseem (een permanente verwijdingvan de luchtwegen distaal van de terminale bronchioli, gepaard gaande met destructie van de alveolair wanden, zonder duidelijke fibrose) is van be1ang omdat de schade permanent is. Als de diagnose bekend is kunnen maatregelen genomen worden om verdere schade te voorkomen, met name het stoppen van roken. Emfyseem kan verwacht worden bij oudere rokers of exrokers die last krijgen van kortademigheid bij inspanning, hoesten en piepen, tetwiji bij longfunctie-onderzoek een luchtwegobstructie wordt gevonden en de thoraxfoto tekenen van hyperinflarie en weefselverlies vertoont. De gevoe1igheid van de thoraxforo voor het aanronen van emf)rseem is echter gering en emfyseem is al in een vergevorderd stadium als de thorax foto duidelijke kenmerken ervan laat zien [6J. "High Resolution Computer Tomography" (HRCT-scan) is een vee! gevoe!iger techniek voor her aantonen van emf)rseem, maar is duur en niet alrijd beschikbaar, rerwiji her nog steeds moeilijk is om de uitgebreidheid ervan te kwantificeren [7-14].
91

Chaptet 7
Een combinatie van longfunctie afWijkingen is karakteristiek, terwijl geen crYan afzonderlijk diagnostische waarde heeft [11-12]. Daarorn zouden de typische patronen van her capnogram bij emfyseem diagnostische waarde kunnen hebben. Kwantificeren cryan in het verleden bleek steeds moeilijk [1,2]. De laatsre veelbelovende onrwikkelingen waten bewerkingen van fase 2 van de PE,C02 versus volume curve: de volumes op de X-as tussen 25 en 50%, en tussen 25 en 75% van de eind-expiratoire peo2> bleken bij patienten met emfyseem groter en meee toe te nemen met de grootte van de ademteug (VT) vanafFRC niveau dan bij patienten met astma en gezonde proefpersonen. Op grond van de toename per I ademreug waren de patienten met emfyseem te onderscheiden van patienten met astma en de gezonde ptoefpetsonen [3,4]. Deze resulraten vormden het uitgangspunt van dit onderzoek. Verder werden fase 3 en dode ruimte bepalingen gedaan en vergeleken in de onderzoeksgroepen.
Achtereenvolgend is het ptoefschrift als voIgt opgebouwd:
In Hoofdstuk 1 wordt een overzicht gegeven van de historische ontwikkelingen van capnografie, met name met betrekking tot de toepassing voor de diagnostiek van emfyseem. Theorieen over de oorzaak van de vorm van het capnogram worden belicht. Definities van emfyseem en astma worden gegeven [13], alsmede een kort overzicht van studies waarin de uitgebreidheid van emfyseem histologisch wordt gekwantificeerd en vergeleken met longfunctietesten.
In Hoofdstuk 2 wordt de onderzoeksgroep van Hoofdstuk 3, 4 en 5 voorgesteld met hun longfunctie gegevens. Deze bestaat uit: gezonde proefpersonen, patienten met astma tijdens exacerbatie, patienten met astma na hers tel, patienten met emfyseem met een matig obstructief gestoorde longfunctie en patienren met emfyseem met een ernstig obstructief gestoorde longfunctie. De thoraxfoto kriteria die werden gebruikt om emfyseem te diagnostiseren [14] worden toegelichr. De meetopstelling, bestaande uit een capnometer en een pneumotachometer, wordt beschreven. Mogelijke foutenbronnen als oorzaak voor de volume drift worden genoemd alsmede de correctieprocedure die we toepasten. Op plaatje 2.2. staat deze correctie aangegeven, terwijl het plaatje tegelijkertijd de ademoefeningen illustreert.
In Hoofdsruk 3 worden de resultaten gepresenteerd over V25-50 en V 25-75 in relatie tot VT als mogelijke diagnostische test voor emfyseem, zoals dat eerder werd beschreven [3,4]. Het bleek mogelijk de gezonde proefpersonen te scheiden van de ernstig obstructief gestoorde emfyseempatienten op grond van discriminant analyse toegepast op intercept en hellingvan de relatie russen V25-50 en VT, en V25-75 en VT. Op grond van de discriminant lijn van V 25_50 versus VT bleken 4 van de 9 matig obstructief gestoorde emfyseempatienten niet aan de kant van de lijn van de 'emfyseempatienten' te zijn gelokalizeerd. Bovendien deed een ademfrequentie van 20 per minuut bij de proefpersonen de waarden dermate toenemen dar er overlap met de ernstig obstructief gestoorde emphyseempatienten optrad. De conclusie was dat V 25-50 in relatie tot VT geen geschikte variabele is voor de diagnostiek van emfyseem. V25 _75 bleek bij de emfyseem- en astmapatienten, in tegenstelling tot de gezonde proefpersonen, niet beperkr te zijn tot fase 2, maar ten gevolge van de steile
92

Samenvatting en conclusies
helling van fase 3, over te lopen in fase 3, waardoor astmapatienten tijdens exacerbatie overlap ten met de ernsdg obstructief gestoorde emfyseempatienten.
In Hoofdstuk 4 worden per proep van patienten de waarden van de hellingen van het alveolair plateau van de PE,C02 versus tijd en PE,C02 versus volume curve, uitgedrukt als percentage van de eind-expiratoire PC02 per seconde en per liter, vergeleken met elkaar en met die van de gezonde proefpersonen tijdens rustig ademen (i.t.t. ademen met opgelegde frequentie). Bij emfYseempatienten bleken de hellingen van het alveolaire plateau van de PE,C02 versus volume curve meer lineair dan die van de PE,C02 versus tijd curve, watwaarschijnlijk toegeschreven kan worden aan de invloed van de afnemende flow tijdens de expiratie. Aangezien met name bij patienten met luchtweg obstructie een negatieve relatie besraar met VT voor de hellingen van de alveolaire plateaus van beide curven, worden de waarden van de hellingen vergeleken bij een VT van 11. De hdling van het alveolair plateau van de PE,C02 versus volume curve bij een VT van 1 I bleek het best gezonde proefpersonen van patienten met luchtwegobstructie te scheiden en bleek ook het best gereIateerd met de mate van luchtwegobstructie. Van de beide types van curven is de helling van het alveolair plateau bij een VT van 1 I gerdateerd aan de lichaamslengre. De negatieve relatie russen de hellingen van de alveolaire plateaus en VT worden toegeschreven aan meer bijdrage van longgebieden met een hoge ventilatie/perfusie ratio bij ademhalen met grote teugen ten opzichte van ademen met kleine teugen.
In Hoofdstuk 5 worden 3, van de PE,C02 versus volume curve afgeleide, dode ruimte berekeningen met elkaar vergeleken in de groepen uit Hoofdstuk 2. Deze dode ruimre bepalingen zijn: VD,Bohr [15], VD,Fowler [16,17] and Prelnterface Expirate (PIE) [18,19]' Deze laatste variabele is gedefinieerd als het gemiddelde van de distributie van LlPILlV versus het volume tot en met fase 2. Op grond van discriminant analyse toegepast op intercept en helling van de relatie tussen VD,Bohr en VT was het mogelijk emf)rseempatienten te scheiden van gezonde proefpersonen en astma patienten tijdens exacerbatie. VD,Bohr bij 1 I VT was beter gerelateerd met de mate van luchtwegobstructie dan de andere twee dode mimte maten.
In Hoofdstuk 6 worden de resulraten van de hoofdstukken 3, 4 en 5 in rdatie tot de diagnostiek van emfyseem en de klinische toepasbaarheid besproken: Fase 2 variabelen lijken ongeschikt voor de diagnostiek van emfyseem in een vroeger stadium, zoals in Hoodstuk 3 wordt aangetoond. De modelgedachte van de long als trompet, waarin bij emfyseempatienten verwijding optreedt, die leidt tot toename van deze fase 2 variabelen, moet dan ook als te eenvoudig worden beschouwd, temeer omdat deze fase 2 variabelen ook afhankelijk zijn van fase 3, die bij emfyseempatienten duidelijk toegenomen is. Fase 3 van de PE,C02 versus volume curve van een kleine ademteug onderscheidt beter patienten met luchtwegobstfuctie van gezonde proefpersonen dan fase 3 van de PE,C02 versus djd curve. De rdatie met lengte en leeftijd bij gezonde proefpersonen verdient dan wei verdere aandacht,
93

Chapter 7
Omdat van de onderzochte dade ruimte variabelen VD,Bohr in relatie tot VT mogelijk diagnostische waarde heeft in geval van emfyseem, is uitbreiding van dit onderzoek bij patienten met minder ernstig emfyseem het overwegen waard. Patienten, die hiervoor in aanmerking komen zijn zij die preoperatief onderzocht worden in verband met een bronchus carcinoom. Bij hen bestaat nogal eens enige mate van emfyseem. Her CT onderzoek vaor de stagering zou uitgebreid kunnen worden met HRCT zadat nauwkeuriger rontgenologisch onderzoek met kwanticeren van emfyseem kan plaatsvinden. Als longweefsel wordt verwijderd kan de uitgebreidheid van emfyseem oak histologisch worden vastgelegd. Aangezien cen goede relatie bestaat russen zowel de helling van het alveolair plateau van de PE,C02 versus volume curve als VD,Bohr bij een teugvolume van 1 1, en de mate van luchtwegobstructie, vormt een ander toepassingsgebied het onderzoek van patienten die niet in staat zijn maximale ademoefeningen te doen [20].
Referenties: zie 6.1.
94

Dankwoord
Voor de realisatie van dit proefschrift wil ik graag iedereen bedanken, die er direct of indirect aan heeft bijgedragen door tijd, ideeen ofkritiek. Met name de volgende personen:
aIle patienten en proefpersonen, waarvan de ouderen afkomstig uit de groep van oudmedewerkers van OilS ziekenhuis en de jongeren ult de huidige werkkring. Judith Aukes-Haazebroek, Ineke den Burger, Caroline Vans, Coriene Dootjes-Mulder en Monique Wapenaar-de Korver, die de longfunctieonderzoeken regelden en uirvoerden, Gerard Goorden, die het computer programma maakte en vanaf het begin zich oak om de statistische verwerking van de gegevens bekommerde. Ton Verbraak voor zijn ondersteuning van de automatisering, hulp bij technische vraagstukken en goede sfeer, die hij met zich meebrengt. Henk Starn voor zijn hulp bij technische vraagstukken. Arnold Drop, die de figuren tekende. Laraine Visser-Isles voor haar correctie van het engels. Siang Kho voor zijn geduldig, weloverwogen klinische oordeel en vaardigheid, van wie ik veel geleerd heb in al deze jaren. Theo Stijnen voor zijn adviezen en hulp bij de starisrische verwerking van de gegevens. de leden van de Kleine Commissie, Professor Dijkman, Professor Luijendijk en Professor Versprille, die door hun kritiek de inhoud van her manuscript verbererden. Professor Hilvering voor de opleiding tot longans, zijn hulp bij de selectie van emf)rseempatienten en het steeds weer bekijken van artikel 1, 2 en 3, hetgeen nog niet voorbij is. Professor Bogaard, Jan, voor de vele rijd van begeleiding en enthousiasme. En als laatste mijn familie en vooral mijn ouders, die aan her begin stonden van alles.
95


Curriculum Vitae
The authot of this thesis was bom on June 3,d 1950 in Breda, The Netherlands. She finished secondary school (Gymnasium Il) in 1968. From 1968 until 1975 she attended the Medical School in Rotterdam (now part of Erasmus University Rotterdam), where she also did the training for general practitioner in 1976. Specialization in internal medicine from 1977 until 1982 in the "Haven Ziekenhuis" (head: Prof.dr. P. Stuiver) at Rotterdam and "Gemeemeziekenhuis Dordrecht" (head: Dr. B.A. de Planque) was followed by specialization for pulmonary physician at the Pulmonary Department (head: Prof.dr. C. Hilvering) of the University Hospital Dijkzigt from 1982 until 1984. The author has been a staff member of the pulmonary department since 1985.
97