Embed Size (px)
Citation preview
NORTHVILLE HEALTH CENTER
CLINIC OPERATIONS ANALYSIS
9 December 1996
Susan GorylLauren Somershoe

C.
Table of Contents
Executive Summary 1
Introduction 2
Methodology 2
Analysis 4
Conclusions 5
Limitations 7
Recommendations 8
Appendix 10
Executive Summary
For the Northville Health Center Clinic Operations Analysis Project, the patient
flow through the clinic was examined to evaluate the patient wait times. After completing
the study and analyzing the data, arew recommendations were made to reduce the wait time
in the clinic. First, the means by which patients are scheduled needs to be further studied.
Currentlyj,atients are given time slots based on the traditional process flow and the
provider the patient is seeing. Since some of the patients to do not flow in that standard
way, the exam rooms become overbooked. Communication is also a problem with the
clinic. There is a significant amount of time spent waiting for the next person to work with
the patient. Using a dry-erase board to track patients and doctors will help keep the staff
informed of where patients are and which providers should see them. Recommendations
are limited because the scope of the project is limiting.
(1
Introduction
The purpose of this project is to analyze and identify any bottlenecks in the patient
flow of the Northville Health Clinic. Any recommendations or improvements will be
reported. The goal is to eliminate iust6mer complaints of long wait times. By doing this,
the efficiency of the clinic will also be improved.
Northville Health Center is a satellite clinic of the University Hospital. It is a
relatively small clinic with a low visit count. Despite this, there have been many incidences
of customer complaints about long wait times. Because of this, a request was made to
decrease the time the patients had to wait, through improving the patient flow. In doing
this, we also hope to improve the efficiency of the clinic.
Methodology
The first step was to establish the current process flow of the clinic. This was done
by interviewing staff members. A flowchart was created from the information.
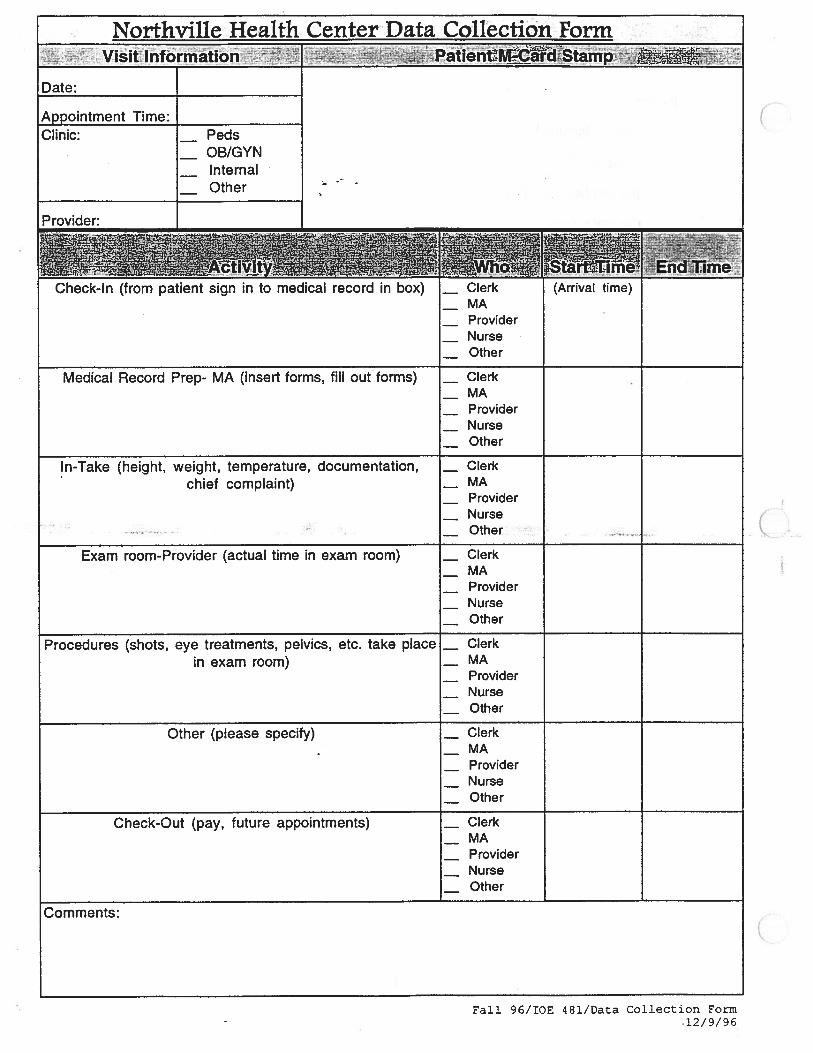
The second step was a time study of the clinic activities. The team designed a data
collection sheet (see Appendix) to be used by the clinic employees. The sheet included
items such as the arrival time, the appointment time, starting times of clinic activities, and
end times of clinic activities. The form was designed to be simple and to be used by the
clerks, MAs, providers, and nurses that operate the clinic. The data collection forms are
accompanied by clipboards. Each of the clipboards has a small digital clock attached to
provide ease in recording the times. The clipboards and clocks have been provided by the
University of Michigan Program and Operations Analysis Department
The data collection begins when a patient signs in at the front desk. The patient fills
in his/her name, the arrival time, and the appointment time. Next, the clerk stamps the
patient’s insurance card onto the data collection form for tracking purposes. The patient’s
arrival time (from the sign-in sheet), appointment time, and the provider’s name is written
on the data coilectioa form. Th data colleciloft form is then attached to a clipboard and
2
inserted into the patient’s medical record. The clerk carries the medical record (and data
collection form) to the in-box for the MA. Before placing the medical record into the in-
box, the time is recorded on the data collection sheet. From here, the MA fill out the data
collection sheet. - -
The MA’s begin by removing the medical record from the in-box and recording the
time on the data collection sheet. She then performs any preparation of the medical record
that has not already been done. When finished, she records the time. The next step in the
process is to call the patient in from the wailing room. The time is recorded as this is done.
The MA, now “works up” the patient by taking the height, weight, temperature, et cetera of
the patient. The MA also leads the patient to an exam room, records the chief complaint
and any other pertinent medical history. The end time is recorded when the MA steps out
of the exam room to notify the provider that the patient is ready. The provider records the
time that he/she steps into the exam room to perform the exam/consultation depending on
the type of visit. The end time is recorded when the provider steps out of the room. The
clipboard is then either left with the patient to take to check out, left in the box outside the
exam room for the next person who will be performing a procedure, or sent with the
medical record to the lab, where the lab technician will fill out the starting and ending times
of the procedure. If a procedure is done in the exam room, the person perfonuing the
procedure will record the time that she steps into the room to perform the procedure, and
the end time will be when she leaves the exam room after the procedure has been finished.
Some examples of procedures might be flu shots, eye treatments, or pelvic exams.
The fmal step is for the patient to take the data collection form to check out. The
clerk records the start time as the lime that the clerk begins the check out procedure. The
end time is the time that the patient walks out the door.
3
Analysis
The first step in analyzing the data was to divide it into three separate clinics;
Pediatrics, OBIGYN, and Internal Medicine. The team decided this was appropriate
because of the different patient flcvs thiough each of these clinics. The second step was to
calculate the wait times and service times, as seen by the patient, for each step in the
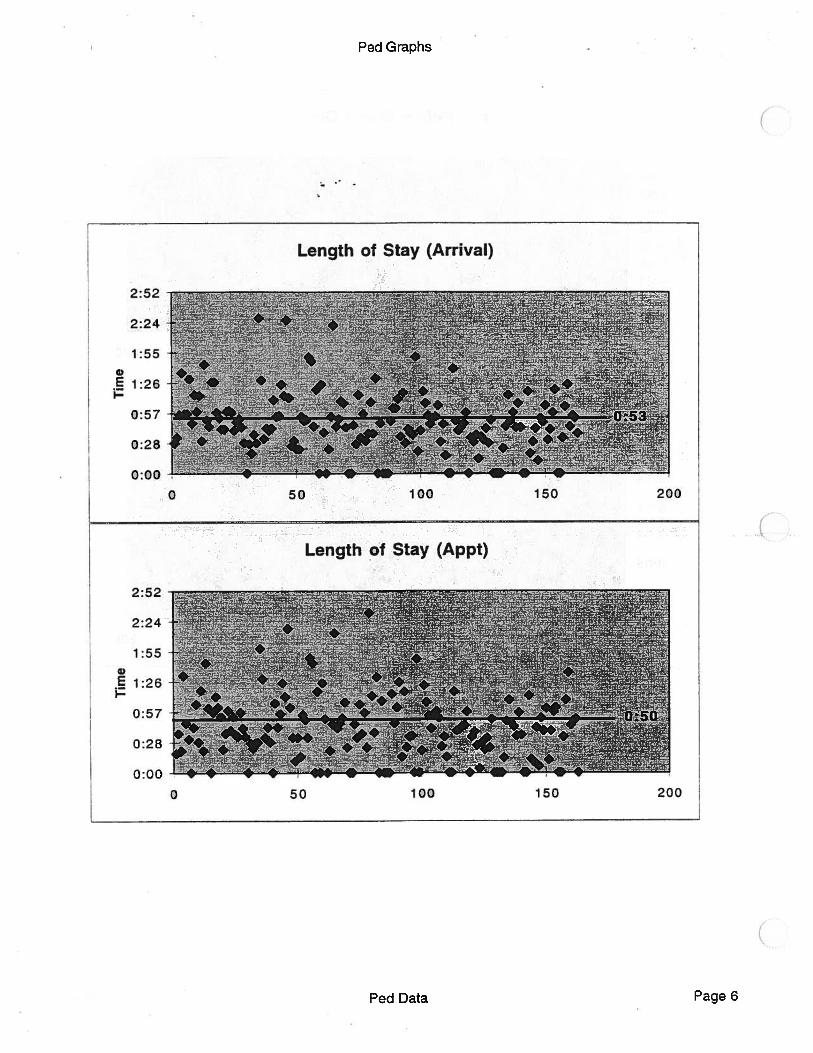
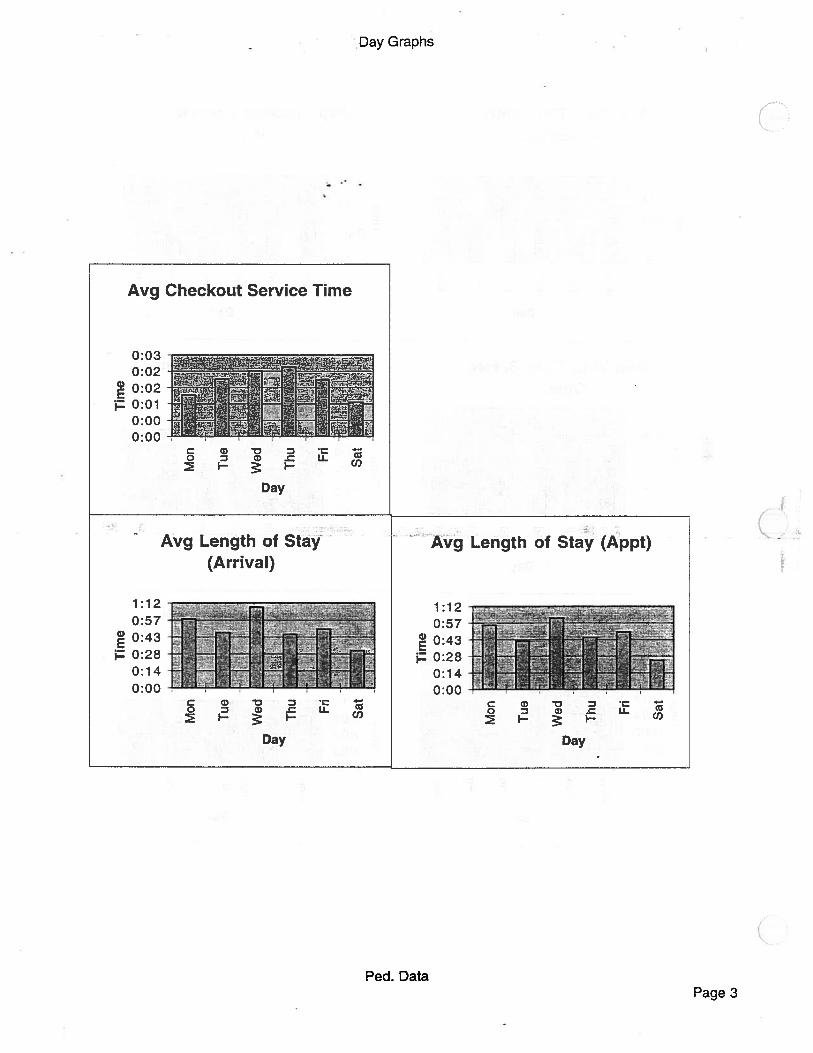
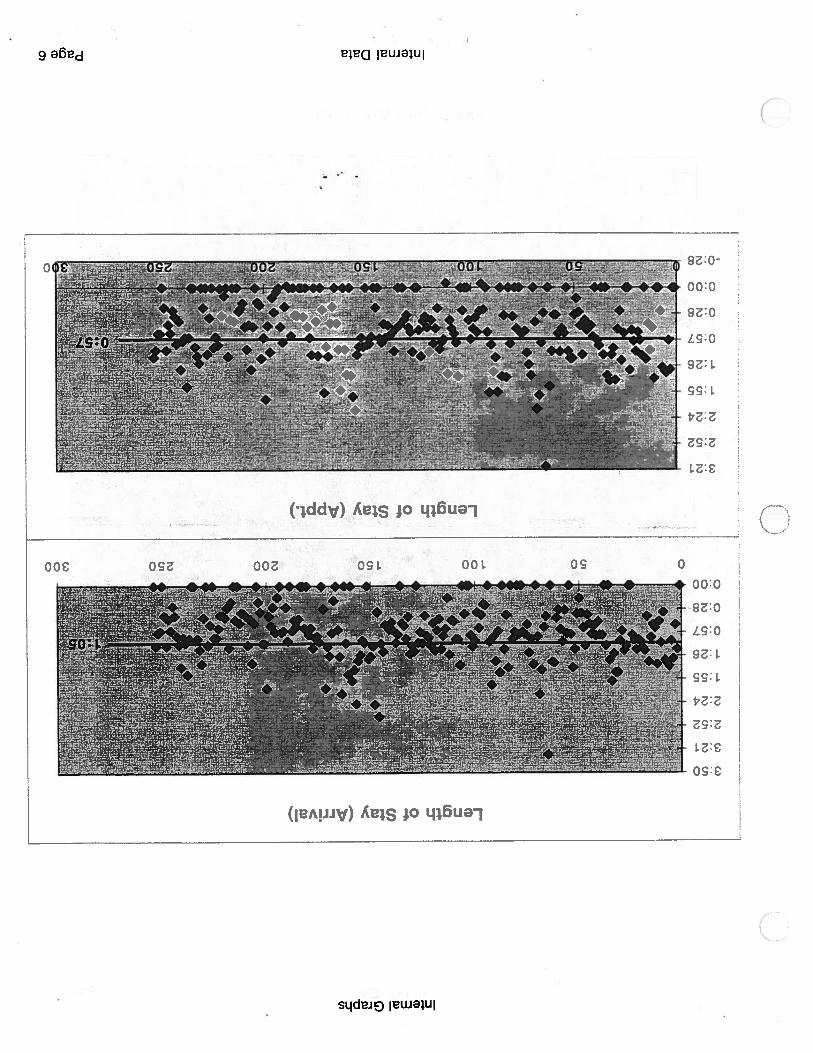
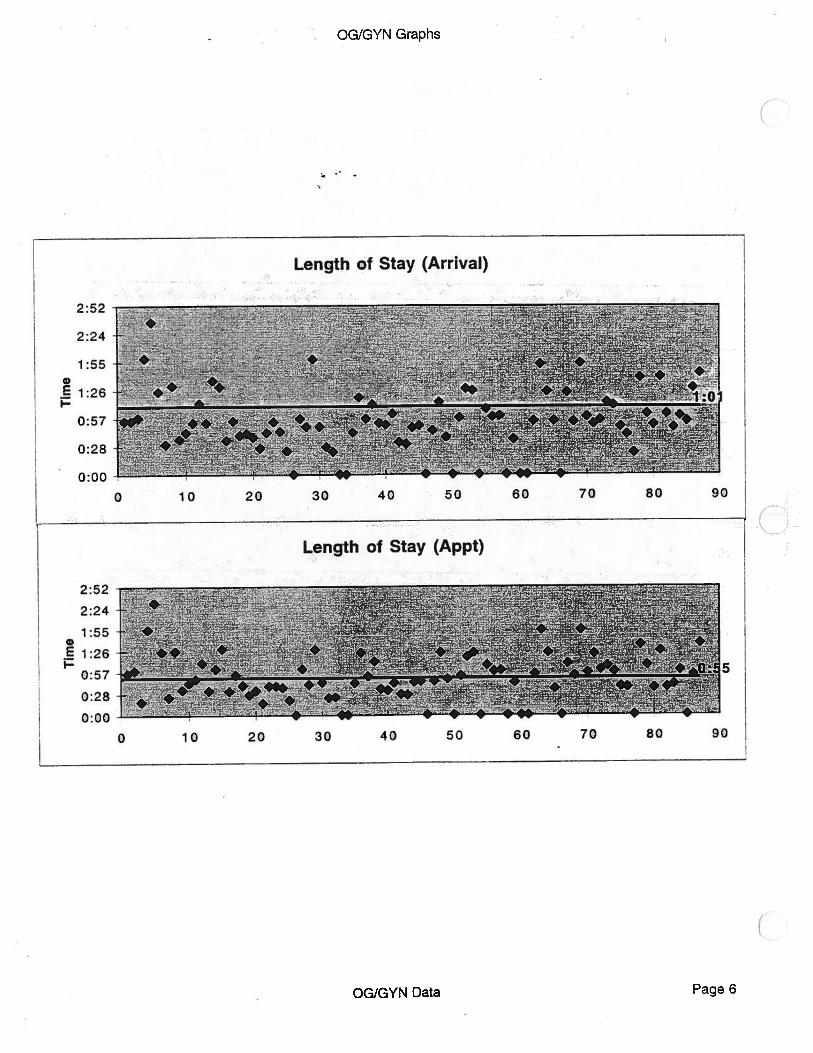
process flow. An Excel spreadsheet was generated from this data. Next, the length of stay
was calculated for each subject. This represents the total amount of time that a patient was
in the clinic. Length of stay was calculated twice, once based on arrival time and once
based on appointment time. This was done twice because patients often do not come at
their scheduled time. The data was used to determine what happens when a patient arrives
at a time other than the scheduled appointment time. If a patient arrives before the
scheduled time, the patient is admitted early, but if a patient arrives late, they must
reschedule their appointment. The length of stay remains essentially the same whether the
patient arrives early or on time.
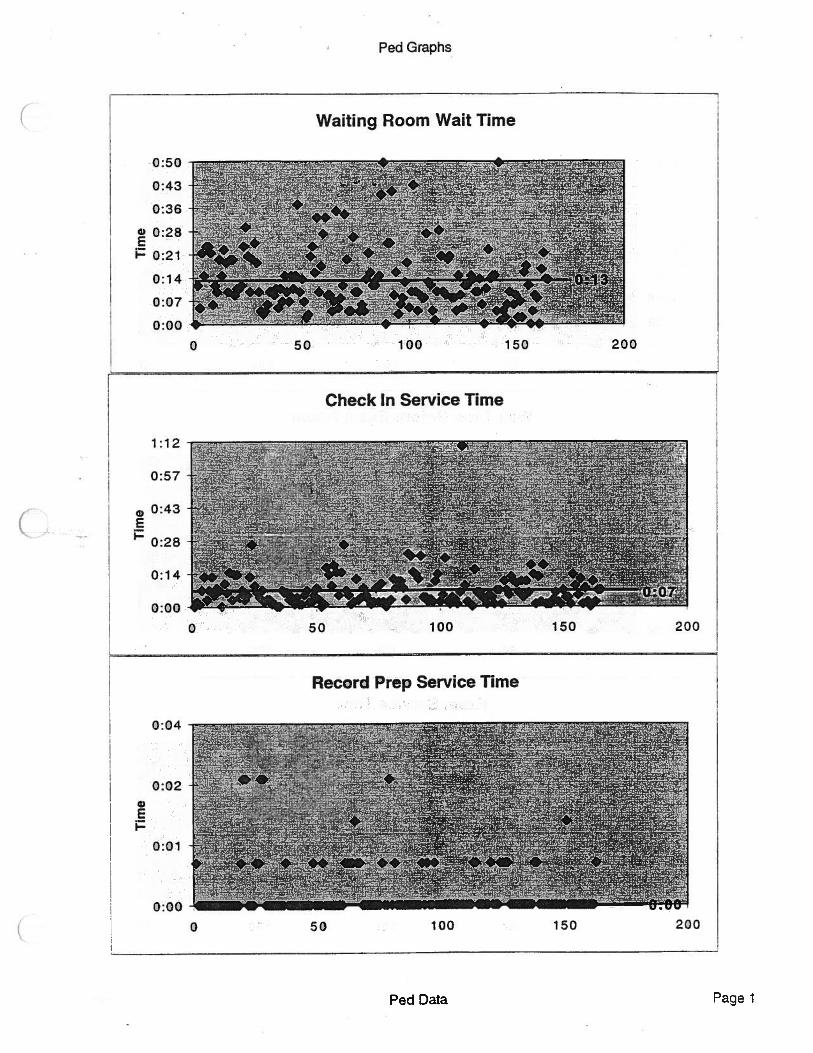
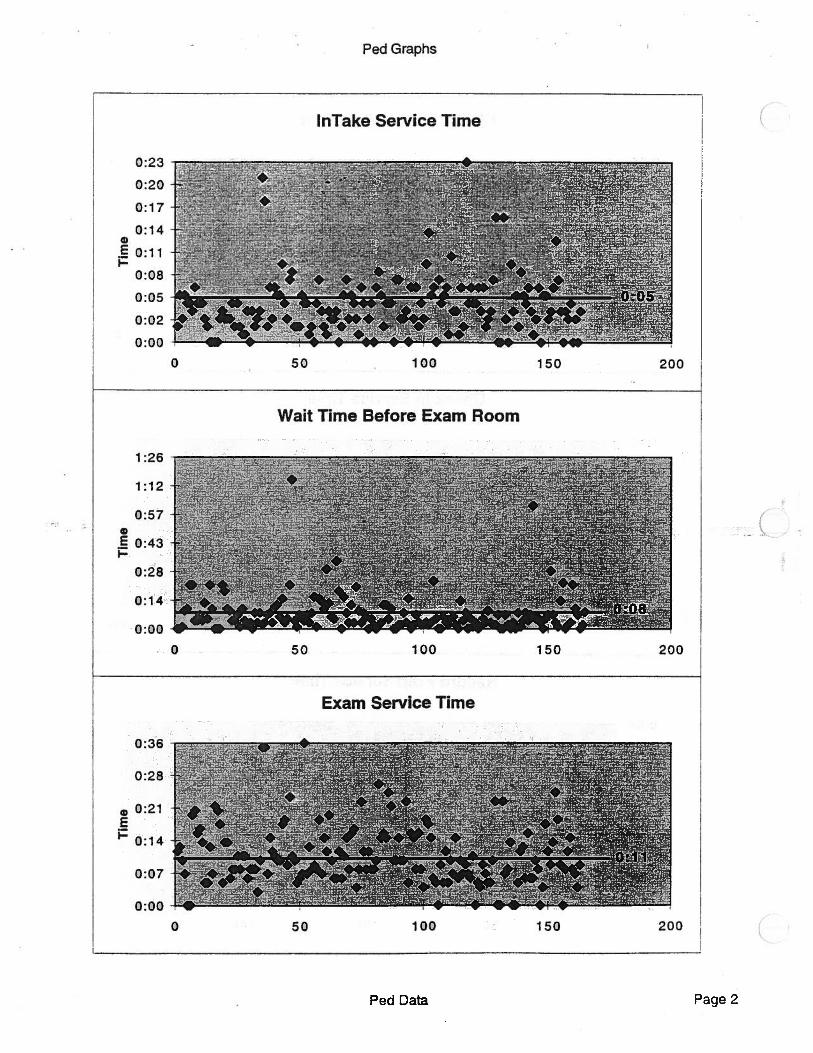
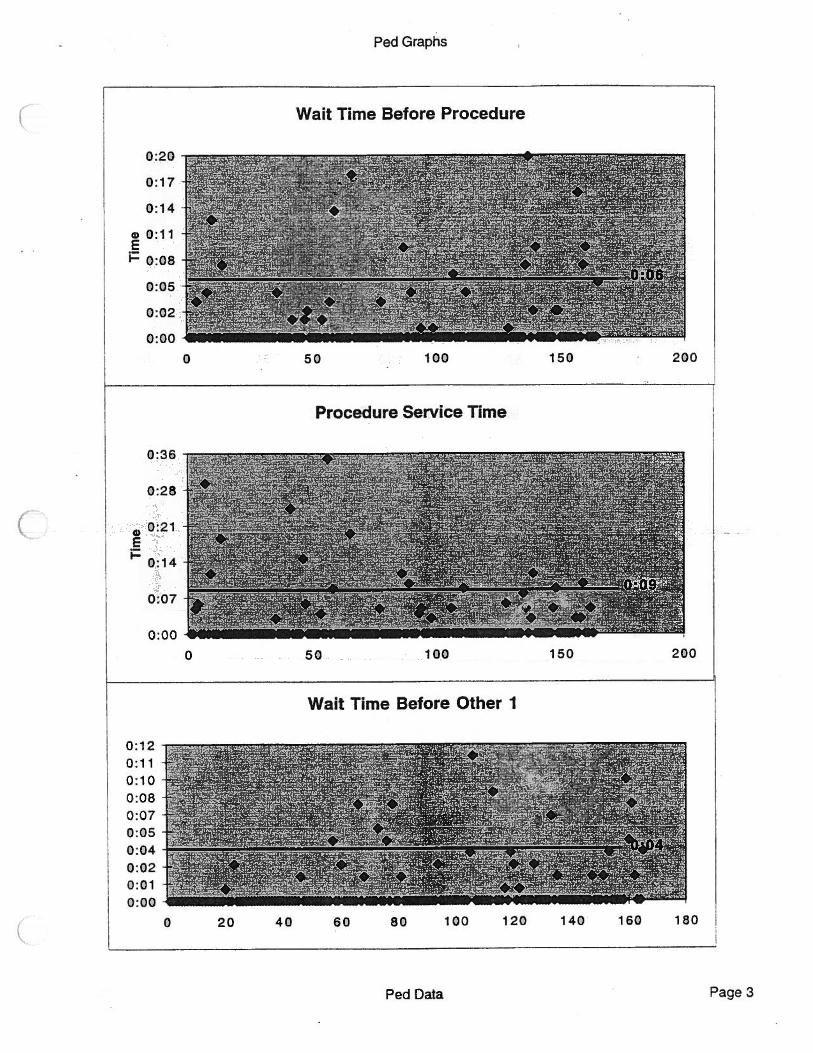
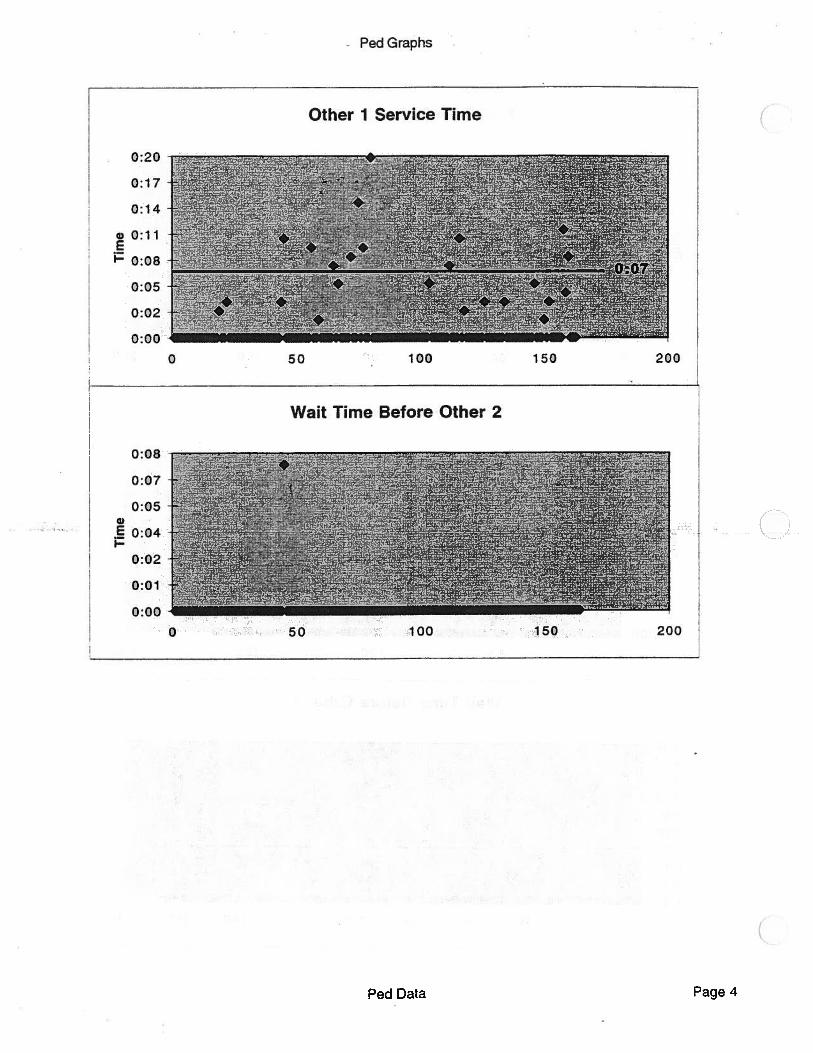
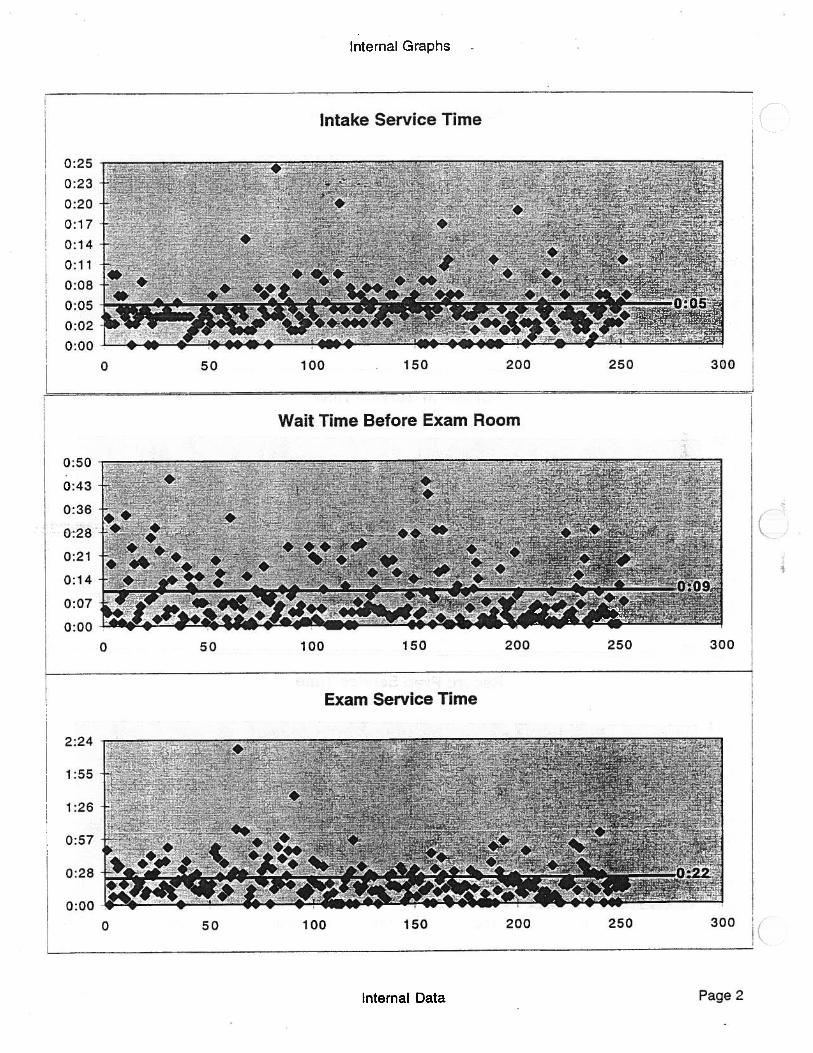
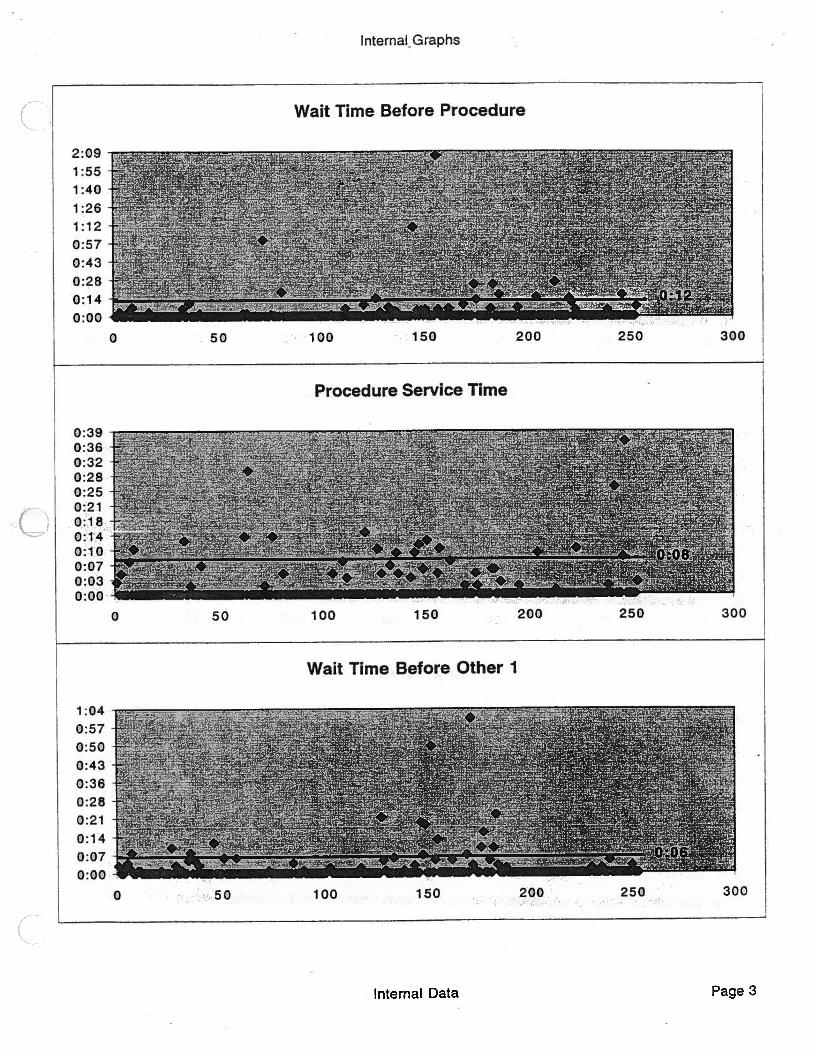
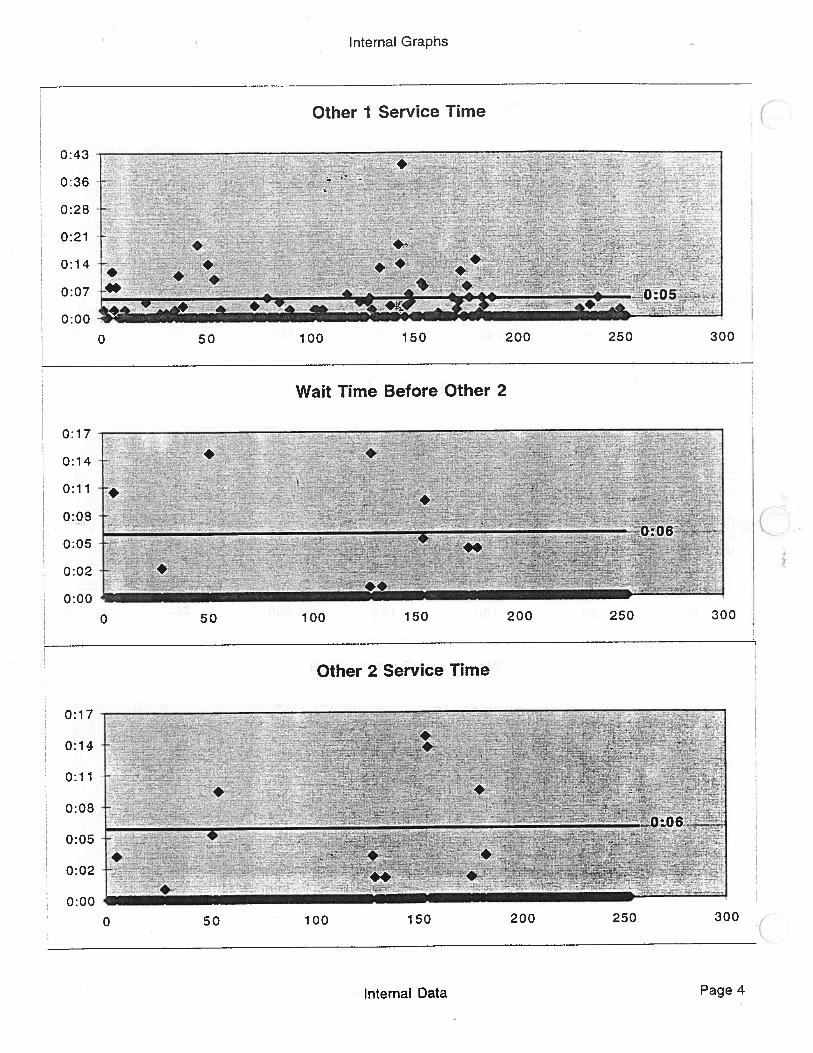
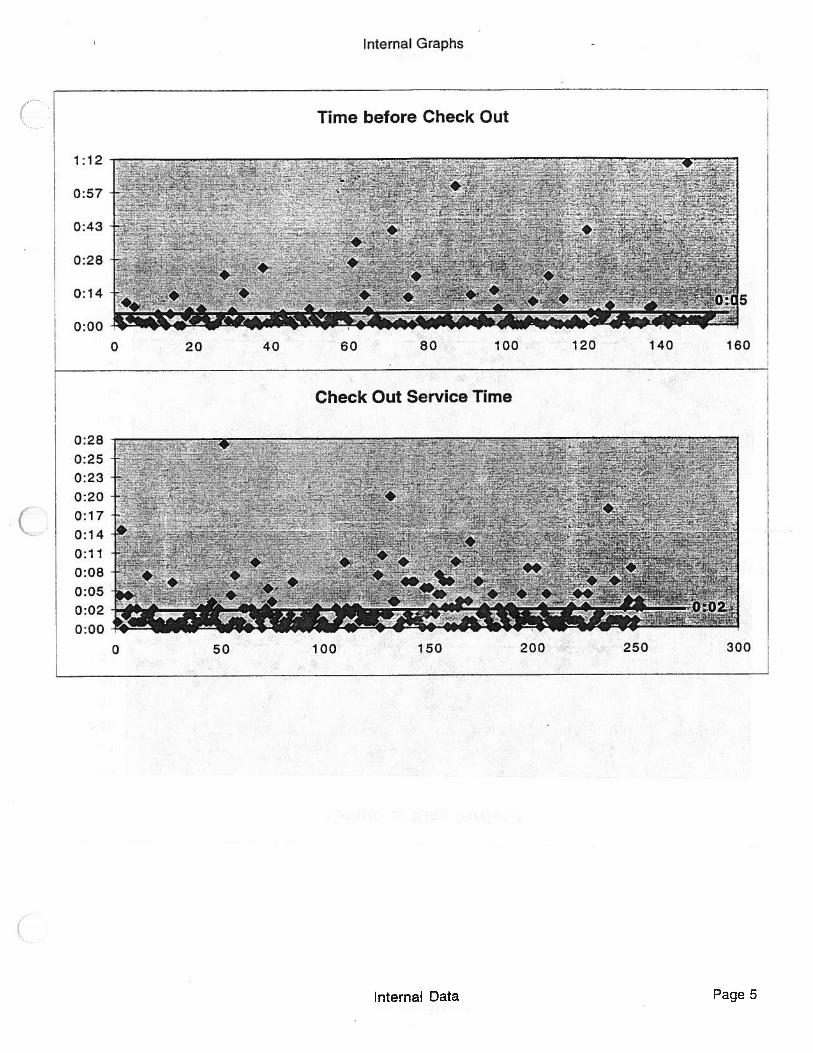
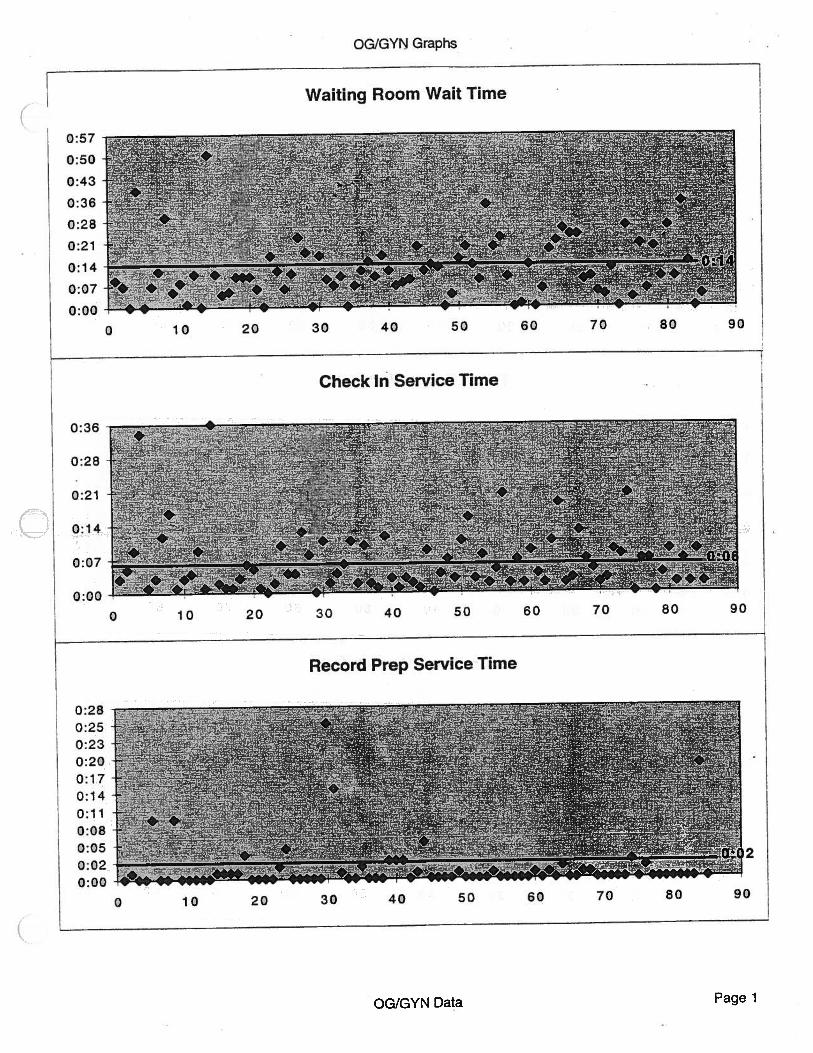
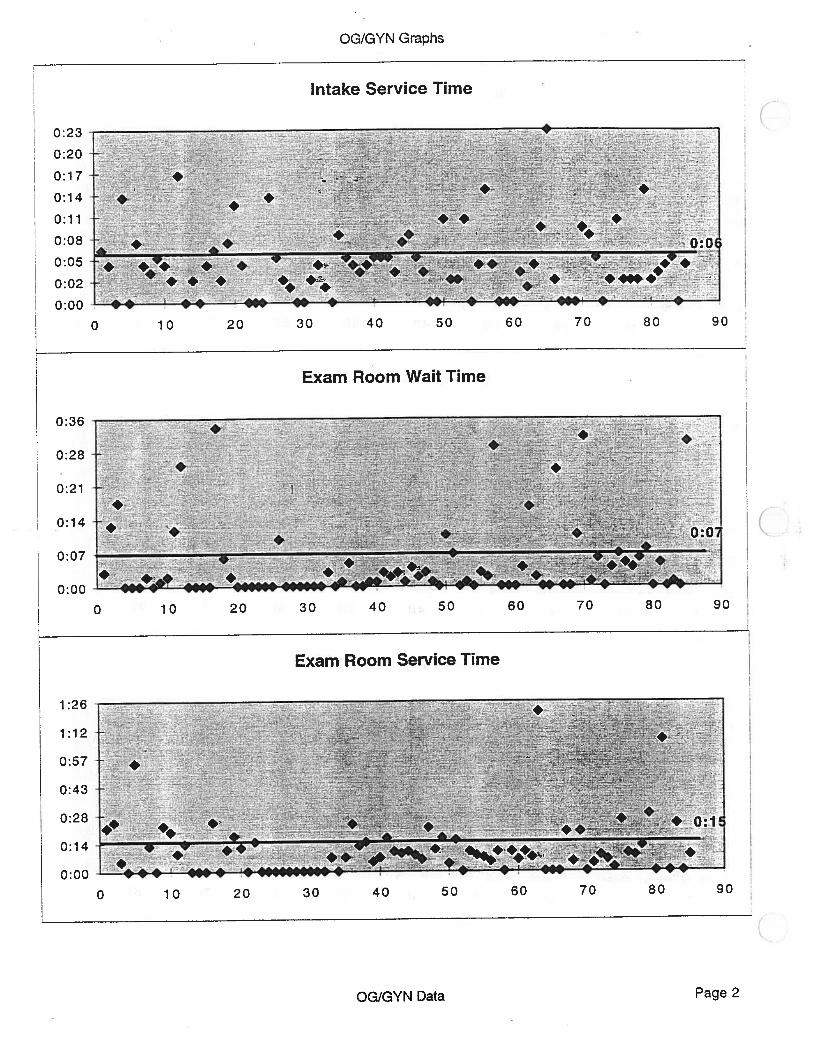
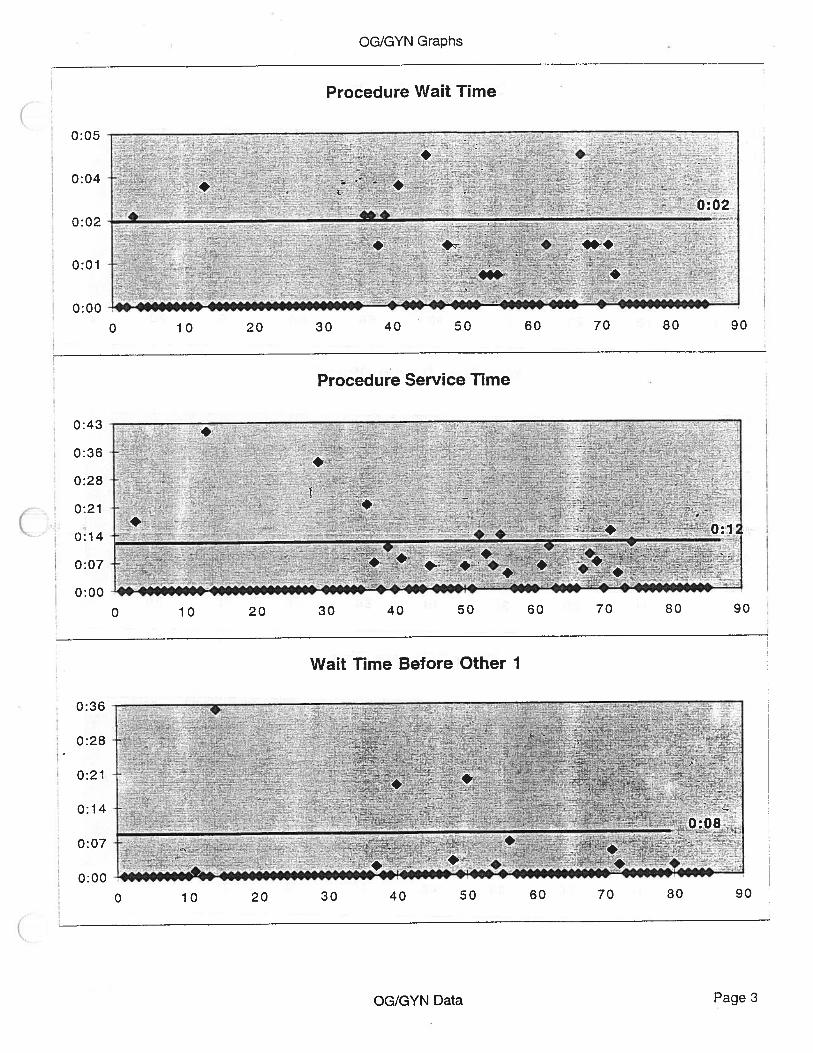
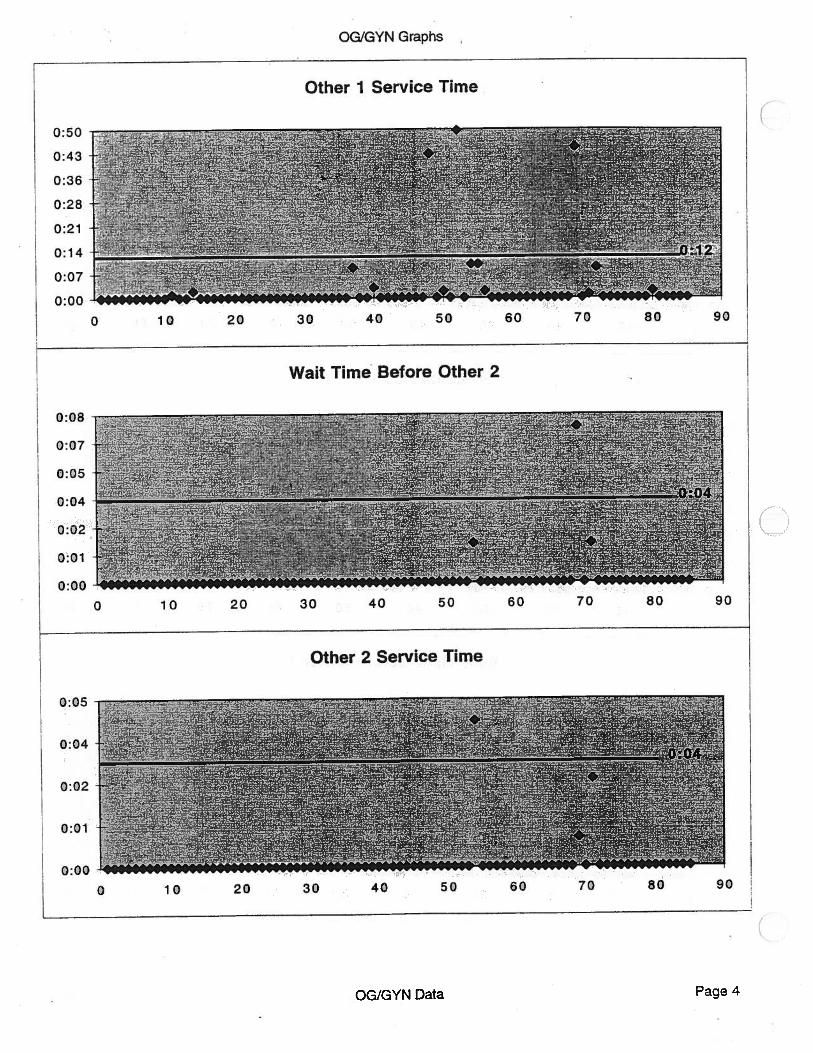
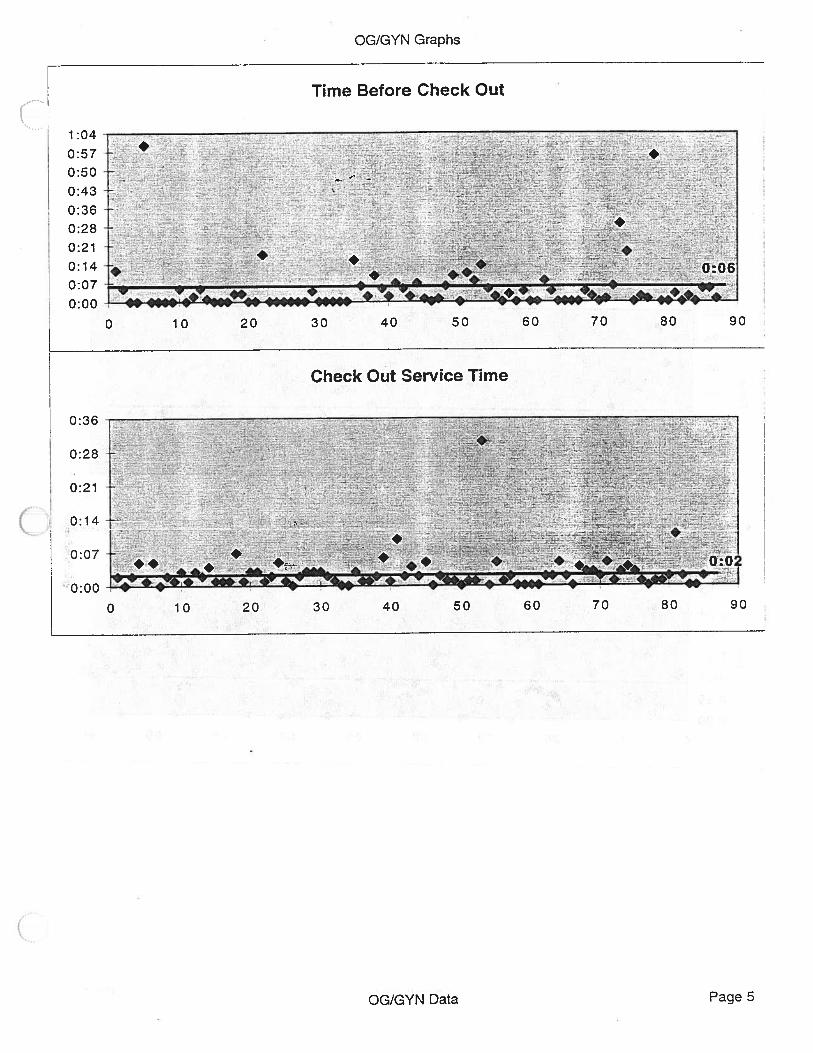
For each process flow step, the data was plotted on an x-y scatter graph (see
Appendix). The average lime was calculated and plotted on the graph also. These graphs
were used to illustrated the variance of times around the average, in addition to the peak
times.
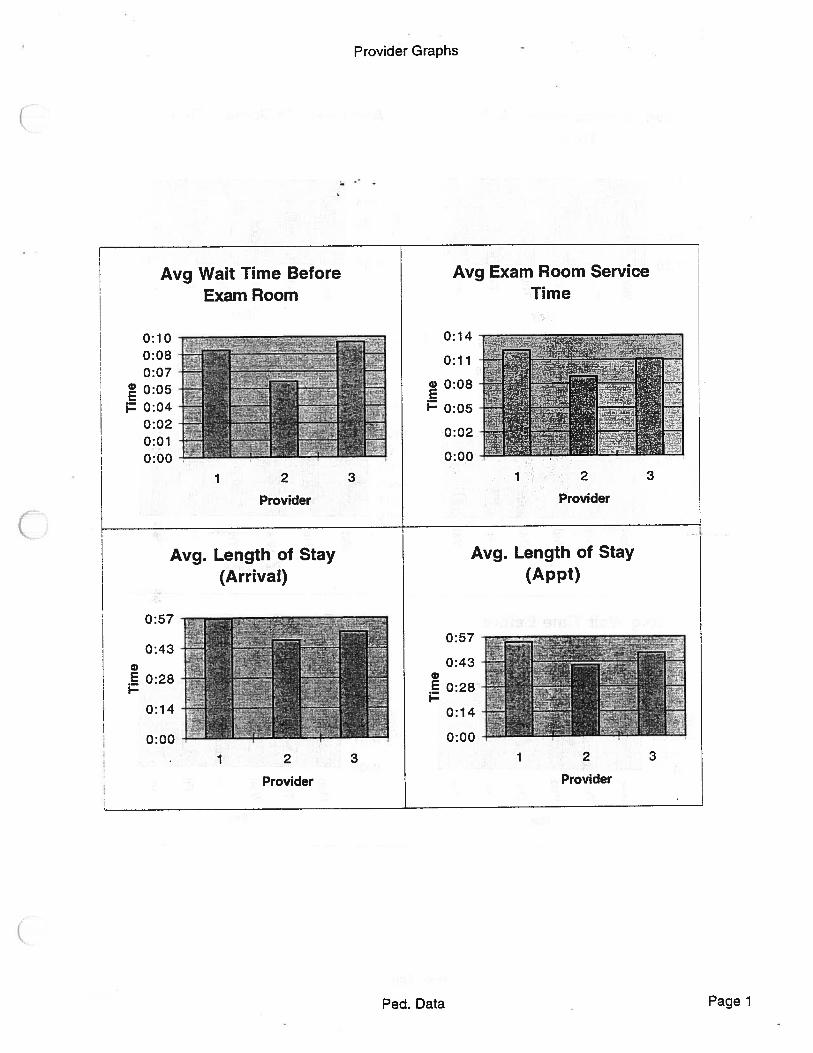
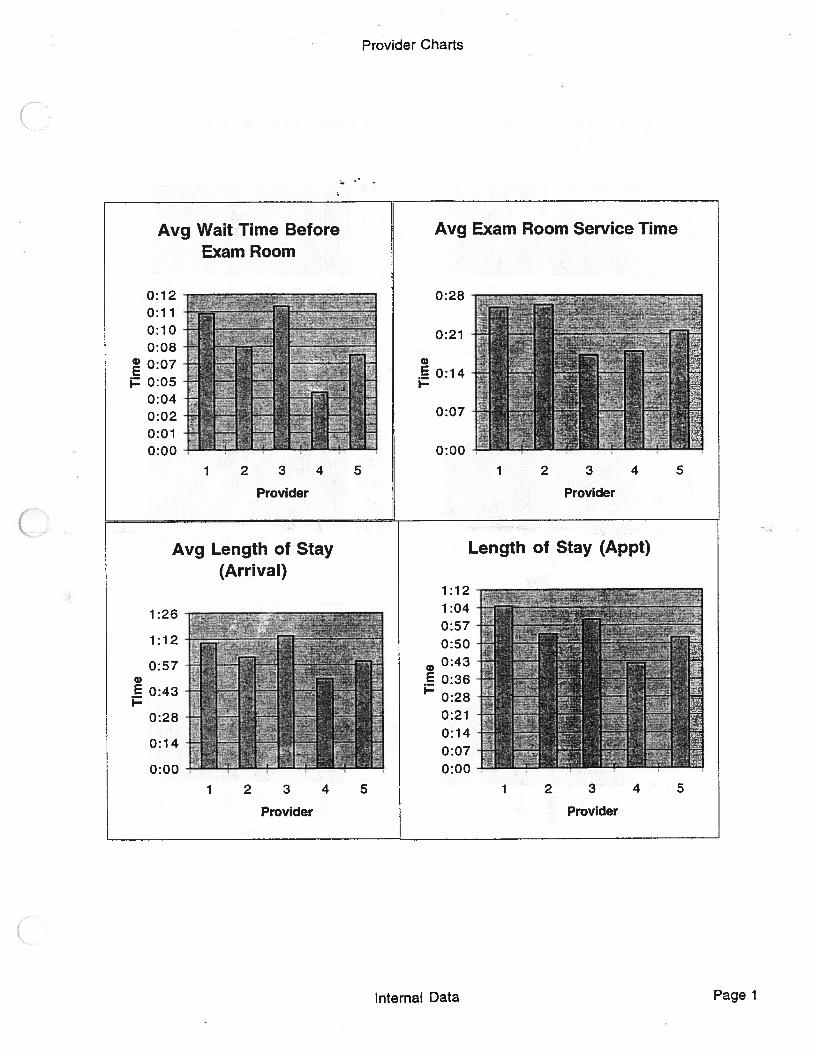
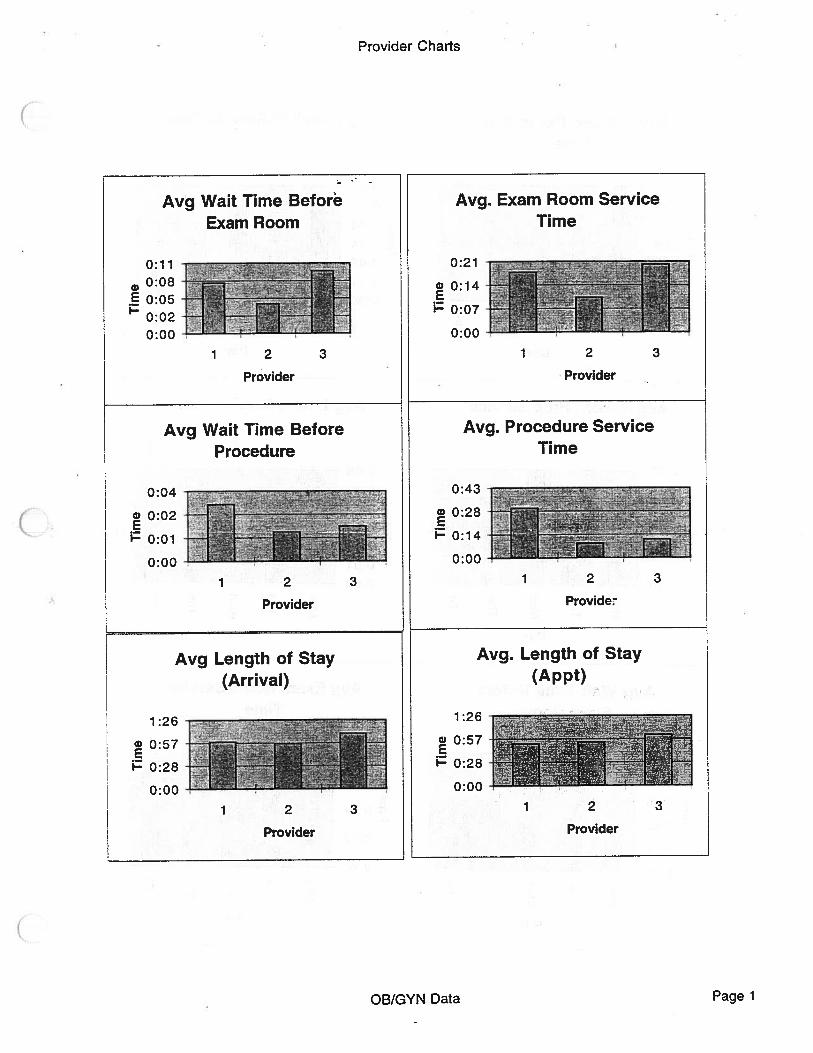
Next the data was re-sorted according to provider. This data was used to determine
the amount of time that each provider spent with a patient. For Internal Medicine, average
times were calculated for the wait time before the exam room, the service time in the exam
room, and both length of stay data. The same averages were calculated for Pediatrics.
Average times for the wait time before a procedure and the service time before a procedure
were calculated in addition to the aforementioned times. These times were chosen because
they are the times that providers directly affect.
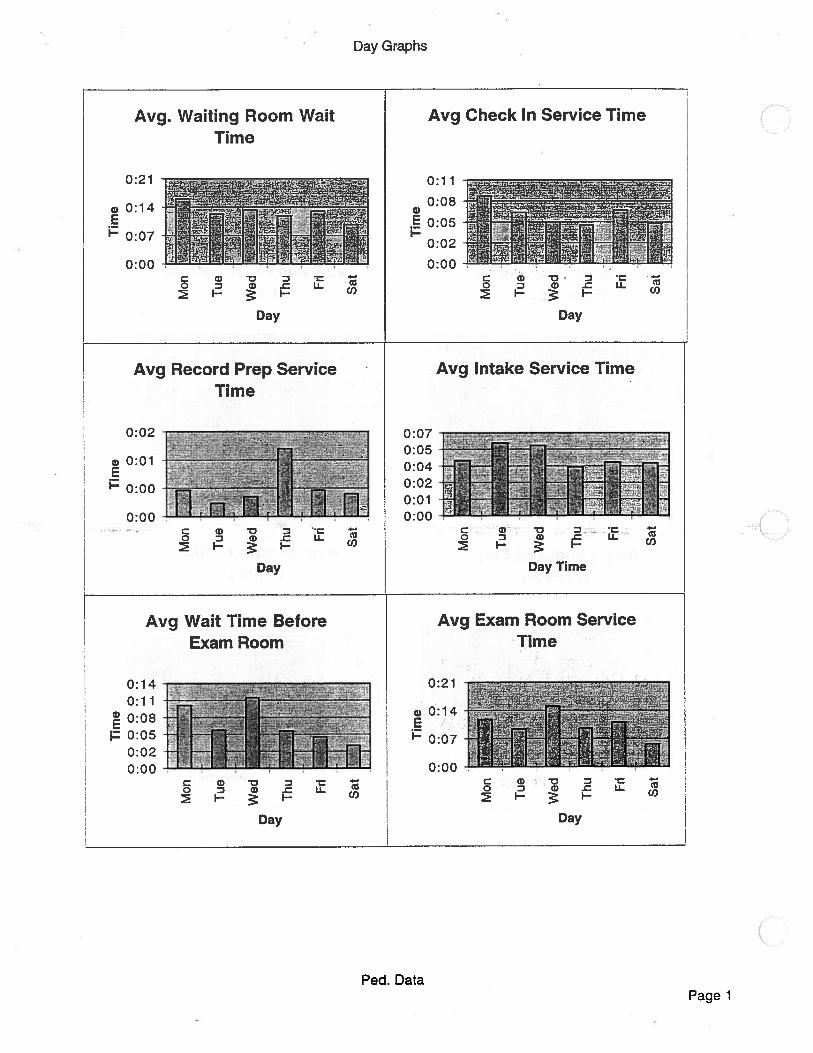
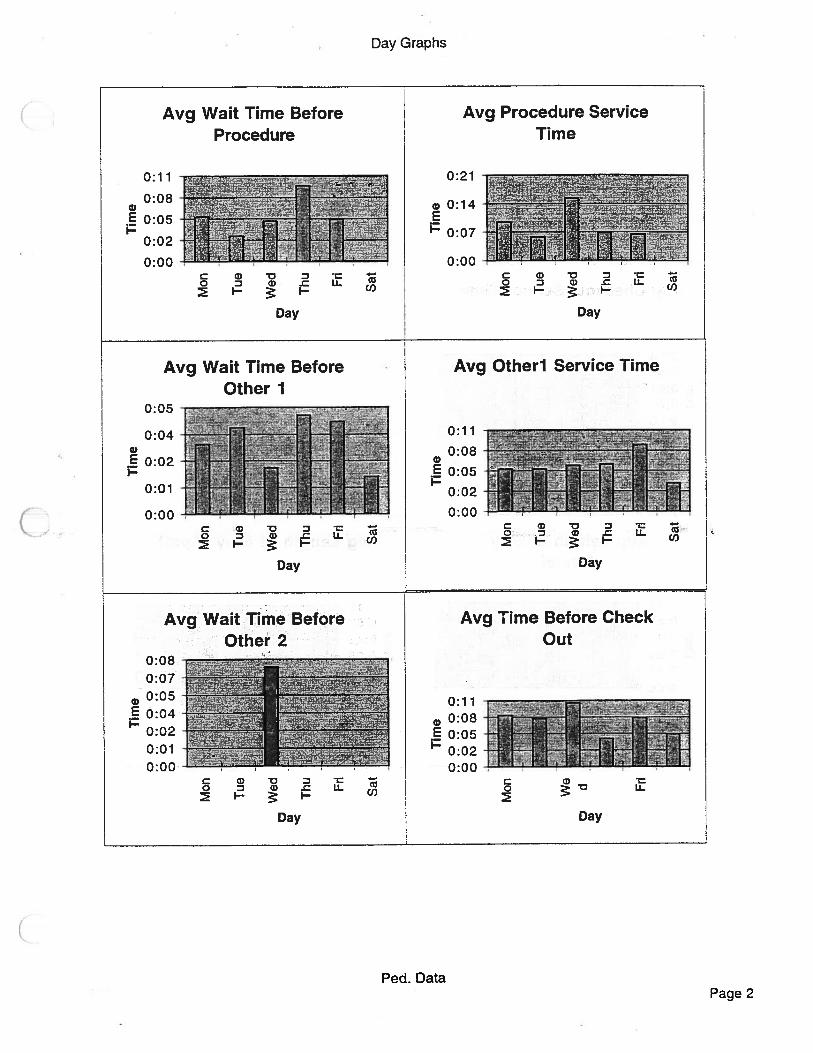
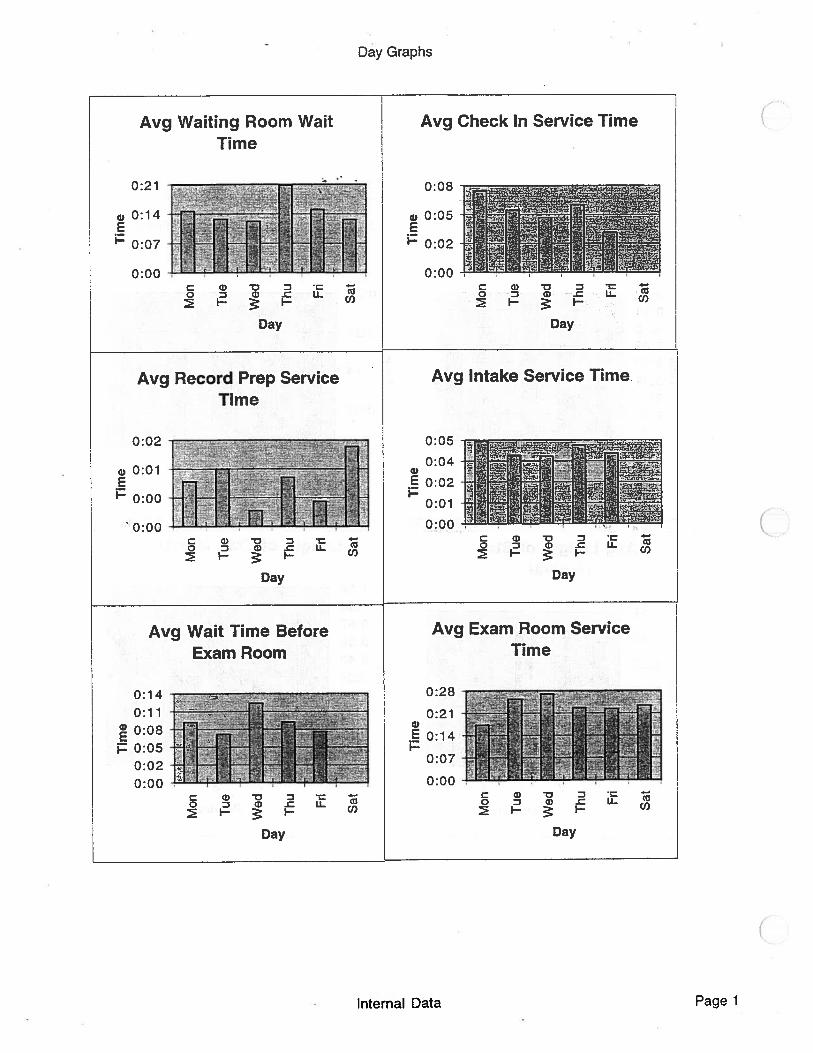
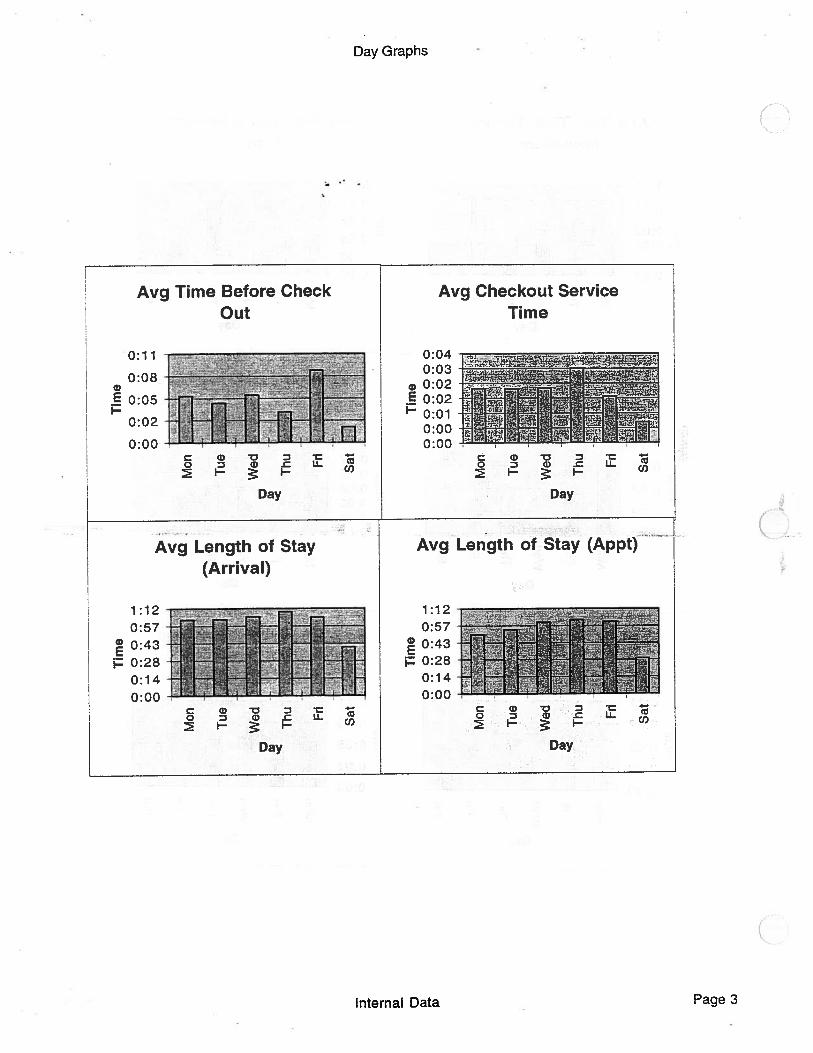
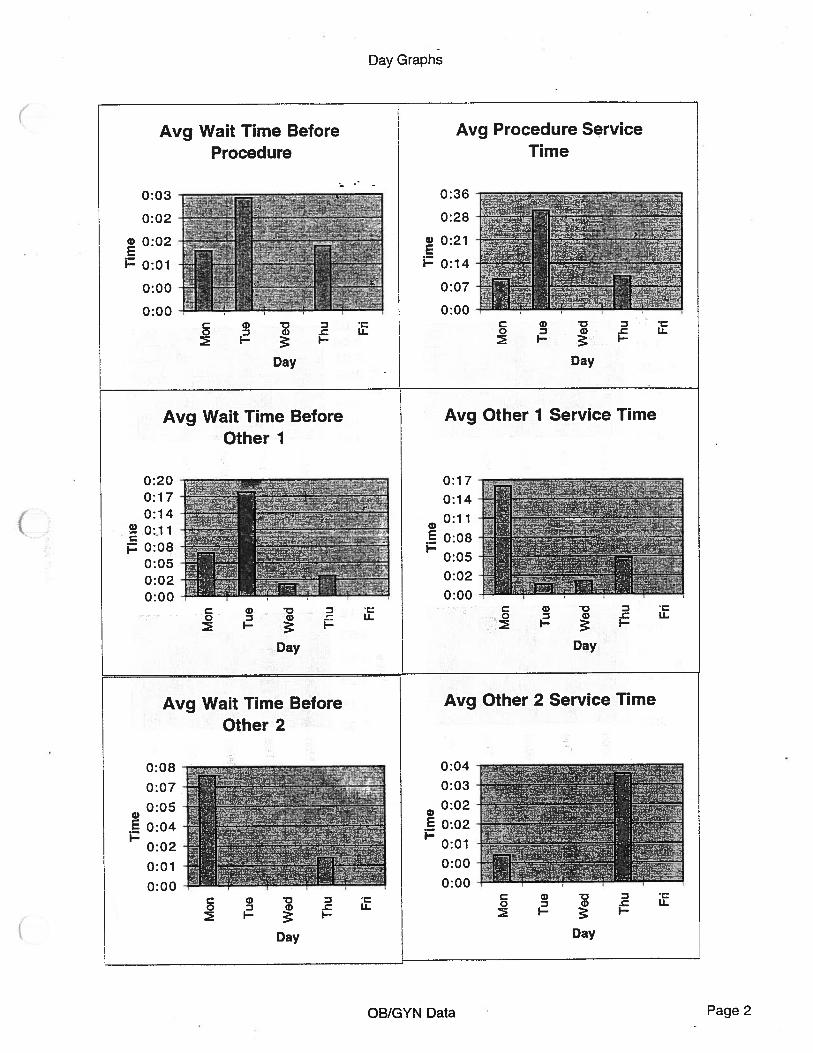
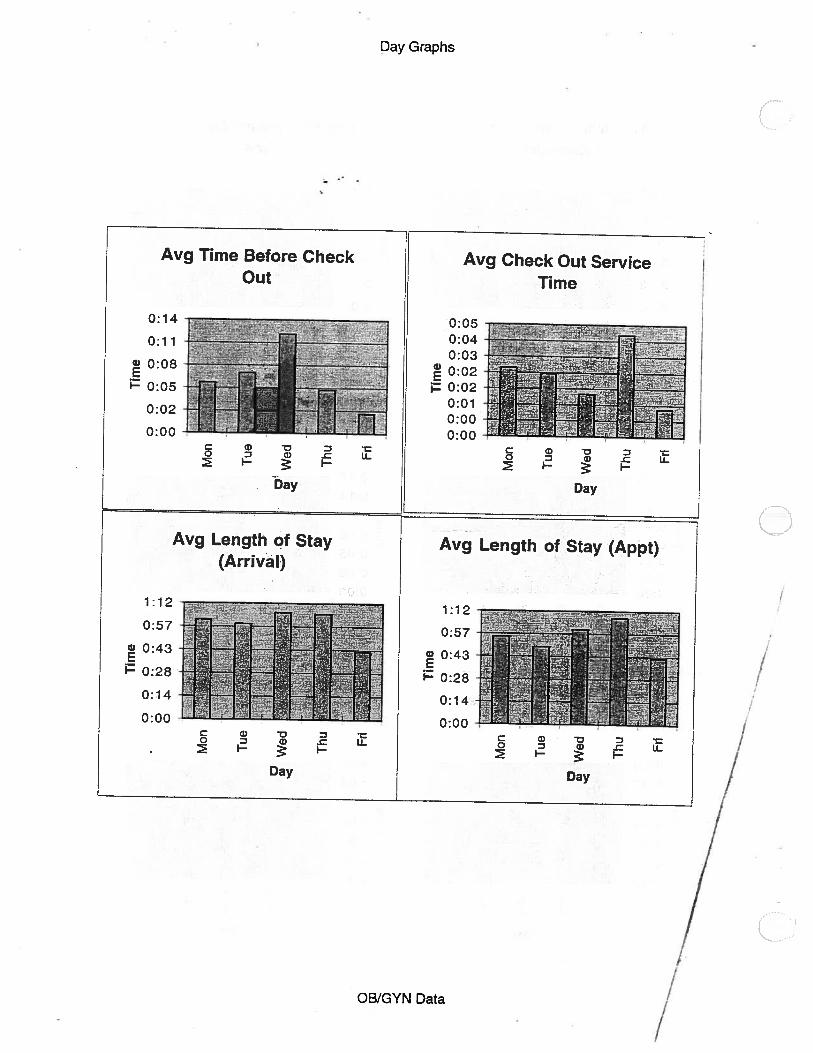
The data was again re-sorted according to the day of the week. This was used to
determine any patterns. This data was calculated for each process flow step, as well as the
4

length of stay data. We were informed during the time study that Thursdays were the
busiest day of the week. They were concerned that Thursdays had more problems. In (examining the data, Mondays and Wednesday had more wait times and longer length of
stays.
Conclusions
In the process of analyzing the data, the team noticed that, oftentimes, the patients
did not flow through the clinic in the order that was originally flow charted. The original
flow chart depicted the patient proceeding from check in, to intake, to the exam room, to a
procedure, to a second procedure, to a third procedure, and concluding with check out. A
tally sheet was constructed to determine the percentage of patients that actually flowed
through these steps in this order. This tally showed that few patients actually flowed
through the entire process. For Internal Medicine and OB/GYN, the majority of patients
followed this order through the intake step. For Pediatrics, most patients followed the
order through either the exam or the procedure step. This does not mean that the patient left
after these steps, it means that the patient went through the process in a different order.
This suggests that the current process of patient scheduling may be inappropriate due to
assumptions that have been based on an incorrect flow. The current scheduling assumes
that patients will be in one place, according to the original protocol, but in actuality, the
patient is elsewhere creating a backup.
From the wait times and service times, the team calculated averages for each
process step. The averages were converted into percent of average length of stay,
calculated using arrival time. Figure 1 outlines the original process flow and shows the
wait time and service time at each step. The percentages show the relative amount of time
that a patient would spend at a process step, if the patient went through that step. Figure 1
is the generalized process flow; not all patients proceed through the flow in this order, nor
do they proceed through every step. =
5
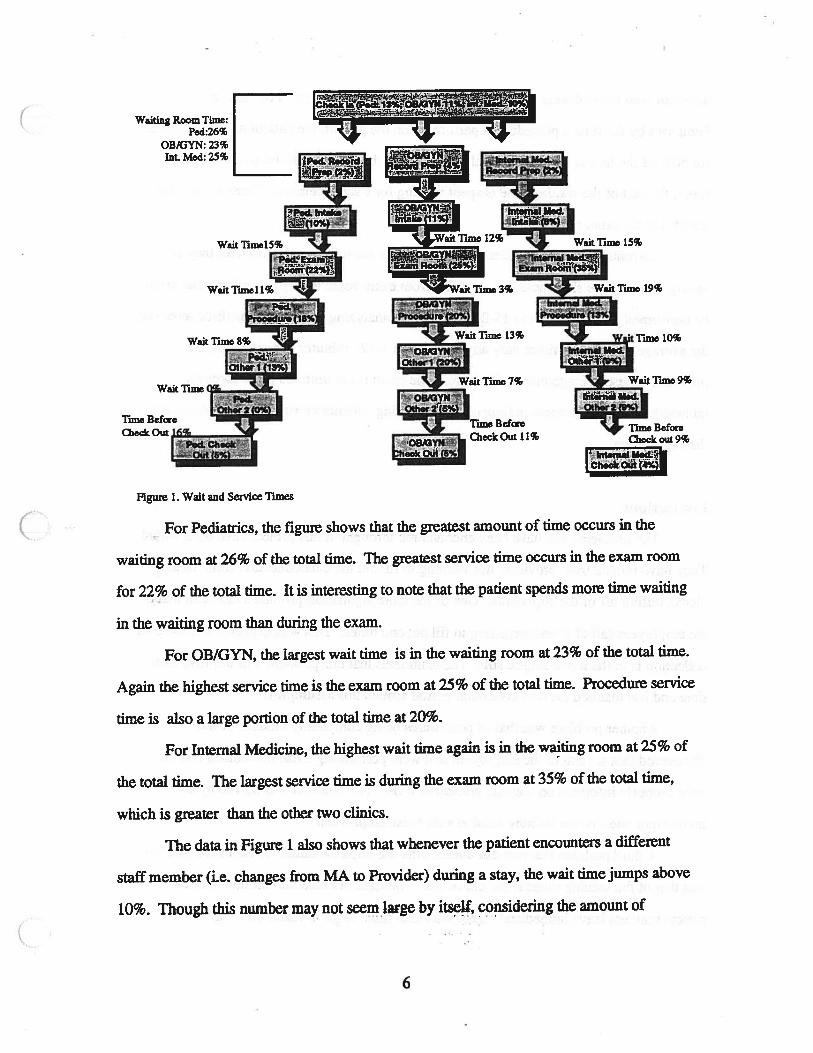
Figure 1. Wait and Service Times
(- For Pediathcs, the figure shows that the greatest amount of lime occurs in the
waiting room at 26% of the total time. The greatest service time occurs in the exam room
for 22% of the total time. It is interesting to note that the patient spends more time wailing
in the waiting room than during the exam.
For OBIGYN, the largest wait time is in the waiting room at 23% of the total time.
Again the highest service time is the exam room at 25% of the total time. Procedure service
lime is also a large portion of the total time at 20%.
For Internal Medicine, the highest wait time again is in the waiting room at 25% of
the total time. The largest service time is during the exam room at 35% of the total time,
which is greater than the other two clinics.
The data in Figure 1 also shows that whenever the patient encounters a different
staff member (i.e. changes from MA to Provider) during a stay, the wait time jumps above
10%. Though this number may not seem large by itself, considering the amount of
Waiting Room Time:Ped:26%
OBIGYN: 23%InLMed:25%
Wait Time
Time Before
Time 10%
Time BeforeQieck Out 11% Check out 9%
IbdwIalMed.I Ch.dc Out c4!41
6
different wait times during a stay, the number becomes very large. For instance, in
Pediatrics by the lime a procedure is performed on the patient, the patient has been waiting
for 50% of the length of the stay. Only 26% of that time is spent waiting in the waiting
room, the rest of the waiting time ii spelt waiting for a staff member. There are similar
results for the other two clinics.
Currently patients are scheduled in time slots according to the provider they are
seeing. These time slots include everything from exam room to any procedures that might
be performed. They vary from 15-20 minutes. In analyzing the data it was discovered that
the average exam room times vary anywhere from 10-27 minutes depending on the
provider. These average times only include the exam room time, no procedures are.
included. These differences in time causes incoming patients to wait longer before going to
the exam room.
Limitations
The problems that have been encountered throughout this project have been varied.
They have ranged from providers not wanting to fill out the data collection form, to the
clocks falling off of the clipboards. One of the more significant problems has been that of
the employees (all of them) forgetting to fill out end times. This was expected and the data
collection is in the initial stages, still. The team feels that this problem will improve over
time and has planned the data collection period around this assumption.
Another problem was that of procedures being completely missed. It was
discovered that several of the employees that were performing these procedures had not
been properly informed on the data collection form. The problem was solved by an
impromptu one-on-one training session with these employees.
A third problem that was discovered after the implementation of the data collection
was that of the waiting times at the check out. The team did take into account that the
patient may not leave immediately from the exam room to go to check out. The are
7
occurrences in which the patient will change a baby’s diaper, go to the bathroom, et cetera
before proceeding to the check out. This will cause the data to show a long wait time at the
check out, when this may not truly be the case.
A last problem that occurred was daylight savings time. Due to the time change, the
majority of the clipboards were changed, but not all of them. This caused a discrepancy
between the check-in clock and several of the clipboards, causing an excessively large
waiting room wait time.
Several issues that will impact the effectiveness of the project include the
participation of the employees. We anticipate resistance of change from physicians, as well
as all other employees that may be requested to alter their routines. In addition, there seems
to be a small problem of cooperation between the different levels of employees. For any
improvement in effectiveness, physicians, nurses, and medical assistants will be required
to cooperate totally and to be open to ideas from all types of employees. Perhaps the
largest issue will be the time constraints of the involved employees. It will be very difficult
to meet with employees as a single group because the majority are part-time.
Recommendations
To alleviate the large patient wait times, the Northville Health Clinic should
redesign the way they schedule appointments and improve the communication between the
staff. For the scheduling issues, the clinic is considering standardizing the appointment
iime slots to 15 minutes per patient. According to the data this means that providers must
spend less time with the patients or the procedure times must be shortened. A continuing
study should be conducted to provide a means to shorten those times. This is outside the
scope of our project. Another concern we are not able to address is scheduling new
patients as opposed to returning patients. In general new patients require more time to
establish a record. This also would affect the amount of time that should be allowed for a
patient visit.
8

There are a few ways to improve the communication at the clinic. Throughout the
study employees commented that it was often hard to fmd someone they were looking for.
Providers didn’t know if they had a patient, nor which room the patient was in. The
current system of flagging the doois is hard to see from different areas of the clinic and the
flags are inconsistently used. A dry-erase board could be used to track the patients through
the clinic. The patient’s provider, exam room number and chief complaint could be listed
and easily referenced by the staff. This board could also be used to track the staff, to know
when they are in the building, in an exam room, or out for the day. The board would be
placed in an area that is prominent to staff members of all clinics. The board would be an
easy way to present up-to-date information consistently to everyone. This will reduce wait
times that are caused by searching for staff members.
9

Appendix
Data Collection Form
Pediatrics Data
Internal Medicine Data
OBIGYN Data
C
10
Northville H1f, Center Data Cniifñ4aForrnI-Visitinformátioñ
Date:
Appointment Time:Clinic: — Peds
OB/GYNInternalOther -
Provider:— --
- _
-Activity Who StarLTime EWthfltheCheck-In (from patient sign in to medical record in box) — Clerk (Arrival time)
MAProviderNurseOther
Medical Record Prep- MA (insert forms, fill out forms) — ClerkMAProviderNurseOther
In-Take (height, weight, temperature, documentation, — Clerkchief complaint) — MA
ProviderNurse
- — - — Other
Exam room-Provider (actual time in exam room) — ClerkMAProviderNurseOther
Procedures (shots, eye treatments, pelvics, etc. take place — Clerkin exam room) — MA
ProviderNurseOther
Other (please specify) — ClerkMAProviderNurseOther
Check-Out (pay, future appointments) — ClerkMAProviderNurseOther
Comments:
C
C
Fall 96/ICE 481/Data Collection Form.12/9/96
Ped Graphs
Waiting Room Wait Time
E b028
iZ 021 •014
0 50 100 150 200
Check In Service Time
1:12
____
057
__
_
0 28 -f- 3
014
__
0:00
0 50 100 150 200
0:04
0:02
E
0:01
0:00200
Record Prep Service Time
0 50 100 150
Ped Data Page 1
InTake Service Time
0:23
______
0 08 - -• - •..
____
•• .*, .0:05 * . i-002
0:00 * • • ••• • •* “ ‘
0 50 100 150 200
Wait Time Before Exam Room
Ped Graphs
C,EI,
0 50 100 150
Exam Service Time
200
EI-
0 50 100 150 200
Ped Data Page 2
Ped Graphs
0:20
0:17
0:14
0:11S
0:08
0:05
0:02
0:00
Procedure Service Time
0:36
0:28
0:21S
0:14
0:07
0:00
0:120:110:100:080:070:050:040:020:010:00
Wait Time Before Procedure
0 50 100 150 200
0 50 100 150 200
Wait Time Before Other 1
0 20 40 60 80 100 120 140 160 180
Ped Data Page 3
Ped Graphs
Other 1 Service Time
F-& -
flI9
_
ze%cf tit7s:;;?;7-L
— —‘ — -w’t-. t—1it,A±
-s r’r - — :z -2v2 -‘---
;- • -
Iiai•iii •iil• •ii.e.fataw%0 50 100 150 200
0:20
0:17
0:14
o 0:112
0:08
0:05
0:02
0:00
Wait Time Before Other 2
0:08
0:07
0:050•g 0:04I—
0:02
0:01
0:00
0 50 100 150 200
Ped Data Page 4

Ped Graphs
Time Before Check Out
I!
____
050 - -
0 28 T - rt 4— ‘-‘ 4 r
I - a -J&t—.-- —4 4’--a- I .sC i 4j’t 40 14 Y W - 4j ziC
0 50 100 150 200
Check Out Service Time
4)C
I-
0 50 100 150 200
Ped Data Page 5
Tim
e909
!‘9!‘
o1’
)C
i10
0110
Ci
ooz
-40)
Ci
41’.
)
01:
I
Tim
eo
00
-‘
-L
okS
1’)
Ci
10
01
ow
-40)
Ci
41’
)
0 Ci
0r CD z Ca S -b Cl)
0) ‘C •0 0 I
Ci o 0 0 -L (Si
0 1’)
0 0
-o CD 0 a -o (0 CD 0)
r CD CD r4•
S 0 -l 0 a 0) ‘C 1 -I C 0)
0 0 -L 0)
0
-u CD a 0 -c (I)
10 0 0
Provider Graphs
Avg Wait Time BeforeExam Room
Avg. Length of Stay(Arrival)
Avg Exam Room ServiceTime
0:14
0:11
0:08
0:05
0:02
0:00
0:57
0:43
• 0:28
0:14
0:00
Avg. Length of Stay(Appt)
EI-
1 2 3
Provider
1 2 3
Provider
• 0:28I-
1 2 3
Provider
1 2 3
Provider
Ped. Data Page 1
Day Graphs
Avg. Waiting Room Wait
0:21
a, 0:14E
0:07
Time
0:00 Ia - D • —
0 D a Li..I— I— U)
Day
Avg Record Prep ServiceTime
-
Ii [i
Avg Check In Service Time
0:11
008j-_N-:. I
0:07
C G) D D —0 D 0 .C LL.
—
U)
Day
Avg Intake Service Time
0:050:04
111
Day Time
i- U)
Day
0:02
a 0:012
0:00
0:00 J JC a, - D0 D a) .C Li..
I— I-
Day
Avg Wait Time BeforeExam Room
0:140:11
0:08j.Z0:05
0:02 -
0:00
Avg Exam Room ServiceTime
0:21
ci 0:14
____
20:07
0:00
Day
Ped. DataPage 1
Day Graphs
Avg Wait Time Before Avg Procedure Service
Procedure Time
_______ ______
::005
___
007:Day Day
Avg Wait Time Before Avg Otherl Service Time
Other 1
04 1
___
0:11
:::
_____________________
I— : I— I—
Day Day
Avg Wait Time Before Avg Time Before CheckOther 2 Out
0:080 07
__________________I
_________________
Day Day
Ped. DataPage 2
Avg Checkout Service Time
Day Graphs
0:030:020:02
jZ 0:010:000:00 I Ii Lll ltl lI• LI I1 I
C0
I—a) -
Day
Avg Length of Stay(Arrival)
1:120:57
a)
jZ 0:280:140:00
Avg Length of Stay (Appt)
1:120:570:43
jZ 0:280:140:00
-øa, .c
I—
Day
Ped. DataPage 3

00
00
00
00
0
00
00
00
0-‘
-
0-
I\)
40
1—
I0)0
-L
0
00
00
0•...L
..L
b-
r%)4
01-
F’.)
04.
0)
C.)
—J
1’.)
0)
(31 a
00
00
0-L
L-
0-
F’.).
01-
F’.).
(Fl
00
)C
.)F
’)0
)0
0l
0
(31
0
-S 0 0
(31
0 -S 0 0
CD C, 0 -o -I CD •0 (1)
CD C) CD —I 3 CD
F’.)
0 0
C)
CD C, (0 CD 1 C) CD -l 3 CD
CD -I 0 CD CD -S
-s (Ji
0
—S
0 0 -L (31
0 F’.)
0 0 F’.)
(31
0 C.)
0 0
(0 0 0 3 -i 3 CD
D CD -‘ G) (1)
01 0
F)
0 0
C.)0
-0
F’.)
(31
0 C.)
0 0
—I 3 CD w CD -h 0 CD m x 3 0 0 3
o0
0-
Eo
(31
rz(3
1N
)o
co-
)0
1
0
c•:S
o-
4-‘
Co0)
C.)
0
01 0
00 (5
1a -A a 0
0 a
(31 a
-A 01 0
-A 0 0
m x 3 (1)
CD C, CD -1 3 CD
(51
a
1’)
a 0
7 ‘-4 CD 3 ci
-4 -c
il) CD CD
-A 01 a
N)
a 0
CD Cl)
CD C, CD —I 3 CD
7.
-4 CD 7 G) -D C’)
1’.)
(7)
0
N)
0 0
t) 01 a
(-‘3
0 0
01 a
C-’)
0 a
C.)0-
0
Internal Graphs
2:09
1:55
1:40
1:26
1:12
0:57
0:43
0:28
0:14
0:00
0:390:360:320:280:250:210:180:140:100:070:030:00
1:04
0:57
0:50
0:43
0:36
0:28
0:21
0:14
0:07
0:00
Procedure Service Time
Wait Time Before Other 1
300
Wait Time Before Procedure
0 50 100 150 200 250 300
0 50 100 150 200 250
0 50 100 150 200 250 300
Internal Data Page 3
9999999
o0
00
-
or’
(Si
Q-
0000000
•
01\
Z(S
i(
-
p
0 0-I
0 0 0 0-I
0
0 (3’
0 0 0 (31
0
•.
:.
H
0 CD Cl)
CD C, CD -I 3 CD•1
•..
0 0
:3 CD -ç p3 -o p3 CD
-1 3 CD 03 CD 0 -‘ CD 0 CD -
00
00
00
0
bo
rz4
0c3
0)
4;.
• Cli
•.
..
0 CD -I Cl)
CD -I C) CD -1 3 CD
(31
0 0 0 -s (31
0 r%) 0 0 (SI
0 () 0 0
r\) 01 0
:3 ‘-I
(P :3 p3 -‘ (1)
r’-) 0 0 (31
0 () 0 0
C.)
0 0
00000000000
oo
oo
—-”r’r’r\F
\04J0(01
00
00
0
;i
is:)4
010
401
C4)
4
ei
II
I0
ri.)
0
0 01 0 0 0 01 0
0 0)
0
C) CD C) 0 P.
C,)
CD C, CD CD
D CD LD -o CD CD 01
a)
0
r’) 0 0
-I CD C-
CD -k 0 CD 0 CD C, 0 P.
D CD -‘ -o Co
0 0
r’) CY1
0
-L 0 0
C.)
0 00)
0
a a C)
a U)
40
c’J
CO ci
al C I.— a) C
I I act
>% Cu 4-’ C,)
II 0 4-’ a)
C a) -j
CD C)
C”
0 C” C” C” C a— a) 4-’ C
0 U)
7-
4-’ 0 Cu 4-’ Cl)
N- 0 a)
C G) -J
0 U)
,0
Os-
C\3
‘fU
)CD
F”CO
CDU
)C
JC
C’J
CDC’
JCD
C0
dC
JC’
.J000
Provider Charts
Avg Wait Time BeforeExam Room
0:120:11
Avg Exam Room Service Time
:0:07
jZ 0:050:040:020:010:00
LL1LII t.iLJH’E1
a)E
I—
Il”;
1 2 3 4 5
Provider
1 2 3 4 5
Avg Length of Stay(Arrival)
Provider
1:26
Length
1:12
of Stay (Appt)
I -
4i
0:57 fJ’:a)E 0:43
0:28
a)EI-
0:14
0:00
1 2 3 4 5
Provider
1 2 3 4 5
Provider
Internal Data Page 1
aj 0:01 :-‘J:
. :::I.- U)
Day Graphs
C’
Avg Wait Time BeforeExam Room
Avg Exam Room ServiceTime
0:14r. .4v. 1 —
. - .
• n a -
________
—--- :- .- ‘ i4’
Avg Waiting Room WaitTime
0:21
Avg Check In Service Time
I -.. P’.,-.0:08
014 -- .-r
0:07 t
_________
C 12) D —0 Ci) C CU
-I— Cl)
0:00 IIlIkt!.i
I— I—
Day
Avg Record Prep ServiceTime
Day
0:02
Avg Intake Service Time.
0:04a’• 0:02I-
0:01
0:00 -
Day
12) • D •t —D Ci) C LL-
ci)
Day
I—
0:21a)• 0:14 H
I-0:07
C a) • •C —0 (2) .z CU
I- I- U)
Day
C a) -
0 Ci) .
I-
Day
Internal Data Page 1

Day Graphs
Avg Wait Time Before
Procedure
0:17 .
C 0 - D —0 D 0 C U
-
U)
Day
Avg Wait Time Before
Other 1
0:11 •
I — - —-
-
008a)
. 0:05I-
0:02
0-00 ijri--i rr
C ci) - D —0 Z ci) C LI..
I— U)
Day
Avg Wait Time Before
Other 2
0:11
0.08 —----.-__L
-
_________ ______
_____
____
0 02 ririi ri0:00
I— 1- U)
Day
Avg Procedure Service
Time
0:14
- I—
Day
Avg Other 1 Service Time
0 08
0:07
_______________________
a) 0:05
4
__
z
_____
0.010:00 -i ., I
C (1) V D •C —0 D (I) - U
- I—
Day
Avg Other 2 Service Time
0:11 -
0:08 -4
a)
0:05 -
I-0:02 -
0:00C ci) -
0 D ci) C LI..)—
Day
Internaf Data Page 2
Day Graphs
C) D —0 D C) .C LI.. Cl)
Day
Avg Length of Stay(Arrival)
1:12 I
__________
O43
F— F-- Cl)
Day
Avg Time Before CheckOut
0:1 1
Avg Checkout ServiceTime
0:04 . .
‘ II! kp4IIJJiatErPrTJ
I— Cl)
Day
Avg Length of Stay (Appt)cS..
Day
Internal Data Page 3
OG/GYN Graphs
Waiting Room Wait Time
Check In Service Time
0:36
:
___
\ r,- &!‘ WYt’ -4- :-=i
- - -. - .—. - -
St- -r-.,.
-‘ fr $*-ñ Ei-
4 ttZrr4sr 4-i
0 14 r-:-
- -• •-wp:4r:tt rj
007• . t %t•
000 4fr
0:280:250:230:200:170:140:110:080:050:020:00
0 10 20 30 40 50 60 70 80 90
0:57
0:50
0:43
0:36
0:28
0:21
0:14
0:07
0:00
0 10 20 30 40 50 60 70 80 90
0:28
0:21
Record Prep Service Time
0 10 20 30 40 50 60 70 80 90
OG/GYN Data Page 1
(1)
0.
(!3z>-CDCD0
a)EIE00ECuxUi
G)EI—a)C)a)U)E00E(UxUi
(z>-CDCD0 c\j0(‘3
a)EIG)C)>I0)U
)a)CUC
,.
.
:.,.,
.,0’
.:•:‘....o
.‘.
i
l”
11
I
ilI
II
lI
r
L:
\I1
.:
.O
...:.
,,,:..
‘,
,.;i...../..:..
A’
••‘•
:‘
..
...
.‘.
.
.::....
..
.:
.4..:
C)
CIS—
•ct-
Co
tOC’J
C
-‘--:9
99
9dàdbooooo
00)0Co
00(0Cto00c)
0c’J0r0
0
1:‘,“
:çi
•::v
ri
I
i
1+
111
111
4’
IIII
•,
1IjT
14
1141
4
ll
4l
11”
4I’1
4II
I-i,.,1
I•1I.r.i
...,Ii.
I1
1I4
...ii..i,:’
,.•
:,
•:•.
‘.4
•
.
•.
C0)
CC0Cr,
Cto0C0C’J
010
I10
••
,I,
A:T
144,4‘V
‘Ii;:irI
Jl
I4I4
IjI
IiftI
II
441J,,I
k1
i
I4
‘III
I
I
•1
1I
I
I•
I4J1J1?L
lJIIIIrl
%
AII
I1
1
4•
00)
0Co0F”CCOCIs)
00C)
0(“3Ca
CDC
o-
t’•-0
rC’J
(‘39
9d
àà
00
a
00
PP
b•-
F.’)
o
0 I’)
0 C.)
0)
0
00
•0
00
0
0•
04
—03
0)
C.)
o0
0p
00
o-
F\)
30-
I
0 0 Fl.) 0 (.3 0 0
0 F’)
0 C.)
0
01 0
- 3 CD 03 CD 0 -I CD 0 CD
0 01 0
0)
0
0 G) 0 z cJ p3 -u p3 (0 (U C.)
-o 0 C, CD C - CD (1)
CD C, CD -I 3 CD
0 0 Fl.)
0 C.)
0 0 01 0 0)
0 -.4 0 03 0 (0 0
*i.
0.
rI.)
0
0)
0
-o 0 C) CD -‘ CD -I 3 CD
0 0 G) z 0 p3 t3 (I)
03 0
-.1 0
(0 0
cC)
0
0..
;.::-
(0 0
QGIGYN Graphs
0:50
0:43
0:36
0:28
0:21
0:14
0:07
0:00
0:08
0:07
0:05
0:04
0:02
0:01
0:00
0:01
Other 1 Service Time
Wait Time Before Other 2
90
80 90
0 10 20 30 40 50 60 70 80
in•iu.Oe.0 10
0:05
20 30 40 50 60 70 80 90
Other 2 Service Time
0:04
0:02
0:00 -‘N(SSSlt
0 10 20 30 40 50 60 70
OG/GYN Data Page 4
C,)
Ct’
z>-(30
0C)a)C)a)0‘4—a)ma)EF
-
CD
C
AP
t
4
•
H1
00)
‘0CD00C
o
0U,
00Ct)0N00
a)EI—a)C-)ci)U
)z0C)a)-cC)
Li)
U)
(Uci.CU(U0z>-(3(!0
c1—
0-
,
1•
4
••
•‘?.
H:
•
4
H,•
CDCD
‘-
f1_
0C
)N
‘!‘z
da
oo
oo
00)
0CD00CD0U)
00C’-)
0N00
II.4:4
tt-..0
Ct)
CDCD
0IS)
It)t
C’)
NN
00
00
00
‘—0
0
00
0
0 0 z ID
I CD I-I. 0 -b Cl)
I- CD CD P.
0 Cl)
P.
-
Tim
eo
o0
-‘
-r
r’3
OS
)n01
0a)4a)01Z
0
Tim
eo
p0-
-.
rJr
0r)01r(fl)C
5i
oa)
.J0)
01.1
.I\
)
-. 0
0 -L 0
I’.)
00
0 0 01 0 0)
0
C.)
0 0 (71
0 0)
0 0 a)
0 CD 0
-“I
C
-o CD CD 0)
a) C CD 0
Provider Charts
Avg Wait Time BeforeExam Room
I!:I 1 1
1 2 3
Provider
Avg Wait Time BeforeProcedure
1:26
0:57
1 0:28
0:00
Avg Length of Stay(Arrival)
0:21
0:14
I— 0:07
0:00
0:43
0:28
) 0:14
0:00
0:110:08
• 0:050:020:00
Avg. Exam Room ServiceTime
1 2 3
Provider
0:04
0:02
I— 0:01
0:00
Avg. Procedure ServiceTime
1 2
Provider
3 1 2 3
Provide
Avg. Length of Stay(Appt)
1:26
0:57
I— 0:28
0:00 I1 2 3
Provider
2
Provider
3
OB/GYN Data Page 1

—4ç{
__
__
__
__
__
__
_
—i:-’
‘
:::I.;I
a)EI—a)C.)
C)C’)C.)C)
C-)
flI4j
-P8M
en-I
uov’
C)EIC)0I-.a)(1)C)
__
__
__
_
f3fj
TI1
1
:
________
‘-L
tC
’Ji--0
oo
00
00
0
oaoa000
OW
!!
nqj
peM
en
!
UOLAJ
oc
00
U)
-c(3>..
U
UC
%J.0
00000
ow
l!
-
1_.
C)0>a)U)E00
OE
r
Pdflij
peM
en
!
uov’1
A
0)3)
(‘5a(‘5(‘IUz>-00
N0
--T
F:fr:i:-
:j.;iq
:
*ø
,-N—
00
OW
!!
r—0
00
.1-’
E000)
flupe,’
eni
UO
V4
a)C.)C)(I)C)a-a)
00C)cc>
—;;
I—
j)
-L
r)c%
J0
i-i---0
0Q
0
a000000
__
__
__
PdPM
en
j
Uo
a)I-
0C)C)
0I—c
Cx
0)
P°M
*i
S.1
l-:
_______
enj
rh’+
_____
uovJ
-co
L().--00
ddoow
l!
NO
00
SW
!!O
W!!
Avg Wait Time BeforeOther 1
Day Graphs
0:20
011
Day
Avg Wait Time BeforeProcedure
Avg Procedure ServiceTime
EF-
Day Day
Avg Other 1 Service Time
0:17
0:14 -
0:11 -
• 0:08 -
F-0:05 -
0:02 -
0:000
0 0I-
Day
D •
- u_F-
Avg Wait Time BeforeOther 2
0:08 I--- -.ir --‘•
I - .- -
---
-
0:05
I______Day
Avg Other 2 Service Time
0:04
0:03
0:02
• 0:02
0:01
0:00
0:00
Day
OB/GYN Data Page 2
0 03 G) z 0 0 0
CD r CD CD 0 cn
1< -a
CD -1 9 CD
Ow
—-I 0 -I CD C)
CD 0 CD C) CD_10
CD U
) m •1 0 CD
Tim
e
oi
oc
C.)
-J
Tim
e9
?9
0oo
oooc::i
or\)
(31
OL
Wed
CD
—‘‘ CD
-I -C
D—
.P
.
Wed
(1)
P.
Tim
e?O
OO
OO
Oo
oo
ööè
Tim
eo
00
00
-.
o-
.cn
-
o.
coC.
,-.4
N)
Mon
__
___________
1iJ;
Tue
___
_________
Wed
___
___________
f,j;
:‘T
huL
Fri
__
__
Mon
0 0 G) -o (I,
Tue
Wed
L_
__
Thu Fr
i