Embed Size (px)
Citation preview

economies do not behave like companies
competing in markets for ordinary goods.
The reality is more complex. Our readers
may usefully refer to the key figures
page, compiled by Salim Bouakline and
Oliver Sartor, which helps to illustrate this
complexity, using national and sector-
based evidence, notably with respect to the
United Kingdom and steel production.
For political decision-makers,
an important aim is to encourage
technological innovation while avoiding the
risk of companies moving their operations
abroad. Such moves could lead to
“carbon leakage”, as emissions are simply
moved from a carbon-constrained region
to regions where no carbon constraints
apply, resulting in a potential increase in
emissions. Decision-makers have a tool kit
at their disposal to plumb the leak, which
Oliver Sartor has also described. That kit
is not very extensive, and, unfortunately,
it only contains double-edged swords! It
must, therefore, be handled with care.
ClimatSphereThe newslet ter on the economics of c l imate change
Emilie Alberola shows us how to use the
tool kit: the benchmark-based allocation
that will be applied from 2013 onwards
within the EU ETS is a kind of free allocation
which enables the risk of carbon leakage to
be reduced.
The debate on EU ETS, competitiveness
and innovation in Europe is far from over.
The final details of Phase III (2013-2020) will
be decided in late 2011 at best – assuming
that European institutions adhere to these
ambitious deadlines. Moreover, the US
Congress’ discussions about defunct draft
laws intended to create a CO2 allowance
system have shown that the Europeans
are not the only ones to ask themselves
questions about competitiveness.
Meanwhile, the emerging powers, especially
China and Brazil, will not be outdone: they
will make their voices heard in international
circles, regardless of whether they it is a UN
forum. The choices made by the European
Union in this regard will be influential. We
have the first shot: naturally, this situation
may seem uncomfortable, but it also gives
the European Union an opportunity to
regain its leadership in the international
negotiations. l
Benoît [email protected]: 33 (0) 1 58 50 98 18
Implementing climate change policies
by putting a price on carbon boosts
demand for “green” assets. Specifically,
setting up the European Union Emissions
Trading Scheme (EU ETS), by imposing
restrictions on European industries, gives a
boost to technological innovation in Europe
and elsewhere. This is a first step, even if
additional policies to support innovation
will be required. This is precisely the point
that Felix Matthes and Matthieu Glachant
make in their interview. I would like to thank
them both for answering our questions.
Encouraging technological innovation
at home is viewed quite positively by
political and economic decision-makers;
encouraging technological and economic
improvements “elsewhere” less so:
this is what introduces the notion of
competitiveness, a term that has many
meanings. However, the notion of national
competitiveness is not much help in the
climate change policy debate: as Oliver
Sartor reminds us in an initial article, national
New markets for innovators: new investment* growth in sustainable energy
Competitiveness & innovation in a decarbonising world
N°19 • 3rd quarter 2010
Spurring low-carbon innovationInterview with Dr Felix Matthes and Prof Matthieu Glachant
Competitiveness 101: separating feelings from facts
Oliver Sartor
Carbon leakage: emissions without borders
Oliver Sartor
Raising the bar: emissions performance benchmarks in EU ETS Phase III
Emilie Alberola
Key figures
Salim Bouakline and Oliver Sartor
Contents
E ditorial
There has been a rapid growth in demand for investment in sustainable energy technologies, which reflects growing markets for competitive innovators in the sector. New public and private spending growth averaged close to 50% a year before the global financial crisis struck in 2008. The largest investors globally are Europe, North America and China, while China and Brazil are the fastest growing (from a low base). * Includes both private and public sector project-based investment and R&D, New Energy Finance (2009)
0
20
40
60
80
100
120
Billi
ons
USD
Europe North America Asia &Oceania
Middle East& Africa
Brazil
2004 2008
China India Total
492%
617%633%
1200%5300%
1633%
429%
600%
Data Source: New Energy Finance, UNEP, SEFI (2009) “Global Trends in Sustainable Energy Investment 2009”

2
I nterview
Spurring low carbon innovation Responding to climate change presents opportunities for innovators to take advantage of demand for new kinds of goods. Felix Matthes1 and Matthieu Glachant2 explain how we can make the most of such opportunities.
We often hear about how carbon pricing may have a negative impact on the international competitiveness of some manufacturing sectors. But can carbon pricing have benefits for other industries like renewable technologies, etc?
M. Glachant: Carbon pricing is an
emissions cost for carbon emitters – I
don’t really believe in the existence of a
mine of profitable reduction initiatives,
– but it is also a growth opportunity
for companies that provide solutions to
the problem: wind turbine and insulation
materials manufacturers, energy service
companies, etc. The real question is
whether the gains outweigh the losses, a
question that is hard to answer, in theory.
F. Matthes: In practice, after six years
of carbon pricing under the EU ETS,
there is almost no evidence of significant
negative impacts for EU industries. Plus
the current debate in China and other
regions shows that there is only a low
probability that major economies will
remain without carbon pricing. However,
there are mechanisms like targeted
compensation to deal with the few cases
where leakage could emerge as a serious
problem. On the other hand, we should
never forget that carbon pricing drives
innovation and creates future markets for
frontrunner industries. Evidence of this is
growing rapidly.
What other measures do you think are important for encouraging the necessary innovation to create a low carbon economy?
FM: Adequate climate policy in the
context of ambitious long term targets (80
to 95% reduction in emissions by 2050)
will need a smart policy mix. Carbon
pricing is the central pillar. But we will
need standards, incentive programs and
other approaches for those fields where
price signals do not work properly or
will not be sufficient to drive radical
innovation (energy efficiency, transport
sector, etc). We have to deal with very
long-life capital stocks, and the period
of time over which markets can deliver
scarcity signals is still an open question.
Many emission reduction options depend
on highly regulated infrastructures which
are not only driven by price signals.
However, complementary policies must
be subject to transparent and careful
justification and pass the relevant cost-
benefit tests.
MG: I would like to underline that
carbon pricing is there to create a
demand for green goods and solutions.
The additional measures must target
the supply side through supporting
innovation, partnering green start-ups and
improving training in the environmental
professions.
In terms of promoting Europe’s innovation and competitiveness in low carbon goods markets, how important is the current discussion about moving its 2020 emissions goal from -20% to -30% below 1990 levels?
FM: Strengthening the EU’s efforts
would send a clear signal to the
markets that the ultimate goal is an
almost decarbonised economy by mid-
century. The -20% by 2020 target is not
really consistent with this objective, so
the accounting of the decarbonisation
pathway is therefore questionable at best.
A clear and quantified vision, like full
decarbonisation, is essential in order to
trigger the radical innovation required.
Moving towards the 30% reduction target
would also be a trust-building measure,
and would signal to emerging and
developing countries that the EU takes the
2°C target seriously and so they should
also increase their climate policy efforts.
MG: Moving to a 30% reduction target
cannot rest on the European innovation
argument alone. As the European Union
is a very open economy, moving from
-20% to -30% will increase local demand
for green assets and solutions, as well as
the related supply of, and innovations in,
such products, but not only in Europe.
China, for example, is the leading
global manufacturer of solar panels.
The country’s output is exported almost
entirely to Europe, the United States and
Japan and it is constantly innovating. l
Interview by Nicolas [email protected].: +33 1 58 50 77 72
1. Dr Felix Matthes is a Researcher and Co-ordinator of Energy and Climate Policy at the Institute for Applied Ecology (the “Oeko” Institute) in Berlin
2. Prof. Matthieu Glachant is Director of the Centre for Industrial Economics (CERNA) & Professor of Economics at Mines Paris-Tech in Paris
Hey big spender: leading economies’ clean energy RD&D budgets
0.005
0.006
0.007
0.004
0.001
0.002
0.003
0
RD&D
Bud
get -
% G
DP
France Germany Italy* United Kingdom Japan Canada United States Europe**
2000 2008
National public expenditure on sustainable energy technologies RD&D (energy efficiency, renewables, carbon capture and storage, and hydrogen & fuel cells) in the world’s largest economies increased sharply between 2004 and 2008, with the exception of Germany, which is starting from a high base. The growth was faster in Europe than in the US. Accurate figures for China were not available.
*2007 data was used for Italy instead of 2008 data. **Includes Austria, Belgium, Denmark, Finland, France, Germany, Greece, Hungary, Ireland, Italy, Luxembourg, the Netherlands, Norway, Portugal, Spain, Sweden, Switzerland, Turkey and UK. Data Source: International Energy Agency RD&D statistics; World Resources Institute

350,000 20,000
18,00016,000
14,000
12,000
10,0008,000
6,000
4,000
2,0000
300,000
250,000
200,000
150,000
100,000
50,000
0
cons
umpt
ion/
prod
uctio
n (th
ousa
nds
of to
nnes
)
Impo
rtat
ion/
expo
rtat
ion
Cement consumptionCement imports
Cement productionCement exports
2000 2001 2002 2003 2004 2005 2006 2007 2008
K ey concepts
Competitiveness 101: separating feelings from facts
3
The potential economic “competitiveness impacts” of climate policy is an issue that arouses strong feelings. But much of their emotional sting can be dulled with an understanding of the economic facts.
There are three main ways in which
the issue of “competitiveness” arises
in climate policy debates; here is a
quick introduction to the issues and
economics underlying each one:
Competitiveness of low-carbon alternatives
Firstly, at its most fundamental
level, the question of “competitiveness
impacts” arises in climate policy
because greatly reducing emissions
requires policies that can improve the
competitiveness of ‘low-carbon’ goods
and technologies in existing markets. For
example, there is now solid evidence that
the carbon emissions price created by
the European Union Emissions Trading
Scheme (EU ETS) has helped electricity
generators using less carbon-intensive
fuels (gas, renewable, nuclear) become
more cost-competitive1. This has helped
them gain a greater share of the market
for power generation, taking it away
from more emissions intensive coal-fired
power. In the same way, changing the
competitive status quo of low-carbon
products and technologies is critical
for driving transformational change in a
range of markets for emissions intensive
goods.
Carbon leakageSecondly, the issue of competitiveness
arises with respect to “carbon leakage”.
Carbon leakage is the idea that if one
country is making its industries pay a
carbon price, but rival overseas producers
are not, then the resulting higher costs of
domestic producers may see them lose
competitiveness in global markets. In many
cases this may simply mean lower profits,
however in the worst case scenario, they
may either suffer a loss of market share
to overseas rivals, or shift production,
employment and emissions, offshore.
But, while carbon leakage sounds scary,
it must be kept in perspective. For the
average EU country, the genuinely concerned
sectors typically represent not much more
than 1% of GDP and only a small portion
of that is seriously at risk of going offshore.
In fact, the EU – which has priced carbon
since 2005 with the EU ETS – has so far seen
little evidence of carbon leakage among the
handful of manufacturing industries most at
risk – although policies to address this risk,
like free allocation of emissions allowances,
were in place2. It should also be kept in
mind that policies to prevent leakage can
also cause competitiveness distortions in
domestic markets if not well harmonized:
hence the EU’s move to a harmonized
system of free allowance allocation for the
EU ETS starting in 2012.
National economic competition: not what it seems
Finally, there’s the often cited
importance of low-carbon innovation – e.g.
in renewable energies, energy efficiency,
clean transport, etc – on national economic
competitiveness. The claim is made that,
if entrepreneurial industries are given a
head start in embryonic export markets
for low-carbon goods, this will make the
whole economy more “competitive” in
future. However, while such innovation
is important to reducing emissions and
can promote the growth of new industries
and jobs, there is solid empirical evidence
that whole economies do not compete
with each other for future prosperity via
international markets3. On the contrary, the
evidence suggests that, for the world’s big
economies, national productivity growth
is much more important for economic
living standards than having competitive
exports. Thus, while promoting low-
carbon innovation and new industries is
an important enterprise, we should keep a
healthy skepticism for such claims about
national economic competitiveness. l
Oliver [email protected]: +33 1 58 50 85 20
1. E.g. Buchner et al. (2008): Over-allocation or Abatement?, Environmental & Resource Economics, 41:2
2. E.g. Ellerman et al. (2009): Carbon Pricing: The EU Emissions Trading Scheme, Cambridge
3. E.g. Krugman (1994): Competitiveness: A Dangerous Obsession, Foreign Affairs, 73 :2
EU27 Cement sector: any sign of a leak?
Data Source: Eurostat ; Cembureau
The EU cement sector is often cited as at risk of carbon leakage. However, the graphic shows the extent to which both production and imports remains, for the most part, a function of local consumption demand, even though the EU introduced carbon pricing in 2005. The small rise in extra-EU imports and drop off in extra-EU exports over this period is most probably due to capacity reductions (for other reasons) in traditional producer countries close to ports: particularly Italy and Spain.
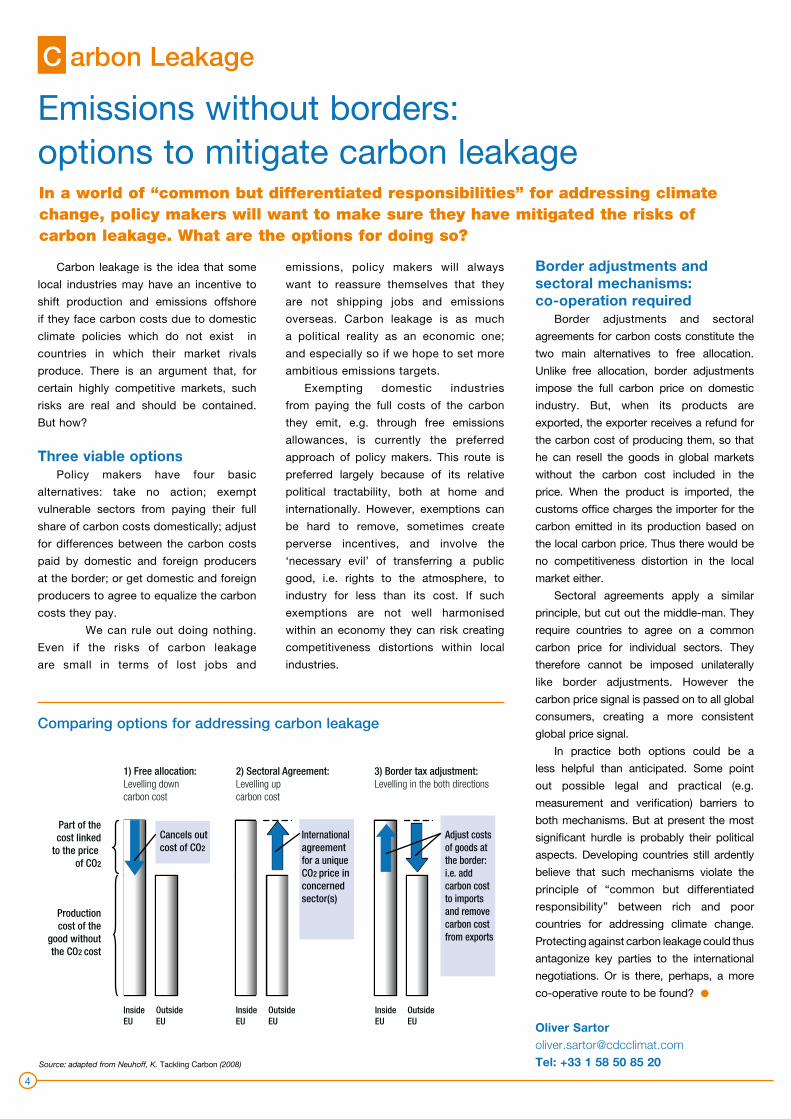
Comparing options for addressing carbon leakage
Source: adapted from Neuhoff, K. Tackling Carbon (2008)
C arbon Leakage
Emissions without borders: options to mitigate carbon leakage In a world of “common but differentiated responsibilities” for addressing climate change, policy makers will want to make sure they have mitigated the risks of carbon leakage. What are the options for doing so?
Carbon leakage is the idea that some
local industries may have an incentive to
shift production and emissions offshore
if they face carbon costs due to domestic
climate policies which do not exist in
countries in which their market rivals
produce. There is an argument that, for
certain highly competitive markets, such
risks are real and should be contained.
But how?
Three viable optionsPolicy makers have four basic
alternatives: take no action; exempt
vulnerable sectors from paying their full
share of carbon costs domestically; adjust
for differences between the carbon costs
paid by domestic and foreign producers
at the border; or get domestic and foreign
producers to agree to equalize the carbon
costs they pay.
We can rule out doing nothing.
Even if the risks of carbon leakage
are small in terms of lost jobs and
emissions, policy makers will always
want to reassure themselves that they
are not shipping jobs and emissions
overseas. Carbon leakage is as much
a political reality as an economic one;
and especially so if we hope to set more
ambitious emissions targets.
Exempting domestic industries
from paying the full costs of the carbon
they emit, e.g. through free emissions
allowances, is currently the preferred
approach of policy makers. This route is
preferred largely because of its relative
political tractability, both at home and
internationally. However, exemptions can
be hard to remove, sometimes create
perverse incentives, and involve the
‘necessary evil’ of transferring a public
good, i.e. rights to the atmosphere, to
industry for less than its cost. If such
exemptions are not well harmonised
within an economy they can risk creating
competitiveness distortions within local
industries.
Border adjustments and sectoral mechanisms: co-operation required
Border adjustments and sectoral
agreements for carbon costs constitute the
two main alternatives to free allocation.
Unlike free allocation, border adjustments
impose the full carbon price on domestic
industry. But, when its products are
exported, the exporter receives a refund for
the carbon cost of producing them, so that
he can resell the goods in global markets
without the carbon cost included in the
price. When the product is imported, the
customs office charges the importer for the
carbon emitted in its production based on
the local carbon price. Thus there would be
no competitiveness distortion in the local
market either.
Sectoral agreements apply a similar
principle, but cut out the middle-man. They
require countries to agree on a common
carbon price for individual sectors. They
therefore cannot be imposed unilaterally
like border adjustments. However the
carbon price signal is passed on to all global
consumers, creating a more consistent
global price signal.
In practice both options could be a
less helpful than anticipated. Some point
out possible legal and practical (e.g.
measurement and verification) barriers to
both mechanisms. But at present the most
significant hurdle is probably their political
aspects. Developing countries still ardently
believe that such mechanisms violate the
principle of “common but differentiated
responsibility” between rich and poor
countries for addressing climate change.
Protecting against carbon leakage could thus
antagonize key parties to the international
negotiations. Or is there, perhaps, a more
co-operative route to be found? l
Oliver [email protected]: +33 1 58 50 85 20
4
InsideEU
1) Free allocation:Levelling down carbon cost
Part of thecost linked
to the price of CO2
Cancels outcost of CO2
Internationalagreementfor a uniqueCO2 price inconcernedsector(s)
Adjust costsof goods atthe border:i.e. addcarbon costto importsand removecarbon costfrom exports
Productioncost of the
good withoutthe CO2 cost
2) Sectoral Agreement:Levelling up carbon cost
3) Border tax adjustment:Levelling in the both directions
OutsideEU
InsideEU
OutsideEU
InsideEU
OutsideEU

E U ETS
5
and mix of the production process for each
product. The activity level per installation
will need to be determined according to
the average production over a reference
period – currently under discussion –
stretching from 2005 to 2008 or to 2009,
excluding the lowest level, and for new
market entrants, according to the highest
production level between 2005 and 2009.
Shared and harmonised rulesThe European Directive (2009/29/EC) is
foresees the allocation of free allowances
to be harmonised on an EU scale, in
order to reduce competition distortions
within the EU as much as possible. The
development of efficient benchmarks
requires not only the existence of common
definitions but also the availability of
reliable data and adequate measurement,
reporting and checking systems. In order
to meet these expectations, the European
Commission Environment-Climate DG
has co-ordinated working groups to
define the benchmark methods used for
each product.
Data gathering: a complicated exercise
As the emission levels drawn from the
central European register, the CITL, are not
sufficient for developing benchmark curves,
it is necessary to use new environmental
and industrial data. In addition to the
availability and the confidentiality of the
data, which vary significantly depending
on the sector, the level of complexity also
increases when the same product can be
manufactured from different raw materials
or when the manufacturing procedures
apply to more than one product: in that
case, benchmarks for intermediate goods
will be necessary.
The European Commission has
developed 51 benchmarks in total, which
will be published in the course of the
coming months so that they can be
discussed by Member States and then
by the European Parliament. Most of
these benchmarks are based on the most
efficient 10% benchmark. Six others
(three for the refining sector and one each
for steel, iron and coke production) are
defined according to the environmental
performance of the best technology
available in the sector. The final adoption
of the free allocation of allowances on
a benchmark basis is scheduled for
September 2011. l
Emilie [email protected]: 33 (0) 1 58 50 41 76
The benchmark-based free allowance
allocation is not a new development
within the EU ETS. Although most free
allowance allocations between 2005 and
2012 were based on the installations’
historical emissions (“grandfathering”),
several governments used benchmarks
based on the best available technology
in the sectors in question to allocate free
allowances to new market entrants.
Now, from 2013 onwards, benchmarks
will determine all free allowance allocations.
Those free allowances will involve 80%
of the 2013 allowance allocation for
industrial sectors, excluding the electricity
generation sector, and will gradually
decrease, falling to 30% in 2020, before
their abolition in 2027. For installations
in 164 sectors and sub-sectors exposed
to international competition, and for new
market entrants, their free allocation share
will only decrease in line with the overall EU
ETS cap. Benchmarks were preferred to a
calculation based on historic emissions
in order to reward installations’ efficiency
and provide an additional incentive for
reducing their emissions.
Towards greater energy efficiency
Within every sector, and for every
product, a benchmark will set the
reference CO2 emission level for a given
production level, which is based on the
average CO2 emission factors for the
most efficient 10% of installations. Then,
benchmark allocations will be calculated
as the product of the activity level (tonnes
produced per year) and the emission
benchmark (tCO2 per tonne produced)
determined based on the energy efficiency
Raising the bar: emissions performance benchmarks in EU ETS Phase III From 2013 onwards, to maintain their competitiveness in international markets, certain European Union Emission Trading System (EU ETS) installations will benefit from a temporary allocation of free emissions allowances determined according to performance benchmarks. This system will be harmonised across Europe, to avoid intra-EU competitiveness distortions.
Based on their emissions intensity performance, the most efficient 10% of installations will be granted the highest percentage of free allowances for the production of products at risk of carbon leakage. The remaining 90% will thus have incentives sharpened to improve their performance in order to meet or surpass the performance level of the benchmark.
Source: Authors
How allocative benchmarks work
Allocation freeallowances per unitof production (relative to rest of industry)
Average intensity of best 10% of installations
Emissions intensity of production
(relative to rest of industry)
High (worst)
Low (best)
Low
High
10 50% of installations in relevant sector
100

Source: Neuhoff (2008) “Tackling Carbon”; originally published
in Climate Strategies (2007): “Differentiation and Dynamics of
EU ETS Industrial Competitiveness Impacts”
6
CDC Climat Research is the research department of CDC Climat, a subsidiary of the Caisse des Dépôts dedicated to the fight against climate change. CDC Climat Research provides public research on the economics of climate change. Head of publications: Benoît Leguet, tel: +33 (0)1 58 50 98 18.CDC Climat Research – 16 rue Berthollet – 94113 Arcueil Cedex, France – ISSN : 1952-7659
Salim [email protected] - Tel: 33 (0) 1 58 50 98 19
Oliver Sartor [email protected] - Tel: 33 (0) 1 58 50 85 20
K ey figures
Sizing up the risks of carbon leakage
Maximum value at stake from carbon pricing: UK industries
Easy come, easy go: the example of steel
0.0%0%2%4%
10%
20%
30%
40%
0.2% 0.4% 0.6% 0.8% 1.0% UKGDP
Pote
ntia
l Max
imum
Val
ue a
t Sta
ke (M
VAS)
and
Net V
alue
At S
take
(NVA
S)
Cem
ent
Basi
c iro
n &
stee
l
Alum
iniu
mRefined petroleum Pulp &paper
Fertilisers & Nitrogen MaltCoke oven
Industrial gasesNon-wovens
Household paper
Finishingof textiles
Hollow glass
Rubber tyres& tubes
Veneer sheetsFlat glass
Copper
Casting of ironOther inorganic
basic chemicals
Lime
Allocation dependent (direct) CO2 costs / GVAElectricity (indirect) CO2 costs / GVA
0%
20%
40%
60%
80%
100%
Pulp Chemicals Non-metalicmineral products
Basic Metals
Rest of World
China
Japan
US
EU
Fabricated MetalProducts
180
160
140
120
100
80
60
40
20
0EU Exports
toEU Imports
fromAmerica Exports to
America Imports from
AsiaExports to
AsiaImports from
Others
Asia
America
EU
Mill
ions
of T
onne
s of
Ste
el
Which manufacturing sectors are impacted and how much?
The graphic shows the maximum
percentage of UK manufacturing industries’
value added that could theoretically be
lost due to carbon pricing, assuming a
carbon price of 20€/tCO2 and electricity
cost increase of 10€/MWh. The 24 sectors
with the most value at stake from carbon
pricing in the UK represent around 1% of
GDP and 13% of emissions. Only a portion
of this is directly at stake.
The Big Four For many energy and emissions
intensive manufacturing sectors, between
70 and 90% of global markets are shared
between just 4 players: the EU, US, Japan,
& China. While some countries may be
able to grow their market share rapidly,
this result implies that tools like sectoral
mechanisms or border tax adjustments
might only need agreement between a
small number of countries to be effective.
Data source: European Commission (2010) “EU Manufacturing Industry: What are the challenges and opportunities for the years ahead?”, DG Enterprise and Industry
Trade gravity Trade has a tendency to cluster in
regions of the globe. Factors like
transport costs, customer relationships,
consumption/capacity utilisation, import
restrictions, risks of disrupted trade-flows,
product and service differentiation, can all
be reasons to privilege geographically close
suppliers. Additional costs from carbon
pricing must outweigh these advantages to
run a risk of large-scale delocalisation by
local firms.
Source: Adapted from Demailly (2007); based on 2004 trade data from IISI.
Share of global markets for some key emissions intensive manufactures