Embed Size (px)
Citation preview

JOURNAL OF GEOPHYSICAL RESEARCH, VOL. 88, NO. C8, PAGES 4705-4718, MAY 30, 1983
Climatology of the Southeastern United States Continental Shelf Waters
LARRY P. ATKINSON
Skidaway Institute of Oceanography, Savannah, Georgia 31406
THOMAS N. LEE
School of Marine and Atmospheric Science, Division of Meteorology and Physical Oceanography University of Miami, Miami, Florida 33149
JACKSON O. BLANTON AND WILLIAM S. CHANDLER
Skidaway Institute of Oceanography, Savannah, Georgia 31406
Data from 2872 hydrographic stations have been used to determine the oceanographic climatology of the southeastern United States continental shelf waters. The data were sorted by each degree of latitude and by depth into three zones (0-20 m, 21-40 m, 41-60 m). Inner shelf water temperatures were similar to adjacent land air temperatures, while outer shelf temperatures were moderated by the Gulf Stream. Minimum and maximum water temperatures occurred in Georgia and South Carolina inner shelf water. Bottom temperatures were unusually low off Florida in the summer probably because of shelf break upwelling. Surface salinity was lowest adjacent to the rivers and reached minimums in the spring at the time of high runoff. An exception to this occurred in the fall, when strong southward winds apparently advected low salinity coastal water southward and offshore flow was restricted. Heat flux was calculated from changes in monthly mean depth-averaged inner shelf water temperatures. Heating occurred from March through July with maximum rates of 103 W m -2. Cooling occurred from October through February with maximum rates of -90 W m -2. Bulk stratification was estimated from the difference in near-surface and near-bottom monthly mean density. In the spring, stratification increases in inner shelf areas because of decreasing winds and increasing heat flux and runoff. By summer the whole shelf is highly stratified reflecting the contrast between high surface water temperatures and cooler bottom waters. Highest bulk stratification is found over the outer shelf. Stratification decreased with the approach of fall with the associated cooling and high winds. Mean flow at midshelf was northward and appears to be produced by an along-shelf slope of sea level of oceanic origin.
INTRODUCTION
Recent studies of southeastern United States continental
shelf waters have significantly increased spatial and tempo- ral coverage of hydrographic and current meter observa- tions. The combination of these data with historical data sets
permits an examination of the oceanographic climatology of the area in terms of monthly mean hydrographic properties and seasonal mean flows.
The general atmospheric climatology of the region, com- monly referred to as the South Atlantic Bight (SAB), has been described by Jacobson [1974] and Ruzecki [1974]. Monthly wind regimes were recently described from analy- ses of surface wind fields obtained from a large set of ship observations [Weber and Blanton, 1980]. Several papers have discussed aspects of the nearshore oceanographic climatology using lightship data [Chase, 1969, 1971;Burnpus and Chase, 1965; Parr, 1933]. Another series of papers [Church, 1937; Schroeder, 1963; Fuglister, 1947] discussed temperature variations in the open ocean, using thermograph or hydrographic station data obtained from ships. None of these papers discusses shelf water in detail. To our knowl- edge, a study of the SAB shelf oceanographic climatology has not been published. As part of a coordinated study of the southeastern U.S. continental shelf, a large amount of new
Copyfight 1983 by the American Geophysical Union.
Paper number 2C 1919. 0148-0227/83/002C- 1919505.00
hydrographic and time series data has been gathered which, combined with the historical data set, permits an examina- tion of the climatology in terms of monthly mean conditions throughout the area.
Before continuing, it is necessary to discuss the time scale of events in the SAB and the relationship of monthly mean statistics to longer and shorter time scales. The SAB has a broad and shallow shelf and responds quickly to atmospheric conditions, especially on the extremely shallow inner shelf. Inner shelf water temperatures respond to air temperature cycles at frequencies ranging from daily to seasonal to interannual. The large heat capacity of water insures a highly damped response to daily air temperature cycles, but cycles at seasonal and interannual time scales have a large effect. Similar arguments apply to the inner shelf salinity field, which is controlled by seasonal and interannual cycles of fiver discharge.
The outer shelf responds seasonally to atmospheric condi- tions, but response is suppressed owing to the proximity of the deep ocean. Most variability there is due to Gulf Stream frontal effects which occur at periods of 2 days to 2 weeks (see Lee et al. [ 1981] for a recent review). Variations in Gulf Stream transport at the 2-day to 2-week time scale are as large as seasonal variations [Niiler and Richardson, 1973]. Thus outer shelf statistics must be viewed with particular caution especially when biological implications are consid- ered. Because of the sampling limitations of the monthly mean statistics, we present selected examples of variability at periodicities below and above the monthly time scale.
4705
4706 ATKINSON ET AL.: CLIMATOLOGY OF SHELF WATER
8œ 81 80 79 78 77 76 75
Cape I•att• 35 35
34 34
33 - ' 33 Charleston/
32 Savannah •'r•j?'•?' Brunswic ,,"
31
•acksonvill ,
• Dayto cape '•[ S t a t i s t i c a I
Canave• c• Regions 28 28
27 27ø•
82 81 80 79 78 77 76 75øW
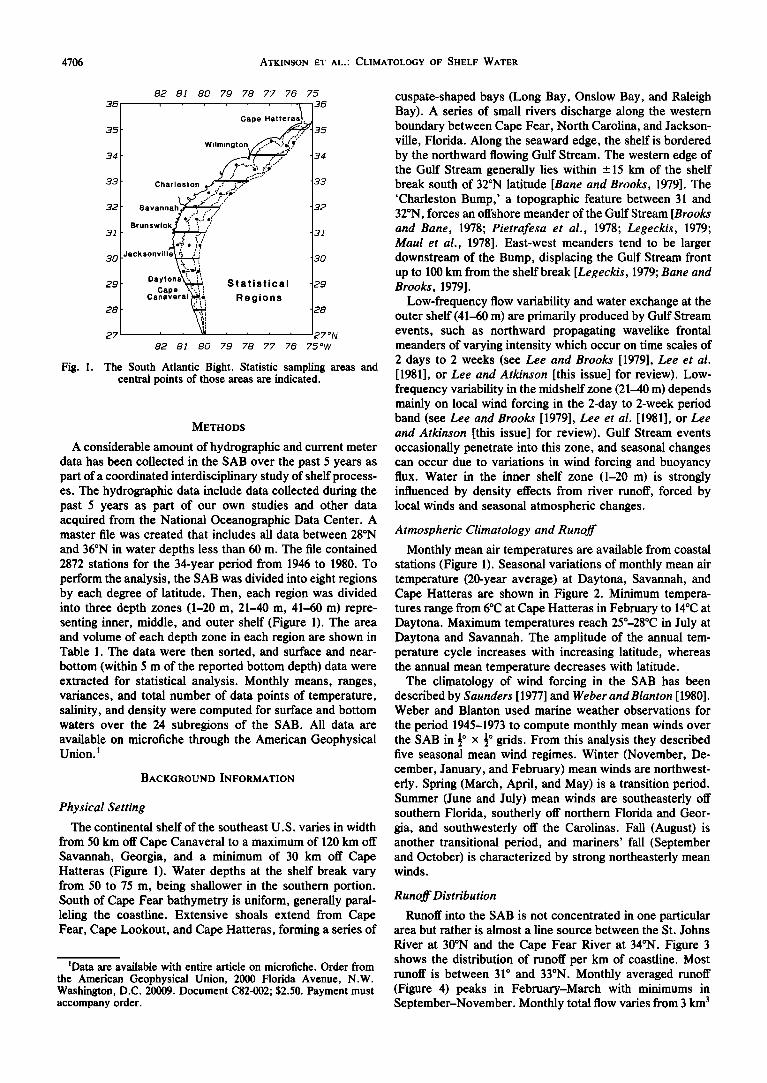
Fig. 1. The South Atlantic Bight. Statistic sampling areas and central points of those areas •e indicated.
METHODS
A considerable amount of hydrographic and current meter data has been collected in the SAB over the past 5 years as part of a coordinated interdisciplinary study of shelf process- es. The hydrographic data include data collected during the past 5 years as part of our own studies and other data acquired from the National Oceanographic Data Center. A master file was created that includes all data between 28øN
and 36øN in water depths less than 60 m. The file contained 2872 stations for the 34-year period from 1946 to 1980. To perform the analysis, the SAB was divided into eight regions by each degree of latitude. Then, each region was divided into three depth zones (1-20 m, 21-40 m, 41-60 m) repre- senting inner, middle, and outer shelf (Figure 1). The area and volume of each depth zone in each region are shown in Table 1. The data were then sorted, and surface and near- bottom (within 5 m of the reported bottom depth) data were extracted for statistical analysis. Monthly means, ranges, variances, and total number of data points of temperature, salinity, and density were computed for surface and bottom waters over the 24 subregions of the SAB. All data are available on microfiche through the American Geophysical Union. •
BACKGROUND INFORMATION
Physical Setting
The continental shelf of the southeast U.S. varies in width
from 50 km off Cape Canaveral to a maximum of 120 km off Savannah, Georgia, and a minimum of 30 km off Cape Hatteras (Figure 1). Water depths at the shelf break vary from 50 to 75 m, being shallower in the southern portion. South of Cape Fear bathymetry is uniform, generally paral- leling the coastline. Extensive shoals extend from Cape Fear, Cape Lookout, and Cape Hatteras, forming a series of
•Data are available with entire article on microfiche. Order from the American Geophysical Union, 2000 Florida Avenue, N.W. Washington, D.C. 20009. Document C82-002; $2.50. Payment must accompany order.
cuspate-shaped bays (Long Bay, Onslow Bay, and Raleigh Bay). A series of small rivers discharge along the western boundary between Cape Fear, North Carolina, and Jackson- ville, Florida. Along the seaward edge, the shelf is bordered by the northward flowing Gulf Stream. The western edge of the Gulf Stream generally lies within _ 15 km of the shelf break south of 32øN latitude [Bane and Brooks, 1979]. The 'Charleston Bump,' a topographic feature between 31 and 32øN, forces an offshore meander of the Gulf Stream [Brooks and Bane, 1978; Pietrafesa et al., 1978; Legeckis, 1979; Maul et al., 1978]. East-west meanders tend to be larger downstream of the Bump, displacing the Gulf Stream front up to 100 km from the shelf break [Legeckis, 1979; Bane and Brooks, 1979].
Low-frequency flow variability and water exchange at the outer shelf (41-60 m) are primarily produced by Gulf Stream events, such as northward propagating wavelike frontal meanders of varying intensity which occur on time scales of 2 days to 2 weeks (see Lee and Brooks [1979], Lee et al. [1981], or Lee and Atkinson [this issue] for review). Low- frequency variability in the midshelf zone (21-40 m) depends mainly on local wind forcing in the 2-day to 2-week period band (see Lee and Brooks [1979], Lee et al. [1981], or Lee and Atkinson [this issue] for review). Gulf Stream events occasionally penetrate into this zone, and seasonal changes can occur due to variations in wind forcing and buoyancy flux. Water in the inner shelf zone (1-20 m) is strongly influenced by density effects from river runoff, forced by local winds and seasonal atmospheric changes.
Atmospheric Climatology and Runoff
Monthly mean air temperatures are available from coastal stations (Figure 1). Seasonal variations of monthly mean air temperature (20-year average) at Daytona, Savannah, and Cape Hatteras are shown in Figure 2. Minimum tempera- tures range from 6øC at Cape Hatteras in February to 14øC at Daytona. Maximum temperatures reach 25ø--28øC in July at Daytona and Savannah. The amplitude of the annual tem- perature cycle increases with increasing latitude, whereas the annual mean temperature decreases with latitude.
The climatology of wind forcing in the SAB has been described by Saunders [1977] and Weber and Blanton [1980]. Weber and Blanton used marine weather observations for
the period 1945-1973 to compute monthly mean winds over the SAB in «o x «o grids. From this analysis they described five seasonal mean wind regimes. Winter (November, De- cember, January, and February) mean winds are northwest- erly. Spring (March, April, and May) is a transition period. Summer (June and July) mean winds are southeasterly off southern Florida, southerly off northern Florida and Geor- gia, and southwesterly off the Carolinas. Fall (August) is another transitional period, and mariners' fall (September and October) is characterized by strong northeasterly mean winds.
Runoff Distribution
Runoff into the SAB is not concentrated in one particular area but rather is almost a line source between the St. Johns
River at 30øN and the Cape Fear River at 34øN. Figure 3 shows the distribution of runoff per km of coastline. Most runoff is between 31 ø and 33øN. Monthly averaged runoff (Figure 4) peaks in February-March with minimums in September-November. Monthly total flow varies from 3 km 3

ATKINSON ET AL' CLIMATOLOGY OF SHELF WATER 4707
TABLE 1. Area (km 2) and Volume (km 3) of the SAB Subregions (Rounded to Two Significant Figures)
Region Depth, m Area, km 2 Volume, km 3
28o-29øN 0-20 2,100 21 20-40 2,400 72 40-60 1,400 69
29o-30øN 0-20 2,800 28 20-40 4,900 150 40-60 1,400 72
,
30ø-31 øN 0-20 4,000 40 20-40 7,100 210 40-60 2,100 110
31 o-32øN 0-20 6,300 63 20-40 5,500 170 40-60 3,300 160
32o-33øN 0-20 6,600 66 20-40 6,400 190 40-60 2,300 120
33o-34øN 0-20 7,00 70 20-40 9,800 290 40-60 2,200 110
34o-35øN 0-20 3,800 38 20-40 7,600 230 40-60 1,600 81
Totals 0-20 32,600 326 20-40 43,700 1312 40-60 14,300 722
0-60 90,600 2360
to 8 km 3 (0.1-0.3% of SAB volume). The total yearly flow is about 50 km 3 (2% of SAB volume).
OCEANOGRAPHIC CLIMATOLOGY
Surface Temperature
Solar heating is maximum in summer (June and July) and the shelf waters reach maximum temperatures in August and September (Figure 5). By July, surface temperatures greater than 28øC are found in inner, middle, and outer shelf waters of the central SAB and in the outer shelf water off Florida.
North of 32øN, surface temperatures are high but less than 28øC. This pattern persists in August with temperatures greater than 28øC throughout the central SAB and offshore waters of Florida and the Carolinas. Temperatures less than 28øC in August over the inner shelf between 29ø-31øN are related to shelf-scale upwelling induced by upwelling-favor- able, southwest-to-southeast winds during the summer [We- ber and Blanton, 1980; Taylor and Stewart, 1959; Green, 1944]. In September water off the northern SAB has cooled slightly, the area less than 28øC has expanded, as has the region less than 28øC off north Florida, while the area with water greater than 28øC in the central SAB has decreased. In October the transition into 'mariners' fall' [Weber and Blanton, 1980] is complete. Winds are strong out of the northeast, and surface cooling occurs. Inner and middle shelf waters throughout the SAB cool uniformly. Lowest temperatures are found in Long Bay (33.5øN), and warmest surface water covers the outer shelf between 29 ø and 31øN. Shelf-wide cooling continues into the fall with minimum temperatures of 16øC in November in Ohslow Bay (34øN). In December minimum temperatures are found off Georgia (31ø-32øN). This pattern persists into January when mini- mum temperatures of 14øC are observed off Georgia (31 ø- 32øN) and off southern North Carolina (33.5ø-34.5øN). Sur-
face temperatures in February are further lowered when inshore water off North Carolina is less than 12øC and water
off Georgia is between 12 ø and 14øC. Annual low tempera- tures are observed in March when inshore water of South Carolina is less than 10øC. To the north and south inner shelf
water starts to warm. In April shelf waters are heating uniformly from south to north, a pattern which persists through June.
Cross-shelf temperature gradients are strongest with maxi- mum gradients occurring in February, March, November, December, and probably January. This is when the thermal contrast between seasonally cooled shelf water and the moderated Gulf Stream is maximum.
30"
25- /;/ O ß
ø ½ \ • 20 - // • '•t• aytona • 15-•. Savannah .• • •Cape Hatteras < •o..•' • 5[• ••• • • • • • • 1,0 1'1 1'2
Month
Fig. 2. Monthly mean air temperature at various coastal locations, øC.
4708 ATKINSON ET AL.' CLIMATOLOGY OF SHELF WATER
84 8• 8• 8i 80 7• 78 77 7G 75
30 --•, i Discharge 30 Arrow size
0,' •..1
28 iii km s/km of shore line 28 27 •'• 27 26 26 øN
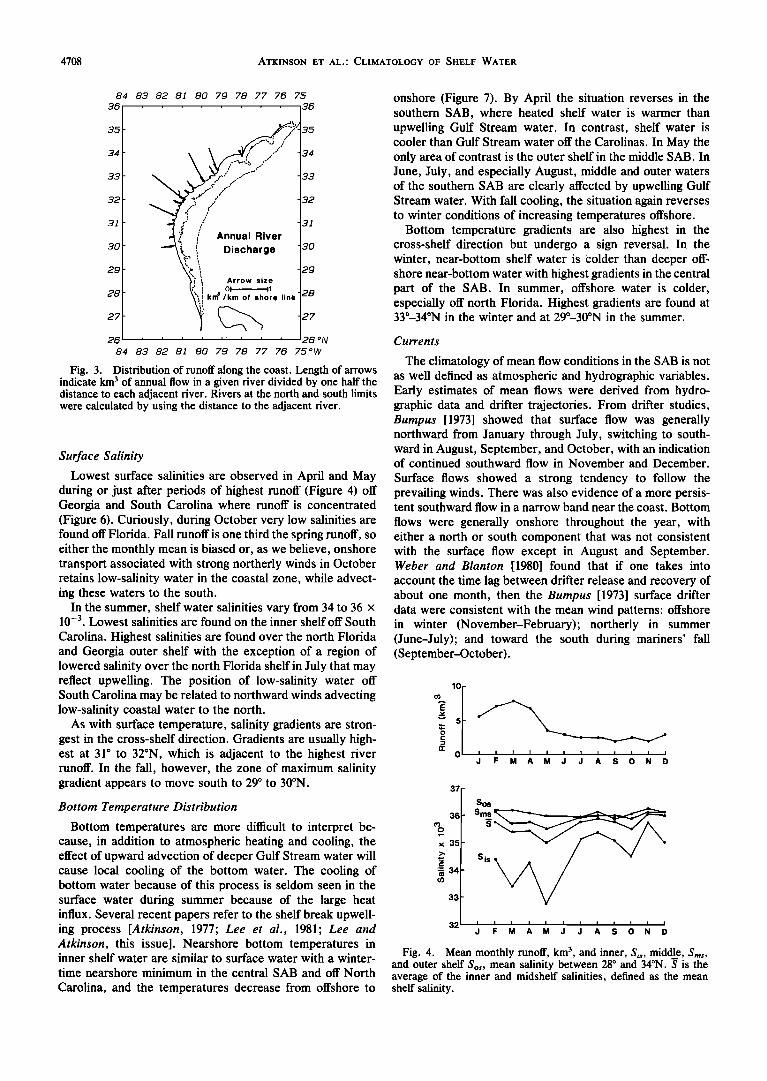
84 83 82 81 80 79 78 77 76 75øW
Fig. 3. Distribution of runoff along the coast. Length of arrows indicate km 3 of annual flow in a given river divided by one half the distance to each adjacent fiver. Rivers at the north and south limits were calculated by using the distance to the adjacent river.
Surface Salinity
Lowest surface salinities are observed in April and May during or just after periods of highest runoff (Figure 4) off Georgia and South Carolina where runoff is concentrated (Figure 6). Curiously, during October very low salinities are found off Florida. Fall runoff is one third the spring runoff, so either the monthly mean is biased or, as we believe, onshore transport associated with strong northerly winds in October retains low-salinity water in the coastal zone, while advect- ing these waters to the south.
In the summer, shelf water salinities vary from 34 to 36 x 10 -3. Lowest salinities are found on the inner shelf off South Carolina. Highest salinities are found over the north Florida and Georgia outer shelf with the exception of a region of lowered salinity over the north Florida shelf in July that may reflect upwelling. The position of low-salinity water off South Carolina may be related to northward winds advecting low-salinity coastal water to the north.
As with surface temperature, salinity gradients are stron- gest in the cross-shelf direction. Gradients are usually high- est at 31 ø to 32øN, which is adjacent to the highest river runoff. In the fall, however, the zone of maximum salinity gradient appears to move south to 29 ø to 30øN.
Bottom Temperature Distribution
Bottom temperatures are more difficult to interpret be- cause, in addition to atmospheric heating and cooling, the effect of upward advection of deeper Gulf Stream water will cause local cooling of the bottom water. The cooling of bottom water because of this process is seldom seen in the surface water during summer because of the large heat influx. Several recent papers refer to the shelf break upwell- ing process [Atkinson, 1977; Lee et al., 1981; Lee and Atkinson, this issue]. Nearshore bottom temperatures in inner shelf water are similar to surface water with a winter- time nearshore minimum in the central SAB and off North
Carolina, and the temperatures decrease from offshore to
onshore (Figure 7). By April the situation reverses in the southern SAB, where heated shelf water is warmer than upwelling Gulf Stream water. In contrast, shelf water is cooler than Gulf Stream water off the Carolinas. In May the only area of contrast is the outer shelf in the middle SAB. In June, July, and especially August, middle and outer waters of the southern SAB are clearly affected by upwelling Gulf Stream water. With fall cooling, the situation again reverses to winter conditions of increasing temperatures offshore.
Bottom temperature gradients are also highest in the cross-shelf direction but undergo a sign reversal. In the winter, near-bottom shelf water is Colder than deeper off- shore near-bottom water with highest gradients in the central part of the SAB. In summer, offshore water is colder, especially off north Florida. Highest gradients are found at 33ø-34øN in the winter and at 29ø-30øN in the summer.
Currents
The climatology of mean flow conditions in the SAB is not as well defined as atmospheric and hydrographic variables. Early estimates of mean flows were derived from hydro- graphic data and drifter trajectories. From drifter studies, Bumpus [1973] showed that surface flow was generally northward from January through July, switching to south- ward in August, September, and October, with an indication of continued southward flow in November and December.
Surface flows showed a strong tendency to follow the prevailing winds. There was also evidence of a more persis- tent southward flow in a narrow band near the coast. Bottom
flows were generally onshore throughout the year, with either a north or south component that was not consistent with the surface flow except in August and September. Weber and Blanton [1980] found that if one takes into account the time lag between drifter release and recovery of about one month, then the Bumpus [1973] surface drifter data were consistent with the mean wind patterns: offshore in winter (November-February); northerly in summer (June-July); and toward the south during mariners' fall (September-October).
lO
• i I I I I i i i I i I ! J F M A M J J A S O N D
3•
x 3. •
'F:: ... • 34
37-
Sos _ Sms _• _
Sis
33
32 I I I I I I i I i i I I
J F M A M J J A S O N D
Fig. 4. Mean monthly runoff, km 3, and inner, Sis , middle, Sins, and outer shelf Sos, mean salinity between 28 ø and 34øN. S is the average of the inner and midshelf salinities, defined as the mean shelf salinity.

ATKINSON ET AL..' CLIMATOLOGY OF SHELF WATER 4709
8• 81 80 7• 78 77 7• 75 8• 81 80 7• 78 77 7• 75 8• 81 80 7• 78 77 7• 75
35
34
31
30
29
28
22 .'/ / , ':24
Surface Temperature May
•'•8
Surface Temperature
,•28 September
35
34
3I
30
28
October
35
,9,4
30
29
28
..
Surface Temperature February
•' •;,, Surface . June
35
34
,9,3
31
30
29
28
35
34
1
14 / ,;
o
•8
2 Surface Temperature March
Surface Temperature July
2o /'/
!! U r f a•,l oev eTme •lePre r a I ure
31
30
29
28
35
34
31
30
28
27 ,27
35
,9,4
•iSi Surface. Temperature • t,,, August
..,
Surface Temperature December
31
30
29
35
34
31
30
29
27
82 81 80 79 78 77 7• 75 82 81 80 79 78 77 76 75 82 81 80 79 78 77 7• 75
Fig. 5. Monthly mean surface temperatures, øC. Dashed contours indicate less confidence.

4710 ATKINSON ET AL.' CLIMATOLOGY OF SHELF WATER
8• 81 80 7g 78 77 7• 75 8• 81 80 7g 78 77 7• 75 8• 81 80 7g 78 77 7• 75
34
32 e, o //
3I
30
2• ••'i , January 36
35
34
33
3•
31
30
•8
,.,
34f '/
4
)3 /
Ili Surface Sahn,ty
36
35
34
33 ..;
32
3I
30 Surface Sal,n,t¾
March
36
35
34
3I
30
2g
,,.'
urface Sal,n,ty May
Surface Sal,nlty June
•Surface Sal,n,ty July
34 r
6
Surface Salinity October
, D .... be • \ Surf_ace Sal•n,t¾
35
33
32
3I
30
28
27
36
35
33
32
30
2g
28
27
35
34
33
32
30
2g
28
27
35
34
33
32
3I
30
2g
28
27
82 8I 80 79 78 77 76 75 82 8I 80 79 78 77 76 75 82 8I 80 79 78 77 76 75
Fig. 6. Monthly mean surface salinity (x 10-3). Dashed contours indicate less confidence.
The measurement of currents with moored current meters
is relatively new to the SAB and data cover only a small portion of the total area. Middle to outer shelf mean flow patterns on the Georgia shelf were determined from aver- aged current meter data for the periods December 10, 1976, to April 10, 1977, and July 2 to November 4, 1977 (Figures 8a
and 8b). Analysis of cumulative weekly averages indicates that mean flows begin to stabilize for averaging periods of 3 months or greater. Therefore, mean values based on averag- ing periods less than 3 months should be treated with caution.
The mean flows are surprisingly similar for both measure-

ATKINSON ET AL..' CLIMATOLOGY OF SHELF WATER 4711
82 81 80 7• 78 77 7• 75 82 8I 80 7• 78 77 7• 75 82 8I 80 7• 78 77 7• 75 36
35
34
35
34
33
31
30
29
28
35
34
33
31
30
29
28
35
34
33
32
31
30
29
16 ,/
Bottom Temperature February
ß
18,-;'
V •1'.8 Bottom TemDerature•• ? •2'0 March
ß
Bottom Temperature
(•.,"'• 2 o
Bottom Temperature May
2O I
.•i Bøttøm TemDerature June
,/'
/,
Bottom Teml:)erature A,,n,,•
,
/'
Bottom Temperature September
• \ B ø t ' ø •3 c;oebmePre r a ' u r e
/,
/ 22/
ß
36
35
34
33
31
30
28
27
36
35
34
33
31
30
29
28
36
35
34
33
31
30
29
28
36
35
34
33
31
30
28
' ' 27
82 81 80 79 78 77 76 75 82 81 80 79 78 77 76 75 82 81 80 79 78 77 76 75
Fig. 7. Monthly mean bottom temperature, øC. Dashed contours indicate less confidence.

4712 ATKINSON ET AL.' CLIMATOLOGY OF SHELF WATER
81 80
B2 2
81 80
Fig. 8a. Mean circulation during winter 1977.
the summer/fall period. Subtidal standard deviations were several times the means during both periods. The 4-month winter/spring mean flow at the midshelf (30-m isobath) was northward at about 4 cm/s and offshore at 1 cm/s in both layers. The summer/fall mean was weak northerly at 1.0 cm/s in both layers with an offshore component of 1 cm/s in the upper layer and onshore at 1 cm/s in the lower layer. Standard deviations were approximately -+9 cm/s for the upper and lower layers during both periods.
The second current averaging period includes the atmo- spheric summer (July and August) and fall (September and October) as defined by monthly mean wind stresses [Weber and Blanton, 1980]. When the current meter data were split into these two averaging periods, it appeared that the summer and fall mean flows at midshelf were consistent with that found by Bumpus [ 1973], essentially following the wind direction, northward in July and August and southward in September and October.
DISCUSSION
ment periods. A strong Gulf Stream influence in the outer shelf is clearly visible. Mean flow at the shelf break (75-m isobath) was toward the north in the upper layer at about 65 cm/s during the winter/spring period and 54 cm/s for the summer/fall period, with onshore components of 1 and 6 cm/s in the winter/spring and summer/fall, respectively. The standard deviation of the subtidal along-shelf flow was +44 cm/s in the winter/spring and +56 cm/s in the summer/fall. Near bottom at the shelf break, the mean flow was toward the north at 8 cm/s with an offshore component of 3 cm/s in the winter/spring period. In the summer/fall period the flow was toward the north at about 3 cm/s with an onshore component of 1 cm/s. Standard deviations were about -+ 13 cm/s for the subtidal along-shelf flow during both periods. At the 45-m isobath a significant Gulf Stream influence is still evident. The winter/spring mean flow in the upper layer was northward at 17 cm/s with an offshore component of 6 cm/s. The summer/fall mean flow was southward at 5 cm/s and onshore at 3 cm/s. In the lower layer the mean flow was northward at 4 cm/s and offshore at 2 cm/s in the winter/spr- ing, and onshore at 1 cm/s and zero along-shelf component in
32
31
Fig. 8b. Mean circulation during summer 1977.
Heat Flux in Inner Shelf Water
Heat exchange between shelf waters and the atmosphere can be calculated for the inner shelf by assuming that advective heat flux is relatively small. This is believed to be a reasonable assumption because inner shelf water on this broad, shallow shelf responds quickly to atmospheric ther- mal forcing, and atmospheric events are more frequent than hydrospheric events. The net heat exchange, Qn, was calcu- lated by determining the monthly change in the heat content of the inner shelf statistical areas:
where
AT
Z
Qn = AT. Za (1)
change in monthly mean temperature, øC; mean depth of inner shelf, 10 m; heat capacity, 1 cal g-l.
The data were smoothed by spatially averaging over the south (29 ø and 30øN), middle (31 ø and 32øN) and northern (33 ø and 34øN) parts of the SAB (Figure 9a). The heat exchange estimates were converted into units of watts m -2 using the conversion factor 1 kcal cm -2 (30 days) -• = 16.15 W m -2.
Heat flux estimates indicate heating in March through July at maximum rates of 103 W m -2 (6.4 kcal cm -2 month -•) corresponding to a 6.4øC rise in the inner shelf mean water temperature. Cooling occurs in October through February with maximum exchange rates of about -90 W m -2 (5.6 kcal cm -2 month-l). These rates are slightly lower than those for the Mid-Atlantic Bight (Bunker [1976]; A. F. Bunker, as cited by Beardsley and Boicourt [1981]).
The accumulated monthly heat exchange, EQ, for the three areas over a year's time (Figure 9b) shows a net calculated heat loss of 2.6 kcal cm -2 month -l. This is about 10% of the total yearly incoming heat flux, probably within our error margin, and agrees with other annual average heat gain calculations [Bunker, 1976]. The mean inner shelf water temperature T clearly lags accumulated heat input during the spring, because of cooling due to sensible heat loss and evaporation.
The rapid response of inner shelf water is well illustrated in time series from a bottom temperature recorder located

ATKINSON ET AL' CLIMATOLOGY OF SHELF WATER 4713
•E lOO
x
-lOO
ß 29 o+30ON
ß 31o+32ON ß 33ø+34øN
ß ß
I I I I I I I I I I
J F M A M J J A S O
6
Month
Fig. 9a. Mean monthly heat flux for the southern, middle, and northern inshore SAB.
8
0,-- 4
,,, õ
• •E 0 20
E
o -4
-6 J F M A M J J A S O N D
Month
Fig. 9b. Accumulated heat flux and mean inner shelf temperature,
about 12 km off the coast at 31øN in 12 m of water (Figure 10). Water temperature was recorded at the bottom of a normally mixed water column and air temperatures are the average of those recorded at the Savannah and Jacksonville airports. Because cooling events are associated with north- erly winds, the air temperatures are probably representative of air temperature at the offshore site. Sea temperatures decrease with the arrival of each cold front in the fall.
Volumetric Analysis
The volumetric T-S diagram for each month (Figure 11) shows the volume of water in km 3 in each bivariate class.
Because of the large variations in T and S, we chose a bivariate increment of 1 x 10 -3 for salinity and 3øC for temperature. A finer scale could be used, but the salient points appear adequately at this scale. We have also indicat- ed the percentage of the total shelf volume represented in each monthly data set. For example, in January, we had data representing only 43% of the volume of the shelf, which is too small a sample for reasonable interpretation. However, in most months, over 80% of the shelf volume was in our sample, thus mean conditions on the shelf are represented.
In February, as in all months, a substantial amount of shelf water was in the 36 x 10 -3 salinity class with only about 23% of the shelf volume less than 36 x 10 -3. Runoff increased in March and April and lower salinity is evident. Water less than 36 x 10 -3 salinity accounted for 29% of the shelf volume in both months. The volume with salinity greater than 36 x 10 -3 shifted to 18ø-24øC range from 15 ø to 24øC. The cooler outer shelf water in the northern part of the SAB warmed.
By May, high salinity water was warming, as was the whole shelf. June data are sparse and are not discussed. In July no shelf water was cooler than 24øC and 52% had less than 36 x 10 -3 salinity. This same situation held in August, when 32% of shelf water was less than 36 x 10 -3 salinity. We believe that the increased volume of water with salinity less than 36 x 10 -3 which occurred during summer was related to upwelling of cooler, fresher water at the shelf edge rather than fiver input. This is pa•!y confirmed by the lack of significant amounts of water with salinity lower than 35 x 10 -3 , and in July lower salinity water was cooler (less than 27øC).
In September the percentage of waters less than 36 x 10 -3 salinity decreased to 14% of the shelf volume. As mentioned previously, October, which features strong southward wind stress had anomalously low salinity inner shelf water. Water
less than 36 x 10 -3 salinity accounted for 22% of the shelf volume while runoff was at its lowest. In November the
situation was similar with 23% of the shelf volume in the less
than 36 x 10 -3 category. This implies that the movement of water across the shelf was restricted, probably by southward winds which produce an onshore component in the surface flow.
Mean Bulk Stratification
Stratification of shelf waters is caused by seasonal pro- cesses such as heating/cooling, runoff, and wind mixing. Bulk stratification calculated from monthly differences in surface and bottom density is used to estimate annual variations in stratification for different parts of the SAB. In Figure 12 we show the regional distribution of the bulk stratification parameter.
In February and March, stratification was generally weak throughout the SAB. The inner shelf at 34ø-35øN was slightly stratified possibly because of lower salinity Virginian coastal water flowing south around Cape Hatteras [Stefansson et al., 1971]. Slight stratification was also found off Florida (29ø-30øN).
Bulk stratification was higher throughout the SAB in April, most likely reflecting increased downward heat flux and freshwater runoff and decreased winds. Stratification
was highest off Georgia (30ø-33øN) where runoff was great- est. Stratification off Florida was relatively high but lower than in February.
35 i , , , , , i , i I 'i
œ•_..• ,•.:• ,...,,.• /-Water
e 20J- ,, ,q ,I ./I•. J• ' /'-' ia.,"h -I ; / /if'" J•l*• '•j'• - Air-/ '• 15K I• i/ i,'
I '•_ •Ji'I ' !O'.,'!!iii I
• t,,j ,, , , ß I 0 J•. ,iJ. ,q/II
0 30 60 90 120 1 0 180 210 240 270 300 3 0 360
Day of Year
Fig. 10. Water temperature (solid line) at 12 m in 12 m of water at 3 IøN and average of air temperature at Jacksonville and Savannah airports (dashed line), øC. Air temperature data hand smoothed.

4714 ATKINSON ET AL.' CLIMATOLOGY OF SHELF WATER
30
27
u 24
•'21
12
JANUARY 43% MAY 79%
191
710
7O
38
31 32 33 34 35 36
SALINITY (xlO a )
FEBRUARY 86% 30
27
u 24
• 21
• 1S
w 15
12
182
52o
28 791
103 296
38 70
31 32 33 34 35 36
SALINITY (xlO 3 )
MARCH 100% 30
27
(J 24
12
272
40 210 693
198 710
63 38
70 66
31 32 33 34 35 35
SALINITY (xlO a )
APRIL 100% 30
27
• 24
•'21
n, 18
L• 15
12
792
63 136 210 891
38 230
SALINITY (xlOa>
27
24
21
lB
15
12
52O
63 136 65O 46O
38
31 32 33 34 35 36
SALINITY (xlOa>
JUNE 49% 30
27
24
21
lB
15
12
69
120 703
38 230
,.,
31 32 33 34 35 36
SALINITY (xlO a )
JULY 94% 30
27
24
21
lB
15
12
g
70 589 993
558
31 32 33 34 35 35
SALINITY (xlOa) '
AUGUST 94% 30
27
24
21
lB
15
12
759 1542
38
31 32 33 34 35 36
SALINITY (xlO a )
SEPTEMBER 86% 30
27
•< le
12
63 266 1618
_
70
31 32 33 34 35 36
SALINITY (x10a>
OCTOBER 81% 30
27
24
21
lB
15
12
69
21 222 962
68 63 7O 426
30 31 32 33 34 35 36
SALINITY (x10a>
NOVEMBER 100%
7
4
1
S
5
2
9
863
28 962
63 336
38 70
31 32 33 34 35 36
SALINITY (xlOa>
DECEMBER 86%
871
72 630
63 78 306
31 32 33 34 35 36
SALINITY (x103>
Fig. 11. Analysis of shelf waters by month. The number in each bivariate class represents the volume in km 3. The percent shown in the upper right of each figure indicates the percentage of the shelf volume for which data were available.
By August stratification increased throughout the SAB, probably due to an increase in surface heating and slackened winds. Stratification was lowest over the inner shelf of the
central SAB and highest to the south and north. Enhanced stratification off Florida is believed to be caused by local- ized, topographically enhanced summer upwelling that can
significantly decrease bottom temperature in that area [B!an- ton et al., 1981]. Stratification in November was similar to that of February, presumably owing to increased wind stress, reduced runoff, and atmospheric cooling.
During the summer, stratification is most intense at the shelf break reflecting the contrast between deeper Gulf

ATKINSON ET AL.' CLIMATOLOGY OF SHELF WATER 4715
82 81 8B 7g 78 77 76 75 82 81 8B 7g 78 77 76 75 82 81 8B 7g 78 77 76 75 36
34
33
32'
31
3B
2'9
2'8
2'?
ß N•EN T
N •BULK STRMATAyIF I CAT I ON
ß ,
BULK STRATIFICATION SEPTEMBER
36
35
34
33
32'
3B
'2'7
36
35
34
33
32'
31
3B
2'8
2'7
ß
I N•N T • . DATA
ß •. . FEBRUARY
36
ß
34 1.5
J ' STRATIFICATION U CA ION
•UNE • •• •K, S••• • 2g 36
35
34
2'9
2'8
BULK STRATIFICATION MARCH
ULK. S T •tTLIyF I CAT I ON ß , .
ß ' . .... 36
35
33
•.'. '.5 31 3B
LK STRATIFICATION NOVEMBER 2'9
' ' ' 2'7
36
35
34
33
32'
31
3B
2'9 •LK AUGUST ß
2'7 ,. '
36
34 ß .
33
BULK STRATIFICATION[
DECEMBER
82' 81 80 79 78 77 76 75 82' 81 80 79 78 77 76 75 82' 81 80 79 78 77 76 75
Fig. 12. Distribution of bulk stratification (trt units m -• x 10-3).

4716 ATKINSON ET AL' CLIMATOLOGY OF SHELF WATER
Stream water and shelf waters. During other times of the year stratification was most intense off Florida.
Salt Balance
Monthly mean surface and bottom salinities are used to estimate annual mean shelf exchange rates and residence times, using a salt balance method [Pritchard, 1960]. The topographically similar region south of the Carolina Capes from 28 ø to 34øN, which receives most of the river runoff, is considered. Volume-averaged salinities in each depth zone are plotted with total monthly runoff in Figure 4. Also shown is the volume-averaged salinity of the combined inner and midshelf regions, between 0 and 40-m isobaths S. The overbar indicates a volume average. Monthly mean salinities in the outer shelf Sos, are relatively constant owing to rapid exchange with the Gulf Stream. Lee et al. [1981] estimated an average 2-week residence time for the outer shelf water from enhanced exchange caused by the passage of Gulf Stream frontal eddies. Shelf water (salinity <36 x 10 -3) is rarely found at the outer shelf owing to this rapid renewal. The annual average outer shelf salinity is 36.08 x 10 -3. Monthly mean salinities of the inner shelf, Sis, show largest variations which tend to follow the river runoff cycle. Maximum runoff occurred in March and minimum inner
shelf salinities occurred two months later in May. Runoff decreased after March, then remained relatively constant from May to December. The inner shelf salinity increased rapidly from May to July, then also showed smaller varia- tions. These data indicate that exchange is occurring be- tween outer, middle, and inner shelf waters in order to produce the rapid increase of mean inner shelf salinity which levels out below midshelf, Sms, and outer shelf, Sos, values. The data also suggest that shelf precipitation must be ap- proximately equal to evaporation in order for shelf salinities to remain consistently below Gulf Stream values and for near-surface Gulf Stream salinities to be nearly constant.
The annual mean exchange rate of shelf water (within the 0-40 m zone between Cape Canaveral, Florida, and Cape Fear, North Carolina) with water of the outer shelf can be estimated from conservation of volume and salt concepts. Conservation of volume states that if the mean sea level is
constant, then the volume transport off the shelf Qo must equal the volume transport into the region from the outer shelf Qos and river runoff R:
Qo= Qos +R (2)
This assumes that along-shelf flows in and out of the region are approximately equal and in the same direction so that their effects cancel, a contention which is in part supported by the consistency of mid-shelf current observa- tions (Figures 8a, 8b) and the model results of Lee et al. [1982]. We also assume that precipitation is approximately equal to evaporation for the reasons previously stated. Conservation of salt states that the net transport of salt into or out of the shelf must equal the local time rate of change of the shelf volume average salt content, which can be approxi- mated by:
-- S dV = Qos•qos - Qo•qo (3) ot
Equation (3) assumes that the along-shelf salt transport into and out of the region are equal, which appears reasonable
given the weak alongshore salinity gradients and uniformity of mean alongshore flows. Here V is the mean volume of the shelf between 0-40 m isobaths and 28ø-34øN latitudes, V equals 1370 km 3 from Table 1, •o is the volume average salinity of the water transported out of the shelf and is taken to be equal to S, the volume average shelf salinity. By using equation (2) and the above, equation (3) can be written'
05 V• = Qos•qos - (Qos + R)•q (4)
Ot
Equation (4) is solved for the fraction rate of exchange of outer shelf with shelf water:
Qos &q 1 •q R • = Ot Sos• + •os• F (5)
The steady state exchange rate can be found by assuming that on the annual average the volume average shelf salinity does not change with time (OS)/(Ot) = 0 and taking the annual average of the values shown in Figure 4. From equation (5) we find that Qos/V = 0.2, or 20% of the shelf volume is exchanged with the outer she• each month on an annual average. The steady state exchange rate can be used to find the time needed to exchange any fractional amount of she• water from the following recurrence formula'
Qos Cn = Cn-• 1 (6)
V
where Cn is the percentage of original shelf water (Co = 1•%) remaining after n months. If we define the she• residence time T• as the time necessary to renew 95% of the original shelf volume, then from equation (6) the mean residence time of inner and midshelf waters is estimated at
approximately one year.
Mean Shelf Circulation
Mean flows in the outer she• of Florida and Georgia are significantly influenced by the strong, noahward flowing Gu• Stream, which tends to follow the shelf break. At midshe• (30-m isobath), mean flows were genera•y noah- ward during both winteffspring and summer/fall sampling periods (Figures 8a, 8b). The speeds were approximately equal in both upper and lower layers, suggesting barotropic flow. Scott and Csanady [1976] showed that the time- averaged nearshore flow off Long Island could be adequately described by an Ekman frictional equilibrium model ex- pressed by a simplified version of the ve•ically integrated along-she• momentum equation:
rsy = gh • + roo (7)
po Oy
where r•y is the surface wind stress in the along-shelf direction y (+ toward the noah), h is the total water depth, (O[)/(Oy) is the along-shelf surface slope of the sea level [, roo is a linear form of the along-shelf bottom stress with r a resistance coefficient of the dimension of velocity, and oo is the along-shelf velocity component measured several meters above the bottom. Scott and Csanady stratified their wind and cu•ent data into 16 d•erent wind categories and averaged the data in each category. A plot of r•y versus oo showed a near linear relationship from which (O[)/(Oy) and r were estimated from equation (7).

ATKINSON ET AL.' CLIMATOLOGY OF SHELF WATER 4717
The shelf wind and near-bottom current meter data from
the 30-m isobath off Georgia were partitioned into 16 wind event categories similar to those used by Scott and Csanady. Plots of •'sy versus vb averaged for each wind category showed a linear relationship [Tebeau and Lee, 1979] from which we estimate (O[)/(Oy) = -1.63 x 10 -7, r' 0.1 cm s -l for the winter/spring period, and (O[)/(Oy) = -0.67 x 10 -7, r = 0.1 cm s-1 for the summer/fall period. These values are in close agreement with the resistance coefficient of 0.16 cm s -• estimated by Scott and Csanady [1976] and the along- shelf surface slope of-2.1 _ 0.4 x 10 -7 estimated by Sturges [1974] for the inshore edge of the Gulf Stream by steric and geostrophic leveling.
The mean along-shelf wind stress averaged over the 4- month winter/spring and summer/fall measurement periods was approximately zero. Therefore during these periods the mean along-shelf momentum balance should be between the kinematic along-shelf pressure gradient and bottom stress as given by
rvb gh O• = - -- (8) oy
Taking r = 0.1 and (Og)/(Oy) = - 1.63 x 10 -7 for winter/spring and -0.67 x 10 -7 for summer/fall we find vo = 4.8 cm s -l for winter/spring and 2.0 cm s -l for summer/fall, which com- pares well to the 4.0 and 1.0 cm s -• time-averaged, along- shelf flows from near-bottom current meters at the 30-m
isobath during winter/spring and summer/fall periods, re- spectively.
These findings indicate that an along-shelf kinematic pres- sure gradient occurs at midshelf due to offshore oceanic conditions similar to that found for the mid-Atlantic Bight by Csanady [ 1978] and Beardsley and Winant [ 1979]. The along- shelf pressure gradient appears to account for the observed seasonally averaged northward mean flow at midshelf.
CONCLUSION
The climatology of oceanographic properties in the SAB indicates that the shelf can be separated into three depth zones, according to the controlling physical processes which regulate the degree of circulation and exchange within each zone. Mean hydrographic and flow properties in the outer shelf (41-60 m isobaths) are the result of the combined effects of transient Gulf Stream events occurring on time scales of 2 days to 2 weeks and to a lesser extent on wind forcing. Off the Florida and Georgia shelves the nearness to the Gulf Stream produces strong northward mean flows. Rapid exchange with Gulf Stream frontal disturbances re- sults in residence times of the order of 2 weeks, which maintain salinities in the outer shelf of Gulf Stream origin (>36 x 10 -3) throughout the year.
Mean flow and hydrographic properties in the midshelf zone (21-40 m isobaths) appear to be a mixed response to wind, Gulf Stream and density forcing. Northward mean flows of 1-4 cm s -• from 4-month averages during win- ter/spring and summer/fall seasons appear to result from barotropic current response to an along-shelf slope in sea level of oceanic origin. Salinity of the midshelf water appears to be a mixture of Gulf Stream and inner shelf waters. Mean
monthly volume-averaged salinities were always between Gulf Stream and inner shelf values and tended to be closer to
Gulf Stream salinity. Stratification undergoes a pronounced
seasonal cycle in the midshelf zone. During November- March atmospheric cooling over the variable depths appears responsible for cross-shelf gradients in density with denser water in shallower depths. However, the combination of wind and tidal mixing with low river runoff is sufficient to maintain vertically homogeneous conditions over most of the midshelf region. Topographically enhanced stratification appears to occur in the lee of capes and regions of diverging isobaths such as in the vicinity of Cape Canaveral and the Carolina Capes. April appears to be a transition period with decreasing wind speeds and increasing runoff and atmo- spheric heating, which results in a positive cross-shelf densi- ty gradient and the onset of stratification at midshelf. During June-August, stratification is widespread and the shelf be- comes essentially a two-layered system. The fall transition occurs in September and October with the onset of enhanced southward wind events that increase vertical mixing and begin to break up the summer stratification.
In the inner shelf (0-20 m isobaths) flow and hydrographic properties are strongly influenced by river runoff and atmo- spheric forcing. Runoff tends to form an along-shelf band of low salinity water in the inner shelf which results in some degree of year-round stratification. Salinity in the band is less and stratification greatest during spring when runoff is highest. The shallow, stratified water of the inner shelf is very responsive to wind forcing. During June and July, mean winds are toward the north and low salinity water is ob- served off the Carolinas. In September and October, south- ward winds appear to be related to the occurrence of low- salinity water in the inner shelf off Florida and Georgia.
The annual mean exchange rate of the combined midshelf and inner shelf waters with outer shelf waters is estimated at
20% per month. At this rate we estimate a mean residence time for the shelf of approximately 1 year.
Acknowledgments. We thank the crews of the many research ships that we used during the field studies. We appreciate the discussions with our colleagues David Menzel, Christopher Mooers, Claes Rooth, and Leonard Pietrafesa and two unknown reviewers. The assistance of the many technicians is especially appreciated, and in particular we would like to thank Jim Singer and Patrick O'Malley. We also thank Beth Christiansen, Linda Land, Suzanne Mcintosh, and Anna Boyette for technical assistance. This research was supported by the Department of Energy under contracts DE- AS05-76EV05163, DE-AS09-76EV00889, and DE-AS09-80EV 10331 and the Bureau of Land Management prime contract number AAT851-CT1-25 to Science Applications, Inc.
REFERENCES
Atkinson, L. P., Modes of Gulf Stream intrusions into South Atlantic Bight shelf waters, Geophys. Res. Lett., 4, 583-586, 1977.
Bane, J. M., Jr., and D. A. Brooks, Gulf Stream meanders along the continental margin from the Florida Straits to Cape Hatteras, Geophys. Res. Lett, 6, 280-282, 1979.
BeardsIcy, R. C., and W. C. Boicourt, On estuarine and continental shelf circulation in the middle Atlantic Bight, in Evolution of Physical Oceanography, Scientific Surveys in Honor of Henry Storereel, edited by B. A. Warren and C. Wunsch, pp. 198-233, MIT Press, Cambridge, Mass., 1981.
Beardsicy, R. C., and C. D. Winant, On the mean circulation in the mid-Atlantic Bight, J. Phys. Oceanogr., 19, 612-619, 1979.
Blanton, J. O., Ocean currents along a nearshore frontal zone on the continental shelf of the southeastern U.S., J. Phys. Oceanogr., 11, 1627-1637, 1981.
Blanton, J. O., L. P. Atkinson, L. J. Pietrafesa, and T. N. Lee, The intrusion of Gulf Stream water across the continental shelf due to
topographically induced upwelling, Deep Sea Res., 28, 393-405, 1981.
4718 ATKINSON ET AL..' CLIMATOLOGY OF SHELF WATER
Brooks, D. A., and J. M. Bane, Jr., Gulf Stream deflection by a bottom feature off Charleston, South Carolina, Science, 201, 1225-1226, 1978.
Bumpus, D. F., A description of the circulation on the continental shelf of the east coast of the United States, Progr. Oceanogr., 6, 111-158, 1973.
Bumpus, D. F., and J. Chase, Changes in the hydrography observed along the east coast of the United States, Spec. Publ. 6, Int. Comm. on NW Atlantic Fish., pp. 847-853, Woods Hole Ocean- ogr. Inst., Woods Hole, Mass., 1965.
Bunker, A. F., Computations of surface energy flux and annual air- sea interaction cycles of the North Atlantic Ocean, Mon. Weather Rev., 104, 1122-1140, 1976.
Chase, J., Surface salinity along the east coast of the United States, Deep Sea Res. Supp., 16, 25-29, 1969.
Chase, J., Oceanographic observations along the east coast of the United States, January-December 1967. U.S. Coast Guard Oceanogr. Rep., 38, 149 pp., 1971.
Church, P., Temperatures of the western North Atlantic from thermograph records, in Publ. Sci. 4, 36 pp., Assoc. de'Oceanogr. Phys., Union Geod. et Geophys. Int., 1937.
Csanady, G. T., The arrested topographic wave, J. Phys. Ocean- ogr., 8, 47-62, 1978.
Fuglister, F. C., Average monthly sea surface temperatures of the western North Atlantic Ocean, in Papers in Physical Oceanogra- phy and Meteorology, vol. 10, no. 2, 25 pp., Massachusetts Institute of Technology, Cambridge, Mass., and Woods Hole Oceanographic Institution, Woods Hole, Mass., 1947.
Green, C. K., Summer upwelling, northeast coast of Florida, Science, 100, 546-547, 1944.
Jacobson, J.P., A socio-economic environmental baseline summary for the South Atlantic region between Cape Hatteras, North Carolina and Cape Canaveral, Florida, in Physical Oceanography, vol. 1, Virginia Institute of Marine Science, Gloucester, Va., 1974.
Lee, T. N., and L. P. Atkinson, Low frequency current and temperature variability from Gulf Stream frontal eddies and atmospheric forcing along the southeast U.S. outer shelf, J. Geophys. Res., this issue.
Lee, T. N., and D. A. Brooks, Initial observations of current, temperature and coastal sea level response to atmospheric and Gulf Stream forcing on the Georgia shelf, Geophys. Res. Lett., 6, 321-324, 1979.
Lee, T. N., L. P. Atkinson, and R. Legeckis, Detailed observations of a Gulf Stream frontal eddy on the Georgia continental shelf, April 1977, Deep Sea Res., 28, 347-378, 1981.
Lee, T. N., E. Daddio, and G. C. Han, Steady state diagnostic model of summer mean circulation on the Georgia shelf, J. Phys. Oceanogr., in press, 1982.
Legeckis, R., Satellite observations of the influence of bottom topography on the seaward deflection of the Gulf Stream off Charleston, South Carolina, J. Geophys. Res., 9, 483-497, 1979.
Maul, G. A., P. W. deWitt, A. Yanaway, and S. Baig, Geostationary satellite observations of Gulf Stream meanders, J. Geophys. Res., 83, 6123-6135, 1978.
Niiler, P. P., and W. S. Richardson, Seasonal variability of the Florida current, J. Mar. Res., 31, 144-167, 1973.
Parr, A. E., A geographical-ecology analysis of the seasonal changes in temperature conditions in shallow water along the Atlantic coast of the United States, Bull. Bingham Oceanogr. Collect., 4(3), 1-90, 1933.
Pietrafesa, L. J., J. O. Blanton, and L. P. Atkinson, Evidence for deflection of the Gulf Stream by the Charleston Rise, Gulf Stream, 4(9), 3-7, 1978.
Pritchard, D. W., Salt balance and exchange rate for Chincoteague Bay, Chesapeake Sci., 1, 48-57, 1960.
Ruzecki, E. P., A socio-economic environmental baseline summary for the South Atlantic region between Cape Hatteras, North Carolina and Cape Canaveral, Florida, in Climatology, vol. 1, Virginia Institute of Marine Science, location, 1974.
Saunders, P.M., Wind stress on the ocean over the eastern continental shelf of North America, J. Phys. Oceanogr., 7, 555- 556, 1977.
Schroeder, E. H., North Atlantic temperatures at a depth of 200 m, Serial Atlas of the Marine Environment, folio 2, Am. Geogr. Soc., Milwaukee, Wis., 1963.
Scott, J. T., and G. T. Csanady, Nearshore currents off Long Island, J. Geophys. Res., 81, 5401-5409, 1976.
Stefansson, U., L. P. Atkinson, and D. F. Bumpus, Hydrographic properties and circulation of the North Carolina shelf and slope waters, Deep Sea Res., 18, 383-420, 1971.
Sturges, W., Sea level slope along continental boundaries, J. Geophys. Res., 79(6), 825-830, 1974.
Taylor, C. B., and H. B. Stewart, Summer upwelling along the east coast of Florida, J. Geophys. Res., 64, 33-40, 1959.
Tebeau, P. A., and T. N. Lee, Wind induced circulation on the Georgia shelf (winter 1976/1979), Tech. Rep. 79003, 177 pp., Univ. of Miami Rosensteil School of Mar. and Atmos. Sci., Miami, Fla., 1979.
Weber, A. H., and J. O. Blanton, Monthly mean wind fields for the South Atlantic Bight, J. Phys. Oceanogr., 10, 1256-1263, 1980.
(Received April 1, 1982; revised August 30, 1982;
accepted December 9, 1982.)


![[PPT]Phylogeny of Bacteria, Archaea, and Eukaryotic …ksuweb.kennesaw.edu/~jhendrix/bio3341/phylogeny.pptx · Web viewA. Domain Bacteria Phylum Cyanobacteria Oxygenic photosynthetic](https://img.pdfslide.us/doc/110x75/5ac91f257f8b9a51678cf171/pptphylogeny-of-bacteria-archaea-and-eukaryotic-jhendrixbio3341phylogenypptxweb.jpg)