Embed Size (px)
Citation preview
EarthLabs: Weather and Climate – Lab 1 http://serc.carleton.edu/eslabs/weather/1.html Name _________________________
Climate, Weather, and Trees Goals: After completing this investigation, you should be able to:
• define weather and climate, and describe how they can be determined at various spatial scales and for various time periods;
• distinguish between weather and climate; and explain the relationship between climate and the biosphere, especially trees.
PART A: Climate, Weather, and Plants in Your Region 1. Write a paragraph describing how you predict the weather in your study area will change over the next day, week, and month, and year. 2. How will the plant that you are observing change in these same time periods? You may want to sketch your predictions for plant growth or change. 3. If possible, identify the age and species of your tree. There are many helpful websites with information about trees; several are linked here: Tree guides: http://www.arborday.org/trees/whatTree/ http://hort.ufl.edu/database/trees/trees_common.shtml PART B: Case Study: Life of a Maple Tree
EarthLabs: Weather and Climate – Lab 1 http://serc.carleton.edu/eslabs/weather/1.html Name _________________________ 1. Describe the ideal growing conditions for the sugar maple. Be as specific as possible; include temperature and rainfall needs as well as other information from the text and videos. 2. Compare and contrast the sugar maple tree to the plant that you described in Lab 1A. How are they similar or different? 3. Describe the maple sugaring process. Why is "sugaring" an important signal of the arrival of Spring? 4. How is maple sugaring dependent on weather and climate?
EarthLabs: Weather and Climate – Lab 1 http://serc.carleton.edu/eslabs/weather/1.html Name _________________________
Page 3 of 4
PART C: Suitable Climate for a Maple Forest 1. How much does the temperature data for one day in February change over the 30-‐year period? (i.e., What is the range of the data?) 2. Two students were discussing weather and climate and shopping for back-‐to-‐school clothing. One stated that knowing the climate of a region helped her decide what clothing to buy, but that the weather forecast helped her to decide what to wear each day. Explain what she meant by this statement.
EarthLabs: Weather and Climate – Lab 1 http://serc.carleton.edu/eslabs/weather/1.html Name _________________________
Page 4 of 4
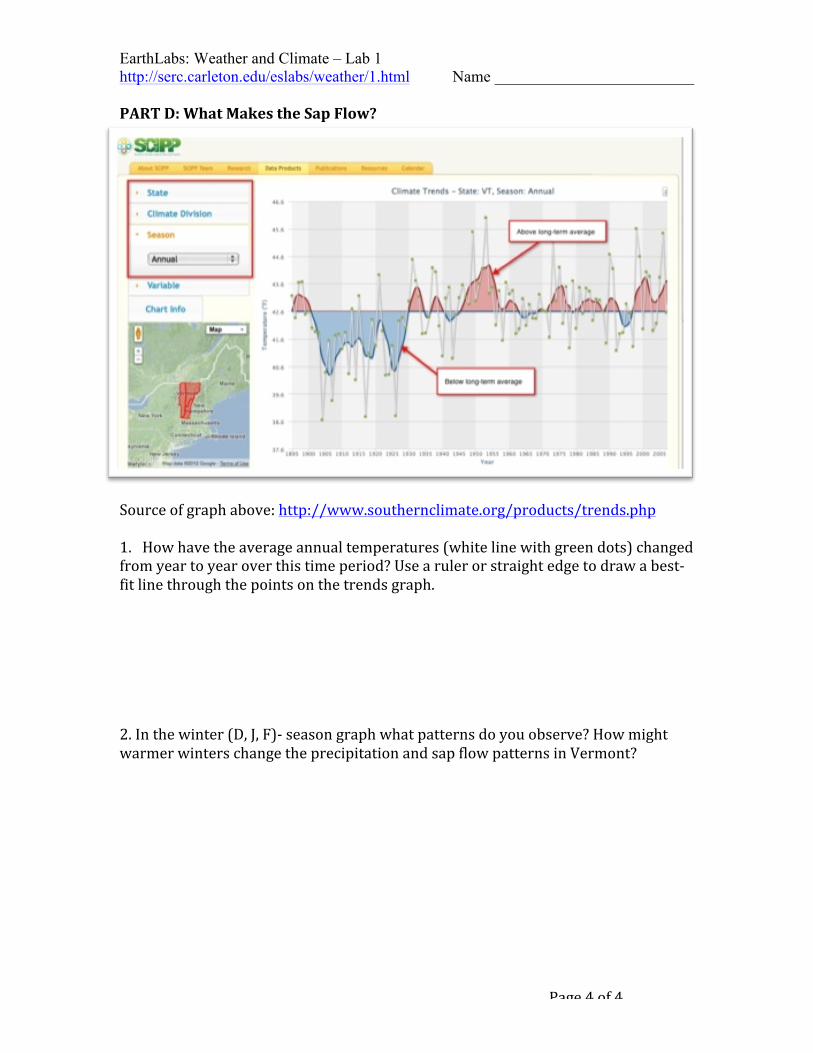
PART D: What Makes the Sap Flow?
Source of graph above: http://www.southernclimate.org/products/trends.php 1. How have the average annual temperatures (white line with green dots) changed from year to year over this time period? Use a ruler or straight edge to draw a best-‐fit line through the points on the trends graph. 2. In the winter (D, J, F)-‐ season graph what patterns do you observe? How might warmer winters change the precipitation and sap flow patterns in Vermont?