Embed Size (px)
Citation preview

Figure 1: SPCZ Position in May 2018. Generally ‘Below Average’ rain-
fall was recorded for May. Pg. 1
& 2
Warmest daytime temperature
of 33.70C for the month of May
was registered on the 21st at
Alafua station and the coolest
night time temperature of
14.90C was recorded on the
14th at Afiamalu station. Pg. 3
Easterly winds were the domi-
nant wind direction with Light
winds (1-10km/hr) being the
dominant wind speed. Pg 4 & 5
Although in neutral range, cli-
mate models suggest a in-
crease in Sea Surface tempera-
ture in the upcoming months,
and can influence the ENSO
status. Pg 6
The eastward propagation of
warmer than normal anomalies
as observed in the last 4
months, is continuing below
the Ocean surface. Cooler
anomalies have weakened
dramatically in the eastern
equatorial region, which justi-
fies the ending of the La Nina
event earlier this year. Pg 6
ISSUED: JUNE 2018
CLIMATE SUMMARY MAY 2018 Samoa Meteorology Division
Ministry of Natural Resources and Environment
HIGHLIGHTS
W: www.samet.gov.ws Ph: (685) 20855/20856
F: www.facebook.com/Samoa Meteorological Services
Figure 2: Normal Position of SPCZ in May.
ITCZ
GLOBAL SCALE OBSERVATIONS
The May 2018 Inter Tropical Convergence Zone was displaced north prior to it’s long term average May
position. It was also observed to be slightly more active. On the contrary, the South Pacific Convergence
Zone (SPCZ), was seen to be disorganized and less active than normal. For Samoa, the SPCZ state for
May meant not much rainfall activity was observed.
LOCAL SCALE OBSERVATIONS
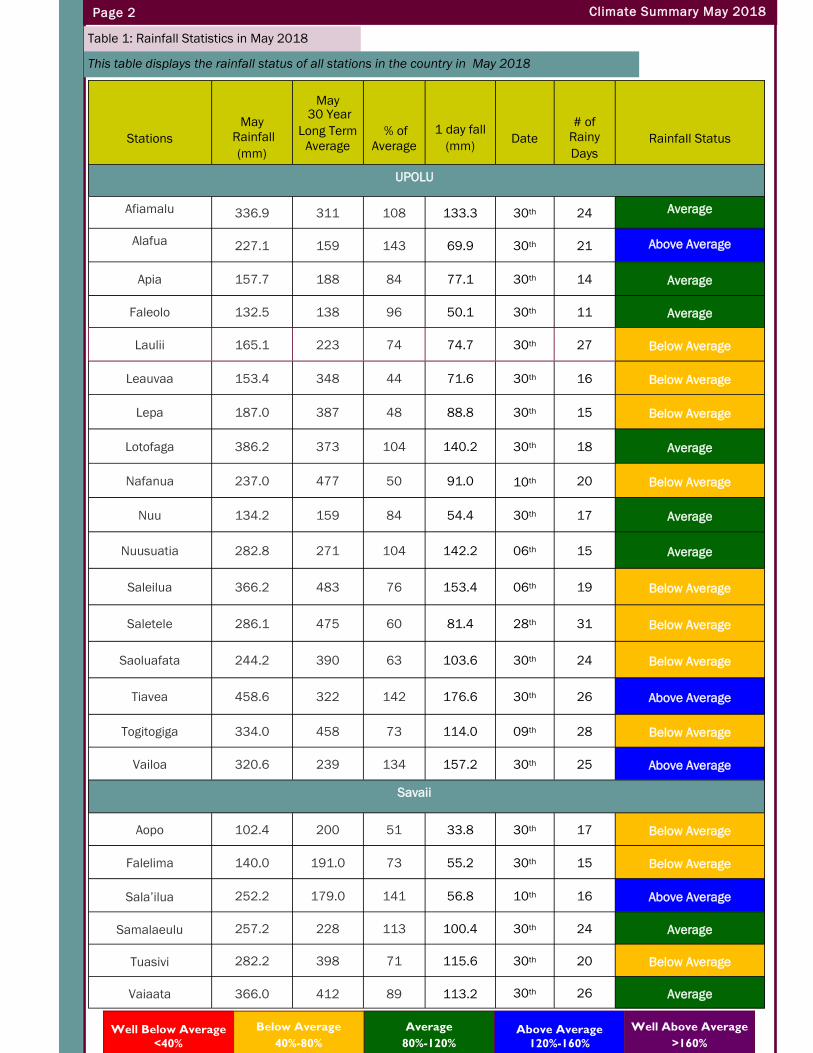
May 2018 received moderate rainfall activity. The highest precipitation of 458.6mm was recorded at
Ti’avea, Lotofaga being the second highest of 386.2mm and the third highest at Saletele of 382.1mm. On
the contrary, Aopo registered the lowest rainfall for May 2018 with the second lowest recorded at Faleolo
station of 382.1mm. The presence of a weak trough over the Islands on the 30th of May brought
significant rainfall, where Tia’vea station registered the highest one day fall of 176.6mm, and Vailoa with
the second highest of 157.2mm, both on the same day. If referred to Table 1, rainfall statistics shows 4
stations registered Above Average rainfall, 8 stations registered Average rainfall and 11 stations recorded
Below Average rainfall.
A graphical representation of the comparison between rainfall activity in may 2017 and may 2018 is
displayed on page 7.
SAMOA
Page 2 Climate Summary May 2018
Table 1: Rainfall Statistics in May 2018
This table displays the rainfall status of all stations in the country in May 2018
Stations
May
Rainfall
(mm)
May 30 Year
Long Term
Average
% of
Average
1 day fall
(mm)
Date
# of
Rainy
Days
Rainfall Status
UPOLU
Afiamalu 336.9 311 108 133.3 30th 24 Average
Alafua 227.1 159 143 69.9 30th 21 Above Average
Apia 157.7 188 84 77.1 30th 14 Average
Faleolo 132.5 138 96 50.1 30th 11 Average
Laulii 165.1 223 74 74.7 30th 27 Below Average
Leauvaa 153.4 348 44 71.6 30th 16 Below Average
Lepa 187.0 387 48 88.8 30th 15 Below Average
Lotofaga 386.2 373 104 140.2 30th 18 Average
Nafanua 237.0 477 50 91.0 10th 20 Below Average
Nuu 134.2 159 84 54.4 30th 17 Average
Nuusuatia 282.8 271 104 142.2 06th 15 Average
Saleilua 366.2 483 76 153.4 06th 19 Below Average
Saletele 286.1 475 60 81.4 28th 31 Below Average
Saoluafata 244.2 390 63 103.6 30th 24 Below Average
Tiavea 458.6 322 142 176.6 30th 26 Above Average
Togitogiga 334.0 458 73 114.0 09th 28 Below Average
Vailoa 320.6 239 134 157.2 30th 25 Above Average
Savaii
Aopo 102.4 200 51 33.8 30th 17 Below Average
Falelima 140.0 191.0 73 55.2 30th 15 Below Average
Sala’ilua 252.2 179.0 141 56.8 10th 16 Above Average
Samalaeulu 257.2 228 113 100.4 30th 24 Average
Tuasivi 282.2 398 71 115.6 30th 20 Below Average
Vaiaata 366.0 412 89 113.2 30th 26 Average
Well Below Average
<40%
Below Average
40%-80%
Average
80%-120%
Above Average
120%-160%
Well Above Average
>160%
Page 3 Climate Summary May 2018
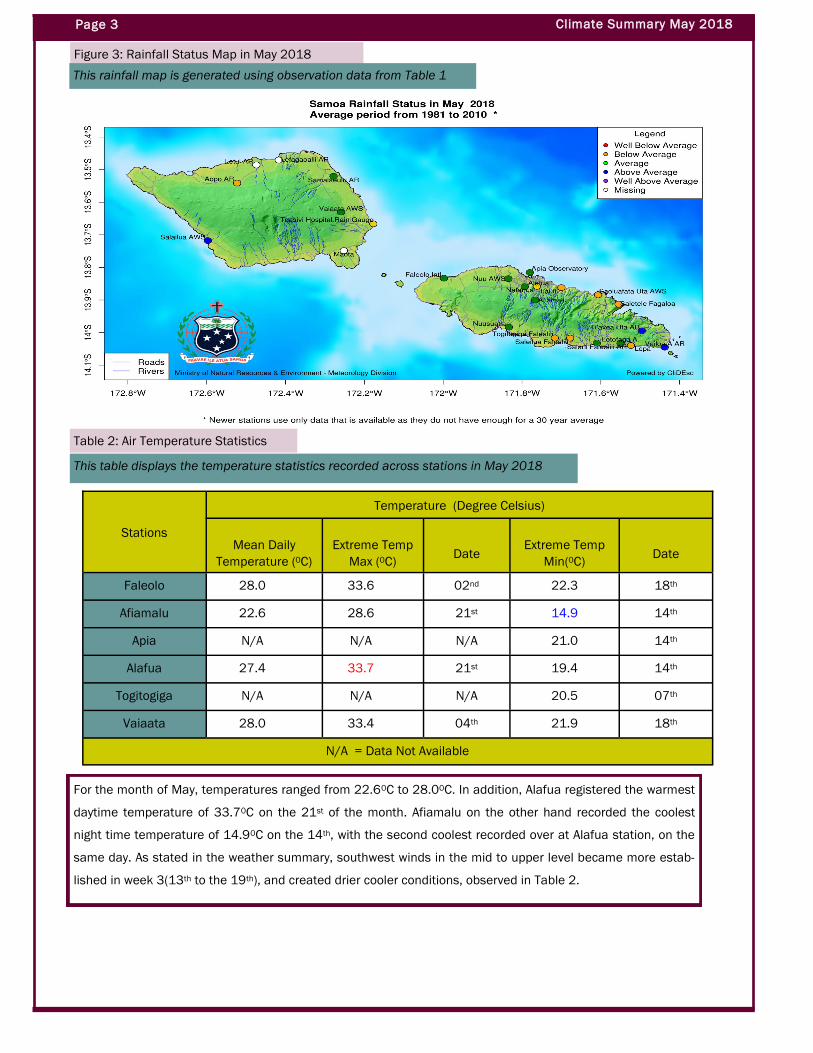
Figure 3: Rainfall Status Map in May 2018
This rainfall map is generated using observation data from Table 1
Table 2: Air Temperature Statistics
This table displays the temperature statistics recorded across stations in May 2018
Stations
Temperature (Degree Celsius)
Mean Daily
Temperature (0C)
Extreme Temp
Max (0C)
Date
Extreme Temp
Min(0C)
Date
Faleolo 28.0 33.6 02nd 22.3 18th
Afiamalu 22.6 28.6 21st 14.9 14th
Apia N/A N/A N/A 21.0 14th
Alafua 27.4 33.7 21st 19.4 14th
Togitogiga N/A N/A N/A 20.5 07th
Vaiaata 28.0 33.4 04th 21.9 18th
N/A = Data Not Available
TEMPERATURE
For the month of May, temperatures ranged from 22.60C to 28.00C. In addition, Alafua registered the warmest
daytime temperature of 33.70C on the 21st of the month. Afiamalu on the other hand recorded the coolest
night time temperature of 14.90C on the 14th, with the second coolest recorded over at Alafua station, on the
same day. As stated in the weather summary, southwest winds in the mid to upper level became more estab-
lished in week 3(13th to the 19th), and created drier cooler conditions, observed in Table 2.

Climate Summary May 2018
Station Highest MSL
Pressure (hPa) Date
Lowest MSL
Pressure (hPa) Date
Average MSL
Pressure (hPa)
Apia 1015.5 09th 1009.1 02nd 1012.0
Faleolo 1015.7 09th 1010.1 28th 1013.2
Table 3: Atmospheric Pressure at Mean Sea Level (MSL)
This table displays the atmospheric statistics recorded across two stations in May 2018
Faleolo station registered the highest Mean Sea Level (MSL) pressure of 1015.7hPa, on the 09 th of May. Moreover,
the lowest MSL pressure of 1009.1hPa was recorded at Apia station on the 02nd of the same month. (Note: High
pressure systems associate with good weather conditions whereas low pressure systems associate with bad
weather conditions)
ATMOSPHERIC PRESSURE
WIND
Figure 4: Wind Speed and Directions
The following diagrams show the different wind speed and direction that recorded daily at 9am across the country in
May 2018.
Figure 4a : Apia Station Figure 4b: Faleolo Station
Easterlies dominated Apia station (Figure 4a) for the month of May, with some northwest winds evident in May.
Winds speeds of 1-10km/hr were the most occurring wind speed (61.3% occurrence). Strong winds (40-50km/hr)
were also recorded at Apia station.
For Faleolo Station (Figure 2b), variable wind directions were registered with Easterly winds being the dominant.
Light winds (1-10km/hr) had the highest occurrence of 41.9%.
Page 4

Page 5 Climate Summary May 2018
Figure 4c : Afiamalu Station Figure 4d: Vaiaata Station
May statistics for Afiamalu station (Figure 4c) shows that the Easterlies were also the dominant wind direction, with predomi-
nant light winds (1-10km/hr) for wind speeds. Some moderate winds (21-30 km/hr) travelling from the north were also regis-
tered at Afiamalu station.
South Easterly winds were registered as the most occurring wind direction at Vaiaata station (Figure 4d). In addition, light winds
(1-10km/hr) were the dominant wind speeds, with noticeable gentle winds (10-20km/hr) travelling from the North East as well.

Page 6 Climate Summary May 2018
EL NINO SOUTHERN OSCILLATION (ENSO)
CURRENT ENSO STATUS
The current ENSO status remains neutral, as suggested
by most atmospheric and oceanic indicators. Most cli-
mate models predict the tropical Pacific Ocean will
slightly warm towards August, but will continue to be in
neutral levels.
Atmospheric Indicator of ENSO
Figure 5: Sea Surface Temperature in May 2018
Across the tropical Pacific Ocean, sea surface tempera-
tures for May were near average. Cooler anomalies have
weakened in the eastern Equatorial region due to warm
waters propagating from the west.
The May values for NINO 3, NINO 3.4 and NINO 4 were –
0.00 C, 0.00 C and +0.20 C respectively.
Southern Oscillation Index (SOI)
Figure 6: Sub-surface Temperature
The cross section showing temperatures beneath the
ocean surface (Figure 6) displays the behavior of warm
and cool anomalies in the past four months. The east-
ward propagation of warmer than average anomalies
from the west tends to weaken cooler anomalies located
in the 125W longitude in the east . This is a typical indi-
cation of a weak La Nina declining.
Oceanic Indicator of ENSO
The 30 day Southern Oscillation Index (SOI) to 03rd of
June was +1.7, and the 90 day SOI was +5.9. Although
fluctuating, the SOI has been in neutral levels since last
April.
(Sustained positive values of the SOI above +7 indicate La
Nina. Whereas sustained negative values below –7 indicate
El Nino. Values within –7 and +7 shows neutral conditions.)
Figure 5: Sea-surface Temperature
Sea Surface Temperatures (SSTs)
Sub surface temperatures

Page 7 Climate Summary May 2018
APPENDIX
Figure 7: Graphical representation of total monthly rainfall in May 2017 vs May 2018 in all rainfall stations.
There was more rainfall activity in May 2017 compared to may 2018. Easterly wind flows dominated may 2018 but
could not bring as much rainfall activity as last year.
0
200
400
600
800
1000
1200
Rainfall in May 2017 vs May 2018
2017 2018