Embed Size (px)
Citation preview

8/8/2019 Climate Solution Web
http://slidepdf.com/reader/full/climate-solution-web 1/96
limateolutions

8/8/2019 Climate Solution Web
http://slidepdf.com/reader/full/climate-solution-web 2/96

8/8/2019 Climate Solution Web
http://slidepdf.com/reader/full/climate-solution-web 3/96
Authors
Yurika Ayukawa & Yamagishi Naoyuki (Japan); Dongmei Chen (China);
Dr Igor Chestin & Alexei Kokorin (Russia); Jean-Philippe Denruyter
(Bioenergy); Mariangiola Fabbri (Energy Efficiency); Gary Kendall
& Paul Gamblin (Gas); Karl Mallon (Design and Summary of Input Data);Jennifer Morgan (The 2oC Imperative); Richard Mott (Nuclear; United
States of America); Simon Pepper (Energy and Poverty); Jamie Pittock
(Hydroelectricity); Duncan Pollard (Deforestation); Dr Hari Sharan,
Prakash Rao, Shruti Shukla & Sejal Worah (India); Dr Stephan Singer
(Wind Energy; Carbon Capture and Storage (CCS; European Union);
Giulio Volpi & Karen Suassuna (Brazil); Dr Harald Winkler (South Africa).
ISBN Number: 2-88085-277-3
Climate Solutions
WWF’s Vision for 2050

8/8/2019 Climate Solution Web
http://slidepdf.com/reader/full/climate-solution-web 4/96
In five years it may be too late to initiate a sustainable transition which could avert
a breach of the two-degree threshold for avoiding dangerous climate change without
compromising biodiversity.
A RESULT:
This WWF report seeks to answer thequestion: “Is it technically possible to meet
the growing global demand for energy by
using clean and sustainable energy sources
and technologies that will protect the global
climate?” In other words, can a concerted
shift to the sustainable energy resources
and technologies that are available today
meet the more than doubling of global
energy demand projected by 2050, while
avoiding dangerous climatic change of
more than two degrees Celsius above
pre-industrial levels?
The report’s conclusion is that the
technologies and sustainable energy
resources known or available today are
sufficient to meet this challenge, and
there is still sufficient time to build up
and deploy them, but only if the necessary
decisions are made in the next five years.
Yet it is clear that the economic policies
and governmental interventions needed to
propel this transition are not now in place,
or even in prospect in most cases. This is
a matter to which the world needs to giveurgent attention.
WWF is acutely aware that many of the
steps considered in this report – an end to
the dominance of fossil energy, a phase-
out of nuclear power, a rapid expansion of
biomass energy – carry with them social,
environmental, and economic consequences
that must be carefully weighed and closely
managed. To take a single example, even
the limited shift to energy crops today
threatens accelerated conversion of wild
habitats and further deprivation of theworld’s poor by driving up food prices. A
global energy transition must be managed
to reflect the differing priorities and
interests of the world community at large.
Halting climate change is a long-term
undertaking, but the first steps must be
taken by governments currently in power.
The future depends on them making
critical decisions soon which could lead
to a low-emission global energy economy
in a timescale consistent with saving the
climate, and planning for the social andeconomic dimensions of that transition
to minimize the negative impacts of such
urgent change.
The WWF Global
Energy Task ForceIn 2006, WWF convened a Global Energy
Task Force to develop an integrated
vision on energy for 2050. The Task Force
explored the potential for successful
achievement of the following goal for energy policy: to meet the projected
global growth in demand for energy
services while avoiding the most dangerous
impacts of climate change, but using
energy sources that are socially and
environmentally benign.4
The time-sensitive approach taken here
differs from other studies in a number
of ways. It draws on authoritative sources
for projections of energy demand
and climate change trends, uses WWF
expertise to estimate the sustainablelimits of technologies and resources,
and assesses a wide range of publisheddata on the potential rate of development
and deployment of these technologies and
systems. Finally, it exposes this information
to analysis in a model which assesses the
feasibility of successful delivery of the goal
described above. A scenario showing high
success potential is illustrated in this paper.
The task force began by reviewing
25 different low-carbon energy
technologies, broadly construed: these
included renewable energy sources, such as
solar and wind power; demand-side optionssuch as efficient buildings and vehicles
and reduced travel; and other low-carbon
technologies such as “carbon capture
and storage” and nuclear power. The
sole constraint was that technologies be
“proven”, by virtue of being commercially
available already.
Each of the energy sources was then sorted
and ranked based on its environmental
impacts, social acceptability, and economic
costs. This ranking exercise yielded three
groupings of technologies: those with
clear positive benefits beyond the ability
to reduce carbon intensity (efficiency
technologies dominate this group); those
with some negative impacts but which
remain on balance positive; and those
whose negative impacts clearly outweigh
the positive.
Executive Summary
CLIMATE SOLUTIONS: THE WWF VISION FOR 2050
2

8/8/2019 Climate Solution Web
http://slidepdf.com/reader/full/climate-solution-web 5/96
Climate Solutions:
The WWF Vision for 2050
The WWF ClimateSolutions ModelThe technology groups whose benefits were
found to outweigh their negative impacts
were then run through a newly designed
WWF Climate Solutions Model. This model
was designed to determine the industrial
feasibility of developing and deploying these
resources and technologies in a timeframe
that can avert dangerous climate change
over the period to 2050, and at levels that
can accommodate the projected increase
in global demand for energy.
It bears emphasis that the WWF Climate
Solutions Model is not an economic model:
no price for carbon was set, nor were
the costs of the technologies assigned or
modelled. Economic scenarios have been
explored by others, including Stern5 and
McKinsey6 , noting that costs of dangerous
climate change are far in excess of the costs
of avoiding it. Likewise, no assumptions
have been incorporated about the policies
or measures needed to drive a transition tothe sustainable energy technologies in the
model. Rather, the model seeks to answer
only the narrow question whether, given
what is known about physical resources,
the capacity of the technologies themselves
and the rate of industrial transitions, it is
feasible to deploy the needed technologies
in time to avert dangerous climatic change.
Findings
and ConclusionsOn this all-important point, the WWF
Climate Solutions Model offers a qualified
basis for hope: it indicates that with a high
degree of probability (i.e. greater than
90%), the known sustainable energy
sources and proven technologies could be harnessed between now and 2050
to meet a projected doubling of global
demand for energy services, while
achieving the significant (in the order
of 60%-80%) reductions in climate-
threatening emissions, enabling a long-term
stabilization of concentrations at 400ppm
(parts per million) – though concentrations
in the short term will peak at a higher level
before being absorbed by oceans and the
biosphere. A solution, in other words, is at
least possible.
However, from this threshold determination
of technological feasibility, the outlook
immediately becomes more complex
and ominous. The economic policies and
measures, as well as the intergovernmental
actions, needed to drive this transition are
not yet in place, and may well be years
away based on current progress. And with
real-world constraints on the speed of
industrial transition, analysed in our model,
it is clear that time is now of the essence.
In five years it may be too late to initiatea sustainable transition which could avert
a breach of the two-degree threshold for
avoiding dangerous climate change. In that
event, dangerously unsustainable options
may be forced upon us or we will face
more severe interventions which will have
significant impacts on the global economy.
Solutions
The WWF report identifies the following
six solutions and three imperatives as key
to achieving the goal of meeting globalenergy demand without damaging the
global climate:
1 Breaking the Link Between EnergyServices and Primary Energy
Production — Energy efficiency
(getting more energy services per unit
of energy used) is a priority, especially
in developed countries which have
a very inefficient capital stock. The
model shows that by 2020-2025, energy
efficiencies will make it possible to meet
increasing demand for energy services
within a stable net demand for primary
energy production, reducing projected
demand by 39% annually, and avoiding
emissions of 9.4Gt carbon per year,
by 2050.
2 Stopping Forest Loss — Stopping and
reversing loss and degradation of forests,
particularly in the tropics, is a crucial
element of any positive climate-energy
scenario. The probability of success of
the climate solutions proposed here drops
progressively from greater than 90%
down to 35% in the absence of effective
action to curb land-use emissions.
3 Concurrent Growth of Low-Emissions
Technologies — The rapid and parallel
pursuit of the full range of technologies,
such as wind, hydro, solar PV & thermal,
and bio-energy is crucial, but within a set
of environmental and social constraints
to ensure their sustainability. By 2050,
these technologies could meet 70% of
the remaining demand after efficiencies
have been applied, avoiding a further
10.2Gt carbon emissions annually.
4 Developing Flexible Fuels, EnergyStorage and New Infrastructure —
Deep cuts in fossil-fuel use cannot be
achieved without large volumes
3 © W W F , K e v i n S C H A F E R

8/8/2019 Climate Solution Web
http://slidepdf.com/reader/full/climate-solution-web 6/96
of energy from intermittent sources,like wind and solar, being stored and
transformed into transportable fuels and
into fuels to meet the thermal needs of
industry. New fuels, such as hydrogen,
that meet these requirements will require
major new infrastructure for their
production and distribution.
5 Displacing High-Carbon Coal with
Low-Carbon Gas — Natural gas as
a “bridging fuel” offers an important
opportunity to avoid the long-term lock-
in of new coal power stations, providingsignificant carbon savings in the near
term, while other energy sources and
technologies are grown from a smaller
industrial base.
6 Carbon Capture and Storage (CCS)
— The model shows that, in order
to stay within the carbon emissions
budget, it is essential that fossil-fuel
plants are equipped with carbon capture
and storage technology as soon as
possible – all by 2050. This has major
and immediate implications for the
planning and location of new plants,
since transport of carbon dioxide to
distant storage sites would be very costly.
Overall, fossil fuels with CCS could
account for 26% of supply in 2050,
avoiding emissions of 3.8GtC/yr.
Additional Imperatives1 Urgency — Delays will make the
transition to a low-carbon economy
increasingly expensive and difficult,
with much greater risks of failure.
The case for early, decisive action is
overwhelming.
2 A Global Effort — Every country has
a role to play in response to the scale
and the type of challenges arising in
its territory.7
3 Leadership — Action is needed bygovernments of the world to agree
targets, to collaborate on effective
strategies, and to influence and
coordinate the investment of the many
trillions of dollars which, in any event,
will be spent on energy developments in
the coming decades, so that future needs
are met safely and sustainably.
Following an introduction, the balance
of this report is comprised of sections
that provide greater detail on the range
of sustainable energy technologies
reviewed by the WWF Task Force, the
WWF Climate Solutions Model, and the
findings and conclusions that emerge
from its analysis.
Every country has a role to play in response to the scale
and the type of challenges arising in its territory.
A GLOBAL EFFORT
( c ) W W F , w w w . J
S G r o v e . c o m
4
CLIMATE SOLUTIONS: THE WWF VISION FOR 2050

8/8/2019 Climate Solution Web
http://slidepdf.com/reader/full/climate-solution-web 7/96
5
1 INTRODUCTION 6
2 WWF REVIEW OF SUSTAINABLE ENERGY SOURCES AND TECHNOLOGIES 7
3 THE WWF CLIMATE SOLUTIONS MODEL – INPUTS 10
3.1 Modelling Project Objectives 10
3.2 Defining the Challenge 10
3.2.1 Meeting Global Energy Services Needs 10
3.2.2 Avoiding Dangerous Climate Change 10
3.3 Key Features of the Model 12
3.3.1 Commercially Available Industry Forcing 123.3.2 Extending the Pacala-Socolow “Wedges” Concept 12
3.3.3 Top-down and Bottom-up 13
4 THE WWF CLIMATE SOLUTIONS MODEL – OUTPUTS 14
4.1 Managing Risk 14
4.2 Build-up of Climate Solution Wedges 14
4.3 How the Wedges Displace High-Emission Energy 16
4.4 Key Characteristics of the WWF Scenario 18
5 CONCLUSIONS 20
5.1 Six Key Solutions 20
5.1.1 Decoupling Energy Services Demand from Energy Production 20
5.1.2 Stopping Forest Loss and Degradation 20
5.1.3 Concurrent Growth of Low-Emission Technologies 20
5.1.4 Flexible Fuels, Energy Storage and Infrastructure 20
5.1.5 Replacing High-carbon Coal with Low-Carbon Natural Gas 21
5.1.6 Moving on Carbon Capture and Storage (CCS) 21
5.2 Three Imperatives 21
5.2.1 Urgency 21
5.2.2 A Global Effort 21
5.2.3 Leadership 22
6 ACKNOWLEDGEMENTS 23

8/8/2019 Climate Solution Web
http://slidepdf.com/reader/full/climate-solution-web 8/96
Introduction
Part 1-2
Averting the unfolding calamity of globalclimate change, while at the same time
ensuring stable and secure supplies of
energy services to meet the needs of a
growing global population and level of
development, especially in the relief of
poverty, is the most important challenge
our generation is likely to face. Doing
so without wreaking new havoc on
the environment (e.g., by excessive
hydro-development or by massive
conversion of tropical forests to biofuels
production) is an additional but so far
little-considered dimension.
With this in mind, WWF’s Global Energy
Task Force undertook the analysis and
modelling project described in this report.
Its aim was to determine whether it is
technically feasible, at this late date, to
meet projected global energy services
needs while avoiding a level of climate
change which would threaten catastrophic
environmental and social consequences.
The starting point for WWF’s analysis
was the strong scientific consensus that
any human-induced warming greater than
two degrees Celsius above pre-industrial
levels would have a dangerous and highly
damaging impact on both human societies
and their economies and the global
environment as a whole. The Task Force
then looked at the projected growth in
energy services needs, taking into account
population trends and development goals,
through to the year 2050. It then sought
to determine how these needs for energyservices might be met while remaining
below the two-degrees Celsius ceiling for
the average increase in global temperature
above pre-industrial levels, and without
resort to unacceptably damaging
technologies or resources.
The result, described in more precise and
technical detail in the sections that follow,
represents what we believe to be among
the very first technically and industrially
pragmatic, time-sensitive energy
scenarios, containing the threat of climatechange while meeting legitimate future
development goals.
The good news is that it appears to be still
possible to avert the worst consequences
of climate change while expanding our
energy supplies to meet the needs of both
the developed and developing world in
the 21st century. The bad news is that
the outcome is extremely sensitive to
decisions made in the next five years.
In these five years, the trajectory must be
set for the required technology, systems,
infrastructure, and resource exploitation,
sufficient to ensure that global greenhouse
gas emissions (GHG) peak and start to
decline within ten years.
What the study did not examine is the
social and economic dislocation that
would probably attend the kind of swift
energy transition needed to avert dangerous
climate change. In this respect, there is
no single, easily recommended course for
all societies, but it is important that suchimpacts are anticipated. Global warming
of greater than two degrees Celsius will
bring with it significant adverse impacts,
particularly in the poorest countries. Anabrupt global shift of the energy systems
which underpin current national economies
threatens disruptions of its own.
Nonetheless, the world is fortunate that the
technology and resources are available to
avert a dangerous disruption of the global
climate. With determination, it appears
technically and industrially possible
to convert this technical potential into
reality. However, the world is currently
on a different and dangerous trajectory.
Scientific warnings continue to mount,yet the debate continues and what passes
for vision seems to have great difficulty
seeing past the next filling station.
The pages that follow contain a blueprint
for an alternative vision – one of a world
in which human needs and economic
development are supported by a robust
mix of low-emission energy sources and
technological efficiencies, while nature
continues to thrive.
WWF’s Climate Solutions Vision is offeredin the hope that it will help to inform
decisions on energy by demonstrating the
technological potential for a cleaner, more
secure and truly sustainable energy future.
Stripped of its technicalities, the central
message here is that if we can find the will,
there is indeed a way. But it is up to us
to find it; succeed or fail, it is the central
challenge by which future generations will
judge our own.
6 © W W F - C a n o n ,
M i c h e l G U N T
H E R
INTRODUCTION & WWF REVIEW OF SUSTAINABLE ENERGY

8/8/2019 Climate Solution Web
http://slidepdf.com/reader/full/climate-solution-web 9/96
7
Climate Solutions:
The WWF Vision for 2050
The groundwork for this report began with
an extensive literature review and expert
consultation looking at 25 low- or zero-
carbon emission technologies and their
application (including efficient end-use
technologies and systems) from ecological,social, and economic perspectives. The
core list of technologies was confined
to those that are currently commercially
available; thus, the review did not consider
technologies that may yet be developed, or
attempt to take account of the potential for
dramatic advancements in the technologies
available to prevent climate change.
In this respect, the energy review
underpinning this report was deliberately
conservative: it limited the suite of
solutions considered to those available
today. Some technologies, such as carbon
capture and storage, straddle the line of
current availability – they are in limited use
today, but their potential for truly large-scale application remains uncertain. The
review then considered the potential for
each technology or application to provide
zero- or low-emission energy, compared
with a business-as-usual energy scenario
in which 14 gigatonnes (Gt) of carbon
would be emitted per year by 2050.8 This
comparison sets the scale and context for
alternative technologies to assume a major
role in displacing carbon dioxide.
Using the 14GtC/yr as a reference, the
Task Force sought and documented a range
of expert input on: the environmental
(non-climate) impacts and risks associated
with each technology; potential obstacles
to implementation; the likely socialacceptability of the technology; and relative
costs. With information on these points
compiled in a matrix, three panels
of the Task Force independently ranked
the technologies on the basis of
environmental risk, social acceptability,
and cost, each weighted equally. While
such a ranking exercise is necessarily
subjective to some degree, the results
across the three Task Force panels showed
a high degree of consistency.
WWF Review of SustainableEnergy Sources and Technologies
Figure 1. The results of a
ranking exercise, scoring
a suite of low- and zero-
carbon “technologies”
(including technical
demand reduction
measures) for their merit
against three criteria:
environmental impact/
risk, social acceptability,
and cost.

8/8/2019 Climate Solution Web
http://slidepdf.com/reader/full/climate-solution-web 10/96
8
The precise scoring of these technologieswas not considered to be critical; Figure 1
is shown for completeness and to ensure
transparency in the Task Force deliberations.
This exercise informed the selection
(depending on significance) and grouping
of certain ”technology” options into three
categories characterized, as shown in
Figure 2, by:
• Overwhelmingly positive benefits
(ef ficiency solutions dominate
this group)
• Some negative impacts, but outweighed
by the positive benefits
• Serious negative impacts, outweighing
any positive benefits
The last group of technologies, which were
identified as representing an unacceptable
balance of risk over benefit, includes:
• Nuclear power (due to its costs,
radiotoxic emissions, safety,
and proliferation impacts)
• Unsustainable biomass (e.g., energycrops grown on newly displaced
forest land)
• Unsustainable examples of large
hydroelectricity (which may flood
biodiversity hotspots and fertile lands,
force large-scale resettlement of
human communities, or seriously
disrupt river systems) 9
All of the above could cause major
disruption to human populations, as
well as to the environment.
Special mention is made here of the
decision to exclude nuclear energy and
certain kinds of biomass, as the potentials
of both have attracted much attention in
the climate change debate:
Figure 2. WWF grouping of climate solutions technologies based
on environmental, social, and economic criteria.
WWF REVIEW OF SUSTAINABLE ENERGY SOURCES AND TECHNOLOGIES
Part 2

8/8/2019 Climate Solution Web
http://slidepdf.com/reader/full/climate-solution-web 11/96
Climate Solutions:
The WWF Vision for 2050
Interest in nuclear energy has seen aresurgence as the technology increasingly
is presented by proponents as a low- or
no-carbon energy source. This study shows
that there are more than sufficient benign
technologies available, without embarking
further on nuclear power with its many
associated risks.10
Biomass, in some respects, represents
the opposite case – a technology with a
mixed track record at scale, but one that
has nonetheless won early support and
raised high expectations, including frommany in the environmental community.
The Task Force considered the high risk of
large-scale biomass plantations creating
unacceptable environmental impacts,
especially when grown in areas recently
converted from tropical forest. Accordingly,
it concluded that biomass ought not to be
considered as a single category, and that
separate designations for “sustainable” and
“unsustainable” biomass were needed. The
Task Force commissioned specific research
to assess the possible range of contributionsthat could be made from sustainable
biomass at a global level. Still, a significant
shift to biomass as an energy source will
surely place new demands on wild habitats,
and may adversely impact the world’s poor by driving an increase in food prices.
Both these potentials sound a clear note of
caution and warrant further attention and
ongoing management.
Nonetheless, current levels of biomass,
nuclear, and large hydro were included in
the model, to reflect existing realities such
as plants in existence or under construction,
along with additional capacity only as
far as judged to be sustainable (none for
nuclear) according to WWF’s own criteria
(see topic papers).
WWF recognizes that there are currently
new nuclear plants being commissioned
and that others are being decommissioned.
The scenario assumes that all existing
nuclear plants built or under construction
will be run to the end of their economic
life, but will not be replaced. This
effectively would result in a phase-out
of nuclear power by 2050.
Its aim was to determine whether it is technically feasible, at this late date,
to meet projected global energy services needs while avoiding a level of
climate change which would threaten catastrophic environmental and
social consequences.
THE GLOBAL TASK FORCE
9 © W W F - C a n o n ,
C h r i s M a r t i n
B A H R
8/8/2019 Climate Solution Web
http://slidepdf.com/reader/full/climate-solution-web 12/96
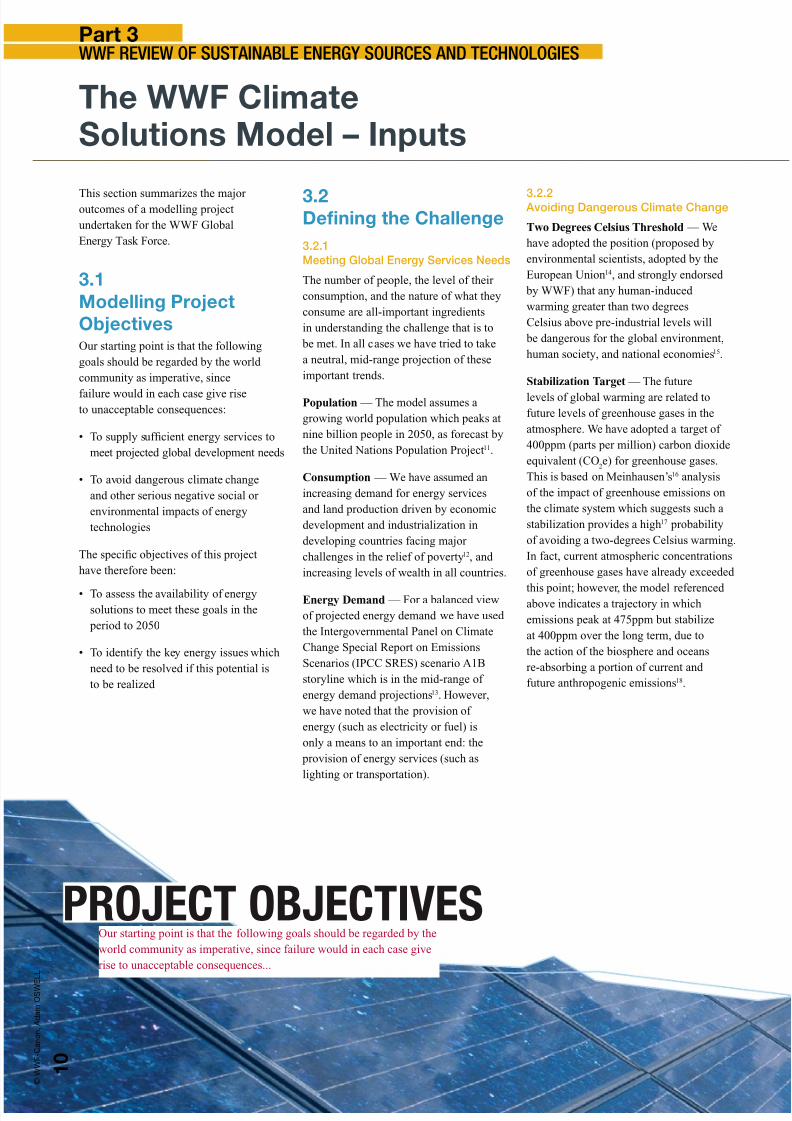
This section summarizes the major outcomes of a modelling project
undertaken for the WWF Global
Energy Task Force.
3.1
Modelling Project
ObjectivesOur starting point is that the following
goals should be regarded by the world
community as imperative, since
failure would in each case give riseto unacceptable consequences:
• To supply sufficient energy services to
meet projected global development needs
• To avoid dangerous climate change
and other serious negative social or
environmental impacts of energy
technologies
The specific objectives of this project
have therefore been:
• To assess the availability of energysolutions to meet these goals in the
period to 2050
• To identify the key energy issues which
need to be resolved if this potential is
to be realized
3.2Defining the Challenge
3.2.1
Meeting Global Energy Services Needs
The number of people, the level of their
consumption, and the nature of what they
consume are all-important ingredients
in understanding the challenge that is to
be met. In all cases we have tried to take
a neutral, mid-range projection of these
important trends.
Population — The model assumes a
growing world population which peaks at
nine billion people in 2050, as forecast by
the United Nations Population Project11.
Consumption — We have assumed an
increasing demand for energy services
and land production driven by economic
development and industrialization in
developing countries facing major
challenges in the relief of poverty12, and
increasing levels of wealth in all countries.
Energy Demand — For a balanced view
of projected energy demand we have used
the Intergovernmental Panel on Climate
Change Special Report on Emissions
Scenarios (IPCC SRES) scenario A1B
storyline which is in the mid-range of
energy demand projections13. However,
we have noted that the provision of
energy (such as electricity or fuel) is
only a means to an important end: the
provision of energy services (such as
lighting or transportation).
3.2.2 Avoiding Dangerous Climate Change
Two Degrees Celsius Threshold — We
have adopted the position (proposed by
environmental scientists, adopted by the
European Union14, and strongly endorsed
by WWF) that any human-induced
warming greater than two degrees
Celsius above pre-industrial levels will
be dangerous for the global environment,
human society, and national economies15.
Stabilization Target — The future
levels of global warming are related tofuture levels of greenhouse gases in the
atmosphere. We have adopted a target of
400ppm (parts per million) carbon dioxide
equivalent (CO2e) for greenhouse gases.
This is based on Meinhausen’s16 analysis
of the impact of greenhouse emissions on
the climate system which suggests such a
stabilization provides a high17 probability
of avoiding a two-degrees Celsius warming.
In fact, current atmospheric concentrations
of greenhouse gases have already exceeded
this point; however, the model referencedabove indicates a trajectory in which
emissions peak at 475ppm but stabilize
at 400ppm over the long term, due to
the action of the biosphere and oceans
re-absorbing a portion of current and
future anthropogenic emissions18.
The WWF ClimateSolutions Model – Inputs
1 0
Our starting point is that the following goals should be regarded by the
world community as imperative, since failure would in each case give
rise to unacceptable consequences...
PROJECT OBJECTIVES
© W W F - C a n o n ,
A d a m O S W E
L L
WWF REVIEW OF SUSTAINABLE ENERGY SOURCES AND TECHNOLOGIES
Part 3

8/8/2019 Climate Solution Web
http://slidepdf.com/reader/full/climate-solution-web 13/96
Climate Solutions:
The WWF Vision for 2050
Carbon Budget — There is an emergingconsensus regarding the level of global
emissions reductions required – typically
60% below current levels by 2050 – in
order to avoid dangerous climate change.
However, it is the total cumulative
emissions that are important in this respect,
so we have adopted the concept of a global
“carbon budget” – the total amount of
carbon that can be released from human
activity (allowing for natural levels of
emission and sequestration) before a
particular concentration level is breached.
Land-Use Emissions — Allowance must
also be made for the uncertain contribution
of emissions from land uses (of which
tropical deforestation will be particularly
important, being responsible for a fifth of
all greenhouse gas emissions). We have
therefore described a “carbon budget”
range representing the upper and lower
allowances of anthropogenic carbon
budget, depending on the success or failure
of activities to limit emissions in these
land-use sectors19
.
Carbon Budget Range — Meinhausen’s
modelling indicates that to achieve an
atmospheric stabilization target of 400ppm
CO2e requires that emissions be limited
to a fossil carbon budget of “about
500GtC” (gigatonnes of carbon). We
have adopted this as the upper limit of
allowable emissions. However, this assumes
a significant cut in land-use emissions, in
the absence of which Meinhausen points
out that the carbon budget “could be
lower (400 GtC)”. This has therefore beenadopted as the alternative upper limit of
allowable emissions.
Carbon Band — Clearly, such a budgetwill be spent (emitted) over the course of
many years (the model builds the carbon
budget over a period of 200 years). The
model assumes the way in which the
budget might be spent as an indicative
band, as shown in Figure 3, consistent with
the upper and lower allowances of the total
carbon budget. The smooth curves of this
band reflect the inertia in the current energy
system which resists sudden change.
Other Greenhouse Gases — We assume
here that reductions of carbon dioxidewill see other greenhouse gases reduced
in equal proportions, provided they are
recognized and included in the same
regulatory frameworks. So, the model
works with carbon dioxide emissions only
and does not include other greenhouse
gases. However, the carbon dioxide from
fossil fuel and deforestation accounts
for the majority of all greenhouse gas
emissions (62% and 18% respectively20 ).
By cutting emissions from these sources,many other GHG emissions (notably
methane and nitrous oxide) will be reduced
in addition to carbon dioxide. A world that
seriously undertakes to reduce the carbon
intensity of its energy sources to combat
climate change is also likely to cut its non-
energy carbon dioxide and other greenhouse
gases by employing more innovative
agricultural and industrial policies.
Persistent Use of Fossil Fuel Without
Carbon Capture — The use of carbon
capture technology will enable low-
emission use of fossil fuels in major
applications (see later). The model also
allows for an estimate of ongoing fossil-
fuel use in a few applications where
alternative fuels are not available and/or
where carbon capture technology has not
been successfully applied. These include a
proportion of aviation fuel demand not met
by biofuels, and some aspects of industrial
manufacturing and other niche applications
or locations21.
Figure 3. An indicative ”carbon band”, showing the
difference in the upper limits of annual allowable
carbon emissions, from fossil fuels, in GtC per year,
for total carbon budgets of 400GtC and 500GtC taken
out to 2200 (showing the period to 2050 only). The
thickness of the band therefore shows the crucial
extra flexibility available in anthropogenic emissions
if deforestation is successfully controlled.
11

8/8/2019 Climate Solution Web
http://slidepdf.com/reader/full/climate-solution-web 14/96
1 2
3.3Key Features
of the Model
3.3.1
Commercially Available
Industry Forcing
The WWF Climate Solutions Model is
primarily a resource, technology, and
industry feasibility model. It is not an
economic model; price and cost have not
been used to limit or guide the uptake of
technologies. No assumptions or inferenceshave been made regarding the policies and
measures required to achieve the outcomes.
However, to ensure that the modelled
scenarios are economically plausible and
affordable, only energy sources and climate
solutions which are currently competitive –
or likely to be in the near term – have been
selected. In some cases distributed energy
technologies priced at point of use (such as
solar photovoltaic panels or combined heat
and power) have specific cost advantages
which the model recognizes. In the caseof hydrogen manufactured via renewable
energy sources, it is assumed that the added
value of storage and creation of flexible,
transportable fuels and fuels for high-
temperature industrial processes will justify
the additional costs.
Although commercial viability has been
assumed, this may not be achievable by
means of single instruments such as a
carbon price alone. However, the level
of commercial and public investment
needed to drive industrial production andinfrastructure development at the scale
required will depend on long-term, stable
commitments from governments on
the pace and depth of greenhouse gas
emission constraints.
Lack of economic plausibility is oftenused to criticize models that include the
use of low emissions, higher cost
technologies. However, the conclusions
of the Stern Review – which was primarily
economic – projected that the costs of
global warming would severely impact
global GDP if left unchecked.
3.3.2
Extending the Pacala-Socolow
“Wedges” Concept 22
A considerable amount of modellinghas been undertaken in the fields of both
climate change and energy. Many models
are constructed in ways that let scenarios
evolve based on costs, such as the price of
oil or the cost of carbon. WWF’s Climate
Solutions Model takes a different approach,
focusing on the technology and resource
potential of averting dangerous climate
change, leaving the political and economic
systems to respond to this necessity, rather
than the other way round.
A “wedges” model, developed by Pacalaand Socolow23, is widely viewed as
an elegant approach and provides an
excellent starting point. It divides the task
of emissions stabilization over 50 years
into a set of seven “wedges” (delivered
by emissions-avoiding technologies)
each of which grows, from a very small
contribution today, to a point where it is
avoiding the emission of 1GtC per year by
2050. Its authors point out that many more
of these “wedges” are technically available
than are required for the task of stabilizingglobal emissions at today’s levels by 2050.
The WWF Climate Solutions Model builds
on the Pacala-Socolow “wedges” model
by adapting it to go beyond stabilization,
to achieve by 2050 the significant
reductions in global emissions which the
current scientific consensus indicates are
needed to avert dangerous climate change.
The WWF model:1 Extends the penetration of
climate-saving technologies so as
to achieve abatement consistent with
a more stringent carbon budget.
2 Draws on a diversity of expert opinion
on the potential size and scale of solution
wedges (from published analysis,
internal research, and commissioned
research from specialist consultants)
as inputs to the model.
3 Employs a probabilistic approach withthese inputs (using the “Monte Carlo”
method24 ) so that the results can be
considered as probabilities of achieving
certain outcomes or risks of failure.
4 Models real world industrial growth
behaviour by assuming: that the growth
of any technology will follow a typical
S-shaped trajectory; that constraints
impose a maximum on the rate of
sustainable growth; and that the ultimate
scale depends on estimated resources
and other specific constraints.
5 Seeks to minimize the replacement
of any stock or system before the end
of its physical or economic life.
6 Allows some solutions to play an interim
role by being phased in then phased out
as better solutions become available.
7 Excludes energy-technological
options deemed by WWF to be
inherently unsustainable.
8 Includes a contingency which allows
for the possibility that some solutions
may encounter significant barriers to
development and therefore fail to meet
the projections set out in the model.
WWF REVIEW OF SUSTAINABLE ENERGY SOURCES AND TECHNOLOGIES
Part 3

8/8/2019 Climate Solution Web
http://slidepdf.com/reader/full/climate-solution-web 15/96
13
Climate Solutions:
The WWF Vision for 2050
Considerable analysis and modelling detailsupports each of these steps and further
explanation is available in a supporting
technical document25.
3.3.3
Top-Down and Bottom-Up
The model combines top-down and
bottom-up aspects to capture the best of
both ends of the debate about how best to
approach future emission cuts – the global
requirement for energy and abatement
opportunities (“top down”) and the widerange of options for meeting these needs
sustainably (“bottom up”).
The top-down aspect of the model is based
on the IPCC’s A1B scenario for energy
and emissions, which is consistent with
Section 3.3.1 above. However, top-down
approaches can introduce perversities such
as inflated baselines creating an illusion of
greater emissions reduction potential26.
The bottom-up aspect of the model builds
a set of “climate solution wedges” to meet
the projected energy services demand,sector by sector. This requires some
assumptions about the level and type of
consumption, what proportion of energy
is used on transport, or in homes or in
industry, and so forth.
It has been assumed that in 2050
consumption patterns throughout the world
will be similar to those of citizens with
developed standards of living today – for
example in the OECD. This information
is used to ensure that the climate solution
wedges are internally consistent and avoid
the “double counting” of overlappingabatement opportunities27. By considering,
in each sector, the total energy services
needed for that sector and then the role
of possible climate solutions, the climate
solution wedges maintain to the best
extent possible their connection with
the real world.
To contrast the two different approaches:
the climate solution wedges can be built
from the bottom up to consider the total
energy provided in response to the needs
of each sector. Or, in the top-downapproach used by Pacala and Socolow,
each can be seen as a wedge of low- or
zero-carbon energy, subtracted from
the A1B projection, and displacing
conventional fossil-fuel supplies which
would otherwise have been used to meet
energy needs.
No preference order of solution wedges
is implied and if the combined block of
potential solution wedges exceeds the
estimated energy demand in a given year,
the extent of this excess is effectively a
contingency/safety margin against failure
of individual wedges, underestimation of
demand, or future requirements for deeper
cuts than currently estimated.
Stopping and reversing loss and degradation of forests, particularly in the tropics,
is a crucial element of any positive climate-energy scenario.
A CRUCIAL ELEMENT
© W W F , K L E I N & H U B E R T

8/8/2019 Climate Solution Web
http://slidepdf.com/reader/full/climate-solution-web 16/96
1 4
The WWF ClimateSolutions Model – Outputs
The WWF Climate Solutions Model has been run to look at a variety of scenarios
within the boundaries of the chosen
modelling methodology, and the scenario
presented here considers what is required
to ensure that the goals defined by the
WWF Global Energy Task Force
energy development needs, climate
protection, and avoidance of social and
environmental impacts are met within a
safety margin consistent with appropriate
risk management.
Importantly, this scenario (see Figures 4and 5) describes a future in which, due to
the long lead times for deploying low-
emission technology, global fossil-fuel
carbon emissions continue to rise for the
next decade. The scenario shows that, in
order to remain within the total carbon
budget, decisive action is needed withinfive years to speed up the growth of all
clean-energy industries. A transition on this
scale is needed to avert dangerous warming,
and under the model it appears technically
and industrially feasible. However,
successful delivery will depend on
sufficient political will, globally organized,
to drive change through a suitable economic
and regulatory framework.
4.1
Managing RiskThe scenario has been constructed with
the following requirements:
• Meets the anticipated demand
in energy services, with at least
a 10% contingency surplus
• Achieves the objective of avoidinga two degrees Celsius warming by
achieving a 400ppm CO2e stabilization
• Is not unduly dependent on any single
energy resource or technology type
• Can be achieved without resort to
unsustainable technologies
4.2
Build-up of Climate
Solution WedgesThis scenario (see Figure 4) indicates that a
combination of efficiency gains, renewable
energy sources and CCS can meet
projected energy needs in 2050.
Figure 4. A representative scenario of the Climate Solutions Model depicting technology wedges capable of averting dangerous
climate change. Each climate solution wedge grows over time and the sum of all wedges becomes significant as industrial capacityand deployment increase in scale. The top yellow line refers to the energy demand projection in the SRES A1B scenario. Note that
since energy-efficiency technologies are shown alongside energy supply from low-emission sources, the results are expressed in
final energy supplied or avoided (rather than primary energy production).
THE WWF CLIMATE SOLUTIONS MODEL – OUTPUTS
Part 4
8/8/2019 Climate Solution Web
http://slidepdf.com/reader/full/climate-solution-web 17/96
Climate Solutions:
The WWF Vision for 2050
Notes1 Renewables: Today, only traditional
biomass and large hydro are providers
of globally significant quantities
of renewable energy, though the
international growth of others such
as wind and solar continues to be
exponential and greater than any other
energy technologies.
2 Time Lag: The energy-efficiency
measures in this simulation have an
effect quite early on, making a noticeable
impact from 2015 onward. Renewables
meaningfully impact a little later and
carbon capture and storage (CCS) only
starts to penetrate the emissions profile
in the period 2020 to 2030. Meanwhile,
gas (without CCS) is used heavily in the
period 2010 to 2040 to displace the use
of coal.
3 Energy for Thermal Processes: There
will be a critical constraint on the
availability of fuels for industrial thermal
processes which can be satisfied onlywith low-emission levels by hydrogen,
biomass, or fossil fuels with CCS.
4 Residual Emissions: If there are
no significant failures in the climate
solutions available, the only remaining
carbon emissions from fossil fuels
after about 2040 are those from
higher-efficiency aviation (see below)
and shipping sectors, a small fraction of
non-CCS natural gas and residual
emissions from a growing share of
CCS-based fossil-fuel use. The modeldoes not include non-energy carbon
dioxide (process) emissions, or
non-carbon dioxide emissions fromother human uses such as agriculture
or fluorinated greenhouse gases
(F-gases). These are assumed to reduce
in rough proportion with carbon dioxide
emissions provided that such gases are
identified and included in the same
regulatory frameworks. However,
assuming the contingency is called upon,
then the phase out of conventional fossil-
fuel use will be delayed by about ten
years to 2040 (see Figure 5).
5 Post 2030: Most energy consumption post-2030 is derived from various
sources of renewable energies, notably
wind, sustainable biomass, geothermal,
and various systems for harnessing
solar radiation.
6 Hydrogen from Renewables: There
are many sources of renewable energy
that can supply substantially more
energy than the power grids are able
to absorb, and harnessing this energy
therefore requires storage in another
form. Hydrogen is an example of one
such energy carrier. The importance of
hydrogen generated from a non-specified
but wide variety of renewable sources
(such as large solar thermal installations,
wind energy, and similar large
resources otherwise constrained by grid
limitations) grows rapidly from 2030.
This provides more flexibility for the
application and time of use for zero- and
low-carbon energy sources, especially
if they are intermittent. It also allows a
chemical energy form for thermal andtransport applications.
7 Aviation: There is currently veryhigh growth in the levels of aviation
and therefore the annual emissions of
greenhouse gases from air travel. In part
this trend reflects the lower levels
of taxation applied to aviation fuels and
their current exclusion from the Kyoto
Protocol. In modelling aviation we have
looked at several possible solutions
for ensuring that aviation levels can be
managed within the carbon budget. The
model includes the following provisions:
a) An ongoing increase in the efficiencyof aircraft.
b) An increase in the operating efficiency of
aircraft by maximizing occupancy levels
on all flights.
c) Displacing the use of mineral (fossil
fuel) kerosene with direct replacements
derived from biofuels.
d) Avoiding aircraft use where possible
through use of alternatives such as high
bandwidth teleconferencing, high-speedtrains for short distance travel, and other
interventions to avoid the need for or
uptake of short duration air travel.
Unlike land-based transport, electrical
storage of energy or hydrogen is not yet,
and may never be, applicable to air travel.
This means that aviation fuels may need to
be a priority for biofuel use or there may
be a need to factor in residual use of fossil
fuels for aviation. The model includes a
provision for continued use of some fossil
fuels for persistent applications, such assome component of aviation fuels.
15 © d a r r e n j e w

8/8/2019 Climate Solution Web
http://slidepdf.com/reader/full/climate-solution-web 18/96
4.3How the Wedges
Displace High-
Emission Energy
Figure 5 shows how the mix of energy
wedges performs relative to the energy that
is forecast to be required from the A1B
reference scenario.
In broad terms the scenario shows anenergy world dominated by the demand
for more energy services over the full
period to 2050.
With the seeds of energy solutions sown
in the period to 2012, the effects on the
energy mix start to become tangible, first
with a deliberate expansion of energy
efficiency (industry, buildings, and in all
forms of transport). The overall effect
is to cause final energy consumption to
plateau from 2020 onwards, while finalenergy services demand actually increases
throughout this period.
Despite starting from a smaller base, the
growth of renewable energy becomes
significant in the period to 2020. In
addition, an increase in use of gas is
postulated to avoid new coal uptake
– creating a “gas bubble” which extends
from 2010 to 2040.
Figure 5. Output of the WWF Climate Solutions Model. Energy efficiency and demand reduction measures
(drawing down from the top, in yellow) largely stabilize energy demand by about 2020, allowing a rising demand
for the provision of energy services to be met from a more or less level supply of energy (notwithstanding
regional variations). Meanwhile zero- and low-emission energy sources are built up (from the bottom, in blue)
until about 2040 when, assuming none fail significantly, fossil-fuel use (in brown) is reduced to a ”persistent”
residual level of 20EJ for applications which are hard to replace. Nuclear energy use (in red) is phased out. It
may of course be that some wedges under-perform or fail entirely. The scenario provides spare capacity as a
contingency, represented by energy supply shown reaching below the x-axis.
1 6
THE WWF CLIMATE SOLUTIONS MODEL – OUTPUTS
Part 4

8/8/2019 Climate Solution Web
http://slidepdf.com/reader/full/climate-solution-web 19/96
17
Climate Solutions:
The WWF Vision for 2050
As renewable electricity production becomes constrained by about 2040,
the growth of hydrogen production and
distribution allows renewable energy to be
both stored and used for end-uses such as
transport fuels and domestic and industrial
thermal processes.
Most of the remaining phase-out of
emissions from conventional fossil fuels is
achieved by expansion of carbon capture
and storage – on both gas and other
fossil fuels still used for power andindustrial processes.
The scenario is resilient to the under-
performance of one or more wedges with
a 15% contingency; this would even allow
for a total failure of fossil fuel CCS.
This scenario shows that it is
technologically possible to exceed the
projected demand for energy (as moderated
by energy-efficiency measures) using the
mix of wedges which have been developedwith the industrial criteria set out for the
model and based on published resource
and performance data. Of course, this
takes a unified global approach. Some
regional perspectives are explored in the
background topic papers28.
The overall effect of this scenario on
emissions is shown in Figure 6.
Figure 6. Emissions in the WWF Climate Solutions Model. The diagram shows the range of emissions (red bands) in the
scenario presented in this paper. The lower limit of the red band shows the technical potential of emissions reduction if all
wedges are fully implemented, and the whole “fossil fuel with CCS” wedge (yellow in Figure 4) comprises plants burning gas
(which has lower carbon intensity). Emissions follow the upper limit line if about 80% of the potential is achieved and the
“fossil fuel with CCS” wedge is made up of (higher carbon intensity) coal plants. Placed against the nominal carbon budget
curve (brown), it is clear that the overall emissions to 2050 of the lower trajectory fall within the total emissions indicated
by the upper limit of the budget range (assuming that deforestation is successfully brought under control). Any failure of
efforts to halt deforestation (reducing the budget available for energy emissions to the lower limit of the brown band) will
reduce the chances of staying within the overall emissions budget, especially if failures or delays in the implementation of
solution wedges drive the emissions curve towards the upper limit of the red band. These curves are set against a backdrop
(green) of the emissions that would occur if the IPCC’s A1B energy scenario were supplied with the current fossil-fuel mix
(i.e., at about 0.02GtC/EJ). Also shown is the projected emissions curve for the A1B reference scenario which reaches annual
emissions of 16GtC in 2050. The results of the modelling show that, although the point at which global emissions start to
decline may not occur until 2015-2020, there is potential to drive deep cuts quickly once the industrial momentum behind
transition is underway.

8/8/2019 Climate Solution Web
http://slidepdf.com/reader/full/climate-solution-web 20/96
1 8
THE GOOD & THE BAD
© W W F - C a n o n ,
M a u r i R A U T K
A R I
The good news is that it appears to be still possible to avert the worst consequences of climate change while
expanding our energy supplies to meet the needs of both the developed and developing world in the 21st century.
The bad news is that the outcome is extremely sensitive to decisions made in the next five years.
8/8/2019 Climate Solution Web
http://slidepdf.com/reader/full/climate-solution-web 21/96
19
Climate Solutions:
The WWF Vision for 2050
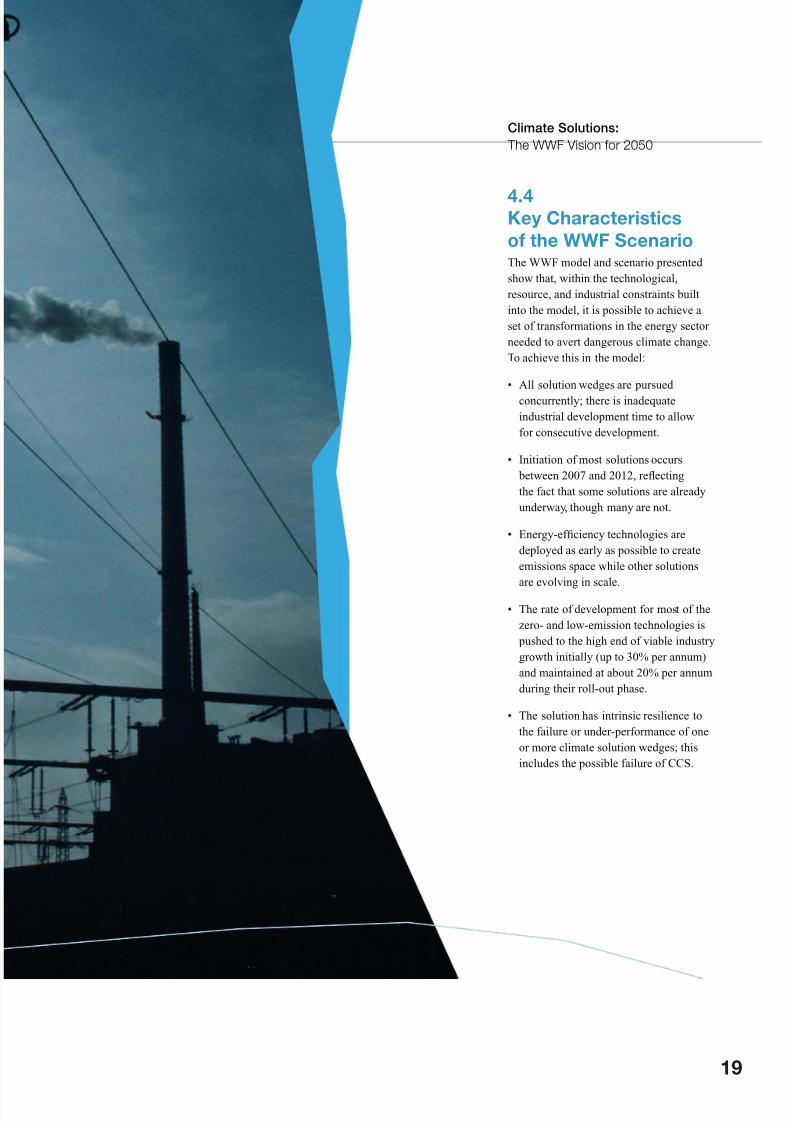
4.4Key Characteristics
of the WWF ScenarioThe WWF model and scenario presented
show that, within the technological,
resource, and industrial constraints built
into the model, it is possible to achieve a
set of transformations in the energy sector
needed to avert dangerous climate change.
To achieve this in the model:
• All solution wedges are pursued
concurrently; there is inadequate
industrial development time to allow
for consecutive development.
• Initiation of most solutions occurs
between 2007 and 2012, reflecting
the fact that some solutions are already
underway, though many are not.
• Energy-efficiency technologies are
deployed as early as possible to create
emissions space while other solutions
are evolving in scale.
• The rate of development for most of the
zero- and low-emission technologies is
pushed to the high end of viable industry
growth initially (up to 30% per annum)
and maintained at about 20% per annum
during their roll-out phase.
• The solution has intrinsic resilience to
the failure or under-performance of one
or more climate solution wedges; this
includes the possible failure of CCS.

8/8/2019 Climate Solution Web
http://slidepdf.com/reader/full/climate-solution-web 22/96
5.1Six Key SolutionsIf implemented in parallel, the WWF
model shows that the following solutions
provide a way to achieve the goal of
averting dangerous climate change while
avoiding other serious environmental
and social consequences. Topic papers
(annexed)29 include further information
on these technologies and WWF’s
definition of “sustainable” for each.
5.1.1
Decoupling Energy Services
Demand from Energy Production
Investment in energy efficiency, at all
levels from generation to actual use, is
by far the most immediate, effective,
and economically beneficial way to
reduce emissions, to “buy time” while
other technologies are developed30,
and to decouple rising demand for
energy services from actual energy
production. The model indicates that by
2020-2025 energy efficiencies will makeit possible to meet increasing demand
for energy services within a stable net
demand for primary energy production.
The priority for developed countries is
to retrofit their inefficient capital stock
with energy-efficiency measures, and
to enable developing countries to leap-
frog by investing in much more efficient
technologies and systems from the start.
By 2050, the WWF scenario shows the
potential for the equivalent of 200EJ31
per year to be avoided through industrial
energy efficiency, plus a similar amount
from building efficiency and from acombination of reduced vehicle use
and higher-efficiency engines. In total,
efficiencies can reduce the projected
demand by 468EJ, or 39% annually
– equivalent to avoiding emissions
of 9.4GtC/yr – by 205032.
5.1.2
Stopping Forest Loss
and Degradation
Stopping and reversing deforestation
and degradation of forest land (e.g., for
charcoal or grazing lands)33 , particularly
in tropical countries, emerges as an
absolutely crucial element of this
scenario34. Priority must be placed on
reducing emissions rather than on pursuing
sequestration. NB: This does not preclude
continued sustainable use of forests.
The scenario underscores the need for
efforts to curb emissions from land-use
change and forestry, contributing a total
saving of 100-150GtC towards achieving
the overall carbon budget. Without thiscontribution, the probability of success
is radically reduced.
5.1.3
Concurrent Growth of Low-emission
Energy Technologies
The model assessed the potential for
a variety of low-emission technologies
such as wind35, hydro36, bioenergy37,
geothermal, solar PV, wave and tidal, and
solar thermal. A rapid scaling-up of these
technologies is needed, but within a setof environmental and social constraints
to ensure their sustainability. In the next
50 years, expansion of sustainable wind,
hydro, and bioenergy will be particularly
important. Bioenergy for heat and transportholds vast potential but could go terribly
wrong if implemented unsustainably –
e.g., by clearing biodiverse habitats to plant
energy crops. Large hydro dams need also
to be deployed with restraint.
By 2050, the scenario includes the
equivalent range of 110-250EJ per year
from sustainable biomass, with a best
estimate at 180EJ/yr. Together, this and
other low-emission technologies can
provide 513EJ energy per year
by 2050, or about 70% of the supply
after efficiencies have been applied,
and equivalent to avoiding emissions
of 10.2GtC/yr 31.
5.1.4
Flexible Fuels, Energy
Storage and Infrastructure
The model shows that the deep cuts
in fossil fuel use cannot be achieved
without the large volumes of energy
from intermittent sources being harnessed
through energy storage for better alignmentwith the timing of demand and for
transformation into energy forms needed for
transport and high-temperature (chemical)
heat. Use of fossil fuels with CCS will
also create large volumes of hydrogen gas.
Therefore, the results imply a requirement
for: (a) major new infrastructure for the
production, storage, transportation and use
of hydrogen gas; and (b) development of
modular, distributed grid-connected power
storage infrastructure.
Conclusions
2 0
© W W F - C a n o n ,
H a r t m u t J U N
G I U S
CONCLUSIONS
Part 5

8/8/2019 Climate Solution Web
http://slidepdf.com/reader/full/climate-solution-web 23/96
Climate Solutions:
The WWF Vision for 2050
5.1.5Replacing High-Carbon Coal
with Low-Carbon Natural Gas
In the short term, an increase in the use of
natural gas38 as a “transition fuel” can play
a significant part in avoiding the locking
in of higher emissions from coal, thereby
buying more development time for other
energy solutions to grow. While this is
more applicable in some countries than
others, gas should be scaled up in the short
term (where it can avoid coal use), without
bringing about harmful biodiversity
impacts. The even lower carbon emissions
for gas used with carbon capture and
storage technology are also taken into
account. WWF therefore sees natural
gas as a bridging fuel with important
applications, provided that energy security
issues can be resolved.
The scenario includes a provision of
natural gas displacing coal which peaks
in supply at about 52EJ in 2023. It is
assumed that this can then become
sequestered within the CCS wedgeas technology comes on line.
5.1.6
Moving on Carbon Capture
and Storage (CCS)
The WWF model shows the importance
of CCS39 if fossil fuels are to have an
ongoing role within a carbon-constrained
energy sector. Clearly, while zero- and
low-emission technologies are being
brought to maturity and widely deployed,
coal, oil, and gas will continue to play
a part in the energy supply mix in the
medium term, for reasons explored
elsewhere in this report and in the topic
papers annexed. The model shows that,
in order to stay within the carbon emissions budget, it is essential that fossil-fuel plants
are equipped with carbon capture and
storage technology as soon as possible
– all by 2050. This requirement has major
and immediate implications for the design,
planning, and location of new plants, since
transport of carbon dioxide to distant
storage sites would be very costly.
Overall, fossil fuels with CCS
could account for 26% of supply
(after efficiency wedges have been
implemented) in 2050, avoiding
emissions of 3.8GtC/yr31.
However, while very important CCS is at
best only a partial contributor. The model
shows that, since CCS doesn’t capture all
emissions, the proportion of fossil fuels in
the supply mix will have to be reduced to
15-30% by 2050 (the low figure for coal,
higher for gas). These points emphasize the
urgency of major investment in zero – or
low-carbon technologies in order to stay
within the carbon budget.
Also, continued exploitation of fossil
fuels, even on a declining scale globally,
will inevitably involve the opening of
new reserves as old sources are worked
out. New developments should be
exposed to rigorous conditions to protect
environmental and social values.
A range of potential capture efficiencies
are included in the probabilistic model.
The level of CCS which can be used is
sensitive to this capture efficiency and
the fuel that is used – its contribution is
maximized with gas.
5.2Three ImperativesThe following factors emerge as of
particular importance in securing a
successful outcome to this challenge:
5.2.1
Urgency
The remedies for climate change have
been discussed at length without sufficient
decisive action. Meanwhile, carbon-
intensive technologies are rapidly usingup the available carbon budget, reducing
options and placing the future in jeopardy.
Within five years, measures must be in
place to drive the urgent development and
deployment of benign energy technologies
described in this vision. Delays make the
transition increasingly difficult and costly,
and the risks of failure greater.
5.2.2
A Global Effort
The challenge identified here, of meeting
the world’s energy needs safely and
sustainably, patently requires a global effort
in which every country has a role to play.
If the worst threats of climate change
are to be avoided, all countries must
shoulder the challenge identified here,
though each has different circumstances,
responsibilities, and priorities, as illustrated
by the accompanying examples of Japan,
USA, South Africa, Russia, India, EU,
China and Brazil40.
21

8/8/2019 Climate Solution Web
http://slidepdf.com/reader/full/climate-solution-web 24/96
Figure 7. The supply mix. A snapshot of the contribution
of each of the ”Climate Solution Wedges” in 2050,
first in Exajoules and then as a percentage of energy
supplied or avoided, compared with the energy demand
projection in the IPCC’s SRES A1B scenario. Efficiencies
reduce that demand by about 40%; of the remaining
demand, about 70% can be met by low-carbon
technologies, and about 26% by fossil fuels operating
with carbon capture and storage. Nuclear, conventional
fossil-fuel use without carbon capture, and other small
sources make up the last 4%.
5.2.3Leadership
Action is needed by governments of the
world to agree targets, to collaborate on
effective strategies, and to influence and
coordinate the investment of many trillions
of dollars (which in any event will be
invested in energy in the coming decades),
so that future needs are met safely and
sustainably, as proposed here.
© W W F , w w w . J
S G r o v e . c o m
2 2
CONCLUSIONS & ACKNOWLEDGEMENTS
Part 5-6

8/8/2019 Climate Solution Web
http://slidepdf.com/reader/full/climate-solution-web 25/96
23
Climate Solutions:
The WWF Vision for 2050
AcknowledgementsThis Task Force has had the benefit of
contributions from many inside and outside
the WWF Network, including:
James Leape, Director General,
WWF International
Members of WWF Global Energy
Task Force 2005-2007
Robert Napier, CEO, WWF-UK
(Task Force Chair)
Greg Bourne, CEO, WWF-Australia
Octavio Castelo Branco, Board Member,
WWF-Brazil
Dongmei Chen, Head of Climate and
Energy, WWF China
Dr Igor Chestin, CEO, WWF-Russia
Jamshyd Godrej, President, WWF-India
Denise Hamu, CEO, WWF-Brazil
Barbera van der Hoek, WWF-Netherland
Jennifer Morgan, Director,
WWF International Climate Change
Programme (to Sept 06)
Richard Mott, Vice President, WWF-US
Mike Russill, CEO, WWF-Canada
Dr Stephan Singer, Head, European
Climate & Energy Policy, WWF European
Policy Office
Paul Steele, COO, WWF International
Lory Tan, CEO, WWF-Philippines
Thomas Vellacott, Conservation Director,
WWF-Switzerland
Principal Authors of
WWF Climate Solutions Vision
Greg Bourne, CEO, WWF-Australia
Dr Karl Mallon, Director, Transition
Institute, Australia
Richard Mott, Vice President, WWF-US
Authors of Topic Papers
Yurika Ayukawa & Yamagishi Naoyuki
(Japan); Dongmei Chen (China);
Dr Igor Chestin & Alexei Kokorin (Russia);
Jean-Philippe Denruyter (Bioenergy);
Mariangiola Fabbri (Energy Efficiency);
Gary Kendall & Paul Gamblin (Gas);
Karl Mallon (Design and Summary of
Input Data); Jennifer Morgan (The 2
o
CImperative); Richard Mott (Nuclear;
United States of America); Simon Pepper
(Energy and Poverty); Jamie Pittock
(Hydroelectricity); Duncan Pollard
(Deforestation); Dr Hari Sharan, Prakash
Rao, Shruti Shukla & Sejal Worah (India);
Dr Stephan Singer (Wind Energy; Carbon
Capture and Storage (CCS; European
Union); Giulio Volpi & Karen Suassuna
(Brazil); Dr Harald Winkler (South Africa).
External Advisers
Rhuari Bennett, Director, 3KQ, UK;
Dr Karl Mallon, Director, Transition
Institute, Australia; Dr Felix Matthes,
Öko Institute, Berlin; V Raghuraman,
Adviser, Confederation of Indian Industry;
Philip Riddell, Environmental Adviser,
France (Bioenergy Potentials); Liam
Salter, former WWF Asia-Pacific Climate
and Energy Director; Dr Hari Sharan,
Chairman, Dasag, Switzerland (for
India); Professor Rob Socolow, Princeton
University, USA; Carlos Tanida, Fundacion
Vide Silvestre, Argentina; Dr Harald Winkler,
Cape Town University, South Africa;
Prof Zhou Dadi, Director, Energy Research
Institute, China.
External Peer Reviewers
Prof José Goldemberg, Secretario
de Estado, Secretaria do Meio Ambiente,
Brazil; Prof Jorgen Randers,
WWF-Norway; Hugh Sadler, Energy
Strategies, Australia; Prof Rob Socolow,
Princeton University.
Contributors of Material and Comments
Jamie Pittock, Paul Toni (WWF-Australia);
Markus Niedermair (WWF-Austria);
Sam van den Plas (WWF-Belgium);
Leonardo Lacerda, Karen Suassuna,
André de Meira Penna Neiva Tavares,
Giulio Volpi (WWF-Brazil); Arlin Hackman,
Julia Langer (WWF-Canada);
Dermot O’Gorman, Liming Qiao(WWF-China); Jean-Philippe Denruyter,
Mariangiola Fabbri, Elizabeth Guttenstein,
Gary Kendall, Elizabeth Sutcliffe (WWF
European Policy Office); Karoliina Auvinen
(WWF-Finland); Edouard Toulouse (WWF-
France); Regine Guenther, Imke Luebbeke,
Christian Teriete (WWF-Germany); Liam
Salter (WWF-Hong Kong); Máthé László
(WWF-Hungary); Samrat Sengupta
(WWF-India); Wendy Elliott, Kathrin
Gutmann, Martin Hiller, Isabelle Louis,
Duncan Pollard, William Reidhead, Thomas
Schultz-Jagow, Gordon Shepherd, Tien-akeTiyapongpattana (WWF International);
Matteo Leonardi, Mariagrazia Midulla
(WWF-Italy); Yurika Ayukawa (WWF-
Japan); Melanie Hutton (WWF-New
Zealand); I Poxon, Rafael Senga, Jose
Ma Lorenzo Tan (WWF-Philippines);
Alexey Kokorin (WWF-Russia); Dr Sue
Taylor (WWF-South Africa); Mar Asuncion,
Heikki Willstedt (WWF-Spain); Denis
Pamlin (WWF-Sweden); Patrick Hofsteter
(WWF-Switzerland); Dr Ute Collier
(WWF-Turkey); Keith Allott, RichardDixon, Andrea Kaszewski, James Leaton,
Richard Wilson (WWF-UK); Jane Earley,
Hans Verolme (WWF-US).
Funding
WWF would like to acknowledge
with thanks the generous support of the
David and Elaine Potter Foundation
towards this work.
Manager: Simon Pepper
Facilitator: James Martin-Jones
Administrator: Amanda Kennett (WWF-UK)

8/8/2019 Climate Solution Web
http://slidepdf.com/reader/full/climate-solution-web 26/96
2 4
Action is needed by governments of the world to agree targets, to collaborate oneffective strategies, and to influence and coordinate the investment of many trillions
of dollars (which in any event will be invested in energy in the coming decades),
so that future needs are met safely and sustainably, as proposed here.
ACTION IS NEEDED
1 Director, Transition Institute, Australia
2 Chief Executive, WWF-Australia
3 Vice President, WWF-US
4 No energy source is free of impacts. The word ‘benign’ is used here to describe sources that WWF judges deliver a positive yield of advantages over disadvantages.
5 Stern Review Report on the Economics of Climate Change: Cambridge University Press, 2007.
6 Per-Anders Enkvist, Tomas Nauclér & Jerker Rosander: A Cost Curve for Greenhouse Gas Reduction: in The McKinsey Quarterly March 2007,
http://www.mckinseyquarterly.com/article_abstract.aspx?ar=1911&L2=3&L3=0&srid=246
7 See Topic Paper Annex
8 Pacala, S & Socolow, R. (2004) Stabilization Wedges: Solving the Climate Problem of the Next 50 Years with Current Technologies. Science 13th August, 2004, Vol. 305.
9 Based on the criteria of the World Commission on Dams (2000): http://www.dams.org/
10 For a fuller assessment, see Topic Paper ”Nuclear Energy”.
11 United Nations (2004). World Population Prospects: The 2004 Revisions Population Database. United Nations Populations Division. http://esa.un.org/unpp/
12 See Topic Paper “Poverty and Energy” and country papers attached.13 IPCC (2000). Special Report on Emissions Scenarios. The scenario is characterized as follows: “The A1 storyline is a case of rapid and successful economic development,
in which regional average income per capita converge – current distinctions between “poor” and “rich” countries eventually dissolve. The primary dynamics are: Strong
commitment to market-based solutions. High savings and commitment to education at the household level. High rates of investment and innovation in education,
technology, and institutions at the national and international levels. International mobility of people, ideas, and technology. The transition to economic convergence results
from advances in transport and communication technology, shifts in national policies on immigration and education, and international cooperation in the development of
national and international institutions that enhance productivity growth and technology diffusion.” The A1B sub-scenario uses a “...balanced mix of technologies and supply
sources, with technology improvements and resource assumptions such that no single source of energy is overly dominant”.
14 EU Council (2004). Spring European Council 2004 proceedings: “...the Council [...] ACKNOWLEDGES that to meet the ultimate objective of the UNFCCC to prevent
dangerous anthropogenic interference with the climate system, overall global temperature increase should not exceed 2oC above levels; [...]” Spring European Council 2004.
Document 7631/04 (annex), p20.
15 For a fuller statement, see Topic Paper “The 2° C Imperative”.
16 Meinhausen, M. (2004). EU’s 2oC Target and Implications for Global Emission Reductions. Swiss Federal Institute of Technology presentation.
17 This refers to the Meinhausen (2004) estimate that a 400ppm CO2e stabilization would be consistent with a 74% probability of staying below two degrees Celsius warming
(relative to pre-industrial levels).
18 Meinhausen, M. (2006) “What Does A 2 Degree Target Mean for Greenhouse Gas Concentrations?”, pp: 265-279, chapter 28 in: Avoiding Dangerous Climate Change;
Cambridge University Press, 392 pages, 2006.
19 See Topic Paper “Deforestation”.
20 Baumert, K.A., Herzog, T., Pershing, J. (2006): Navigating the numbers – Greenhouse Gas Data and International Climate Policy; World Resource Institute, Washington USA.
21 See Topic Paper ”Persistent non-CCS fossil-fuel use”.
22 Pacala and Socolow have applied the word ”wedge” to mean a very specific level of climate abatement defined by a triangle growing from zero in 2005 to 1GtC per year of
avoided emissions in 2050. The WWF model adopts the same principle of growing wedges, but does not require a linear growth, nor define a prescribed size in 2050. For
differentiation, the WWF model refers to ”Climate Solution Wedges”.
23 Pacala, S and Socolow, R. (2004) Stabilization Wedges: Solving the Climate Problem of the Next 50 Years with Current Technologies. Science 13th August, 2004, Vol. 305.
24 The Monte Carlo method is widely used to predict probable outcomes in situations where two or more inputs have a range of possible values. The model is run over and
over again with different input values set randomly within their possible range and in accordance with their individual probability distributions. Consequently the results
provide a probability of outcome which reflects the combined probability distributions of the inputs. See references in technical summary.
25 A technical summary of the design of the model can be found in Paper 19 of the Topic Paper Annex to this report.
2 4
© W W F - C a n o n ,
C l a i r e D O O L E
ACKNOWLEDGEMENTS
Part 6

8/8/2019 Climate Solution Web
http://slidepdf.com/reader/full/climate-solution-web 27/96
Climate Solutions:
The WWF Vision for 2050
26 For example, converting an average car to hybrid might save 3 litres per 100km, but if you assume cars in the future are twice as big and would normally use twice as much
fuel, then the savings would be 6 litres per 100km. If that were the case, the net consumption rate would have remained unchanged. While it can appear that there are
greater emissions avoided, in practice this may not be the case.
27 For example, abatement from transport could be achieved by more efficient vehicles or a switch to biofuels. However, these measures are not cumulative: if all cars ran on
biofuels, greater vehicle efficiency would have no impact on net emissions.
28 See the attached Topic Paper Annex.
29 See the attached annex of topic papers.
30 See the attached topic paper on “Energy Efficiency”.
31 Exajoule (EJ) – a quintillion (1018) joules.
32 Compared with our reference energy demand scenario (IPCC’s A1B), supplied at today’s average levels of carbon intensity (about 0.02GtC/EJ).
33 See Topic Paper ”Deforestation”.
34 see Topic Paper ”The 2°C Imperative”.
35 See Topic Paper ”Wind Energy”.
36 See Topic Paper ”Hydroelectricity”.
37 See Topic Paper ”Bioenergy”.
38 See Topic Paper ”Natural Gas”.
39 See Topic Paper ”Carbon Capture and Storage”.
40 See the Topic Paper Annex.
25

8/8/2019 Climate Solution Web
http://slidepdf.com/reader/full/climate-solution-web 28/96
PART 1 – KEY THEMES AND TECHNOLOGIES 1
1 The 2ºC Imperative 2
2 Deforestation 6
3 Energy Efficiency (EE) 8
4 Wind Energy 10
5 Hydroelectricity 11
6 Bioenergy 12
7 Natural Gas 14
8 Carbon Capture and Storage (CCS) 18
9 Nuclear Energy 20
10 Poverty and Energy 22
PART 2 – REGIONAL CASE STUDIES 23
11 Japan 28
12 United States of America 30
13 Republic of South Africa 32
14 Russia 36
15 India 38
16 European Union 42
17 China 44
18 Brazil 46
PART 3 – TECHNICAL SUMMARIES 49
19 Design of the Model 50
20 Summary of Input Data 62
21 Persistent Use of Non-CCS Fossil Fuel 64
Climate Solutions: The WWF Vision for 2050
Short Topic Papers

8/8/2019 Climate Solution Web
http://slidepdf.com/reader/full/climate-solution-web 29/96
P
ar t 1
–
K E
Y T HE ME S A ND T E C HN
OL O GI E S
C l i m a t e S ol u t i on s :
T h e WWF V i s i onf or 2 0 5 0
S h or t T o pi c P a p e r s
1
Part 1KeyThemes
andTechnologies
© W W F - C a n o n ,
C l a i r e D O O L E

8/8/2019 Climate Solution Web
http://slidepdf.com/reader/full/climate-solution-web 30/96
2
SignificanceThe average global temperature has alreadyrisen by 0.74 °C in 2005 compared to 100years ago and “eleven of the last twelve
years (1995-2006) rank among the twelve
warmest years in the instrumental record
of global surface temperature.”1 Scientistsattribute most of this temperature rise tohuman activities which release carbondioxide (CO
2) and other greenhouse gases
(GHG) into the atmosphere.
According to recent research2 3
, an averageglobal warming of 2°C or above comparedto the pre-Industrial Revolution level wouldresult in dangerous and irreversible impacts,including the following projections:
• Water shortages — Globally, more thanthree billion more people would be atrisk as a result of water shortages. Thepredicted loss of ongoing glacier melt-water in India alone would cause watershortages for 500 million people and for37% of India’s irrigated land.
• Food insecurity — More frequentdroughts in Africa and elsewherewould lead to lower crop yields,and there would be a general decreasein cereal crop yields extending beyondthe tropics to mid-latitude and temperateregions, mainly due to increasedevapotranspiration.
• Health impacts — Three hundredmillion people would be at greater riskof malaria and other vector- and water-borne diseases; and the health costs of climate change are projected to doubleby 2020, partly as a result of heatstress, but primarily because of increasedrates of diarrhoea and malnutrition inlow-income countries4.
• Socio-economic impacts — Initialestimates of socio-economic losses withmoderate temperature increases include
gross domestic product (GDP) losses of a few to several GDP percentage points,with net global damage of up to 20% forunmitigated climate change compared tomuch lower abatement costs in the caseof early mitigation action.
• Effects on ecosystems — Thirty-fiveper cent of terrestrial species wouldbe at or near extinction by the year20505, including the loss of uniqueecosystems/species (e.g., theCape region, South Africa).
ChallengesResearch6 indicates that at 550ppm (partsper million) CO2 equivalent (CO2e), thelikelihood of exceeding 2°C above pre-industrial levels is very high (63-99% witha mean of 82%). A stabilization at 475ppmwould bring with it a 38-90% (mean 64%)probability of exceeding a 2°C target.With a stabilization at 400ppm CO
2e the
probability of exceeding 2°C “unlikely”,with a range of 8-57% (mean 28%).
Greenhouse concentrations already exceed400ppm CO2e. However, there will be
some re-absorption by the biosphere (landand oceans) and analysis by Meinhausenindicates that in the short term radiativeforcing by greenhouse gases is being offsetby aerosol emissions from industry andbiomass burning, amongst other things.Figure 1 (c) shows the concentrationspathway for a stabilization at 400ppmCO
2e, following a peak at 475ppm.
Topic Paper 1:
The 2ºC Imperative
1 IPCC. (2007) Climate Change 2007 – The Physical Science Basis; Summary for Policy Makers. Contribution of WorkingGroup I to the Fourth Assessment Report of the IPCC; Geneva.
2 Schellnhuber, H J, Cramer, W, Nakicenovic, N, Wigley, T & Yohe, G. (2006) Avoiding Dangerous Climate Change;
Cambridge University Press, 392 pp.
3 The Impacts of Climate Change on Growth and Development, pp: 56-167, chapter II in: Stern Review Report on the
Economics of Climate Change: Cambridge University Press, 2007..
4 Kovats R S & Haines A. (2005) Global climate change and health: recent findings and future steps [editorial]. CMAJ
2005;172(4):501-2. http://www.cmaj.ca/cgi/content/full/172/4/501
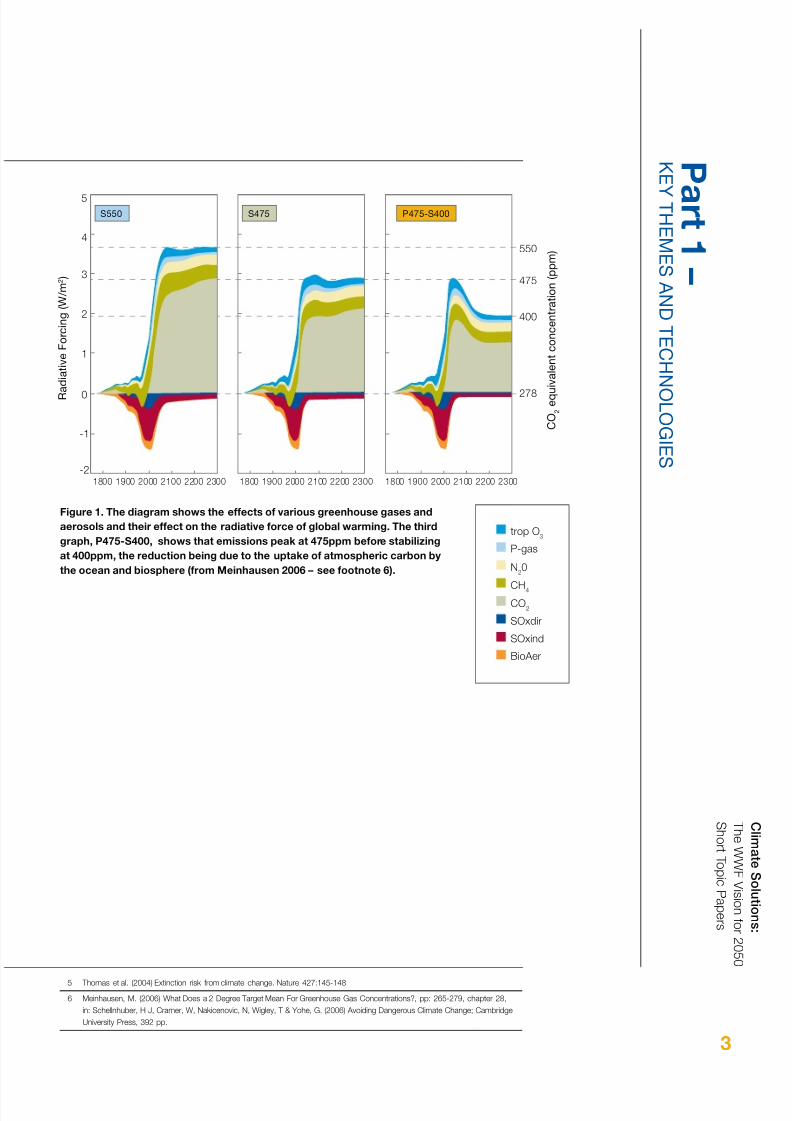
8/8/2019 Climate Solution Web
http://slidepdf.com/reader/full/climate-solution-web 31/96
P
ar t 1
–
K E
Y T HE ME S A ND T E C HN
OL O GI E S
C l i m a t e S ol u t i on s :
T h e WWF V i s i onf or 2 0 5 0
S h or t T o pi c P a p e r s
3
Figure 1. The diagram shows the effects of various greenhouse gases and
aerosols and their effect on the radiative force of global warming. The third
graph, P475-S400, shows that emissions peak at 475ppm before stabilizing
at 400ppm, the reduction being due to the uptake of atmospheric carbon by
the ocean and biosphere (from Meinhausen 2006 – see footnote 6).
5 Thomas et al. (2004) Extinction risk from climate change. Nature 427:145-148
6 Meinhausen, M. (2006) What Does a 2 Degree Target Mean For Greenhouse Gas Concentrations?, pp: 265-279, chapter 28,
in: Schellnhuber, H J, Cramer, W, Nakicenovic, N, Wigley, T & Yohe, G. (2006) Avoiding Dangerous Climate Change; Cambridge
University Press, 392 pp.

8/8/2019 Climate Solution Web
http://slidepdf.com/reader/full/climate-solution-web 32/96
4
Topic Paper 1:
The 2ºC Imperative (continued)
7 den Elzen, M & Meinhausen, M. (2006) Multi Gas Emissions Pathways for Meeting the EU 2 degree C Climate Target,pp 299-309, chapter 31, in: Schellnhuber, H J, Cramer, W, Nakicenovic, N, Wigley, T & Yohe, G. (2006) Avoiding
Dangerous Climate Change; Cambridge University Press, 392 pp.
In developing this model, the long-termstabilization goal has been translated
into two levels of budget for cumulative
fossil carbon emissions, taking account of
the high and low estimates for reducing
land-use change emissions. Stabilizing
at 400ppm CO2e would require the
world to keep within a carbon budget of
approximately 500 GtC of fossil emissions
(shown by the upper line in the graph
below), provided that land-use emissions
were successfully controlled. Should
land-use emissions not be reduced
(through a failure to limit deforestation),
the allowable budget of fossil emissions
would be reduced by at least 100GtC,
so a lower budget of 400GtC has been
included (shown by the lower line).
Though the carbon budget used in the
model is taken out to 2200, fossil fuel
use by 2050 would be somewhat less at
between 383GtC for the higher budget
and 315GtC for the lower budget. The
difference of about 70GtC reflects the
different outcomes for land-use changeover the half-century.
ImplicationsThe amount of carbon dioxide in the
atmosphere in 2007 stands at 382ppm, or
approximately 425ppm CO2e (see note
below). This has been rising in recent years
at a rate of 2ppmv per year. At the same
time fossil fuel carbon dioxide emissions
have been rising at an unprecedented rate of
3% per annum in the last few years. In order
to be able to achieve a global cut of about
50% of all GHG by mid-century compared
to 1990 emission levels – considered
necessary to stay below 2°C global warming
– the critical need is to ensure that global
GHG emissions peak and start to decline
within the next ten years7. As GHGs linger
in the atmosphere for decades, radical action
– above all in developed countries – is
urgent and imperative.
Figure 2. The diagram shows the trajectories of annual emissions and cumulative
emissions in the Meinhausen (2006) 400ppm scenario as compared to various
other scenarios.

8/8/2019 Climate Solution Web
http://slidepdf.com/reader/full/climate-solution-web 33/96
P
ar t 1
–
K E
Y T HE ME S A ND T E C HN
OL O GI E S
C l i m a t e S ol u t i on s :
T h e WWF V i s i onf or 2 0 5 0
S h or t T o pi c P a p e r s
5
R a d i a t i v e F o r c i n g
CO2
(ppmv)
+ other GHG
+ aerosols
CO2eq
(ppmv)
350 + other 400
390 + other 450
470 + other 550
550 + other 650
Conversion Table for > 2100
Note: In the model we use the equivalencebetween carbon dioxide emissions (GtC) orconcentrations (ppmv) and total emissionsincluding other gases. In practice, the releases of carbon dioxide and other GHGs can be assumedto stay roughly in proportion; the following tableshows an approximate relationship (Meinhausen,
M. (2004) EU’s 2ºC Target and Implications
for Global Emission Reductions. Swiss Federal
Institute of Technology presentation).
Figure 3. To permit a 500GtC carbon emissions budget, land-use emissions must be reduced
over the period to 2050 as per the Meinhausen (2006) 400ppm scenario in the diagram. A failure
to do so reduces the budget available to energy and other sectors.

8/8/2019 Climate Solution Web
http://slidepdf.com/reader/full/climate-solution-web 34/96
6
SignificanceDeforestation is responsible not only forsignificant ecosystem and species loss,but importantly also for 20% of globalgreenhouse gas emissions. Ten countriesaccount for 87% of global deforestation,with Brazil and Indonesia alone accountingfor 54% of these emissions. Tropicalforests, where deforestation is mostprevalent, hold over 210GtC, and almost500GtC in their soils (which is oftenreleased in land-use change). Rates of
deforestation have remained constantover the last two decades and withoutsignificant, concerted action these couldresult in emissions of 10Gt of carbondioxide per year for 50-100 years.Forests also absorb carbon dioxide, soincreasing forest cover can increase carbonsequestration, but the positive impact of this is far outweighed by the negativeimpact of deforestation8 on atmosphericcarbon dioxide, let alone wider ecosystemimpacts. So, while restoring forest cover
is a benefi
t, the primary focus should be toreduce deforestation9.
Challenges• The causes of deforestation are wide
ranging and vary by country. Theyinclude agricultural expansion, cattleranching, infrastructure development,and logging. These are driven by bothpopulation pressures and increasedlevels of local and foreign consumption,and exacerbated by poor governanceand inadequate land-use planning.Governments and the wide range of market actors must be effectively
influenced to reduce these threats.• Currently available data are provided
by national governments and arenot globally consistent. Establishingaccurate data, and in particular agreeingnew globally consistent definitions of deforestation and degradation at a forestbiome level, is essential.
• Bioenergy is potentially “CO2
neutral”.However, the expansion of palm oiland tropical crops, such as sugarcane,for biofuel production could becomea significant driver of deforestation.Bioenergy developments must thereforebe appropriately regulated to preventfurther deforestation.
Rate of Change AchievableIt is plausible to halve the current rateof deforestation by 2015 and achieve azero rate by 2020. This would lead tocumulative emission reductions of 55Gtcarbon dioxide by 2020, and 155Gt by2030. In contrast, to halve the rate of deforestation by 2020, and achieve a zerorate by 2030 would result in cumulativeemission reductions of 27Gt carbondioxide by 2020, and 105Gt by 2030– a significantly lower benefit.
See topic paper 1 for assumptions made
in model.
Halting land clearance is a far moreeffective intervention than planting trees.Reforestation with fast-growing trees at therate of three million hectares per year (equalto current rates) would result in a cumulativeabsorption of only approximately 10Gtcarbon dioxide by 2020.
Topic Paper 2:
Deforestation
8 Source: IPCC, Special Report 2000.
9 The sustainable use of forests, while protecting and maintaining their overall structure and ecosystem functions, is not
in question.

8/8/2019 Climate Solution Web
http://slidepdf.com/reader/full/climate-solution-web 35/96
P
ar t 1
–
K E
Y T HE ME S A ND T E C HN
OL O GI E S
C l i m a t e S ol u t i on s :
T h e WWF V i s i onf or 2 0 5 0
S h or t T o pi c P a p e r s
7
© W W F , K L E I N & H U B E R T

8/8/2019 Climate Solution Web
http://slidepdf.com/reader/full/climate-solution-web 36/96
8
SignificanceMost societies are massively wasteful of energy. Energy-ef ficiency (EE) measuresacross all sectors can play a huge, essential,painless and non-controversial part inensuring a sustainable energy future.Such conclusions have been reconfirmedmany times. The International EnergyAgency’s (IEA) latest scenarios estimatethat, depending on the scenario applied,EE could account for 31-53% of the
total carbon dioxide emission reduction
(relative to baseline) in 205010. Thisis consistent with the findings of theWWF model where energy-ef ficiencytechnologies and systems account for areduction of approximately one-third of energy demand. The European Commissionestimates that EE measures could cost-effectively deliver a 20% reductionin today’s energy consumption in theEuropean Union (EU) by 2020, withsavings of at least €60 billion11.
Energy use in commercial and residentialbuildings accounts for 35% of today’sglobal final energy consumption; 32%for industry and 26% for transport.In all sectors, major savings could beachieved by adopting best availabletechnologies, innovative materials and/ornew processes and systems, in most caseavailable on the market and at reduced netcosts (generally higher investment cost butlower operating cost).
EE measures in buildings comprise mainlyenvelope and insulation materials, lightingand appliances, heating and coolingsystems. In the long term, the biggestsaving potential can be achieved by settingbuilding codes for construction andrenovation for all buildings. In the shortterm, major savings from a better energyend-use can be attained. IEA countriescould save some 322Mt of CO
2 /y by 201012
with new policies aimed at residentialuses of energy (e.g., early replacement of inef ficient appliances, energy labelling
systems, or setting minimum requirementsfor energy-using products).
Industrial EE includes many devices andsystems already commercially available,providing the same service or commoditywith lower energy input. Due to themultiplicity of industrial production andprocesses, different technologies andsystems (e.g., higher-ef ficiency motorsystems, residual heat recovery, fuelsubstitution, ef ficient steam generation and
use) are applicable to a range of differentsectors and industrial groups. Assessingthe potential requires a detailed analysis of each technology and its application.
In the past 25 years, transport emissionshave grown at approximately twice therate of EE improvements. Without asignificant intervention, global transportGHG emissions will keep growing steadily(50-100% by 2020 in comparison with1995)13. Vehicle ef ficiency must be further
improved (e.g., increased fuel ef fi
ciency,minimum ef ficiency requirement forautomobile AC systems, better tyre rollingresistance) but at the same time measuresare needed to reduce vehicle use, whichwould otherwise increase with improvedef ficiency. Better public transport systems,a modal shift from road to rail, and reducedroad freight transport are among themeasures to be drawn upon.
In the power sector, the best EE potentiallies in recovery of waste energy, a
large expansion of combined heat andpower generation (CHP), and better gridmanagement. Cost-effective measures needto be more broadly adopted14 to reducetransmission and distribution losses, suchas minimum standards for distributiontransformers15, EE obligations on systemoperators, and cost recovery for investmentsmade on the energy end-use side.
Topic Paper 3:
Energy Efficiency (EE)
10 “Energy Technology Perspective – Scenario and Strategies to 2050”, International Energy Agency (June 2006), p. 47.
11 Green Paper of the European Commission on Energy Efficiency, “Doing more with less”, COM (2005) 265 final,
June 2005.
12 “Cool appliances – Policy Strategies for Energy-efficient Homes”, IEA (2003), p. 14.
See also http://www.iea.org/textbase/nptable/Projected%20savings%20by%20end-use.pdf
13 IPCC III report, p 203.
14 IEA estimates that improved end-use efficiency leads to substantial reductions in investment needs for power
generation capacity (USD2.9 trillion) and transmission and distribution (USD4.3 trillion).

8/8/2019 Climate Solution Web
http://slidepdf.com/reader/full/climate-solution-web 37/96
P
ar t 1
–
K E
Y T HE ME S A ND T E C HN
OL O GI E S
C l i m a t e S ol u t i on s :
T h e WWF V i s i onf or 2 0 5 0
S h or t T o pi c P a p e r s
9
ChallengesThere are many barriers to overcome, despitethe fact that a widespread disseminationof existing EE technologies would provecost effective in most cases. Many of these
barriers are regulatory and financial,
rather than technological. For example:
• High upfront investments
• Capital misallocation
• Split incentives between manufactures
and consumers• Lack of policy coherence and regulatory
incentives (regulation that rewards sellinglarge quantities of low-cost power ratherthan providing better services andreducing demand)
• Organizational failure (no rewards forcutting energy cost, non-integrated budgetfor purchase and operating savings)
• Lack of financial schemes to addressupfront costs
• Lack of information/education amongprofessionals and consumers on howto optimize energy savings throughpurchase, installation, and operationof best available technology
• Dif ficulties in marketing energy saving/ ef ficiency
See topic paper 20 for inputs to model.
15 Saving potential > 20 TWh/a in EU.
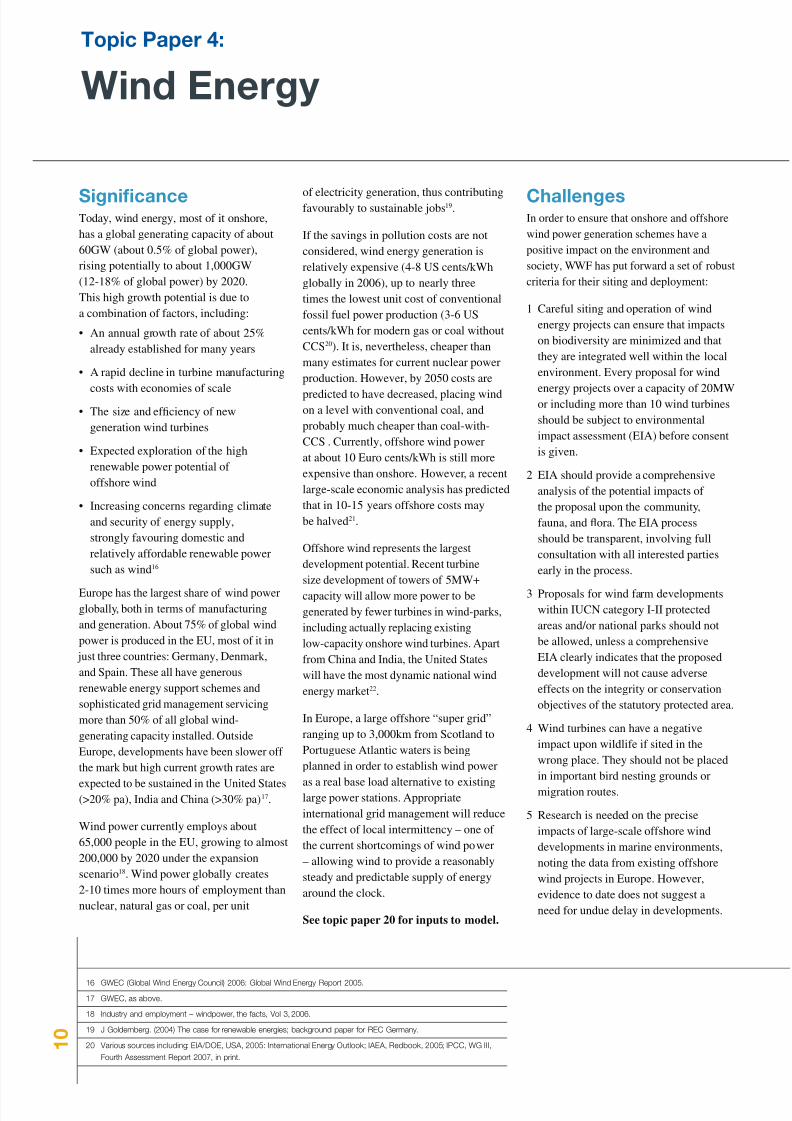
8/8/2019 Climate Solution Web
http://slidepdf.com/reader/full/climate-solution-web 38/96
1 0
SignificanceToday, wind energy, most of it onshore,has a global generating capacity of about60GW (about 0.5% of global power),rising potentially to about 1,000GW(12-18% of global power) by 2020.This high growth potential is due toa combination of factors, including:
• An annual growth rate of about 25%already established for many years
• A rapid decline in turbine manufacturing
costs with economies of scale• The size and ef ficiency of new
generation wind turbines
• Expected exploration of the highrenewable power potential of offshore wind
• Increasing concerns regarding climateand security of energy supply,strongly favouring domestic andrelatively affordable renewable powersuch as wind16
Europe has the largest share of wind powerglobally, both in terms of manufacturingand generation. About 75% of global windpower is produced in the EU, most of it in
just three countries: Germany, Denmark,and Spain. These all have generousrenewable energy support schemes andsophisticated grid management servicingmore than 50% of all global wind-generating capacity installed. OutsideEurope, developments have been slower off the mark but high current growth rates are
expected to be sustained in the United States(>20% pa), India and China (>30% pa)17.
Wind power currently employs about65,000 people in the EU, growing to almost200,000 by 2020 under the expansionscenario18. Wind power globally creates2-10 times more hours of employment thannuclear, natural gas or coal, per unit
of electricity generation, thus contributingfavourably to sustainable jobs19.
If the savings in pollution costs are notconsidered, wind energy generation isrelatively expensive (4-8 US cents/kWhglobally in 2006), up to nearly threetimes the lowest unit cost of conventionalfossil fuel power production (3-6 UScents/kWh for modern gas or coal withoutCCS20). It is, nevertheless, cheaper thanmany estimates for current nuclear powerproduction. However, by 2050 costs are
predicted to have decreased, placing windon a level with conventional coal, andprobably much cheaper than coal-with-CCS . Currently, offshore wind powerat about 10 Euro cents/kWh is still moreexpensive than onshore. However, a recentlarge-scale economic analysis has predictedthat in 10-15 years offshore costs maybe halved21.
Offshore wind represents the largestdevelopment potential. Recent turbinesize development of towers of 5MW+capacity will allow more power to begenerated by fewer turbines in wind-parks,including actually replacing existinglow-capacity onshore wind turbines. Apartfrom China and India, the United Stateswill have the most dynamic national windenergy market22.
In Europe, a large offshore “super grid”ranging up to 3,000km from Scotland toPortuguese Atlantic waters is beingplanned in order to establish wind power
as a real base load alternative to existinglarge power stations. Appropriateinternational grid management will reducethe effect of local intermittency – one of the current shortcomings of wind power– allowing wind to provide a reasonablysteady and predictable supply of energyaround the clock.
See topic paper 20 for inputs to model.
ChallengesIn order to ensure that onshore and offshorewind power generation schemes have apositive impact on the environment andsociety, WWF has put forward a set of robustcriteria for their siting and deployment:
1 Careful siting and operation of windenergy projects can ensure that impactson biodiversity are minimized and thatthey are integrated well within the localenvironment. Every proposal for wind
energy projects over a capacity of 20MWor including more than 10 wind turbinesshould be subject to environmentalimpact assessment (EIA) before consentis given.
2 EIA should provide a comprehensiveanalysis of the potential impacts of the proposal upon the community,fauna, and flora. The EIA processshould be transparent, involving fullconsultation with all interested partiesearly in the process.
3 Proposals for wind farm developmentswithin IUCN category I-II protectedareas and/or national parks should notbe allowed, unless a comprehensiveEIA clearly indicates that the proposeddevelopment will not cause adverseeffects on the integrity or conservationobjectives of the statutory protected area.
4 Wind turbines can have a negativeimpact upon wildlife if sited in thewrong place. They should not be placedin important bird nesting grounds or
migration routes.
5 Research is needed on the preciseimpacts of large-scale offshore winddevelopments in marine environments,noting the data from existing offshorewind projects in Europe. However,evidence to date does not suggest aneed for undue delay in developments.
Topic Paper 4:
Wind Energy
16 GWEC (Global Wind Energy Council) 2006: Global Wind Energy Report 2005.
17 GWEC, as above.
18 Industry and employment – windpower, the facts, Vol 3, 2006.
19 J Goldemberg. (2004) The case for renewable energies; background paper for REC Germany.
20 Various sources including: EIA/DOE, USA, 2005: International Energy Outlook; IAEA, Redbook, 2005; IPCC, WG III,
Fourth Assessment Report 2007, in print.

8/8/2019 Climate Solution Web
http://slidepdf.com/reader/full/climate-solution-web 39/96
P
ar t 1
–
K E
Y T HE ME S A ND T E C HN
OL O GI E S
C l i m a t e S ol u t i on s :
T h e WWF V i s i onf or 2 0 5 0
S h or t T o pi c P a p e r s
11
SignificanceThis brief covers three related technologieswith a proposed capacity of +400GW:repowering old hydro dams (+30GWproposed) and installing new small(+100GW) and medium and large hydroprojects (+270GW). Hydroelectricitycurrently provides nearly 20% of the world’selectricity. At particular sites, hydroelectricitycan provide low-greenhouse gas emissionelectricity that is particularly useful formeeting peak loads.
Issues Which Arise or Constraints
Which Should Apply to its Widespread
Deployment
• Dams destroy the ecology of river systemsby changing the volume, quality, and timingof water flows downstream, and by blockingthe movement of wildlife, nutrients, andsediments. Less than 40% of the world’slongest rivers remain free-flowing, and thereare over 1,400 large dams planned or underconstruction (e.g., 105 in the Yangtze River
basin ecoregion, 162 in northern India).
• Dams have enormous social impacts, with40-80 million people displaced so far. Largedam proposals at many sites have beenopposed by local people.
• Undeveloped (but not necessarilylow-impact or sustainable) hydropowercapacity is unevenly distributed: 60%in Asia, 17% in Africa, and 13% inSouth America. Small hydropower ismostly used in decentralized systems.
Development/Deployment Potential
Repowering old hydropower dams– retrofitting them with modern equipmentthat can produce more power – generally isbenign and can be an opportunity to reducethe original environmental impacts. While thetotal contribution is relatively small (+30GW),repowering of dams can happen quickly andform the basis for a broader dialogue between
civil society andfi
nanciers, industry, andgovernments. The 30GW contribution isestimated based on the numbers of 20+ year-old hydropower only dams on the InternationalCommittee on Large Dams’ register andestimating a conservative 10% increasedproduction between now (~20GW) and2025 (+10GW) based on a mixture of light,medium, and full upgrading opportunities.
Small, low-impact, economically feasiblehydropower potential is estimated at 190GWglobally, with 47GW developed so far. We
have estimated that a realistic developmentlevel is around 100GW over 50 years,continuing the current 2GW/yr growth rate.
New dam proposals are controversial. Basedon impacts in countries with different degreesof hydropower development, WWF estimatesthat it may be possible to develop 30% of theeconomically feasible hydropower capacityin most river basins or nations withoutunacceptable impacts, in accordance withWorld Commission on Dams guidelines.Around 740GW has been installed out of aglobal economically feasible large hydropowercapacity of 2,270GW. Around 120GW arecurrently under construction and 445GWare planned over 30-40 years, includingmany dams with unacceptable environmentalimpacts. We estimate that of the 445GW,250GW of large hydropower sites could bedeveloped with relatively low impacts. Usinga similar process, we identify a further 20GWof medium hydropower potential.
See topic paper 20 for inputs to model.
Criteria Used by WWF to Define
“Sustainable”
WWF advocates social and environmentalsafeguards which are based on the guidelinesof the World Commission on Dams (2000):http://www.dams.org/
Topic Paper 5:
Hydroelectricity
21 Nitsch, J & Viehbahn, P. (2006). (In German), Strukturell-ökonomischer-ökologischer Vergleich regenerativer Energietechnologien(RE) mit Carbon Capture and Storage-Technologien (CCS).
22 GWEC, as above

8/8/2019 Climate Solution Web
http://slidepdf.com/reader/full/climate-solution-web 40/96
1 2
Biomass is the totality of plants in theterrestrial and marine biosphere whichuse carbon dioxide, water, and solarenergy to produce organic material; italso includes animals, and agents of decomposition such as bacteria and fungiwhose activity releases carbon dioxide intothe atmosphere. Bioenergy can be derivedfrom biomass in the form of liquid biofuels(processed usually from energy-rich crops),wastes (including renewable municipalwaste), solid biomass (wood, charcoal,and other biomass material), or gases
(derived from biomass decomposition).
Significance“Globally, biomass currently providesaround 46EJ of bioenergy. This shareis estimated to be over 10% of globalprimary energy supply, though thevolume of traditional biomass consumedin developing countries is uncertain.”23
Applications vary widely, from traditionalbiomass use (such as cooking on open fires)
in the poorest countries to highly ef ficientelectricity and heat production or transportfuels. About 110EJ to 250EJ produced frombiomass (see “Development/deployment”)would remove about 8-19Gt carbon peryear from the atmosphere24 if it is used todisplace fossil fuels. However, this assumesthe same ef ficiency for all biomass and thatit is all produced sustainably and replantedso as to be carbon neutral. Since muchbiomass is used less ef ficiently, the actualsavings would be lower.
Issues andConstraints25 Uncontrolled development of bioenergycrops can have dramatic impacts onhumans and the environment. What, where,and how the raw materials are producedand processed will define whetherbioenergy projects are environmentallyand socially sustainable on all fronts.
WWF believes that key principles andcriteria26, which must be taken into account
for sustainable bioenergy production anduse, include the following:
Bioenergy must deliver greenhouse gas
(GHG) and carbon life-cycle bene fi ts
over conventional fuels
Energy crops to be used for bioenergymust be selected on the basis of the mostef ficient carbon (soil and air) and energybalance, from production through toprocessing and use. This is not alwaysachieved. For example energy-intensive
fertilizer input increases nitrous oxide(N
2O) emissions, a highly potent GHG, and
intensive cropping may contribute to therelease of soil-bound carbon dioxide. Someconventional crops, such as sugarcane orwoody biomass, can provide net benefitsif sustainably produced and processed, andare already available for use as bioenergy.However, future investments and researchshould be oriented towards ligno-cellulosicor other crops that offer better options toreduce carbon dioxide emissions, as well
as a reduced impact on the environment.
Bioenergy developments must ensure positive natural resource use and careful
land-use planning
Permanent grasslands, natural forests,natural floodplains, and wetlands andpeatlands, important habitats for threatenedspecies and other high conservation valueareas (HCVA), must not be convertedinto intensive forest or farmland, evenif to produce a potential environmentalgood such as a bioenergy crop. Biomassproduction requires agricultural and
forestry management techniques that canguarantee the integrity and/or improvementof soil and water resources, avoiding waterand soil pollution, depletion of soil carbon,and over-abstraction of water resourcesfor irrigation.
Competition for Land Use
and Social Impacts
An unplanned opportunistic rush intobioenergies could lead to damaging land-use competition in some regions. This may
involve a range of key environmental needs(floodplains, deforestation, high naturevalue lands), access to land for pooreror start-up farmers, or competition withfood and fibre production. Many of thecurrently used bioenergy commodities arealso food and feed crops. The interest inbioenergy has already led to price increasesfor several crops, which can challenge thecapacity of poor farming communities tocontinue buying them for their own needs.
Topic Paper 6:
Bioenergy
23 IEA, 2005.
24 Preliminary results of the WWF potentials study (agriculture potentials) and IPCC results (forestry potentials). WWF is
currently running an internal consultation process to check these data.
25 The Oeko Institut has prepared a first list of criteria for sustainable bioenergy production for WWF in “Sustainability
Standards for Bioenergy”, 2006 (draft).
26 These principles and criteria will need to be further defined and are not meant to be exhaustive.

8/8/2019 Climate Solution Web
http://slidepdf.com/reader/full/climate-solution-web 41/96
P
ar t 1
–
K E
Y T HE ME S A ND T E C HN
OL O GI E S
C l i m a t e S ol u t i on s :
T h e WWF V i s i onf or 2 0 5 0
S h or t T o pi c P a p e r s
13
Rate of Development/DeploymentThe WWF Climate Solutions model assumesthat about 110EJ (low estimate) to 250EJ (highestimate) bioenergy can be produced globally,in a sustainable way. These figures are takenfrom a “first estimate” study commissioned byWWF in 200627.
Forestry bioenergy potentials were takenfrom existing literature and range from 14EJto 65EJ.
Agriculture bioenergy potentials range from96EJ to 185EJ.
• This is a pure supply-side scenario, nottaking into account economics or demand-side dynamics such as policy-based andregulatory incentives. Many bioenergyscenarios have been prepared but WWFwanted to make sure that any potentialsadopted in its policies could be producedwithout harming the environment.
• WWF assumed that about 30% of available(i.e., not currently used) arable landcould be allocated for future bioenergyproduction. This percentage is higher indeveloped economies and lower in someregions such as sub-Saharan Africa. Theremaining 70% of arable land shouldbe protected for the purposes of natureconservation and human development.The scenarios excluded land consideredmarginal for cropping, except for jatrophawhich is known to thrive on such land.
• Where increased irrigation is required forbioenergy crops, the scenarios allow it upto a level which is renewable. For someregions, where such data were not reliable,no bioenergy developments were accepted.
• The scenarios include a conservative “yieldgap closure” by 2050, based on the yieldfor a crop that is expected to be exceededby only 20% of the countries growing it in2015, as a conservative reference for 2050.
• Potentials by 2050 are based on estimatesof annual increments of arable land forbioenergy cropping from 2006 until 2050.
• The scenarios only look at existingagricultural crops, including where relevantpost-harvest residues. Waste that is notderived from crops, 2nd generation crops,algae, etc are not included.
• The main variable that influences thedifference in potentials is crop yield. Thelower-end potentials assume a maximumdiversity of crops in the different regions,
assuming that more and less productivecrops would be used to produce bioenergy.The higher-end scenarios assume that onlythe most productive crops would be used.The range of potentials would even begreater (110EJ-340EJ) if the single mostproductive crop was chosen per region.
This estimate is considered as a “firstestimate”. Further research would be neededto refine the data.
• The potential estimate should, for example,
be compared to demand-side scenarios,including economics, policies, etc.
• More recent and accurate data couldbe collected, for example on irrigation.Country studies could also help to refinethe data.
• Agricultural crops that were not included inthe present study – algae, biogas from non-crop waste, “2nd generation” crops – alsopresent potentials that should be assessed.
• The forestry potentials should be refined.
These potentials have not been assessed inWWF’s study, and data from the literaturewere used.
See topic paper 20 for inputs to model.
27 Preliminary results of the WWF potentials study (agriculture potentials) and IPCC results (forestry potentials), in prep.

8/8/2019 Climate Solution Web
http://slidepdf.com/reader/full/climate-solution-web 42/96
1 4
Gas and ClimateChange TargetsAs a source of energy natural gas has acarbon footprint about half that of coal28.
Currently, coal supplies 23% of theworld’s primary energy, yet contributes37% of global GHG emissions29. In thepower sector, the IEA projects that coalconsumption will almost double by 2030,with China and India accounting for 68%of this increase30. Whatever the exact
figure, it is clear that coal use will increasehugely if alternative sources of energy arenot made commercially available.
Natural gas may be part of the medium-term solution. Some modern conventionalpower plants can be easily modified toswitch fuel sources, delivering immediatecarbon dioxide savings when substitutingcoal for gas. Furthermore, modernCombined Cycle Gas Turbine (CCGT)installations emit only 40% of the carbondioxide produced by a conventional coal-fired power station31. So displacing coalwith natural gas in the power sector canreduce short- and medium-term emissions,“buying time” for the deployment of trulysustainable zero-emission solutions andreducing the overall atmospheric loadingfrom GHG pollution from coal.
For such an outcome to occur it is criticalthat gas replaces only coal use and thatits use does not slow or hinder renewableenergy development in the same markets.
Issues and ConstraintsRenewable Energy Overlap
In some cases market conditions whichprice carbon will tend to favour gas (whichis a competitive energy supply in mostmarkets) over renewables, which wouldneed a higher carbon price to competedirectly with gas. This competition betweentwo low-emission supply sources is highlyinef ficient and counter productive in thelonger term.
Competing Uses
To deliver maximum carbon dioxideabatement potential, the world’s finitenatural gas resources need to deployedto avoid coal emissions where possible.Competing uses, such as extraction of oil from tar sands, have serious negativeconsequences for the climate and shouldbe avoided.
Shrinking Sources of Supply
Gas resources have been available in manyareas and often close to the markets thatuse them, such as North Sea gas in Europe.However, as these are used up, the focusmoves to the remaining large gas reservesin areas remote from current and futurehigh-growth energy demands. The globalleader by volume proven is Russia(47.57 trillion cu m) followed byIran (26.62 trillion cu m) and Qatar(25.77 trillion cu m). European productionis now in severe decline, with increasingdependency upon Russian supplies. Thisraises challenges for transportation andenergy security.
Transport and StorageIt is more dif ficult and often moreexpensive to transport and store gascompared to liquid fuels (such as oil) orsolids (such as coal). Traditionally, gashas been transported via pipeline fromsource to production and then onward tomarket via other distribution networks.Pipeline investment requires stablelong-range contracts, low sovereign risk,harmonization of financial, supply anddemand risk, and strong regulatory design
with interaction between and acrossmarkets. Some networks have existed forover 100 years. In de-regulated markets,there is usually third party ownership of transportation assets outside the controlsof producer and end-user. This presentsfurther risk.
On the other hand, liquefied natural gas(LNG) is usually transported in shippingoperated by producers or end-users.Russia has an extensive pipeline networklinking its reserves to Europe, China, and
Japan. By contrast, Qatar has recentlycommissioned 46 new LNG tankerswhich can be delivered by South Koreanshipbuilders in about three years, comparedwith a ten-year lead time for pipelinedevelopments.
Methane Leaks
Natural gas consists primarily of methane(CH
4), which is 21 times more potent
than carbon dioxide as a greenhouse gas32.As such, relatively small leakages of
CH4 throughout the total gas life-cycleof extraction, processing, distribution,storage, and end-use can quicklyundermine the potential carbon dioxideabatement advantages.
Topic Paper 7:
Natural Gas
28 EIA - Natural Gas Issues and Trends 1998.
29 CO2
Emissions from Fuel Combustion, 2004 Edition, International Energy Agency.
30 World Energy Outlook, 2004 Edition, International Energy Agency.
31 IPCC 3rd Assessment Report, Working Group III, 2001, Cambridge University Press.
32 Climate Change 2001: Synthesis Report, IPCC.

8/8/2019 Climate Solution Web
http://slidepdf.com/reader/full/climate-solution-web 43/96
P
ar t 1
–
K E
Y T HE ME S A ND T E C HN
OL O GI E S
C l i m a t e S ol u t i on s :
T h e WWF V i s i onf or 2 0 5 0
S h or t T o pi c P a p e r s
15
Energy SecurityIn the coming decades, the majority of new power generation will be installed inrapidly developing Asian economies suchas China and India, which have generouscoal deposits but limited gas. Also LNGreceiving ports, storage capacity, andtransmission infrastructure are very limited,and with energy security a political priority,these countries will naturally favour thedevelopment of coal-fired power overincreasing reliance on imported gas, unless
other compelling reasons or incentives prevail.Similarly, European nations may try to avoiddependence on piped gas from Russia, whosepolitical relations with transit countries suchas Ukraine are strained. The emergence of “resource nationalism” also challenges capitalflows so that global energy companies becomeloath to risk having stranded assets. Thismay slow development of reserves in manymarkets and shift focus away from gas.
Beyond Pipelines
LNG technology is maturing to the extentthat it is now economically competitive withpipelined gas in many instances33. With vastreserves and an advantageous geographicallocation, Qatar is ideally positioned tosupply LNG to both Atlantic and Pacificbasins, uniting previously discrete regionsinto a new global gas market, with uncertainconsequences for pricing and marketdynamics. Geopolitical relationships areincreasingly important with China, Japan,India, and South Korea competing with theUnited States for LNG supplies.
33 “Assess ing the future challenges of the global gas market”, 23rd World Gas Conference, Amsterdam, 2006.

8/8/2019 Climate Solution Web
http://slidepdf.com/reader/full/climate-solution-web 44/96
1 6
Technology RiskThere remain a number of technologysafety risks with gas. Proximity to marketis critical for LNG terminals, requiring thatmost new facilities be proposed in or nearmajor coastal population centres. Whilethe safety record is largely positive, thepotential for a significant LNG accidentremains. Such an event would increasethe dif ficulty for development of LNGterminals and therefore affect marketdevelopment and expansion in the OECD
and some Asian countries.
Non-Climate Environmental Impacts
Site-based environmental impactsassociated with natural gas include:
• Effects of seismic exploration oncetaceans and fish
• Loss of benthic habitat such ascoral and seagrass from dredging forshipping channels
• Significantly reducing the breeding
success of turtles from light pollution(from coastal LNG infrastructure)
• Damage to coastal habitat such as turtlenesting beaches and bird roosts from theconstruction of port facilities, and theattendant problem of boat-strikes andthe potential for introducing ship-bornemarine pests
• Risk of pollution from airborneemissions and from spills of oil,diesel, and other pollutants during
LNG operations• Quarantine risks, particularly to islands
• Clearing of terrestrial habitat forpipelines or LNG facilities
Detailed, rigorous, and comprehensiveenvironmental impact assessments will benecessary to ensure that switching fromcoal to natural gas will realize net benefits.
Rate of Development/DeploymentAt year end 2005, an estimated 65 yearsof proved natural gas reserves remained,based on current consumption34. Theemergence of LNG as a viable economicoption connects traditionally remotegas fields with end-users, enabling thedevelopment of a global gas market.The resulting diversification of supplies,coupled with requisite economic incentivesfor lower-carbon intensity fuels, meansfuture growth rates may exceed historicallevels of 2.9% pa, thereby contractingthe lifetime of known reserves and orincreasing the costs for projected new gassupplies which may be more expensiveto extract. Switching from coal to gas forpower generation must therefore be viewedas a temporary measure which reducesshort- and medium-term emissions, yet isconsistent with possible carbon capture andstorage in the longer term and the overallcarbon budget for 400ppm stabilization.
Essential KeyMeasures for These
Expectations to be
Realized• The world’s limited natural gas
resources must be used wisely in orderto maximize carbon dioxide savingswhile avoiding CH4 emissions and widerenvironmental impacts
• Investments in natural gas infrastructure
are most important in the short term,whether pipeline or LNG, to reducethe take-up of coal, allow sourcediversification, and alleviate securityof supply concerns
• For imported gas to compete withdomestic coal, the full external costsof coal use must be internalized,together with a strengthening of carbonmarkets and/or other fiscal mechanismswhich provide compelling economicincentives for fuel switching. Developing
country markets will need to ensurethat such measures do not cut acrossdevelopment goals
• High investment levels with longlead times require confidence andassurance in the market and regulatoryenvironment. Coordination betweenall stakeholders is critical and offersa role for regulators and governmentsto support investment
34 BP Statistical Review, 2006.
Topic Paper 7:
Natural Gas (continued)

8/8/2019 Climate Solution Web
http://slidepdf.com/reader/full/climate-solution-web 45/96
P
ar t 1
–
K E
Y T HE ME S A ND T E C HN
OL O GI E S
C l i m a t e S ol u t i on s :
T h e WWF V i s i onf or 2 0 5 0
S h or t T o pi c P a p e r s
17
©
W W F , w w w . J
S G r o v e . c o m

8/8/2019 Climate Solution Web
http://slidepdf.com/reader/full/climate-solution-web 46/96

8/8/2019 Climate Solution Web
http://slidepdf.com/reader/full/climate-solution-web 47/96
P
ar t 1
–
K E
Y T HE ME S A ND T E C HN
OL O GI E S
C l i m a t e S ol u t i on s :
T h e WWF V i s i onf or 2 0 5 0
S h or t T o pi c P a p e r s
19
ChallengesThere are, however, a wide range of issuesthat must be dealt with before CCS can beconsidered a mature and reliable part of thesolution. These include:
Proof of Efficacy
Carbon capture and storage of emissions fromcoal-fired power stations is still in its infancyand as such needs to be shown to be effectiveat commercial scales.
Storage
There are a range of potential storage sites,each with its own challenges. A detailedmapping of storage capacity in key countriesis needed. According to the IPCC39, suf ficientstorage capacity of at least 1,700Gt carbondioxide is available on a global scale, almostall of it from either saline aquifers or depletedor ageing oil/gas fields.
WWF believes that due to a range of factors,the ocean and the marine environment are
not a safe place to store carbon. Widespreaddissolution of carbon dioxide will furtherreduce the pH-value in oceans and contributeto acidification and additional stress to theglobal marine environment. Also, atmosphericgassing out of carbon dioxide is projectedto be in the range of 30-80% in open oceaninjection depths of 800-3,000m within aperiod of 500 years40. Globally, ten geologicalcarbon storage sites are already being used,with many more planned.
PermanenceAs regards the most important question of permanence of stored carbon, the IPCC states:“Observations from engineered and natural
analogues as well as models suggest that the
fraction retained in appropriately selected and
managed geological reservoirs is very likely
to exceed 99% over 100 years and is likely to
exceed 99% over 1000 years”41.
In any case, a sound regulatory frameworkis needed in all countries seeking to useCCS or individual components of it. Thisshould include as a minimum an independentand consensual site selection process forsafe storage and provision for long-termmonitoring, immediate preparedness for fixingleakages, and a liability regime.
Biodiversity Impacts
As with all large-scale technologies, andin particular with storing carbon dioxide
underground in geological layers, anindependent environmental impact assessmentneeds to be undertaken and made available tostakeholders. In the case of saline aquifers,acidification of drinking water and any contactwith freshwater resources above ground needto be carefully avoided.
Full Energy Balance
However, even if storage works safely, CCSis not 100% fossil free as there is an energy“penalty” of 10-40% resulting mainly from the
carbon capture process which is rather energy-intensive. This in turn contributes to increasedpower generation costs of CCS plants of upto 100% (4-10 US cents/kWh for coal and gastechnologies). These additional costs placeCCS on the same level as current global windpower production costs42.
The case for CCS is not made in order toprolong the life of fossil fuels, which currentlyprovide more than two-thirds of global energy.Even in highly ambitious scenarios whichcut global energy demand quite substantially
compared to any business-as-usual projection,the world’s energy demand will still growby 50% or more by 2100. It is likely that theinertia and pressure will persist for fossil fuelsto continue to supply a major share of theincreased demand43,44. Therefore, as the WWFClimate Solutions Model demonstrates, CCScould allow fossil fuels to play a significantrole in future energy production, with verymuch lower emissions.
See topic paper 20 for inputs to model.
39 IPCC, 2005: CCS, summary for policy makers; p. 31.
40 IPCC; as above, p. 35.
41 IPCC; as above, p. 13.
42 IPCC, as above ; p. 9.
43 C Azar et al. (2006) CCS from fossil fuels and biomass, in: Climatic Change 74:47-79.
44 M Hoogwwijk & N Hoehne (2005) Comparison of scenarios for keeping temperature below 2 degree; briefing paper for WWF.

8/8/2019 Climate Solution Web
http://slidepdf.com/reader/full/climate-solution-web 48/96
2 0
SignificanceNuclear fission, the conventional means forgenerating nuclear power, remains amongthe most controversial and contestedsources of energy. In the past 50 years,nuclear energy has risen to generate16% of global electricity (roughly 6.5%of world primary energy consumption)from nearly 450 reactors in 30 countries,including Europe, Asia, and the UnitedStates. The International Energy Agency(IEA) recently projected a large growth
of nuclear by 203045. However, withinOECD countries, a decline of net nuclearcapacity of about 3% is projected by 2030in the “business-as-usual scenario” or anincrease of about 20% until 2030 in the“alternative” scenario”46. In China, growthin nuclear capacity from currently 6GWto 31-50GW nuclear capacity is predictedby 203047. But nuclear may still onlycontribute 3-6% of all electricity generatedin China by 2030. In order to save 1Gtcarbon emissions, displacing 770GW of
fossil fuel energy, approximately 1,200 newreactors of conventional capacity wouldneed to be built.
Public and political support for nuclearenergy, which in many western countrieshas waned in recent years, is seeing someresurgence as concerns over climate changeand energy supply security intensify. Inmany OECD countries, a powerful lobbyis invoking nuclear’s claim to be a “low orno-carbon” fuel as a basis for promoting anew generation of reactors. While nuclear
energy is unquestionably low-carbon, thereal debate is whether other concerns oversafety, public acceptability, and particularlycost militate in favour of pursuingalternative technologies for controllingcarbon emissions, and what the trade-offsamong those options may be.
Security of supply arguments are usedto favour nuclear in particular whereexpensive low-carbon natural gas isimported from countries that are seen byothers as less reliable geo-politically inthe mid and long term. However, nuclearenthusiasms may cool when consideringthe delays affecting the only reactorcurrently under construction in WesternEurope. Following the go-ahead from theFinnish Parliament in 2002, the 1,600MWreactor is now scheduled to start electricitygeneration two years late, in early 2011.
This kind of time and cost overrun hasa severe effect of the competitiveness of capital-intensive nuclear power plants.
WWF has on record long opposed nuclearpower on environmental grounds (seeCaring for the Earth, 1990). However,in developing the analysis for its 2050Energy Vision, all available technologicaloptions were weighed without regardto prior positioning, and trackedby environmental impacts and risk,
implementability, social acceptability,and cost. Of some 23 different low-carbonenergy technologies, nuclear fared poorestfor a variety of factors, in part for safetyand nuclear proliferation issues and thesocial acceptability concerns they imply– but also because of the opportunity costsof significant shift of capital and energycontracts to nuclear.
ChallengesBriefly summarizing the analysis: the chief environmental concern remains nuclearenergy’s generation of radioactive wastesthat stay dangerous for up to 25,000years and which must be contained andactively managed. Related safety concernsinclude radiotoxic emissions from fuelmining and processing, transport, routinereleases during use, and the prospect of leaks in accidents, or in potential attackson facilities. It is noteworthy that these
concerns, at least in situations short of aChernobyl-type situation, sit more squarelyin the realm of human health than as athreat to biodiversity.
Implementability faces obstacles relatingboth to the long build-time and regulatorydelays that have led to 20 years elapsingfrom the start of planning to operation.For instance, since 2000, China, Russia,and Ukraine have announced plans tobuild 32, 40, and 12 reactors respectivelyby 2020. Of this total of 84 reactors, only
nine have started construction49. Build-timeoverruns have been common, and thoughimproved nuclear designs could speedimplementation, unanticipated problems ordelays seem equally possible. In the UnitedStates, 51 repeated shutdowns for a year orlonger led to power shortages and soaringcosts. Implementability will also faceemerging issues related to new concernsover terrorism and geopolitical stability,and any significant shift to developing-country deployment would require
regulatory infrastructure, capacity-building,and development of supporting industry.
Topic Paper 9:
Nuclear Energy
45 Despite some regional differences, business-as-usual scenarios of the IEA project an increase of nuclear capacity toabout 416GW by the year 2030 compared to 364GW today. The “alternative” scenario forecasts an even bigger growth
to 519GW (IEA, 2006: World Energy Outlook, Paris).
46 IEA 2006, as above.
47 IEA 2006, as above.
49 “Gerd Rosenkranz, “Deutsche Umwelthilfe”, 2006.

8/8/2019 Climate Solution Web
http://slidepdf.com/reader/full/climate-solution-web 49/96
P
ar t 1
–
K E
Y T HE ME S A ND T E C HN
OL O GI E S
C l i m a t e S ol u t i on s :
T h e WWF V i s i onf or 2 0 5 0
S h or t T o pi c P a p e r s
21
Public acceptability refl
ects many of theforegoing concerns, but varies significantlyby country. In the United States and in muchof Europe, public opposition is such thatnew plants have become nearly impossibleto commission. (In the USA, the last licencefor a new nuclear plant was issued in 1973.)But even within Europe, there is considerablediversity on this point. France, for example,generates 75% of its electricity from nuclearenergy, selling excess power off its grid toneighbouring countries that will not hostnuclear plants themselves. And critically,
countries such as China, with the greatestlikelihood of undertaking a major shift tonuclear power, may face the least oppositionamong their publics.
Economically, nuclear energy is dif ficult to“cost” for a number of reasons. Historicallyit has been heavily subsidized, through directgovernment support and by limitations onliability. In direct terms nuclear has receivedhigh if not the highest rate of subsidy of allfuels within many OECD countries. Between
1947 and 1999 in the USA alone, nuclearreceived US$145bn – or 96% of all energysubsidies. This compares with subsidies forsolar of US$4.5bn and wind US$1.2bn between1975 and 199950. In the former EU-15, nuclearsubsidies still amount to €2bn per year51.
Future costs – decommissioning andmanagement of wastes – are not factoredinto current pricing and appear likely toincrease substantially over time. The costof any accidents will be large but borne bygovernments (in the USA, about US$600bn
for a single major accident). (One studysuggested that a successful terrorist attack ona reactor near New York could cause up toUS$2 trillion damage, in addition to 44,000short-term and 500,000 long-term deaths52.)
These market distortions make it dif fi
cultto price nuclear energy in comparison withthe full life-cycle cost of other carbon-saving energy options. But even analysis by“nuclear-friendly” institutions estimates theglobal average capital costs for nuclear atabout US$2m per installed MW, or roughlytwice as much as wind power and five timesmore expensive than natural gas combinedcycle53. Nuclear energy is suf ficiently capitalintensive that a massive build-up couldstarve other renewable-energy options fromreceiving necessary funding, leading to a
higher overall carbon intensity than a robustmix of renewable technology options thatdoes not include nuclear. Whether this canchange with advances in design construction– e.g., so-called “pebble-bed” reactors orwith recently heralded progress on fusion (asopposed to fission) reactors – remains to beseen. (Fusion is not expected to be availablefor another 30 years, although this has beensaid for three decades.) But among currentlydeployed commercial technologies, scalingup nuclear power is not an effective course
to avert carbon emissions.
50 Renewable Energy Policy Project (REPP), July 2000.
51 EEA Technical Report 34, Energy Subsidies in the European Union, 2004.
52 “Chernobyl on the Hudson?: The Health and Economic Impacts of a Terrorist Attack at the Indian Point Nuclear Plant”,
Union of Concerned Scientists, 2004.
53 IEA, 2003: World Energy Investment Outlook (Paris) at p. 349.

8/8/2019 Climate Solution Web
http://slidepdf.com/reader/full/climate-solution-web 50/96
2 2
SignificanceThe world’s poor are victims at both endsof the energy story. They have little accessto energy themselves, but they bear anundeservedly large share of the impact of others’ access. Halving poverty by 2015 isa Millennium Development Goal (MDG).Access to energy is key. At the same time,the threat of climate change brings hugeextra pressures onto the world’s poor,especially where their health is alreadycompromised by HIV/AIDS. A report
by Christian Aid54 warns that climatechange threatens the development goals of billions of the world’s poorest people, forexample by increasing the prevalence andintensity of malaria and other diseases inAfrica, inducing persistent drought and itsconnections to conflict in Kenya, or floodsand sea-level rise in Bangladesh.
ChallengesAffordable, adequate, and reliablemodern energy supplies are still beyondthe reach of some two billion people.At the same time, current methods of producing, distributing, and using energyhave environmental and health impactsthat increasingly endanger the welfare of communities and biodiversity worldwide,while problems of oil and gas supplysecurity are linked to increasing regionalpolitical instability, raising further risksfor the poor.
Current electricity supply policies and
energy development paradigms have failedto address these energy-poverty issuesadequately. Analyses repeatedly return tothe same conclusions. A new approach isneeded to energy services for the rural poor
based, in most developing countries, ondecentralized, renewable, locally managedenergy generation and distribution systemswhich are demand-led and affordable.(China, however, is succeeding with grid-connected electricity supply for rural areas,heavily subsidized by urban consumers).
The Christian Aid report concludes thata renewable energy revolution can powerclean, sustainable development. However,it says, great care is needed with the optionschosen. Another report, by WWF with
support from Oxfam55, shows in case studiesfrom Zambia and Kenya how hydropowercan deliver maximum benefits with minimalnegative impact. But it also highlightsthe legacy of environmental and socialproblems linked to existing hydropowerand therefore urges a cautious approach.
All studies emphasize the need for thedeveloped world to commit to a veryexplicit contribution of major cuts in itsown emissions, and major investments forthe developing world to help their transitionto a sustainable energy future. Very basicenergy needs can be met technicallywithout adding significantly to emissionlevels. Professor Robert Socolow56 assertsthat energy services to meet basic humanneeds (electricity and cooking fuel) for2.6 billion people would only makea minimal relative impact on globalemissions, even if these services weresupplied at current rates of carbon intensity.
The WWF Climate Solutions Vision
is based on the IPCC’s A1B scenario,postulating a convergence of “rich” and“poor” countries so that these distinctionseventually dissolve. It anticipates athreefold increase in the average provisionof energy services over the period to 2050.
In practice this means that on averagecitizens in 2050 would consume energyservices equivalent to the average inthe OECD today. The key difference,however, is that approximately half of the energy is required for the equivalentlevel of energy service.
Global cooperation – vital for meetingthese challenges – depends on spreadingthe burden of change in an equitableway. The rich must allow for majorgrowth in energy provision for the poor,
while proposing a decisive reductions inconsumption patterns in the developedworld, and appropriate modificationof energy development patterns in theemerging economies57.
Topic Paper 10:
Poverty and Energy
54 The Climate of Poverty: Facts, Fears and Hope. Christian Aid, 2007, at:http://www.christian-aid.org.uk/indepth/605caweek/index.htm
55 Meeting Africa’s Energy Needs – the Costs and Benefits of Hydropower. WWF 2006, at:
http://assets.panda.org/downloads/africahydropowerreport2006.pdf
56 Prof Robert Socolow: pers. comm.
57 One model for such an approach is proposed in the concept of ”Greenhouse Development Rights”
(Athanasiou, T, Kartha, S & Baer, P. (2006) “Greenhouse Development Rights: An approach to the global
climate regime that takes climate protection seriously while also preserving the right to human development”).

8/8/2019 Climate Solution Web
http://slidepdf.com/reader/full/climate-solution-web 51/96
C l i m a t e S ol u t i on s :
T h e WWF V i s i onf or 2 0 5 0
S h or t T o pi c P a p e r s
23
P
ar t 2
–
R E
GI ONA L C A S E S T UD I E S
Part 2RegionalCase
Studies
©
W W F - C a n o n ,
M a u r i R A U T
K A R I

8/8/2019 Climate Solution Web
http://slidepdf.com/reader/full/climate-solution-web 52/96
2 4
The coming half-century will seeunprecedented economic developmentand therefore more demands on limitedresources. The process of convergencebetween the standards of living of peoplein developed countries today and thosein countries emerging from poverty willinvolve all people and all countries inprotecting the climate.
The following eight regional case studiesillustrate the diversity of challengesinvolved. The eight examples span the full
spectrum of the United Nation’s humandevelopment index. They include countriesrich in energy supplies, like Russia, andothers almost entirely dependent onimported energy, such as Japan. Some of the heaviest energy users like the USA arecontrasted with the least energy intensiveeconomies and populations such as Chinaand India. Brazil faces the task of tacklingmajor land-use change emissions, buthas taken a major international lead onbiofuels, while Japan shows leadership in
energy ef fi
ciency driven by energy securityconstraints, and the European Unionillustrates the progress which can be madein regional collaboration. China providesgreat scope to leap-frog into high-tech,well planned, low-emission cities,
while South Africa can use its economicdominance to stimulate the developmentof new technologies and distributedrenewable energy generation throughoutthe African continent.
These cases illustrate how every countryhas leadership potential – regardless of itslevel of development, energy resources,or technology prowess – in driving thetransition to a prosperous low-carbon future.
For reference, key comparative indices
are tabulated below (data from CAIT58
).Note that the last year for which completecomparative data was available for all of countries was 2000; this is shown in blue.Current data, where available, are shown asan additional box at the top of the column.
Note: Emissions can be described in termsof carbon dioxide (CO
2) or carbon (C).
Emissions are measured in metric tonnes.The atomic weight of carbon is 12, and themolecular weight of carbon dioxide is 44,
so 1.00 tonne of carbon dioxide contains0.27 tonnes of carbon.
58 Climate Analysis Indicators Tool Version 4 (2007). World Resources Institute online data-base.http://cait.wri.org/ (accessed March 2007).
Part 2:
Regional Case Studies
Most
Recent
Available
Data (CAIT)
[MtCO2] Most
recent
available
data (CAIT)
[gCO2 /
kWh]
Most
recent
available
data (CAIT)
[tCO2 /Mill
Intl $]
Most
recent
available
data (CAIT)
[Intl $/
person]
Most
recent
available
data (CAIT)
[tons
CO2 /
person]
Most
recent
available
data (CAIT)
[Mt
CO2]
USA 2000 -402.8 2003 560.3 2003 561.7 2003 35 373 2003 19.9 2003 5752.3
Russian
Federation
2000 54.2 2003 553 2003 1282.7 2003 8524 2003 10.9 2003 1526.8
Brazil 2000 1372.1 2003 60.2 2003 250.7 2003 7306 2003 1.8 2003 306.7
China 2000 -47.3 2003 706.9 2003 702.9 2003 4966 2003 3.5 2003 3719.5
India 2000 -40.3 2003 813.4 2003 395 2003 2731 2003 1.1 2003 1051.1
South
Africa
2000 1.7 2003 772.9 2003 830.1 2003 10 055 2003 8.3 2003 318.3
EU 2000 -20.9 2003 385.2 2003 369.1 2003 23 770 2003 8.8 2003 3889.2
Japan 2000 4.4 2003 320.1 2003 375.4 2003 26 270 2003 9.9 2003 1201.4

8/8/2019 Climate Solution Web
http://slidepdf.com/reader/full/climate-solution-web 53/96
C l i m a t e S ol u t i on s :
T h e WWF V i s i onf or 2 0 5 0
S h or t T o pi c P a p e r s
25
P
ar t 2
–
R E
GI ONA L C A S E S T UD I E S

8/8/2019 Climate Solution Web
http://slidepdf.com/reader/full/climate-solution-web 54/96
2 6
Part 2:
Regional Case Studies

8/8/2019 Climate Solution Web
http://slidepdf.com/reader/full/climate-solution-web 55/96

8/8/2019 Climate Solution Web
http://slidepdf.com/reader/full/climate-solution-web 56/96
2 8
The Significanceof Japan
Japan is the world’s third largest economyand fourth largest emitter of greenhousegases59. It is a major manufacturerdomestically and internationally andtherefore a significant investor anddisseminator of high-technology products.Japan is also a significant economy withinAsia and has the ability to assert regionalinfluence and leadership. The flip-side is
that there are many regional tensions overfossil-fuel assets which would be alleviatedby an ongoing reduction in their use.
Energy in JapanDue to its scarce resources, Japan relieson imports for more than 95% of primaryenergy supply and is the world’s secondlargest importer of oil. In order to attainenergy security, Japan has endeavoured toimprove energy ef ficiency and diversifyenergy sources. Japan’s of ficial dream is
to create its own, nuclear, power supplyby reprocessing spent nuclear fuel and“re-using” the retrieved plutonium in fast-breeder reactors to produce more energy(plutonium). Nuclear energy has alsobecome the central pillar in the Japanesegovernment’s policy to combat climatechange. In 2006, with 55 reactors inoperation, about 30% of electricity comesfrom nuclear energy and the governmentplans to increase the share further, despitevery strong public resistance.
Energy ef ficiency is the area in whichboth Japanese government and industrytake most pride. The two oil crises in the
1970s made Japan place extra emphasis onimproving energy ef ficiency. An EnergyConservation Law has been playing amajor role in this improvement. Amongthe measures implemented under the law,the “Top Runner Standard” is considereda unique and effective measure. Thegovernment sets ef ficiency targets onidentified product categories, based onconsultation with industry and experts.Those targets are set in such a way that allthe products in the category achieve at leastthe same level of ef ficiency as the most
ef ficient product at the time.
The government is determined to keepJapan’s status as the “front-runner” inenergy ef ficiency. The New NationalEnergy Strategy, published in 2006, setsa target to increase the country’s energyef ficiency by at least 30% by 2030.
In the meantime, renewable energies havebeen largely dismissed as unreliable,and R&D budgets for renewables areminimal compared to other countriesor to the spending on domestic nucleardevelopment. The government introduceda Japanese version of the RenewablePortfolio Standards (RPS) but the targetis negligibly low: 1.35% of the totalelectricity sold by power companies by2010, revised to 1.6% by 2014. Windpower has been gaining competitivenessrecently but power companies have set aceiling on buying wind power owing to itsintermittency, and growth of wind energyin Japan is therefore unlikely. Even the
number of solar rooftops, for which Japanhad long held world No.1 status, has beentaken over by Germany with its “Feed-inLaw” in 2005.
Japan’s EmissionsProfileJapan’s base year emissions60 were1,261.4MtCO
2e. By 2004, its GHG
emissions had increased to 1,355.2Mtor 7.4 % above the base year. Of this,carbon dioxide emissions were 1,285.8Mt,or 12.4% above the 1990 level. Carbondioxide emissions per capita have alsoincreased from 9.26t per capita to 10.07tper capita – up 8.8% since 1990.
Of carbon dioxide emissions, thelargest share comes from the industry(30.3% [36.2%]61) and energy (29.7%[6.3%]) sectors. These are followedby the transport (19.8% [20.3%]),commercial (8.2% [17.6%]), andresidential (5% [13.0%]) sectors62.
Since 1990, the commercial sector hasshown the largest growth rate (26.9%),followed by transport (20.6%), energy(20%), and residential (5%). The industrysector has decreased its emissions by 0.1%but it should be noted that the Japaneseeconomy was in recession in the 1990s.
According to Kiko Network’s survey andanalysis of emissions from factories/sitesregulated by the Energy Conservation Law,the 50 biggest factories emit 20% of thetotal carbon dioxide emissions in Japan.Some big factories (including cement,petroleum, chemical) did not disclose theirdata, but it can be assumed that the 200biggest factories emit about half of the total
emissions of Japan (Kiko Network Report,July 2005).
Topic Paper 11:
Japan
59 Handbook of Energy & Economic Statistics in Japan, 2006, by Energy Data and Modelling Center.
60 1990 for CO2, CH4, and N2O, and 1995 for HFCs, PFCs, and SF6
61 Figures in square brackets refer to “allocated” emiss ion shares, which means the share of indirect emissions.
Indirect emissions are the proportion of emissions from power generation by electric utilities allocated to the
final demand sector in accordance with electricity consumption.
62 “Greenhouse Emissions Data of Japan” (2004), by Greenhouse Gas Inventory Office of Japan,
http://www-gio.nies.go.jp/aboutghg/nir/nir-e.html

8/8/2019 Climate Solution Web
http://slidepdf.com/reader/full/climate-solution-web 57/96
C l i m a t e S ol u t i on s :
T h e WWF V i s i onf or 2 0 5 0
S h or t T o pi c P a p e r s
29
P
ar t 2
–
R E
GI ONA L C A S E S T UD I E S
Potential for Leadership:Catalyst for Asia’s
Development Towards
Clean Energy Future?Japan stands in a very important position inthe international context of climate policy.First, it is a major industrialized country and,as the host of the Kyoto conference, it hasa special commitment to the treaty. Second,it lies in Asia, the region where the largestemissions will arise in future. Japan has both
opportunities and dif ficulties in the region.
Japan could extend its leadership in thefollowing areas to help move Asia towardsa clean energy future, which will enablethe country to take the lead in internationalclimate negotiations for a future frameworkfor preventing dangerous climate change.
Energy Efficiency
This is an important area where Japan couldmake a major contribution in the development
of a clean energy future for Asia. For example,there is great potential for the Japanese steelindustry and coal power companies to exporttheir energy-ef ficient technology to China,where they claim that GHG emissions couldbe reduced much more cost-effectively thanin Japan.
Public Transportation
In spite of its small land surface, Japan hasdeveloped a relatively advanced transportationsystem, especially around large cities with
large populations. Energy per unit of GDPin the transport sector is relatively smallcompared to other major industrializedcountries, and this could be a model for Asia’spublic transportation development.
Automobile TechnologyAs shown with hybrid engine technology,Japan is taking the lead in developing fuel-ef ficient vehicles. This technology could betransferred to other Asian countries both forpreventing air pollution and reducing carbondioxide emissions.
Japan’s leadership in technology developmentprovides other excellent opportunities forclimate change leadership both regionally andglobally. The country’s existing manufacturingbase also provides a basis for technology
dissemination; for example, in energyef ficiency of household appliances. Keyadditional leadership areas could include:
• Directing domestic and internationalcapital investment towards climate-friendlysolutions
• Using domestic and international buyingpower in manufactured goods, timber,and food products to support moresustainable production processes, includingenergy issues
• Development and deployment of electricand hydrogen vehicles
• Hydrogen technology and distribution;
• PV industry development
• Energy ef ficiency in transport, buildings,and industry
• Managing the transfer of best availableenergy-ef ficient technology to Japan’strading partners so as to help achievelow-emission goals
• Carbon capture and storage demonstration
• Greater investment in ocean powertechnology development
• Energy storage

8/8/2019 Climate Solution Web
http://slidepdf.com/reader/full/climate-solution-web 58/96

8/8/2019 Climate Solution Web
http://slidepdf.com/reader/full/climate-solution-web 59/96
C l i m a t e S ol u t i on s :
T h e WWF V i s i onf or 2 0 5 0
S h or t T o pi c P a p e r s
31
P
ar t 2
–
R E
GI ONA L C A S E S T UD I E S
The areas where the USA can show defi
nitiveleadership and fundamentally alter thetrajectory of future emissions are numerousand include:
• Directing domestic and internationalcapital investment towards climate-friendlysolutions
• Using domestic and international buyingpower in manufactured goods, timber,and food products to support moresustainable production processes, includingenergy issues
• Transition of the transport sector to publictransport, and electric and hydrogen vehicles
• Hydrogen technology and distribution
• Renewable energy industry development
• Energy ef ficiency in transport, buildings,and industry
• Ensuring that, where industry is transferred tolower labour-cost markets, the change is usedalso to achieve multiple low-emission goals

8/8/2019 Climate Solution Web
http://slidepdf.com/reader/full/climate-solution-web 60/96
3 2
The Significanceof South AfricaSouth Africa is important for three reasons:
1 A high-growth nation leading regionaleconomic development
2 High dependence on coal, and anemissions-intensive economy
3 A developing country with significantexposure to climate change impacts
South Africa is the economic powerhouseof sub-Saharan Africa, with a GDPcomprising around 25% of the entirecontinent’s GDP. Government policy aimsto raise economic growth from 5% to 6%,halving poverty and unemployment by2014, using strong economic growth toeradicate poverty.
Climate change – affecting disease vectors,drought, flooding and therefore foodsecurity – represents a real threat to thewell-being of a population already widely
affected by HIV/AIDS.
South Africa therefore has an importantrole in meeting economic and populationdevelopment goals while taking appropriateaction on climate change.
Energy in South Africa
“South Africa has several features that
it shares with countries such as India
and China: it is poor but growing; it
faces rising demand for energy and in
particular electricity; and it is naturally
endowed with large coal supplies that
dominate its power generation mix”
(Bradley et al., WRI 2005).
The country has the world’s seventhlargest amount of recoverable coal reserves(54.6 billion short tons), approximately 5%of the world total64. Seventy per cent of allSouth Africa’s energy [DME, 2005b], and93% of its electricity, is produced from coal(NER 2004).
The South African economy is
comparatively energy-intensive65. Energycomprises about 15% of South Africa’sGDP, creating employment for about250,000 people (the peak demand on theintegrated system totals 32GW).
The economy is dominated by large-scale, energy-intensive primary mineralbeneficiation and mining industries usingenergy for direct thermal processes atrelatively low cost, and absorbing themajority of available investment.
South Africa also has an active nuclearindustry with expansion plans using eitherPebble Bed Modular Reactor (PBMR)technology (already being pursued) or newpressurized water reactors (PWRs) such asthe existing Koeberg station.
Commercial supply of energy tohouseholds is an ongoing challenge. Sofar, only an estimated seven million of South Africa’s 11 million households haveelectricity, and 80% of schools and manyclinics still lack supply (US DOE EIA,
2003). Household consumption representssome 17% of the country’s net use; 50% of this is obtained from fuel-wood, primarilyin rural areas, with the rest from coal(18%), illuminating paraf fin (7%), and asmall amount from liquid petroleum gas.
Topic Paper 13:
Republic of South Africa
0
2000
4000
6000
8000
10000
Sub-Saharan
Africa
South Africa
G D P
U S
$ p e r p e r s o n
Figure 1. Comparison of per capita GDP in South Africa, and the average
for sub-Saharan Africa63.
63 Citation: Climate Analysis Indicators Tool (CAIT) Version 4.0. (Washington, DC: World Resources Institute, 2007.)
64 South Africa Country Analysis Brief US DOE EIA 2005.
65 Total primary energy supply of 11.7MJ per US$ of GDP on a purchasing power parity basis, compared to 7.9MJ/$
for Asia and 6.7MJ/$ for Latin America. (Winkler.H: Energy for Sustainable Development, Volume XI, No.1, 2007).
8/8/2019 Climate Solution Web
http://slidepdf.com/reader/full/climate-solution-web 61/96
C l i m a t e S ol u t i on s :
T h e WWF V i s i onf or 2 0 5 0
S h or t T o pi c P a p e r s
33
P
ar t 2
–
R E
GI ONA L C A S E S T UD I E S
GHG Emissions Profileof South AfricaSouth Africa contributes only 1.4% of annualglobal carbon dioxide emissions, but percapita emissions are high for a developingcountry66. Its position half way betweenrich and poor country status highlights itsimportance as a trend-setter for the continent.
There is no consolidated projection of South Africa’s future GHG emissions, butwork in progress will probably confirm
the basic pattern, with the largest share of future emissions continuing to come frombulk energy supply (45% of the total). Thishighlights the opportunities for emissionsabatement in Africa; currently 80% of GHGemissions come from energy supply and use.
South African Leadership
on Development, Energy
and ClimateLike most developing countries, South
Africa faces a double bind in relation toclimate change – development priorities limitits ability to take on mitigation reductioncommitments, but the country is alsovulnerable to the impacts of climate changeand has an interest in urgent action.
Politically, South Africa has taken a proactiverole in seeking to bridge the gap betweendeveloped and developing countries[5].South Africa’s National Climate ChangeResponse Strategy is centred around
sustainable development[10]. Approachesto mitigation that take local sustainabledevelopment benefits seriously are likelyto work best (from job creation and povertyalleviation to reducing local air pollution).Its regional geopolitical leadership providesthe ability to expand and disseminatesuccessful models for development, energy,and climate protection.
The emissions profi
le makes clear that thecore challenge to achieve low emissionsis to diversify energy supply to reduce thedependence on coal. “Securing supply throughdiversity” has been a major energy policygoal since 1998[6]. Important specificopportunities include:
• Replacement of old electricity generationcapacity with diversified renewablesand gas. Just over 1,000MW per year of additional capacity is required for the next20 years. The “baseline” plan is for six new
coal-fired power stations of c3,600MWeach, but four of the six could be replacedby other options: renewables, energyef ficiency, imported gas, or sustainablehydroelectricity.
• Transitioning from non-commercial fuelto clean commercial fuels. The currentdependence of many households on woodfuels is likely to change with developmentand urbanization. This provides anopportunity to engage supplies of low-emission power and zero-emission fuels
such as hydrogen, and also to implementdiversified/decentralized approaches to theprovision of energy.
• Energy ef ficiency has the greatestnear-term potential. The South Africangovernment has a target of energy-ef ficiency improvement of 12% by 2014[8].Industry is committed to a reduced energyconsumption of 15% by 2015.
• Solar Thermal Leadership. This isSouth Africa’s major solar radiationresource which means that the countrycould become a location for globalleadership in thermal electric (STE)technologies. Some studies show significantgrowth potential of STE in South Africa,assuming learning rates[7] in keeping withthe ETF model. Large-scale STE with localmanufacturing capacity would be for thedomestic grid, but could also be used toexport to neighbouring countries.
66 CO2 emissions of 6.7 tonnes per capita, comparable to the OECD average of about 11tCO2/cap., far higher than the non-OECDaverage of 1.7tCO2/cap. (Winkler.H Energy for Sustainable Development, Volume XI, No.1, 2007).

8/8/2019 Climate Solution Web
http://slidepdf.com/reader/full/climate-solution-web 62/96
3 4
• Carbon capture and storage (CCS).Cleaning up the base-load of coal willrequire CCS, if it is cost-effective, andif social and environmental concernscan be resolved. South Africa alsohas an active industry in the area of the coal-to-liquids (CTL) – a veryemissions-intensive technology. Mostof these emissions could be avoidedby the use of CCS. However, it shouldbe noted that the use of the resultingfuels, say in the transport sector,would have similar emission-intensity
to oil-derived fuels.
• Biofuels are of increasing interest.The potential is not as large as inBrazil, owing to constraints on arableland, water, and competition for foodproduction. But biodiesel to displaceoil-based diesel is an option. Up to 35PJis possible by 2025 without displacingfood production[7].
References1. Van der Merwe, M R & Scholes, R J.
(1998) South African Greenhouse GasEmissions Inventory for the years 1990and 1994, (National Committee onClimate Change, 1998).
2. RSA (Republic of South Africa),South Africa: Initial NationalCommunication under the UnitedNations Framework Convention onClimate Change. Submitted at COP-9.(Pretoria, 2004.) unfccc.int/resource/
docs/natc/zafnc01.pdf
3. Winkler, H, Spalding-Fecher, R &Tyani, L. (2001) What could potentialcarbon emissions allocation schemesand targets mean for South Africa?(Energy & Development ResearchCentre, University of Cape Town,2001); WRI (World ResourcesInstitute), Climate Analysis IndicatorsTool (CAIT), version 3.0. (WashingtonDC, 2005.) http://cait.wri.org/
4. IEA (International Energy Agency),Key World Energy Statistics from theIEA. (IEA, Paris, 2004.)
5. Van Schalkwyk, M. (2006) Ministerialindaba on climate action. Chair’sSummary. Kapama Lodge, South Africa,17 to 21 June, 2006. (Department of Environmental Affairs and Tourism,2006.) http://www.environment.gov.za/HotIssues/2006/Climate_Change_Indaba/cc_indaba.html.
6. DME (Department of Minerals and
Energy), White Paper on Energy Policyfor South Africa. (DME, Pretoria,1998.) http://www.dme.gov.za
7. Winkler, H. (Ed.) (2006) Energypolicies for sustainable developmentin South Africa: Options for thefuture. ISBN: 0-620-36294-4. (EnergyResearch Centre, Cape Town, 2006.)
8. DME (Department of Minerals andEnergy), Draft energy ef ficiencystrategy of the Republic of South Africa,April 2004. (DME, Pretoria, 2004.)www.dme.gov.za/energy/pdf/energy_ef ficiency_strategy.pdf
9. Mwakasonda, S & Winkler, H. (2005)
Carbon capture and storage in SouthAfrica. Chapter 6 in: Growing in thegreenhouse: Protecting the climate byputting development first, R Bradley,K Baumert & J Pershing (Eds), pp.94-109. (World Resources Institute,Washington DC, 2005.)
10. DEAT (Department of EnvironmentalAffairs and Tourism), A nationalclimate change response strategy.(Pretoria, 2004.)
11. Winkler, H. (2006) Energy policiesfor sustainable development in SouthAfrica’s residential and electricitysectors: Implications for mitigatingclimate change. PhD Thesis, Universityof Cape Town.
12. Pacala, S & Socolow, R H. (2004)Stabilization wedges: Solving theclimate problem for the next 50 yearswith current technologies. Science305:968-972.
Topic Paper 13:
Republic of South Africa (continued)

8/8/2019 Climate Solution Web
http://slidepdf.com/reader/full/climate-solution-web 63/96
C l i m a t e S ol u t i on s :
T h e WWF V i s i onf or 2 0 5 0
S h or t T o pi c P a p e r s
35
P
ar t 2
–
R E
GI ONA L C A S E S T UD I E S
©
W W F , P h i l i p p e O B E R L E

8/8/2019 Climate Solution Web
http://slidepdf.com/reader/full/climate-solution-web 64/96
3 6
The Significanceof RussiaRussia and its neighbours have historicallybeen leading industrial national andtechnology providers. In more recenttimes, Russia has become an energy “superpower” on account of its large reservesof gas and oil which have underpinnedEuropean energy consumption. Oil, gas,and metals make up two-thirds of Russia’sexport income and a quarter of GDP.Indeed, the country has very large oilreserves and production is second onlyto Saudi Arabia67. Russia finds itself asa central player in energy pipelines andinfrastructure that go both east and west.
While Russian industrial output isrebuilding after a period of recession, theoverall population is declining by about0.4% per year.
EnergyRussia is significant in terms of itsenergy exports, but it is also important torecognize its internal energy usage. Russiasits at the high end of the spectrum in termsof energy intensity. This increased less thanGDP in the 1990s, but faster during theeconomic recovery of the early 2000s. Incontrast, energy utilities have become lessef ficient in supplying energy due to lack of modernization. As a result, municipal andstate-owned sector energy ef ficiency has
not improved over the last 15 years.
Sectoral distribution of GHG emissions (inCO
2equivalent) was stable in the period
1990-2004, with energy emitting 83.0%in 1990 and 84.6% in 2004, industry 4.3%and 5.1%, agriculture 10.8% and 7.3%, andwaste 1.9% and 3.1% respectively68.
Energy for electricity and heat generationdominate primary energy use. However,with recent GDP growth at 6-7% peryear in recent years, GHG growth has
been significantly lower at about 1%69.The main contributions to GDP are: oiland gas, services and trade, and heavyindustry, so only the last component islinked to significant GHG emissions. Theseemissions are mainly determined by, firstly,electricity and heat production, whichis almost stable owing to the decliningpopulation, and, secondly, by transport,which is growing albeit relatively slowly.
Currently, energy saving, natural gas, andnuclear are considered by the governmentand private companies to be the maintools of energy development in thecoming decades, while there is very littlediscussion on future decarbonization.
Russia also has a considerable nuclearlegacy, with 31 operating power stations.Five new ones are proposed. Proposals todevelop more nuclear supply, to free upmore gas for export sale, are controversial.
EmissionsAccording to of ficial data, in 2004 RussianGHG emissions fell by one-third between1990 and 2004, while the Russian Kyotocommitment is a zero reduction from 1990levels in 2008-2012. In 1990, RussianGHG emissions were 2,960Mt CO
2-eq.
After a sharp decrease in GHG emissionscaused by economic decline in the 1990s,Russian emissions have been slowlygrowing from 2000 (1,991Mt CO
2-eq in
2000 and 2,074Mt CO2
-eq in 2004).
Per capita emission in 1990 was about 20tCO2-eq per year, falling to 14.4t CO2-eqper year in 2004.
Topic Paper 14:
Russia
67 Key World Energy Statistics, International Energy Agency, 2006. www.iea.org
68 Fourth Russian National Communication to the UNFCCC, 2006. www.unfccc.int
69 Fourth Russian National Communication to the UNFCCC, 2006. www.unfccc.int

8/8/2019 Climate Solution Web
http://slidepdf.com/reader/full/climate-solution-web 65/96
C l i m a t e S ol u t i on s :
T h e WWF V i s i onf or 2 0 5 0
S h or t T o pi c P a p e r s
37
P
ar t 2
–
R E
GI ONA L C A S E S T UD I E S
Leadership PotentialEnergy Efficiency of Economy
Energy-saving potential is up to 40% of current energy demand. Electricity productionuses low domestic natural gas prices whileselling electricity by state-regulated tariffs.Meanwhile, the metallurgy sector is tryingto reduce energy costs by installing its ownenergy generation facilities, which shouldbe much more ef ficient. In service, foodproduction, and some other sectors energy
ef fi
ciency can improve as a result of theintroduction of modern, imported technologiesand products. The subsidized prices in themunicipal energy sector present opportunitiesto get better price indicators to consumers,which would assist with reduced use andbetter ef ficiency.
Natural Gas Use
Russia has over a quarter (26.6%) of theworld gas resources70 – greater than anyother country – and about 28% of extractedRussian gas is exported. In 2004, the Russianshare in global gas export was about 22%(including export to former USSR countries).Oil and gas exports are becoming the mainsource of income for the State Budget andrepayment of Russian external debts. Hugegas resources and a well-developed system of gas pipelines guarantee a key role in the globalgas market, with a focus on export to theEU and China. This clearly provides a majoropportunity to use gas to avoid the uptake of coal in other countries. On the other hand,Russian government and state-owned energy
monopolist RAO UES Rossii have indicatedplans to increase coal use to free up more gasfor export sale. This is very controversial andwill certainly lead to considerable growth inGHG emissions71.
Biomass UseIn Russia, biomass used for energy orheat production is mainly timber waste ornon-commercial fuel-wood. The market forwood-chips is already growing rapidly inNW Russia (mainly wood granules– pellets for export to Europe). Modern andecologically sound technologies for wood andother biomass use are in use in some places.
The estimate of total wood biomass (oil tobiomass switch potential) in NW Russia isabout 400Mt CO
2 /year, including 8.8Mt.c.e
heavy oil and 5.7Mt.c.e diesel oil. This type of fuel switch in heat generation will become mosteconomically reasonable in the near future.
Strategic Use of Gas Assets
Russia can also play a significant role inunderpinning energy security in many regions,especially through the strategic use of its gasassets and pipeline infrastructure.
70 According to BP’s Statistical Review of World Energy, 2005.
71 Presentation of RAO UES Rossii Chairman, Mr Chubais, 13 February 2007,
http://www.rao-ees.ru/ru/news/speech/confer/show.cgi?prez130207abc.htm
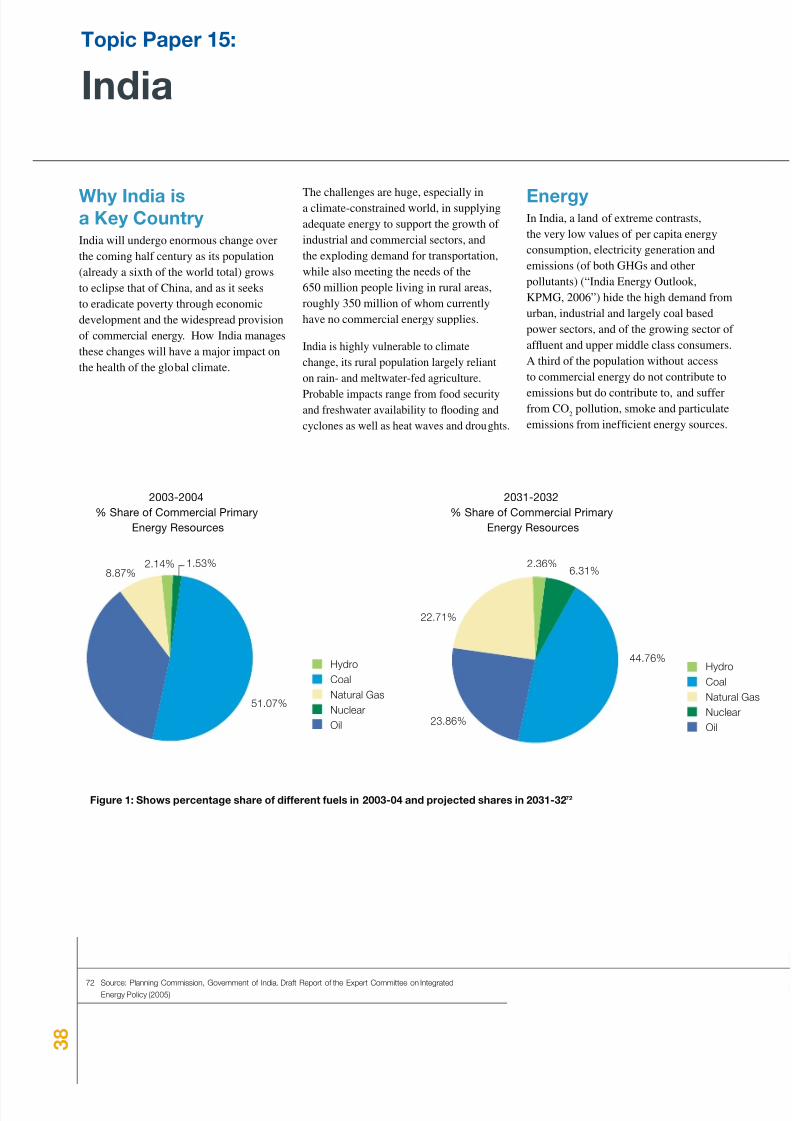
8/8/2019 Climate Solution Web
http://slidepdf.com/reader/full/climate-solution-web 66/96
3 8
Why India isa Key CountryIndia will undergo enormous change overthe coming half century as its population(already a sixth of the world total) growsto eclipse that of China, and as it seeksto eradicate poverty through economicdevelopment and the widespread provisionof commercial energy. How India managesthese changes will have a major impact onthe health of the global climate.
The challenges are huge, especially ina climate-constrained world, in supplyingadequate energy to support the growth of industrial and commercial sectors, andthe exploding demand for transportation,while also meeting the needs of the650 million people living in rural areas,roughly 350 million of whom currentlyhave no commercial energy supplies.
India is highly vulnerable to climatechange, its rural population largely relianton rain- and meltwater-fed agriculture.
Probable impacts range from food securityand freshwater availability to flooding andcyclones as well as heat waves and droughts.
EnergyIn India, a land of extreme contrasts,the very low values of per capita energyconsumption, electricity generation andemissions (of both GHGs and otherpollutants) (“India Energy Outlook,KPMG, 2006”) hide the high demand fromurban, industrial and largely coal basedpower sectors, and of the growing sector of af fluent and upper middle class consumers.A third of the population without accessto commercial energy do not contribute to
emissions but do contribute to, and sufferfrom CO
2pollution, smoke and particulate
emissions from inef ficient energy sources.
Topic Paper 15:
India
Figure 1: Shows percentage share of different fuels in 2003-04 and projected shares in 2031-3272
72 Source: Planning Commission, Government of India. Draft Report of the Expert Committee on IntegratedEnergy Policy (2005)

8/8/2019 Climate Solution Web
http://slidepdf.com/reader/full/climate-solution-web 67/96
C l i m a t e S ol u t i on s :
T h e WWF V i s i onf or 2 0 5 0
S h or t T o pi c P a p e r s
39
P
ar t 2
–
R E
GI ONA L C A S E S T UD I E S
Emissions ProfileAn assessment of the current and projectedtrends of GHG emission from India and someselected countries indicates that althoughIndian emissions grew at the rate of 4%per annum in the 1990-2000 period and areprojected to grow further to meet nationaldevelopment needs, the absolute level of GHGemissions in 2020 will still be less than 5 percent of global emissions. Per capita emissionswill still be lower than most of the developedcountries, and lower than the global average.
(Sharma73 et al , 2006)
Nevertheless, reference scenarios suggestthat total CO
2emissions in India may grow
by 280% between 1990 and 2030. Coalpower and related CO
2emissions will more
than double and overtake those of the EU by203074. Controlling the emission intensity of this growth will be an important contributionto climate protection.
73 Sharma, S., Bhattacharya, S and Garg, A. Greenhouse Gas Emissions from India: A Perspective. In Current Science, VOL. 90,NO. 3, 10 February 2006
74 IEA, 2004; World Energy Outlook, Paris, pages 415ff.

8/8/2019 Climate Solution Web
http://slidepdf.com/reader/full/climate-solution-web 68/96
4 0
LeadershipIndia has a unique opportunity to findsolutions which can meet the immediateneeds of poverty reduction, and economicand industrial growth without sacrificingthe longer term objectives of energysecurity and climate change.
• Size Matters: As one of the world’sonly two, billion-people economies– and a vibrant democracy – India has aninfluential status in International forums.
• Commitment: India’s successfulengagement within the CleanDevelopment Mechanism (CDM) showsits willingness to work with the globalcommunity to tackle the problem of Climate Change. This engagement alsobrings with it responsibility and a highdegree of interest towards ensuringthat there is no gap between the twocommitment periods of the KyotoProtocol. There is an increasing interestwithin the Industry with regards to the
Carbon Markets and opportunities toengage in it.
• Decentralised and Distributed
Generation: India’s experience inharnessing RETs for rural electricitysupply linked to job creation is apowerful business model for ensuringeconomically, socially and ecologicallyviable development of the rural areas of the Third World and is attracting a greatdeal of interest from many countries inAsia, Africa and South America.
• Renewable and Alternative SourcesOf Low Carbon Energy: By virtue of decades of sustained support to R&Din the renewable energy sector, India istoday in a position to play a major role inthe large scale commercialisation RETssuch as large and small biomass andbiogas technologies, wind generators,small hydro, solar thermal, solar PV,energy ef ficient lighting systems, andmuch more. India will be an especiallyattractive partner for other developingcountries as technology provider,
equipment supplier and capacity builder.Indeed, South-South-North partnerships,which utilise innovative new solutionsand the financial and marketing strengthsof industrialised countries, may be aneffective instrument. (“India EnergyOutlook, KPMG, 2006 / RET Outlook”Based on MNES website).
• Nuclear Energy: Increasingly Nuclearpower is being labelled as a carbonneutral option towards managingincreasing Carbon emissions fromdeveloping countries. Unfortunately inIndia civilian nuclear power generationunits have been shown to be the mostexpensive option upon comparison withthe time and capital invested in other fuelchoices. Further the risks attached withthe nuclear sector raise critical questionsabout the safety of local populationsand eco-systems in case of an accident.The threat from potential leakages is anissue of concern in a densely populatedcountry like India. A similar level of
efforts and money if investedin renewable or decentralized systemssuch as solar, wind and bio-massbased projects will channelize limitedfinancial resources for an alternativeoption to develop a low-cost andeco-friendly energy paradigm for solvingthe country’s energy security problems.
• Urbanisation and IT: The expansionand development of Indian citiesprovides a great opportunity to findways for Indian citizens to live and work
in ways that are far more ef ficient andless polluting than many existing cities.The major IT infrastructure and skillbase in India is already allowing Indiancompanies to access and service globalmarkets without the need to fly peoplearound the world. Ensuring that evenwithin cities commuting distances areminimised, public transport is availableand new buildings are highly ef ficientwill all contribute to an ongoing lowemission legacy in India.
• Carbon Capture and Storage: WhileIndia is not yet in the forefront of carbon capture and storage technologydevelopment, its current dependenceon coal and large reserves makes itimportant that CCS is proven, and if successful, made intrinsic to futurecoal use in India. Several nationalprogrammes are being undertaken todevelop and commercialise clean coaltechnologies, backed by internationalco-operation programs both in thepublic and private sectors. However,
Topic Paper 15:
India (continued)
8/8/2019 Climate Solution Web
http://slidepdf.com/reader/full/climate-solution-web 69/96
C l i m a t e S ol u t i on s :
T h e WWF V i s i onf or 2 0 5 0
S h or t T o pi c P a p e r s
41
P
ar t 2
–
R E
GI ONA L C A S E S T UD I E S
“clean coal” is not the state of art of themost ef ficient and climate-friendly coaltechnology and more advanced CO
2
sequestration / conversion technologies suchas the CCS should also be taken up on apriority basis.
• Sustainable Hydroelectric Power: Agreat deal more development and design isneeded to evolve socially and ecologicallybetter solutions for hydro power systemswhich minimise large-scale dislocation of local populations and associated damage to
ecosystems and species.• Industrial Energy Ef ficiency: While
the Government Program on EnergyEf ficiency has not made a very big impact,three factors are pushing the energysavings programs. Firstly liberalisationof the economic and industrial sectorswhich forces the Indian industry to bemore competitive. Foreign ownership of manufacturing or processing industries (inJV partnerships and 100% owned) brings innew energy ef ficient technologies. Secondly
the opening up of carbon markets underCDM of the Kyoto Protocol is promotingenergy savings in areas which wouldotherwise not do so. The small and mediumindustrial sector and the agricultural sector,however, are still rather energy inef ficientand major efforts can be made to makethem energy ef ficient which will reduce theIndian GHG emissions significantly.

8/8/2019 Climate Solution Web
http://slidepdf.com/reader/full/climate-solution-web 70/96
4 2
The Significanceof the EUWith the European Union (EU) havingmany harmonized laws on energy andemissions which impact on the actionof many countries and over 500 millionpeople, its potential to drive changetowards a secure climate is highlysignificant. The EU’s current expansion(which makes some trends a little dif ficultto explain) creates opportunities toinfluence and invest in the workings of accession countries and many of its newneighbours. It has now taken a historicdecision to cap GHG emissions by up to30% by 2020 by mandating 20% suppliesfrom renewable energy also by 2020. Thisdecision could be the hugely influentialprecursor to a new global deal for 2012climate targets in order to say below 2°Cglobal warming.
The EU is responsible for a major volumeof the world’s technical innovation and has
large volumes of capital for internal andexternal investment that can help to shapethe future.
Like the USA, the EU is a major importerof many goods which have an upstreamclimate change impact – manufacturedgoods, timber, and foods. Judicious useof this buying power can significantlyaffect the sustainability of productionaround the world.
EnergyThe overall profile of individual EUcountries’ climate policy and energyperformance is extremely diverse.Reductions of GHG emissions of morethan 10% (UK, Germany) through climatemeasures compare with large increasesin other countries such as Spain, Italy,Ireland, The Netherlands, and Finland.The economic decline in Eastern Europeannew EU member states in the early 1990sled to industrial closure and consequent
huge decline in energy demand andtherefore emissions – now in the processof increasing again.
In terms of energy supply, while somecountries have embarked on nuclearprogrammes, others have phased nuclearout. Some continue to rely strongly oncoal, while many others have combinedrenewables in their mix, and a few haveembarked increasingly on natural gas andother fuels. Oil is the key primary energyproduct used in the EU (39%), followed by
natural gas (23% and growing rapidly) andcoal (19% but declining by almost a thirdsince 1990). Nuclear accounts for 14%and renewable energy for only 7% of allprimary energy used.
The EU’s high dependence on importedfossil fuels will be exacerbated bydwindling internal reserves. This is addingimpetus to the drive to harness indigenousresources from renewables, especiallywind, biomass, and solar, as well as
fuelling interest in newer technologiessuch as solar thermal power and oceanand wave energy.
EmissionsThe EU 25’s total greenhouse gas emissionsamounted to almost 5Gt CO
2equivalents
in 2004 – about 12% of all global GHGemissions. Energy-related carbon dioxideemissions account for 82% of these.
Compared to 1990, the EU25 and EU15GHG emissions are almost 5% and 0.6%below those of 1990, respectively. Asregards carbon dioxide only, emissionsdeclined by 1% in the EU25, but in fact
increased by 4.4% in the EU15 between1990 and 2004, showing that the economicengines of Europe have not yet stabilizedtheir emissions.
With 8.4t CO2
per capita, the EU’s annualemissions from fossil fuels are one of thelowest in the OECD (compared to 20t inthe US) but still nine and three times that of China and India, respectively. Also, the EU’senergy intensity (energy used/unit GDP) isbetter than average in the OECD, and almost100% better than that of the US75.
In the EU25, the largest share of all GHGemissions come from electricity and steamproduction (33%), transport (19% – itsshare has grown by 20% since 1990),industry (14%), and households (10%).Non-energy related and non-CO
2emissions
account for 18% of all emissions76.
Past policies in cutting non-CO2
emissionssuch as from waste or the agriculturalsector have been much more successfulthan cutting carbon from fossil fuels.
In recent years, the trend has shown anincrease of all emissions in the EU25,posing a serious question as to whether atleast the EU15 is able to meet its Kyototarget of a cut of 8% by 2008/2012.77
Topic Paper 16:
European Union
75 IEA 2005: Key World Energy Statistics
76 EEA 2006, as above
77 EEA 2006: Technical report No 6/2006, Annual European Community greenhouse gas inventory

8/8/2019 Climate Solution Web
http://slidepdf.com/reader/full/climate-solution-web 71/96
C l i m a t e S ol u t i on s :
T h e WWF V i s i onf or 2 0 5 0
S h or t T o pi c P a p e r s
43
P
ar t 2
–
R E
GI ONA L C A S E S T UD I E S
European LeadershipForecasts of “business-as-usual” energydemand development in the world see theEU’s relative share of global emissions shrinkin the future, regardless of its own climateactions, as emerging economies continue togrow. Nevertheless, using its quite powerfulpolitical tools, the EU – or rather somemember states and some sectors – are alreadyleaders towards a truly carbon-free future.Examples are:
• Sweden (decision to phase out oil in
transport by 2020 through transportef ficiency and biofuels);
• The wind energy sector in Europewhich represents 80% of all global windinvestments;
• German and Spanish “feed-in” tariffs;
• The strong solar push though variousmeasures in Spain, Austria, and Germany;
• Implementation of biomass heat inScandinavia and Austria;
• Expansion of ef ficient combined heatand power (CHP) in Denmark and TheNetherlands;
• The strong commitment in France to cutemissions by 75% by 2050;
• The recent policy and investment pushfor sustainable carbon capture and storage(CCS) by various actors;
• The very encouraging public debate aboutclimate change issues generally in the EU.
In addition, the European Union has beenleading efforts to introduce the 2°C thresholdinto the international climate negotiationsfor a post-2012 regime. The EU has ledon renewable energy targets by obligatingmember states to have 21% of all electricityby 2010 from renewable power, and this hasnow been extended to 20% renewable in allenergy-consuming sectors by 2020.
The EU Emissions Trading Scheme (ETS)is groundbreaking in its attempts to create asolid cap and trade system. Further efforts are
required, however, to ensure that the systemis improved through stronger caps and cleararchitecture that encourage a low-carbonfuture. Efforts to agree binding measuresfor 20% in primary energy savings by 2020through various measures in energy ef ficiencywill be critical for the near future.
The areas of technology development anddeployment that Europe can influence coversvirtually every single climate solutionconsidered in the WWF model, both internallyand externally through its internationalinvestments and purchasing power.

8/8/2019 Climate Solution Web
http://slidepdf.com/reader/full/climate-solution-web 72/96
4 4
The Significanceof ChinaAs a developing country, China takes socialand economic development and povertyelimination as its overriding priorities.China may support the quadrupling of itsGDP by doubling its energy consumption,which will inevitably lead to majorincreases in carbon dioxide emissionsunless this demand is met by much loweremission technologies.
With the world’s largest population andwith a period of rapid industrialization andurbanization now underway, the choicesmade by China will be very important inthe avoidance of 2°C global warming.
Energy in ChinaChina has a coal-dominated energy resourceendowment; coal making up 96% of theproven fossil fuel reserve. In contrast,petroleum and natural gas together onlyaccount for 4%. China’s share of the worldtotal coal, hydropower, oil, and natural gasreserves in 1999 are respectively 11.6%,13.4%, 3.4% and 0.9% 78.
Home-produced coal dominates China’senergy mix, assisting in energy security butchallenging CO
2emission control efforts.
China is both the largest consumer andproducer of coal and the largest producerof hydropower in the world79 (BP, 2006).In 2005, total energy consumption in Chinais about 1386 Mtoe, of which coal was
2140 Mt, oil 300 Mt, Natural gas 50 BillionCubic Meter, hydropower 40.1 billionkWh and nuclear power 52.3 billion kWh80 (CNSB, 2005).
China reported a net import of 117 milliontons of crude oil in 2004, representing animport dependence rate of 40%81 (Zhang,2005). The oil price rocketing on theinternational market has made energysecurity a major concern in China.
Energy security pressures, environmentalconsiderations and distributed energydemands have made China move quicklyinto renewable energy. Historically it hasbeen a world leader in small hydro systems,but now wind farming, solar hot water and
solar PV are big industries in China.
Emissions ProfileChina, due to its large population andcoal-dominated energy structure, emitted3759.9 million tonnes of carbon dioxidefrom fuel combustion in 200382 and wasranked as the world’s second biggestcarbon dioxide emitter, accounting for14.9% of world energy-related carbondioxide emissions. The IEA estimates thatby 2010, China will surpass the UnitedStates and become the world’s biggestcarbon dioxide emitter; however, China’sper capita carbon dioxide emissions fromenergy combustion were 2.9 tonnes in2003, about 72% of the world averagelevel in the same year83.
In its 11th five-year plan, China for the firsttime explicitly set the tasks of controlling
greenhouse gas emissions.
LeadershipRenewable Energy Technology
and Deployment
In the medium- and long-term (2020)plan for renewable energy developmentand energy conservation, China stipulatesthat renewable energy will reach 10% of China’s total primary energy consumptionby 2010 and 15% by 2020, and the energy-intensity of GDP is planned to decreaseby 43% during the period 2002 to 2020.Meanwhile, energy use per capita in 2004was only 1.08 tonnes of oil equivalent,about two-thirds of the world average and13.4% of that in the United States. Theserepresent outstanding targets for a countrywhich is still very much a poor countryon average.
Commitment and Showing How
to Decouple Emissions and GDP
If China were to meet its energyconservation target by 2020, it would avoidthe emission of some 3.4 billion tonnes of
CO2 from 2003 to 202084. This shows thestrong commitment of China to decoupleeconomic growth from carbon emissions.
Energy Efficiency
To reach the energy conservation targetset in the 11th five-year plan, that energyintensity per GDP unit will decreaseby 20% by 2010 in comparison withthat in 2005, the National Reform andPlanning Commission has signed energyconservation-obligatory agreements with
30 provincial and municipal governmentsand 14 state-owned enterprises85. Onthis basis, the provincial and municipalgovernments will sign an obligatoryagreement with the high energy-intensityenterprises located in their precincts.The achievement of the energy-ef ficiencytarget is linked with performanceevaluation of provincial governorsand state-owned enterprises86.
78 LBNL (Lawrence Berkeley National Laboratory), May 2004, China Energy Databook v.6.0.
79 BP World Energy Statistics 2006.
80 CNSB (China National Statistics Bureau), 2005 National Economic and Social Development Statistic Communique
(February 2006).
81 Zhang Guobao, Vice Minister of the National Development and Reform Commission, made a speech on behalf of the
Chinese government on 14th September 2005 (http://www.gov.cn/xwfb/2005-09/14/content_31342.htm).
82 IEA (International Energy Agency), CO2
Emissions from Fuel Combustion, 1971- 2003 (2005 Edition).
Topic Paper 17:
China

8/8/2019 Climate Solution Web
http://slidepdf.com/reader/full/climate-solution-web 73/96
C l i m a t e S ol u t i on s :
T h e WWF V i s i onf or 2 0 5 0
S h or t T o pi c P a p e r s
45
P
ar t 2
–
R E
GI ONA L C A S E S T UD I E S
Key Exporter of EnergyEfficiency Technologies
China is the largest energy-ef ficient lightbulb producer in the world. In 2005, the totalproduction reached 1.76 billion accounting for90% of world total, 70% of which is exportedto other countries (Ma, 2006).
Leap-frogging Technology on Coal
To deal with the pollution caused from the useof the main energy source, coal, China hasdemonstrated advanced clean-coal technology,
such as Integrated Gasification CombinedCycling (IGCC), and now is exploring thefeasibility of carbon capture and storage.The first Green Coal Power Company, withshareholders from the top eight state-ownedpower companies, was founded at the endof 2005. It is planned for this company todemonstrate and promote advanced coalpower generation technologies with near-zeroemissions of CO
2and other pollutants within
15 years.
Urbanization
The expansion and development of China’scities is a major opportunity to decouplehow people live and work in China fromGHG emissions. This can be achieved withhigh building and appliance ef ficienciescombined with ensuring that even withincities commuting distances are minimizedand public transport is well used.
83 IEA (International Energy Agency), World Energy Outlook 2006.
84 Wang Yanjia (2006) Energy Efficiency Policy and CO2
in China’s Industry: Tapping the potential. Tsinghua University.
85 Press Release at Xinhua Net from the National Energy Conservation Workshop on 26 July 2006 (h ttp://news.xinhuanet .com/
newscenter/2006-07/26/content_4881272.htm).
86 Ma Kai, Minister of the National Development and Reform Commission, gave a speech at the National Energy Conservation
Workshop on 26 July 2006 (http://hzs.ndrc.gov.cn/).

8/8/2019 Climate Solution Web
http://slidepdf.com/reader/full/climate-solution-web 74/96

8/8/2019 Climate Solution Web
http://slidepdf.com/reader/full/climate-solution-web 75/96
C l i m a t e S ol u t i on s :
T h e WWF V i s i onf or 2 0 5 0
S h or t T o pi c P a p e r s
47
P
ar t 2
–
R E
GI ONA L C A S E S T UD I E S
LeadershipBrazil has already implemented a number of successful emission reduction policies forreasons other than climate protection. Thecountry has the potential for global leadershipin three areas: energy ef ficiency, ethanolproduction, and forest protection.
Energy Efficiency
Brazil has long had governmental programmesfor energy ef ficiency, including Procel,launched in 1985. By 2004, with a total budget
of R$760 million, Procel achieved savingsof more than 19TWh, equivalent to over 2%of the country’s power use, thereby avoidingmore than 5,255MW of new capacity andsaving more than R$13 billion in foregoneinvestments in generation, transmission,and distribution (Procel, 2007). Followingelectricity rationing in 2001-2002, with veryshort notice Brazilians reduced consumptionby almost 20% (compared to 2000 levels).WWF research has shown there is potentialto reduce power demand growth by 40% over
the next 15 years87, resulting in an annual CO2 emissions reduction of about 26Mt (WWFBrazil, 2006). However, over the last fewyears energy-ef ficiency promotion has beena low political priority, with the governmentintent on focusing on supply-side constructionto satisfy the country’s future energy needs(Brazil Federal Government, 2007).
BiofuelsLaunched in 1975, Proalcool, Brazil’s ethanolprogramme, remains to date the largestcommercial application of biofuel for transportin the world. It succeeded in demonstratinglarge-scale ethanol production from sugarcaneand its use for car engines88. Were Brazil todouble its ethanol programme by 2015, thiswould result in a reduction of 10Mt carbonper year (Goldemberg & Meira Filho, 2005).However, the challenge ahead is to ensure thatsugar production expands89 only on degraded
and abandoned land and does not result infurther tropical deforestation and loss of biodiversity, or damage to river ecosystemsfrom excessive water use for irrigation.
Halting Deforestation
Finally, given the country’s high deforestationrates, the urgent development of Brazil’scapacity to reduce and eventually haltdeforestation of its tropical rainforests isof great importance, for its own long-termsustainable development, for global and
regional climate protection, and as an exampleto other countries. The major challenge is tosupport economic alternatives to extensiveforest clearing, increase funding to enforceenvironmental legislation and implementprotected areas, and build institutional capacityin remote forest regions. Under the futureinternational climate regime, Brazil couldtable a deforestation emissions reduction targetand receive positive incentives to achieve it.For instance, using data from Prodes (2005),PointCarbon (2006), and Ângelo (2006), afurther 10% yearly reduction in deforestation
rates could represent US$1.8 billion in yearlyadded income90 for the country.
87 Two-thirds on the demand side, mainly industrial motors, appliances and solar water heating, and the remaining one-third on thesupply side, including re-powering and distributed generation.
88 Its benefits also included savings worth about US$100 billion in hard currency, over a million jobs created in rural Brazil, around
1,350GWh per year of electricity produced from sugar bagasse, and an estimated saving of 574 million tons of CO2
since 1975,
or roughly 10% of Brazil’s CO2
emissions over that period (IEA, 2004).
89 A fivefold increase from 5 to 35 million hectares is projected by 2025 to meet future growth in world ethanol demand (NAE 2005).
90 For Motta (2002), carbon finance would be sufficient to invert perverse local incentives, leading the way to a more sustainable
use of the forest’s resources.

8/8/2019 Climate Solution Web
http://slidepdf.com/reader/full/climate-solution-web 76/96
4 8
ReferencesÂngelo, Cláudio (2006). Desmatamento cai 30%, diz governo. Folha de São Paulo, CIência.
Brazil Federal Government (2007). Programa de Aceleração do Crescimento.
Goldemberg & Meira Filho (2005). Um novo Protocolo de Quioto, Estado de São Paulo.
IPAM (2005). Tropical Deforestation and Climate Change, São Paulo.
Motta, Ronaldo Seroa da (2002). Estimativa do custo econômico do desmatamento na Amazônia.
NAE (Nucleo de Assuntos Estrategicos) (2005). Mudança do clima – Caderno II, Brazil.
PointCarbon (2006). Carbon 2006 – Towards a truly global market.Procel (2007). Eletrobras www.eletrobras.com.br
Prodes (2005.) Projeto Prodes – Monitoramento da Floresta Amazônica por Satélite.
WWF-Brazil (2006). Agenda Elétrica Sustentável 2020.
WRI (2006). Climate Analysis Indicators Tool.
Topic Paper 18:
Brazil (continued)

8/8/2019 Climate Solution Web
http://slidepdf.com/reader/full/climate-solution-web 77/96
C l i m a t e S ol u t i on s :
T h e WWF V i s i onf or 2 0 5 0
S h or t T o pi c P a p e r s
49
P
ar t 3
–
T E
C HNI C A L S UMMA R I E S
Part 3TechnicalSummaries
© W W F - C a n o n ,
C h r i s M a r t i n
B A H R

8/8/2019 Climate Solution Web
http://slidepdf.com/reader/full/climate-solution-web 78/96
5 0
IntroductionThe WWF Energy Wedge Model usesprobabilistic risk management tools tomodel the likelihood that global warmingcan be safely and successfully mitigatedby a suite of appropriate technologies,systems, and resources.
The model makes the assumption thatany climate change action will have tobe compatible with other internationaldevelopment goals, including
industrialization, poverty eradication/ economic development, and energysecurity, as well as continuing globalpopulation growth.
The model assumes that there will beglobal action on emissions reductions,though the timing and effectiveness of action is explored in various scenarios.The model builds on the work of Pacala& Socolow91, developing the concept of “wedges” which either avoid energy use,or create energy without emissions, or
have low associated emissions.
The WWF model has been developed totest the plausibility and time constraintsof implementing deep greenhouse gasemission cuts. In the WWF Model these“climate solution wedges” are developedconcurrently subject to a set of definingcharacteristics which determine theboundaries of the scale and speed of their development. However, unlikePacala & Socolow’s wedges, the shapeand size of these “climate solution
wedges” are based on typical or plausibleindustry development characteristics andlimitations, as well as reviews of publishedwork on resources, performance, and insome cases new research undertaken forthe WWF Energy Task Force.
Another feature of this model is the useof Monte Carlo92 simulations to allow arange of estimates for any given variableto be accommodated and reflected in theoutputs. Thus, every input and output canbe expressed as a range described by aprobability distribution.
The model deliberately avoids the use of a carbon price. Instead, it is assumedthat the price adjusts to respond to thegovernment-imposed requirements of emission reduction or technology forcing
– not the other way round. Furthermore,a carbon price has not been used as it doesnot allow for the complexities of industrydevelopment processes, front end capitalinvestment, and the resultant dynamicsin the economy.
This model is not an economic model inthe form presented. However, is should benoted that all the “solutions technologies”considered are commercially availabletoday. Most energy sources are competitivewith – and all have current or future netcost projections less than – the price of nuclear energy, based on the MIT analysisof nuclear costs93. The use of energystorage and conversion to new fuels suchas hydrogen will present additional costs.However, these are fundamental to theprovision of energy on demand, fuels, andindustrial heat and these additional valueswill be the basis of meeting additional costs.
It is possible for this model to be extendedto provide full costings.
A Comparison withConventional Modelling
ApproachesThere are a number of methodologies formodelling future emissions. The mostcomplex link estimates of world energyconsumption, trade, economic growth, andpolitical responses to climate change. Theoutputs most sought after are estimatesof reductions in emissions, implied carbonprices, and effects on GDP.
Most models equilibrate technologies viamarket pricing and using technology cost/ learning curves with the aim of achievingeconomic allocative ef ficiency at anyspecific carbon price and time.
By their nature, most economic modelsare designed to explore changes from thestatus quo and do not deal with ongoingtransformational change which includessignificant structural shifts. Economicmodels do not easily model the kind of
stimulated entrepreneurial activity thatarises in response to the need to transform,change, and survive when business is facedwith an exogenous threat/opportunity.
The range of models and scenarios currentlyavailable to consider how to addressclimate change tend to assume limits dueto implied economic constraints longbefore realizing the resource or industrydevelopment constraints and opportunities.Typically, the impact of change is seen asdampening the economy, in contrast to much
experience from forced innovation – viz theUSA, Germany, and Japan, which are allinnovation-driven economies.
Topic Paper 19:
Design of the Model
91 Pacala, S & Socolow, R. (2004) Stabilization Wedges: Solving the Climate Problem of the Next 50 Years with Current Technologies. Science 13th August, 2004, Vol. 305.
92 See Hammersley, J M & Handscomb, D C. (1964) Monte Carlo Methods. John Wiley & Sons, New York.Binder, K &
Heerman, D W. (1992) Monte Carlo Simulation in Statistical Physics, An Introduction, Springer-Verlag, Berlin, 129 pp.;
McCracken, D D. (1955) The Monte Carlo Method, Scientific American, May, pp. 90-96; Morgan, M Granger & Henrion, M.
(1990) Uncertainty – A guide to dealing with uncertainty in Qualitative Risk and Policy Analysis, Cambridge University Press.
93 MIT (2003) The Future of Nuclear Power – An Interdisciplinary Study. Release July 2003. Published by MIT.
http://web.mit.edu/nuclearpower/
8/8/2019 Climate Solution Web
http://slidepdf.com/reader/full/climate-solution-web 79/96
C l i m a t e S ol u t i on s :
T h e WWF V i s i onf or 2 0 5 0
S h or t T o pi c P a p e r s
51
P
ar t 3
–
T E
C HNI C A L S UMMA R I E S
Limiting the analysis of how to achievedeep cuts through innovation because of economic constraints does not seem sensible.Conventional models tend to extrapolatetoday’s structural shape into a very similarshape tomorrow. (Imagine the inaccuracy of insights which might be achieved from thebest of today’s economic models if they reliedonly on data known in 1950.) Much of today’stechnology from aircraft to computers hasbeen born of forced innovation combined withmarket take-up. This is the approach takenin this model.
The WWF model is based on thefollowing assumptions:
1 Increasing global demand for energywill be driven by a combination of population growth, poverty eradicationthrough economic growth andindustrialization in developing countries,and continued economic developmentin developed countries.
2 The economic impact of global warming
greater than 2°C above pre-industrial levelswill greatly exceed the cost of standardcommercially available interventions thatwould avoid such a rise.
3 There is a relationship between emissionsand temperature which allows a “carbonbudget” to be derived consistent with alow risk of global temperature increasesexceeding 2°C.
4 Estimates of resources, industry growthrates, and other parameters relevant toachieving reduction in emissions are
intrinsically uncertain and also subjectto varied opinion.
5 The rate and scale of investment, industrygrowth, and resource exploitation aresubject to well-known commercialconstraints and boundaries.
6 Precautionary risk management requiresa portfolio of proven solutions and not anover-dependence on one or more magicbullets (“green”, “brown”, or “black”).The possibility of a sudden breakthroughof a new, significant, commercial energysolution, however plausible, is disregarded.
7 A growing world population will peak atnine billion in about 2050 as forecast by theUnited Nations Population Prospects (2004).
8 World energy requirement willapproximately follow projections in the
IPCC SRES A1B storyline – a mid-linepath in the SRES series of projections.

8/8/2019 Climate Solution Web
http://slidepdf.com/reader/full/climate-solution-web 80/96
5 2
Figure 1. An indicative “carbon band”, showing the difference in the upper limits
of annual allowable carbon emissions, from fossil fuels, in GtC per year, for total
carbon budgets of 400GtC and 500GtC taken out to 2200 (showing the period to
2050 only). The thickness of the band shows the crucial extra flexibility available
in anthropogenic emissions if deforestation is successfully controlled.
Method
Two-Degree Carbon Budget
We have established a carbon emissions budget of 500GtC (Fossil Fuels) (see item 3)as necessary to stabilize carbon dioxide concentrations at a level which is predictedto keep the climate below a 2°C rise. This is reduced to 400GtC if emissions fromland use and forestry are not successfully constrained. This analysis is based on thework of Meinhausen as discussed earlier in this report, which considers the affectsof multiple gases and the processes of removal of GHG from the atmosphere in theoceans and biosphere.
The band uses a smooth pathway which recognizes that the world’s economies havesignificant intrinsic inertia and that sharp changes are not feasible, economically,technologically, or politically.
Ranges of Data as Inputs
We have investigated many sources of information about “solutions wedges”providing zero- or low-emissions energyor avoided energy use across all sectors.As this information develops over time,the model allows for new information tobe included.
Proponents of any one solution tend to beoptimistic regarding the contribution andtiming of their proposed intervention, while
others tend to be more disparaging. Ratherthat make a judgment, we have electedto use ranges of data which reflect thediversity of opinion.
All such ranges of data are entered intothe model as a “triangular” probabilitydistribution defined by the lowest, highest,and best estimate for any given variable(Figure 2). We have also sought to havea broad range of independent sources forany given variable.
Topic Paper 19:
Design of the Model (continued)

8/8/2019 Climate Solution Web
http://slidepdf.com/reader/full/climate-solution-web 81/96
C l i m a t e S ol u t i on s :
T h e WWF V i s i onf or 2 0 5 0
S h or t T o pi c P a p e r s
53
P
ar t 3
–
T E
C HNI C A L S UMMA R I E S
Trapezoid Solution Deployment
Whereas Pacala & Socolow simplify the growth of a new technology to a wedge with lineargrowth, in practice any innovation into the market follows a standard sigmoid or “S” curve, as
shown in Figure 3.
Figure 2. Ranges of input data are entered into the model as ranges. The probability distribution
used is triangular, and defined completely by the lowest, best, and highest estimates.
Figure 3. Emissions abated as a new technology grows.

8/8/2019 Climate Solution Web
http://slidepdf.com/reader/full/climate-solution-web 82/96

8/8/2019 Climate Solution Web
http://slidepdf.com/reader/full/climate-solution-web 83/96
C l i m a t e S ol u t i on s :
T h e WWF V i s i onf or 2 0 5 0
S h or t T o pi c P a p e r s
55
P
ar t 3
–
T E
C HNI C A L S UMMA R I E S
is run over and over again with differentcombinations of inputs, which are both randomand reflect their probability of occurrence.
The result then is a histogram of results forthe outputs of the model, which are in effectprobability distributions for the results.
In summary, the Monte Carlo techniqueallows multiple inputs with various probabilitydistributions to be combined to create outputswith their own probability distributions.
Bottom-Up Approach
As discussed above, we have noted thatglobal demand for energy will be driven
by population and economic/industrialdevelopment; and we have taken as agiven the SRES-A1B estimate for energyand emissions.
We have taken a bottom-up approach of building up a set of “solutions wedges” to meetthe projected demand and sectoral energy mixof citizens with developed standards of living.
Figure 5. Example distribution for an output for a sample run of the model, presented as a
histogram and percentile distribution. These indicate the range of possible outcomes, the
most likely outcome and a probability distribution for any given output.

8/8/2019 Climate Solution Web
http://slidepdf.com/reader/full/climate-solution-web 84/96
5 6
We have also considered a top-down approach to look at how such wedges displace fossil fuels (and emissions). To show this, the “builtup” wedges are subtracted form the energy projection to provide a single overview of Avoided Energy Use, Zero Emissions energycreation, Low-Emission Energy Creation, and the Residual Energy Requirement assumed to be provided from an un-sequestered mix
of fossil fuels.
Figure 6. A representative scenario of the Climate Solutions Model depicting technology wedges capable of averting dangerous
climate change. Each climate solution wedge grows over time and the sum of all wedges becomes significant as industrial
capacity and deployment increase in scale. The top yellow line refers to the energy demand projection in the SRES A1B scenario.
Note that since energy-efficiency technologies are shown alongside energy supply from low-emission sources, the results are
expressed in final energy supplied or avoided (rather than primary energy production).
Topic Paper 19:
Design of the Model (continued)

8/8/2019 Climate Solution Web
http://slidepdf.com/reader/full/climate-solution-web 85/96
C l i m a t e S ol u t i on s :
T h e WWF V i s i onf or 2 0 5 0
S h or t T o pi c P a p e r s
57
P
ar t 3
–
T E
C HNI C A L S UMMA R I E S
Figure 7. Output of the WWF Climate Solutions Model. Energy efficiency and demand reduction measures
(drawing down from the top, in yellow) largely stabilize energy demand by about 2020, allowing a rising
demand for the provision of energy services to be met from a more or less level supply of energy
(notwithstanding regional variations). Meanwhile zero- and low-emission energy sources are built up (from the
bottom, in blue) until about 2040 when, assuming none fail significantly, fossil-fuel use (in brown) is reduced to
a ”persistent” residual level of 20EJ for applications which are hard to replace. Nuclear energy use (in red) is
phased out. It may of course be that some wedges under-perform or fail entirely. The scenario provides spare
capacity as a contingency, represented by energy supply shown reaching below the x-axis.

8/8/2019 Climate Solution Web
http://slidepdf.com/reader/full/climate-solution-web 86/96
5 8
Calculating Carbon Emission PathwaysFrom the final energy mix, including the residual use of fossil fuels and emissions from CCS, it is then possible to calculate theresultant annual carbon emissions, illustrated below, against a carbon budget consistent with emission constraints for a 400ppmstabilization, for comparison.
Figure 8. Emissions in the WWF Climate Solutions Model. The diagram shows the range of emissions (red bands) in the scenario
presented in this paper. The lower limit of the red band shows the technical potential of emissions reduction if all wedges are
fully implemented, and the whole “fossil fuel with CCS” wedge (yellow in Figure 6) comprises plants burning gas (which has lower
carbon intensity). Emissions follow the upper limit line if about 80% of the potential is achieved and the “fossil fuel with CCS”
wedge is made up of (higher carbon intensity) coal plants. Placed against the nominal carbon budget curve (brown), it is clear
that the overall emissions to 2050 of the lower trajectory fall within the total emissions indicated by the upper limit of the budgetrange (assuming that deforestation is successfully brought under control). Any failure of efforts to halt deforestation (reducing the
budget available for energy emissions to the lower limit of the brown band) will reduce the chances of staying within the overall
emissions budget, especially if failures or delays in the implementation of solution wedges drive the emissions curve towards the
upper limit of the red band. These curves are set against a backdrop (green) of the emissions that would occur if the IPCC’s A1B
energy scenario were supplied with the current fossil-fuel mix (i.e., at about 0.02GtC/EJ). Also shown is the projected emissions
curve for the A1B reference scenario which reaches annual emissions of 16GtC in 2050. The results of the modelling show that,
although the point at which global emissions start to decline may not occur until 2015-2020, there is potential to drive deep cuts
quickly once the industrial momentum behind transition is underway.
Topic Paper 19:
Design of the Model (continued)

8/8/2019 Climate Solution Web
http://slidepdf.com/reader/full/climate-solution-web 87/96
C l i m a t e S ol u t i on s :
T h e WWF V i s i onf or 2 0 5 0
S h or t T o pi c P a p e r s
59
P
ar t 3
–
T E
C HNI C A L S UMMA R I E S
Expressing the ResultsThe results as presented are useful inproviding a qualitative understanding of whatmay be a plausible trajectory for energy andemissions under various scenarios. However,a critical measure of success is whether, in thegiven period, the cumulative emissions havestayed below the budget associated with a400ppm stabilization.
The model allows the probability of achieving the emissions reduction task tobe considered over a given period and theresults for the period 1990-2050 are shownin the following diagram. These compare thecumulative emissions to 2050 in the scenariowith the cumulative carbon emissions in thecarbon budget.
Simulation: Histogram
0
10
20
30
40
50
60
3 0 8
3 1 6
3 2 4
3 3 2
3 4 0
3 4 8
3 5 6
3 6 4
3 7 2
3 8 0
3 8 8
Figure 9. Sample histogram showing the amount of carbon (GtC) released in the period
1990-2050 on the x-axis. Each run of the model returns a new result and the y-axis shows the
number of individual results in each possible outcome “bin”. This overall shape is effectively
the resulting probability distribution of an output (in this example centred about 348GtC),
based on all of the input variable probabilities combined in the model and run under the
Monte Carlo simulation.

8/8/2019 Climate Solution Web
http://slidepdf.com/reader/full/climate-solution-web 88/96
6 0
Figure 10. Probability distribution of carbon emissions staying within the 400GtC and
500GtC budgets for the period 1990-2050 in WWF’s Climate Solutions scenario. Note that
the total budget is spent over the period 1990 to 2200; however, this figure considers the
component of the budget in the period to 2050. The 400GtC budget to 2200 corresponds
to a budget of 340GtC to 2050, and the 500GtC budget to 2200 corresponds to a budget
of 415GtC to 2050. The yellow and blue lines represent the outputs of multiple runs of the
Monte Carlo model (as number of hits). The yellow and blue lines correspond to the lower
and upper limits (respectively) of the red band in Figure 8.
As stated earlier, the size of the carbon budget consistent with avoiding 2°C of warming
will depend on the extent to which land clearance is addressed. Figure 10 shows a greaterthan 95% probability of staying within the carbon budget of 500GtC, but this budgetassumes that emissions from land clearance are fully controlled. However, if land-useemissions are not properly addressed, the scenario shows the probability of staying withinthe lower 400GtC budget is considerably reduced.
Topic Paper 19:
Design of the Model (continued)

8/8/2019 Climate Solution Web
http://slidepdf.com/reader/full/climate-solution-web 89/96
C l i m a t e S ol u t i on s :
T h e WWF V i s i onf or 2 0 5 0
S h or t T o pi c P a p e r s
61
P
ar t 3
–
T E
C HNI C A L S UMMA R I E S
© W W F - C a n o n ,
M i c h e l G U N T H E R

8/8/2019 Climate Solution Web
http://slidepdf.com/reader/full/climate-solution-web 90/96
6 2
The WWF model has been designed to use ranges of data and plausible parameters to help defi
ne the Climate Solution Wedges out to2050. In some cases this might include resources such as the amount of biomass available; in others it may be the fraction of energyuse for a sector that can be reduced with ef ficiency measures; and so on. The growth rates of some wedges can be defined by plausiblegrowth rates and others by technology turnover.
The outputs for final energy provision or avoidance over time of each of the Climate Solutions wedges used in the presented scenarioare shown below.
Topic Paper 20:
Summary of Output Wedges

8/8/2019 Climate Solution Web
http://slidepdf.com/reader/full/climate-solution-web 91/96
C l i m a t e S ol u t i on s :
T h e WWF V i s i onf or 2 0 5 0
S h or t T o pi c P a p e r s
63
P
ar t 3
–
T E
C HNI C A L S UMMA R I E S

8/8/2019 Climate Solution Web
http://slidepdf.com/reader/full/climate-solution-web 92/96
6 4
Topic Paper 21:
Persistent Use ofNon-CCS Fossil Fuel
This study confi
rms the need to replacefossil-fuel energy as widely as possible,across all its applications – includingelectricity, heat, and transport.
It is important to recognize that thetype, application, and location of useof the energy makes replacement morechallenging and in some cases not evenpossible using existing commercialtechnologies.
For example, aviation fuels are not easily
replaced by hydrogen or standard biofuelssuch as ethanol and biodiesel. There aresolutions such as biokerosene which is adirect replacement94, but this is not yet usedin commercial volumes. Aviation currentlyuses 2% of all fossil fuels burnt or 12% of all transport fuels95,96.
The Climate Solution Wedges used in theWWF model includes a wedge of fossilfuels with CCS, but there are likely to beother persistent uses of fossil fuels wherealternatives and/or suitable carbon capture
technologies may not be available. In orderto allow for emissions from sources thatmay be dif ficult to completely replace, wehave included a “persistent non-CCS fossil
fuel use” provision in the model. Thisis an allocation of possible ongoing fossilfuel use in 2050 which could includea variety of sources including a proportionof aviation fuels, some aspects of industrial manufacturing, and otherniche applications.
In this model, we use an estimation of 20EJof oil as a persistent fossil fuel use; that is5% of current energy supply, and 2% of the “plateau” final energy supply from2025 onwards.
94 The first flight made using biofuels was in the 1980s using pure biokerosene in an EMBRAER turbo-prop poweredaircraft between the cities of São José dos Campos and Brasília using commercial product Prosene (patent PI
8007957) www.tecbio.com.br [accessed March 2007].
95 http://www.atag.org [accessed March 2007].
96 By way of comparison, in the OECD in 2003, emission levels from aviation consumption were of the order of 3-4% of
energy emissions. If, in 2050, aviation represented a similar proportion of energy services use globally as for the OECD in
2003, the total energy demand from aviation would be of the order 30EJ per year globally. With efficiency improvements,
such as increased load factor and reduced travel for business, the model incorporates a reduction factor range of 10-25%.

8/8/2019 Climate Solution Web
http://slidepdf.com/reader/full/climate-solution-web 93/96
C l i m a t e S ol u t i on s :
T h e WWF V i s i onf or 2 0 5 0
S h or t T o pi c P a p e r s
65
P
ar t 3
–
T E
C HNI C A L S UMMA R I E S
© W W F - C a n o n ,
A n d r e w K E R R

8/8/2019 Climate Solution Web
http://slidepdf.com/reader/full/climate-solution-web 94/96
6 6
Topic Paper 21:
Persistent Use ofNon-CCS Fossil Fuel

8/8/2019 Climate Solution Web
http://slidepdf.com/reader/full/climate-solution-web 95/96
P
ar t 1
–
K E
Y T HE ME S A ND T E C HN
OL O GI E S
C l i m a t e S ol u t i on s :
T h e WWF V i s i onf or 2 0 5 0
S h or t T o pi c P a p e r s
67
© W W F - C a n o n ,
A n t o n V O R A U E R
8/8/2019 Climate Solution Web
http://slidepdf.com/reader/full/climate-solution-web 96/96
Technologies and sustainable energy
resources known or availabletoday are sufficient to meet the growing
demand for energy, and protect the
world from dangerous climatic change.
However, the first steps must be taken
by governments currently in power.
The future depends on them making criticaldecisions in the next five years.
© WWF International 2007
Paper prepared for
WWF’s Global Energy
Task Force by :
Karl Mallon
Director, Transition Institute,
Australia
Greg BourneChief Executive, WWF-Australia
Richard Mott
Vice President, WWF-US
Thanks to all those who provided input.
The geographical designations given here do
not imply the expression of any opinion
whatsoever on the part of WWF concerning
the legal status of any country, territory,
or area, or concerning the delimitation of its
frontiers or boundaries.
© 1
9 8 6 P a n d a s y m b o l W W F – W o r l d W i d e F u n d F o r N a t u r e ( F o r m e r l y W o r l d W i l d l i f e F u n d )
® “
W W
F ” & “ l i v i n g p l a n e t ” a r e W W F R e g i s t e r e d T r a d e m a r k s – 0 7 . 5