Embed Size (px)
Citation preview
1
[UNCLASSIFIED]
[UNCLASSIFIED]
Climate science considerations of global mitigation pathways and
implications for New Zealand mitigation pathways
Piers M Forster (1), Richard Millar (2) and Jan Fuglestvedt (3)
1. Priestley International Centre for Climate, University of Leeds, UK
2. UK Climate Change Committee, UK
3. CICERO, Norway
Version 14 January 2021
This report interprets how the global surface temperature responds to mitigation of long lived
greenhouse gases and short-lived greenhouse gases using the latest climate science. It puts
these findings in the context of global mitigation pathways and New Zealand specific emission
pathways. With a concerted effort to reduce biogenic methane emission and other greenhouse
gases, New Zealand can substantially reduce its contribution to global warming out to 2100.
Further, reaching net zero long-lived greenhouse gases is essential to limit New Zealand’s
contribution to global warming in the longer term.
Introduction
This report gives a brief overview of the current scientific understanding of emissions reductions
needed to achieve the global temperature goal of the Paris Agreement. It builds on the findings
in the Intergovernmental Panel on Climate Change (IPCC) Special Report on Global Warming
of 1.5°C (SR1.5) and Special Report on Climate change and Land, as well as recent updates in
the scientific literature. It focuses on the main characteristics of global emissions pathways and
tradeoffs between reductions of emissions of different greenhouse gases. We also discuss how
different choices affect the prospects of meeting the Paris temperature goals and how New
Zealand’s future emissions pathway relate to global temperature outcomes.
1. Climate response to emissions of different GHGs
This first section examines how much global warming has occurred and how much past and future
emissions commit the world to further warming.
Based on the literature and knowledge available at the time, SR1.5 concluded that past emissions
alone are unlikely to commit the world to global warming in excess of 1.5°C. Does this conclusion
still hold? Since 2018 (the date of IPCC-SR1.5 publication) there have additional warm years
observed in 2019 and 2020, and updates to the methodologies used to construct global surface
temperature timeseries from past observations. There is new science emerging on estimates of
the ‘locked-in’ or ‘committed’ warming from past carbon dioxide (CO2) emissions alone, the
2
[UNCLASSIFIED]
[UNCLASSIFIED]
zeroemission commitment (ZEC).1 Future warming also depends on the amount of warming
coming from future greenhouse gas (GHG) emissions and on emission changes in short lived
greenhouse gases such as methane and in non-greenhouse gas pollutants, as well as cumulative
emissions of longer-lived GHGs, such as (CO2) and nitrous oxide (N2O). The sections below detail
how understanding of each of these has progressed since SR1.5.
1.1 Historical warming
SR1.5 estimated that the human-induced warming2 had reached around 1°C (with a 0.8°C to
1.2°C likely3 range) above pre-industrial levels by the end of 2017. This was based on averaging
the four prominent global (land and sea) datasets with peer-reviewed methodology (summarized
in Table 1.1 of IPCC-SR1.5). Since then these global temperature datasets have been updated
and improved to reflect the latest understanding of how to incorporate a range of historical climate
data into a single timeseries and to improvements to methods to produce globally representative
values (Morice et al., 2020). These latest revisions will lead to a slight increase in the estimated
level of warming above pre-industrial levels relative to the versions of the datasets available to
IPCC-SR1.5 (e.g., Kennedy et al. 2019, Kadow et al. 2020). These changes arise from updates
in the methodologies for constructing global temperature records and not because climate change
today is worse than expected by recent IPCC reports. The trend in global temperature over recent
decades are robust, consistent with the years since the publication of IPCC-SR1.5 being among
the hottest in the instrumental record.
Definitions of globally average surface temperature for the purpose of estimating remaining global
carbon budgets was addressed in Chapter 2 of SR1.5. Chapter 2 employed two estimates of the
warming to date. The traditional measure of global-mean surface temperature (GMST) is based
on observations that use a combination of near surface air temperature over land and sea-ice
regions and sea-surface temperature over open ocean regions. The second measure is one that
infers global surface air temperature (GSAT) changes across the globe based on a scaling factor
from complex climate models. The latter choice was there estimated to lead to 10% higher levels
compared to GMST based on climate models and therefore a smaller remaining carbon budget
than estimates based on GMST. More recent work suggests that increasing GMST by 10% to
estimate GSAT may not be borne out in real-world observations comparing night-time marine air
temperature to sea-surface temperature data (e.g., Kennedy et al. 2019).
1 This is estimated using idealised scenarios in climate models in which emissions are reduced to zero instantaneously. This scenario isn’t directly relevant to scenarios that could be realised in the global economy but is informative for identifying physically-based lower limits of the minimum amount of ‘inevitable’ additional future increases in global temperature. 2 This is a measure of the increase in global temperature above pre-industrial levels resulting from human activity (e.g., GHG emissions and emissions of aerosols) only. Temporary natural effects (e.g. temporary cooling due to volcanic eruptions or natural climate cycles), that temporarily increase or decrease total warming relative to this human-induced level, are excluded. 3 Here likely means at least a 66% chance that the true value lies within this interval – consistent with how this term is used across IPCC reports.

3
[UNCLASSIFIED]
[UNCLASSIFIED]
IPCC SR1.5 used the average over the period 1850-1900, the earliest period then available in
the direct observational record with reliable estimates of the global average temperature, to
approximate pre-industrial levels. There has been discussion in the scientific literature of the
dependence of global emissions reduction ambition needed to achieve the Paris Agreement on
the choice of this 1850-1900 period to approximate the pre-industrial baseline or an earlier period
such as 1750. Using 1750 as a pre-industrial baseline could increase today’s level of the global
average temperature rise above preindustrial level by around 0.05°C above the level when using
the 1850-1900 period, but this is not estimated to be statistically significant (Hawkins et al., 2017).
In summary, we might expect further revisions and updates of the order one tenth of a degree to
the historical surface temperature change since preindustrial times and these would have knock
on effects for estimates of the remaining global carbon budget consistent with the Paris
Agreement. Note that by altering the historical temperature we are implicitly altering the applied
relationship between the level of global temperature rise above pre-industrial levels and
aggregate climate impacts. As an example, if we were to revise the present day historical warming
upwards from 1.0°C to 1.1°C, the present day climate impacts being experienced now do not
alter, we instead would associate temperature levels (e.g. 1.1°C or 1.5°C) with lower levels of
climate impact than previously, so avoiding 1.5°C of warming becomes a more stringent target
(associated with a lower level of aggregate climate impacts than it was previously), rather than
the revision pushing us closer to higher levels of future climate impact.
1.2 Future warming
1.2.1 Committed warming from greenhouse gases
This section demonstrates to what extent past and future emissions of specific gases (chiefly CO2
and CH4) commit to future changes in global temperature, and hence the extent to which the
levels of global temperature above pre-industrial levels in a given year (e.g. around 2050 to reflect
when peak warming under many 1.5°C scenarios) is a historic liability and what amount is the
result of future emissions that haven’t yet occurred.
For emissions of long-lived GHGs (LLGHG) (CO2, N2O, some fluorinated-gases)4 their global
temperature impact is largely determined by their cumulative emissions. Nitrous oxide (N2O) has
a finite single perturbation lifetime unlike CO2, and consequently behaves differently in the very
long term, but can be treated as approximately equivalent to a certain amount of CO2 emissions
(e.g. using conventional metrics from equivalence between GHGs; see section 2.4) when thinking
about impacts of its emission on global temperature for this century. As shown in SR1.5 (Table
2.4) and the scientific literature, these emissions need to come down to below net zero
(aggregated by the global warming potential with time horizon of 100 years - GWP100) in scenarios
compatible with 1.5°C warming. As some level of residual long-lived greenhouse gas emissions
are expected to be unavoidable, active removal of CO2 from the atmosphere is expected to be
required to achieve net-zero LLGHG emissions. Removal of non-CO2 greenhouse gases from the
4 These are GHGs that result in raised atmospheric concentrations of the gas for many decades after the emission occurred.
4
[UNCLASSIFIED]
[UNCLASSIFIED]
ambient atmosphere has been considered at a conceptual level in the scientific literature but has
not generally been considered in the same level of techno-economic detail as active removal of
CO2, for which demonstration-scale plants of some engineered removals methods already exist
today (De Richter et al., 2017; Jackson et al., 2019).
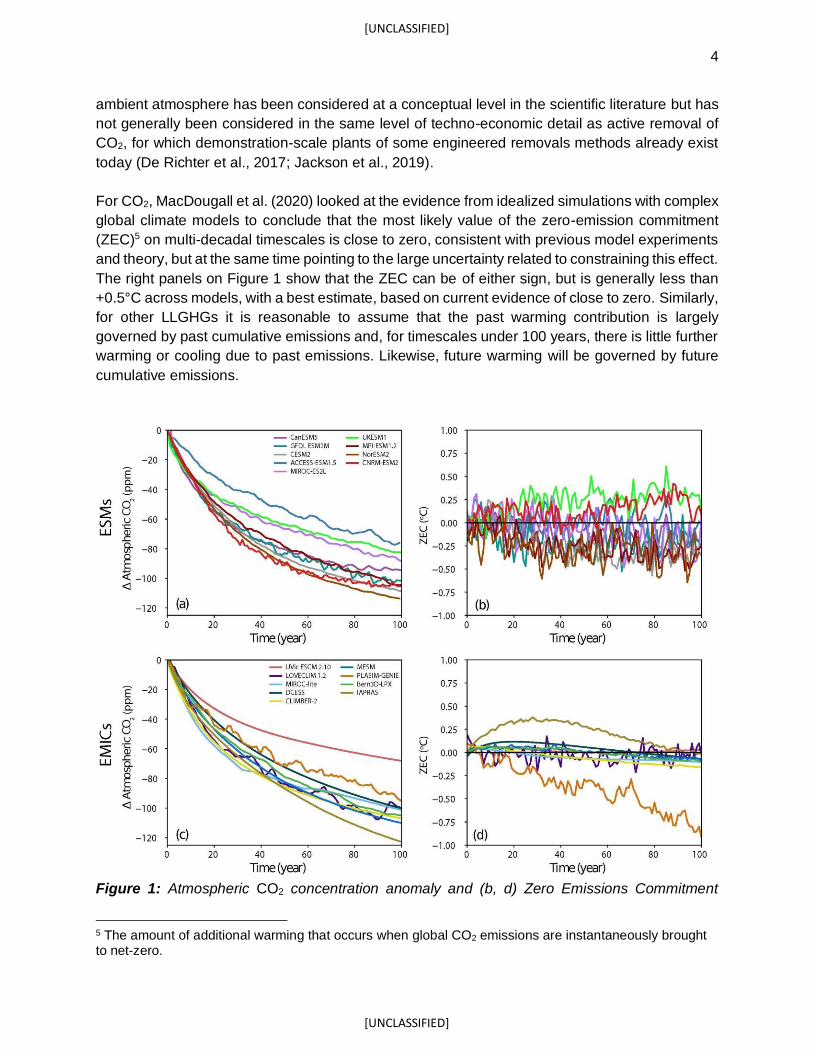
For CO2, MacDougall et al. (2020) looked at the evidence from idealized simulations with complex
global climate models to conclude that the most likely value of the zero-emission commitment
(ZEC)5 on multi-decadal timescales is close to zero, consistent with previous model experiments
and theory, but at the same time pointing to the large uncertainty related to constraining this effect.
The right panels on Figure 1 show that the ZEC can be of either sign, but is generally less than
+0.5°C across models, with a best estimate, based on current evidence of close to zero. Similarly,
for other LLGHGs it is reasonable to assume that the past warming contribution is largely
governed by past cumulative emissions and, for timescales under 100 years, there is little further
warming or cooling due to past emissions. Likewise, future warming will be governed by future
cumulative emissions.
Figure 1: Atmospheric CO2 concentration anomaly and (b, d) Zero Emissions Commitment
5 The amount of additional warming that occurs when global CO2 emissions are instantaneously brought to net-zero.
5
[UNCLASSIFIED]
[UNCLASSIFIED]
following the cessation of emissions during the experiment wherein 1000 PgC was emitted
according to the methods in the 1% experiment (A1). ZEC is the temperature anomaly relative to
the estimated temperature at the year of cessation. The top row shows the output for Earth
System Models (ESMs), and the bottom row shows the output for Earth System Models of
Intermediate Complexity (EMICs) (MacDougall et al., 2020).
The current evidence across the scientific literature therefore suggests that we do not expect
significant additional warming above that seen already due to past long-lived GHG emissions.
However, important uncertainties still remain, including through processes that are difficult to
accurately simulate within the current generation of complex climate models, such as the role of
future thawing of the permafrost and future wildfires. Nevertheless, some of the more dire
warnings of tipping points (e.g., Steffen et al., 2018) are not born out in more careful assessments
(e.g., Turetsky et al., 2020). It remains likely that the future amount of GHG emissions from the
global economy emitted on the pathway to net-zero emissions will be significantly more important
to future levels of warming realized than the warming arising from changes in natural carbon sinks
this century due to feedbacks from Earth system processes that aren’t typically included within
carbon budget estimates. Nevertheless, estimates of these additional feedbacks can be factored
into remaining carbon budget estimates (e.g., Table 2.2 in Chapter 2 of SR1.5), although it is
difficult to estimate exactly how quickly or slowly these additional emissions might enter the
atmosphere. It is unlikely that all of these Earth system emissions would have occurred by the
time global CO2 emissions must have reached net-zero by around 2050 and warming peaked to
keep to the temperature level of the Paris Agreement long-term temperature goal (see SR1.5
Chapter 2, Rogelj et al., 2018a,b and Rogelj et al., 2019).
6
[UNCLASSIFIED]
[UNCLASSIFIED]
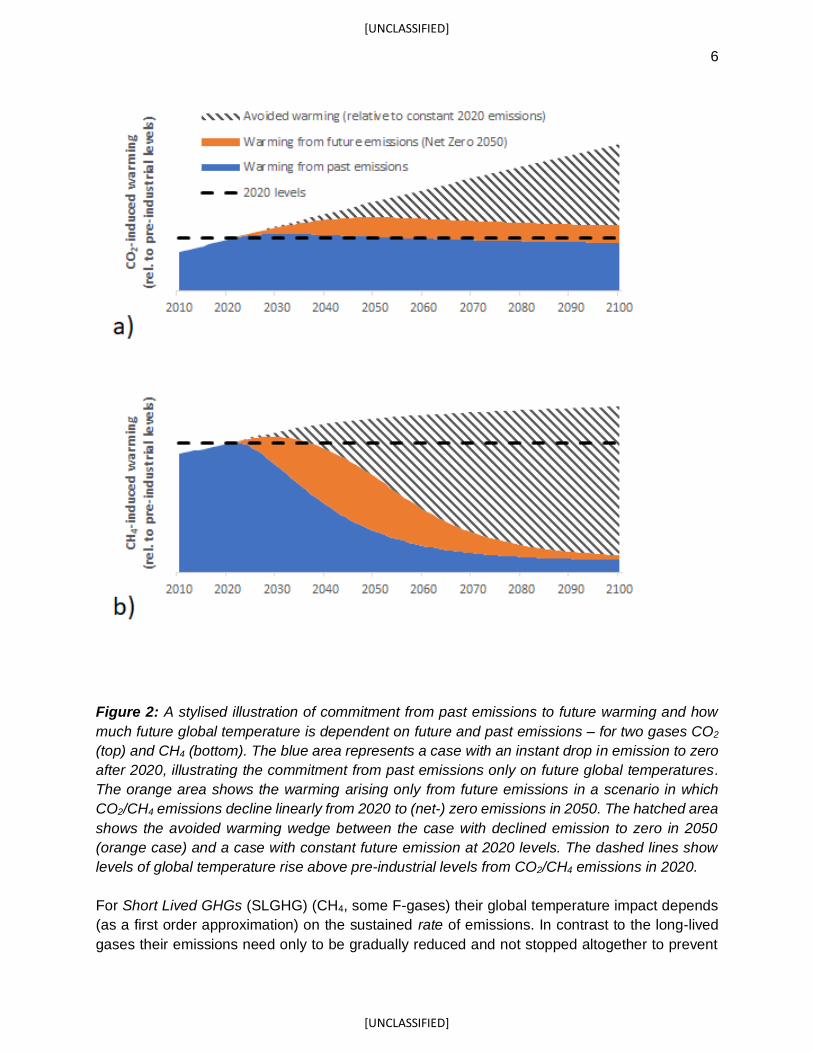
Figure 2: A stylised illustration of commitment from past emissions to future warming and how
much future global temperature is dependent on future and past emissions – for two gases CO2
(top) and CH4 (bottom). The blue area represents a case with an instant drop in emission to zero
after 2020, illustrating the commitment from past emissions only on future global temperatures.
The orange area shows the warming arising only from future emissions in a scenario in which
CO2/CH4 emissions decline linearly from 2020 to (net-) zero emissions in 2050. The hatched area
shows the avoided warming wedge between the case with declined emission to zero in 2050
(orange case) and a case with constant future emission at 2020 levels. The dashed lines show
levels of global temperature rise above pre-industrial levels from CO2/CH4 emissions in 2020.
For Short Lived GHGs (SLGHG) (CH4, some F-gases) their global temperature impact depends
(as a first order approximation) on the sustained rate of emissions. In contrast to the long-lived
gases their emissions need only to be gradually reduced and not stopped altogether to prevent
7
[UNCLASSIFIED]
[UNCLASSIFIED]
further contributions to ever increasing global temperature. An increase in their emission rate, not
simply continued emissions will add to future warming. It is important to note that any level of
sustained short-lived GHG emissions would still sustain raised global temperature above pre-
industrial levels (as does achieving net zero CO2). Therefore, to reduce their historical contribution
to temperature change SLGHG emissions rates need to be reduced whereas net negative
emissions of LLGHGs are needed to reduce historical contribution to global temperature from
LLGHG emissions. The lower the emissions rate of SLGHGs the lower the contribution of
sustained SLGHG emissions to global temperature. Furthermore, emissions of SLGHGs also
have longer-term climate impacts through their impact on carbon cycle (e.g., Gasser et al. 2017)
and on other climate variables (e.g., sea level rise - Zickfeld et al., 2017), that are not reversed
simply by reducing their sustained emissions rates.
The different lifetimes of the two gases (CO2 and CH4) is fundamental for understanding how past
emissions of these gases affect future warming and the role of additional future emissions on top
of the committed warming from past emissions. Figure 2 shows in a stylised way the different
behavior of these two gases. While for CO2 the warming from pre-2020 emission remains
approximately constant over the century, the warming from past emissions of CH4 decays over
the coming decades (although doesn’t disappear entirely). These differences are also important
to bear in mind when different metrics are used for comparing effects of emissions (see Section
2.4). In spite of the very different warming profiles, reducing emissions of both gases will
significantly contribute to reduced future warming and would help achieve the long-term
temperature goal. For CO2, this abatement comes from avoiding future emissions that add to the
committed historical warming from past emissions. For CH4, this principally comes from emissions
reductions that reduce the level of global temperature rise above preindustrial levels that would
have been sustained if emissions were kept at current rates.
In summary, both long and short-lived greenhouse gas emissions contribute to keeping global
temperatures above pre-industrial levels, but they do so in different ways. For short-lived gases it
is via their emission rates. For long-lived gases it is via their cumulative emissions. Abatement
from emissions of both short- and long-lived gases benefit the global climate.
1.2.2 Non greenhouse gas emission changes
Changes in emissions that affect aerosol and those that affect ozone concentrations change
future temperature and how close we are to temperature targets. Although generally 20-30 years
of near-term warming is expected from reducing aerosol pollution following a combination of
climate mitigation policies and air quality policies (Shindell and Smith 2019; Samset et al. 2018),
near term warming can be limited with well-designed policies targeting both short and long-lived
pollutants (Shindell and Smith, 2019). Forster et al. (2020) and Weber et al. (2020) examined the
climate response to COVID-19 restrictions and showed that some of the short term warming from
reduced SO2 emissions and less aerosol cooling was offset globally by a large near-term
reduction in NOx and ozone from reduced transport emissions. This suggests reducing road
transport emissions at the same time as SO2 emissions would lessen any near-term warming.
1.3 Scientific developments

8
[UNCLASSIFIED]
[UNCLASSIFIED]
Since the IPCC 5th Assessment Report (AR5), scientific knowledge has developed further with
improved understanding of several key processes in the climate system, and longer and improved
observation series. The adoption of the Paris Agreement increased the focus on differences
between 2°C and 1.5°C in terms of climate responses and impacts, as well as emission pathways
compatible with the Paris Agreement ambitions, summarized in the recent IPCC Special Reports.
Their assessments also confirm that the fundamental understanding of the climate system has
remained largely the same since AR5. From consistency across these reports, there is a robust
understanding of what needs to happen to global emissions to meet the temperature goal of the
Paris Agreement. This requires reaching and sustaining net-zero global anthropogenic CO2
emissions and declining net non-CO2 radiative forcing (primarily driven by the rate of SLGHG
emissions) to halt anthropogenic global warming.
In spite of the fundamental understanding remaining largely unchanged, uncertainties in radiative
forcing and climate sensitivity affect the relationship between emissions and surface temperature
change, and there have been some relevant developments in these areas which are discussed
below.
1.3.1 Climate sensitivity
The latest generation of climate models from the sixth climate model intercomparison exercise
(CMIP6) warm more than the previous generation and generally have greater equilibrium climate
sensitivities (Forster et al., 2019). However, a five-year assessment of climate sensitivity
comparing estimates using paleoclimate evidence, physical process evidence and the evidence
from the 1850-2018 period (Sherwood et al., 2020) finds a much more constrained likely range
for the equilibrium climate sensitivity that is robustly within 2.3 to 4.5°C. These estimates did not
directly rely on the new generation of climate models so provides an independent assessment
against which the new generation of complex climate models can be compared. This comparison
suggests that the high warming estimates from some of the climate models are unlikely but cannot
be ruled out entirely (Forster et al., 2019).
This updated evidence on the climate sensitivity indicates that the likely range of global warming
projections due to uncertainty in the climate system response for projections of future climate
changes under different global GHG emissions scenarios would have a narrower range than
similarly presented ranges in SR1.5 and AR5. As this revised uncertainty in the Earth’s climate
sensitivity largely affects the tails of the distribution, the central estimates of projected warming
for the same emission scenario would likely still remain similar to those shown in SR1.5 and AR5
(see Figure 3). The low estimates of warming have firmed up and are slightly larger than before,
whereas the high-end estimate remains somewhat uncertain.

9
[UNCLASSIFIED]
[UNCLASSIFIED]
Figure 3: Constrained future warming estimates as probability distribution functions. based on
revised climate sensitivity ranges from Sherwood et al. (2020). Results are shown for four
representative concentration pathways. (Figure 23 from Sherwood et al. 2020).
1.3.2. Radiative Forcing and Global Warming Potentials
The Effective Radiative Forcing (ERF) introduced in IPCC AR5 has now become the accepted
way to compare the magnitude of different climate change mechanisms (Richardson et al., 2019).
The ERF includes cloud related adjustments to the more traditional stratospherically adjusted
radiative forcing, allowing a better comparison of the effect on global surface temperature across
forcing agents.
The establishment of ERF as the standard measure of forcing can help improve the estimates of
GHG metrics (such as the GWP), including for methane. A number of other factors studied in
recent publications may also influence the GWP value for methane:
● Moving to ERF increases CO2 radiative forcing but leads to a decrease in methane
radiative forcing from cloud adjustments (Smith et al. 2018).
● Etminan et al. (2016) include the shortwave forcing from methane and updates to the
water vapour continuum and account for the overlaps between carbon dioxide and nitrous
oxide.
● Thornhill et al. (2020) quantify the indirect effect of methane on ozone radiative forcing
based on several models and strengthen the knowledge basis about indirect effects of
methane.
10
[UNCLASSIFIED]
[UNCLASSIFIED]
● The results of Wang and Huang (2020) show that due to high cloud changes the
stratospheric water contribution to methane GWP-100 which was 15% in AR5 might be
closer to zero in the ERF framework. This change would be additional to the adjustments
outlined in Smith et al. (2018) and in of itself it would decrease the GWP.
● Gasser et al. (2017) and Sterner and Johansson (2017) give descriptions of how to account
for climate carbon cycle feedbacks in emission metrics. AR5 Working Group I included
this feedback for non-CO2 gases, which up to then was only included for the reference gas
CO2, and imply an underestimation of GWP values for non-CO2 gases. Due to lack of
sufficient literature at the time of writing AR5, the inclusion of this feedback effect was
presented as tentative.
Studies have not yet applied these results or combined these analyses for an overall estimate of
methane GWP. At this stage it is difficult to be more quantitative regarding the net result, but the
IPCC Sixth Assessment Report will attempt to assess these and other studies, bringing different
lines of evidence together to form a new comprehensive assessment.
For CH4, the GWP value also depends on whether the carbon is of biogenic or fossil origin. When
oxidised, fossil methane will introduce additional CO2 to the atmosphere. The metric value for
fossil methane will therefore be slightly higher than for biogenic methane. Thus, AR5 Working
Group I gave two values for the methane GWP-100; i.e., 28 for biogenic and 30 for fossil methane.
It was pointed out that “In applications of these values, inclusion of the CO2 effect of fossil methane
must be done with caution to avoid any double-counting because CO2 emissions numbers are
often based on total carbon content. Methane values without the CO2 effect from fossil methane
are thus appropriate for fossil methane sources for which the carbon has been accounted for
elsewhere, or for biospheric methane sources for which there is a balance between CO2 taken up
by the biosphere and CO2 produced from CH4 oxidization.”
Other updates are also available in the literature, e.g., Hodnebrog et al. (2020) gives an update
of radiative efficiency and GWP and GTP values for halocarbons. New radiative efficiencies
calculations are presented for more than 400 compounds in addition to the previously assessed
compounds, and GWP calculations are given for around 250 compounds. Present‐day radiative
forcing due to halocarbons and other weak absorbers was estimated to be 0.38 [0.33–0.43] W
m−2, compared to 0.36 [0.32–0.40] W m−2 in IPCC AR5 (Myhre et al., 2013), which is about 18%
of the current CO2 forcing.
1.3.3 Surface temperature projection estimates
Climate model emulators such as FaIR and MAGICC (employed in SR1.5) are often used to
estimate global warming futures across multiple scenarios. Such reduced complexity climate
models can either be set up to mimic the behaviour of global-mean surface temperature change
from more complex models or can be set up in probabilistic form to match the assessed range of
climate sensitivity and effective radiative forcing from other assessments or lines of evidence.
Due to the prominent role of such models in projecting net zero scenarios in SR1.5, an
intercomparison is currently underway (https://www.rcmip.org/) between a variety of these
reduced complexity models. Preliminary results from this show that such models generally work
11
[UNCLASSIFIED]
[UNCLASSIFIED]
well for projections of global surface temperature (Nicholls et al., 2020). Such models based on
updated estimates of ERF and climate sensitivity can provide the basis for calculating national
emissions contributions to global temperature changes and could also be used to understand the
direct global temperature impacts of New Zealand’s emissions (see Section 3.1).
2. Trade-offs in global emissions pathways to keep warming to 1.5°C
At a global level, different combinations of future long-lived and shorter-lived GHG emissions
trajectories can be consistent with achieving the long-term temperature goal of the Paris
Agreement. This section looks at the understanding of possible combinations of cumulative long-
lived GHG emissions and sustained emissions rates of shorter-lived GHGs that could be
consistent with an overall global temperature trajectory consistent with the Paris Agreement.
2.1 Understanding GHG trade-offs determining the level of peak warming reached
Physically, warming could be kept to ‘well-below’ 2°C or below 1.5°C with a range of possible
combinations of global future cumulative LLGHG emissions and global SLGHG emissions rates.
Fundamentally, there are three key contributions from future emissions to the level of peak
warming reached:
1. The level of global temperature increase above pre-industrial levels arising from future
cumulative LLGHG emissions between now and the timing of reaching net zero. This
warming is additional to that caused by past-emissions of LLGHGs.6
2. The level of global temperature increase sustained by the rate of SLGHG emissions over
the couple of decades prior to peak warming. Depending on whether the global emissions
rates are higher or lower than values over the recent past, the level of global temperature
rise above pre-industrial levels sustained by global SLGHG emissions could be greater,
the same, or lower than the level of global temperature rise above pre-industrial levels
sustained by these emissions today.
3. Changes in the levels of global temperature decrease below pre-industrial levels that are
sustained by global human emissions of aerosols (which have a net cooling effect on the
climate). These emissions are also shorter-lived meaning that the contribution from these
emissions to peak warming largely depends on the emissions rate of the aerosols. Some
aerosols emissions are often co-emitted with GHG emissions, so efforts to reduce
emissions in the future and improve air quality mean that global emissions of aerosols are
expected to be reduced in the future, meaning that they are expected to suppress less the
GHG induced warming at the time of peak warming than they do today.
6 Nitrous oxide emissions have a perturbation lifetime of ~100 years in the atmosphere, meaning that,
unlike carbon dioxide, some of the warming caused by past nitrous oxide emissions early in the historical record will have decayed away. For the purposes of future nitrous oxide emissions over the next several decades, nitrous oxide can be treated largely analogous to CO2 when converted through the GWP-100 metric to CO2-equivalent emissions.
12
[UNCLASSIFIED]
[UNCLASSIFIED]
Variations in any one of these three factors has implications for the combinations of the other two
that would be consistent with a given climate outcome. Emissions of aerosols are not formally
regulated under climate policy frameworks (such as the Paris Agreement) so changes in aerosol
emissions are often considered as exogenous to climate policy considerations on the balance of
GHG emissions, despite not being entirely independent.
Overall, the higher the global rates of SLGHG emissions the lower the cumulative total of LLGHG
emissions that would be consistent with keeping expected peak warming to any level and vice
versa the lower the global rate of SLGHG emissions the greater the cumulative total of LLGHG
emissions. These physically-based trade-offs have been illustrated in the literature through the
use of simple climate models (e.g. Leahy et al. 2020) and summarised by the IPCC in Figure
SPM1 of the Special Report on Global Warming of 1.5°C.
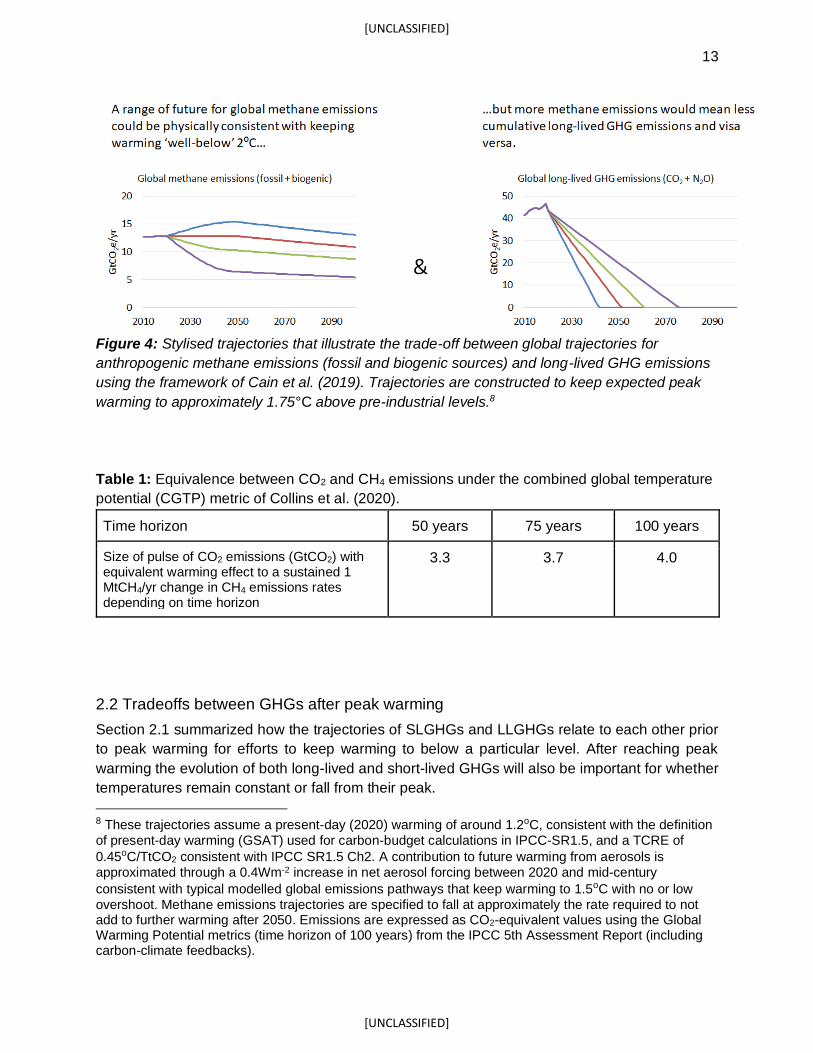
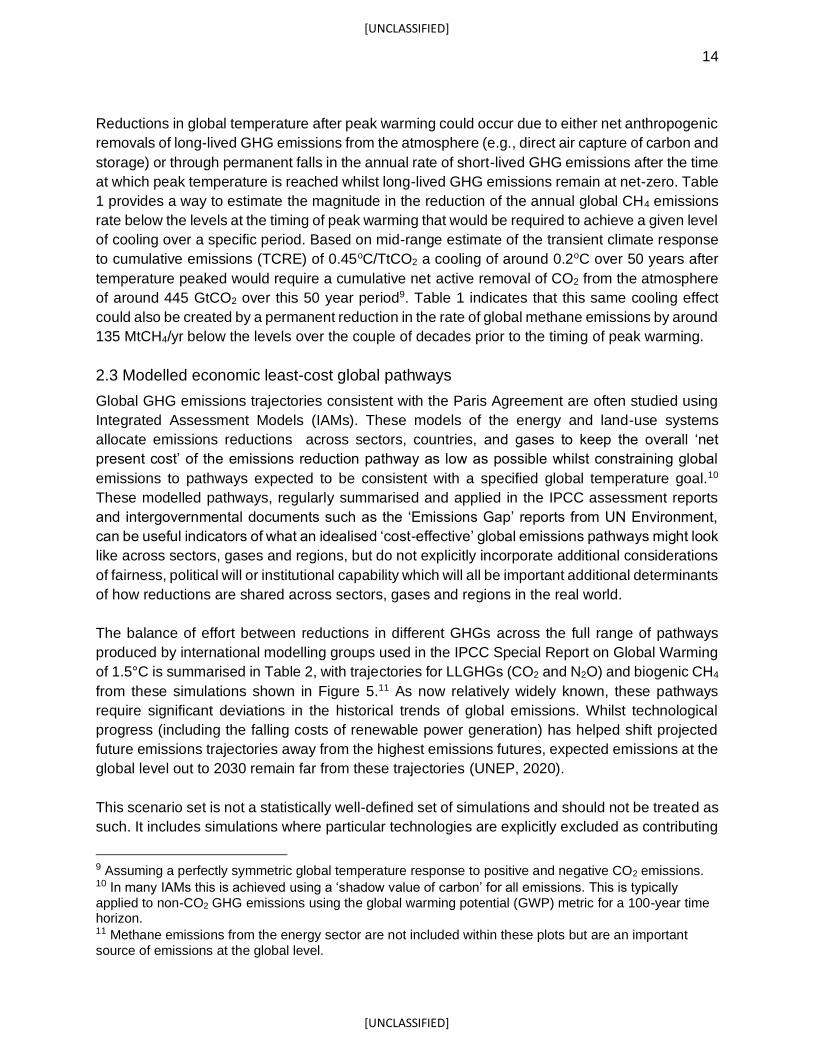
Alongside the use of simple climate models, the relationship between different futures for global
cumulative long-lived GHG emissions and reductions/increases in the rate of global short-lived
GHG emissions for can be explored for a wide range of situations using new emission metrics
(see Section 2.4); e.g., proposed metrics that more directly measure the ‘warming-equivalence’
between long-lived and short-lived GHG emissions (Allen et al., 2016, Allen et al., 2018, Collins
et al., 2018, Cain et al., 2019, Collins et al., 2020).7 An application of these metrics to approximate
trade-offs between global methane emission futures and futures of long-lived GHGs are shown in
Figure 4.
Table 1 provides conversion factors to approximate the amount of cumulative carbon dioxide
emissions that would create the same warming as a sustained change in the emissions rate of a
shorter-lived GHG such as methane. Whilst there is some variation across time horizons for these
factors, the fractional variation is significantly reduced relative to conventional metrics (e.g., global
warming potential - Section 2.4), suggesting that comparing pulses of LLGHGs and sustained
emissions rates of SLGHGs provides the most robust approximation for the effects on global
temperature across a range of timescales, and could be used to explore a wide range of
scenarios.
7 Collins et al. (2018), applied a process-based approach to assess the importance of methane reductions
for the 1.5°C target. Their modelling approach included indirect effects of methane on tropospheric ozone, stratospheric water vapour and the carbon cycle. They find a robust relationship between decreased CH4 concentration at the end of the century and increased amount of cumulative CO2 emissions up to 2100. This relationship is independent of climate sensitivity and temperature pathway. In terms of relation between end of the century emission changes in CH4 and CO2, their results achieve similar results as those obtained by Allen et al., 2016 in a GWP* context. Collins et al., 2018, also point out that the non-climate benefits of mitigating CH4 can be significantly larger than indicated by IAM studies.
13
[UNCLASSIFIED]
[UNCLASSIFIED]
Figure 4: Stylised trajectories that illustrate the trade-off between global trajectories for
anthropogenic methane emissions (fossil and biogenic sources) and long-lived GHG emissions
using the framework of Cain et al. (2019). Trajectories are constructed to keep expected peak
warming to approximately 1.75°C above pre-industrial levels.8
Table 1: Equivalence between CO2 and CH4 emissions under the combined global temperature
potential (CGTP) metric of Collins et al. (2020).
Time horizon 50 years 75 years 100 years
Size of pulse of CO2 emissions (GtCO2) with equivalent warming effect to a sustained 1 MtCH4/yr change in CH4 emissions rates depending on time horizon
3.3 3.7 4.0
2.2 Tradeoffs between GHGs after peak warming
Section 2.1 summarized how the trajectories of SLGHGs and LLGHGs relate to each other prior
to peak warming for efforts to keep warming to below a particular level. After reaching peak
warming the evolution of both long-lived and short-lived GHGs will also be important for whether
temperatures remain constant or fall from their peak.
8 These trajectories assume a present-day (2020) warming of around 1.2oC, consistent with the definition
of present-day warming (GSAT) used for carbon-budget calculations in IPCC-SR1.5, and a TCRE of
0.45oC/TtCO2 consistent with IPCC SR1.5 Ch2. A contribution to future warming from aerosols is
approximated through a 0.4Wm-2 increase in net aerosol forcing between 2020 and mid-century
consistent with typical modelled global emissions pathways that keep warming to 1.5oC with no or low
overshoot. Methane emissions trajectories are specified to fall at approximately the rate required to not add to further warming after 2050. Emissions are expressed as CO2-equivalent values using the Global Warming Potential metrics (time horizon of 100 years) from the IPCC 5th Assessment Report (including carbon-climate feedbacks).
14
[UNCLASSIFIED]
[UNCLASSIFIED]
Reductions in global temperature after peak warming could occur due to either net anthropogenic
removals of long-lived GHG emissions from the atmosphere (e.g., direct air capture of carbon and
storage) or through permanent falls in the annual rate of short-lived GHG emissions after the time
at which peak temperature is reached whilst long-lived GHG emissions remain at net-zero. Table
1 provides a way to estimate the magnitude in the reduction of the annual global CH4 emissions
rate below the levels at the timing of peak warming that would be required to achieve a given level
of cooling over a specific period. Based on mid-range estimate of the transient climate response
to cumulative emissions (TCRE) of 0.45oC/TtCO2 a cooling of around 0.2oC over 50 years after
temperature peaked would require a cumulative net active removal of CO2 from the atmosphere
of around 445 GtCO2 over this 50 year period9. Table 1 indicates that this same cooling effect
could also be created by a permanent reduction in the rate of global methane emissions by around
135 MtCH4/yr below the levels over the couple of decades prior to the timing of peak warming.
2.3 Modelled economic least-cost global pathways
Global GHG emissions trajectories consistent with the Paris Agreement are often studied using
Integrated Assessment Models (IAMs). These models of the energy and land-use systems
allocate emissions reductions across sectors, countries, and gases to keep the overall ‘net
present cost’ of the emissions reduction pathway as low as possible whilst constraining global
emissions to pathways expected to be consistent with a specified global temperature goal.10
These modelled pathways, regularly summarised and applied in the IPCC assessment reports
and intergovernmental documents such as the ‘Emissions Gap’ reports from UN Environment,
can be useful indicators of what an idealised ‘cost-effective’ global emissions pathways might look
like across sectors, gases and regions, but do not explicitly incorporate additional considerations
of fairness, political will or institutional capability which will all be important additional determinants
of how reductions are shared across sectors, gases and regions in the real world.
The balance of effort between reductions in different GHGs across the full range of pathways
produced by international modelling groups used in the IPCC Special Report on Global Warming
of 1.5°C is summarised in Table 2, with trajectories for LLGHGs (CO2 and N2O) and biogenic CH4
from these simulations shown in Figure 5.11 As now relatively widely known, these pathways
require significant deviations in the historical trends of global emissions. Whilst technological
progress (including the falling costs of renewable power generation) has helped shift projected
future emissions trajectories away from the highest emissions futures, expected emissions at the
global level out to 2030 remain far from these trajectories (UNEP, 2020).
This scenario set is not a statistically well-defined set of simulations and should not be treated as
such. It includes simulations where particular technologies are explicitly excluded as contributing
9 Assuming a perfectly symmetric global temperature response to positive and negative CO2 emissions. 10 In many IAMs this is achieved using a ‘shadow value of carbon’ for all emissions. This is typically
applied to non-CO2 GHG emissions using the global warming potential (GWP) metric for a 100-year time horizon. 11 Methane emissions from the energy sector are not included within these plots but are an important
source of emissions at the global level.
15
[UNCLASSIFIED]
[UNCLASSIFIED]
to the emissions reductions (e.g., nuclear) and come from a wide set of models with varying levels
of detail regarding the representation of energy system technologies, varying assumptions
regarding their relative costs, and varying assumptions about global developments (e.g.,
population, economic growth and development) in the absence of climate policies or impacts.
Some scenarios also impose specific behavioural change (e.g., diet preferences) future
exogenous to the modelling framework (van Vuuren et al., 2018). Differences in the evolution of
the global energy systems can be larger between different models as it can between different
levels of climate ambition within the same model. Although the differing assumptions and
outcomes in the land and agriculture sector have been studied (Popp et al., 2017), it is difficult to
clearly identify the drivers of differences between the high-level global emissions outcomes
without additional targeted experiments, and the fundamental drivers of different balances
between reductions in biogenic methane and LLGHGs within these modelling frameworks in
pursuit of ambitious climate objectives remain poorly understood.
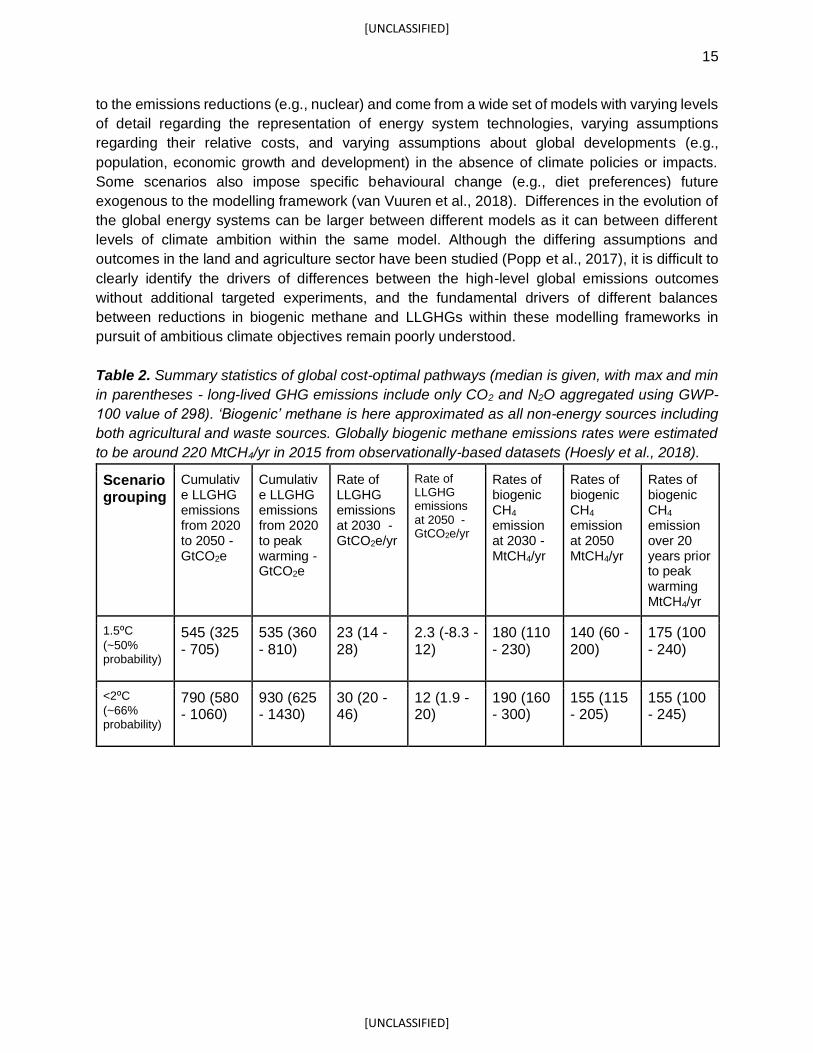
Table 2. Summary statistics of global cost-optimal pathways (median is given, with max and min
in parentheses - long-lived GHG emissions include only CO2 and N2O aggregated using GWP-
100 value of 298). ‘Biogenic’ methane is here approximated as all non-energy sources including
both agricultural and waste sources. Globally biogenic methane emissions rates were estimated
to be around 220 MtCH4/yr in 2015 from observationally-based datasets (Hoesly et al., 2018).
Scenario grouping
Cumulative LLGHG emissions from 2020 to 2050 - GtCO2e
Cumulative LLGHG emissions from 2020 to peak warming - GtCO2e
Rate of LLGHG emissions at 2030 - GtCO2e/yr
Rate of LLGHG emissions at 2050 - GtCO2e/yr
Rates of biogenic CH4 emission at 2030 - MtCH4/yr
Rates of biogenic CH4 emission at 2050 MtCH4/yr
Rates of biogenic CH4 emission over 20 years prior to peak warming MtCH4/yr
1.5⁰C
(~50% probability)
545 (325 - 705)
535 (360 - 810)
23 (14 - 28)
2.3 (-8.3 - 12)
180 (110 - 230)
140 (60 - 200)
175 (100 - 240)
<2⁰C
(~66% probability)
790 (580 - 1060)
930 (625 - 1430)
30 (20 - 46)
12 (1.9 - 20)
190 (160 - 300)
155 (115 - 205)
155 (100 - 245)

16
[UNCLASSIFIED]
[UNCLASSIFIED]
Figure 5: The spread of GHG emission pathways in the IPCC SR1.5 scenarios database for
Long-lived GHGs (CO2 and N2O) and biogenic CH4. Solid lines denote the median of the scenario
set.
Figure 5 illustrates the different roles the gases CO2, CH4 and N2O can play in future model-based
emissions pathways that are compatible with the temperature ambitions of the Paris Agreement.
The global emissions of CO2 have to go to net zero around the middle or second half of the
century, depending on level of temperature ambition. Large reductions in CH4 and N2O are also
generally found in these modelled pathways but there is more variation. The model studies found
that strong reductions in methane are simulated in all pathways, but zero CH4 is not achieved in
any pathway. This non-zero global residual CH4 emission is due to the assumed cost of reducing
the remaining CH4 emissions not because of its physical properties (Harmsen et al., 2019). For
N2O, the pathways show smaller reductions or even modest increases depending on the degree
of future fertilizer use. N2O emission pathways also do not reach net-zero. The large spread in
possible pathways for emissions of CH4 and N2O are worth noting, reflecting different
assumptions about abatement costs including potential for demand-side changes. However, in
the vast majority of these modelled least economic cost global pathways, biogenic CH4 emissions
are seen to decline strongly by mid-century. This reduces the level of global average CH4-induced
warming relative to the warming these emissions are causing at present.
Peak warming generally occurs around 2050 in scenarios that keep warming to 1.5°C with ~50%
probability - approximately corresponding with the date of global net-zero CO2 emissions (Figure
2.6 in UK CCC, 2019). Although net long-lived GHG emissions remain positive at the time of peak
warming (due to some residual N2O emissions in all scenarios), the effect of falling methane
emissions over the decades prior to 2050 (which reduces CH4-induced levels of global
17
[UNCLASSIFIED]
[UNCLASSIFIED]
temperature rise) temporarily acts to offset some of the temperature implications of these residual
long-lived GHG emissions, sufficient to bring global temperature to a peak.12
Many of these scenarios continue to reduce CO2 emissions further so that global CO2 (and long-
lived GHG) emissions go net-negative. This has the effect of reducing temperatures after peak
warming has been reached, but doesn’t significantly contribute to the level of peak warming
achieved. In many scenarios that peak warming at around 1.5°C (or less than 0.1°C of overshoot)
by 2050 the net-negative CO2 emissions largely contribute to temperatures declining from their
peak to around 1.3°C by 2100. Alternative pathways exist that would avoid these net-negative
emissions - for example Rogelj et al. (2019) shows that pathways which reach net-zero CO2
emissions around 2040 and then maintain this level still achieve a peak temperature around 1.5°C
with warming remaining around this level out to 2100, in part due to the continued reduction of
global methane emissions after warming peaks acting to offset any increases in the level of global
temperature due to non-zero residual (non-CO2) long-lived GHG emissions. In the long-term
(centennial timescales) it may be necessary to have a certain amount of net negative global CO2
emissions even to sustain global temperature at a constant level. This is to counter any slow Earth
System feedbacks such as permafrost thawing which would add to atmospheric concentrations
(and therefore warming) over long timescales (see Section 1).
After the completion of SR1.5, new scenarios have been developed by various scenario groups.
These may give more insight to cost optimal emissions pathways for these gases and provide a
stronger knowledge basis for options to reach the temperature goals.
2.4 Emission metrics
The Global Warming Potential (GWP) is defined as the time-integrated radiative forcing (RF) due
to a pulse emission of a non-CO2 gas, relative to a pulse emission of an equal mass of CO2. It is
used for expressing the effects of different emissions on a common scale; so-called ‘CO2
equivalent emissions’. The GWP was presented in the First IPCC Assessment, where it was
stated that “It must be stressed that there is no universally accepted methodology for combining
all the relevant factors into a single global warming potential for greenhouse gas emissions. A
simple approach has been adopted here to illustrate the difficulties inherent in the concept, …”.
Since then, the GWP has become a widely used metric for aggregation of different gases to ‘CO2
equivalent emissions’ in the context of reporting emissions as well as in designing and assessing
climate policies. The GWP for a time horizon of 100 years was adopted as a metric to implement
the multi-gas approach embedded in the United Nations Framework Convention on Climate
Change (UNFCCC) and made operational in the 1997 Kyoto Protocol.
12 This compensatory effect of falling methane emissions could only temporarily offset the additional
warming from continued positive emissions of long-lived GHGs, as falling methane emissions could not be maintained forever, ultimately keeping warming constant would require net-zero long-lived GHG emissions to be reached, necessitating net-negative emissions of CO2 as some level of residual positive agricultural N2O emissions are expected to be unavoidable.
18
[UNCLASSIFIED]
[UNCLASSIFIED]
The numerical values for GWP have been updated in the successive IPCC reports, as a
consequence of updated science but also due to the changes occurring in the atmosphere; in
particular the CO2 concentration to which the radiative forcing has a non-linear relation.
Since its introduction, the concept has been evaluated and tested for use in design of mitigation
policies. IPCC AR4 stated that “Although it has several known shortcomings, a multi-gas strategy
using GWPs is very likely to have advantages over a CO2-only strategy (O’Neill, 2003). Thus,
GWPs remain the recommended metric to compare future climate impacts of emissions of long-
lived climate gases.” In IPCC AR5, the assessment concluded that “The choice of metric and time
horizon depends on the particular application and which aspects of climate change are considered
relevant in a given context. Metrics do not define policies or goals but facilitate evaluation and
implementation of multi-component policies to meet particular goals. All choices of metric contain
implicit value-related judgements such as type of effect considered and weighting of effects over
time.”
The Paris Agreement text does not explicitly specify any emission metric for aggregation of GHGs,
but under the Paris rulebook adopted at COP 24 in Katowice [Decision 18/CMA.1, annex,
paragraph 37], parties have agreed to use GWP-100 values from the IPCC AR5 or GWP-100
values from a subsequent IPCC assessment to report aggregate emissions and removals of
GHGs and for accounting under NDCs. In addition, it is also stated that parties may use other
metrics to report supplemental information on aggregate emissions and removals of greenhouse
gases.
After IPCC AR5, new metric concepts have been published; some of them building on the
similarity in behaviour of a sustained change in SLGHG and pulse of CO2 (Allen et al., 2016),
similar to the approach explored earlier by Lauder et al. (2013).
This new approach for comparing emissions, denoted GWP*, uses the same GWP values, but
apply rate of change in emissions of the short-lived gas, e.g., methane. Cain et al. (2019) refined
the concept to better represent the relationship between cumulative CO2-warming-equivalent
emissions and modelled warming in diverse CH4 mitigation scenarios by taking into account the
delayed warming impact of past methane emission increases. Lynch et al. (2020) demonstrated
this for idealized cases. Collins et al. (2020) take an analytical approach and derive the combined
global temperature change potential (CGTP) metric for calculating an equivalence between a
sustained step-change in SLGHG emissions and a CO2 emissions pulse. Collectively, these
metrics that represent SLGHG emissions with a rate of emissions of CO2 that would have the
same impact on global temperatures are known as “warming-equivalent”.
These mixed step-pulse metrics can be used to aggregate SLGHG together with CO2 and
approximate the development of temperature relative to a reference year. In this way, the mixed
step-pulse metrics allow for inclusion of SLGHG into the relation between cumulative CO2-
equivalent emissions and temperature change.
It is important to note that the two metric concepts GWP* and GWP measure different things.
GWP measures the warming effect from emissions of a gas (e.g., CH4) relative to the absence of
19
[UNCLASSIFIED]
[UNCLASSIFIED]
that emission, whereas GWP* measures the warming effect from that emission relative to the
warming from a reference emissions level. Thus, the physical quantity that is being compared for
SLGHGs emissions relative to the warming from CO2 is different for the two metrics. The
differences are shown in the stylised example in Figure 2. For both LLGHGs and SLGHGs their
past emissions contribute to global temperatures remaining above preindustrial levels in the
future. For LLGHGs the contribution from past emissions persists at current levels for centuries.
For SLGHGs their past contribution to temperature change above preindustrial decays over the
next few decades (compare blue segments in Figure 2a and 2b). Therefore, the global
temperature change contributed by post-2020 CH4 emissions is quite different to the change in
the global temperature level, comparing the 2020 reference level to the level at a future date,
unlike for CO2. This is because the contribution of CH4 to warming from past emissions will decay
over time (Figure 2b).
The fundamental science underlying these metrics is well established and much of the ongoing
debate is about the framing and applications of metrics for various questions and contexts.
Metrics can also be used for assessing the concept “GHG balance” as used in Article 4 in the
Paris Agreement. Fuglestvedt et al. (2018) tested metrics for calculation of temperature response
to various composition of GHGs and found that balance determined using GWP* imply
approximately constant temperatures once the balance has been achieved, whereas a balance
based on GWP implies slowly declining temperatures when the mix of GHGs contains a significant
positive contribution from SLGHGs13. This raises issues related to consistency between Article 4
and Article 2 in the Paris Agreement and what the ultimate temperature goal of the agreement is
(Fuglestvedt et al. 2018; Schleussner et al., 2019). Tanaka and O’Neill (2018) find that net zero
GHG emissions (in terms of GWP-100) are not necessarily required to remain below 1.5°C or
2°C, assuming either target can be achieved without temporarily overshooting these warming
levels.
It is useful to consider how trading emissions under GWP-100 affects surface temperature
change. Different combinations of LLGHGs and SLGHGs can give the same overall CO2
equivalent emission trajectory (when aggregated using GWP-100 values) (e.g., Fuglestvedt et a.,
2000, Fuglestvedt et al., 2003; Myhre et al., 2013; Allen et al., 2016; Allen et al., 2018). Globally
the ambiguity generated for realistic strong mitigation pathways has been found to be important
at the 10% level (or 0.17°C) (Denison et al., 2019). However, larger ambiguities could exist at
sector and country level; e.g., in countries where methane emissions represent a larger fraction
of total greenhouse gas emissions.
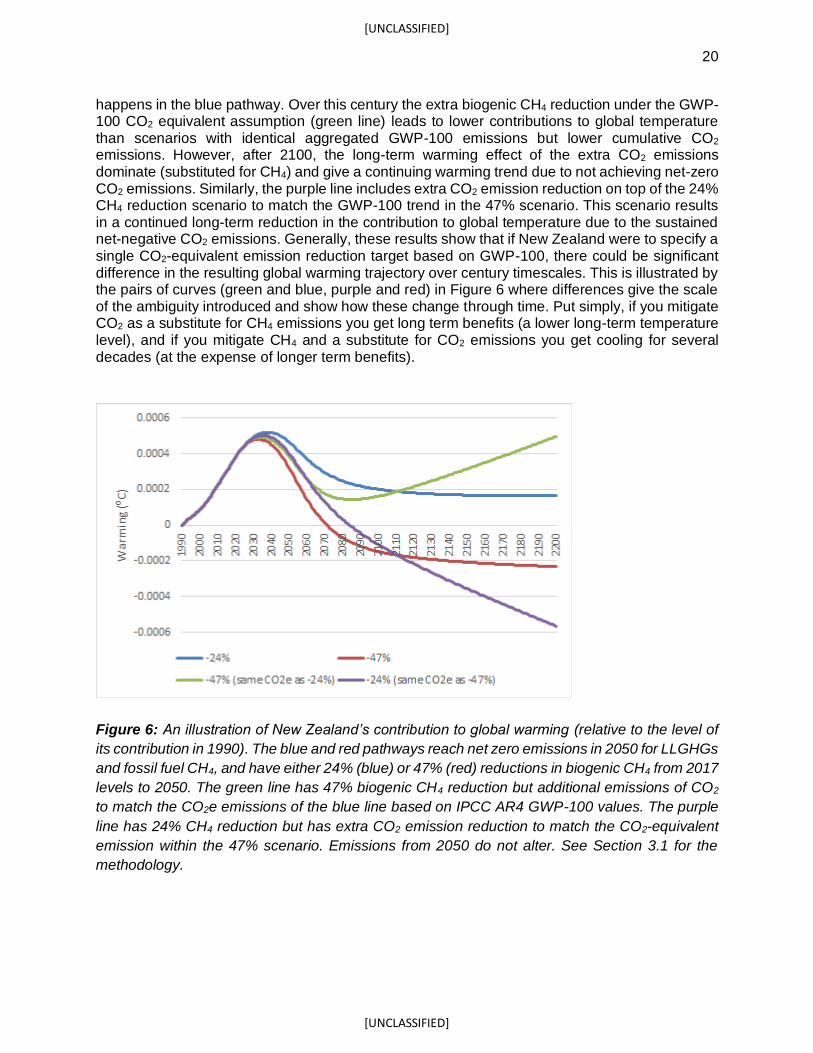
Figure 6 illustrates the temperature responses for different and purely hypothetical scenarios for New Zealand. The blue and green lines (or the purple and red) are contributions from pathways with the same total CO2 equivalent emission trajectory (based on GWP-100) but different trajectories of CO2 and biogenic CH4 emissions comprising it. The green pathway has 47% biogenic CH4 reductions by 2050 but at the expense of extra CO2 emissions (to match the CO2-equivalent emissions of the blue line) and does not reach net zero CO2 emissions by 2050, which
13 Balance based on GWP could theoretically lead to a warming effect if SLGHG removal is used to
balance ongoing CO2 emissions on a large scale.
20
[UNCLASSIFIED]
[UNCLASSIFIED]
happens in the blue pathway. Over this century the extra biogenic CH4 reduction under the GWP-100 CO2 equivalent assumption (green line) leads to lower contributions to global temperature than scenarios with identical aggregated GWP-100 emissions but lower cumulative CO2 emissions. However, after 2100, the long-term warming effect of the extra CO2 emissions dominate (substituted for CH4) and give a continuing warming trend due to not achieving net-zero CO2 emissions. Similarly, the purple line includes extra CO2 emission reduction on top of the 24% CH4 reduction scenario to match the GWP-100 trend in the 47% scenario. This scenario results in a continued long-term reduction in the contribution to global temperature due to the sustained net-negative CO2 emissions. Generally, these results show that if New Zealand were to specify a single CO2-equivalent emission reduction target based on GWP-100, there could be significant difference in the resulting global warming trajectory over century timescales. This is illustrated by the pairs of curves (green and blue, purple and red) in Figure 6 where differences give the scale of the ambiguity introduced and show how these change through time. Put simply, if you mitigate CO2 as a substitute for CH4 emissions you get long term benefits (a lower long-term temperature level), and if you mitigate CH4 and a substitute for CO2 emissions you get cooling for several decades (at the expense of longer term benefits).
Figure 6: An illustration of New Zealand’s contribution to global warming (relative to the level of
its contribution in 1990). The blue and red pathways reach net zero emissions in 2050 for LLGHGs
and fossil fuel CH4, and have either 24% (blue) or 47% (red) reductions in biogenic CH4 from 2017
levels to 2050. The green line has 47% biogenic CH4 reduction but additional emissions of CO2
to match the CO2e emissions of the blue line based on IPCC AR4 GWP-100 values. The purple
line has 24% CH4 reduction but has extra CO2 emission reduction to match the CO2-equivalent
emission within the 47% scenario. Emissions from 2050 do not alter. See Section 3.1 for the
methodology.
21
[UNCLASSIFIED]
[UNCLASSIFIED]
3. Considerations for national pathways consistent with keeping
warming to 1.5°C
Section 2 considered the tradeoffs between mitigation of different greenhouse gases. This section
discusses other considerations that could be taken into account in national pathways. There is no
fundamental physical reason why a national pathway should follow either the global temperature
or the global emissions trajectory, given different national circumstances and different mix of
sectors with different long-lived and short-lived greenhouse gases.
3.1 National contribution to global warming.
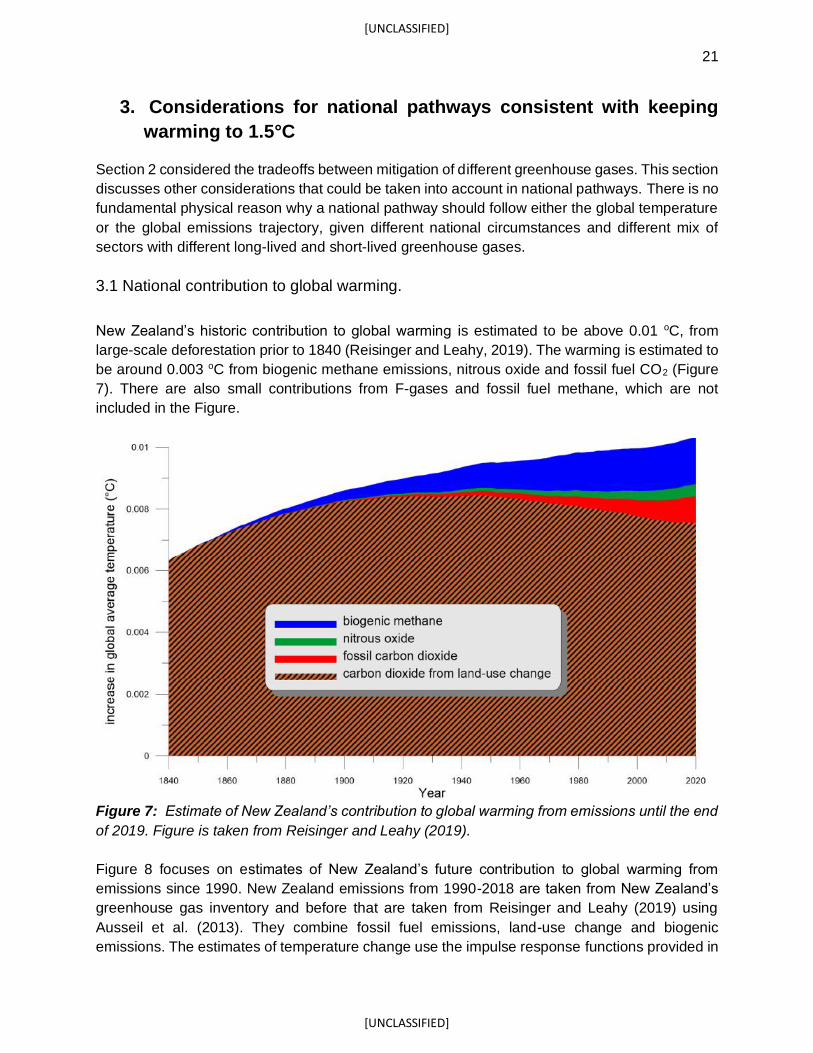
New Zealand’s historic contribution to global warming is estimated to be above 0.01 oC, from
large-scale deforestation prior to 1840 (Reisinger and Leahy, 2019). The warming is estimated to
be around 0.003 oC from biogenic methane emissions, nitrous oxide and fossil fuel CO2 (Figure
7). There are also small contributions from F-gases and fossil fuel methane, which are not
included in the Figure.
Figure 7: Estimate of New Zealand’s contribution to global warming from emissions until the end
of 2019. Figure is taken from Reisinger and Leahy (2019).
Figure 8 focuses on estimates of New Zealand’s future contribution to global warming from
emissions since 1990. New Zealand emissions from 1990-2018 are taken from New Zealand’s
greenhouse gas inventory and before that are taken from Reisinger and Leahy (2019) using
Ausseil et al. (2013). They combine fossil fuel emissions, land-use change and biogenic
emissions. The estimates of temperature change use the impulse response functions provided in
22
[UNCLASSIFIED]
[UNCLASSIFIED]
the IPCC 5th Assessment Report for calculating GHG metrics as a simple climate model. Non-
GHG contributions to warming (e.g., aerosol emissions) are not part of these scenarios.
The blue and red curves in Figure 8 approximate the range of New Zealand’s possible future
contributions to global warming under current policies, with a range of idealised assumptions after
2050. Under both 24% and 47% biogenic CH4 reduction policies, New Zealand is beginning to
reverse its contribution to global warming by around 2040. Under 24% reduction policies, the 2050
contribution to the level of global warming from New Zealand’s emission since 1990 matches
today’s level of New Zealand’s contribution to the level of global warming. Under 47% biogenic
CH4 reduction policies, the 2050 level of global warming from New Zealand’s emissions
approximately matches that from 2015.
Contributions to global temperature rise are sensitive to the shape of the emissions reduction
profile as well as the end point reached in 2050 or any other year when mitigation approaches
might change. This is particularly so for LLGHG pollutants, but less so for SLGHGs. Early
reductions in LLGHGs have lower cumulative LLGHG emissions and overall less climate impact
in the longer term (see Section 2.3). However, the most relevant factor for New Zealand’s
contribution to global temperatures rise above pre-industrial levels over most of this century will
be the level of reduction of SLGHGs.
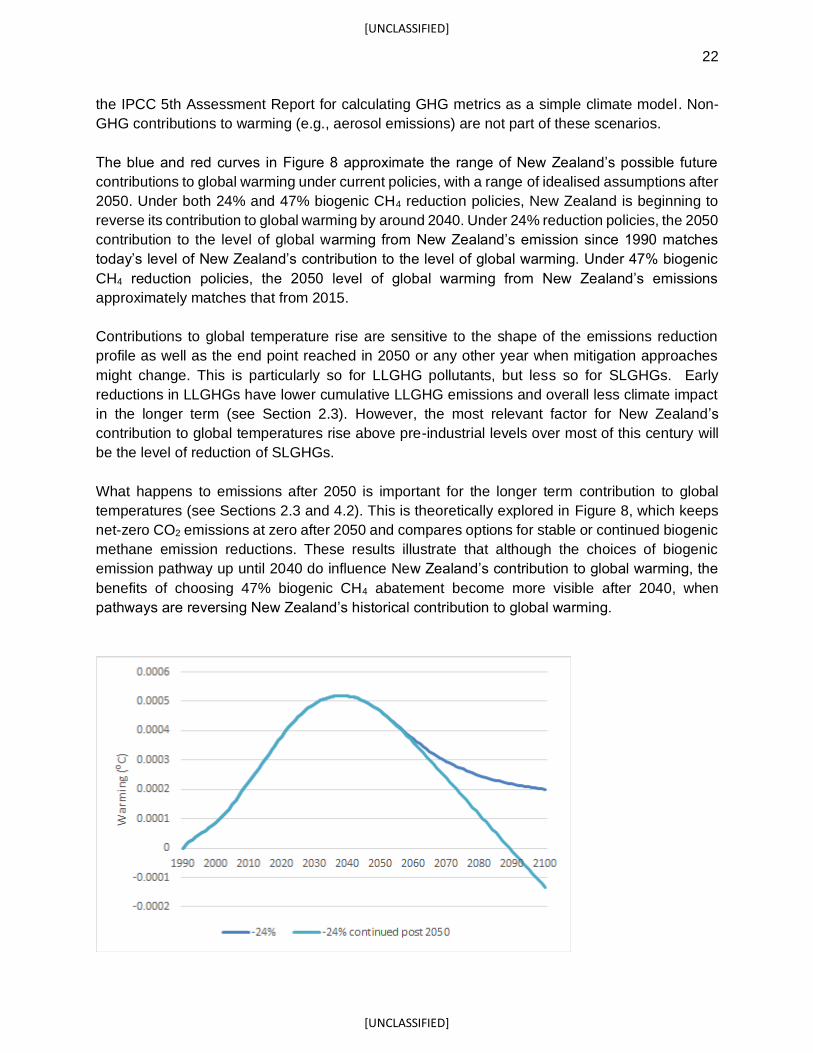
What happens to emissions after 2050 is important for the longer term contribution to global
temperatures (see Sections 2.3 and 4.2). This is theoretically explored in Figure 8, which keeps
net-zero CO2 emissions at zero after 2050 and compares options for stable or continued biogenic
methane emission reductions. These results illustrate that although the choices of biogenic
emission pathway up until 2040 do influence New Zealand’s contribution to global warming, the
benefits of choosing 47% biogenic CH4 abatement become more visible after 2040, when
pathways are reversing New Zealand’s historical contribution to global warming.
23
[UNCLASSIFIED]
[UNCLASSIFIED]
Figure 8: As Figure 6, except emissions reductions continue beyond 2050. 24% biogenic CH4
reduction by 2050, shown in the top panel and 47% reduction in the bottom panel. The panels
have two scenarios: emissions unchanged after 2050, matching Figure 6, and the biogenic
methane reduction rate continuing after 2050.
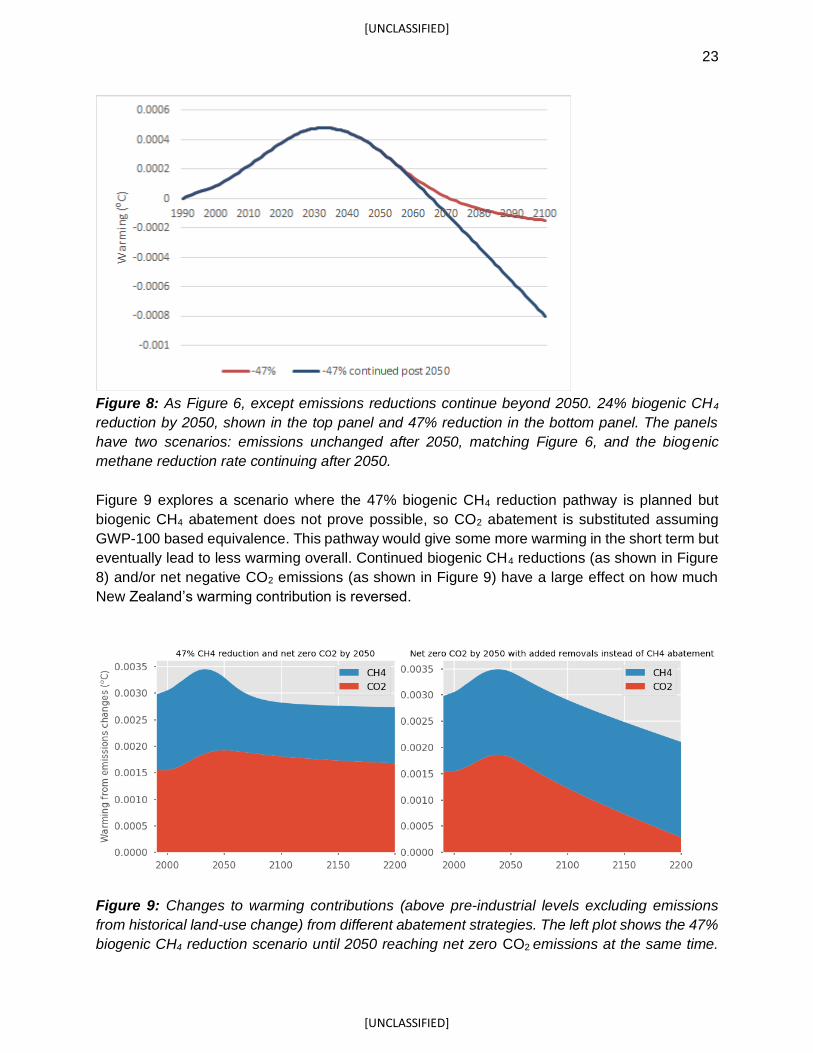
Figure 9 explores a scenario where the 47% biogenic CH4 reduction pathway is planned but
biogenic CH4 abatement does not prove possible, so CO2 abatement is substituted assuming
GWP-100 based equivalence. This pathway would give some more warming in the short term but
eventually lead to less warming overall. Continued biogenic CH4 reductions (as shown in Figure
8) and/or net negative CO2 emissions (as shown in Figure 9) have a large effect on how much
New Zealand’s warming contribution is reversed.
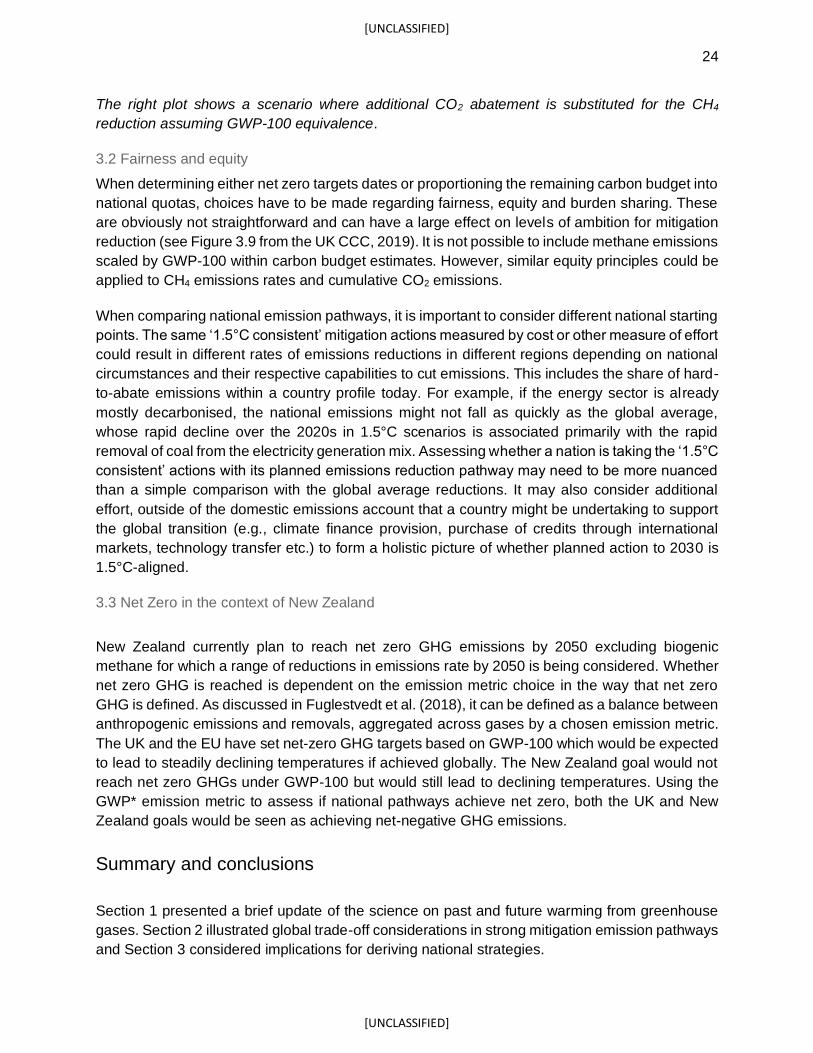
Figure 9: Changes to warming contributions (above pre-industrial levels excluding emissions
from historical land-use change) from different abatement strategies. The left plot shows the 47%
biogenic CH4 reduction scenario until 2050 reaching net zero CO2 emissions at the same time.
24
[UNCLASSIFIED]
[UNCLASSIFIED]
The right plot shows a scenario where additional CO2 abatement is substituted for the CH4
reduction assuming GWP-100 equivalence.
3.2 Fairness and equity
When determining either net zero targets dates or proportioning the remaining carbon budget into
national quotas, choices have to be made regarding fairness, equity and burden sharing. These
are obviously not straightforward and can have a large effect on levels of ambition for mitigation
reduction (see Figure 3.9 from the UK CCC, 2019). It is not possible to include methane emissions
scaled by GWP-100 within carbon budget estimates. However, similar equity principles could be
applied to CH4 emissions rates and cumulative CO2 emissions.
When comparing national emission pathways, it is important to consider different national starting
points. The same ‘1.5°C consistent’ mitigation actions measured by cost or other measure of effort
could result in different rates of emissions reductions in different regions depending on national
circumstances and their respective capabilities to cut emissions. This includes the share of hard-
to-abate emissions within a country profile today. For example, if the energy sector is already
mostly decarbonised, the national emissions might not fall as quickly as the global average,
whose rapid decline over the 2020s in 1.5°C scenarios is associated primarily with the rapid
removal of coal from the electricity generation mix. Assessing whether a nation is taking the ‘1.5°C
consistent’ actions with its planned emissions reduction pathway may need to be more nuanced
than a simple comparison with the global average reductions. It may also consider additional
effort, outside of the domestic emissions account that a country might be undertaking to support
the global transition (e.g., climate finance provision, purchase of credits through international
markets, technology transfer etc.) to form a holistic picture of whether planned action to 2030 is
1.5°C-aligned.
3.3 Net Zero in the context of New Zealand
New Zealand currently plan to reach net zero GHG emissions by 2050 excluding biogenic
methane for which a range of reductions in emissions rate by 2050 is being considered. Whether
net zero GHG is reached is dependent on the emission metric choice in the way that net zero
GHG is defined. As discussed in Fuglestvedt et al. (2018), it can be defined as a balance between
anthropogenic emissions and removals, aggregated across gases by a chosen emission metric.
The UK and the EU have set net-zero GHG targets based on GWP-100 which would be expected
to lead to steadily declining temperatures if achieved globally. The New Zealand goal would not
reach net zero GHGs under GWP-100 but would still lead to declining temperatures. Using the
GWP* emission metric to assess if national pathways achieve net zero, both the UK and New
Zealand goals would be seen as achieving net-negative GHG emissions.
Summary and conclusions
Section 1 presented a brief update of the science on past and future warming from greenhouse
gases. Section 2 illustrated global trade-off considerations in strong mitigation emission pathways
and Section 3 considered implications for deriving national strategies.
25
[UNCLASSIFIED]
[UNCLASSIFIED]
In the further development of policy towards New Zealand’s contribution to the global effort of
achieving the Paris temperature goals, our report has highlighted several issues and choices that
would benefit from consideration. These are outlined below:
4.1 Evolving science
As knowledge is being developed and assessment reports are being published, it is important to
be clear and transparent about what is used as the basis for the policy design; i.e. which
parameter values and which definitions are adopted and used and how they might be revised as
science understanding evolves.
4.2 Abatement choices
Choices of approach not only need to consider the physical science uncertainty but also need to
consider the overall objectives of the climate policy and the practicalities of usage and
communication. As illustrated in Section 3.1, the selection of greenhouse gases and as well as
the emission metric used will have a significant effect on timing and efforts to achieve net zero
and on the resulting global warming. The UK legislated for a net zero target in terms of GWP-100
emissions. One of the reasons given was that such a target would actively decrease its future
warming commitment over time (see Section 2.1 and 3.1). For New Zealand to continue to
decrease its future warming commitment after 2050, additional CH4 reductions and/or negative
emissions of CO2 would be needed (Section 3.1).
New Zealand, by employing a two-target approach, one for biogenic methane and one for other
greenhouse gases, largely avoids complications to do with emission metrics discussed in Section
2.4. However, if at a future date biogenic CH4 and CO2 abatements were traded as illustrated in
Figure 9, the way of doing this trading would need to be considered. Using a GWP-100 metric
would lead to long term additional cooling effect but shorter term additional warming when using
carbon dioxide removal as a substitute for methane abatement (see Figure 9). However, other
metric choices for trading between the gases could be considered. More generally, Sections 2.2
and 3.1, showed how it is possible to reverse the global warming trend and/or a nation’s
contribution to it by either a net removal of cumulative CO2 emissions or by a permanent reduction
in the rate of methane emissions below the levels at the time of peak warming. Where 445 GtCO2
removal would have the same cooling effect as a permanent reduction in the rate of global
methane emissions by around 135 MtCH4/yr.
The Paris Agreement aims for a net-zero type target on a global basis. In the development of
mitigation strategies for a single country it is important to consider how the plans for net zero
might be achieved internationally and how a nation’s plan fits into the international effort (i.e.,
which countries might achieve net negative, net zero or net positive emissions, and how
international trading is used).

26
[UNCLASSIFIED]
[UNCLASSIFIED]
4.3 Pathways after net-zero
As shown in the pathways in SR1.5, achieving net zero CO2 is just one part of the challenge in
limiting future warming. Plans for the further path of emissions of the individual gases after net
zero target is achieved also need to be addressed and communicated, particularly how
greenhouse gas removal can be sustained given finite and competing interest for land resources
(see Section 3.1).
4.4 Defining national high-ambition pathways
Which fairness and equity principles that are applied as rationale for New Zealand’s efforts are
important to communicate as a part of a mitigation strategy. As New Zealand’s starting position
in terms of sectoral emissions is different from other nations, a high ambition emission reduction
trajectory might look quite different to a high ambition pathway from another country. In particular,
many countries are expected to rapidly decarbonise their power sector out to 2030, leading to
large national emission reductions in the 2020s. In countries such as New Zealand (and the UK)
where the power sector is already mostly decarbonised, urgent actions are needed on other
sectors such as agriculture, buildings and transport for mitigation compatible with Paris
Agreement ambitions. Policy actions in these areas might take longer to manifest themselves in
emissions trends. Such a pathway was presented for the UK 6th carbon budget (UK CCC, 2020),
where actions over 2020-2025 only produced modest emission reduction by laying the
groundwork for march larger emission reductions at the end of the 2020s.
New Zealand, by getting to net zero CO2 as soon as possible with concerted action to substantially
reduce biogenic CH4 emissions as much as possible, can limit the contribution it makes to global
warming which is expected to peak around 2040 and then begin to reverse. If actions continue to
2050 and beyond, New Zealand could substantially reduce its historic contribution to global
warming from fossil fuel emissions, nitrous oxide and biogenic methane by the end of the century.
References
Allen M.R., Fuglestvedt, J.S, Shine, K. P., Reisinger, A., Pierrehumbert, R.T., and Forster, P.M., 2016: New use of global warming potentials to compare cumulative and short-lived climate pollutants. Nature Climate Change, 6, 773-776, doi: 10.1038/nclimate2998
Allen, M. R., K. P. Shine, J. S. Fuglestvedt, R. J. Millar, M. Cain, D. J. Frame, and A. H. Macey, 2018: A solution to the misrepresentations of CO2-equivalent emissions of short-lived climate pollutants under ambitious mitigation. Nature npj Climate and Atmospheric Science, 1(2018-16), doi: 10.1038/s41612-018-0026-8.
Ausseil A-GE, Kirschbaum MUF, Andrew RM, McNeill S, Dymond JR, Carswell F, Mason NWH 2013 Climate regulation in New Zealand: contribution of natural and managed ecosystems. In Dymond JR ed. Ecosystem services in New Zealand – conditions and trends. Manaaki Whenua Press, Lincoln, New Zealand.
Cain, M., Lynch, J., Allen, M. R., Fuglestvedt, J. S., Frame, D. J., and Macey, A. H. (2019). Improved calculation of warming-equivalent emissions for short-lived climate pollutants. NPJ Clim. Atmos. Sci. 2, 1–7. doi:10.1038/s41612-019-0086-4.
Collins, W.J., C.P. Webber, P.M. Cox, C. Huntingford, J. Lowe, S. Sitch, S.E. Chadburn, E. Comyn-Platt, A.B. Harper, G. Hayman and T. Powell, 2018: Increased importance of methane reduction for a 1.5 degree target. Environmental Research Letters, 13(5) https://doi.org/10.1088/1748-9326/aab89c

27
[UNCLASSIFIED]
[UNCLASSIFIED]
Collins, W. J., Frame, D. J., Fuglestvedt, J., and Shine, K. P. (2020). Stable climate metrics for emissions of short and long-lived species – combining steps and pulses. Environ. Res. Lett. https://doi.org/10.1088/1748-9326/ab6039
Denison S., Forster P.M., Smith C.J., 2019: Guidance on emissions metrics for nationally determined contributions under the Paris Agreement. Environmental Research Letters, 10 (7-10), https://doi.org/10.1088/1748-9326/ab4df4
de Richter, Tingzhen Ming, Philip Davies, Wei Liu, Sylvain Caillol, Removal of non-CO2 greenhouse gases by large-scale atmospheric solar photocatalysis, Progress in Energy and Combustion Science, Volume 60, 2017, Pages 68-96, ISSN 0360-1285, https://doi.org/10.1016/j.pecs.2017.01.001.
Etminan, M., Myhre, G., Highwood, E. J., and Shine, K. P. (2016). Radiative forcing of carbon dioxide, methane, and nitrous oxide: A significant revision of the methane radiative forcing. Geophys. Res. Lett. 43, 12,614-12,623. https://doi.org/10.1002/2016GL071930
Forster P.M., A.C. Maycock, C.M. McKenna and C.J. Smith, 2019: Latest climate models confirm need for urgent mitigation. Nature Climate Change, 1–14, https://doi.org/10.1038/s41558-019-0660-0
Forster, P. M., Forster, H. I., Evans, M. J., Gidden, M. J., Jones, C. D., Keller, C. A., et al. (2020). Current and future global climate impacts resulting from COVID-19. Nature Climate Change. https://doi.org/10.1038/s41558-020-0883-0
Fuglestvedt J.S., Rogelj, R. J. Millar, M. Allen, O. Boucher, M. Cain, P. M. Forster, E. Kriegler and D. Shindell., 2018: Implications of possible interpretations of ‘greenhouse gas balance’ in the Paris Agreement. Philosophical Transaction of the Royal Society A, 376(2119), DOI:https://doi.org/10.1098/rsta.2016.0445
Fuglestvedt J.S., Berntsen T.K. and Skodvin T., 2000: Climate implications of GWP‐based reductions in
greenhouse gas emissions. Geophysical Research Letters, 27(3), 409–412.
Fuglestvedt J.S., Berntsen T.K., Godal O., Sausen R., Shine K.P. and Skodvin T., 2003 Metrics of Climate Change: Assessing Radiative Forcing and Emission Indices. Climatic Change, 58, 267-331, doi:10.1023/A:1023905326842 .
Gasser T. et al., 2016: Accounting for the climate–carbon feedback in emission metrics. Earth System Dynamics, 8, 235-253, doi: 10.5194/esd-8-235-2017.
Hawkins E. et al., 2017: Estimating Changes in Global Temperature since the Preindustrial Period. American Meteorological Society, 98(9), 1841-1856https://doi.org/10.1175/BAMS-D-16-0007.1
Harmsen, J.H.M., Detlef P. van Vuuren, Dali R. Nayak, Andries F. Hof, Lena Höglund-Isaksson, Paul L. Lucas, Jens B. Nielsen, Pete Smith, Elke Stehfest, 2019: Long-term marginal abatement cost curves of non-CO2 greenhouse gases, Environmental Science & Policy, Volume 99, 2019, Pages 136-149, ISSN 1462-9011, https://doi.org/10.1016/j.envsci.2019.05.013.
Hoesly, R. M., Smith, S. J., Feng, L., Klimont, Z., Janssens-Maenhout, G., Pitkanen, T., Seibert, J. J., Vu, L., Andres, R. J., Bolt, R. M., Bond, T. C., Dawidowski, L., Kholod, N., Kurokawa, J.-I., Li, M., Liu, L., Lu, Z., Moura, M. C. P., O'Rourke, P. R., and Zhang, Q.: Historical (1750–2014) anthropogenic emissions of reactive gases and aerosols from the Community Emissions Data System (CEDS), Geosci. Model Dev., 11, 369–408, https://doi.org/10.5194/gmd-11-369-2018, 2018
Hodnebrog Ø. Et.al., 2020: Updated Global Warming Potentials and Radiative Efficiencies of Halocarbons and Other Weak Atmospheric Absorbers. Reviews of Geophysics, 58(3), doi:10.1029/2019RG000691.
Jackson, R.B., Solomon, E.I., Canadell, J.G. M. Cargnello & C. B. Field. Methane removal and atmospheric restoration. Nat Sustain 2, 436–438 (2019). https://doi.org/10.1038/s41893-019-0299-x
Kadow, C., Hall, D. M., and Ulbrich, U. (2020). Artificial intelligence reconstructs missing climate information. Nat. Geosci. 13, 408–413. doi:10.1038/s41561-020-0582-5.
Kennedy J.J. et al., 2019: An Ensemble Data Set of Sea Surface Temperature Change From 1850: The

28
[UNCLASSIFIED]
[UNCLASSIFIED]
Met Office Hadley Centre HadSST.4.0.0.0 Data Set. JGR Atmospheres, 124(14), 7719-7763, doi:10.1029/2018JD029867.
Lauder, A. R., I. G. Enting, J. O. Carter, N. Clisby, A. L. Cowie, B. K. Henry, and M. R. Raupach, 2013: Offsetting methane emissions—An alternative to emission equivalence metrics. Int. J. Greenh. Gas Control, 12, 419–429.
Leahy, S. C., H. Clark, and A. Reisinger, 2020: Challenges and prospects for agricultural greenhouse gas
mitigation pathways consistent with the Paris Agreement. Front. Sustain. Food Syst., 1–15,
Lynch J., Cain, M, Pierrehumbert, R., and Allen, M., 2020: Demonstrating GWP*: a means of reporting
warming-equivalent emissions that captures the contrasting impacts of short- and long-lived climate
pollutants. Environmental Research Letters, 15(4). https://doi.org/10.1088/1748-9326/ab6d7e
MacDougall A.H. et al., 2020 Is there warming in the pipeline? A multi-model analysis of the Zero Emissions Commitment from CO2.Biogeoscience, 17(11), doi: 10.5194/bg-17-2987-2020.
Morice C.P., J. J. Kennedy, N. A. Rayner J. P. Winn E. Hogan R. E. Killick R. J. H. Dunn T. J. Osborn P. D. Jones I. R. Simpson. An updated assessment of near‐surface temperature change from 1850: the
HadCRUT5 dataset. JGR Atmospheres. 15 December 2020. https://doi.org/10.1029/2019JD032361
Myhre, G., Shindell, D., Bréon, F.‐M., Collins, W., Fuglestvedt, J., Huang, J., et al. (2013). Anthropogenic
and natural radiative forcing. In T. F. Stocker, D. Qin, G.‐K. Plattner, M. Tignor, S. K. Allen, J. Boschung,
A. Nauels, Y. Xia, V. Bex, & P. M. Midgley (Eds.), Climate change 2013: The physical science basis. Contribution of Working Group I to the Fifth Assessment Report of the Intergovernmental Panel on Climate Change (pp. 659–740). Cambridge, UK and New York, NY: Cambridge University Press. https://doi.org/10.1017/ CBO9781107415324.018
Nicholls Z.R.J. et al., 2020: Reduced complexity model intercomparison project phase 1: Protocol, results and initial observations. Geoscientific Model Development, doi: 10.5194/gmd-2019-375.
O’Neill, B., 2003: Economics, natural science, and the costs of global warming potentials. Clim. Change, 58, 251–260.
Popp et al., 2017: Land-use futures in the shared socio-economic pathways. Global Environmental Change, Volume 42, January 2017, Pages 331-345. https://doi.org/10.1016/j.gloenvcha.2016.10.002
Reisinger, A. and Leahy, S., 2019: Scientific aspects of New Zealand’s 2050 emission targets, New Zealand Agricultural and Greenhouse Research Centre Technical Report, available at https://www.nzagrc.org.nz/user/file/1941/Scientific%20aspects%20of%202050%20methane%20targets.pdf
Rogelj, J., D. Shindell, K. Jiang, S. Fifita, P. Forster, V. Ginzburg, C. Handa, H. Kheshgi, S. Kobayashi, E. Kriegler, L. Mundaca, R. Séférian, M. V. Vilariño, 2018a, Mitigation pathways compatible with 1.5°C in the context of sustainable development. In: Global warming of 1.5°C. An IPCC Special Report on the impacts of global warming of 1.5°C above pre-industrial levels and related global greenhouse gas emission pathways, in the context of strengthening the global response to the threat of climate change, sustainable development, and efforts to eradicate poverty [V. Masson-Delmotte, P. Zhai, H. O. Pörtner, D. Roberts, J. Skea, P. R. Shukla, A. Pirani, W. Moufouma-Okia, C. Péan, R. Pidcock, S. Connors, J. B. R. Matthews, Y. Chen, X. Zhou, M. I. Gomis, E. Lonnoy, T. Maycock, M. Tignor, T. Waterfield (eds.)].
Rogelj J. Forster, P.M., Kriegler, E., Smith, C.J. & Séférian, R., 2018b: Estimating and tracking the
remaining carbon budget for stringent climate targets. Nature, 571, 335-342, doi:10.1038/s41586-019-
1368-z
Rogelj J. Huppmann, D., Krey, V, Riahi, K., Clarke, L., Gidden, M., Nicholls, Z., and Meinshausen, M., 2019: A new scenario logic for the Paris Agreement long-term temperature goal. Nature, 573, 357-363, https://doi.org/10.1038/s41586-019-1541-4
Richardson T.B. et al., 2019: Efficacy of Climate Forcings in PDRMIP Models. JGR Atmospheres,

29
[UNCLASSIFIED]
[UNCLASSIFIED]
124(23), 12824-12844, https://doi.org/10.1029/2019JD030581 .
Samset B.H. et al, 2018: Climate Impacts From a Removal of Anthropogenic Aerosol Emissions. Geophysical Research Letters, 45, 408-411, https://doi.org/10.1002/2017GL076079
Schleussner, C.-F., Nauels, A., Schaeffer, M., Hare, W. and Rogelj, J.: 2019: Inconsistencies when applying novel metrics for emissions accounting to the Paris agreement. Environ. Res. Lett. 14 (2019) 124055 https://doi.org/10.1088/1748-9326/ab56e7
Sherwood S.C. et al., 2020: An Assessment of Earth's Climate Sensitivity Using Multiple Lines of Evidence. Reviews of Geophysics, 58(4), e2019RG000678, https://doi.org/10.1029/2019RG000678
Shindell D. and Smith J., 2019: Climate and air-quality benefits of a realistic phase-out of fossil fuels.
Nature, 573(sup1), 408-411, https://doi.org/10.1038/s41586-019-1554-z
Smith C.J. et al., 2018: Understanding Rapid Adjustments to Diverse Forcing Agents Geophysical Research Letters,16(21),12023-12031, doi: 10.1029/2018GL079826
Steffen W. et al., 2018: Trajectories of the Earth System in the Anthropocene. PNAS, 115(33), 8252,8259, doi:10.1073/pnas.1810141115.
Sterner, E. and Johansson D., 2017: The effect of climate–carbon cycle feedbacks on emission Metrics. Environ. Res. Lett. 12 034019
Tanaka K. and O’Neil B.C., 2018: The Paris Agreement zero-emissions goal is not always consistent with the 1.5 °C and 2 °C temperature targets. Nature Climate Change, 8, 319-324. https://doi.org/10.1038/s41558-018-0097-x
Thornhill G. et al., 2020: Climate-driven chemistry and aerosol feedbacks in CMIP6 Earth system models Atmospheric Chemistry and Physics, https://acp.copernicus.org/preprints/acp-2019-1207/
Turetsky M.R. et al., 2020: Carbon release through abrupt permafrost thaw. Nature Geoscience, 13, 138-143, doi:10.1038/s41561-019-0526-0.
UNEP 2020 Emissions Gap Report, https://www.unenvironment.org/emissions-gap-report-2020.
UK Committee on Climate Change: Net Zero – The UK’s contribution to stopping global warming, https://www.theccc.org.uk/publication/net-zero-the-uks-contribution-to-stopping-global-warming/
UK Climate Change Committee, 2020, Sixth Carbon Budget Report, https://www.theccc.org.uk/publication/sixth-carbon-budget/
van Vuuren D.P. et al., 2018: Alternative pathways to the 1.5 °C target reduce the need for negative emission technologies. Nature Climate Change, 8, 391-397, doi:10.1038/s41558-018-0119-8.
Weber, J., Shin, Y.M, Staunton Sykes, J., Archer‐Nicholls, S., Abraham, N. L., Archibald, A.: 2020:
Minimal Climate Impacts From Short‐Lived Climate Forcers Following Emission Reductions Related to
the COVID‐19 Pandemic. Geophys. Res. Let., 13 October 2020. https://doi.org/10.1029/2020GL090326
Wang Y and Huang Y., 2020: The Surface Warming Attributable to Stratospheric Water Vapor in CO2‐Caused Global Warming. JGR Atmospheres, 125(17), e2020JD032752, doi: 10.1029/2020JD032752.
Zickfeld K. et al., 2017: Centuries of thermal sea-level rise due to anthropogenic emissions of short-lived greenhouse gases. PNAS, https://doi.org/10.1073/pnas.1612066114