Embed Size (px)
Citation preview

CLIMATE SCENARIO ANALYSIS: CEMENT’S FINANCIAL PERFORMANCE UNDER 2° C AND 2.7° C
A how-to guide for the sector, and three companies across six countries
This project has received funding from the European Union’s Horizon 2020 research and innovation programme un-der grant agreement No. 696004. The text reflects only the author’s view. The Agency (EASME) under the power de-legated by the European Commission is not responsible for any use that may be made of the information it contains.
A
1
2
3
4
5
6
CCONTENTS
01 The Energy Transition Risk Project . . . . . . . . . . . . . . . . . . . . . . . . . . . . . . . 4
02 Key findings . . . . . . . . . . . . . . . . . . . . . . . . . . . . . . . . . . . . . . . . . . . . . . . . 6
2 .1 Executive summary . . . . . . . . . . . . . . . . . . . . . . . . . . . . . . . . . . . . . 7
2 .2 Key findings on the scenario’s EBITDA changes in six charts . . . . . 9
03 Financial climate scenario analysis for cement – context . . . . . . . . . . . 10
3 .1 Objectives and readers‘ guide . . . . . . . . . . . . . . . . . . . . . . . . . . . 11
3 .2 How to interpret and integrate the results . . . . . . . . . . . . . . . . . . 13
3 .3 Scope of the study . . . . . . . . . . . . . . . . . . . . . . . . . . . . . . . . . . . . . 17
3 .4 Cement sector in transition . . . . . . . . . . . . . . . . . . . . . . . . . . . . . . 19
04 Underlying scenarios, adaptation pathways . . . . . . . . . . . . . . . . . . . . . 22
4 .1 Building block: Climate transition scenarios . . . . . . . . . . . . . . . . . 23
4 .2 Building block: Company‘s technology portfolio adaption . . . . . 26
05 Results: Sector-level EBITDA impact of the two scenarios . . . . . . . . . . . . 30
06 Results: Company-level EBITDA impact . . . . . . . . . . . . . . . . . . . . . . . . . 34
6 .1 LafargeHolcim: Strong climate performer . . . . . . . . . . . . . . . . . . 35
6 .2 HeidelbergCement: Climate risk resilient . . . . . . . . . . . . . . . . . . . 39
6 .3 CRH: growing in both scenarios . . . . . . . . . . . . . . . . . . . . . . . . . . 43
APPENDIX: climateXcellence tool, limitations, and key scenario data . . . . . . . 47
A .1 Overview of the climateXcellence model . . . . . . . . . . . . . . . . . . 40
A .2 Limitation of the method applied . . . . . . . . . . . . . . . . . . . . . . . . . 51
A .3 Underlying scenario data . . . . . . . . . . . . . . . . . . . . . . . . . . . . . . . 52
Impressum . . . . . . . . . . . . . . . . . . . . . . . . . . . . . . . . . . . . . . . . . . . . . . . . . . 53

A
1
2
3
4
5
6
C
ACT Ambitious Climate Transition scenario
CCS Carbon Capture Storage
CO2 Carbon dioxide
EBIT Earnings before interest and taxes
EBITDA Earnings before interest, taxes, depreciation and amortization
ETP Energy Technology Perspectives
EU ETS European Union Emissions Trading Scheme
GDP Gross domestic product
GJ Gigajoule
IEA International Energy Agency
LCT Limited Climate Transition scenario
M&A Mergers and Acquisitions
Mt Million tons
RTS Reference Technology Scenario
SEI Sustainable Energy Investment
t Tons
TCFD Task Force on Climate-related Financial Disclosures
USD US-Dollar
3rd Technology Level Semi-dry rotary kiln
4th Technology Level Dry long rotary kiln
5th Technology Level Dry rotary kiln with pre-heater
6th Technology Level Dry rotary kiln with pre-heater and pre-calciner
°C Degree centigrade
Abbreviations

C
A
2
3
4
5
6
1
01
THE ENERGY TRANSITION RISK PROJECT
C
A
2
3
4
5
6
1
The energy transition risk project 5
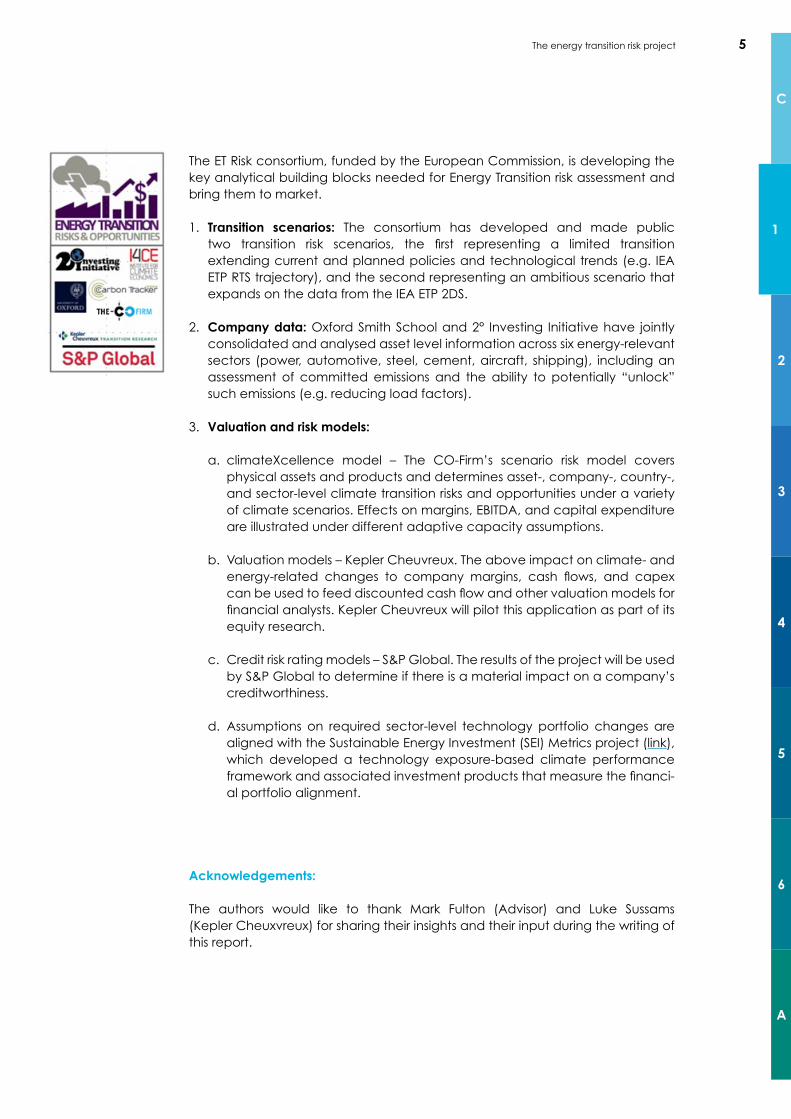
The ET Risk consortium, funded by the European Commission, is developing the key analytical building blocks needed for Energy Transition risk assessment and bring them to market.
1. Transition scenarios: The consortium has developed and made public two transition risk scenarios, the first representing a limited transition extending current and planned policies and technological trends (e.g. IEA ETP RTS trajectory), and the second representing an ambitious scenario that expands on the data from the IEA ETP 2DS.
2. Company data: Oxford Smith School and 2° Investing Initiative have jointly consolidated and analysed asset level information across six energy-relevant sectors (power, automotive, steel, cement, aircraft, shipping), including an assessment of committed emissions and the ability to potentially “unlock” such emissions (e.g. reducing load factors).
3. Valuation and risk models:
a. climateXcellence model – The CO-Firm’s scenario risk model covers physical assets and products and determines asset-, company-, country-, and sector-level climate transition risks and opportunities under a variety of climate scenarios. Effects on margins, EBITDA, and capital expenditure are illustrated under different adaptive capacity assumptions.
b. Valuation models – Kepler Cheuvreux. The above impact on climate- and energy-related changes to company margins, cash flows, and capex can be used to feed discounted cash flow and other valuation models for financial analysts. Kepler Cheuvreux will pilot this application as part of its equity research.
c. Credit risk rating models – S&P Global. The results of the project will be used by S&P Global to determine if there is a material impact on a company’s creditworthiness.
d. Assumptions on required sector-level technology portfolio changes are aligned with the Sustainable Energy Investment (SEI) Metrics project (link), which developed a technology exposure-based climate performance framework and associated investment products that measure the financi-al portfolio alignment.
Acknowledgements:
The authors would like to thank Mark Fulton (Advisor) and Luke Sussams (Kepler Cheuxvreux) for sharing their insights and their input du ring the writing of this report.

C
A
1
3
4
5
6
2
02
KEY FINDINGS
» 2.1 Executive summary
» 2.2 Key findings on the scenario‘s EBITDA changes in six charts

C
A
1
3
4
5
6
2
Key findings 7
Climate change scenario analysis for cement sector
This report is the fifth in a series of six. After a methodological paper, scenario analysis of the utilities, automotive and steel sector followed, the last report will cover a management synthesis. As part of the Energy Transition Risk project, it aims at showing how to perform a scenario analysis for the cement sector, under the constraint that asset level data is not available at sufficient global quality. Therefore, this report specifically aims at illustrating the general impact of two distinct climate changes scenarios on the financial performance of the plants that operate in these six countries (Germany, Italy, France, Brazil, the USA and Mexico).
Macro climate scenarios and company trajectories underlying the financial impact analysis
The basis for the work is The CO Firm’s climateXcellence model. It assesses two distinct climate change scenarios with different global warming implications, and, overlaid on to them, two pathways illustrating the impact of companies’ adaptation to the changing environment along a low-carbon transition as illustrated in the scenarios:
» Macro climate change scenarios out of International Energy Agency’s (IEA) 2017 Energy Technology Perspectives (ETP): 1) the Limited Climate Transition scenario (LCT), based on the IEA’s “Reference Technology Scenario” (c. 2.7°C temperature increase by 2100); and 2) the Ambitious Climate Transition scenario (ACT), corresponding to the IEA’s “2°C Scenario” (c. 2°C).
» Illustrative company adaptation pathways: 1) MARKET expects companies’ asset development and growth to be fully in line with the market develop-ments outlined in the IEA’s scenarios, relative to their market share by region. The market share is determined through forecast data until 2020 based on Cement. For instance, a 20% cement production increase in one country corresponds to a 20% increase in capacity across all cement companies producing in this country; and 2) MARKET EBIT acknowledges that financially strong companies (higher earnings before interest and taxes (EBIT)) can gain a higher share of new investments compared to the companies with average or below EBIT strength.
Key findings: Tools for engagement and further research
In the context of a host of unknown low-carbon transition factors, e.g. carbon price, development of CCS, efficiency improvements etc., scenario analysis emerges as a vital tool to battle uncertainty. Furthermore, it can be used to begin to piece together a company’s adaptive capacity and the degree to which this builds resilience to a sector in transition. The underlying analysis faces the additional challenge of having no asset level data of sufficient quality.
2.1 Executive summary

C
A
1
3
4
5
6
2
Key findings 8
Therefore, it also provides a basis for what to look out for when upgra-ding information of companies in the cement sector. In this report, we present a case study as to how a scenario analysis can be performed for the cement sector for six selected countries (focus countries of the ET Risk project). The analysis illustrates
» Just looking at the six countries in focus, the change is material for cement production. In a 2°C, ACT scenario, the EBITDA to be earned in these six countries roughly remains stable till 2050, however, individual companies in these countries, could face losses of up to 70% of EBITDA in these markets, during the transition. The 2.7°C, LCT scenario provides a growth story across the six counties, with an EBITDA growth of ~75 % till 2050.
» In the 2°C scenario, for the operations of the three case study companies (thyssenkrupp, HeidelbergCement, and CRH) in Germany, Italy, France, Brazil, the USA and Mexico, operations see the financial risk materializing star-ting in 2020. Change in operations is required already in the short-term to maintain EBITDA.
» Out of all EBITDA drivers illustrated in the scenario, two have the strongest impact: • carbon prices and their impact on the competitiveness of plants • presence in growth markets
» Key drivers of a financially valuable transformation are the companies’ low energy and low carbon plants, their capacity to financially increase the share of newer plants, and with the commercial and financially viable introduction of CCS, the relative size of the plants eligible for CCS.
Investors should engage with companies on the following:
∙ Have you performed a scenario analysis, and if not, why not? ∙ What is the current and future role of your cement business relative to
other business lines? ∙ Which are your growth markets, and specifically, where do you intend to
build new plants? ∙ Which technology level do you want to reach by when? Do you plan to
have upgraded your plants to the 6th technology level? ∙ Would your plants technically and geologically be able to operate with
CCS? These findings enable financial actors to
∙ assess the probability of the scenario, ∙ potentially integrate the materiality of risk into their own assessments and ∙ engage with companies on their perspective on the likelihood of the
scenario, their relative positioning in face of the scenario and their investment strategy in face of the differential geographic and technology performance of plants.
Key findings
Set of engage-ment questions

C
A
1
3
4
5
6
2
Key findings 9
2.2 Key findings on the scenario’s EBITDA changes in six charts
55 companies (ACT)
-100
-50
0
50
100
150
200
2020 2030 2040 2050
EBIT
DA
(cha
nge
% v
s. 2
016)
2020 2030 2040 2050
60
0
90
30
EBIT
DA
(cha
nge
% v
s. 2
016) LCT
ACT
Sector average in six selected countries
Chart 1 Key findings in six charts
-100
-50
0
50
100
2020 2025 2030 2035 2040 2045 2050
EBITD
A (c
hang
e %
vs.
2016
)
FROZENMARKETMARKET-EBIT
0 20 40 60 80 100 120 140 160 180
ACT MARKET
Indexed sum of cumulative EBITDA (Baseline = EBITDA in 2016 until 2050)
LCT MARKET
2016 Baseline
LCT MARKET-EBIT 162
128ACT MARKET-EBIT
155
100
118
First 5 years Years 2023-2030 Years 2030-2050 W/O ASH GROVE MERGER 2017
010
020
050
150
20202016
EBIT
DA
[100
% in
201
6]
2030 2050
100
200
150
050EB
ITD
A [1
00%
in 2
016]
2016 2020 2030 2050
6. TECH. LVL.+CCS 6. TECH. LVL. 5. TECH. LVL. 4. TECH. LVL. 3. TECH. LVL.
LCT ACT
050
100
150
200
EBIT
DA
[100
% in
201
6]
20202016 2030 2050Germany France USAItaly Mexico Brazil
020
050
100
150
EBIT
DA
[100
% in
201
6]
20302016 2020 2050
Chart 1.1: While LCT illustrates a strong sector growth story, ACT can lead the way to globally stable EBITDA
Chart 1.3: In the ACT scenario, material and potentially business destroying fi-nancial impacts come about as soon as 2020 (case example: LafargeHolcim)
Chart 1.5: The relative exposure to technologies determines a company’s participation in EBITDA growth…
Chart 1.2: In ACT, companies have a very different capacity to participate in the (long-term) growth story
Chart 1.4: Relative to today, CRH would grow in LCT, and remain stable in ACT (2016 EBITDA held stable, till 2050, undis-counted)
Chart 1.6: ... in connection with the com-pany’s exposure to profitable growth markets

C
A
1
2
4
5
6
3
03
FINANCIAL CLIMATE SCENARIO ANALYSIS FOR CEMENT – CONTEXT
» 3.1 Objectives and readers‘ guide
» 3.2 How to interpret and integrate the results
» 3.3 Scope of the study
» 3.4 Cement sector in transition

C
A
1
2
4
5
6
3
Financial climate scenario analysis for cement – context 11
3.1 Objectives and readers‘ guide
This report aims to illustrate how scenario-based financial risk analysis can be performed in the cement sector and if and how it can be relevant to company analysis and, specifically, the assessment of its future financial performance.
This is the fifth in a series of six reports. The first report, ‘Investor Primer to Transition Risk Analysis’, discusses the methodological and conceptual under-pinnings of such an endeavour. The second till fourth report focussed on the impact of scenarios on the utilities sector, automotive sector and steel sector, respectively, illustrating the general growth story associated with carbon- limiting climate scenarios, and the substantial impact on valuations that can be expected. This report aims at showing how to perform a scenario ana-lysis for the cement sector under the constraint that one of the key building blocks of the analysis, asset level data, is not available in sufficient quality. Therefore, the main insight is understanding the general dynamics in climate change scenarios. The analysis is performed with activities in six selected coun-tries for three cement companies, in line with the focus set in the Energy Transition Risk project (ET Risk). Due to the insufficient asset level data and geographic coverage, this analysis is not integrated into Kepler Cheuvreux valuation models as has been done with the other three sectors.
The primary audience of this report is financial analysts who wish to understand the materiality of these results on company performance and the more techni-cal aspects involved in scenario analysis. We also hope to provide investors with food for thought on what factors are material in determining which cement companies might be the winners and losers in the transition.
The results should not be considered as investment recommendations, financial forecasts or judgement of their veracity, but rather illustrations of two of many plausible energy transition scenarios. They constitute an outside-in analysis for providing guidance on company engagement.
The report builds on the following previous reports:
» Transition scenarios: The Transition Risk-O-Meter . Reference Scenarios For Financial Analysis (2dii, The CO-Firm, June 2017, link).
» Technical Supplement: The Use of Scenario Analysis in Disclosure of Climate- Related Risks and Opportunities, TCFD (June 2017, link).
» Adaptive capacity: changing colors . Adaptive capacity of companies in the context of the transition to a low carbon economy (2dii, The CO-Firm, Allianz, Allianz Global Investors, August 2017, link).
» Climate scenario compass: Investor primer to transition risk analysis (Kepler Cheuvreux, The CO-Firm, January 2018, link).
» Climate scenario compass: Transition risks for electric utilities (The CO-Firm, Kepler Cheuvreux, January 2018, link).

C
A
1
2
4
5
6
3
» Climate scenario compass: Transition risks for the automotive sector (Kepler Cheuvreux, The CO-Firm, forthcoming).
» Climate scenario compass: Transition risks for the steel sector (The CO-Firm, Kepler Cheuvreux, forthcoming).
» Climate change scenarios: Transition risks: How to move ahead. Kepler Cheuvreux, The CO-Firm, forthcoming).
» The way into an economy below 2 degrees (analysis paths – assessments – economic implications): Using the example of key economic sectors for Germany: automobile production and selected plastic goods (forthcoming)1.
» Röttmer, Nicole: “Scenario analysis and TCFD – contribution to risk manage-ment and financing/investment strategy?“ In Greening Finance – The way to a sustainable financial economy, by Matthias Stapelfeldt, Matthias Kopp and Martin Granzow (2018)2.
Financial climate scenario analysis for cement – context 12
1 Original German: „Der Weg in die unter 2 Grad Wirtschaft (Analysewege – Einschätzungen – wirtschaftliche Implikationen): Am Beispiel wesentlicher Wirtschaftszweige für Deutschland: Automobilherstellung und ausgewählte Kunststoffwaren“ 2 Original German: „Szenarioanalysen und TCFD – Beitrag zu Risikomanagement und Finanzierungs-/Investi-onsstrategie?“ In Greening Finance – Der Weg in eine nachhaltige Finanzwirtschaft, von Matthias Stapel-feldt, Matthias Kopp und Martin Granzow (2018).
C
A
1
2
4
5
6
3
Financial climate scenario analysis for cement – context 13
3.2 How to interpret and integrate the results
The findings are designed to provide a complementary view to traditional analyst research. For the business sectors and potentially business segments with the highest risks and opportunities (in the case of this report: the cement industry), the findings build on scenario analysis, illustrating:
» Materiality of business risks and opportunities under a long-term climate scenario, through looking at the relative development of EBITDA
» Speed of manifestation of financial risks and opportunities, analysing how fast the potential transition can impact the financial performance of sectors on average, and companies specifically
» Drivers of change: What could be the drivers supporting the transition, complementing the external trend analysis
» Transition capacity of companies/ engagement catalogue: Which are company asset configurations enabling a financially beneficial transition
The limited number of countries under investigation does not allow us to derive potential winners and losers in the sector as part of this technical report.
Thus, this research aims at supporting you in understanding:
» What the climate scenarios’ key business determinants look like
» Via which mechanisms (volumes, prices, costs, etc.) the scenario can impact company performance, building on their individual physical assets (“cash flow generators”)
» Whether and how the structural set-up of companies today already provides a perspective on the future performance potential for the company, with and without integrating its capacity to adapt
The results support you in putting climate risks and opportunities in perspective:
» The scenario readiness of the resource base: How is a company positioned in a changing “scenario” market, assuming it changes along the market changes modelled by IEA for the specific scenario (potential to participate in relative growth, in specific technologies/geographic markets)
» Winner propensity: How is the company positioned relative to others, regarding their types of physical or intellectual assets and their geographic market presence, to gain above average, profitable market share
» The cost of inaction illustrates the financial magnitude of the change illustrated in a climate scenario (frozen “pathway” relative to a “market” pathway)

C
A
1
2
4
5
6
3
Financial climate scenario analysis for cement – context 14
How does it relate to your current analyses:
In case the results should be integrated in traditional analyst research:
We typically see that analysts can follow two pathways to incorporate transition risks in case a discounted cash flow model is used for company valuation: They can either adjust a company’s risk or a growth profile. Adjusting the first involves modifying the discount factor for future cash flows. Adjusting the latter can either mean extending the forecast of specific cash flows or altering the terminal growth rate. Generally, the results of our climateXcellence model enable analysts to adjust a company’s forecasted specific cash flows, the most granular option. As part of the Energy Transition Risk project this has been done by Kepler Cheux-vreux for the utilities, automotive and steel sector but is done for the cement sector due to the limited availability of asset level data which made us focus on six countries, only.
Apart from adjusting company valuations, an analyst can extend the list of risk drivers and early warning indicators when evaluating the business environ-ment. Lastly, they can qualify the results in the overall context of the company, i.e., other non-climate related drivers, performance of and dynamics in other business units, the ability of the company to shift their business model or market coverage, and the individual adaptive capacity they assign to each company.
Similarities Differences
∙ Both are financial assessments
∙ Both are data-driven
∙ Both are reflecting specific com-
pany strengths and weaknesses
(current resources)
∙ Both reflect the corporate strategy
(till, in the scenario case, and de-
pending on the sector analysed,
2020 or 2023)
∙ Both incorporate industry and
competitive dynamics, though
with different timelines
∙ The scenario analysis timeline extends up to 2050,
beyond the currently available forecast data (sec-
tor-dependent, 2020 or 2023)
∙ The global warming scenario is designed to ensure
limiting global emissions to this equivalent of global
warming. Some general business trends might not be
reflected within this climate perspective, some of the
assumptions that need to be put into action to limit
global warming might be expected currently
∙ The fundamental driver of the assessment is the physi-
cal asset park/ product portfolio of the company, not
its past financial performance
∙ The analysis is more forward looking, vs. back-
ward-centred with a near-term outlook
∙ Focus is on general propensity to change the asset
park, not on specific point -in-time strategic decisions
as soon as these are announced
∙ The company is only considered in its potentially most
risk-prone or opportunity-laden business segments

C
A
1
2
4
5
6
3
Financial climate scenario analysis for cement – context 15
Use by different practitioners
As an equity analyst, ask yourself the following
∙ To what degree do you believe the scenario/do you assign a probability to it?
∙ Do you consider climate risk/opportunity to be material for your sectors and companies?
∙ Does the risk/opportunity materialise soon enough for you to integrate it into your investment case? Or does managing the risks and capturing the opportunities already require preparation on the side of companies that impacts their financial performance within your time horizon?
The schematic below introduces an example decision-tree that an equity analyst might follow when first interpreting a climate change scenario analysis (Chart 2).
Would you assign a
probability to the scenario?
Is the risk/opportunity material?
Is there a short-term impact on financials?
Is it possible to hedge the
risk/ transform the
company?
Ignore the scenario analysis
Can the company be
a winner?
yes
yes
no
Validate with your overall perception of the company
no
yes yes
no
no
no
yes
divest
invest
Chart 2 How an analyst can interpret their climate change scenario analysis
Source: The CO-Firm
Scenario analysis should inform company valuation incase the scenario is credible and probable, the risksand opportunities are material and companies are able to sustain the required change
As an equity ana-lyst, ask yourself the following
C
A
1
2
4
5
6
3
As an asset manager, ask yourself the following
∙ Do you want to foster the transition by investing strategically into it, for example by supporting companies that are already transitioning, at the expense of a lower current financial performance?
∙ In the event that a risk manifests itself, can the company credibly trans-form? If so, do you need to engage with the company to either transition within its current business segments or more fundamentally shift to other business segments?
∙ In the event that the company can transform, do you agree with its belief it will be a winner in the market?
∙ If the company cannot align with the transition, can the risk be ignored or hedged outside the business segment/sector concerned?
∙ Do you need to divest from the company due to unacceptable financial risks due to the low-carbon transition?
As a portfolio manager, ask yourself the following
∙ What are the risk and opportunity drivers of the underlying scenario?
∙ How might transition risks impact the sectors’ relative risk-return profiles?
∙ How large is the gap between traditional valuation and longer-term scenario dynamics and what are the main drivers?
∙ After performing a scenario analysis, transparency should have increased and one could ask whether the structural characteristics of companies for have been identified in terms of their resilience.
∙ To what extent can stock picking impact the average sector risk?
As a risk manager, ask yourself the following
∙ What are the drivers and early warning indicators for climate risks in a 2°C scenario in TCFD-relevant sectors?
∙ Do I want to assign the scenario a probability weighting? If so, which?
∙ Can I identify the structural nature of the opportunities and risks that exist for companies?
∙ Would a change in the materiality of risk factors or new risk factors imply changes to general risk management?
Financial climate scenario analysis for cement – context 16
As an asset mana-ger, ask yourself the following
As a portfolio mana-ger, ask yourself the following
As a risk manager, ask yourself the following

C
A
1
2
4
5
6
3
Financial climate scenario analysis for cement – context 17
3.3 Scope of the study
This report and its underlying analysis on the possible impact of the low-carbon transition focus on one of the (climate-wise) most important business segments of building material companies: cement. This sector forms one of the focus sectors of the TCFD’s reporting recommendations, being considered one of the sectors with the strongest business risks (or opportunities).
Due to the focus of the research on European companies, and market capita-lization as a leading selection criterion, this report compares scenario analysis outcomes for three companies, LafargeHolcim, HeidelbergCement and CRH.
Challenges to obtain global asset-level data of sufficient quality led to limiting this research to the six focus countries of the ET Risk project, Brazil, Germany, France, Italy, Mexico, and the USA. With this constraint, the results enable analys-ts to understand two distinct global warming climate scenarios and follow how these are impacting the financial performance of specific corporate physical assets and the selected companies’ performance in the six countries in focus. The results do not lend themselves to comparing overall company performance, for the reason illustrated (limited geographic scope) as well as two others:
a. Broader adaptation beyond the assumptions taken in this study: Within their cement business, the companies might choose to invest in new geo-graphic markets, which is not in line with the transition assumptions taken here.
The results focusexclusively on thecement productionin six countries .
0
10
20
30
LafargeHolcimHeidelbergCement CemexCRH Ultra Tech Cement
18
2527
9
14
Market Capitalisation
Ma
rket
Ca
pita
lisat
ion
[as o
f yea
r-end
201
7 in
billi
on E
UR]
Chart 3 Market capitalisation of analysed companies (all among the top 7 cement producers based on capacity, excl. China)
Source: The CO-Firm

C
A
1
2
4
5
6
3
Financial climate scenario analysis for cement – context 18
Chart 4 Scope of this report: Analysed companies and covered countries and their cement production sites as of 2016.
b. Adaptation outside of the three companies cement operations: These three companies do not obtain their revenues/net sales exclusively from their cement operations. For example, for LafargeHolcim in 2017, the ce-ment business accounted for 66% of the group’s total net sales (2017), whereas HeidelbergCement generated ~50% of its total revenues with cement. Thus, these companies might be able to compensate losses or limited performance in their cement business with the aid of other business lines. This is not part of this scenario analysis for cement.
The six countries in focus were selected across the ET Risk project, as they show the strongest overlap of production capacity across the three companies that are the focus of this report, and across the other sectors within the scope of ET Risk. It needs to be highlighted that for the cement sector, strongest growth happens in India, other developing Asian countries, Middle East and Africa where the analysed companies do maintain production sites. Hence, it needs to be kept in mind that for the cement sector we do not include markets with largest growth options when analysing the company results.
We perform a case study on a selection of six countries, for a complete com-pany evaluation an additional analysis is needed that incorporates potential growth as well as risk markets.
Companies mayupgrade their tech-nology mix alongthe scenario require-ments, but cannotenter new markets(model constraint
Source: The CO-Firm

C
A
1
2
4
5
6
3
Financial climate scenario analysis for cement – context 19
Within the peer group, all three analysed companies belong to the top perfor-mers with a great financial strength among the industry:
To answer the question how scenario dynamics could affect the earnings of a company, we compare cumulative earnings before interest, taxes, depreciation and amortization (EBITDA) for selected companies along our 2 by 2 matrix of climate change scenario and adaptive capacity pathways and compare them against the baseline of constant earnings throughout the considered time peri-od. As the results only cover a selection of countries and not the entire cement activities of a company, the key is to understand the rationale for divergen-ce in earnings across scenarios and against the baseline. These rationales can then be applied to the overall activities of a company for further evaluation. The assessment builds on the relative competitiveness of each cement plant in its relevant competition.
3.4 Cement sector in transition
The cement industry is responsible for roughly 5% of global anthropogenic carbon emissions, not only caused by combustion related emissions, but also a result of process emissions (Mikulcic et al. 2013). Cement is among the bulk commodities with the lowest value per weight or volume ratio. With the exception of some high-value white clinker cements, individual transportation of cement over distances longer than 200 kilometres is usually not economically viable. Thus, the supply and demand for cement is regional and international trade intensity is very low.
The transition risk story for the sector articulates itself along a few trends:
» Increasing demand for cement with increasing population growth. The demand for cement is largely influenced by economic developments and population growth, as it is mostly used in form of concrete by the building industry. Over the last 25 years, the global cement production has increased by roughly 400%, in particularly in emerging countries like China, Brazil and India. In industrialized countries like Germany and France, cement produc-tion is stagnating or decreasing. Demand for cement is expected to remain stable in developed countries until 2030 and set to continue to increase in emerging economies.
» Fade out of wet cement production routes. Cement can be manufactured in four different routes: dry, semi-dry, semi-wet and wet process. The dry or wet state of its raw materials determines the use of the routes. Wet processes consume more energy and are therefore expected to fade out until 2030 in a stepwise process. Wet cement routes only play a minor role for the six countries in scope, therefore, this trend won’t be considered in detail.
» Declining clinker-to-cement-ratio supports the abatement of process-related CO2 emissions. The production of clinker is highly carbon-intensive. It emits on average about 60% of total carbon dioxide (CO2) emissions in the production
The transition of the cement sector can be summarized in 7 trends

C
A
1
2
4
5
6
3
Financial climate scenario analysis for cement – context 20
process (Moya et al. 2010). Abating process-related CO2 emissions is gene-rally perceived as more challenging compared to energy-related CO2 emis-sions, as major process changes or CCS retrofitting is required. The demand for specialised cement has risen continuously during the last decades with more composite materials and additives currently being used. Thus, the clinker-to-cement-ratio is declining. This trend is expected to increase further in the future.
» Shift from coal to less carbon-intensive fuels for cement kilns. The shift from coal to secondary raw materials (e.g. biomass, waste and waste-related materials such as tyres, sludge and slag) could pave the way towards a substitution rate of about 80% (from a technical point of view). In addition, the share of renewables in the electricity supply can cause a significant emis-sion reduction.
» Increasing efficiency gains creates competitive advantage. A comparatively high energy use combined with low prices for raw materials (e.g. limestone) and products result in cement having one of the highest energy cost intensi-ties in industry. Energy costs account for one third of the total production cost. Increasing energy efficiency is often a viable option for cement producers to gain a competitive advantage, as competition on raw material cost such as coal already is strong.
» Carbon leakage risks. Although cement is considered to be a regional product due to low value per weight ratio, making it unfavourable for im-ports, cement producers can be exposed to carbon leakage risks. In par-ticular, in areas in close proximity to the sea or major rivers, transportation of the carbon-intensive clinker (in bulk carrier ships from countries with no emission trading scheme or similar CO2 taxes) could be become economi-cally viable. In the destination country, the imported clinker could then be ground and mixed with additives to produce the desired type of cement. The risk of carbon leakage has driven a special political care for the cement sector in the past under the EU ETS (Emissions Trading Scheme). Under the current EU ETS, the cement industry profits both from free allowances for emitting CO2 emissions, and over-supply. Hence, the cement sector holds a cumulative surplus of roughly 450 million allowances.3 Furthermore, an analysis of the extent of carbon leakage (the relocation of production or of the production of pre- products) to regions without equivalent car-bon costs is highly limited, if existing at all, and therefore is being discus-sed whether the sector should be removed from the carbon leakage list.4 Under the scenario analysis performed here, we assume that a certain car-bon leakage can occur. Free allocations, however, will cease globally under the scenario assumptions by IEA.
3 Sandbag (2017): The fact on the ETS Reform. 4 Banks (2017): EU ETS: Commission urged to remove cement from carbon leakage list.

C
A
1
2
4
5
6
3
» Deployment of CCS. To reduce CO2 emissions for cement production, a variety of techniques and energy efficiency measures are already in place. However, to decarbonize the cement sector extensively, literature commonly finds CCS to be the preferred decarbonization route5. At the same time, the use of CCS faces obstacles worldwide. The largest barrier to CCS implemen-tation is its cost or rather its competition with not effective (enough) emissions trading schemes. For example, under the European Union Emissions Trading Scheme (EU ETS), emitting CO2 emissions remains much cheaper than imple-menting CCS. Even though there are still many legal uncertainties, cement companies already address CCS as an option to decarbonize their produc-tion processes and are active in various research projects.
According to McKinsey6, four strategies will shape the future of the cement industry and determine the relative winners and losers:
∙ Actively rebalancing one’s portfolio: reallocation of resources and invest-ments by entering growing markets and exiting markets that are at peak
∙ Improving the performance of Mergers and Acquisitions (M&A): Sharpen rules, such as only enter into M&As when you expect growth in a market (see first point)
∙ Determine the winning business model: Make the choice between cost leadership or premium selling
∙ Leveraging economies of scale: Reduce the risk of volatility through differentiation, increase operational efficiency and benefit from stronger brand positioning.
These strategies do not differ from the strategies that make a good climate winner. Key trends of the underlying transition scenarios as well as the compa-nies’ adaptation pathways are described in the upcoming chapter. The distin-guishing feature of the scenarios, the CO2 price, only increases the importance of having such strategies in place. This holds especially true for the strategy on having winning business model.
5 Associative costs of CCS: Muratori (2017): Carbon capture and storage across fuels and sectors in energy systemtransformation pathways 6 McKinsey (2015) The cement industry at a turning point: A path towards value creation.
Financial climate scenario analysis for cement – context 21

C
A
1
2
3
5
6
4
04
UNDERLYING SCENARIOS, ADAPTATION PATHWAYS
» 4.1 Building block: Climate transition scenarios
» 4.2 Building block: Company‘s technology portfolio adaption

C
A
1
2
3
5
6
4
Underlying scenarios, adaption pathways 23
4.1 Building block: Climate transition scenarios
The building blocks of the analysis are two climate transition scenarios and two illustrative “adaptive pathways”. The two scenarios are:
The Limited Climate Transition (LCT), corresponding to the IEA’s Reference Technology Scenario (RTS), with a 2.7°C global warming limit by 2100.
The Ambitious Climate Transition (ACT), corresponding to IEA ETP 2°C scenario.
The two scenarios, i.e. ACT and LCT, complement the IEA’s scenario with a consistent narrative on regulatory, technology and market-related changes. See Appendix 1 for more details on the sources used for complementing the IEA scenarios to render them business relevant.
4 .1 .1 Key market drivers and trends
The following trends mainly influence the financial growth potential of compa-nies:
» Individual participation in global cement market growth. This growth is driven by population and GDP growth. The growth rate is the same across scena-rios. Compared to today, in the six countries in focus, cement production more or less stagnates in USA, Germany, France and Italy, while it increases significantly in Mexico and Brazil until 2050. Companies with assets in growing markets benefit, however, entering new markets is not part of the companies’ strategic options. The current location is therefore crucial as it determines whether participation in growth markets is possible.
» Technology upgrading: These scenarios see a replacement of older generation cement plants with newer generations to improve relative cost-base and carbon emission intensity, but do not anticipate entirely new technologies. However, from 2030 onwards, plants will be equipped with Carbon Capture Storage (CCS) in case the assumed carbon price is sufficiently high. Alternati-ve efficiency measures such as secondary fuels or clinker substitutes can also play a role, have limited impact especially relative to the introduction of CCS. Changing to a newer generation of cement plant configuration can sig-nificantly improve energy efficiency and decrease carbon intensity. In the six countries in focus, more than two thirds of the cement is produced with the latest generation of cement production technology (i.e. dry rotary kilns with pre-heater and pre-calciner). The remaining share is produced with the previous generation and a minor share with older generations. Companies are flexible in entering new production technologies and/ or CCS, in case these become financially attractive (business case-positive).
Key revenue drivers are production growth, technology endowment, upgra-de potential and size of plants and subs-tantial CO2 prices
The analysis focuses on two climate tran-sition scenarios

C
A
1
2
3
5
6
4
» CO2 price: In the LCT scenario, carbon prices raise to almost 70 and 35 USD/t CO2 in 2050 in advanced and development countries, respectively. These price levels have hardly any steering effect on the cement produc-tion, because some of the production costs can be passed through to the costumers. Lack of cheap substitutes and trading limited to short-haul dis-tances are some of the reasons for the cost pass-through potential. Under these conditions, older generation of cement plants are at the end of their respective lifetimes gradually upgraded to the latest generation over time. In the ACT scenario, carbon prices increase to 175-180 USD/tCO2 until 2050 in most of the countries globally. These high CO2 price levels makes the adopti-on of CCS technology, despite significant higher CAPEX and running costs for storing, economically viable to adopt after it comes available between 2030 and 2040. In 2050, more than half of the cement production is equipped with CCS technology. It needs to be noted that we expect CCS to capture most CCS emissions but not all. One third is produced with six generation plants while only a minority is produced with older generations. With the high CO2 prices, shutting down older cement plants and replacing it with newer ge-neration equipped with CCS technology can be cost-effective even before their respective end of lifetime.
» Emission impact of the scenario: In 2050 in ACT, 88% of the cement is produced with the latest technology, 12 percent points more compared to the LCT. This results in CO2 intensity reduction of 38% which reduces the absolute CO2 by 24% until 2050 compared to today and despite the production grow. None-theless, while a 24% CO2 reduction might seem low for 2°C scenario, it follows the equal burden approach and takes into account the comparatively higher CO2 abatement costs in cement production. Other sectors with lower CO2 abatement costs, like electricity generation, must reduce more CO2
emissions to compensate. In 2050 in LCT, 11 more percent points of cement are produced with the latest generation while The CO2 intensity reductions of 16% are not sufficient to compensate for the production grow resulting in an absolute increase of CO2 emission of 2% until 2050 compared to today.
Underlying scenarios, adaption pathways 24

C
A
1
2
3
5
6
4
*3. TECHNOLOGY LEVEL = Semi-dry rotary kiln, 4. TECHNOLOGY LEVEL = Dry long rotary kiln, 5. TECHNOLOGY LEVEL = Dry rotary kiln with pre-heater, 6. TECHNOLOGY LEVEL = Dry rotary kiln with pre-heater and pre-calciner
Limited Climate Transition (LCT)Ambitious Climate Transition (ACT)Market
Technology
Regulation
CO2 emissions 2050 vs. today
-38% intensity
-24% absolute
-16% intensity
+2% absolute
Share of cement technology level across USA, Mexico, Brazil, Germany, Italy and France in 2016 and 2050*
26%64%
2%8%
0%
3. TECH. LVL. 6. TECH. LVL.+CCS4. TECH. LVL. 5. TECH. LVL. 6. TECH. LVL.
Global cement production [Mt]
Production in selectedcountries [Mt]
5.0944.175
2014 2050
+22%
2016
2050
161
200
USABrazil FranceGermanyMexico Italy
CO2- certificate prices [USD/t CO2 ]
0
200
2016 2050
ADV. ECON. EMERG. ECON.
20502016
0%1%12%
35%53%
0%
75%
1% 24%0%
2016 2050
CO2 impact
Chart 5 This report tests for the financial impact of two transition scenarios
Source: The CO-Firm; IEA 2017; EC 2017
Underlying scenarios, adaption pathways 25

C
A
1
2
3
5
6
4
4.2 Building block: Company‘s technology portfolio adaption
In the analysis for the cement sector, adaptive capacity is a result of dynamic capabilities, which enable a company to adapt in face of radical change7 and allow for putting existing resources (assets, financial pockets, intellectual pro-perty), via a strategy, to good future use. These dynamic capabilities comprise, for example, the capability to perceive external market changes, to engage in alliances, to reconfigure internal resources for future uses etc.8 These need to be analysed closely when assessing whether an individual company is future proof. The strategic decisions for companies are restricted to the cement sector only, hence a compensation of losses in the cement sector through activities outside the cement sector is not considered.
Three key aspects determine whether a company can be considered future proof (see Chart 6):
» Five capabilities: Opportunity recognition, partnering, building, integrating, reconfiguring. Not all of them need to be present at the same time (if know-how is being sourced through a joint venture, it does not need to be built up by oneself).
» The current resource base of the company, i.e. what is at the disposal of the company to reconfigure: Financial means, physical assets, intellectual pro-perty.
» Strategies pinpoint where the company aims to go, as a synthesis of trends in its business environment, its resources and its capabilities.
In this comprehensive scenario analysis across the cement sector for six selected countries, we assume that all companies have the same dynamic capabilities at their disposal, and their relative performance is thus determined by their current resources, i.e., physical, intellectual and financial assets, and their fit with future market requirements under the scenario. This assumption creates a data-driven, reproducible data basis for comparing companies. For this analysis, adaptive capacity does not refer to decisions taken outside the considered business model within a sector.
7 Teece, Pisano, Shuen (1997): Dynamic Capabilities and Strategic Management. 8 Röttmer (2011): Innovation Performance And Clusters.
Underlying scenarios, adaption pathways 26
A company‘s adaptive capacity (based on resources, strategies and dy-namic capabilities) determines whether a company is future proof

C
A
1
2
3
5
6
4
Resources: • Financial• Physical• Intellectual
Strategy
“what”
Analyst focus
“how”
• Opportunity recognition
• Partnering• Building• Integrating• Reconfi-
guring
Dynamic capabilities
Changing business environment
Chart 6 Conceptual logic of being future proof
Traditionally, adaptive capacity more or less implicitly forms part of an analyst’s judgement, as a judgement on the reliability of strategic announcements or financial forecasts (“can the company really do it”), and/or under the label “management quality”, and/or the company’s historic track record. Explicitly, analysts tend to look at the current resource base (EBITDA, current model mix, etc.) and at the implementation of past strategic decisions (R&D expenditures), and new strategic targets (model strategy).
In this study, we have analysed two pathways, within each climate change scenario, that vary a company’s adaptation strategy depending on its financial strength. This is of course just one facet of those highlighted in Chart 6, but gives a flavour of the role that adaptive capacity can play in determining winners and losers in a transitioning sector.
4 .2 .1 The MARKET pathway
MARKET assesses the scenario readiness of individual companies. Here, earnings depend on its regional diversity as well as the degree of cost efficiency of a company’s technology portfolio. A company’s investment decisions until 2020 provide the basis. The MARKET pathway assumes that companies are flexible with technologies, but not in choosing to enter new countries. Therefore, com-pany’s production increases to the same extent as the market, it is therefore crucial for companies to be positioned in growth markets. For our case study, Brazil and Mexico represent the largest growth markets, albeit for the global cement market India, emerging Asian countries, Middle East and Africa actually will see most growth (this is not covered in this analysis). If a market stagnates or decreases, overcapacity hits the least advanced company technologywise first, as supply and demand are matched using a merit order.
Underlying scenarios, adaption pathways 27
Adaptive capacity already forms part of an analyst’s (im-plicit) judgement on the company
Source: The CO-Firm

C
A
1
2
3
5
6
4
The second factor, cost efficiency of technology, determines how profitable an additional unit of production will be. Here, the assumption is made that a com-pany will incrementally adapt its technology portfolio to newer technological levels once this becomes economical viable. A relatively new technology port-folio, thus, creates a competitive advantage for the company.
4 .2 .2 The MARKET EBIT pathway
The general dynamics of MARKET EBIT compare to the MARKET pathway, with the additional assumption that better financial endowment (higher EBIT) allows companies to leverage a superior “resource configuration” under the constraints posed by the scenario, and only when replacement or growth options become business case positive. It illustrates the winning potential of companies.
FROZEN illustrates the opportunity cost of inaction, i. e. of not seeing the required change or not being able to act upon it. It illustrates the financial extent and speed of the transition that is required for the individual company. Also, it illus-trates the speed and strength of the market change, along the timing of the impact and its extent. This is not a proxy for the cost of transitioning, rather, in comparison to the MARKET or MARKET EBIT pathways, for the cost of inaction.
Underlying scenarios, adaption pathways 28

C
A
1
2
3
5
6
4
Chart 7 Two assumptions on companies’ physical asset development in ACT and an indicator of opportunity cost of inaction
Source: The CO-Firm
CAPACITY
20502040203020252010
34%
33%
33%
60% 20%20%
33%33%34%
Company CCompany BCompany A
2016 2020
CAPACITY
2050204020302025202020162010
15%15%
70%
60%20%
20%
33%
34%33%
Company A Company CCompany B
20252020 20402010 20502030
CAPACITY
20%60%20%
33%33%34% 33%34%
33%
2016
Company CCompany BCompany A
Earnings depend on regional diversity and degree of cost efficiency. Growth in regions is restric-ted to a company’s existing markets: here, asset development is fully in line with the develop-ments outlined in the scenario . For instance, a 20% cement production increase in one country corresponds to a 20% increase in capacity across all cement companies producing in this coun-try. Technological efficiency can be improved when upgrades are business-case positive with a positive impact on margins .
Builds on the market scenario and includes companies’ relative financial strength over time, assuming that financially strong companies can invest more in growing technologies. A com-pany’s overall EBIT serves as an indication of its financial strength. This is put into a non-linear function to the average EBIT across all companies . This function ensures that the company with the strongest EBIT is able to gain a higher share of new investments per country, compared to the companies with average EBIT strength, while the weakest companies get less market share compared to the average-EBIT company .
Asset structure in 2020 is frozen until 2050 . It considers new plants and shutdowns until 2020, as announced by the company, until 2017 . Freezing technologies leads to inconsistency with the scenarios outlined, thus a frozen development serves to show cost of inaction .
MA
RKE
TM
AR
KET-
EBIT
FRO
ZEN
Underlying scenarios, adaption pathways 29

C
A
1
2
3
4
6
5
05
RESULTS: SECTOR-LEVEL EBITDA IMPACT OF THE TWO SCENARIOS

C
A
1
2
3
4
6
5
Results: Sector-level EBITDA impact of the two scenarios along the pathways 31
In the reference scenario (LCT), cement producers across the six selected countries, i.e. USA, Brazil, Mexico, Germany, Italy and France, are well off. The cumulative EBITDA grows by more than 60% until 2050 compared to 2016, which is stronger than the production increase (25%). The increasing share of higher value cement types result in growing average EBITDA margin over time.
However, under the 2°C climate scenario (ACT) the cumulative EBITDA stagnates despite production growths and higher value cement types. Only after 2040, with the availability of CCS, EBITDA increases again. In 2050, in ACT, the CO2 prices of 175-180 USD/tCO2 (no exemptions) amount to more than half of the total production costs of an average European-based cement producer.
Because of the lack of available bulk and cheap binding or building materials, we assume that the absolute major share of the carbon-related production costs increase can be passed on to customers, resulting in a cement price increase. However, with increasing prices, we see higher risks for clinker imports from countries without CO2 taxes or certificates, in particular for areas close to a harbour where clinker transport by ship from oversea is possible. Clinker is the energy- and carbon-intensive intermediate product in the cement production process. With the increasing risk of clinker imports, we assume that a minor share of the carbon-related production cost increase cannot be passed on to the customers, which weighs on the EBITDA margin of cement producers in the six selected countries.
Individual company performance can differ substantially from the sector average: In the ACT, the scatter plot shows that the 55 companies producing in the six selected countries perform heterogeneously. Cement is a mostly locally traded commodity because of its low value to weight ratio. Thus, cement pro-ducers compete mostly with local competition, that is challenged by a compa-rable CO2 price increase. Energy efficiency becomes a competitive advantage, in face of similar raw material and energy carrier prices and given that energy costs account for roughly one third of the total production costs. This is emphasi-zed further by increasing CO2 prices.
We don’t envision technological disruptions for cement production in the investi gated time horizon. Nonetheless, even before CCS technology becomes available economically in 2040, switching to the latest cement plant generati-on and performing gradual efficiency improvements is important to maintain a competitive advantage and margins. Inefficient plans have higher impacts from rising CO2 prices and lose EBITDA margins over time in comparison to more efficient competitors.
Summarizing, main drivers for companies’ financial performance in both climate scenarios are the company’s technology and country portfolio mix. The EBITDA breakdown by cement plant generation shows that the latest (sixth) generation in cement producing technology makes up more than 70% in the LCT and 90% in the ACT of cumulative EBITDA in 2050. This includes the 53% production capacity outfitted with CCS which makes more than 60% of the cumulative EBITDA in 2050.
Across the six countries, thecement sector’sEBITDA growssteadily only inthe LCT and stagnates in ACT until 2040 .
There is significant divergence of individual company performane .

C
A
1
2
3
4
6
5
Looking at the country breakdown, the cumulative EBITDA of Brazil and Mexi-co more than doubles in the LCT scenario until 2050, compared to 2016, due to production growth and increasing EBITDA margins. The latter is the effect of higher value cement types but also of incrementally switching a rather homo-geneous set of older cement plants to newer generation. In this situation, the older plants that account for the majority of the supply tend to keep the cement price relatively high, generating additional profit for the cement producers in the transformation process.
In ACT, the rather carbon-intensive cement production in Brazil and Mexico is susceptible regarding rising CO2 prices, diminishing EBITDA margins relative to LCT. In contrast, Germany and Italy lose EBITDA to the gradual elimination of overcapacity in both scenarios, while France and USA manage to sustain the cumulative EBITDA results. In 2050 all countries recover from their dip in EBITDA due to CCS becoming economically viable which reduces the pressure of the high carbon price.
Results: Sector-level EBITDA impact of the two scenarios along the pathways 32
Cumulative EBITDA of Brazil and Mexico more than doubles in the LCT scenario until 2050

C
A
1
2
3
4
6
5
Chart 8 Cement producers‘ aggregated financial performance across USA, Brazil, Mexico, Germany, Italy and France under two climate scenarios
Main drivers: Technological* development and regional growth
Source: The CO-Firm
Results: Sector-level EBITDA impact of the two scenarios along the pathways 33
2020 2030 2040 2050
60
0
90
30
EBITD
A (c
hang
e %
vs. 2
016) LCT
ACT
Sector average in six selected countries 55 companies (ACT)
-100
-50
0
50
100
150
200
2020 2030 2040 2050EB
ITDA
(cha
nge %
vs.
2016
)
010
020
050
150
20202016
EBITD
A [1
00%
in 20
16]
2030 2050
100
200
150
050EB
ITDA
[100
% in
2016
]
2016 2020 2030 2050
6. TECH. LVL.+CCS 6. TECH. LVL. 5. TECH. LVL. 4. TECH. LVL. 3. TECH. LVL.
LCT ACT
050
100
150
200
EBITD
A [1
00%
in 20
16]
20202016 2030 2050Germany France USAItaly Mexico Brazil
020
050
100
150
EBITD
A [1
00%
in 20
16]
20302016 2020 2050
Both scenarios produce material financial impact for the cement sector in the six countries considered, resulting in stagna-tion till 2040 (ACT) or in substantial growth till 2050 (~75%, till 2050)
Companies are in a very different shape to leverage a 2° C global warming scenario for their benefit.
Technology footprint is a key determinant of EBITDA performance, with the sixth’s technology plus CCS being the EBITDA winner in ACT in 2050 .
Geographic footprint is a strong determinant of financial performance, with Mexico and Brazil being key EBITDA growth markets in LCT and ACT in 2050 .
Sector average in six selected countries 55 companies (ACT)
LCT ACT
6. TECH. LVL.+CCS 6. TECH. LVL. 5. TECH. LVL. 4. TECH. LVL. 3. TECH. LVL.
Germany France Italy USA Mexico Brazil

C
A
1
2
3
4
5
6
06
RESULTS: COMPANY-LEVEL EBITDA IMPACT
» 6.1 LafargeHolcim: Strong climate performer
» 6.2 HeidelbergCement: Climate risk resilient
» 6.3 CRH: growing in both scenarios
The earnings results presented in the following section focus on the 2°C ACT scenario, while explaining differences to the 2.7°C LCT scenario, as to not overburden the reader with in-formation. A full breakdown of the results from all scenario-pathway combinations can be found in the accompanying online tool, that you can request access to under www.et-risk.eu or [email protected].

C
A
1
2
3
4
5
6
Results: Company-level EBITDA impact 35
6 .1 .1 Introduction to LafargeHolcim
In 2015, LafargeHolcim was formed by the merger of Lafarge and Holcim, making it the largest cement producer in the world (excluding China), with a presence in more than 80 countries. While LafargeHolcim produces a range of building materials, it is important to note that this report only focus on the cement pro-duction. In the six countries in focus (i.e. USA, Mexico, Brazil, Germany, Italy and France), LafargeHolcim can increase cumulative EBITDA in both climate scena-rios, though with a much stronger growth potential through strategic investments in the LCT scenario.
6.1 LafargeHolcim: Strong climate performer
Analyst guidance: The results and charts below exclusively highlight findings from a climate risk scenario analysis. As such, they neither contain nor pro-vide any assessment of probabilities. They illustrate relative changes in fi-nancial parameters over time. Results are subject to the scope (cement production only), the applied operationalized scenarios, corporate ad-aptation (technology portfolio development: FROZEN_2020, MARKET, MAR-KET-EBIT in the current countries and technologies), and the modelling limit-ations. Companies’ portfolio data is based on Global Cement Directory, Cemnet and own research with a raw data input deadline of end of 2016. Any significant, interim changes in corporate strategies are likely to have an impact on these results. They do not constitute a financial forecast nor an investment advice. See Appendix for more information.
6 .1 .2 Cumulative EBITDA 2016-2050 grows across both scenarios
LafargeHolcim is active in all of the six countries in focus. All six countries, i.e. USA, Mexico, Brazil, Germany, Italy and France, have already or will introduce CO2 certificates or similar mechanisms by 2020, impacting the company’s production costs. While most of the carbon-related costs increase can be passed on to the customer, the remaining share of the cost is still affecting the company’s EBITDA margin negatively.
This effect is stronger with the higher CO2 prices in the ACT scenario, resulting in the lowest EBITDA of +7%, compared to the +39% EBITDA increase in the LCT scenario. In the countries in focus, LafargeHolcim operates rather large and pro-fitable cement plants. Under the MARKET-EBIT assumption, LafargeHolcim makes use of its financial strength, upgrading capacity and gaining additional market share. Under this assumption, the company increases its production capacity by almost 50% until 2050, resulting in an EBITDA growth of +56% in the LCT, and +34% in the ACT scenario, relative to the 2016 baseline. The baseline extrapolates 2016 EBITDA to 2050 for reference purposes, without discounting.
LafargeHolcim is active in further countries that promise potential for future growth, these need to be analysed separately.

C
A
1
2
3
4
5
6
0 20 40 60 80 100 120 140 160
Indexed sum of cumulative EBITDA (Baseline = EBITDA in 2016 until 2050)
ACT MARKET-EBIT
2016 Baseline
LCT MARKET-EBIT
ACT MARKET
LCT MARKET
103
100
156
139
134
Years 2023 -2030First 5 years Years 2030 - 2050
Chart 9 LafargeHolcim profits from its global diversity and can increase its EBITDA in all four combinations of two climate scenarios (ACT/LCT) and two adaptive capacity pa-thways (MARKET/MARKET-EBIT)
Source: The CO-Firm
Results: Company-level EBITDA impact 36
6 .1 .3 2°C scenario: lowest EBITDA grow until 2040
The ATC limits global warming to 2°C, requiring CO2 prices of up to 180 USD/t CO2 in 2050. Despite the margin impact of high CO2 prices in ACT, LafargeHolcim’s EBITDA grows in MARKET-EBIT and is stable in MARKET. This is due to technology performance of its plants (strong share of large-scale and profitable cement plants with latest technology already in 2016) and its market share in the growth markets Brazil and Mexico. In MARKET-EBIT, the strong positioning can be levera-ged further.
LafargeHolcim especially improves when leveraging its financial strength in the ACT scenario .

C
A
1
2
3
4
5
6
-100
-50
0
50
100
2020 2025 2030 2035 2040 2045 2050
EBITD
A (c
hang
e %
vs.
2016
)
FROZENMARKETMARKET-EBIT
Chart 10 Zooming in, LafargeHolcim can maintain absolute EBITDA levels under the 2°C climate scenario (ACT ) between 2016 and 2040, with strong growth potential after 2040.
Source: The CO-Firm
6 .1 .4 Brazil and Mexico are main drivers for EBITDA grow
For this report, we assume that companies continue to operate in today’s markets and will not enter new markets. Instead, under the MARKET-EBIT assump-tion, they will try to increase capacity and market share in their existing markets. While EBITDA is stagnating in Germany, Italy, France, and USA between 2016 and 2030, it steadily increases in Brazil and Mexico, where demand for cement is still growing.
» In the ACT scenario, with the MARKET-EBIT assumption, LafargeHolcim uses its financial strength in those growing countries to upgrade capacities and market shares. The high CO2 prices in the ACT slow EBTIDA growth till 2030. However, after upgrading the plants ahead of the competition, LafargeHol-cim benefits significantly from the high CO2-price regime (up to 180 USD/t CO2 in 2050). Of the six countries in focus, around 50% of the cumulative EBITDA is earned in Brazil and Mexico in 2050. This more than doubles the total EBITDA generated in these countries in 2016.
» Regarding the technology level, LafargeHolcim’s current physical asset portfolio is the most up-to-date one in the six selected countries, relative to the other two companies in focus. More than two third of its plants operate with the latest (6th) technology level (i.e. dry rotary kiln with pre-heater and pre-calciner) and only less than 10% are still operating on the comparably inefficient 4th technology level (i.e. dry long rotary kiln).
Results: Company-level EBITDA impact 37
LafargeHolcim slightly increases EBITDA in the 2°C scenario when adapting, without adaptation financial performance signifi-cantly decreases from 2020 onwards .
C
A
1
2
3
4
5
6
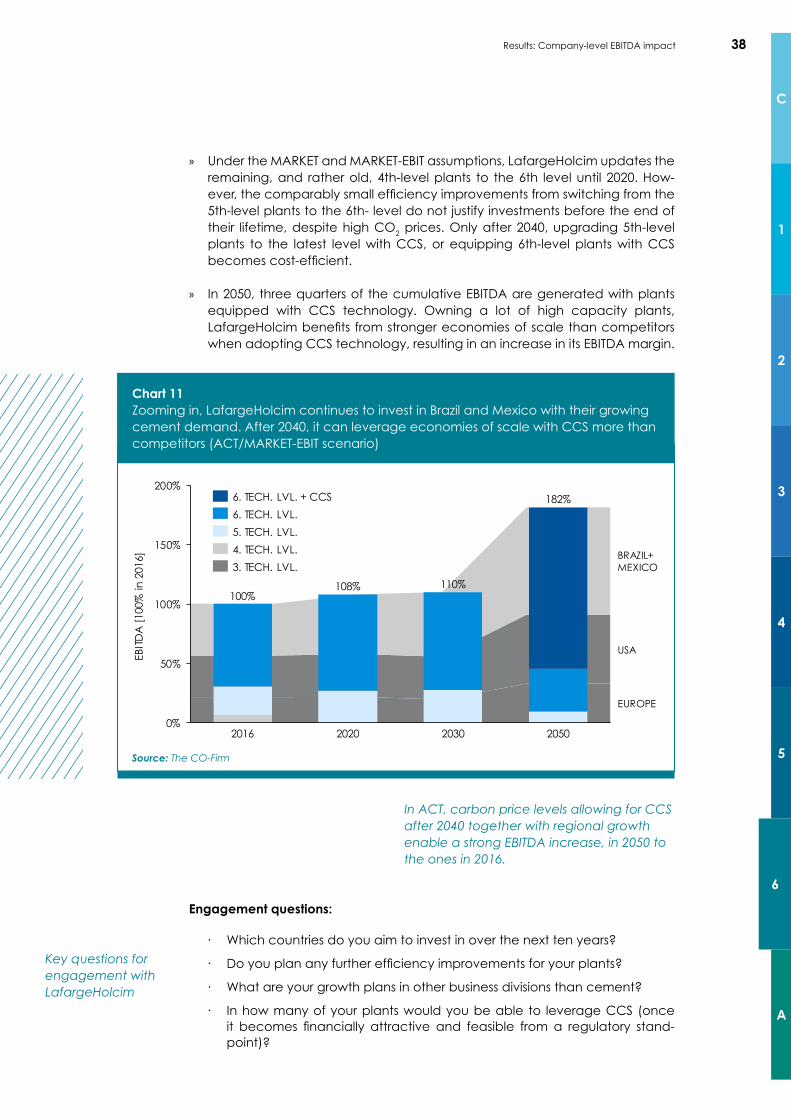
» Under the MARKET and MARKET-EBIT assumptions, LafargeHolcim updates the remaining, and rather old, 4th-level plants to the 6th level until 2020. How-ever, the comparably small efficiency improvements from switching from the 5th-level plants to the 6th- level do not justify investments before the end of their lifetime, despite high CO2 prices. Only after 2040, upgrading 5th-level plants to the latest level with CCS, or equipping 6th-level plants with CCS becomes cost-efficient.
» In 2050, three quarters of the cumulative EBITDA are generated with plants equipped with CCS technology. Owning a lot of high capacity plants, Lafarge Holcim benefits from stronger economies of scale than competitors when adopting CCS technology, resulting in an increase in its EBITDA margin.
EUROPE
BRAZIL+MEXICO
USA
0%
50%
100%
150%
200%
108%
2016
EBITD
A [1
00%
in 2
016]
2020
110%
2030 2050
100%
182%
3. TECH. LVL.
6. TECH. LVL. + CCS
4. TECH. LVL.
6. TECH. LVL.5. TECH. LVL.
Chart 11 Zooming in, LafargeHolcim continues to invest in Brazil and Mexico with their growing cement demand. After 2040, it can leverage economies of scale with CCS more than competitors (ACT/MARKET-EBIT scenario)
Source: The CO-Firm
Results: Company-level EBITDA impact 38
Engagement questions:
∙ Which countries do you aim to invest in over the next ten years?
∙ Do you plan any further efficiency improvements for your plants?
∙ What are your growth plans in other business divisions than cement?
∙ In how many of your plants would you be able to leverage CCS (once it becomes financially attractive and feasible from a regulatory stand-point)?
In ACT, carbon price levels allowing for CCS after 2040 together with regional growth enable a strong EBITDA increase, in 2050 to the ones in 2016 .
Key questions for engagement with LafargeHolcim

C
A
1
2
3
4
5
6
6.2 HeidelbergCement: Climate risk resilient
6 .2 .1 Introduction to HeidelbergCement
HeidelbergCement is a German multinational building materials company. After the acquisition of Italcementi in 2016 (formerly the 5th largest cement producer), Heidelberg became the second largest cement producer worldwide (excluding China), with activities in around 60 countries. While HeidelbergCement produces a range of building materials, it is important to note that this report only focus on the cement production. HeidelbergCement produces cement in four (i.e. USA, Germany, Italy and France) of the six countries in focus. Until 2050, Heidelberg-Cement’s cumulative EBITDA is slightly negatively affected by the two climate scenarios.
Analyst guidance: The results and charts below exclusively highlight fin-dings from a climate risk scenario analysis. As such, they neither contain nor provide any assessment of probabilities. They illustrate relative chan-ges in financial parameters over time. Results are subject to the scope (ce-ment production only), the applied operationalized scenarios, corporate adaptation (technology portfolio development: FROZEN_2020, MARKET, MARKET-EBIT in the current countries and technologies), and the modelling limitations. Companies’ portfolio data are based on Global Cement Direc-tory, Cemnet and own research with the date of end-2016. Any significant, interim changes in corporate strategies are likely to have an impact on the-se results. They do not constitute a financial forecast nor investment advice. See Appendix for more information.
Results: Company-level EBITDA impact 39
6 .2 .2 Slight negative impact on cumulative earnings 2016-2050, across both scenarios
HeidelbergCement produces cement in four (i.e. USA, Germany, Italy and France) of the six countries in focus. In both climate scenarios, all four countries have already or will introduce CO2 certificates or similar mechanisms by 2020, impacting the company’s production costs. While most of the carbon-related cost increase can be passed through, a residual share still negatively impacts the company’s EBITDA margin. This effect is stronger with the high CO2 prices of the ACT scenario. In comparison to LafargeHolcim and CRH, in the four of the six countries of operation, HeidelbergCement owns a lower share of high capacity plants operating at the latest technology level. Also, to a larger extent, it is operating in countries with a stagnating cement demand. Thus, under MAR-KET-EBIT, HeidelbergCement hardly increases capacity.
For HeidelbergCement the countries in focus represent mature markets only. HeidelbergCement is active in further countries that promise potential for future growth, these need to be analysed separately.

C
A
1
2
3
4
5
6
0 10 20 30 40 50 60 70 80 90 100 110
Indexed sum of cumulative EBITDA (Baseline = EBITDA in 2016 until 2050)
ACT MARKET
LCT MARKET
2016 Baseline
LCT MARKET-EBIT
ACT MARKET-EBIT
100
102
96
99
93
First 5 years Years 2023-2030 Years 2030-2050
Chart 12 HeidelbergCement profits from its global diversity and can maintain EBITDA in all four combinations of two climate scenarios (ACT/LCT) and two assumptions around techno logical portfolio development (MARKET/MARKET-EBIT)
Source: The CO-Firm
Results: Company-level EBITDA impact 40
HeidelbergCement can manage to sustainclose to stable earnings in both climatescenarios
6 .2 .3 2°C scenario: Slight EBITDA impacts in 2016-2040
In ACT, CO2 prices of up to 180 USD/tCO2 in 2050 negatively affect Heidelberg-Cement’s EBITDA in both adaptive capacity scenarios. Because Heidelberg-Cement is situated in countries with stagnating cement demand (Italy, Germany, France and the US) and has an average market share in high capacity plants operating with the latest technology level, it faces limited options for extending capacities along the MARKET-EBIT pathway.
Under the MARKET-EBIT assumption, HeidelbergCement can nonetheless main-tain close to stable despite the high carbon prices in the ACT scenario and increase EBTIDA slightly in the LCT scenario. The baseline extrapolates 2016 EBITDA to 2050 for reference purposes.

C
A
1
2
3
4
5
6
-100
-50
0
50
100
20302020 20352025 2040 2045 2050
EBITD
A (c
hang
e %
vs.
2016
)
MARKET FROZENMARKET-EBIT
Chart 13 Zooming in, in ACT, HeidelbergCement can be expected to face EBITDA pressure even under MARKET EBIT up to 2045.
Source: The CO-Firm
6 .2 .4 Stagnating cement demand puts EBITDA growth under stress
HeidelbergCement faces pressure from stagnating markets and rising carbon prices.
» At the end of 2016, HeidelbergCement operated cement plants in four of the six countries in focus (i.e. USA, Germany, Italy and France). Due to the modelling assumption that companies continue to invest in markets they are currently producing in, HeidelbergCement stays in its four countries in focus and cannot profit from cement demand in Brazil and Mexico grow like CRH or LafargeHolcim.
» From 2016 to 2040, the high CO2 prices in the ACT scenario (up to 180 USD/t CO2 in 2050) increase production costs, negatively impacting EBITDA margins both in Europa and USA. In particular cement plants in those countries in close proximity to harbours are exposed to potential clinker imports by ship from countries without emission schemes.
» HeidelbergCement’s 2016 physical asset portfolio across the four countries shows an average state of energy and carbon efficiency. One third of its plants have adopted the latest (6th) technology level (i.e. dry rotary kiln with pre-heater and pre-calciner), while close to 20% are still operating with the relatively inefficient 4th technology level (i.e. dry long rotary kiln) or below.
Results: Company-level EBITDA impact 41
HeidelbergCement almost maintains EBITDA in the 2°C scenario when adapting, without adaptation financial performance signifi-cantly decreases from 2020 onwards .

C
A
1
2
3
4
5
6
» In ACT, under the MARKET and MARKET-EBIT assumptions, HeidelbergCement updates most of the remaining, and rather old, 3rd and 4th-level plants to the 6th-level until 2020. However, the relatively small efficiency improvements gained from upgrading the 5th to the 6th level do not justify investments before the end of their lifetime, despite high CO2 prices. Only after 2040, upgrading 5th-level plants to the latest level with CCS, or equipping 6th- level plants with CCS becomes cost-efficient. In 2050, more than 50% of the cumulative EBITDA is generated with plants equipped with CCS technology.
USA
Europe
0%10%20%30%40%50%60%70%80%90%
100%110%120%130%140%150%
EBITD
A [1
00%
in 2
016]
84%95%
113%
2016 20502020 2030
100%
4. TECH. LVL6. TECH. LVL. + CCS3. TECH. LVL.6. TECH. LVL
5. TECH. LVL
Chart 14 Under the MARKET_EBIT assumption, companies will continue to invest in today’s market and not enter new markets. Stagnating cement demand and high CO2 prices in the ACT scenario negatively impact HeidelbergCement’s EBITDA in Europe and US between 2016 (ACT/MARKET-EBIT scenario)
Source: The CO-Firm
Results: Company-level EBITDA impact 42
In ACT, carbon price levels allowing for CCS after 2040 enable EBITDA growth . The share of EBITDA from the EU and the US are com-parable in 2050 to the ones in 2016 .
Engagement questions:
∙ Have you performed scenario analysis and if so, with which results?
∙ What is the general financial performance that you foresee for your cement business? Which role do other business segments play in your financial performance today and in the future?
∙ Which are your key growth markets over the coming ten years, and are you intending to invest into any markets that are new to you?
Key questions for engagement with HeidelbergCement

C
A
1
2
3
4
5
6
6.3 CRH: growing in both scenarios
6 .3 .1 Introduction to CRH
With activities in 32 countries, CRH is a globally diversified building materials company based in Ireland. It is the seventh largest cement producer world wide (excluding China). In mid-2017, CRH acquired Ash Grove, the fifth largest cement producers in the US. This merger is not portrayed in the report as end of 2016 had been chosen as the baseline. Furthermore, while CRH produces a range of building materials, it is important to note that this report only focusses on the cement production. End of 2016, out of the six countries in focus, CRH produced cement in Germany, France and Brazil. From 2016 to 2050, CRH has the potential to increase its EBITDA significantly in both climate scenarios, in those three coun-tries. Still, CRH’s strategic investments in the LCT 2.7°C scenario have the highest financial impact.
Analyst guidance: The results and charts below exclusively highlight fin-dings from a climate risk scenario analysis. As such, they neither contain nor provide any assessment of probabilities. They illustrate relative chan-ges in financial parameters over time. Results are subject to the scope (ce-ment production only), the applied operationalized scenarios, corporate adaptation (technology portfolio development: FROZEN_2020, MARKET, MARKET-EBIT in the current countries and technologies), and the modelling limitations. Companies’ portfolio data is based on Global Cement Directo-ry, Cemnet and own research, with a baseline of end-2016. Any significant, interim changes in corporate strategies are likely to have an impact on the-se results. They do not constitute a financial forecast nor investment advice. See Appendix for more information.
Results: Company-level EBITDA impact 43
6 .3 .2 Highest growth of cumulative EBITDA 2016-2050
The company is active in three of the six countries in focus. All three countries, i.e. Brazil, Germany and France, have, or will introduce CO2 certificates or similar mechanisms by 2020, impacting the company’s production costs. While most of the carbon-related cost increase can be passed through, the remainder of the carbon cost negatively impacts the company’s EBITDA margin. In ACT, this effect is stronger, due to the high CO2 prices. In the respective countries, CRH holds a considerable share of the large and profitable cement plants. Under the MARKET-EBIT assumption, CRH can make use of its financial strength, extending its capacity by 18 % till 2050, resulting in EBITDA growth of +28% in the ACT scena-rio, and +62% in the LCT, and compared to the baseline. The baseline extra-polates 2016 EBITDA to 2050, undiscounted, for illustrative purposes.
The report uses end-2016 as starting point which exclu-des the acquisition of US-based cement producer Ash Grove in mid-2017 .
CRH is active in further countries that promise potential for future growth, these need to be analysed separately.

C
A
1
2
3
4
5
6
0 20 40 60 80 100 120 140 160 180
ACT MARKET
Indexed sum of cumulative EBITDA (Baseline = EBITDA in 2016 until 2050)
LCT MARKET
2016 Baseline
LCT MARKET-EBIT 162
128ACT MARKET-EBIT
155
100
118
First 5 years Years 2023-2030 Years 2030-2050 W/O ASH GROVE MERGER 2017
Chart 15 CRH profits from its global diversity and can increase its EBITDA in all four combinations of two climate scenarios (ACT/LCT) and two assumptions around technological port-folio development (MARKET/MARKET-EBIT)
Source: The CO-Firm
Results: Company-level EBITDA impact 44
In both scenarios, CRH can gain an about10 percentage points higher EBITDA increase by investing, leveraging its financialstrength .
6 .3 .3 2°C scenario: low EBITDA grow until 2040
The ACT limits global warming to 2°C and dictates CO2 prices of up to 180 USD/t CO2 in 2050. While this affects EBITDA margins negatively, CRH’s EBITDA grows un-der both pathway assumptions (MARKET and MARKET-EBIT). While the relatively low standard of CRH’s current plants in these countries initially limits growth, CRH can benefit substantially from a demand increase, especially in Brazil.
In ACT, along the MARKET pathway, the EBITDA increase is limited to +18 percentage points till 2050, compared to +55 percentage points in the LCT scenario.

C
A
1
2
3
4
5
6
-100
-50
0
50
100
2020 2025 2030 2035 2040 2045 2050
EBITD
A (c
hang
e %
vs.
2016
)
FROZENMARKET-EBIT MARKET
W/O ASH GROVE MERGER 2017
Chart 16 Zooming in, CRH incrementally adapt its technological portfolio to newer technologi-cal level when economical viable and maintains absolute EBITDA levels between 2016 and 2040 under the 2°C climate scenario (ACT)
Source: The CO-Firm
6 .3 .4 First Brazil then Germany are main driver for EBITDA grow
In 2016, CRH operated cement plants in three of the six countries in focus (i.e. USA, Mexico, Brazil, Germany, Italy and France). From 2016 till 2030, EBITDA is stagnating in Germany and France, but steadily increases in Brazil.
» In ACT and along MARKET-EBIT, CRH uses its financial strength to extend its capacity and gain further market share in Brazil. Until 2030, high CO2 prices slow EBTIDA growth, but after 2040, the integration of CCS into the plants allows CRH to significantly benefit from the high CO2 prices. In 2050, around 75% of the cumulative EBITDA of the three countries is earned in Brazil and Germany.
» I 2016, CRH’s plant portfolio is in the lower-middle field in terms of technolo-gical progress in the three out of six countries. Less than 20% of its produc-tion plants adopted the latest (6th) technology level (i.e. dry rotary kiln with pre-heater and pre-calciner) and still more than 25% are using the compa-rably inefficient 4th technology level (i.e. dry long rotary kiln).
Results: Company-level EBITDA impact 45
CRH benefits from economies of scale when adopting CCS and sees EBITDA growth after 2040 in the 2°C scenario, without adapta-tion financial performance significantly decreases from 2020 onwards .

C
A
1
2
3
4
5
6
» Under MARKET and MARKET-EBIT assumptions, CRH updates all of the remaining, 4th-level plants and older 5th-level plants to the 6th level until 2020. Upgrading the remaining 5th-level plants is not cost-efficient between 2020 and 2030, despite rising CO2 prices. Only after 2040, upgrading 5th-level plants to the latest level with CCS, or equipping 6th-level plants with CCS becomes cost-efficient. In 2050, more than half of the cumulative EBITDA is generated with plants equipped with CCS technology. CRH benefits relative to local competitors more from economics of scale when adopting CCS technology, as it owns a considerable share of high capacity plants.
Germany
France
Brazil
0%
50%
100%
150%
200%
EBITD
A [1
00%
in 2
016]
105%
2020
100% 104%
20502016 2030
164%
6. TECH. LVL. + CCS6. TECH. LVL. 3. TECH. LVL.5. TECH. LVL.
4. TECH. LVL. W/O ASH GROVE MERGER 2017
Chart 17 Zooming in, CRH continues to invest in the Brazilian growth market. Owning a conside-rable share of high capacity plants, the company benefits from economics of scale when adopting CCS technology after 2040 (ACT/MARKET-EBIT scenario)
Source: The CO-Firm
Engagement questions:
∙ Which countries do you aim to invest in over the next ten years?
∙ When do you envision substantial efficiency upgrades in your plants?
∙ In how many of your plants would you be able to leverage CCS (once it becomes financially attractive and feasible from a regulatory stand-point)?
Results: Company-level EBITDA impact 46
CRH benefits from EBITDA increases acrossits regions of operation and benefits from expansion with CCS .
Key questions for engagement with CRH

C
1
2
3
4
5
6
A
APPENDIX: CLIMATEXCELLENCE TOOL, LIMITATIONS, AND KEY SCENARIO DATA
» A.1 Overview of the climateXcellence model
» A.2 Limitation of the method applied
» A.3 Underlying scenario data
C
1
2
3
4
5
6
A
Appendix 48
This section builds on:
∙ Validation with a broad range of financial and ESG analysts, academia, and practitioners over the last five years.
Research is published in the following documents:
∙ Transition scenarios: The Transition Risk-O-Meter . Reference Scenarios For Financial Analysis (2dii, The CO-Firm, June 2017, link).
∙ Technical Supplement: The Use of Scenario Analysis in Disclosure of Clima-te-Related Risks and Opportunities, TCFD (June 2017, link).
∙ Adaptive capacity: changing colors . Adaptive capacity of companies in the context of the transition to a low carbon economy (2dii, The CO-Firm, Allianz, Allianz Global Investors, August 2017, link).
∙ Climate scenario compass: Investor primer to transition risk analysis (Kepler Cheuvreux, The CO-Firm, January 2018, link).
∙ Climate scenario compass: Transition risks for electric utilities (The CO-Firm, Kepler Cheuvreux, January 2018, link).
∙ Climate scenario compass: Transition risks for the automotive sector (Kep-ler Cheuvreux, The CO-Firm, forthcoming).
∙ Climate scenario compass: Transition risks for the steel sector (The CO-Firm, Kepler Cheuvreux, forthcoming).
∙ Climate change scenarios: Transition risks: How to move ahead . (Kepler Cheuvreux, The CO-Firm, forthcoming).
This section illustrates the practical application of the Investor primer to transition risk analysis published by Kepler Cheuvreux and The CO-Firm (link), which provides a higher-level discussion of the concepts and analysis steps described below.

C
1
2
3
4
5
6
A
Appendix 49
A.1 Overview of the climateXcellence model
Drivers of change
Regulation
Technology
Market
Litigation
Reputation
Scenario data Asset level data Risk mitigation measures
Market development Asset development
Holistic XXXXXXXHolistic XXXXXXXHolistic narrativesFinancial asset data
+KPI (e.g. CO2-intensity)
Potentials + Costs
Demand Adaptive capacity
1 2 3
2016
P
q
Demand Supply
2020…
20162020
…
Supply costs
Earnings
Prices
$/bbl
5 4
company-and asset-
specif ic
Asset level dataFeedback loop to check consistency of narratives
Revenues
Expenditures
Income statement Balance sheetAssets and Liabilities
Capital and Financing
6
Price
Cash-Flow Statement
Chart 18 Overview of the method applied. How to derive the business impact of transition scenarios in the cement sector
Source: The CO-Firm
Financial modelling of the cement sector with respect to climate scenario ana-lysis can be divided into six central steps (see Chart 18; subsequent numbering is consistent with the chart; for more general information on each of the following steps, please refer to the “Investor primer to transition risk analysis” report):
1. Derive the key risk drivers to translate a scenario into a narrative. First, develop a holistic transition narrative by extending scenario data with consistent transition drivers. For the cement sector, we conducted the following steps to derive a consistent scenario:
a. Analysing, extrapolating, and breaking down available scenario data of the global and regional cement sector (i.a. IEA Energy Techno-logy Perspective 2017;2016; IEA World Energy Outlook 2017;2016) to country-specific technology pathways in terms of production and CO2 emissions.
b. Determining drivers of change including regulatory (e.g. CO2 prices), technological (e.g. CO2 intensity, clinker to cement ratio) and market- based (i.e. secondary fuel prices, aggregate prices, demand for high value cement type) by region and by scenario based on current and announced regulatory regimes, climate targets, envisaged technology pathways (see point a), etc.

C
1
2
3
4
5
6
A
2. Build an asset-level database with financial information on individual tech-nology. Since climate transition impacts technologies differently (even within the same sector), building a financially meaningful asset-level database is central to the modelling. For the cement sector, we build upon Global Cement Directory, Cemnet and own research with the date of end-2016. The database contains some rough asset-level information on a technology level (e.g. wet, semi-dry, dry), installed capacity, ownership, location. We have complemented the available data (technology-specific) with the following information:
a. Specific energy and raw material usage, CO2 intensity, marginal short-run and long-run production costs
b. CAPEX requirements and depreciation over time by scenario and by region.
c. Expected year of decommissioning based on the age of the plant.
3. Conduct a techno-economic assessment of risk mitigation measures (“adaptive capacity”). Financial modelling of climate risk must consider companies’ ability to adapt to changing environments. With respect to the cement sector, analysing risk mitigation must take into account a variety of aspects such as:
a. The scenario applied (e.g. ACT, LCT).
b. The current technology (e.g. type, location, and start-up year) and market base (e.g. access to secondary fuel, demand for high value cement types) of a company.
c. The ratio between production costs benefits and CAPEX requirements of the new technology.
4. Assumptions for companies’ physical asset portfolio development with and without adaptive capacities under different scenarios. Here we make assumptions on how companies make use of the available options (see step 3) to adapt its physical asset base (see step 2) to the changing environment of the climate scenario (see step 1). For the cement sector, we modelled three portfolio development pathways: FROZEN, MARKET, and MARKET-EBIT (see Chart 7 for a detailed description of adaptive scenarios).
5. Derive financial performance of individual assets in market models: Cement is a mostly locally traded commodity because its low value to weight ratio does not justify economically long-distance transportation. Thus, cement producers compete mostly with local producers. The local cement market is modelled with an annual merit-order based approach. The merit order ranks the cement supply in ascending order based on the marginal production costs. The cross-section between supply costs and demand determines the local annual cement price. The asset-specific profits margins are derived by the difference of the local market price the individual production costs.
Appendix 50

C
1
2
3
4
5
6
A
6. Derive financial impacts on companies. In the last step, the financial performance of the individual assets obtained in step 5 are aggregated together with the capital requirements of step 3 and 4 to the company level. This step ensures the linkage to the Task Force on Climate-related Financial Disclosures (TCFD) recommendations by outlining the scenario-related impacts on the income, cash-flow statement and balance sheet.
Note: For an overview of how to develop scenario analysis and integrate this into company valuations and investment decision-making, please see the “Investor primer to transition risk analysis” published by Kepler Cheuvreux and The CO-Firm (link).
A.2 Limitation of the method applied
Although the underlying method has been developed over years and reviewed by a range of stakeholders, it does have its limitations that need to be taken into account and tested for when incorporating results into financial modelling.
» Scenarios are not associated with likelihoods: The underlying scenarios are operationalized IEA scenarios (see the “Investor primer to transition risk ana-lysis” report). Although this is inherent to scenario analysis and not a limitation per se, it is important to note. For instance, the IEA has been criticised for continuously overestimating the deployment of CCS in its scenarios. While it is fair to say that the scenarios try to anticipate drivers such as technological im-provements, it does not estimate the likelihood of these drivers. The strength of the scenario is the plausibility and consistency of the outlined parameters over time.
» Companies’ asset development assumptions: The model assumes that com-panies will remain active in country-asset combinations they are invested in end-2016. Furthermore, as no market entry of new players is assumed, capa-city upgrades outlined by scenario are shared among existing companies.
» Scenario analysis and alignment assessments. It is important to understand that the ACT (2°C) scenario tests for the financial impact of the various parameters (e.g. CO2 prices) compatible with such a trajectory, but it does not assume that the companies are “aligned” in terms of their asset base, as understood under the science-based target approach (and more specifically the sectoral decarbonisation approach) or SEI Metrics’ 2°C portfolio test (misalignment of activities based on future production by technology, and the technology portfolio requirements illustrated in the IEA’s scenarios). In fact, while several of them can, the remaining non-CCS plants are too large to be equally distributed to allow for a linear ownership across cement com-panies. Thus, few companies will show higher emissions than aimed for, to ensure system stability. Also, please note that alignment with science-based targets is not per se correlated with financial performance.
Appendix 51

C
1
2
3
4
5
6
A
A.3 Underlying scenario data
Chart 19 Excerpt from “modelling principles of the transition scenarios“
Source: The Transition Risk-O-Meter
Sector Type Indicator Page Geography Main Sources
Cement
Production & technology
Cement production (Mt) 54World, BR, MX, USA, FR, DE, IT
IEA ETP, EC Trends 2015
Clinker to cement ratio (%) 55World, BR, MX, USA, FR, DE, IT
IEA ETP
Energy intensity for clinker production (GJ / t clinker)
56World, BR, MX, USA, FR, DE, IT
IEA ETP
Share of alternative fuel use (%) 57World, BR, MX, USA, FR, DE, IT
IEA ETP
CCS deployment (%) 58World, BR, MX, USA, FR, DE, IT
IEA ETP
CO2 Intensity (t CO2 / t cement) 59World, BR, MX, USA, FR, DE, IT
IEA ETP
Market Pricing
Secondary Fuels (USD / ton) 60 WorldThird-party source
Policy costs and incen-tives
Allowances of free CO2 allowances (% of total direct emissions)
61 BR, EU, MX, USAIEA ETP and Third-party source
Appendix 52

Impressum
Editor: The CO-Firm GmbH Veritaskai 3 21079 Hamburg www.co-firm.com E-Mail: [email protected] Fon: +49 (0)40 2281 - 6551
Supported by:
This project has received funding from the European Union’s Horizon 2020 research and innovation programme under grant agreement No. 696004. The text reflects only the author’s view. The Agency (EASME) under the power delegated by the European Commission is not responsible for any use that may be made of the information it contains.
Editing: peppermint werbung berlin GmbH www.peppermint.de
About The CO-Firm:
The CO-Firm GmbH is a boutique consultancy that supports its clients in the financial assess-ment of risks and opportunities arising from energy and climate change. For the assessment of risks and opportunities, The CO-Firm uses its climateXcellence toolbox, which was an es-sential part of its work on climate risk modelling with Allianz Global Investors, Allianz Clima-te Solutions and WWF Germany from 2013, as well as its work with the Investment Leaders Group, organised by the Cambridge Institute for Sustainability Leadership. In addition to their work for clients from the real economy and finance, Kepler Cheuvreux and Standard and Poor‘s are currently building exemplary equity valuation and credit valuation approaches for climate risks and opportunities as part of the European Commission‘s Energy Transition Risk Project.
Authors:
Dr. Nicole Röttmer Dr. Jean-Christian Brunke Jana Mintenig
July 2018, First edition