Embed Size (px)
Citation preview

Step 2Which plant species will
be sustainable for the proposed revegetation site in the future?
Step 1What are the climate
projections for the site?
2.1 List the species currently recorded
at the site
2.2 Map the current distribution of the
species
2.3 Add the revegetation site to species’ distribution map and climate envelope
2.4 Apply the climate projections to the scatterplot
to assess the species’ sustainability under future climate
2.5 Consider alternatives if local species unlikely
to be sustainable
2.6 Model future distributions for species unlikely to
survive unassisted
Step 3Which provenance strategy
will increase the likelihood of the local population surviving
in the future?
3.1 Where should non-local provenance material be
sourced from?
3.2 What should the proportion of non-local provenance to
local provenance be?
3.3 Is there a risk of outbreeding depression when
mixing local and non-local provenances?
3.4 What other factors should be considered?
Figure 1. Steps 1–3 (1) Where to find and how to use climate projections; (2) How to consider which plant species will be sustainable for the proposed vegetation site; and (3) How to consider an appropriate provenance strategy.
OverviewThis Guide represents a first attempt at compiling online tools
available to assist natural resource managers incorporate the in-
herent uncertainties associated with climate change when plan-
ning revegetation activities. The information in the Guide is based
on the premise that survival and resilience will be enhanced for
species and local populations with large, genetically diverse popu-
lations. Species differ in their vulnerability to climate change. Spe-
cies that cannot evolve and adapt to new environmental condi-
tions in-situ as fast as the climate changes, or disperse to more
suitable climes, will be more vulnerable than those with the evolu-
tionary potential and/or the capacity to disperse. In theory, plants
with wide distributions are more likely to cope with climate change
than those with narrow distributions. However, even if a species’
distribution indicates that it is able to tolerate a broad range of cli-
mate conditions, survival of local populations is not guaranteed.
Small populations may require genetic rescue (incorporating non-
local genetic material) to boost their capacity to adapt to a rapidly
changing environment.
The Guide provides step-by-step instructions on where to find and
how to use climate projections and how to consider the suitabil-
ity of species and provenances for revegetation projects (Figure
1). The consideration of factors other than climate change to de-
termine the suitability of species and provenance selection (e.g.
soil characteristics, topography and aspect) are covered in other
publications and are not addressed in this Guide (e.g. the Stand-
ards for the Practice of Ecological Restoration in Australia (SERA)
http://www.seraustralasia.com/pages/standards.html, or look
for regional examples such as www.biodiversitygateway.com.au/
SWSR_Guide/home.html).
Climate-ready revegetationA guide for natural resource managers. Version 2
Glossary
Adaptive capacity: The ability to evolve
and adapt to a new environment
Adaptive management: Used in situa-
tions where despite uncertainty, deci-
sions and actions must be made and
acted upon. The process acknowledges
that the information used to make these
decisions is incomplete and therefore
may be incorrect. Emphasizes learning
from the outcomes of these decisions to
inform future decision-making
Ecosystem services: Processes or serv-
ices provided by species and ecosystems,
e.g. crop pollination by insects
Evolutionary potential: The potential
to evolve
Germplasm: Seed or other regenerative
material
In-situ: In the original place
Niche space: Realized niche space – the
area that a species occupies vs Available
niche space – the area that is suitable for
that species to occupy (but the species is
not present)
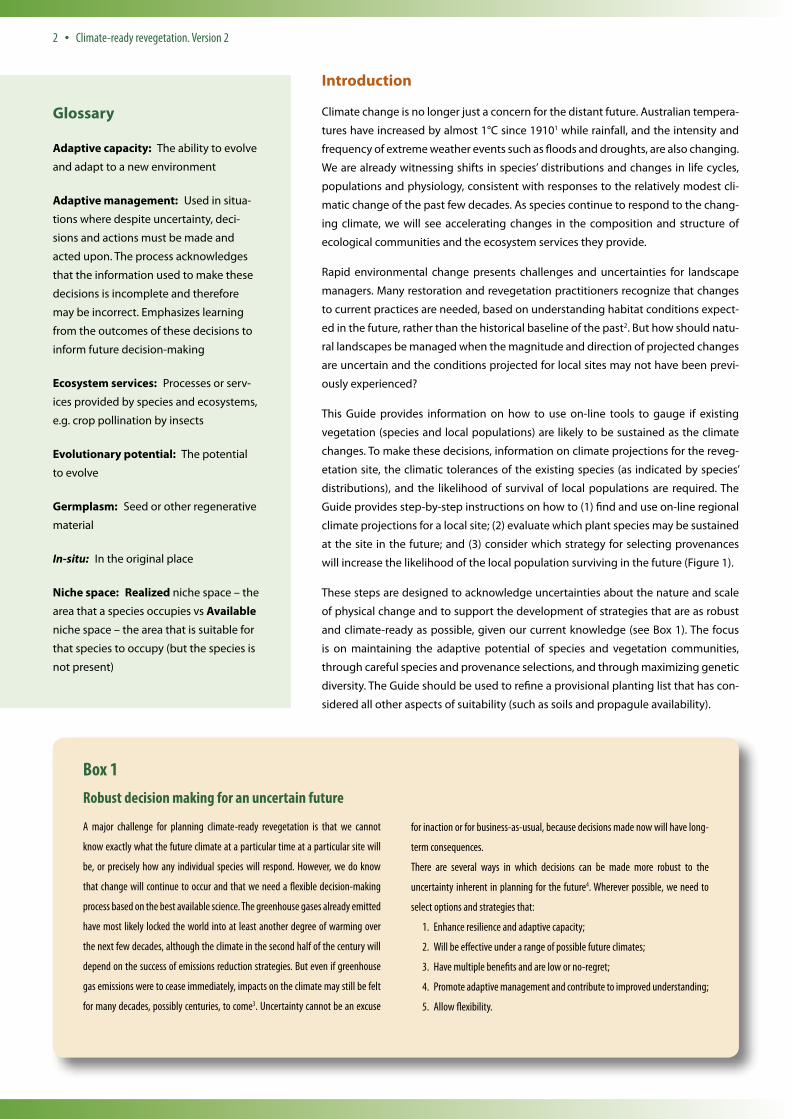
Introduction
Climate change is no longer just a concern for the distant future. Australian tempera-
tures have increased by almost 1°C since 19101 while rainfall, and the intensity and
frequency of extreme weather events such as floods and droughts, are also changing.
We are already witnessing shifts in species’ distributions and changes in life cycles,
populations and physiology, consistent with responses to the relatively modest cli-
matic change of the past few decades. As species continue to respond to the chang-
ing climate, we will see accelerating changes in the composition and structure of
ecological communities and the ecosystem services they provide.
Rapid environmental change presents challenges and uncertainties for landscape
managers. Many restoration and revegetation practitioners recognize that changes
to current practices are needed, based on understanding habitat conditions expect-
ed in the future, rather than the historical baseline of the past2. But how should natu-
ral landscapes be managed when the magnitude and direction of projected changes
are uncertain and the conditions projected for local sites may not have been previ-
ously experienced?
This Guide provides information on how to use on-line tools to gauge if existing
vegetation (species and local populations) are likely to be sustained as the climate
changes. To make these decisions, information on climate projections for the reveg-
etation site, the climatic tolerances of the existing species (as indicated by species’
distributions), and the likelihood of survival of local populations are required. The
Guide provides step-by-step instructions on how to (1) find and use on-line regional
climate projections for a local site; (2) evaluate which plant species may be sustained
at the site in the future; and (3) consider which strategy for selecting provenances
will increase the likelihood of the local population surviving in the future (Figure 1).
These steps are designed to acknowledge uncertainties about the nature and scale
of physical change and to support the development of strategies that are as robust
and climate-ready as possible, given our current knowledge (see Box 1). The focus
is on maintaining the adaptive potential of species and vegetation communities,
through careful species and provenance selections, and through maximizing genetic
diversity. The Guide should be used to refine a provisional planting list that has con-
sidered all other aspects of suitability (such as soils and propagule availability).
2 • Climate-ready revegetation. Version 2
Box 1Robust decision making for an uncertain future
A major challenge for planning climate-ready revegetation is that we cannot
know exactly what the future climate at a particular time at a particular site will
be, or precisely how any individual species will respond. However, we do know
that change will continue to occur and that we need a flexible decision-making
process based on the best available science. The greenhouse gases already emitted
have most likely locked the world into at least another degree of warming over
the next few decades, although the climate in the second half of the century will
depend on the success of emissions reduction strategies. But even if greenhouse
gas emissions were to cease immediately, impacts on the climate may still be felt
for many decades, possibly centuries, to come3. Uncertainty cannot be an excuse
for inaction or for business-as-usual, because decisions made now will have long-
term consequences.
There are several ways in which decisions can be made more robust to the
uncertainty inherent in planning for the future4. Wherever possible, we need to
select options and strategies that:
1. Enhance resilience and adaptive capacity;
2. Will be effective under a range of possible future climates;
3. Have multiple benefits and are low or no-regret;
4. Promote adaptive management and contribute to improved understanding;
5. Allow flexibility.
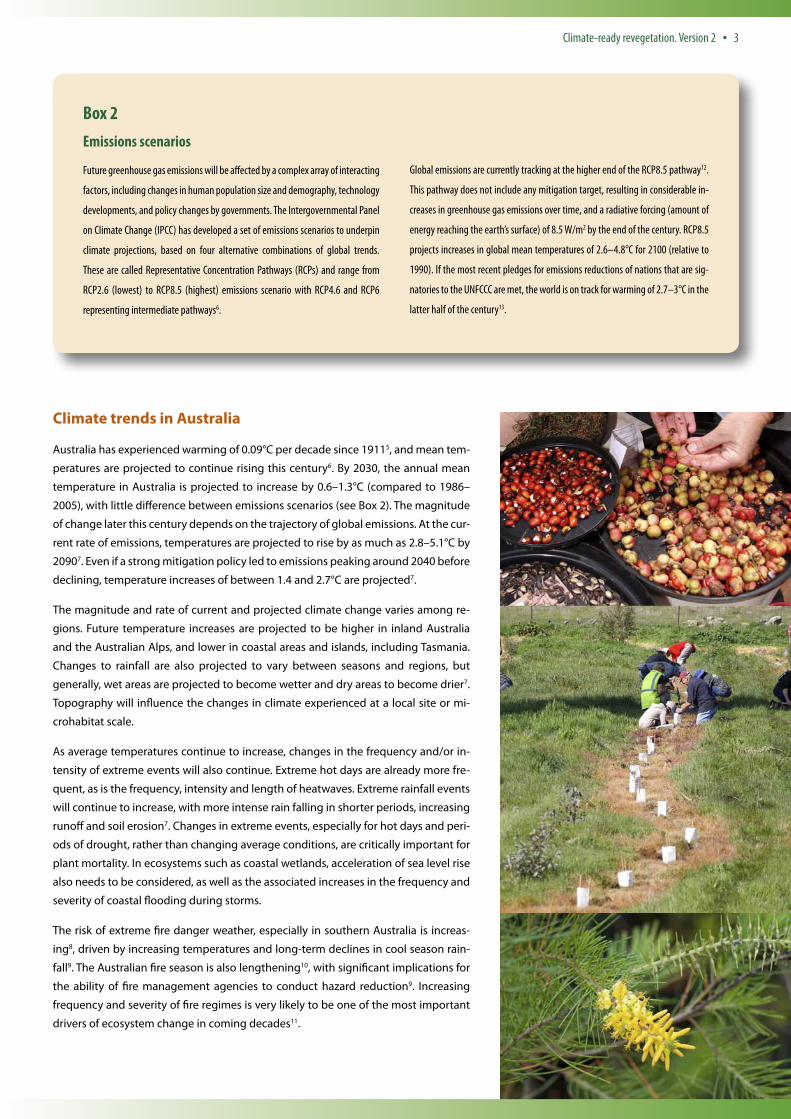
Climate trends in Australia
Australia has experienced warming of 0.09°C per decade since 19115, and mean tem-
peratures are projected to continue rising this century6. By 2030, the annual mean
temperature in Australia is projected to increase by 0.6–1.3°C (compared to 1986–
2005), with little difference between emissions scenarios (see Box 2). The magnitude
of change later this century depends on the trajectory of global emissions. At the cur-
rent rate of emissions, temperatures are projected to rise by as much as 2.8–5.1°C by
20907. Even if a strong mitigation policy led to emissions peaking around 2040 before
declining, temperature increases of between 1.4 and 2.7°C are projected7.
The magnitude and rate of current and projected climate change varies among re-
gions. Future temperature increases are projected to be higher in inland Australia
and the Australian Alps, and lower in coastal areas and islands, including Tasmania.
Changes to rainfall are also projected to vary between seasons and regions, but
generally, wet areas are projected to become wetter and dry areas to become drier7.
Topography will influence the changes in climate experienced at a local site or mi-
crohabitat scale.
As average temperatures continue to increase, changes in the frequency and/or in-
tensity of extreme events will also continue. Extreme hot days are already more fre-
quent, as is the frequency, intensity and length of heatwaves. Extreme rainfall events
will continue to increase, with more intense rain falling in shorter periods, increasing
runoff and soil erosion7. Changes in extreme events, especially for hot days and peri-
ods of drought, rather than changing average conditions, are critically important for
plant mortality. In ecosystems such as coastal wetlands, acceleration of sea level rise
also needs to be considered, as well as the associated increases in the frequency and
severity of coastal flooding during storms.
The risk of extreme fire danger weather, especially in southern Australia is increas-
ing8, driven by increasing temperatures and long-term declines in cool season rain-
fall9. The Australian fire season is also lengthening10, with significant implications for
the ability of fire management agencies to conduct hazard reduction9. Increasing
frequency and severity of fire regimes is very likely to be one of the most important
drivers of ecosystem change in coming decades11.
Climate-ready revegetation. Version 2 • 3
Box 2Emissions scenarios
Future greenhouse gas emissions will be affected by a complex array of interacting
factors, including changes in human population size and demography, technology
developments, and policy changes by governments. The Intergovernmental Panel
on Climate Change (IPCC) has developed a set of emissions scenarios to underpin
climate projections, based on four alternative combinations of global trends.
These are called Representative Concentration Pathways (RCPs) and range from
RCP2.6 (lowest) to RCP8.5 (highest) emissions scenario with RCP4.6 and RCP6
representing intermediate pathways6.
Global emissions are currently tracking at the higher end of the RCP8.5 pathway12.
This pathway does not include any mitigation target, resulting in considerable in-
creases in greenhouse gas emissions over time, and a radiative forcing (amount of
energy reaching the earth’s surface) of 8.5 W/m2 by the end of the century. RCP8.5
projects increases in global mean temperatures of 2.6–4.8°C for 2100 (relative to
1990). If the most recent pledges for emissions reductions of nations that are sig-
natories to the UNFCCC are met, the world is on track for warming of 2.7–3°C in the
latter half of the century13.
Step 1. What are the climate projections for the proposed revegetation site? Where to find and how to use climate projections at the regional level
A variety of on-line tools are available to assist natural resource managers to
plan for plausible climate futures at a regional level, although the level of spatial
resolution varies between tools developed in different States and regions. It is
not possible, nor desirable, to use a single value for the change in temperature
or rainfall at a particular site for a particular time period, because there will
always be uncertainty associated with projections14. The values derived from
the tools will depend on the emissions scenario (see Box 2) and climate model
chosen, and the range of uncertainty will be greater for some variables. For
example, projections of future rainfall are generally more uncertain than those
for temperature. Indeed, in some instances, projections of rainfall at a site not
only vary considerably in magnitude but also in direction.
One approach is to consider both a ‘worst case’ and ‘best case’ scenario, where
‘worst’ and ‘best’ are defined in relation to existing climate (e.g. a dry location
projected to be drier). The Climate Projections for Australia website has a tool
that demonstrates this approach (see Box 3) and Figure 2 illustrates the ranges
provided on the NARCLiM website (Box 3).
1. Go to Box 3 and find the climate projection for the region of interest.
Box 3 provides a list of web-based tools, developed at both the national and
State level that can be used to project environmental conditions at the re-
gional level. If projections at the regional level are not available for the par-
ticular State, the CSIRO and Bureau of Meteorology website (Regional Climate
Change Explorer) will be the most useful.
4 • Climate-ready revegetation. Version 2
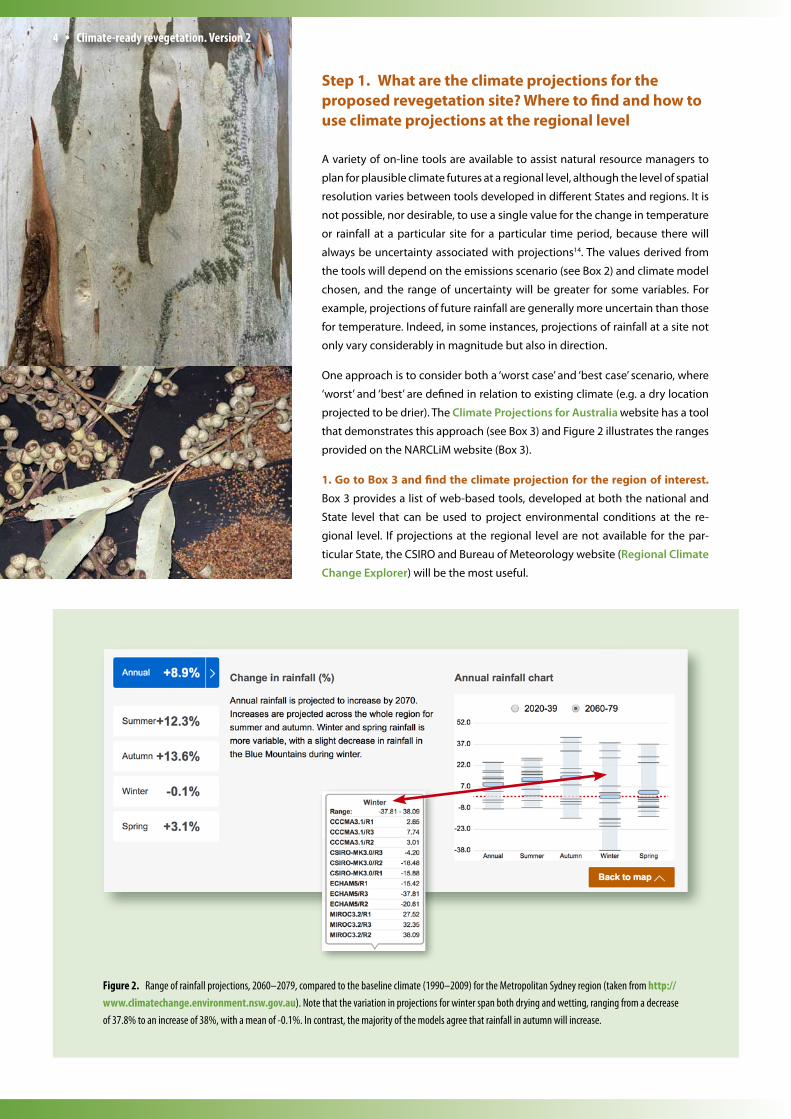
Figure 2. Range of rainfall projections, 2060–2079, compared to the baseline climate (1990–2009) for the Metropolitan Sydney region (taken from http://www.climatechange.environment.nsw.gov.au). Note that the variation in projections for winter span both drying and wetting, ranging from a decrease of 37.8% to an increase of 38%, with a mean of -0.1%. In contrast, the majority of the models agree that rainfall in autumn will increase.
Box 3
What will the site be like in the future? A toolbox of resources
Climate-ready revegetation. Version 2 • 5
State-based climate change toolsNSW & ACT
NARCliM has produced an ensemble of regional climate projections for south-
eastern Australia that can be used to plan for the range of likely future changes
in climate (2030 and 2070).
Go to: http://www.climatechange.environment.nsw.gov.au/Climate-
projections-for-NSW/About-NARCliM
To obtain projections for the region:
Either
1. Download a pdf:
a. Go to: http://www.climatechange.environment.nsw.gov.au
b. Click on the ‘Climate projections for NSW’ tab | Climate projections for
your region
Or
2. Access detailed projections (recommended action):
a. Go to: http://www.climatechange.environment.nsw.gov.au
b. Click on the ‘Climate projections for NSW’ tab | interactive map
c. Click on the ‘Region view’ tab
d. On the interactive map, click in the region of interest
e. Select the appropriate climate variable and time range from the list on
the right hand side of the map (e.g. temperature and click on the arrow)
f. Click on ‘Read more’
g. Click on the bars on the graph to see the range of projected highs and
lows (see Figure 2 for an example)
Tasmania
Climate Futures for Tasmania: Dynamically downscaled climate projections
for Tasmania are based on six global climate models under two emissions
scenarios (high emissions scenario – A2; and lower emissions scenario – B1)
Climate information is available for the period 1961 to 2100 at ~10 km
resolution. The summary reports consider changes to mean and extreme
climate conditions, runoff and hydrology, and fire danger. http://acecrc.org.
au/climate-futures-for-tasmania/
Western Australia
The Western Australian Local Government Association has developed a
toolkit to help local governments adapt to climate change. http://walga.
asn.au/Policy-Advice-and-Advocacy/Environment/Climate-Change/
Additional-Climate-Change-Resources.aspx
Victoria
Regional climate projections are available from http://www.climatechange.
vic.gov.au
Queensland
Climate projections are available at https://www.longpaddock.qld.gov.au.
Users must register on-line to receive the data.
Climate projections for Australia (CSIRO and Bureau of Meteorology)Go to www.climatechangeinaustralia.gov.au. Support and guidance on how
to use the website is available at http://www.climatechangeinaustralia.
gov.au/en/support-and-guidance/. This website provides access to a wide
range of tools, datasets and guidance material. These tools include:
Regional climate change explorer
To obtain a regional climate change projection:
1. Go to http://www.climatechangeinaustralia.gov.au/en/climate-
projections/about/modelling-choices-and-methodology/
regionalisation-schemes/
2. Click on the ‘Cluster Search Tool’ link (an excel spreadsheet) to determine
which cluster represents the region of interest:
3. Click on the link ‘Cluster report’: http://www.climatechangein
australia.gov.au/en/publications-library/cluster-reports/
4. Click on the link for the region of interest.
Thresholds calculator
Users can explore projected changes in the annual-average number of days
above or below selected thresholds for maximum and minimum temperatures
at over 100 sites. http://www.climatechangeinaustralia.gov.au/en/
climate-projections/explore-data/threshold-calculator/
Australian Climate Futures
A tool that tabulates projected changes in two climate variables, selected
from a list of up to 16 variables. It shows the clustering and spread of
projections produced by up to 40 climate models, for selected years and
emission scenarios. This information can guide the selection of a small subset
of climate models for use in impact assessment. Users can select a ‘worst case’
scenario, a ‘best case’, or a ‘maximum consensus’ case that is relevant to their
context. http://www.climatechangeinaustralia.gov.au/en/climate-
projections/climate-futures-tool/introduction-climate-futures/
Map explorer
This tool allows users to produce a map of climate projections for individual
climate models across a range of variables, time periods and emissions scenarios.
Users can zoom into regions of interest and download data in different formats.
Click on Explore data | Map explorer http://www.climatechangein
australia.gov.au/en/climate-projections/explore-data/map-explorer/
Other tools on the site include the Climate Extremes explorer (to view
projections for cold nights, hot days and extreme rainfall) http://www.
climatechangeinaustralia.gov.au/en/climate-campus/climate-
extremes/ and the Marine Explorer (for sea level rise and other oceanic
variables) http://www.climatechangeinaustralia.gov.au/en/climate-
projections/coastal-marine/marine-explorer/
Further information about climate science, climate models, projections and
data can be found in the Climate Campus http://www.climatechange
inaustralia.gov.au/en/climate-campus/, designed to build knowledge in
key climate science areas.
6 • Climate-ready revegetation. Version 2
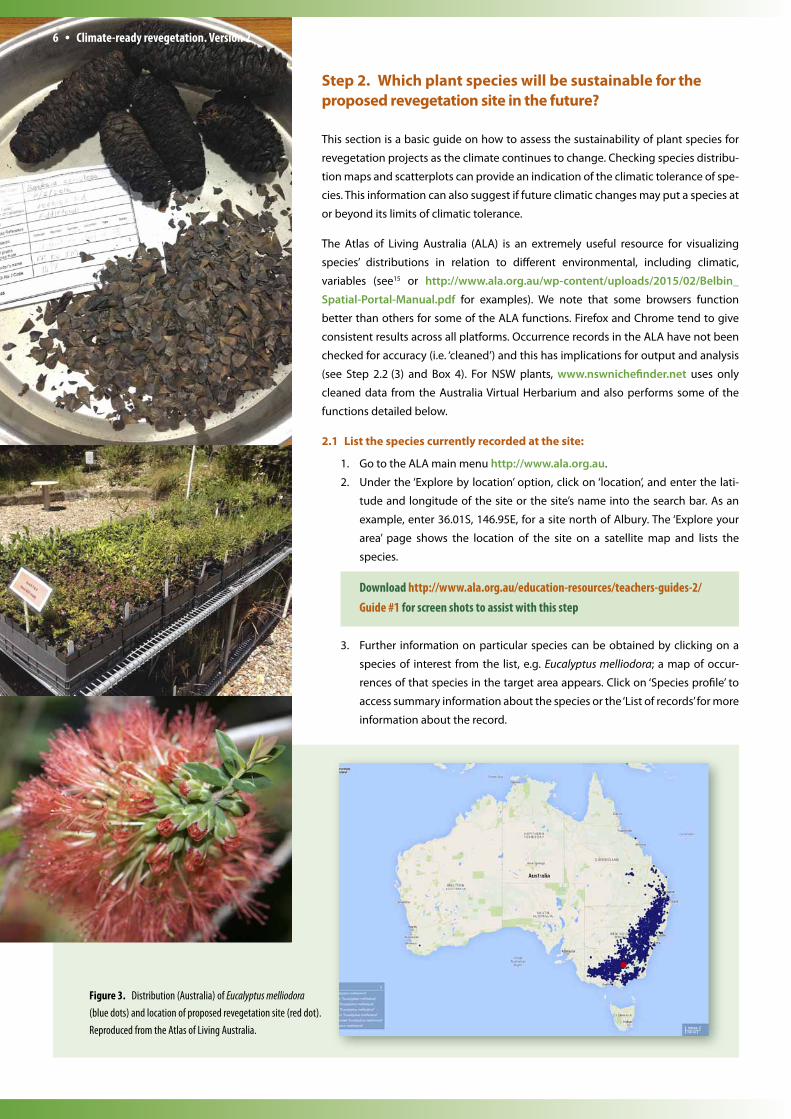
Figure 3. Distribution (Australia) of Eucalyptus melliodora (blue dots) and location of proposed revegetation site (red dot). Reproduced from the Atlas of Living Australia.
Step 2. Which plant species will be sustainable for the proposed revegetation site in the future?
This section is a basic guide on how to assess the sustainability of plant species for
revegetation projects as the climate continues to change. Checking species distribu-
tion maps and scatterplots can provide an indication of the climatic tolerance of spe-
cies. This information can also suggest if future climatic changes may put a species at
or beyond its limits of climatic tolerance.
The Atlas of Living Australia (ALA) is an extremely useful resource for visualizing
species’ distributions in relation to different environmental, including climatic,
variables (see15 or http://www.ala.org.au/wp-content/uploads/2015/02/Belbin_
Spatial-Portal-Manual.pdf for examples). We note that some browsers function
better than others for some of the ALA functions. Firefox and Chrome tend to give
consistent results across all platforms. Occurrence records in the ALA have not been
checked for accuracy (i.e. ‘cleaned’) and this has implications for output and analysis
(see Step 2.2 (3) and Box 4). For NSW plants, www.nswnichefinder.net uses only
cleaned data from the Australia Virtual Herbarium and also performs some of the
functions detailed below.
2.1 List the species currently recorded at the site:
1. Go to the ALA main menu http://www.ala.org.au.
2. Under the ‘Explore by location’ option, click on ‘location’, and enter the lati-
tude and longitude of the site or the site’s name into the search bar. As an
example, enter 36.01S, 146.95E, for a site north of Albury. The ‘Explore your
area’ page shows the location of the site on a satellite map and lists the
species.
Download http://www.ala.org.au/education-resources/teachers-guides-2/ Guide #1 for screen shots to assist with this step
3. Further information on particular species can be obtained by clicking on a
species of interest from the list, e.g. Eucalyptus melliodora; a map of occur-
rences of that species in the target area appears. Click on ‘Species profile’ to
access summary information about the species or the ‘List of records’ for more
information about the record.
•
Climate-ready revegetation. Version 2 • 7
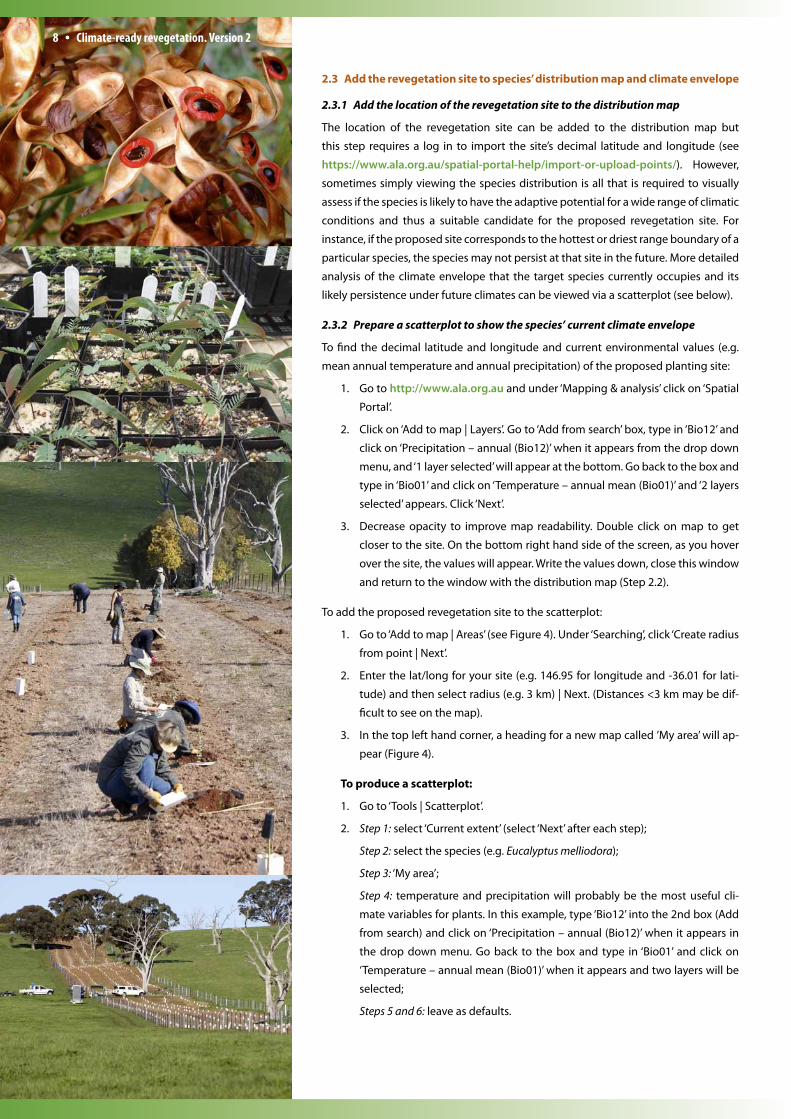
Box 4Cleaning the data is an important step
To remove an occurrence record in the ALA, click on the point on the occurrence
map – an ‘Occurrence information’ box appears. Click in the ‘Assign record to ad
hoc group’ option. Click on the X at the top of the box to exit. On the left of the
screen, click on the ‘Add in/out layers to map’ option within ‘Ad hoc selection’. The
map is revised with the selected point in a different colour (in the distribution
map below, the most northerly record is now a different colour). At the top left of
2.2 Map the current distribution of the species:
1. Go to the main ALA menu http://www.ala.org.au and under ‘Mapping &
analysis’ click on ‘Spatial Portal’.
2. Select ‘Add to map | Species’ and enter the species name, e.g. ‘Eucalyptus mel-
liodora’
Download http://www.ala.org.au/education-resources/teachers-guides-2/ Guide #2 for screenshots to assist with this step and for detailed instructions, including how to view two species at the same time
3. Using the example of E. melliodora, the species occurrence map (Figure 3)
shows that the species has a wide distribution from Victoria to the Gladstone
region in Queensland, and also occurs in New Zealand. To check that any ‘out-
liers’ are credible records, click on that occurrence dot and then select ‘Full
record | View details’ to display detailed information about the record. If you
are not confident that the record is credible, the record can be removed (see
Box 4). There is some value in leaving in cultivated locations, and locations
where the species has naturalized or has been planted overseas (especially
eucalypts16) because this gives some indication of the thermal tolerance of
the species. However, these records should not be used to indicate rainfall
requirements because the plants may be artificially watered.
the screen (see red arrow on the screenshot below), you have the choice of analys-
ing the data (e.g. scatterplot) with the point removed (the ‘out’ group) or with the
point retained (the ‘in’ group).
Alternatively, if there is a group of points that you want to exclude, click on ‘Add to
map’ and then ‘Areas’. Select ‘Draw polygon’ and draw a polygon around the points
you want to include. A new map with only those points is then available.
Reproduced from the Atlas of Living Australia.
8 • Climate-ready revegetation. Version 2
2.3 Add the revegetation site to species’ distribution map and climate envelope
2.3.1 Add the location of the revegetation site to the distribution map
The location of the revegetation site can be added to the distribution map but
this step requires a log in to import the site’s decimal latitude and longitude (see
https://www.ala.org.au/spatial-portal-help/import-or-upload-points/). However,
sometimes simply viewing the species distribution is all that is required to visually
assess if the species is likely to have the adaptive potential for a wide range of climatic
conditions and thus a suitable candidate for the proposed revegetation site. For
instance, if the proposed site corresponds to the hottest or driest range boundary of a
particular species, the species may not persist at that site in the future. More detailed
analysis of the climate envelope that the target species currently occupies and its
likely persistence under future climates can be viewed via a scatterplot (see below).
2.3.2 Prepare a scatterplot to show the species’ current climate envelope
To find the decimal latitude and longitude and current environmental values (e.g.
mean annual temperature and annual precipitation) of the proposed planting site:
1. Go to http://www.ala.org.au and under ‘Mapping & analysis’ click on ‘Spatial
Portal’.
2. Click on ‘Add to map | Layers’. Go to ‘Add from search’ box, type in ‘Bio12’ and
click on ‘Precipitation – annual (Bio12)’ when it appears from the drop down
menu, and ‘1 layer selected’ will appear at the bottom. Go back to the box and
type in ‘Bio01’ and click on ‘Temperature – annual mean (Bio01)’ and ‘2 layers
selected’ appears. Click ‘Next’.
3. Decrease opacity to improve map readability. Double click on map to get
closer to the site. On the bottom right hand side of the screen, as you hover
over the site, the values will appear. Write the values down, close this window
and return to the window with the distribution map (Step 2.2).
To add the proposed revegetation site to the scatterplot:
1. Go to ‘Add to map | Areas’ (see Figure 4). Under ‘Searching’, click ‘Create radius
from point | Next’.
2. Enter the lat/long for your site (e.g. 146.95 for longitude and -36.01 for lati-
tude) and then select radius (e.g. 3 km) | Next. (Distances <3 km may be dif-
ficult to see on the map).
3. In the top left hand corner, a heading for a new map called ’My area’ will ap-
pear (Figure 4).
To produce a scatterplot:
1. Go to ‘Tools | Scatterplot’.
2. Step 1: select ‘Current extent’ (select ‘Next’ after each step);
Step 2: select the species (e.g. Eucalyptus melliodora);
Step 3: ‘My area’;
Step 4: temperature and precipitation will probably be the most useful cli-
mate variables for plants. In this example, type ‘Bio12’ into the 2nd box (Add
from search) and click on ‘Precipitation – annual (Bio12)’ when it appears in
the drop down menu. Go back to the box and type in ‘Bio01’ and click on
‘Temperature – annual mean (Bio01)’ when it appears and two layers will be
selected;
Steps 5 and 6: leave as defaults.
Climate-ready revegetation. Version 2 • 9
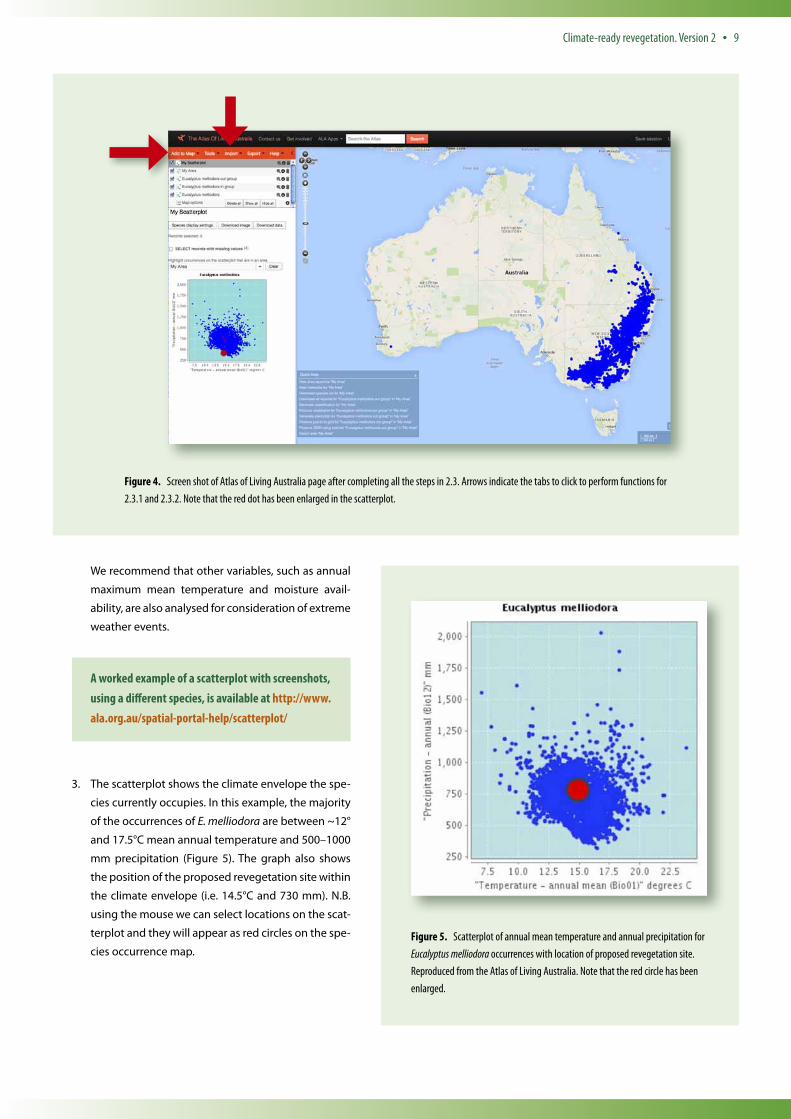
Figure 4. Screen shot of Atlas of Living Australia page after completing all the steps in 2.3. Arrows indicate the tabs to click to perform functions for 2.3.1 and 2.3.2. Note that the red dot has been enlarged in the scatterplot.
Figure 5. Scatterplot of annual mean temperature and annual precipitation for Eucalyptus melliodora occurrences with location of proposed revegetation site. Reproduced from the Atlas of Living Australia. Note that the red circle has been enlarged.
We recommend that other variables, such as annual
maximum mean temperature and moisture avail-
ability, are also analysed for consideration of extreme
weather events.
3. The scatterplot shows the climate envelope the spe-
cies currently occupies. In this example, the majority
of the occurrences of E. melliodora are between ~12°
and 17.5°C mean annual temperature and 500–1000
mm precipitation (Figure 5). The graph also shows
the position of the proposed revegetation site within
the climate envelope (i.e. 14.5°C and 730 mm). N.B.
using the mouse we can select locations on the scat-
terplot and they will appear as red circles on the spe-
cies occurrence map.
A worked example of a scatterplot with screenshots, using a different species, is available at http://www.ala.org.au/spatial-portal-help/scatterplot/
•

2.4 Apply the climate projections to the scatterplot to assess the species’
sustainability under future climate
1. Refer to the future climate projections for the region of interest. Using the
example of E. melliodora and the Albury site (Step 1, Box 3) (http://www.
climatechangeinaustralia.gov.au/en/publications-library/cluster-reports/),
a mean warming of 2.7–4.5°C in 2080–2099 (using RCP8.5), with rainfall pro-
jected to vary between seasons i.e. -40% to +5% in winter is projected.
2. Compare the climate projections with the information derived from points
2 to 4, particularly the scatterplot. For E. melliodora at the Albury site, by the
end of the century, the projected rise in mean annual temperature and a 30%
decline in annual precipitation is likely to put conditions at the Albury site
at the outer limits of those that are currently experienced within the natural
distribution of the species (Figure 3). Under those conditions, E. melliodora
may not be a suitable species and monitoring of distribution changes would
be advisable.
2.5 Consider alternatives if local species are unlikely to be sustainable
After completing Steps 2 and 3, if the persistence of existing species is doubtful under
changing climatic conditions, plants from outside the local area may need to be
considered for the proposed revegetation site. This is particularly important for key
species such as those needed to recreate functioning ecosystems. There are many
factors to consider if species from outside the local area are included in a planting
list and in addition to industry standards (e.g. the SERA Standards for the Practice of
Ecological Restoration in Australia), consideration should be given to factors such as:
• Is there a risk of the species becoming invasive?
• Can the species disperse or migrate naturally to the proposed revegetation
site?
• Are there any common species at the proposed revegetation site and an ana-
logue town (Box 5)?
• Are the soil types compatible?
• Have any ‘new’ species already migrated to the proposed revegetation site?
To view a list of species that are currently present in locations with current climates
similar to those that a selected location may experience in the future (Box 5):
Go to: http://www.ala.org.au | Species by location, and follow the instruc-
tions set out in Step 2.1.
2.6 Model future distributions for species unlikely to survive without
assistance
Species with limited climatic tolerances that cannot adapt to a changing climate in-
situ or disperse naturally to more favourable climes will be vulnerable to population
decline and potentially even extinction. Planning should include the translocation
of these species to cooler and wetter (if applicable) locations outside their current
range, if these locations exist. More detailed climate analysis can be undertaken
in ALA using MaxEnt software. Species’ potential distributions are modelled using
several environmental layers. This function is not detailed here and we recommend
further reading on MaxEnt http://www.cs.princeton.edu/~schapire/maxent/ and
examples of modelling17 before undertaking this step.
10 • Climate-ready revegetation. Version 2
A NOTE OF CAUTION When using tools that only evaluate climate parameters, other determinants of past and future distribution such as soil, aspect, topography and interactions with other species (such as competitors and herbivores) should also be considered. Helpful websites include http://spatial.ala.org.au/ (Add to map | layers) and for NSW plant species, www.nswnichefinder.net
Climate-ready revegetation. Version 2 • 11
Box 5Imagining future changes in vegetation communities
As the climate changes, some plant species may become increasingly unsuited to
a particular local site. Changes in the population sizes and distributions of individ-
ual species will progressively lead to changes in the characteristics of vegetation
communities. For example, shrubby vegetation may progressively replace grass-
lands in some areas. The Climate analogues tool, available at CSIRO and Bureau
of Meteorology Climate projections for Australia website (http://www.climate
changeinaustralia.gov.au/en/) provides a useful way of envisioning the mag-
nitude of potential vegetation change at a site under a particular future climate. In
brief, the tool is used to find locations in Australia with current climates similar to
those that a selected location may experience in the future.
The website provides detailed instructions on how to use this tool, but here we
provide an example. Let us suppose that a revegetation project for a site in the
vicinity of Melbourne is being planned and we wish to envision what type of
vegetation that site might support in the period 2040 to 2059:
1. Go to http://www.climatechangeinaustralia.gov.au/en/climate-
projections/climate-analogues/analogues-explorer/
2. Either select Melbourne from the dropdown box (left side, bottom of map)
or click on Melbourne on the map.
3. Use either the ‘Configure data’ or ‘Preset scenarios’ option. To use the
preset option, select the cluster Melbourne belongs to (http://www.
climatechangeinaustralia.gov.au/en/climate-projections/about/
modelling-choices-and-methodology/regionalisation-schemes/);
the emissions scenario (we use the highest, RCP8.5, see Box 2); time period
and the future climate description (see Figure 6).
4. The temperature and rainfall ranges projected under those parameters then
appear under ‘Configure data’, and on the map, arrows point to analogue
towns (a list of towns appears below the preset function).
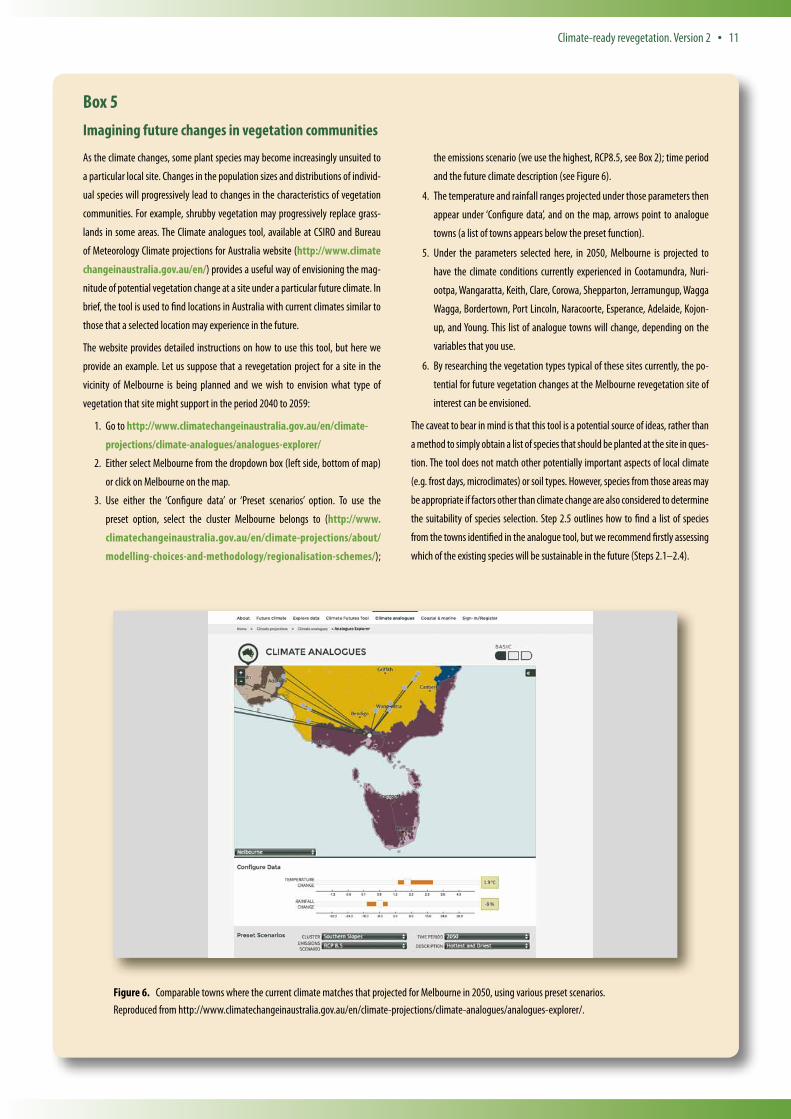
5. Under the parameters selected here, in 2050, Melbourne is projected to
have the climate conditions currently experienced in Cootamundra, Nuri-
ootpa, Wangaratta, Keith, Clare, Corowa, Shepparton, Jerramungup, Wagga
Wagga, Bordertown, Port Lincoln, Naracoorte, Esperance, Adelaide, Kojon-
up, and Young. This list of analogue towns will change, depending on the
variables that you use.
6. By researching the vegetation types typical of these sites currently, the po-
tential for future vegetation changes at the Melbourne revegetation site of
interest can be envisioned.
The caveat to bear in mind is that this tool is a potential source of ideas, rather than
a method to simply obtain a list of species that should be planted at the site in ques-
tion. The tool does not match other potentially important aspects of local climate
(e.g. frost days, microclimates) or soil types. However, species from those areas may
be appropriate if factors other than climate change are also considered to determine
the suitability of species selection. Step 2.5 outlines how to find a list of species
from the towns identified in the analogue tool, but we recommend firstly assessing
which of the existing species will be sustainable in the future (Steps 2.1–2.4).
Figure 6. Comparable towns where the current climate matches that projected for Melbourne in 2050, using various preset scenarios. Reproduced from http://www.climatechangeinaustralia.gov.au/en/climate-projections/climate-analogues/analogues-explorer/.

Step 3. Which strategy for selecting provenances will increase the likelihood of the local population surviving in the future?
The strategy to select the provenance/s best suited to a particular revegetation project
is context-specific and driven by variables such as the species’ phenotypic plasticity
(the ability to cope with change through physiological and/or morphological means
rather than by genetic alteration), levels of in-situ genetic diversity18, and the location
of the revegetation site. Therefore, in this Guide, the selection of the appropriate
provenance strategy and subsequent recommendations can only be general and not
site-specific.
Even though a species distribution may indicate that the species is able to tolerate
a broader range of climate conditions than those currently being experienced at
the proposed revegetation site, the survival of local populations is not guaranteed.
For example, local populations may not have sufficient genetic diversity to have the
capacity to adapt to a rapidly changing climate. The traditional approach of using
only locally collected germplasm is based on an assumption that local genotypes are
best adapted to local conditions. Given the rapidity of observed and future climate
change, this ‘local provenance is best’ approach is unlikely to provide the most
effective basis for long-term sustainability of revegetation projects.
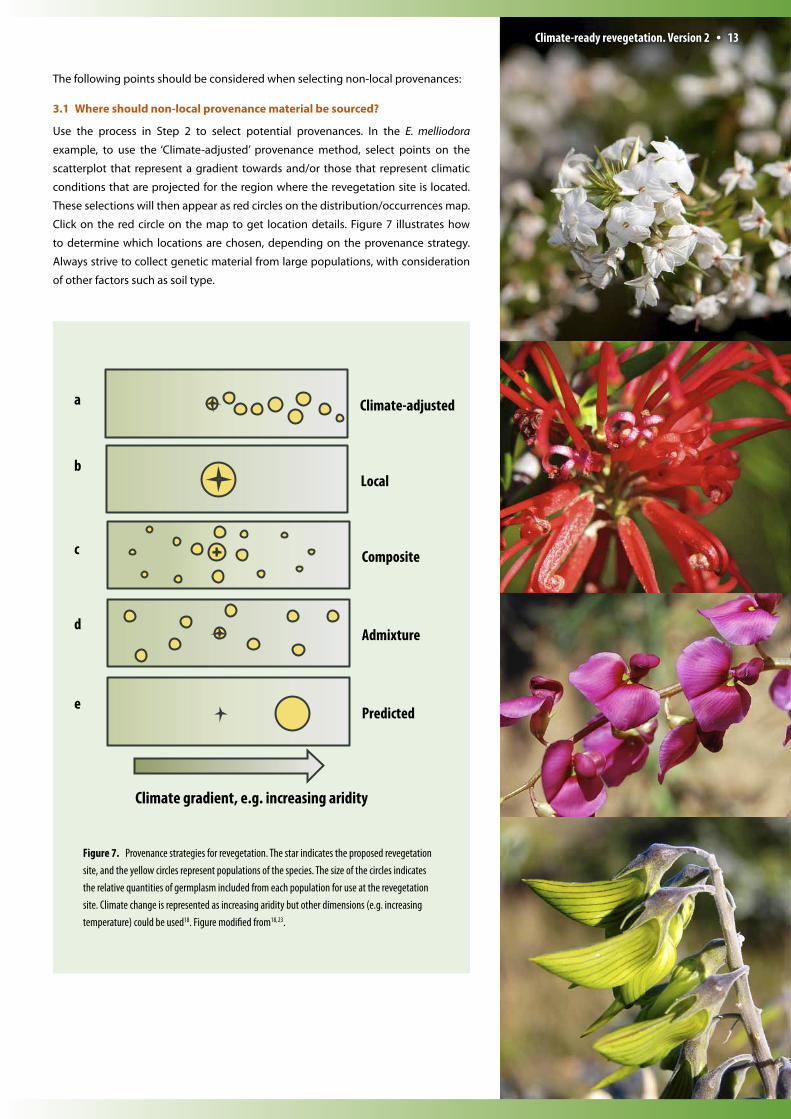
Provenance selection strategies
Including propagation material from locations currently experiencing climatic
conditions similar to that projected for the revegetation site will reduce the risk
that the revegetation project will fail as the climate changes. Several approaches to
selecting germplasm for revegetation are shown in Figure 7 and are briefly explained
here: (but see18 and references therein for more detailed information http://journal.
frontiersin.org/article/10.3389/fevo.2015.00065/full).
• The ‘Climate-adjusted’ approach18 (Figure 7a) builds on previous research
that recommends including non-local provenance with local provenance
material to increase genetic diversity and adaptive potential19, 20. Germplasm
is sourced from locations in the direction of predicted climate change.
• A ‘Local provenance’ approach (Figure 7b) uses germplasm that is only
found within a certain geographic distance to the revegetation site.
• A ‘Composite’ provenance approach (Figure 7c) recommends mixing a small
proportion of genotypes from non-local high quality and genetically diverse
populations with local sources to reinstate historical gene flow and address
inbreeding and adaptive potential issues19.
• Where changes to the local environment are expected but uncertainty about
the scale and rate of this change is high, the ‘Admixture’ approach may be
appropriate (Figure 7d). This approach incorporates a wide variety of prov-
enances with no spatial relationship to the revegetation site and is predicted
to build evolutionary resilience20.
• A ‘Predictive’ provenance approach (Figure 7e) uses genotypes solely from a
source population that has been experimentally determined to be the best
match for the revegetation site21.
12 • Climate-ready revegetation. Version 2
Climate-adjusted
Local
Composite
Admixture
Predicted
Climate gradient, e.g. increasing aridity
a
b
d
e
c
Figure 7. Provenance strategies for revegetation. The star indicates the proposed revegetation site, and the yellow circles represent populations of the species. The size of the circles indicates the relative quantities of germplasm included from each population for use at the revegetation site. Climate change is represented as increasing aridity but other dimensions (e.g. increasing temperature) could be used18. Figure modified from18, 23.
The following points should be considered when selecting non-local provenances:
3.1 Where should non-local provenance material be sourced?
Use the process in Step 2 to select potential provenances. In the E. melliodora
example, to use the ‘Climate-adjusted’ provenance method, select points on the
scatterplot that represent a gradient towards and/or those that represent climatic
conditions that are projected for the region where the revegetation site is located.
These selections will then appear as red circles on the distribution/occurrences map.
Click on the red circle on the map to get location details. Figure 7 illustrates how
to determine which locations are chosen, depending on the provenance strategy.
Always strive to collect genetic material from large populations, with consideration
of other factors such as soil type.
Climate-ready revegetation. Version 2 • 13
14 • Climate-ready revegetation. Version 2
3.2 What should the proportion of non-local provenance to local provenance
be?
Figure 7 illustrates how to determine the proportions of different provenances to
satisfy the different strategies. The star represents the proposed revegetation site
and the green circles represent different populations of the target species. The size
of the circles indicates the relative quantities of genetic material included from each
population for use at the revegetation site18. For example, to adopt a Climate-adjusted
provenance strategy where the revegetation site is projected to become warmer
and drier, provenances should be selected along a gradient of warmer and drier
locations18. The proportion of local germplasm that is combined with proportions of
non-local germplasm along the gradient reflects the confidence in climate change
projections and the likely genetic compatibility of the different provenances18.
This Guide cannot be prescriptive about the best provenance strategy for indi-
vidual sites. However, the provenance strategies shown in Figure 7 (a), (c) and (d)
will increase genetic diversity and adaptive potential, compared to the sole use of
local provenance. Further information regarding the different provenance strate-
gies is available from18 http://journal.frontiersin.org/article/10.3389/fevo.2015.
00065/full.
3.3 Is there a risk of outbreeding depression when mixing local and non-local
provenances?
Historically, there has been a reluctance to incorporate non-local provenance material
into revegetation programs because of concerns that outbreeding depression (OD)
will occur if two or more populations are mixed. Whilst OD has been experimentally
shown to occur at some sites, (e.g. in old, naturally fragmented, landscapes such as
those in WA), a recent review of the evidence for this concern concluded that the risk
of OD is overstated and can be minimized22. In summary, OD is predicted to be low
for crossing populations where22:
a) The populations are the same species (the species is not currently under taxo-
nomic review and appears to be taxonomically stable);
b) The karyotype is the same (there are no differences in the number and
structure of chromosomes between breeding individuals (see http://www.
tropicos.org/Project/IPCN as a guide);
c) There has been gene flow between the populations during the last 500 years
(this is generally the case in Australia, where populations have not been frag-
mented for more than 500 years); and
d) There are no marked differences between the habitats of the different popu-
lations, e.g. wet areas vs dry areas, different soil types, different day lengths.
Information may not be available to assess all these points, especially with regard to
chromosomal differences. However, to balance the urgency of planning for climate-
readiness against waiting for perfect knowledge, Climate-adjusted, Composite and
Admixture provenance approaches alleviate some of the uncertainties (Figure 7).
3.4 What other factors should be considered?
This Guide cannot provide answers for site-specific questions because there are
many factors other than provenance and species choices that need to be considered
during revegetation projects. Which of these factors are relevant to a particular
project will depend on the site and the species involved. We urge users of this Guide
to read the papers and reports referenced here, relevant planning documents (e.g.
the SERA Standards for the Practice of Ecological Restoration in Australia) and to fully
explore the capabilities of the on-line tools and their associated caveats.
Climate-ready revegetation. Version 2 • 15
References1 Braganza, K., Murphy, B., Timbal, B., Hope, P.,
Dowdy, A.J., Hennessy, K., Bhend, J. and Kirono, D.
(2015). Understanding Recent Australian Climate.
In: Climate Change in Australia. Information for
Australia’s Natural Resource Management Regions:
Technical Report. CSIRO and Bureau of Meteorology,
Australia. http://www.climatechangeinaustralia.
gov.au/en/publications-library/technical-report/
2 Hancock, N. and Hughes, L. (2012). How far is it to
your local? A survey on local provenance use in New
South Wales. Ecological Management & Restoration
13, 259-266. doi:10.1111/j.1442-8903.2012.00660.x
3 Friedlingstein, P., Solomon, S., Plattner, G.K., Knutti,
R., Ciais, P. and Raupach, M.R. (2011). Long-term
climate implications of twenty-first century options
for carbon dioxide emission mitigation. Nature
Clim. Change 1, 457-461. doi: http://www.nature.
com/nclimate/journal/v1/n9/abs/nclimate1302.
html#supplementary-information
4 Lourenço, T.C., Rovisco, A., Groot, A., Nilsson, C.,
Füssel, H.-M., van Bree, L. and Street, R.B. (2014).
Adapting to an uncertain climate: lessons from
practice. (Springer International Publishing).
5 Fawcett, R.J.B., Trewin, B.C., Braganza, K., Smalley,
R.J. and Jovanovic, B. and Jones, D.A. (2012). On
the sensitivity of Australian temperature trends
and variability to analysis methods and observation
networks. CAWCR Technical Report No. 050, 54
pp. The Centre for Australian Weather and Climate
Research (CAWCR) – a partnership between the
Bureau of Meteorology (BoM) and CSIRO. (CAWCR,
Melbourne, Victoria).
6 IPCC (2014). Climate Change 2014: Impacts,
Adaptation, and Vulnerability. Part B: Regional
Aspects. Contribution of Working Group II to the Fifth
Assessment Report of the Intergovernmental Panel
on Climate Change. Cambridge University Press,
Cambridge, United Kingdom and New York, NY, USA.
7 CSIRO and Bureau of Meteorology (2015).
Climate Change in Australia. Information for
Australia’s Natural Resource Management
Regions: Technical Report. CSIRO and Bureau of
Meteorology, Australia. Available from: http://www.
climatechangeinaustralia.gov.au/en/publications-
library/technical-report/
8 Clarke, H., Lucas, C. and Smith, P. (2013). Changes
in Australian fire weather between 1973 and 2010.
International Journal of Climatology 33, 931-944.
doi:10.1002/joc.3480
9 Hughes, L. and Fenwick, J. (2015). The Burning
Issue: Climate change and the Australian bushfire
threat. (Climate Council of Australia). Available
at: https://www.climatecouncil.org.au/uploads/
e18fc6f305c206bdafdcd394c2e48d4a.pdf
10 Jolly, W.M., Cochrane, M.A., Freeborn, P.H., Holden,
Z.A., Brown, T.J., Williamson, G.J. and Bowman,
D.M.J.S. (2015). Climate-induced variations in global
wildfire danger from 1979 to 2013. Nat Commun 6,
doi:10.1038/ncomms8537
11 Reisinger, A., Kitching, R., Chiew, F., Hughes,
L., Newton, P., Schuster, S., Tait, A. and
Whetton, P. (2014). Chapter 25: Australasia. In:
Intergovernmental Panel on Climate Change Fifth
Assessment Report, Working Group II, Impacts,
Adaptation & Vulnerability. IPCC, Geneva.
12 Peters, G.P., Andrew, R.M., Boden, T., Canadell, J.G.,
Ciais, P., Le Quere, C., Marland, G., Raupach, M.R.
and Wilson, C. (2013). The challenge to keep global
warming below 2°C. Nature Clim. Change 3, 4-6.
doi: http://www.nature.com/nclimate/journal/
v3/n1/abs/nclimate1783.html#supplementary-
information
13 United Nations Environment Programme (UNEP)
(2015). The Emissions Gap Report 2015. A UNEP
Synthesis Report. Available at: http://uneplive.unep.
org/media/docs/theme/13/EGR_2015_301115_
lores.pdf
14 Harris, R.M.B., Grose, M.R., Lee, G., Bindoff, N.L.,
Porfirio, L.L. and Fox-Hughes, P. (2014). Climate
projections for ecologists. Wiley Interdisciplinary
Reviews: Climate Change 5, 621-637.
15 Booth, T.H., Williams, K.J. and Belbin, L. (2012).
Developing biodiverse plantings suitable for
changing climatic conditions 2: Using the Atlas
of Living Australia. Ecological Management &
Restoration 13, 274-281. doi:10.1111/emr.12000
16 Booth, T.H., Broadhurst, L.M., Pinkard, E., Prober, S.
M., Dillon, S.K., Bush, D., Pinyopusarerk, K., Doran,
J.C., Ivkovich, M. and Young, A.G. (2015). Native
forests and climate change: Lessons from eucalypts.
Forest Ecology and Management 347, 18-29.
doi:10.1016/j.foreco.2015.03.002
17 Harris, R.M.B., Carter, O., Gilfedder, L., Porfirio,
L.L., Lee, G. and Bindoff, N.L. (2015). Noah’s ark
conservation will not preserve threatened ecological
communities under climate change. PLoS ONE 10.
doi:10.1371/journal.pone.0124014
18 Prober, S.M., Byrne, M., McLean, E.H., Steane, D.A.,
Potts, B.M., Vaillancourt, R.E. and Stock, W.D. (2015).
Climate-adjusted provenancing: a strategy for
climate-resilient ecological restoration. Frontiers in
Ecology and Evolution 3. Available at: http://www.
frontiersin.org/Journal/FullText.aspx?s=1472&n
ame=interdisciplinary_climate_studies&ART_
DOI=10.3389/fevo.2015.00065. doi:10.3389/
fevo.2015.00065
19 Broadhurst, L.M., Lowe, A., Coates, D.J., Cunningham,
S.A., McDonald, M., Vesk, P.A. and Yates, C. (2008).
Seed supply for broadscale restoration: maximizing
evolutionary potential. Evolutionary Applications 1,
587-597.
20 Breed, M.F., Stead, M.G., Ottewell, K.M., Gardner,
M.G. and Lowe, A.J. (2013). Which provenance and
where? Seed sourcing strategies for revegetation in
a changing environment. Conservation Genetics 14,
1-10.
21 Crowe, K.A. and Parker, W.H. (2008). Using portfolio
theory to guide reforestation and restoration under
climate change scenarios. Climatic Change 89, 355-
370. doi:10.1007/s10584-007-9373-x
22 Frankham, R., Ballou, J.D., Eldridge, M.D.B., Lacy,
R.C., Ralls, K., Dudash, M.R. and Fenster, C.B. (2011).
Predicting the probability of outbreeding depression.
Conservation Biology 25, 465-475. doi:10.1111/
j.1523-1739.2011.01662.x
23 Byrne, M., Prober, S., McLean, E., Steane, D., Stock,
W., Potts, B. and Vaillancourt, R. (2013). Adaptation
to climate in widespread eucalypt species. National
Climate Change Adaptation Research Facility, Gold
Coast, 86 pp.
This Guide is also downloadable as a PDF and can be viewed electronically at:
http://anpc.asn.au/resources/climate_ready_revegetation
The information provided in this Guide is based on the best available science at
the time of publication. It is acknowledged that there are still many uncertainties
surrounding the preparation of climate-ready revegetation. It is acknowledged that
it is not understood whether species are currently occupying all suitable habitat
(available niche space vs realized or actual niche space), and tools such as Species
Distribution Modelling (see Step 2.6) are still being developed and improved. If and
when projections and further research and tools become available, users of this
Guide should update their strategies accordingly.
AuthorsNola Hancock Macquarie University, Rebecca Harris Antarctic Climate
& Ecosystems CRC, University of Tasmania, Linda Broadhurst CSIRO and
Lesley Hughes Macquarie University.
Please send any feedback or comments to [email protected]
Please cite as: Hancock, N., Harris, R., Broadhurst, L. and Hughes, L. 2018.
Climate-ready revegetation. A guide for natural resource managers.
Version 2. Macquarie University, Sydney. Accessible from: http://anpc.asn.
au/resources/climate_ready_revegetation
AcknowledgementsWe are grateful to Ku-ring-gai Municipal Council and the NSW Adaptation
Research Hub – Biodiversity Node, hosted by Macquarie University, for pro-
viding funding for this project and the Australian Network for Plant Conser-
vation (ANPC) for hosting the website. We thank Trevor Booth for the use of
his worked example and for reviewing Step 2 of the Guide, Suzanne Prober
et al.18 for the use of Figure 7, Huw Evans, Mary-Lou Lewis, Alistair Phillips,
Elisa Raulings, Jim Robinson, Jenny Scott and Bindi Vanzella for providing
thoughtful comments and improving the Guide, and to the staff at the ALA for
their assistance. We also thank Andy Burton, North Sydney Council Bushcare,
Hornsby Community Nursery and Nola Hancock for the use of their images.
Designed by: Fiona Richardson, Meredith, Victoria
Printed by: Print Media Group, Sydney, NSW
ISBN 978-0-9925006-0-3
February 2018