Embed Size (px)
Citation preview
8/13/2019 Climate Proofing: A Risk-based Approach to Adaptation
http://slidepdf.com/reader/full/climate-proofing-a-risk-based-approach-to-adaptation 1/219
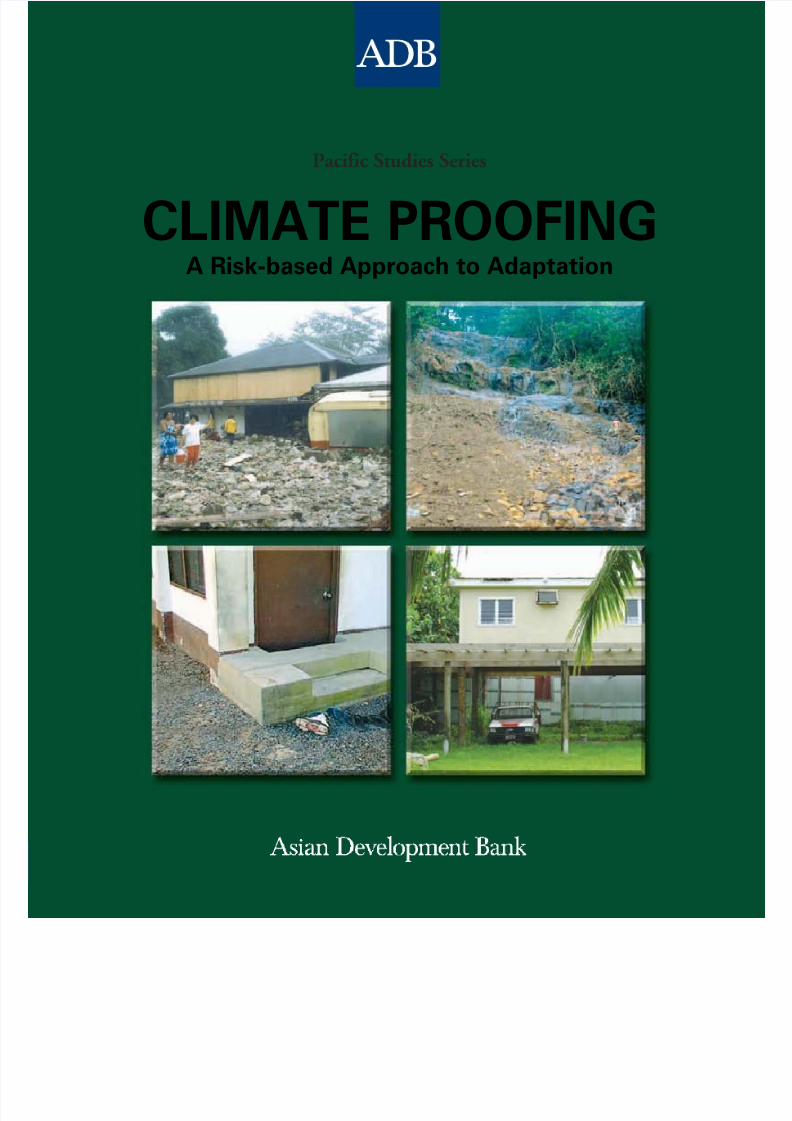
CLIMATE PROOFINGA Risk-based Approach to Adaptation
Pacific Studies Series

8/13/2019 Climate Proofing: A Risk-based Approach to Adaptation
http://slidepdf.com/reader/full/climate-proofing-a-risk-based-approach-to-adaptation 2/219
Climate ProofingA Risk-based Approach to Adaptation
Pacific Studies Series

8/13/2019 Climate Proofing: A Risk-based Approach to Adaptation
http://slidepdf.com/reader/full/climate-proofing-a-risk-based-approach-to-adaptation 3/219
Climate Proofing: A Risk-based Approach to Adaptationii
© 2005 Asian Development Bank
All rights reserved. Pub lished 2005.
Printed in the Philippines.
Library of Congress Cataloging-in-Publication Data Available.
Publication Stock No. 030905
Asian Development Bank Developing countries in the Pacific can adapt thei rcapacity for dealing with, and resilience to climate change and climatevariability.
The views expressed in this book are those of the authors and do not necessarily reflect the views and policies of the Asian Development Bank or its Board of Governors or the governments they represent.
The Asian Development Bank does not guarantee the accuracy of the data
included in this publication and accepts no responsibility for any consequenceof their use.
Use of the term “country” does not imply any judgment by the authors or the Asian Development Bank as to the legal or other status of any terri torial entity.

8/13/2019 Climate Proofing: A Risk-based Approach to Adaptation
http://slidepdf.com/reader/full/climate-proofing-a-risk-based-approach-to-adaptation 4/219
iiiContents
Table of Contents Abbreviations x
Currency Equivalents xiGlossary xii
Foreword xv
Acknowledgments xvii
Executive Summary xxiii
I. Background to the Study 1
II. Introduction to the Study 2
III. Sharing the Findings 4
IV. Why Adapt and What Is Involved? 5 A. Scientific Consensus on Global and Regional Climate Change, and
Implications for Pacific Island Countries 5
B. Adaptation 7
V. Climate-related Risks in the Case Study Countries 10
A. Background on the Case Study Countries 10
B. Characterizing Risk 12
VI. The Case Studies 18
A. Introduction 18B. Case Study Identification and Selection Procedures 19
C. Implementation of the Case Studies 22
D. Case Study One: Climate Proofing a Roadbuilding InfrastructureProject in Kosrae, Federated States of Micronesia 26
E. Case Study Two: Climate Proofing the Design of the Breakwaterfor the Newly Developed Western Basin, Avatiu Harbor, Rarotonga 32
F. Case Study Three: Climate Proofing Avatiu-Ruatonga, a community inlandfrom Avatiu Harbor Cook Islands 39
G. Case Study Four: Climate Proofing Sapwohn, a Coastal Community in Pohnpei, Federated States of Micronesia 48
H. Case Study Five: Climate Proofing the Infrastructure, Human Health,and Environment Components of the Federated States of MicronesiaNational Strategic Development Plan 55
I. Case Study Six: Climate Proofing the Cook Islands National Development Strategy 62

8/13/2019 Climate Proofing: A Risk-based Approach to Adaptation
http://slidepdf.com/reader/full/climate-proofing-a-risk-based-approach-to-adaptation 5/219
Climate Proofing: A Risk-based Approach to Adaptationiv
VII. Key Findings and Recommendations 75
A. Follow-Up to the Case Studies 76
B. Implications for ADB Project Processing and Operations 78
C. The Global Environment Facility as One Mechanism for Financing Adaptation 84
D. Lessons Learned and Demonstrated 87E. Barriers to Successful Application of the CCAIRR Framework and Methods 89
F. Recommendations 91
VIII. Elaboration of the Approach, Methods, and Tools 95
A. Introduction 95
B. Approach, Methods, and Tools for an Integrated, Risk-Based Approach to Adaptation 95
C. Mainstreaming Adaptation in National Development Planning and Implementation 110
IX. Summary and Conclusions 116
References 119
Apppendices
Appendix 1: Federated States of Micronesia—Climate Risk Profile 121
Appendix 2: The Cook Islands—Climate Risk Profile 132
Appendix 3: Guidelines for Policy and Decision Makers and Other Key Players—Federated States of Micronesia 145
Appendix 4: Guidelines for Policy and Decision Makers and Other Key Players—Cook Islands 161
Appendix 5: Mainstreaming the Economic Analysis of Adaptation to Climate Change 176 Within ADB
Appendix 6: Land Use Change Model 190
List of Tables
V.1. A Risk Register, Based on Hypothetical Examples 13
V.2. Return Period and Likelihood of Occurrence in 1 Year, for Given ExtremeEvents in Pohnpei and Kosrae, for the Present and Projected Future 14
V.3. Return Period and Likelihood of Occurrence in 1 Year, for Given ExtremeEvents in Rarotonga, for the Present and Projected Future 15
V.4. Probability Components for Daily Rainfall of at least 250 mm, Rarotonga 15
V.5. Open Water Wave Height (Average of Top 10%) Associated with Tropical Cyclones Recently Affecting Rarotonga 17
VI.1. Factors Considered When Selecting the Implementing Agencies 22

8/13/2019 Climate Proofing: A Risk-based Approach to Adaptation
http://slidepdf.com/reader/full/climate-proofing-a-risk-based-approach-to-adaptation 6/219
vContents
VI.2. Implications of Possible Changes in Future Climatic Risks for Optionsfor the Location and Design of the Road through the Yela 29
VI.3. Construction Costs for the As Yet Unbuilt 6.6-km Section of RS4 (2004 $) 30
VI.4. Total Construction, Maintenance, and Repair Costs of the As Yet Unbuilt Sectionof RS4 (2004 $) 30
VI.5. Construction Costs of 3.2-km Built Section of RS4 (2004 $) 31
VI.6. Total Construction, Maintenance, and Repair Costs of 3.2-kmBuilt Section of RS4 (2004 $) 31
VI.7. Relationship Between Wind Speed and Significant Wave Height forGiven Return Periods for the Avatiu Harbor Area 36
VI.8. Estimates of Return Periods for Given Wind Speeds 38
VI.9. Estimated Wave Run-up Elevation for Conditions Representative of Cyclone Sally for a Coastal Segment Adjacent to Avatiu Harbor, with Future Sea-level Rise Added(Current Return Period of Approximately 13 Years) 39
VI.10. Projected Costs of Flooding for Avatiu-Ruatonga, as a Consequence of All Heavy Rainfall Events Occurring over the Period Indicated 43
VI.11. Benefit Cost Analysis for Reduction of Flood Damage from Heavy Rainfall, Avatiu-Ruatonga, over Next 50 Years 44
VI.12. Cost and Consequent Change in Damage Costs for Selected Regulatory and Voluntary Measures, for New/Renovated Buildings Only, Over Next 50 Years 45
VI.13. Relationships Between Cyclone Parameters and Coastal Risk Parameters for aSite Representative of a Segment of the Avatiu Coastline 45
VI.14. Projected Costs of Sea Surge Flooding of a Selected Area of Avatiu-Ruatonga(NZ$ million) 47
VI.15. Cost and Consequent Change in Damage Costs for Selected Regulatory and Voluntary Measures, for New/Renovated Buildings Only, Over Next 50 Years 47
VI.16. Cost and Consequent Change in Damage Costs for Hypothetical Scenario, A 5 m-High Sea Wall at the Avatiu Shoreline 48
VI.17. Projected Costs of Sapwohn Flooding as a Consequence of Heavy Rainfall($ million) 51
VI.18. Cost and Consequent Change in Damage Costs for Selected Regulatory and Voluntary Measures over Next 50 Years 52
VI.19. Incremental Costs and Benefits of Selected Adaptation Measures ($ million) 52
VI.20. Projected Costs of Flooding of Sapwohn Village as a Result of High Sea Levels($ million) 53
VI.21. Cost and Consequent Reduction in Damage Costs for Selected Regulatory and Voluntary Measures, for New/Renovated Buildings Only, over the Next 50 Years 54
VI.22. Return Periods for Maximum Wind Speed, Pohnpei (Years) 59

8/13/2019 Climate Proofing: A Risk-based Approach to Adaptation
http://slidepdf.com/reader/full/climate-proofing-a-risk-based-approach-to-adaptation 7/219
Climate Proofing: A Risk-based Approach to Adaptationvi
VI.23. Number of Dengue Cases in a Month if an Outbreak is Already Occurring, Basedon the Rainfall (mm) and Maximum Temperature (°C) in the Previous Month 65
VI.24. Total and Monthly Maximum Number of Cases of Dengue in Rarotonga (1998–2003) 66
VI.25. Number of ARI Cases in a Month, Based on Rainfall (mm) and ExtremeTemperature (°C) in the Previous Month 67
VI.26. Strategic Priority 1: Good Governance and Law and Order 69
VI.27. Strategic Priority 2: Macroeconomic Stability and Economic Development 69
VI.28. Strategic Priority 3: Improved Quality of Education 70
VI.29. Strategic Priority 4: Improved Quality of Health Services 70
VI.30. Strategic Priority 5: Improve the Standard of Infrastructure and the Provision of Utilities, including Transport Services 71
VI.31. Strategic Priority 6: Increase Agricultural Productivity for Self-Sufficiency and Food Security 71
VI.32. Strategic Priority 7: Improve Development and Management of Marine Resources 72
VI.33. Strategic Priority 8: Tourism Development 72
VI.34. Strategic Priority 9: Protection, Conservation, and Sustainable Managementof the Environment and Natural Ecosystems 73
VII.1. Tools and Timing for Mainstreaming Adaptation in ADB Procedures 83
VIII.1. Comparison of Hypothetical Present Values of Expected Damages UnderClimate Change 106
VIII.2. The Multiple Dimensions of the Enabling Environment 112
List of Figures
II.1 Case Studies Demonstrate the Importance of Mainstreaming Adaptation 3
IV.1 Adaptation and Mitigation 7
IV.2. The CCAIRR Framework and Methodology for a Risk-based Approach toMainstreaming Adaptation 9
V.1. Observed and Projected Likelihoods of a Daily Rainfall of at Least 250 mmOccurring in a Year, Rarotonga 15
V.2. Number of Months in each Year (1929–2003) when the Precipitation forRarotonga was Below the 10th Percentile 16
V.3. Number of Tropical Cyclones per Year Passing Close to, and Affecting, Rarotonga 16
V.4. Average Annual Number of Tropical Cyclones for La Niña Years (Top Figure)and El Niño Years (Bottom Figure) 17
VI.1. Sectors and Support Systems Considered to be at Risk and the Three CaseStudies Chosen to Demonstrate the Risk-based Approach toMainstreaming Adaptation (FSM) 20
8/13/2019 Climate Proofing: A Risk-based Approach to Adaptation
http://slidepdf.com/reader/full/climate-proofing-a-risk-based-approach-to-adaptation 8/219
viiContents
VI.2. The Sectors and Support Systems Considered to be at Risk, and theThree Case Studies Chosen to Demonstrate the Risk-based Approachto Mainstreaming Adaptation (Cook Islands) 21
VI.3. Feature story in the Cook Islands News , 5 February 2004 24
VI.4. Heights above Mean Sea Level for the Avatiu-Ruatonga Study Area 26
VI.5. Kosrae’s Circumferential Road 27
VI.6. Hourly Rainfall (mm) with a Return Period of 25 Years, Kosrae 29
VI.7. Accumulated Costs (Construction, Repairs, and Maintenance) for the As Yet UnbuiltSection of RS4 30
VI.8. Location of, and Plan for, the Western Basin of Avatiu Harbor 33
VI.9. Planned Risk Characterization and Management Procedures for the Western Basin Breakwater Study 34
VI.10. Linkages Among Climate Change, Tropical Cyclones, Coastal Impacts,and Adaptation Measures 35
VI.11. Results of Significant Wave Height Calculations, Using SimClim 37
VI.12. Projected Values of Sea-level Rise for Rarotonga, Relative to theCurrent Mean Sea Level 39
VI.13. Location of the Avatiu-Ruatonga Study Area, showing (Lower Figure)Land Elevations and Locations of the 221 Structures 40
VI.14. Likelihood of Two-hour Rainfall Totals of at Least 140 mm and 200 mmfor the Present and for 2050, for Given Time Horizons 41
VI.15. Calculated (Top) and Observed Areal Extent (Bottom) of Flooding Associated with the Rainstorm of January 8, 2001 42
VI.16. Flooded Areas and Depths for a 2-Hour Rain Storm with a Return Period of 12 years, for the Present and for 2050 42
VI.17. The Study Area, showing Locations of Key Hydraulic Controls on the Flooding 43
VI.18. Depth and Spatial Extent of Flooding from a Sea Surge with a Return Period of 25 years, for Current Conditions and in 2050 46
VI.19. Location of Sokehs Island, Pohnpei 48
VI.20. The Study Area in Sapwohn Village, Showing the Location of all Structures 49
VI.21. Likelihood of an Hourly Rainfall of 200 mm occurring in Pohnpei within theIndicated Time Horizon (Years) 50
VI.22. Flooded Areas and Depths for a 1-Hour Rainstorm with a Return Period of 25 years,for Present Day (Left) and 2050 (Right) 51
VI.23. Spatial Extent of Flooding (Shown in Red) from High Sea Level with a RecurrenceInterval of 25 Years 53
VI.24. Monthly Admissions to Pohnpei Hospital for Influenza and Gastroenteritis 56
VI.25. Antecedent Rainfall Conditions for the Months with High (Upper) and Low (Lower)Numbers of Gastroenteritis Admissions to Pohnpei Hospital 57

8/13/2019 Climate Proofing: A Risk-based Approach to Adaptation
http://slidepdf.com/reader/full/climate-proofing-a-risk-based-approach-to-adaptation 9/219
Climate Proofing: A Risk-based Approach to Adaptationviii
VI.26. Number of Occurrences in 50 Years of Periods of Low Rainfall Ending in aHeavy Rainfall Event; Observed and Projected Rainfall Data for Pohnpei 58
VI.27. Monthly Admissions to Pohnpei Hospital for Influenza and Observed and NormalMean Daily Temperature Ranges for Pohnpei 58
VI.28. Number of Months in Each Year or Decade for which Precipitation in Pohnpei was
Below the Fifth Percentile 58 VI.29. Number of Months per Decade for which Precipitation in Pohnpei is Projected to
be Below the Fifth Percentile 59
VI.30. Annual Maximum Wind Gust Recorded in Pohnpei 1974–2003 59
VI.31. Likelihood of a Maximum Wind Gust of 28 m/sec occurring within the IndicatedTime Horizon in Pohnpei (years) 60
VI.32. Monthly Totals of Notifiable Disease Cases for Rarotonga 64
VI.33. Number of Cases of Dengue and the Monthly Total Rainfall, Observed MeanMaximum Temperature and Normal Mean Maximum Temperature for Rarotonga 64
VI.34. Number of Cases of ARI, Monthly Total Rainfall, Observed Mean MinimumTemperature and Temperature Range, and Normal Mean MaximumTemperature and Temperature Range for Rarotonga 66
VII.1. Linkages Between Sustainable Development, Climate Change, and the Policies inthese Areas 80
VII.2. Nexus of ADB and Country-level Adaptation Mainstreaming Activities 82
VIII.1. Structure and Content of the Chapter 96
VIII.2. Generic Steps and Activities for Characterizing and Managing Risk 98
VIII.3. Procedures Used in the Characterization and Management of Climate-related Risks 99
VIII.4. Generating Future Sea-level Scenarios: Combining Global, Regional, and LocalInformation on Sea-Level Changes 102
VIII.5. The Approach used in Assessing Economic and Other Losses, Costs, and Benefits 104
VIII.6. Hypothetical Stage-Damage Curves 105
VIII.7. Implementation of SimClim for Assessing Flood Risks and Adaptation and theirChanges due to Climate Change 108
VIII.8. The Extreme Event Analyzer in SimClim 110

8/13/2019 Climate Proofing: A Risk-based Approach to Adaptation
http://slidepdf.com/reader/full/climate-proofing-a-risk-based-approach-to-adaptation 10/219
ixContents
List of Maps
V.1. The Cook Islands 11
V.2. The Federated States of Micronesia 12
List of BoxesIV.1. Key Points for Policy and Decision Makers 5
V.1. Key Points for Policy and Decision Makers 10
VI.1. Key Points for Policy and Decision Makers 18
VI.2. Criteria for Selection of Case Studies 19
VI.3. Example of Program for Awareness-Raising and Action-Promotion Workshop 23
VI.4. Questions used to Focus Discussions on the Climate Proofing Dimensions of the Cook Islands National Development Strategy 68
VII.1. Key Points for Policy and Decision Makers 75
VII.2. Operational Guidelines for the Strategic Priority “Piloting anOperational Approach to Adaptation” 86
VII.3. Key Lessons Learned and Demonstrated 88
VIII.1. Key Points for Policy and Decision Makers 95

8/13/2019 Climate Proofing: A Risk-based Approach to Adaptation
http://slidepdf.com/reader/full/climate-proofing-a-risk-based-approach-to-adaptation 11/219
Climate Proofing: A Risk-based Approach to Adaptationx
Abbreviations
ADB Asian Development Bank
ARA adaptation rapid assessment (process)
ARI acute respiratory infection
CCAIRR Climate Change Adaptation through Integrated Risk Reduction
CCC Canadian Climate Centre
CEA country environment assessment
CLIMAP Climate Change Adaptation Program for the Pacific
COP Conference of the Parties
CRP climate risk profile
CSIRO Commonwealth Scientific and Industrial Research Organization
CSP Country Strategy and Program
CSPU Country Strategy and Program Update
DEM digital elevation model
EIA environmental impact assessment
EIRR economic internal rate of return
ENSO El Niño Southern Oscillation (see Glossary)
EOCC economic opportunity cost of capital
FSM Federated States of MicronesiaGCM global climate model
GEF Global Environment Facility
GIS geographical information system
GPS Global Positioning Satellite
IDP Infrastructure Development Plan (FSM)
IPCC Intergovernmental Panel on Climate Change
JBIC Japan Bank for International Cooperation
NAPA national adaptation program of actionNGMACC National Guidelines for Mainstreaming Adaptation to Climate Change
NDS National Development Strategy (Cook Islands)
NGO nongovernment organization
NIES National Institute for Environmental Science ( Japan)

8/13/2019 Climate Proofing: A Risk-based Approach to Adaptation
http://slidepdf.com/reader/full/climate-proofing-a-risk-based-approach-to-adaptation 12/219
xiAbbreviations
NPV net present value
O&M operation and maintenance
PAA project adaptation assessment
PAB project adaptation brief
PDMC Pacific developing member country (of ADB)
PPTA project preparatory technical assistance
PV present value
REACH Renewable Energy, Energy Efficiency, and Climate Change
SDP Sustainable Development Plan
SPCZ South Pacific Convergence Zone
SPM Strategic Planning Matrix (FSM)
UNFCCC United Nations Framework Convention on Climate Change
Currency Equivalents
The local currency (NZ$) is used when reporting results for the Cook Islands case studies:
NZ$1.00 = US$ 0.6901
(as of 20 October 2004).
Otherwise, in this report ‘$’ refers to U.S. dollars

8/13/2019 Climate Proofing: A Risk-based Approach to Adaptation
http://slidepdf.com/reader/full/climate-proofing-a-risk-based-approach-to-adaptation 13/219
Climate Proofing: A Risk-based Approach to Adaptationxii
Glossary Adaptation (to climate variability and change) –
Policies, actions, and other initiatives designed tolimit the potential adverse impacts arising fromclimate variability and change (including extremeevents), and exploit any positive consequences.
Adaptive capacity – The potential for adjustments,processes (both natural and human), practices, orstructures to moderate or offset the potential fordamage, or take advantage of opportunities, createdby variations or changes in the climate.
Climate change – Trends or other systematic
changes in either the average state of the climate,or its variability (including extreme events), withthese changes persisting for an extended period,typically decades or longer (i.e., longer term).Climate change may be due to natural internalprocesses or external forcings, or to persistentanthropogenic changes in the composition of theatmosphere or in land use. Note that the UnitedNations Framework Convention on Climate Change(UNFCCC), in its Article 1, defines climate changeas: “a change of climate which is attributed directly or indirectly to human activity that alters thecomposition of the global atmosphere and which isin addition to natural climate variability observedover comparable time periods.” The UNFCCC thusmakes a distinction between “climate change”attributable to human activities altering theatmospheric composition and “climate variability”attributable to natural causes.
Climate extreme – A climatic event that is rare within its reference stat istical distribution for aparticular place. Typically “rare” is interpreted as anevent that is below the 10th percentile or above the90th percentile. An extreme climate event may bedue to natural internal processes within the climatesystem, or to variations in natural or anthropogenicexternal forcing.
Climate proofing – a shorthand term for identifying risks to a development project, or any other specified
natural or human asset, as a consequence of climate
variability and change, and ensuring that those risksare reduced to acceptable levels through long-lasting and environmentally sound, economically viable, andsocially acceptable changes implemented at one ormore of the following stages in the project cycle:planning, design, construction, operation, anddecommissioning.
Climate variability – Variations in climaticconditions (average, extreme events, etc.) on timeand space scales beyond that of individual weatherevents, but not persisting for extended periods of,
typically, decades or longer (i.e., shorter term). Variability may be due to natural internal processes within the climate system (internal variability), orto variations in natural or anthropogenic externalforcing (external variability).
Consequence – The end result or effect caused by some event or action. A detrimental consequenceis often referred to as an “impact.”
El Niño Southern Oscillation - The El Niño SouthernOscillation (ENSO) is a result of ocean-atmosphereinteractions internal to the tropical Pacific Oceanand the overlying atmosphere. Unusually warmtemperatures in the eastern equatorial Pacific(termed an “El Niño event”) reduce the normally large sea surface temperature difference between theeastern and western portions of the tropical Pacific. As a consequence, the northeast and southeast trade winds weaken and sea level falls in the west and risesin the east, as warmer waters move eastward along the equator. At the same time, the weakened trade winds reduce the upwelling of cold water in theeastern equatorial Pacific, thereby strengthening the warm temperature anomaly. A corresponding “LaNiña event” occurs when temperatures in the easternequatorial Pacific are unusually cool.
Enabling environment – The enabling environmentfor adaptation comprises the high-level and robustsystems and capabilities that foster the adaptation

8/13/2019 Climate Proofing: A Risk-based Approach to Adaptation
http://slidepdf.com/reader/full/climate-proofing-a-risk-based-approach-to-adaptation 14/219
xiiiGlossary
process, including innovation, revitalization of traditional knowledge and practices, application of human knowledge and skills, policies, financing,legislation and regulations, information, markets,and decision support tools. It encourages andsupports the climate proofing of development
projects and related initiatives, as well as being supportive of the wider sustainable developmentprocess.
Global climate model – A numerical representationof the global climate system based on the physical,chemical, and biological properties of itscomponents, their interactions and feedback processes, and accounting for all or some of itsknown properties. Global climate models areapplied, as a research tool, to study and simulatethe climate. They are also used for operationalpurposes, including monthly, seasonal, andinterannual climate predictions.
Greenhouse gases – Those gaseous constituents of the atmosphere, both natural and anthropogenic,that absorb and emit radiant heat energy at specific waveleng ths wi th in the spec tr um of in fraredradiation emitted by the Earth’s surface, theatmosphere, and clouds. This property causes thegreenhouse effect. Water vapor, carbon dioxide(CO 2), nitrous oxide (N 2O), methane (CH 4), andozone (0
3) are the principal greenhouse gases in the
Earth’s atmosphere. Several entirely human-madegreenhouse gases can also be found in theatmosphere, such as halocarbons and otherchlorine- and bromine-containing compounds.
Incremental cost (of adaptation) – The additionalcosts arising from reducing climate risks throughadaptation, when preparing for and implementing a policy, plan, or action.
Ka – A tropical tree (botanical name Terminalia
carolinensis ) the largest surviving stand of which canbe found on the island of Kosrae, FSM.
La Niña event – See “El Niño Southern Oscillation”.
Likelihood – The probability, or statistical chance,of a given event occurring within a specified periodof time.
Mainstreaming (of adaptation) – The effective andequitable integration of adaptation activities intothe preparation and implementation of policies,plans, and other instruments concerned witheconomic development, social progress, and/orenvironmental protection.
Mitigation (of climate change) – Policies, actions,and other initiatives that reduce the net emissionsof greenhouse gases (q.v.), such as CO 2, CH 4, N2O,that cause climate change through global warming.
Monte Carlo techniques – a method of generating amodel of change in which the likelihood of an eventis first determined and then a random number isused to determine whether the event actually occurs.
No regrets – Policies, plans, or actions that wouldgenerate net social benefits whether or not climatechange occurs. No regrets opportunities forgreenhouse gas emissions reduction are defined asthose options whose benefits, such as reducedenergy costs and reduced emissions of local/regional pollutants, equal or exceed their costs tosociety, excluding the benefits of avoided climatechange. No regrets potential is defined as the gapbetween the market potential and thesocioeconomic potential. The cost of an economicactivity forgone by the choice of another activity.
Projection – Any description of the future, and thepathway that leads to it.
Rational Method – a simple mathematicaltechnique used in water engineering for estimating peak flows of runoff from small catchments, in which Discharge (Q) = CiA, where C is the runoff coefficient, i is the rainfall intensity and A is thecatchment area.
Return period – The average length of time betweenthe occurrences of a specified event.
Risk – The combination of a hazardous eventoccurring, and the impact or consequence of thatevent.

8/13/2019 Climate Proofing: A Risk-based Approach to Adaptation
http://slidepdf.com/reader/full/climate-proofing-a-risk-based-approach-to-adaptation 15/219
Climate Proofing: A Risk-based Approach to Adaptationxiv
Scenario – A plausible and often simplified courseof anticipated events or a probable future condition,based on a coherent and internally consistent set of assumptions about key driving forces andrelationships, constructed for explicit use ininvestigating the potential consequences of changes
from current conditions.
Sea-level rise (fall) – An increase (decrease) in themean level of the ocean, persisting for an extendedperiod, typically decades or longer. Eustatic sea-level rise is a change in global average sea levelbrought about by an alteration to the volume of the world ocean. Relative sea-level rise occurs wherethere is a net increase in the level of the oceanrelative to local land movements. Climate modelerslargely concentrate on estimating eustatic sea-levelchange; risk assessors focus on relative sea-levelchange.
Sea-level change – Trends and other systematicchanges in mean sea level, persisting for anextended period, typically decades or longer (i.e.,longer term).
Sea-level variability – variations in mean sea-level
conditions (including extreme events) that do notpersist for extended periods of, typically, decadesor longer (i.e., shorter term).
Vulnerability (to climate variability and change) –The extent to which a natural or human system issusceptible to sustaining damage resulting fromclimate variability and change, despite humanactions to moderate or offset such damage. Vul ne rabi li ty is a func ti on of the charac te r,magnitude, and rate of climate variation to which asystem is exposed, its sensitivity, and its adaptivecapacity.

8/13/2019 Climate Proofing: A Risk-based Approach to Adaptation
http://slidepdf.com/reader/full/climate-proofing-a-risk-based-approach-to-adaptation 16/219
xvForeword
Foreword
Since the early 1990s, the Asian Development Bank (ADB) has been at the forefrontin assisting countries in the Asia and Pacific region to address climate change,through various technical assistance programs and lending operations.
ADB recently attracted the increasing interest of various aid providers (such asDenmark, Canada, and the Netherlands) for grant funding of its program on renewableenergy, energy efficiency, and climate change, (REACH). Under the REACH program, ADB administers three grant funds: i) the Netherlands Cooperation Fund for Promotionof Renewable Energy, Energy Efficiency, and Greenhouse Gas Abatement ($4.5 million);ii) the Canadian Cooperation Fund for Climate Change ($3.2 million); and iii) the DanishCooperation Fund for Renewable Energy and Energy Efficiency in Rural Areas ($3.5million).
ADB’s Climate Change Adaptation Program for the Pacific (CLIMAP) assists Pacificdeveloping member countries to enhance their adaptive capacities and resilience toclimate change and climate variability, including extreme events. It also assists thesecountries to prevent and address the adverse effects of global climate change, particularly sea-level rise and changing climate variability in coastal and marine areas. This isachieved through risk assessment, adaptation planning, and policy development, by climate proofing infrastructure, and through community and other developmentinitiatives. This assistance involves preparation/design of adaptation measures at theproject level as well as capacity building, including institutional strengthening andhuman resources development for adaptation.
CLIMAP builds on ongoing and recently completed adaptation programs througha consultation and analysis process. It follows an integrated approach covering economic,financial, technical, and legal aspects as well as social, environmental, and networking dimensions. This requires the active and sustained engagement of various experts andstakeholders from the scientific community, decision makers, and public and privatesector operators, as well as nongovernment organizations and representatives of civilsociety.
ADB foresaw the need to prepare a series of case studies that demonstrate a risk-based approach to adaptation to climate change, including the mainstreaming of adaptation. These would link to, and support, initiatives being taken to prepare formainstreaming adaptation in ADB’s own policies and procedures.
Climate Proofing—A Risk-based Approach to Adaptation is the result of a regionaltechnical assistance (RETA) funded under REACH by the Canadian Cooperation Fundfor Climate Change—Greenhouse Gas Abatement, Carbon Sequestration and Adaptation.The technical assistance was administered by ADB.
The case studies were prepared by Maunsell (NZ) Ltd., working in association with the International Global Change Institute of the University of Waikato, New Zealand.The team was directed by Edy Brotoisworo, Senior Environment Specialist, Pacific
8/13/2019 Climate Proofing: A Risk-based Approach to Adaptation
http://slidepdf.com/reader/full/climate-proofing-a-risk-based-approach-to-adaptation 17/219
Climate Proofing: A Risk-based Approach to Adaptationxvi
Department; who succeeded Daniele Ponzi, then Senior Economist (Environment),Pacific Department. Design, coordination, and implementation of the RETA benefitedfrom the overall guidance of Peter N. King, former Director, Area B, Pacific Department,Robert Y. Siy Jr., Director, Area A, Pacific Department and Indu Bhushan, Director, Area B,Pacific Department, ADB.
The leader of the team of consultants who prepared the case studies was John E.Hay of the International Global Change Institute(IGCI), University of Waikato, Hamilton,New Zealand. The team included Richard Warrick, also of IGCI, Chri s Cheatham ,Consultant, Suva, Fiji Islands; Teresa Manarangi-Trott , Pacific Communications,Rarotonga, Cook Islands; Joseph Konno , Consultant, Chuuk, Federated States of Micronesia; Peter Hartley , Maunsell (NZ) Ltd., Auckland, New Zealand.
ADB also acknowledges, with thanks, the assistance and cooperation of theGovernments of the Federated States of Micronesia and the Cook Islands.
Philip ErquiagaDirector General
Pacific Department Asian Development Bank

8/13/2019 Climate Proofing: A Risk-based Approach to Adaptation
http://slidepdf.com/reader/full/climate-proofing-a-risk-based-approach-to-adaptation 18/219
xviiSummary for Policy and Decision Makers
Case study preparations were a team effort, hence many are deserving of
acknowledgement and thanks.
Project Team
John Hay Team Leader, International Global ChangeInstitute (IGCI), University of Waikato
Richard Warrick Team Member, IGCI, University of Waikato
Wei Ye SimClim Development, University of Waikato
Peter Kouwenhoven SimClim Development, University of Waikato
Liza Koshy Data Management and GIS, IGSI,University of Waikato
Claire Gibson Information, IGCI, University of Waikato
Yengpeng Yi Data Processing, IGCI, University of Waikato
Joseph Kono Team Member (FSM)
Teresa Manarangi-Trott Team Member (Cook Islands)
Mr. Kevin Oldham Project Director, Maunsell (NZ) Ltd.
Peter Hartley Project Manager, Maunsell (NZ) Ltd.
Nadine Wakim Flood Modelling, Maunsell (NZ) Ltd.
Federated States of Micronesia
Department of Finance and Administration
Nick Andon Secretary
Senny Philip International Finance Coordinator
Department of Transportation, Communication and Infrastructure
Akilino H. Susaia Secretary
Phillip Joseph Water Engineer (CLIMAP Project Officer)
Tajmilur Rahman Civil Engineer
Department of Economic Affairs
Ishmael L. Lebehn Acting Secretary
John Mooteb Deputy Secretary
Okean Ehmes Biodiversity Project Manager
Cindy Ehmes Sustainable Development Planner
Acknowledgments

8/13/2019 Climate Proofing: A Risk-based Approach to Adaptation
http://slidepdf.com/reader/full/climate-proofing-a-risk-based-approach-to-adaptation 19/219
Climate Proofing: A Risk-based Approach to Adaptationxviii
Eneriko Suldan Division of Statistics
Val A. Martin Marine Resources ConservationManagement Officer
Department of Justice
Marstella E. Jack Assistant Attorney General
Department of Foreign Affairs
Vince Sivas Foreign Service Officer
Department of Health, Education & Social Affairs
Moses Pretrick Environmental Health CoordinatorJane Gallen GEF POPs Project Coordinator
Weather Services
Ceasar Hadley Meteorologist-In-Charge Wilfred Nanpei Meteorologist
Pohnpei State
Elden Hellan Director, Environmental Protection Agency Henry Susaia Environmental Protection Agency
(CLIMAP Project Officer)Kondios Gornelius Chief, Division of Survey and Mapping,
Dept. of Land & Natural ResourcesBenley Lucios Division of Survey and Mapping, Dept. of
Land and Natural ResourcesJoyce Nanpei Field Supervisor, Division of Survey and Mapping,
Dept. of Land and Natural Resources Waliet E. Elisa Surveyor, Dept. of Land and Natural Resources Anderson Andon Surveyor, Dept. of Land and Natural ResourcesPeterson Anson Cartographic Aid, Dept. of Land and Natural ResourcesDonna Scheurin Consultant, Environmental Protection Agency Siocy D. Soaz Medical Record Specialist, Pohnpei HospitalDonald David Marine Development, Office of Economic Affairs William Kostka Conservation Society of PohnpeiBill Raynor The Nature Conservancy Francis Hezel Micronesian Seminar Alex Nanpei Public Utilities CorporationKenneth Gilmete Public Utilities CorporationStevick Edwin Public Utilities CorporationHerson Anson Sapwohn VillageRainer Jimmy Sapwohn Village

8/13/2019 Climate Proofing: A Risk-based Approach to Adaptation
http://slidepdf.com/reader/full/climate-proofing-a-risk-based-approach-to-adaptation 20/219
xixSummary for Policy and Decision Makers
Chuuk State
Augustine Mathias Member, EPA Board and Vice Principal Dept.of Education
Mercy D. Sos Environmental Specialist, EnvironmentalProtection Agency
Kosrae State
Simpson Abraham Director, Development Review Commission(CLIMAP Project Officer)
Bruce Howell Engineer, Public Works Abraham Bahillo Engineer, Department of Public WorksLikiak Wesley Division of Planning and StatisticsBernie Construction and Engineering Carmelo Construction and Engineering Erick Waguk Development Review CommissionRoosten Abraham Department of Marine Resources
Yap State
Charles Chieng Chairman, EPA Board and Director Yap Civic Action Program
Francis Itimai Director, Office of Planning and BudgetJesse Gajdusek Deputy Director, Department of Resources
Development
Cook Islands
Ministry of Finance and Economic Management
Kevin Carr Financial Secretary Bredina Drollett Manager of Policy UnitPetero Okotai Planning Office
Ministry of Works
Ata Herman Secretary and Chair of Project LiaisonCommittee
Timoti Tangiruaine GIS Specialist (CLIMAP Project Officer)Ben Parakoti Waterworks EngineerMathilda Miria Tairea Waste Management Project
Adrian Teotahi Engineering Assistant Aporo Kirikava Engineering AssistantRene Nooapii Engineering Assistant

8/13/2019 Climate Proofing: A Risk-based Approach to Adaptation
http://slidepdf.com/reader/full/climate-proofing-a-risk-based-approach-to-adaptation 21/219
Climate Proofing: A Risk-based Approach to Adaptationxx
Office of the Prime Minister
Tuaere TangimetuaHelen Wong
Environment Service
Vaitoti Tupa Secretary Tania Temata International AdvisorPasha Carruthers Climate Change OfficerBobby Bishop Aitutaki Project Officer
Ministry of Agriculture
Poona Samuel Director of Quarantine
Ministry of Health
Ngapoko Short Director of Public Health
Tuaine Teokotai Chief Health InspectorTearoa Iorangi Health Officer
Ministry of Marine Resources
Jo Anderson Marine Scientist
Ministry of Education
Jane Taurarii Social Science Advisor
Meteorological Service
Arona Ngari DirectorNga Rauraa Chief Meteorological Officer
Disaster Management Office
Mac Mokoroa Disaster Management Officer
Cook Islands Investment Corporation
Tarita Hutchinson Chief Executive Officer
Ports Authority
Andrew McBirney Chief Executive Officer
University of the South Pacific
Rod Dixon Centre Director

8/13/2019 Climate Proofing: A Risk-based Approach to Adaptation
http://slidepdf.com/reader/full/climate-proofing-a-risk-based-approach-to-adaptation 22/219
xxiSummary for Policy and Decision Makers
Private Sector
Don Dorrell Coastal Environmental International Ltd.Sam Brown Miro Consultants
WWF
Mona Matepi Cook Islands Co-ordinatorPat Fitzgibbon Environmental Education Specialist
Taporoporo Ipukarea Society (TIS)
Imogen Ingram President Ana Tiraa
Avatiu/Ruatonga Community
Teariki RongoTony Utanga
Traditional Leaders
Dorice Reid Koutu Nui
International
Richard Creed Engineer, Idaho, USA Pete Mason NIWA, New ZealandChris Jones GDH, Australia
Sea level data for Rarotonga and Pohnpei were supplied by the National Tidal Facility, TheFlinders University of South Australia, Copyright reserved.

8/13/2019 Climate Proofing: A Risk-based Approach to Adaptation
http://slidepdf.com/reader/full/climate-proofing-a-risk-based-approach-to-adaptation 23/219
Climate Proofing: A Risk-based Approach to Adaptationxxii

8/13/2019 Climate Proofing: A Risk-based Approach to Adaptation
http://slidepdf.com/reader/full/climate-proofing-a-risk-based-approach-to-adaptation 24/219
xxiiiSummary for Policy and Decision Makers
Executive SummaryBackground
The Pacific islands region faces increasing environmental and socioeconomic pressuresexacerbated by global climate change and climatevariability. 1 Adaptation to climate change andvariability (CCV) is ultimately an issue of sustainabledevelopment. Even without climate change, Pacificisland countries are already severely affected by climate variability and extremes, and they remainextremely vulnerable to future changes in theregional climate that could increase the risks.Countries in the Pacific have clearly recognized theneed to (i) reduce their vulnerability to theseincreasing risks through adaptation, and (ii)strengthen their human and institutional capacitiesto assess, plan, and respond to these challenges.
Six case studies designed to assist countries toadapt to current and future climate risks have beenprepared. The case studies were prepared througha regional technical assistance under the RenewableEnergy, Energy Efficiency, and Climate Change(REACH) programme of the Asian DevelopmentBank, and funded by the Canadian CooperationFund for Climate Change – Greenhouse Gas Abatement, Carbon Sequestration and Adaptation.The technical assistance was administered by the Asian Development Bank as the executing agency,and implemented in partnership with theGovernments of the Federated States of Micronesiaand of the Cook Islands (implementing agencies),Maunsell (NZ) Ltd (environmental and engineering consultancy) and the International Global ChangeInstitute, University of Waikato, New Zealand.
The ultimate aim of the case studies is to show why and demonstrate how reducing climate-related
risks is an integral part of sustainable development.The overall goal of a risk-based approach to climatechange adaptation is to manage both the current
and future risks associated with the full spectrumof atmospheric and oceanic hazards. Through aconsultative process the following case studies wereselected: (i) the Federated States of Micronesia -“climate proofing” a coastal community in Pohnpei;a roading infrastructure project in Kosrae; and theinfrastructure, human health and environmentcomponents of the National Strategic DevelopmentPlan; (ii) the Cook Islands - “climate proofing” thedesign of the breakwater for the newly developed Western Basin, Rarotonga; a community inlandfrom Avatiu Harbour; and the National SustainableDevelopment Strategy.
As part of the case studies, assessments weremade of both the risks arising from current climatevariability and extremes and from the future,incremental changes in those risks as a result of longer-term changes in climate extremes andvariability. While the field studies and other activitiesto develop the six case studies were undertaken inPacific Island Countries, the innovativemethodologies and tools, as well as the findings, areapplicable to all Small Island Developing States, andeven to larger developing and developed countries.
Adaptation: Responding to ClimateChange
The case studies highlight that adaptation takesplace at three levels: i) project/community; ii) sectorregulation and compliance; and iii) policy andplanning level (short- and mid-term policy making and planning at sub-national level and nationalstrategic development planning). Importantly, thecase studies also demonstrate methods forprioritizing adaptation strategies and specific
adaptation interventions, in terms of both theircosts and benefits. A major goal, and challenge, wasto determine, in a rigorous and quantitative manner,the incremental costs of adaptation to climatechange.
For both the Cook Islands and the FederatedStates of Micronesia, climate risk profiles wereprepared. Extreme climate events that are relatively
1 Global climate change refers to a significant long-term change in the earth’sclimate system, whereas climate variability refers to short- to medium-termfluctuations in the climate system, and usually i ncludes extreme weather eventssuch as hurricanes, floods, droughts, and other related disasters caused byweather phenomena.
8/13/2019 Climate Proofing: A Risk-based Approach to Adaptation
http://slidepdf.com/reader/full/climate-proofing-a-risk-based-approach-to-adaptation 25/219
Climate Proofing: A Risk-based Approach to Adaptationxxiv
rare at present (likelihood in one year less than 0.05)are projected to become relatively common as aresult of global warming (in many cases likelihoodsare projected to increase to over 0.20 by 2050).Climate-related risks facing both the case study infrastructure projects and communities are already
substantial, but in all cases are projected to increasedramatically as a result of increases in climateextremes and variability. For infrastructure projectsit is possible to avoid most of the damage costsattributable to climate change, and to do this in acost effective manner, if “climate proofing” isundertaken at the design stage of the project. Costeffectiveness can be further enhanced if environmental impact assessment proceduresrequire that all development be “climate proofed”.“Climate proofing” communities can also be costeffective if planning and regulatory measures takeinto account both current and future climate-related risks.
“Climate proofing” national strategicdevelopment plans enhances the enabling environment for adaptation and also establishes therequirement for “climate proofing” sector, sub-national (e.g., state, island and community)development plans as well as “climate proofing”individual development projects. In addition, ithelps to ensure that actions to reduce climate-related risks are an integral part of, and harmonized with, sustainable development ini tiatives. Such“climate proofing” at the national policy level is oneof the major ways to mainstream adaptation. In thecase studies mainstreaming was facilitated furtherby preparing Adaptation Mainstreaming Guidelinesfor each of the two countries.
Lesson Learned and Demonstrated
Through preparation of the case studies, many key lessons were learned and demonstrated.Climate change will manifest largely as changes inthe frequency and consequences of extreme eventsand inter-annual and similar variations, rather thanas long-term trends in average conditions. Whilethere are uncertainties in projections of greenhousegas emissions, and of the response of the globalclimate as estimated by models, confidence in
estimates of future changes in climate-related risksis increasing. This is due to the consistency inmodel-based projections of changes in thelikelihood of extreme events and climate variability,as well as increased consistency between theseprojections and the observed changes in these
likelihoods over recent decades. At a practical level adaptation should focus on
reducing both present and future risks related toclimate variability and extremes. This is despite thefact that under present international climate changeagreements funding is often limited to reducing future risks. In many instances current levels of climate risk are already high, due in large part toincreases in risk over the past few decades.Moreover, adapting to current climate extremes andvariability prevents precious financial and otherresources being squandered on disaster recovery and rehabilitation and is an essential step to being able to withstand the pending changes in climate.
A risk-based approach to adaptation is not only desirable but also practicable. It combines both thelikelihood and consequence components of climate-related impacts and can assess risks for bothcurrent and anticipated conditions, with the optionof examining either specific events or an integrationof those events over time. Furthermore, risk assessment and management are common to many sectors – e.g., health, financial, transport,agriculture, energy, and water resources. Theexisting familiarity of planners and decision makers with risk management therefore helps facilitate themainstreaming of risk-based adaptation. Risk-basedmethods also facilitate an objective and morequantitative approach, including cost benefitanalyses that result in evaluation of the incrementalcosts and benefits of adaptation and assist inprioritizing adaptation options. Many players areusually involved in the adaptation process. The risk-based approach provides a framework thatfacilitates coordination and cooperation amongst
the various players, including the sharing of information that might otherwise be retained by information “gate keepers”. It also links tosustainable development by identifying those risksto future generations that present generations wouldfind unacceptable.

8/13/2019 Climate Proofing: A Risk-based Approach to Adaptation
http://slidepdf.com/reader/full/climate-proofing-a-risk-based-approach-to-adaptation 26/219
xxvSummary for Policy and Decision Makers
Most barriers to the successful application of arisk-based approach to adaptation relate to theexistence of, and access to, information. Whileremoving such barriers may be difficult, theexperience gained in preparing the current casestudies provides some grounds for optimism.
Before generalized findings and lessons can bedrawn from case studies of a risk-based approachto adaptation, many more examples will need to bedeveloped. It is desirable to have internationally consistent assessment methodologies. Internationalbodies, such as the Intergovernmental Panel onClimate Change, play major roles in establishing best practices. They would need to formally endorseand encourage a risk-based approach to adaptationbefore there will be widespread uptake. Currently,best practice favors the more traditionalassessments of vulnerability, and of adaptationoptions. These have many limitations compared toa risk-based approach, including no formalassessment of the likelihood of future extremeevents or variations in climate or of baselineconditions; a focus on individual events (e.g., anextreme rainstorm or a cyclone) or on a future date,rather than on an aggregation of the anticipatedclimatic conditions over a specified time period intothe future; inability to differentiate between thecosts of current climate extremes and variability andthe future costs of those events plus any systematictrend (i.e., unable to evaluate the incremental costsof climate change); difficulty of incorporating economic, social and wider environmentalscenarios into the assessment procedures; nofunctional link between the vulnerability andadaptation assessments; and no formal proceduresfor prioritizing adaptation options on the basis of cost and other measures of efficiency andeffectiveness.
Until a risk-based approach to adaptation isformally endorsed and encouraged there will alsobe a lack of documentation and training
opportunities. While a risk-based approach requiresno greater skills and experience than are called on when using traditional assessment methods, thereis a need to build a cadre of in-country expertise.So long as parallel frameworks and methodologiesare being advocated, there will be confusion, andarguments for maintaining the status quo. Addi tional barriers include the need for formal
specification of risk-based targets that define futurelevels of acceptable risk – this requires consultation with, and consensus amongst, key stakeholders,specification of relationships between magnitudeand consequence of risk events of relevance, “rules”that specify future social, economic and wider
environmental changes; and appropriate discountrates to be applied to future costs and benefits.
For the current case studies, all these barriers were overcome. Future efforts to develop additionalcase studies, as well as to support the practicalapplication of adaptation measures, can build onboth the methodologies and experience gained inpreparing the current case studies. Thus the barriersare unlikely to be as imposing as for the initial work.
Implications for Governments and their
Development PartnersGovernments and other stakeholders are urged
to note and act on the finding that the likelihoodsof adverse weather and climate conditions arealready high and are projected to increase in thefuture. Similarly, the consequences of these weatherand climate events are also already very high, and will likely increase markedly as a result of climatechange. Most climate-related risks can be reducedin a cost effective manner. Care should be exercisedto ensure that future development does notexacerbate climate-related risks. Experience in boththe Cook Islands and the Federated States of Micronesia highlights the importance of theenabling environment for successful adaptation,across all its many dimensions.
Governments and their development assistancepartners should ensure that all proposed, new andupgraded development projects are “climateproofed” at the design stage. This should be part of good professional practice, with national and stateclimate risk profiles being used as the basis for“climate proofing” infrastructure, community andother development projects. Compliance with thisrequirement should be assessed as part of enhancedenvironmental impact assessment procedures.Governments should also undertake cost benefitanalyses of all major development projects,including determining the incremental costs andbenefits. If for a developing country the incremental

8/13/2019 Climate Proofing: A Risk-based Approach to Adaptation
http://slidepdf.com/reader/full/climate-proofing-a-risk-based-approach-to-adaptation 27/219
Climate Proofing: A Risk-based Approach to Adaptationxxvi
costs are large, the Government should requestdeveloped country donors and other relevantagencies to fund the incremental costs.Governments should also ensure that all regulations(e.g., building code, public health regulations) are“climate proofed” as this will facilitate enforcement
of policies and plans that should, themselves, be“climate proofed”. These actions can be assisted by preparing and implementing National Guidelinesfor Mainstreaming Adaptation to Climate Change.
Climate change poses a threat to poverty reduction, water and energy supplies, wastemanagement, wastewater treatment, food security,human health, natural resources and protectionagainst natural hazards. Development also affectsthe rate and nature of climate change. Theselinkages between climate change and developmentare being increasingly recognized. The AsianDevelopment Bank and other development partnersneed to modify their policies and procedures in waysthat ensure that the design and funding implicationsassociated with “climate proofing” infrastructure,community and other development projects areaddressed early in the project cycle. Such initiativesmean that “climate proofing” will become anintegral part of best practice, rather than a later addon. The Asian Development Bank and otherdevelopment partners also need to establish anddemonstrate such a standard of good practice, withthe hope that others will follow. There is arequirement for further development of methods toidentify, early in the project cycle, the incrementalcosts of this “climate proofing”. For developing countries, these costs should be met from sources
that do not add to their existing or future debtburdens. The Global Environment Facility (GEF) isone such source of funding for adaptation indeveloping countries.
Key ConclusionsThe six case studies give rise to several
important conclusions. It is possible to enhance thesustainability (e.g., lifetime) of projects at risk toclimate change by “climate proofing” such projectsat the design stage. This will normally require aninvestment that is small relative to the maintenanceand repair costs that would otherwise be incurredover the lifetime of the project. Retroactive “climateproofing” is likely to be considerably more expensivethan that undertaken at the design stage of a project.
Many adaptation options qualify as “no regrets”adaptation initiatives, including being cost effective.Governments and their development partnersshould respond to these findings by ensuring thatall projects are “climate proofed” at the design stage,making this part of good professional practice.Furthermore, governments of developing countriesshould determine the incremental costs andbenefits of all major development projects andrequest that development partners fund at least theincremental costs. National and sub-national levelregulations should be “climate proofed” as this willallow enforcement of policies and plans that should,themselves, be “climate proofed”, in accordance wi th Nat iona l Gu id el ines fo r Mainst ream ing Adaptation to Climate Change.

8/13/2019 Climate Proofing: A Risk-based Approach to Adaptation
http://slidepdf.com/reader/full/climate-proofing-a-risk-based-approach-to-adaptation 28/219
1Climate Proofing: A Risk-based Approach to Adaptation
Background to the Study
Even without climate change, the smallerisland countries in the Pacific are already severely affected by climate variability andextremes. They are also extremely vulnerable
to future changes in global and regional climate.Consequently, since the early 1990s, the Pacific
Forum Leaders, through their annual ForumCommuniqué, have identified climate change as apriority issue. Their high level of concern was madevery apparent in October 2000, when they endorsedthe Pacific Islands Framework for Action on ClimateChange, Climate Variability, and Sea-Level Rise.They clearly recognized the need to reduce theirvulnerability to these increasing risks throughadaptation processes, while also strengthening thehuman and institutional capacities needed toassess, plan, and respond to these challenges. Whileclimate is acknowledged as a priority issue at thehighest levels of government, active support hasbeen lacking. Key ministries are concerned largely with matters of socioeconomic development, suchas finance and planning; their priorities are basedon the belief that climate is an environmental, not adevelopmental, issue. Mainstreaming adaptation isdesigned to overcome this inappropriate andcounterproductive separation.
Tangible political support for climate-relatedinitiatives is growing, however, mainly because of
increasing recognition that the impacts of achanging climate are already being experiencedthrough the increased occurrence of climateextremes such as unusually intense and/orunseasonal cyclones, flooding, droughts, and othernatural phenomena. One way to address thischallenge is to integrate disaster management into
a holistic risk reduction strategy that includesadaptation to climate change, all within the broadercontext of sustainable development policies andplanning. In addition, improving the ability to cope with current variability not only provides short-termbenefits through risk reduction and more sustain-able development, but also increases the adaptivecapacity with respect to the increased risks result-ing from future global climate change. This linking of short-term and long-term responses to climate-related risks is critical to achieving an integrated,participatory, and holistic approach to a compli-cated issue. This holistic framework and methodol-ogy is formalized as Climate Change Adaptationthrough Integrated Risk Reduction (CCAIRR).
The studies described in this book are designedto assist Pacific Developing Member Countries(PDMCs) of the Asian Development Bank (ADB) toadapt to climate variability and change, including extreme events. The CCAIRR framework and meth-odology have been used to demonstrate a risk-basedapproach to adaptation and the mainstreaming of adaptation. Two PDMCs, the Federated States of Micronesia and the Cook Islands, were selected todemonstrate how to mainstream this risk-basedapproach at three levels: national developmentplanning, sector programs, and project activities.
Climate Proofing—A Risk-based Approach to
Adaptation is the result of a regional technicalassistance (RETA 6064-REG) funded under ClimateChange, Renewable Energy, and Energy Efficiency (REACH) by the Canadian Cooperation Fund forClimate Change—Greenhouse Gas Abatement,Carbon Sequestration and Adaptation. Thetechnical assistance was administered by ADB.
CHAPTER I

8/13/2019 Climate Proofing: A Risk-based Approach to Adaptation
http://slidepdf.com/reader/full/climate-proofing-a-risk-based-approach-to-adaptation 29/219
Climate Proofing: A Risk-based Approach to Adaptation2
Just as today’s development decisions willinfluence tomorrow’s climate, so too willtomorrow’s climate influence the success of today’s development decisions. Most develop-
ment plans and projects have life expectancies thatrequire future climate conditions to be given dueconsideration. Long-term changes in atmosphericand oceanic conditions will impose both increasedand new risks on many natural and human systems,especially as a result of changes in climate variabil-ity and in the frequency and magnitude of extremeclimatic events.
The overall goal of a risk-based approach toclimate change adaptation is to manage both thecurrent and future risks associated with the fullspectrum of atmospheric and oceanic hazards. Thisis best undertaken in a holistic manner as an inte-gral part of sustainable development planning.National, local and sector development should bebased on harmonized hazard management strate-gies and climate change adaptation measures thatensure risks are reduced to acceptable levels. Thesemeasures, and the related strategies, will helpstrengthen all decision-making processes by requir-ing that specific programs and projects includeplans and measures to manage risks associated withfuture, as well as present, climate variability andextreme events. Such actions will result in the cli-
mate proofing of development projects and relatedinitiatives, in support of the wider process of sus-tainable development.
Climate proofing means identifying risks to adevelopment project, or any other specified natu-ral or human asset, as a consequence of both cur-rent and future climate variability and extremes, andensuring that those risks are reduced to acceptable
levels through long-lasting and environmentally sound, economically viable, and socially acceptablechanges implemented at one or more of the follow-ing stages in the project cycle: planning, design,construction, operation, and decommissioning.
This book presents case studies that demon-strate the climate proofing of infrastructure andcommunity development projects, and themainstreaming of climate change considerationsinto national strategic development plans. In thecontext of addressing climate and related risks, theterm “mainstreaming” is used to describe the inte-gration of climate change adaptation into ongoing and new development policies, plans, and strate-gies, including laws and regulations (e.g., environ-mental impact assessment requirements).Mainstreaming aims to enhance the effectiveness,efficiency, and longevity of initiatives directed atreducing climate-related risks, while at the sametime contributing to sustainable development andimproved quality of life.
The case studies thus include assessments of both the risks arising from current climate variability and extremes and from future, incremental changesin those risks that will result from longer-termchanges in climate. Significantly, the case studiesincorporate assessments of adaptation strategiesand specific measures that can be used to reduce
unacceptable risks, including analyses of theirbenefits and costs. One aim of these analyses is todetermine, in a rigorous and quantitative manner,the incremental costs of adaptation to climatechange. The likelihood is increasing that when thesecosts are clearly identified and quantified by adeveloping country, they will be met, at least in part,by the international community (e.g., bilateral and
Introduction to the StudyCHAPTER II

8/13/2019 Climate Proofing: A Risk-based Approach to Adaptation
http://slidepdf.com/reader/full/climate-proofing-a-risk-based-approach-to-adaptation 30/219
3Climate Proofing: A Risk-based Approach to Adaptation
multilateral aid providers and financial mechanismssuch as the Global Environment Facility (GEF).
The case studies were chosen to highlight therange of levels at which adaptation takes place, andthe linkages between them. The levels are i) project,ii) regulation and compliance, iii) short- and mid-
term policymaking and planning at subnationallevel, and iv) national strategic developmentplanning. Therefore, as shown in Figure II.1, the casestudies also demonstrate the importance of mainstreaming adaptation, including strengthening the enabling environment for adaptation to increasethe likelihood of successful adaptation at projectand community levels.
The field studies and other activities to developthe six case studies were undertaken in the Cook Islands and the Federated States of Micronesia(FSM), as part of RETA 6064-REG Climate Change
Adaptation Program for the Pacific (Second Phase,Country Level Activities), 2003. However, the inno-vative methodologies and tools, as well as the find-ings, are applicable to all Small Island Developing States and even to larger developing and developedcountries.
The case studies have been prepared through apartnership among the Government of Canada(funding provider), the Asian Development Bank (executing agency), the Governments of the FSMand the Cook Islands (implementing agencies),Maunsell (NZ) Ltd (environmental and engineering consultancy) and the International Global ChangeInstitute, University of Waikato, New Zealand. TheRETA was funded under REACH by the CanadianCooperation Fund for Climate Change—Green-house Gas Abatement, Carbon Sequestration, and Adaptation.
Figure II.1. Case Studies Demonstrate the Importance of Mainstreaming Adaptation
The case studies cover the continuum between project, subnational planning and regulation, and national strategicdevelopment planning, thereby showing the importance of the enabling environment to infrastructure, community,and other development projects. They also demonstrate how a risk-based approach, cost-benefit analysis, andadaptation mainstreaming contribute to the success of adaptation.
Source: CCAIRR findings.
Reflecting Climate Risks in NationalDevelopment Planning Demonstrated byClimate Proofing National StrategicDevelopment Plans:• Cook Islands• Federated States of Micronesia
Reflecting Climate Risks in InfrastructureDesign and Local Decision MakingDemonstrated by Climate Proofinginfrastrusture development projects:
• breakwater (CKI)• new road (FSM)
C l i m a t e -
P r o o f e d D e v
e l o p m e n t
E n a b l i n
g E n v i r o n
m e n t I m m e d i a t e , P
r o j e c t L e
v e l L o n g
T e r m , N a t
i o n a l L e v e l
Reflecting Climate Risks in Land UsePlanning, Regulations, and PermittingDemonstrated by Climate Proofingsuch instruments as the Building Code,EIA, Regulations and Procedures, andHealth Regulations:• Pohnpei State (FSM)• Rarotonga (CKI)
Demonstrating adaptation through– risk-based approach– cost-benefit analysis– mainstreaming
8/13/2019 Climate Proofing: A Risk-based Approach to Adaptation
http://slidepdf.com/reader/full/climate-proofing-a-risk-based-approach-to-adaptation 31/219
Climate Proofing: A Risk-based Approach to Adaptation4
Case studies that demonstrate a risk-basedapproach to adaptation, including itsmainstreaming in development planning,are of relevance beyond the Pacific Islands
region. They support messages that should be heardand heeded by political, private sector, andcommunity leaders in both large and small,developing and developed countries.
For this reason the case studies, and the meth-ods and tools used in their preparation, aredescribed in this book rather than in a more con-ventional technical report. The book is designed toappeal to readers with a diversity of backgrounds,current interests, and responsibilities. Both theoverarching Summary for Policy and Decision Mak-ers, and the key messages at the start of each chap-ter, reflect a conscious effort to ensure that the book influences the thinking and actions of those indi-viduals who play critical roles in development plan-ning, whether in government, the private sector, orcivil society.
As noted in the Introduction, the case studiescover the spectrum over which adaptation takesplace—from projects, through regulations and othermechanisms, short- and medium-term policy making and planning at the subnational level, tonational strategic development planning.
Rather than the case studies being grouped
nationally, the two project-level case studies are pre-sented first, followed by those related to climateproofing at the community level and then by thoseconcerned with national strategic developmentplanning. One of the many benefits of this sequenc-
ing is the ability to identify more readily common-alities and distinctions in both the approaches andthe findings. In many respects, these are dependenton the level of the case study. This approach has evengreater value because of the marked political,social, economic, and other differences between theFederated States of Micronesia (FSM) and the Cook Islands.
After introductory material on adaptation toclimate variability and change, and presentationof the climate risk profiles (CRP) for the areas in which the case studies were located, the reader istaken in Chapter VI directly to the case studiesthemselves. Again, this is a deliberate initiative,reflecting the assumption that the target reader-ship is likely to be more interested in the casestudies and what they reveal than in how it wasrevealed. For this reason, technical details of theinformation, methods, and tools used in prepar-ing the studies form part of the case study descrip-tions, but they are presented in ways that areintended to be informative while not distracting the reader from the important messages that thecase studies are intended to convey.
Chapter VII, on key findings and theirimplications, also caters directly to the interests of the target readership. The key findings derive fromthe case studies, both individually and collectively.
The reader who has a greater interest in themore technical aspects of the studies is catered forin Chapter VIII, which provides detailed informationon the approach, methods, and tools used to preparethe six case studies, as well as in the appendixes.
Sharing the FindingsCHAPTER III

8/13/2019 Climate Proofing: A Risk-based Approach to Adaptation
http://slidepdf.com/reader/full/climate-proofing-a-risk-based-approach-to-adaptation 32/219
5Climate Proofing: A Risk-based Approach to Adaptation
Why Adapt, and What is Involved?
A. Scientific Consensus on Global andRegional Climate Change, andImplications for Pacific IslandCountries
The Intergovernmental Panel on ClimateChange (IPCC) reported that globally averaged surface temperatures are projec-ted to increase by between 1.4 and 5.8
degrees Celsius (°C) during this century while sealevel is projected to rise by between 9 centimeters(cm) and 88 cm (IPCC 2001). The consensus of scientific opinion is that changes are more likely inthe middle of the ranges given above than at theextremes. Model-based projections suggest that,globally, temperatures will increase faster over landthan over the oceans, and at higher latitudes ratherthan lower latitudes.
The Southern Hemisphere will warm moreslowly than the globe as a whole, because watersinking near the Antarctic carries heat away fromthe surface to the ocean depths. This also increasesthe temperature difference between the tropics andthe Antarctic, causing an increase in westerly windspeeds. Global precipitation is projected to increaseoverall, with a larger percentage of the annual total
occurring as intense rainfall events.Despite the many uncertainties as to the natureand consequences of global warming, the climateof the Pacific islands region will continue to bedominated by the trade winds and convergencezones, and by the interannual variability associated with the El Niño Southern Oscillation (ENSO) (Hay et al. 2003). However, the projected rate of warming
BOX IV.1Key Points for Policy and Decision Makers
• Even now, but more so in the future, climate variability
and extreme events impose untenable social,environmental, and economic costs.
• This highlights the need to mainstream both disaster risk
management and adaptation to climate variability and
extreme events, in a mutually consistent and supportive
manner, by making them integral components of the
national risk management strategy and, in turn, of the
national development planning process.
• Adaptation is one of two major ways in which climate-
related risks can be managed. The other—mitigation—
is effective only in the longer term.
• Adaptation has many dimensions and is best viewed as
an ongoing and flexible process.
• Generally, the most appropriate forms of adaptation are
those that build on current actions to cope with present-
day climate variability and extreme events, and that also
contribute in a positive manner to sustainable economic
development, sound environmental management, social
progress, and wise resource use. The latter constitute “no
regrets” adaptation initiatives.
• Climate proofing does not always incur additional costs.
This is especially the case for no regrets adaptation
initiatives.
• Climate Change Adaptation through Integrated Risk
Reduction (CCAIRR) provides both a framework and a
methodology that result in development and
implementation of adaptation strategies and measures
that are coordinated, integrated (“bottom-up” as well as
“top-down”), and cost effective.
Source: CCAIRR findings.
CHAPTER IV

8/13/2019 Climate Proofing: A Risk-based Approach to Adaptation
http://slidepdf.com/reader/full/climate-proofing-a-risk-based-approach-to-adaptation 33/219
Climate Proofing: A Risk-based Approach to Adaptation6
for the Pacific Islands region (by between 0.6°C and3.5 oC in this century) is much larger than theobserved changes during the last century and is very likely to have been without precedent during at leastthe last 10,000 years. The projected increase shouldbe compared to the temperature difference, for the
region, of around 3–4 o C between the middle of thelast Ice Age and the present day. During the presentcentury, the climate may become more “El Niño-like”, with central and eastern equatorial Pacific seasurface temperatures projected to warm more thanthe western equatorial Pacific, and with acorresponding mean eastward shift of precipitation.During future ENSO events, anomalously wet areascould become even wetter, and unusually dry areaseven drier. While there is no evidence that tropicalcyclone numbers will change with global warming,a general increase in tropical cyclone intensity (lower central pressures, stronger winds, and higherpeak and mean precipitation intensities) appearslikely, as does an eastward extension in the area of formation.
While local sea levels change in response tomany factors, including local uplift or sinking of theEarth’s crust, and variations in air pressure and windvelocity, it is expected that even those areas in thePacific currently experiencing a relative fall in sealevel will, by the end of this century, experience arising relative sea level. However, interannualvariations in sea level associated with ENSO, andstorm surges associated with tropical cyclones, arelikely to be of greater significance in the coming decades.
To date much attention has focused on global warming causing gradual, long-term changes inaverage conditions. However, the most immediateand more significant risks are likely to arise fromchanges in the nature of extreme events (e.g.,flooding, tropical cyclones, storm surges) andclimate variability (e.g., drought, prevailing windsaccelerating coastal erosion). Present-day problems
resulting from increasing demand for water,increasing pollution of water, and current patternsof extreme events and climate variability will beexacerbated by climate change over the next few decades (Hay et al. 2003). Since most good quality land in the Pacific islands region is already underintense cultivation, increasing population numberscombined with climate change impacts will
threaten food security, as will the increasing relianceon imported food and the consequent vulnerability to short-term breaks in supply and world foodshortages due to climate events.
Significantly, the natural ecosystems and thepeople of the Pacific have many attributes that make
them inherently resilient, as they have developedmechanisms to cope with past changes in natural,social, and economic conditions. However, althoughterrestrial and freshwater ecosystems have beenable to evolve and adapt over time both to climateextremes and variability and to human pressures,the indications are that changes in climaticconditions coupled with unsustainable use willrender terrestrial and freshwater ecosystemsincreasingly vulnerable in the longer term.
Similarly, many of the likely impacts of climatechange on coastal zones and marine ecosystems arealready familiar to island populations, and somehave experience in coping with them. However, inmost countries and for most coastal and marineareas, coping with climate extremes and variability will be even more demanding over the next few decades.
The human health risks resulting from climatevariability and change will frequently arise throughinitial impacts on ecosystems, infrastructure, theeconomy, and social services. The increasing “urbanness” and centralization of Pacific islandpopulations is increasing the risks arising fromclimate variability and change, while repairs andrehabilitation for rural populations after an extremeevent may well receive decreasing priority. Thepossibility of more extreme events, such as tropicalcyclones and storm surges, coupled with currently projected rates of sea-level rise and flooding, placescritical infrastructure—health care and socialservices, airports, port facilities, roads, vital utilitiessuch as power and water, coastal protectionstructures, and tourism facilities—at increased risk.
In summary, many countries in the Pacific
islands region are already experiencing disruptivechanges consistent with the anticipatedconsequences of global climate change, including increased frequency and severity of coastal erosion,floods, droughts, storm surges, groundwaterdegradation, salinization, coral bleaching, more widespread and frequent occurrences of vector-borne diseases, and periods of exceptionally high
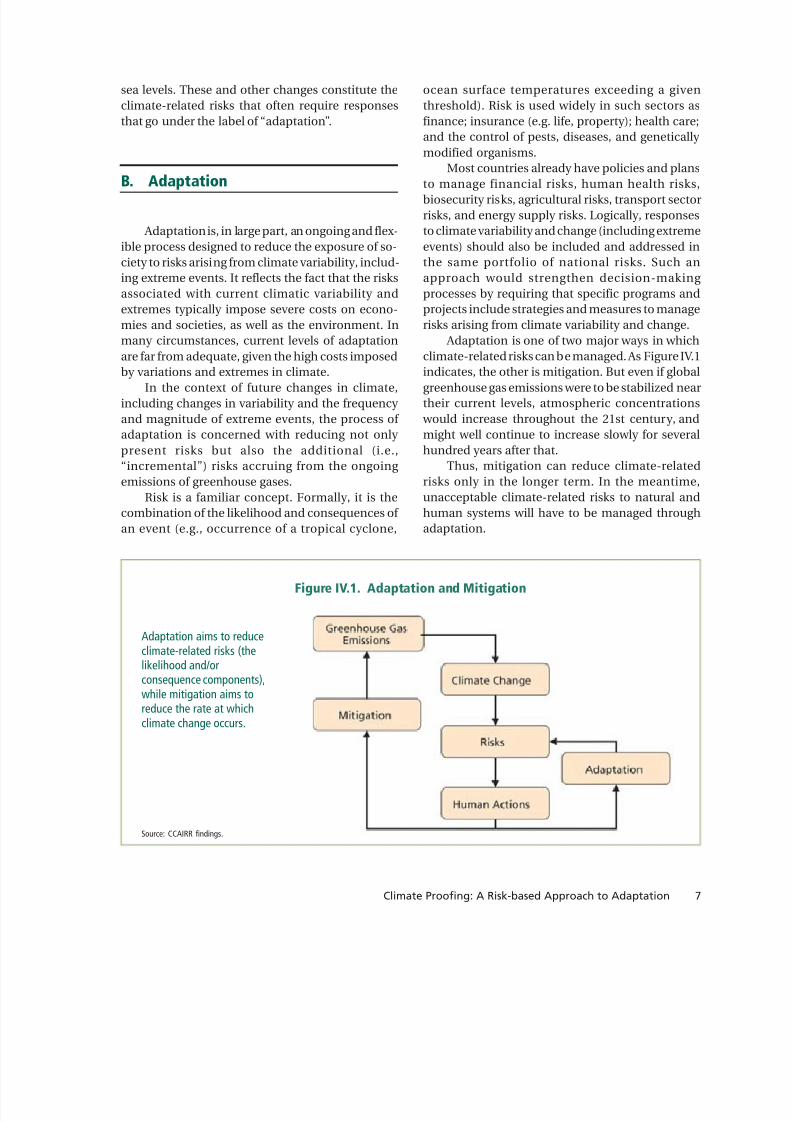
8/13/2019 Climate Proofing: A Risk-based Approach to Adaptation
http://slidepdf.com/reader/full/climate-proofing-a-risk-based-approach-to-adaptation 34/219
7Climate Proofing: A Risk-based Approach to Adaptation
sea levels. These and other changes constitute theclimate-related risks that often require responsesthat go under the label of “adaptation”.
B. Adaptation
Adaptation is, in large part, an ongoing and flex-ible process designed to reduce the exposure of so-ciety to risks arising from climate variability, includ-ing extreme events. It reflects the fact that the risksassociated with current climatic variability andextremes typically impose severe costs on econo-mies and societies, as well as the environment. Inmany circumstances, current levels of adaptationare far from adequate, given the high costs imposedby variations and extremes in climate.
In the context of future changes in climate,including changes in variability and the frequency and magnitude of extreme events, the process of adaptation is concerned with reducing not only present risks but also the additional (i.e.,“incremental”) risks accruing from the ongoing emissions of greenhouse gases.
Risk is a familiar concept. Formally, it is thecombination of the likelihood and consequences of an event (e.g., occurrence of a tropical cyclone,
ocean surface temperatures exceeding a giventhreshold). Risk is used widely in such sectors asfinance; insurance (e.g. life, property); health care;and the control of pests, diseases, and genetically modified organisms.
Most countries already have policies and plans
to manage financial risks, human health risks,biosecurity risks, agricultural risks, transport sectorrisks, and energy supply risks. Logically, responsesto climate variability and change (including extremeevents) should also be included and addressed inthe same portfolio of national risks. Such anapproach would strengthen decision-making processes by requiring that specific programs andprojects include strategies and measures to managerisks arising from climate variability and change.
Adaptation is one of two major ways in whichclimate-related risks can be managed. As Figure IV.1indicates, the other is mitigation. But even if globalgreenhouse gas emissions were to be stabilized neartheir current levels, atmospheric concentrations would increase throughout the 21st century, andmight well continue to increase slowly for severalhundred years after that.
Thus, mitigation can reduce climate-relatedrisks only in the longer term. In the meantime,unacceptable climate-related risks to natural andhuman systems will have to be managed throughadaptation.
Figure IV.1. Adaptation and Mitigation
Adaptation aims to reduceclimate-related risks (thelikelihood and/orconsequence components),while mitigation aims toreduce the rate at whichclimate change occurs.
Source: CCAIRR findings.

8/13/2019 Climate Proofing: A Risk-based Approach to Adaptation
http://slidepdf.com/reader/full/climate-proofing-a-risk-based-approach-to-adaptation 35/219
Climate Proofing: A Risk-based Approach to Adaptation8
Effective management of climate-related risks,through both mitigation and adaptation, preventsprecious resources from being squandered ondisaster recovery and rehabilitation. If adaptationis reactive, as opposed to planned, the range of response options is likely to be narrower; adaptation
may well prove more expensive, socially disruptive,and environmentally unsustainable. Moreover,many disaster and climate change responsestrategies are the same as those that contribute in apositive manner to present-day efforts to implementsustainable development, including enhancementof social equity, sound environmental management,and wise resource use. Such adaptation initiativesare termed “no regrets” options, since they are alsoappropriate responses to the present-day andemerging stresses on social, cultural, economic, andenvironmental systems. No regrets adaptationstrategies are beneficial and cost effective, even if no climate change occurs.
Thus, identifying and undertaking actions toadapt to climate extremes and variability haseconomic and social value, both in dealing withtoday’s climate-related concerns and as an essentialstep toward building long-term resilience to withstanding future changes in climate-relatedrisks. In short, adaptation must reflect current risksas well as the new risks associated with futureclimate change. 1
People will, as a result of their own resourceful-ness or out of necessity, adapt to climate variability and change (including extreme events), based ontheir understanding and assessment of the antici-pated or observed effects, and on the perceivedoptions and benefits for response; in some casessuch adaptations will be adequate, effective, andsatisfactory. For many circumstances, however, suchadaptation may not be satisfactory or successful. Anexternal entity, such as central or local government,may then be needed to facilitate the adaptation pro-cess to ensure that obstacles, barriers, and ineffi-
ciencies are addressed in an appropriate manner.Furthermore, while many climate-related risks and
losses are manifested locally, measures to alleviatethem have important national and internationaldimensions.
Adaptation has many dimensions and is alsobest viewed as an iterative process. As such, itinvolves
• assessing the risks to human systems as well asnatural systems;
• quantifying the consequence component of risk in social, environmental, and economic terms;
• explicitly assessing adaptation options in termsof their costs and benefits in reducing unaccept-able risks;
• identifying the most effective adaptationoption(s);
• developing policies and action plans to reducerisks to acceptable levels; and
• identifying the most effective mechanisms andmodalities to mainstream adaptation programsinto development decision making andeconomic planning.
Significantly, adaptation also comprises key elements such as
• capacity building and awareness raising tounderstand and undertake adaptation;
• developing tools for the assessment of risks andadaptation options;
• the undertaking of required assessments;• mainstreaming adaptation into development
policies, strategies, and plans based upon theresults of the assessments, including theprioritization of adaptation options;
• provision of adequate funding, from internaland/or external sources; and
• implementing the adaptation options throughdevelopment plans, programs, and projects.
These elements of the adaptation process are
depicted in Figure IV.2. Climate Change Adaptationthrough Integrated Risk Reduction (CCAIRR)captures the multiple dimensions of adaptation andthus serves as a framework for the actions thatensure successful adaptation outcomes.
The CCAIRR framework and associated meth-ods underpinned preparation of the case studiesdescribed in the following pages. The framework is
1 In some formal contexts, such as those relating to the UnitedNations Framework Convention on Climate Change, adaptationrelates only to climate change . At an operational level, a moreinclusive definition is reflective of how climate-related risks are,and should be, managed in practice.

8/13/2019 Climate Proofing: A Risk-based Approach to Adaptation
http://slidepdf.com/reader/full/climate-proofing-a-risk-based-approach-to-adaptation 36/219
9Climate Proofing: A Risk-based Approach to Adaptation
operationalized through the activity of climate proof-ing, which includes a risk-based approach to adapt-ing to climate variability and change, including extreme events. Implementing the adaptation pro-cess using this framework results in risk manage-ment responses (i.e., adaptation initiatives) that arecoordinated, integrated, and cost effective. Furtherdetails on CCAIRR may be found in Chapter VIII,“Approach, Methods, and Tools for anIntegrated, Risk-Based Approach to Adaptation”.
Assessment of climate-related risks, and thecost-benefit analyses of specific adaptation mea-sures, have been facilitated by the use of “SimClim”,an “open framework” modelling system to integratedata and models for evaluating the risks of, and
adaptation to, climate variability and change,|including extreme events. User-friendly, Windows-
based interfaces allow users to import climate (andother) data for geographical areas and spatial reso-lutions of their own choice and to attach impactmodels for relevant sectors (e.g., agricultural,coastal, healthcare, water resources). By selecting among emission scenarios, climate change patternsderived using global climate models, climate sensi-tivity values, and time horizons, the user has con-siderable flexibility for generating scenarios of fu-ture climate changes that can be used to drive risk assessment and adaptation models. SimClim con-tains a custom-built geographical information sys-tem for spatial analyses and presentation of results.It also includes tools for examining site-specifictime-series data, including analysis of extreme
events and estimation of return periods. Furtherdetails on SimClim are provided in Chapter VIII.
Figure IV.2. The CCAIRR Framework and Methodology for aRisk-based Approach to Mainstreaming Adaptation
Note: CCAIRR = Climate Change Adaptation through Integrated Risk Reduction.
Source: CCAIRR findings.

8/13/2019 Climate Proofing: A Risk-based Approach to Adaptation
http://slidepdf.com/reader/full/climate-proofing-a-risk-based-approach-to-adaptation 37/219
Climate Proofing: A Risk-based Approach to Adaptation10
A. Background on the Case StudyCountries
The Cook Islands
The Cook Islands comprises 15 small islandsand atolls. The country has a total land areaof 244 square kilometers (km 2) dispersedover an exclusive economic zone of 1.8
million km 2 of the South Pacific Ocean (Map V.1).The islands are predominantly coastal entities andbecause of their size and isolation, and the fragilenature of island ecosystems, their biologicaldiversity is among the most threatened in the world.
The Cook Islands is divided into northern andsouthern groups, stretching over some 1,000 km of ocean. The southern islands are generally youngervolcanic islands, while the northern group is madeup of coral atolls. Islands in the southern group aregenerally larger and more heavily populated. Thetotal population of the Cook Islands is 18,600, whilethat of the capital island (Rarotonga) is 13,200. Thisis the largest island, though only 6 km wide.
The climate of the Cook Islands is considered tobe of a maritime tropical nature, dominated by theeasterly trade winds. The rainfall regime exhibits amarked seasonality, with a dry season from May toOctober, during which only one third of the 2,000millimeters (mm) annual rainfall occurs. The other twothirds falls during the wet season (November to April).The wet season is also the tropical cyclone seasonand is associated with the easterly shift of the SouthPacific Convergence Zone (SPCZ) over the country.
Climate-related Risks in the Case
Study Countries
BOX V.1Key Points for Policy and Decision Makers
• Both the Cook Islands and the Federated States of
Micronesia (FSM) comprise a mixture of relatively largeand hilly islands, coral atolls, and raised coralline islands.
• While the climates of both countries are characterizedas maritime tropical, FSM usually experiences warmerand wetter conditions. Both countries experience amarked seasonality in precipitation.
• The two countries also experience large interannualvariations in rainfall, associated with the El NiñoSouthern Oscillation;
• Tropical cyclones (typhoons) are more common in theCook Islands.
• The consequence component of climate risk is site orsector specific.
• The likelihood component of climate risk, however, isusually evaluated for a country, state, island, or similargeographical unit.
• For both countries, extreme climate events that arerelatively rare at present (likelihood less than 0.05) areprojected to become relatively common as a result of global warming. In many cases, likelihoods are projectedto increase to over 0.20 by 2050.
Source: CCAIRR findings.
The monthly average temperatures rangebetween 21° C and 28° C. Extreme temperatures havebeen recorded in the mid-30s and mid-teens. Theclimate of the Cook Islands experiences largeinterannual variability, especially during ENSOevents.
The occurrence of tropical cyclones tends to bemore frequent during an El Niño event, when
CHAPTER V

8/13/2019 Climate Proofing: A Risk-based Approach to Adaptation
http://slidepdf.com/reader/full/climate-proofing-a-risk-based-approach-to-adaptation 38/219
11Climate Proofing: A Risk-based Approach to Adaptation
warmer than normal sea surface temperatures occurbetween latitudes 10° and 15° South and the SPCZmigrates eastward in the vicinity of the Cook Islandsand French Polynesia. During an El Niño event, thesouthern Cook Islands experiences a reduction inrainfall, to as little as 60% of normal, while in thenorthern Cook Islands rainfall increases to as muchas 300% above normal.
Tropical Cyclones Martin and Pam, during the1997/98 ENSO, caused extensive damage toproperty and infrastructure and brought humansuffering, including loss of lives. During the sameperiod, the southern group of islands experiencedprolonged drought. In the southern Cook Islands,cyclones are seldom associated with heavy rainfall.
The Federated States of Micronesia
The Federated States of Micronesia (FSM)comprises four states: Yap, Chuuk (formerly Truk),Pohnpei (formerly Ponape), and Kosrae (formerly Kusae), in the western Pacific Ocean between theequator and 14° North, and between 136° and 166°
degrees East (Map V.2). The states stretch about2,700 km in geographic sequence from west to east.The country has a total population of about 106,000.
The land area of the FSM comprises 607 islands, which have a combined area of only 701 km 2. Of these hundreds of islands, a number are relatively large and mountainous or hilly, while the rest aresmall, flat coral atolls or raised coralline islands. Thelatter are associated with 7,190 km 2 of lagoons. Themarine area within the FSM’s exclusive economiczone totals over 2.6 million km 2 and includesabundant and varied resources.
The climate of the FSM is typical of many tropical islands. Temperatures are relatively uniform, averaging in the mid to high 20°C range;humidity averages over 80%. Rainfall is high, varying
from about 3,000 mm per year on drier islands toover 10,000 mm per year in the mountainousinterior of Pohnpei. Most islands have a pronounced wet season ( June to October) and dr y season(November to May). For Pohnpei, the “dry” seasoncontracts to January to March.
During an ENSO event, the FSM suffers droughtconditions during the winter and spring months.
Map V.1. The Cook Islands

8/13/2019 Climate Proofing: A Risk-based Approach to Adaptation
http://slidepdf.com/reader/full/climate-proofing-a-risk-based-approach-to-adaptation 39/219
Climate Proofing: A Risk-based Approach to Adaptation12
Map V.2. The Federated States of Micronesia
With a severe El Niño episode, drought can begin asearly as late autumn and extend into the following summer. The stronger the El Niño, the longer-lasting the drought conditions are likely to be. Whether anEl Niño event is “typical” or stronger than usual, Yapand western Chuuk, being in the western part of theFSM, tend to be affected somewhat earlier and, inmost cases, more harshly than eastern Chuuk andthe eastern states of Pohnpei and Kosrae.
The western region of the FSM is subject to theoccasional (one in 20 years return period) tropicalcyclone (typhoon). These can cause severe damage. A typhoon that struck Pohnpei on April 24, 1997caused many landslides, damage to vegetation as well as infrastructure, and 19 deaths. When El Niñoconditions prevail, typhoons tend to form fartherto the east and northeast than usual. The typicaldirections of the storm tracks taken by thesetyphoons are to the north, northwest, or west.During an El Niño event the FSM is most vulnerableto typhoon activity during November and
December, when typhoons have the greatestlikelihood of forming directly east, then tracking west, and gathering strength before traveling acrossthe FSM.
B. Characterizing Risk
Formally, risk is the combination of theconsequence of an event and the likelihood (i.e.,probability) of that same event. As illustrated by theexamples in Table V.1, the full extent of a risk isevident only when both the likelihood andconsequence components are considered together.
While the consequence component of a risk willbe site or sector specific, the likelihood componentgenerally will be applicable both over a larger areaand to many sectors. This is due to the spatial scaleand pervasive nature of weather and climate. Thusthe likelihood of, say, an extreme event or climateanomaly is often evaluated for a country, state, smallisland, or similar geographical unit. While thelikelihood may well vary within a given unit,information is often insufficient to assess this spatialvariability, or the variations are judged to be of low
practical significance. In such instances the mainchallenge is to determine the likelihoods using observed and other data, and to use climate changescenarios to develop projections of how thelikelihoods might change in the future.

8/13/2019 Climate Proofing: A Risk-based Approach to Adaptation
http://slidepdf.com/reader/full/climate-proofing-a-risk-based-approach-to-adaptation 40/219
13Climate Proofing: A Risk-based Approach to Adaptation
Table V.1 A Risk Register, Based on Hypothetical Examples
The remainder of Chapter V provides examplesof such analyses, for both the FSM and Cook Islands.Since the case studies were located in the FSM statesof Pohnpei and Kosrae, and on Rarotonga in theCook Islands, the results are presented for thosegeographical units.
Chapter VI presents the results of characterizing the consequence components of the risks, as partof the detailed description of the case studies.
Summary Climate Risk Profile for Pohnpei andKosrae
The likelihood (i.e., probability) components of climate-related risks in Pohnpei and Kosrae areevaluated, for both present-day and futureconditions. Changes into the future reflect theinfluence of global warming. The risks evaluated inthis way are extreme rainfall events (both hourly anddaily), high sea levels, strong winds, extreme highair temperatures, and drought.
A summary of the climate risk profile (CRP) ispresented here. The full CRP, including descriptionsof the data sources and methods used, may be found
in Appendix 1.Table V.2 presents the average time betweenoccurrences of specified extreme events, for both
Source: CCAIRR findings.
Risk Type Risk Event Consequence Likelihood Risk RankProbability
Natural Typhoon/ Widespread damageCyclone and deaths 1 in 10 year High 1
Human Industrial Explosion Several die 1 in >100 year Low 3
Combined Landslide Damage to road 1 in 50 year Medium 2and environment
Pohnpei and Kosrae. These values, also known asreturn periods, are given for the present and for theprojected future.
The information can also be presented as thelikelihood that the specified event will occur withina given time period. In Table V.2, a time horizon of 1 year has been used. Graphs provided in Appendix 1present the likelihoods for other time horizons.
While all the chosen events are relatively rareat the present time, global warming will causemarked increases in the frequency of all theseextreme events except wind gusts.
Extreme high rainfall amounts are morecommon in Pohnpei than Kosrae, and this differencepersists into the future, with global warming.
An analysis of observed rainfall for Pohnpei for1953–2003 shows that most of the low rainfallmonths (below the fifth percentile, which is oftenused as an indicator of drought) are concentratedin the latter part of the period of observation,indicating that the frequency of drought hasincreased markedly since the 1950s. The years witha high number of months below the fifth percentilecoincide with El Niño events. A similar analysis of projected daily rainfall amounts for Pohnpei reveals
that the frequency of low rainfall months willgenerally remain at these higher levels for the 21stcentury.

8/13/2019 Climate Proofing: A Risk-based Approach to Adaptation
http://slidepdf.com/reader/full/climate-proofing-a-risk-based-approach-to-adaptation 41/219
Climate Proofing: A Risk-based Approach to Adaptation14
Table V.2. Return Period and Likelihood of Occurrence in 1 Year 1, for Given Extreme Eventsin Pohnpei and Kosrae, for the Present and Projected Future
Event and Location Present 2025 2050 2100
RP LO RP LO RP LO RP LO
Rainfall—Daily Total at least 300 mmPohnpei 21 0.05 9 0.11 4 0.23 2 0.65Kosrae 38 0.03 21 0.05 12 0.08 4 0.22
Rainfall—Daily Total at least 200 mmPohnpei 23 0.04 12 0.08 7 0.14 4 0.25Kosrae 28 0.04 21 0.05 16 0.06 11 0.09
Sea Level—Hourly Average at least120 mm above mean sea level
Pohnpei 61 0.02 21 0.05 5 0.20 1 1.0
Wind Gust—Extreme at least 25 m/secPohnpei 8 0.13 10 0.10 9 0.10 0.9 0.11
Maximum Temperature—Daily atleast 35ºC
Pohnpei 24 0.04 11 0.09 6 0.17 2 0.50
RP = return period in years; LO = likelihood of occurrence.1 A likelihood of 0 equals zero chance while a likelihood of 1 equates to a statistical certainty that the event will occur within a year.
Source: CCAIRR findings.
Summary Climate Risk Profile for Rarotonga
The likelihood components of climate-relatedrisks in Rarotonga are evaluated, for both present-day and future conditions. Changes in the futurereflect the influence of global warming. The risksevaluated in this way are extreme rainfall events(both hourly and daily), drought, high sea levels and wave heights, strong winds, and extremely high airtemperatures.
A summary of the CRP is presented in Table V.3.The full CRP, including descriptions of the datasources and methods used, may be found in Appendix 2.
Table V.3 presents the return periods forRarotonga of specified extreme events. Theinformation is also presented in terms of thelikelihood that the specified event will occur within
a time horizon of 1 year. Graphs provided in Appendix 2 present the likelihoods for other timehorizons.
Whil e al l the chosen ex trem e even ts arerelatively rare at the present time, global warming will cause marked increases in the frequency of allof them.
An important point to consider is whether theselikelihoods have changed during the recent past. Any such changes might signal the impact global
warming has had on climate-related risks, althoughdirect attribution of any changes to global warming would require detailed invest igat ions that arebeyond the scope of the present study.
The long rainfall record for Rarotonga providesan opportunity to investigate changes in likelihoodsover time. Table V.4 shows that, between the periods1929–1959 and 1970–2003, a substantial increase

8/13/2019 Climate Proofing: A Risk-based Approach to Adaptation
http://slidepdf.com/reader/full/climate-proofing-a-risk-based-approach-to-adaptation 42/219
15Climate Proofing: A Risk-based Approach to Adaptation
Table V.3. Return Period and Likelihood of Occurrence in 1 Year 1, for Given Extreme Eventsin Rarotonga, for the Present and Projected Future
occurred in the likelihood of a daily rainfall of 250mm or more. This finding is not surprising given that,of the six days since 1929 that had precipitationamounts over 200 mm, all but one was later than1966.
An obvious question arises: are the past changesin the probability component consistent with thechanges projected to occur in the future as a result
of global warming?Table V.4 also shows projected return periodsand likelihoods. The trend of increasing likelihoodthat was apparent in the historical data for much of the last century is projected to continue, in aconsistent manner, through the present century.
The likelihood results in Table V.4 are presentedgraphically in Figure V.1. A consistency between the
Event and Location Present 2025 2050 2100
RP LO RP LO RP LO RP LO
Rainfall—Daily Total at least 300 mm 38 0.03 26 0.04 19 0.05 11 0.09Rainfall—Hourly Total at least 100 mm 91 0.01 57 0.02 25 0.04 13 0.08Height of Sea Surge – Extreme at least6 m above mean sea level 10 0.10 8 0.13 7 0.15 5 0.21Wind Gust – Extreme at least 42m/sec 29 0.03 16 0.06 14 0.07Maximum Temperature – Daily at least34ºC 29 0.03 14 0.07 9 0.12 3 0.29
RP = return period in years; LO = likelihood of occurrence.1 A likelihood of 0 = zero chance; a likelihood of 1 = a statistical certainty that the event will occur within a year.Source: CCAIRR findings.
Table V.4. Probability Components for Daily Rainfall of at least 250 mm, Rarotonga
Time Period Return Period (years) Likelihood in Any One Year
1929–1959 (observed) 66 0.021970–2003 (observed) 17 0.062025 (projected) 13 0.082050 (projected) 10 0.102100 (projected) 6 0.17
Source: CCAIRR findings.
Figure V.1. Observed and Projected Likelihoodsof a Daily Rainfall of at Least 250 mm
Occurring in a Year, Rarotonga

8/13/2019 Climate Proofing: A Risk-based Approach to Adaptation
http://slidepdf.com/reader/full/climate-proofing-a-risk-based-approach-to-adaptation 43/219
Climate Proofing: A Risk-based Approach to Adaptation16
observed and projected changes is readily apparent. This does not prove the existence of a global warming signal in the historical data,however. Once again, more detailed analysesare required before any such attributions mightbe made.
While the frequency of heavy rainfallevents in Rarotonga is clearly increasing, so toois the frequency of low monthly rainfall totals.Figure V.2 shows the number of months in each year when the precipitation was below the 10thpercentile. It is clear that in the latter part of the last century Rarotonga experiencedunprecedentedly low rainfall conditions. In1998 alone, 4 consecutive months had rainfallbelow the 10th percentile. In that same year, 6months had rainfall below the 10th percentile, with 3 below the fifth percentile. All the low rainfall years, namely 1982/83, 1992/93 and1997/98, coincided with El Niño events.
The number of tropical cyclones passing closeto, and affecting, Rarotonga, appears to have
increased during the last century, as indicated inFigure V.3. However, since observing and reporting systems improved substantially over the timeperiod, it is unwise to read too much into the marked
contrast in frequency between the first and secondhalves of the 20th century. The record for the lastfew decades is much more reliable, and hence thedoubling in decadal frequencies between the 1950sand 1990s may well be closer to the truth. It iscertainly consistent with the fact that, since the1970s, the tendency has been for more frequent ElNiño episodes, without intervening “La Niña”events. The duration of the 1990–95 El Niño isunprecedented in the climate records of the past 124 years.
Studies by Australia’s Bureau of Meteorology reveal the consequences of the weakened trade winds and eastward movement of the warm watersof the western tropical Pacific during El Niño events(Figure V.4). Because convective systems (e.g.,thunderstorms and rainstorms) and tropicalcyclones preferentially occur over warmer waters,changes in the pattern of sea surface temperaturesis reflected in the distribution of rainfall and tropicalcyclones.
A poss ib le consequence of the increa sedpersistence of El Niño conditions in recent decadesis the apparent intensification of tropical cyclones.
Table V.5 shows a systematic increase in upper 10th-percentile heights of open water waves associated with tropical cyclones occurring in the vicinity of Rarotonga.
C y c
l o n e s p e r
Y e a r
Figure V.3. Number of Tropical Cyclones per YearPassing Close to, and Affecting, Rarotonga
N u m
b e r o
f L o w
R a
i n f a l l M o n
t h s
i n Y e a r
Figure V.2. Number of Months in each Year(1929–2003) when the Precipitation for
Rarotonga was Below the 10th Percentile

8/13/2019 Climate Proofing: A Risk-based Approach to Adaptation
http://slidepdf.com/reader/full/climate-proofing-a-risk-based-approach-to-adaptation 44/219
17Climate Proofing: A Risk-based Approach to Adaptation
Figure V.4. Average Annual Number of Tropical Cyclones for La NiñaYears (Top Figure) and El Niño Years (Bottom Figure)
Source: Australian Bureau of Metereology n.d.
Table V.5. Open Water Wave Height (Average of Top 10%)Associated with Tropical Cyclones Recently Affecting Rarotonga
Cyclone Wave Height(name and year) (m)
Charles (1978) 11Sally (1987) 10Val (1991) 14Pam (1997) 14Dovi (2003) 17Heta (2004) 17Meena (2005) 17Nancy (2005) 22Percy (2005) 19Olaf (2005) 16
Source: Dorell (pers.comm.)
8/13/2019 Climate Proofing: A Risk-based Approach to Adaptation
http://slidepdf.com/reader/full/climate-proofing-a-risk-based-approach-to-adaptation 45/219
Climate Proofing: A Risk-based Approach to Adaptation18
A. Introduction
Before the details regarding the six case studies are pre-sented, the consultative
procedures used to identify potential case studies, and selectthe final six, will be described.Details of the principles andpractices followed in implement-ing the case studies will also beprovided.
As noted in Chapter II, the six case studies are presented in thefollowing order:
• infrastructure developmentprojects (Kosrae and Raroton-ga);
• communi ty developmentplanning and regulations(Rarotonga and Pohnpei); and
• national strategic develop-ment plans (FSM and Cook Islands).
This ordering is designed tohelp the reader gain a widerappreciation of how climateproofing operates at the threelevels, by identifying the similari-ties and procedures for commu-nity development planning andregulation. The sequencing is also
The Case Studies
BOX VI.1Key Points for Policy and Decision Makers
• Five principles underscored preparation of the case studies, to ensure stakeholder
buy-in and sustained uptake of the findings: Al l activi ti es were to be un dertaken in an in clusive, transpare nt , an dparticipatory manner. Wherever possible, existing information and other resources were to be used.Local experts were expected to work alongside and at times lead theirinternational counterparts. All outcomes were to have high relevance to key stakeholders, add value tocurrent and planned initiatives, and be sustainable.Selection of the case studies was to be in accordance with criteria establishedinitially by the Asian Development Bank and subsequently expanded throughconsultation with stakeholders in each country (governments, nongovernmentorganizations (NGOs), private sector, and communities).
• In addition to the technical and policy-oriented work, considerable effort wasdevoted to a key dimension of adaptation, namely capacity building, including awareness raising and action and institutional strengthening.
• Climate-related risks facing both the infrastructure projects and the communitiesare already substantial, but in all cases are projected to increase substantially as aresult of increases in climate extremes and variability.
• For infrastructure projects, it is possible to avoid most of the damage costsattributable to climate change, and to do this in a cost-effective manner, if climateproofing is undertaken at the design stage of the project.
• Cost effectiveness can be further enhanced if environmental impact assessmentprocedures require that all development be climate proofed.
• Climate proofing communities can also be cost effective if planning and regulatory measures take into account both current and future climate-related risks.
• Climate proofing national strategic development plans
enhances the enabling environment for adaptation;establishes the requirement for climate proofing sector and subnational(e.g., state, island and community) development plans, as well as individualdevelopment projects (i.e., mainstreaming adaptation); andensures that actions to reduce climate-related risks are an integral part of, andharmonized with, sustainable development initiatives.
Source: CCAIRR findings.
CHAPTER VI

8/13/2019 Climate Proofing: A Risk-based Approach to Adaptation
http://slidepdf.com/reader/full/climate-proofing-a-risk-based-approach-to-adaptation 46/219
19Climate Proofing: A Risk-based Approach to Adaptation
intended to assist the reader to identify differencesin the climate proofing process that arise from thecontrasting social, political, environmental, and eco-nomic contexts of the case studies.
The key findings arising from the case studiesare presented in the next chapter, along with a
discussion of their implications. Additional details regarding the methods and
tools used in developing the case studies may befound in Chapter VIII.
B. Case Study Identification andSelection Procedures
The six case studies that were to demonstrate arisk-based approach to adaptation and themainstreaming of adaptation were selected in aconsultative process involving stakeholders in theFederated States of Micronesia (FSM) and the Cook Islands. In both countries the stakeholders wererepresented by government officials, leaders of nongovernment organizations (NGOs), andindividuals active in the private sector.
Criteria used in the selection were alsodeveloped as part of the same consultative process(Box VI.2). In addition, the Asian Development Bank (ADB) prescribed that, for each country, the casestudies must cover the spectrum from strategicplanning to project-level activities. Moreover, atleast one of these activities had to be funded by anagency other than ADB. This was to ensure that notall the activities were closely associated with ADBpolicies and procedures.
The other criteria reflected the need for the casestudies to produce self-evident results within 1 year.The results had to be of direct benefit to govern-ments, the private sector, and civil society, both inthe participating countries and in the wider Pacific
region.Discussions with stakeholders in both countriesresulted in identification of a wide range of climate-related risks, affecting many sectors, both individ-ually and collectively, in a crosscutting manner.Examples from the FSM included landslide events,malfunction of septic tanks and latrines, reduced fishcatches, and damage to coastal infrastructure. For
BOX VI.2Criteria for Selection of Case Studies
• Criteria given in the Terms of Reference from the ADB:
Three case studies were to demonstrate a risk-basedapproach to adaptation and the mainstreaming of adaptation. At least one must be• related to a strategy or plan,• related to a project,• related to an activity (strategy, plan or project) not
funded by ADB), or• related to the coastal zone.Development or implementation of activity (strategy,plan, or project) is imminent, with at least the designphase due for completion by the end of the timeavailable to prepare the case studies.
• Case studies must involve assets at risk to climatechange, especially to variability and extreme events.
• Some or all of the required information is already available, or is easily acquired.
• Case studies must deal with mainline sectors, and hencehave buy-in from governments.
• Implications of the case studies will ideally extendbeyond individual sectors—i.e., crosscutting.
• Case studies must complement and add value to
related projects, anddevelopment activities, regardless of climate change.
• Case studies must not duplicate existing activities.• Case studies must maintain a balance of capital and
Outer Island coverage.• The results of addressing climate change must be
amenable to cost-benefit analysis, including social andenvironmental costs and benefits.
• Case studies must maintain links with the nationalimplementing agency and/or other ministries.
• Case studies must attract strong interest from the privatesector and/or civil society.
• Case study findings must be made widely applicable,nationally and in the region.
Source: CCAIRR findings.
the Cook Islands, additional risks were identified,including tourism downturn and decline of the pearlindustry. The high interdependency of sectors andcommunity support systems in both countries

8/13/2019 Climate Proofing: A Risk-based Approach to Adaptation
http://slidepdf.com/reader/full/climate-proofing-a-risk-based-approach-to-adaptation 47/219
Climate Proofing: A Risk-based Approach to Adaptation20
• climate proofing the infrastructure, humanhealth care, and environment components of theFSM National Strategic Development Plan.
The results of similar consultations in the Cook Islands are shown in Figure VI.2, including the
agreed case studies, namely
• climate proofing the design of the breakwater forthe newly developed Western Basin, Rarotonga;
• climate proofing Avatiu-Ruatonga, a community inland from Avatiu Harbour; and
• climate proofing the Cook Islands NationalDevelopment Strategy.
For each country the case studies form an inte-grated package based on activities ranging from
resulted in stakeholders requesting that, other thanfor the project level, all case studies cut across sec-tors and reflect a range of climate-related risks.
Figure VI.1 identifies the sectors and supportsystems in the FSM considered to be exposed tocurrent and future climate-related risks and the
three specific case studies chosen to demonstratethe risk-based approach to mainstreaming adaptation.
As shown in Figure VI.1, the outcome of theconsultations was a suite of case studies for the FSM,namely:
• climate proofing Sapwohn, a coastal community in Pohnpei;
• climate proofing a roadbuilding infrastructureproject in Kosrae; and
Figure VI.1. Sectors and Support Systems Considered to be at Risk, and the Three Case StudiesChosen to Demonstrate the Risk-based Approach to Mainstreaming Adaptation (FSM)
Source: CCAIRR fi ndings.

8/13/2019 Climate Proofing: A Risk-based Approach to Adaptation
http://slidepdf.com/reader/full/climate-proofing-a-risk-based-approach-to-adaptation 48/219
21Climate Proofing: A Risk-based Approach to Adaptation
Source: CCAIRR findings.
Figure VI.2. The Sectors and Support Systems Considered to be at Risk, and the Three Case StudiesChosen to Demonstrate the Risk-based Approach to Mainstreaming Adaptation (Cook Islands)
Source: CCAIRR findings.
project level to national strategic development plan-ning. Identifying climate-related risks (including those related to sea level and state), and determin-ing how best to manage them through adaptationmeasures, will add value to planned project activi-ties and help enhance the sustainability of devel-opment, at community through to national levels.
The ultimate aim of the case studies was to show why and demonstrate how reducing climate-related
risks is an integral part of sustainable development.Implementation of specific risk-reduction measuresat project and local levels can be facilitated if land-use planning and associated regulations and
permitting procedures for community andinfrastructure development projects incorporaterequirements designed to reduce risks related toclimate extremes, variability, and change. Thisstrengthening of planning and regulatory provisionsis, in turn, assisted by ensuring that national policy frameworks and strategies address the potential forclimate-related risk events to have large adverse social,environmental, and economic consequences.
In this way, a favorable enabling environmentis created for the implementation of specificadaptation measures that will reduce climate-related risks.

8/13/2019 Climate Proofing: A Risk-based Approach to Adaptation
http://slidepdf.com/reader/full/climate-proofing-a-risk-based-approach-to-adaptation 49/219
Climate Proofing: A Risk-based Approach to Adaptation22
C. Implementation of the Case Studies
In addition to the requirement that the casestudies comply with the previously listed selection
criteria, four fundamental principles underscoredpreparation of the case studies:
• all activities were to be undertaken in an inclu-sive, transparent, and participatory manner;
• wherever possible, existing information andother resources were to be used;
• local experts were expected to work alongsideand at times lead their international counter-parts; and
• all outcomes were to have high relevance to key stakeholders, add value to current and planned
initiatives, and be sustainable.
These principles are consistent with, and in factunderscore, the CCAIRR methodology that wasfollowed in preparing the case studies. In order tocomply with these principles, and reflecting theCCAIRR methodology, the case studies involvedmore than characterizing climate-related risks anddetermining the most effective and efficientmethods for reducing these to acceptable levels.
Two key dimensions of the CCAIRR methodol-ogy that are fundamental to successful adaptation,and illustrate the integrated and comprehensiveapproach taken to implement the case studies in thetwo host countries, are i) capacity building, includ-ing awareness raising and institutional strengthen-
ing, and ii) provision, enhancement, and applica-tion of data, tools, and knowledge.
Capacity Building, Including AwarenessRaising and Institutional Strengthening
Careful consideration was given to the selectionof the implementing agencies in the two countries. As shown in Table VI.1, several considerations wereidentified. This resulted in the selection of the Min-istry of Works as implementing agency for the Cook Islands. For the FSM, the implementing agency wasthe Department of Transport, Communications, andInfrastructure. The equivalent implementing agency at the state level in Pohnpei was the EnvironmentalProtection Agency; in Kosrae it was the Develop-ment Review Commission. In both countries, close working relationships were also established withenvironmental and other relevant agencies.
Table VI.1. Factors Considered When Selecting the Implementing Agencies
Characteristic Reason
Development focus This will help ensure achievement of a key project outcome, namelymainstreaming adaptation responses as demonstrated through development casestudies.
Infrastructure responsibility Major climate change risks and opportunities are infrastructure related. Thecentral tenet of this TA is to make a real difference at a practical level.
Established office facilities and counterpart staff The TA team needs to work alongside counterpart staff in the implementing
agency, in order to achieve another key project outcome, namely to enhance localcapacity in mainstreaming adaptation to climate change.
Already facilitating coping Adaptation is typically most effective when it is complementary to existing effortsto cope with extremes, variability, and change.
TA = technical assistance.Source: CCAIRR findings.

8/13/2019 Climate Proofing: A Risk-based Approach to Adaptation
http://slidepdf.com/reader/full/climate-proofing-a-risk-based-approach-to-adaptation 50/219
23Climate Proofing: A Risk-based Approach to Adaptation
Since training is an important component of theCCAIRR methodology, preparation of the casestudies also included on-the-job training fornational counterparts, based on learning by doing.International experts worked alongside counterpartstaff in the implementing agency, among others, in
order to achieve another key project outcome,namely building local capacity in mainstreaming adaptation to climate change. These activitiescomplemented more formal “transfer and apply” workshops that we re conducted as pa rt of completing the case studies.
As part of the effort to build local expertise in arisk-based approach to adaptation and to main-stream adaptation, a close working relationship wasalso established with individuals who had respon-sibility for preparing and implementing develop-ment policies, plans, and projects. The aim was tohelp achieve the major benefits that accrue if therisks associated with climate variabili ty and change(including extreme events) are taken into consider-ation at an early stage in the planning and projectcycles. The training and relationship building wasalso part of a deliberate strategy to ensure minimalturnover of in-country personnel who had key rolesto play in ensuring the success of the case studies.
Another part of the strategy was to ensure gov-ernment “buy-in” for the project, especially with ref-erence to accepting the approach, methodologies,and selection of case studies; providing active andeffective oversight of the project; assigning staff to work alongside the consultants; allowing learning by doing; and providing in-kind support such asappropriate work space, communications facilities,and information resources. Effort was also devotedto ensuring that actions related to the case studies were harmonized with the ongoing activities of gov-ernment, the private sector, and NGOs. In this way synergies were maximized and duplication wasavoided.
Throughout the preparation of the case studies,
there was also a commitment to communicating theproject findings in ways that maximized awarenessamong stakeholders, encouraged constructive feed-back, and laid the foundation for effective uptake of the project findings. This was part of a comprehen-sive awareness-raising and action-promotionprogram. Both broad and targeted activities wereundertaken in each country on a regular basis, in
order to raise awareness of the case study activitiesamong governments, the private sector, and civilsociety. As indicated in Box VI.3 and Figure VI.3, suchactivities were undertaken in cooperation with themedia, community-based organizations, educationalinstitutions, the private sector, and government.
Stakeholder oversight of the preparation of thecase studies in the two countries was via ProjectLiaison Committees. Where possible and appropri-ate, these were based on existing groups. In the FSM,the terms of reference of the National ClimateChange Country Team (NCCCT) were modified toreflect responsibility for overseeing the case stud-ies. The Country Team was also strengthened andits representation widened through the addition of individuals from NGOs and the private sector. In theCook Islands, most members of the Project LiaisonCommittee were members of the NCCCT and/or theproject advisory committee for an infrastructure
BOX VI.3Example of Program for Awareness-Raising
and Action-Promotion Workshop
• Welcome and Opening Comments—Minister forEnvironment
• The need for public awareness and action—Outer IslandEnvironmental Officer
• Climate-related risks to communities in Rarotonga, andimplications for action—John Hay • Environment Service’s strategies for promoting climate
change awareness and action— National ClimateChange Coordinator
• Using climate change as a theme to supportenvironmental education in the Cook Islands—officialfrom Education Ministry
• Using environmental education as the delivery mechanism for adaptation and mitigation measures—nongovernment organization representative
• Using the Climate Change Adaptation Program for thePacific findings to raise awareness, change attitudes, and
promote adaptation actions—Teresa Manarangi-Trott• Question & answer and discussion• Brainstorming—elements of an action strategy to
promote environment awareness, change attitudes, andfoster action related to climate change.
Source: CCAIRR findings.
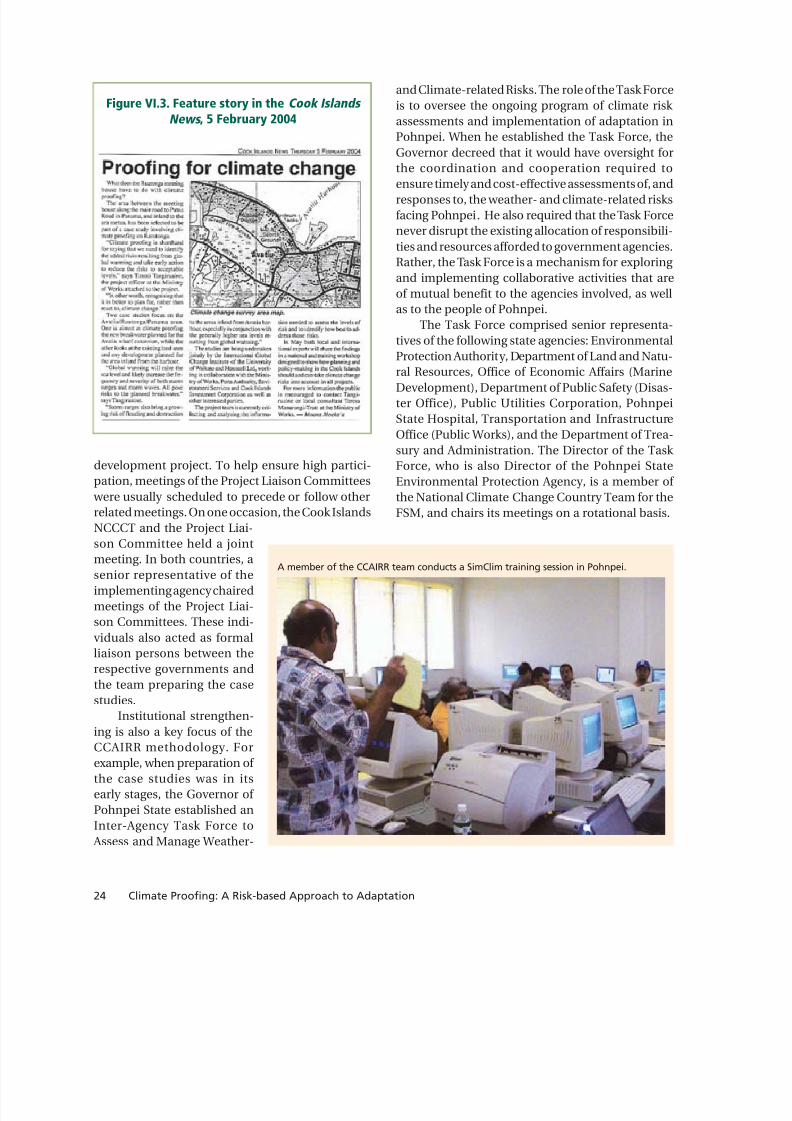
8/13/2019 Climate Proofing: A Risk-based Approach to Adaptation
http://slidepdf.com/reader/full/climate-proofing-a-risk-based-approach-to-adaptation 51/219
Climate Proofing: A Risk-based Approach to Adaptation24
and Climate-related Risks. The role of the Task Forceis to oversee the ongoing program of climate risk assessments and implementation of adaptation inPohnpei. When he established the Task Force, theGovernor decreed that it would have oversight forthe coordination and cooperation required to
ensure timely and cost-effective assessments of, andresponses to, the weather- and climate-related risksfacing Pohnpei. He also required that the Task Forcenever disrupt the existing allocation of responsibili-ties and resources afforded to government agencies.Rather, the Task Force is a mechanism for exploring and implementing collaborative activities that areof mutual benefit to the agencies involved, as wellas to the people of Pohnpei.
The Task Force comprised senior representa-tives of the following state agencies: EnvironmentalProtection Authority, Department of Land and Natu-ral Resources, Office of Economic Affairs (MarineDevelopment), Department of Public Safety (Disas-ter Office), Public Utilities Corporation, PohnpeiState Hospital, Transportation and InfrastructureOffice (Public Works), and the Department of Trea-sury and Administration. The Director of the Task Force, who is also Director of the Pohnpei StateEnvironmental Protection Agency, is a member of the National Climate Change Country Team for theFSM, and chairs its meetings on a rotational basis.
Figure VI.3. Feature story in the Cook Islands
News , 5 February 2004
development project. To help ensure high partici-pation, meetings of the Project Liaison Committees were usually scheduled to precede or follow otherrelated meetings. On one occasion, the Cook IslandsNCCCT and the Project Liai-son Committee held a jointmeeting. In both countries, asenior representative of theimplementing agency chairedmeetings of the Project Liai-son Committees. These indi-viduals also acted as formalliaison persons between therespective governments andthe team preparing the casestudies.
Institutional strengthen-
ing is also a key focus of theCCAIRR methodology. Forexample, when preparation of the case studies was in itsearly stages, the Governor of Pohnpei State established anInter-Agency Task Force to Assess and Manage Weather-
A member of the CCAIRR team conducts a SimClim training session in Pohnpei.

8/13/2019 Climate Proofing: A Risk-based Approach to Adaptation
http://slidepdf.com/reader/full/climate-proofing-a-risk-based-approach-to-adaptation 52/219
25Climate Proofing: A Risk-based Approach to Adaptation
At the technical level the Task Force was assistedby the Pohnpei CCAIRR Team, made up of techni-cal specialists, key individuals from NGOs, and com-munity representatives.
Providing, Enhancing, and Applying Data,
Members of the team from the Cook Islands’ Ministry of Works played keyroles in the case studies undertaken in that country.
one government agency (Mapping and Survey Division, PohnpeiDepartment of Lands and NaturalResources; Geographic Informa-tion Systems Division, the Cook Islands Ministry of Works) as the
central repository of information tobe used, not only for undertaking risk assessments to support adap-tation to climate change, but alsofor the land use and related assess-ments that underpin state-of-the-art approaches to national develop-ment planning. This recognition,along with widespread buy-in to theprocess of preparing the case stud-ies, resulted in relevant informationrepositories being identified andmade readily available by their cus-todians, despite previous historiesof unwillingness to share data andother information, even between
government agencies. At times, however, it was necessary to collect
new information, since its absence would jeopar-dize the quality of the risk assessments and adapta-tion studies. A case in point was the high-resolution(spatial and elevation) data required to determinethe flood risks faced by the Aviatiu-Ruatonga and
Survey Crew, Sapwohn Case Study
Tools and Knowledge
Implementing a risk-basedapproach to adaptation is an infor-mation-intensive task. As notedabove, one of the principles guiding preparation of the case studies wasthat, wherever possible, existing information was to be used. Com-plying with this principle was, attimes, a major challenge, but theresulting benefits went way beyond
those related to efficiency. Many had to do with effectiveness, oftenin terms of improved communica-tion and cooperation betweeninformation gatekeepers as well asamong stakeholders. In both coun-tries, preparation of the case stud-ies resulted in the identification of

8/13/2019 Climate Proofing: A Risk-based Approach to Adaptation
http://slidepdf.com/reader/full/climate-proofing-a-risk-based-approach-to-adaptation 53/219
Climate Proofing: A Risk-based Approach to Adaptation26
Sapwohn communities. For the Sapwohn case study,existing survey data held by the Pohnpei Depart-ment of Lands and the Public Utilities Commission were supplemented by spot heights obtained using a Total Station Survey System. For the Avatiu-Ruatonga study area, existing spot heights from con-
ventional surveys were supplemented with new spotheights obtained using Global Positioning Satellite(GPS) equipment (Figure VI.4).
D. Case Study One: Climate Proofinga Roadbuilding InfrastructureProject in Kosrae, Federated Statesof Micronesia
The infrastructure development plan for Kosraeincludes completion of the circumferential road. Atpresent, a 16-km gap occurs, designated RS4. Funds
for the roadbuilding project will be provided underthe Compact of Free Association with the UnitedStates of America. Construction of at least a portionof the road, the northern portion up to but notincluding the Yela Valley crossing (Figure VI.5), wasscheduled for 2004.
The proposed alignment of the road skirts themangrove, hugging the coastline at the foot of thesteeper slopes (see photo).
Most of the proposed road is 7 to 10 m abovemean sea level, with the lowest point about 4 mabove mean sea level. On the inland, steeper side of the road, small drainages require that provision bemade for handling peak runoff flows so as to preventdamage to the road and associated infrastructure.
The primary purpose of the project is tocomplete the road around the island of Kosrae andprovide all-weather land access to the remote villageof Walung (population 230) in the southwest (Figure VI.5). It is the only community without reliable linksto the other municipalities. The existing coastal road
Note: Heights were derived using a combination of existing spot heights based on conventional survey methods and new spot heights obtained using GPS equipment.Source: CCAIRR findings.
Figure VI.4. Heights above Mean Sea Level for the Avatiu-Ruatonga Study Area

8/13/2019 Climate Proofing: A Risk-based Approach to Adaptation
http://slidepdf.com/reader/full/climate-proofing-a-risk-based-approach-to-adaptation 54/219
27Climate Proofing: A Risk-based Approach to Adaptation
Note: The portion of the road that is still to be Completed (RS4) will run along the northwest coast of the island, from Tafunsak to just north of Walung. A possiblealignment i s shown in red in the right hand image. The Yela Valley is indicated by a red oval in the left hand map.Source:CCAIRR findings.
Figure VI.5. Kosrae’s Circumferential Road
The Yela Valley. Theproposed roadalignment is eitherthrough themangrove (fore-ground), across theberm, through theka (Terminaliacarolinensis) swamp,or around the valleyrim (background).

8/13/2019 Climate Proofing: A Risk-based Approach to Adaptation
http://slidepdf.com/reader/full/climate-proofing-a-risk-based-approach-to-adaptation 55/219
Climate Proofing: A Risk-based Approach to Adaptation28
currently covers about two thirds of the island’scircumference.
Completion of this link will also allow easieraccess at the present undeveloped interior of the is-land along the western coast, providing scope foragriculture and new settlement in the area. At
present, the timing and extent of future develop-ment along the western coast due to the new roadis extremely uncertain. Development is unlikely tobe significant along the road segment under study,but the plans are to construct power lines to join Walung to the existing electricity distribution sys-tem from two directions along the new route. This will convert the present “radial” configuration of thepower distribution system in Kosrae to a more reli-able ring-main, with benefits for the whole island.
Three major issues are connected to theclimate-related risks to completion and main-tenance of the circumferential road in Kosrae:
• determining the hydraulic design features for theroad up to, and beyond, the Yela Valley crossing;
• choosing among the options for routing acrossthe Yela Valley, of which there are currently five;and
• determining the hydraulic design features foreach of the above options.
The choice of a route across the Yela isproblematic, due to the need to traverse orcircumnavigate a large freshwater swamp that isdominated by Terminalia carolinensis (locally known as ka ) and flooded by the Yela River. The Yelaka swamp is officially designated as an Area of Biological Significance.
The Yela watershed is the largest and perhapsthe most valuable intact landscape remaining inKosrae. With the largest remaining stand of T.carolinensis in the world, the natural beauty of the wild and undisturbed wetland attracts tourists, evenif seeing it requires hiking for some distance from
the ends of the existing roads.Stakeholder consultations resulted in thedecision to focus on the first of the above threeissues, with some consideration being given to theclimatic implications for the choice of optionsacross the Yela, though not in detail. Some initialassessments are included in Table VI.2.
Whil e the th ird is sue was po tent ia lly anappropriate focus for the case study, it was decidedthat including it was not practicable. The decisionas to which, if any, route option would be pursuedmay not be reached in the foreseeable future.Subsequent to that decision, and in compliance withgovernment requirements, an environmentalimpact statement and a detailed design will have tobe prepared.
Thus this climate proofing case study relatesonly to the 9.8-km portion of RS4 that lies north of the Yela Valley. The as yet unbuilt portion is 6.6 kmin length. The remainder (3.2 km) has already beenconstructed, with drainage works designed for anhourly rainfall of 178 mm.
Climate change scenarios were used to developprojections of how the likelihood of extreme rain-fall events might change in the future. Projectionsused the Hadley Centre (United Kingdom) globalclimate model (GCM), with best judgement of model sensitivity, as this gave results intermediatebetween those provided by three other GCMs,namely those developed by the Australian Common- weal th Sc ie nt if ic and Indust ri al ResearchOrganisation (CSIRO), Japan’s National Institute for
Environmental Science (NIES), and the CanadianClimate Centre (CCC) (see Appendix 1). Similarly,the SRES A1B greenhouse gas emission scenario was used when preparing the rainfall projections,as this scenario is close to the middle of the enve-lope of projected emissions and greenhouse gasconcentrations.
Yela Valley: portion of the Stand of Terminaliacarolinensis, or ka.

8/13/2019 Climate Proofing: A Risk-based Approach to Adaptation
http://slidepdf.com/reader/full/climate-proofing-a-risk-based-approach-to-adaptation 56/219
29Climate Proofing: A Risk-based Approach to Adaptation
Table VI.2. Implications of Possible Changes in Future Climatic Risks for Options for theLocation and Design of the Road through the Yela Basin
Location of Road Sea-Level Rise Increase in Rainfall
Across the berm “Hardening” the berm could create a permanentbarrier and prevent berm and mangrove fromnaturally migrating as a result of rising sea level.
Culvert numbers and/or sizes should beincreased to accommodate higher peakflows and bridgehead heights should behigher, thus increasing cost.
Through the mangrove swamp Roadbed and culvert freeboard should be increasedto accommodate risk of extreme high sea-levelevents, thus increasing fill and cost.
Bridgehead freeboard should beincreased to accommodate risk of extreme high rainfall and flow events,thus increasing cost.
No road across Yela Allow ecosystems (mangrove andka swamp) tomigrate naturally in concert with inundation andsalinity changes.
None
Through the ka swamp Increased backwater effects from higher sea level,which have implications for culvert, bridge, androadbed heights
Culvert numbers and/or sizes should beincreased to accommodate higher peakflows and bridgehead heights should behigher, thus increasing cost.
Around the rim None Increased risks of flood damage andscouring associated with higher flow andvelocity from increased runoff
As noted, the drainage works for the originalroad design (both built and yet-to-be-built sections) were based on an hourly rainfall of 178 mm. Thisvalue was thought to have a recurrence interval of 25 years, but was derived using hourly rainfall datafor Washington, DC, USA, since no hourly rainfalldata exist for Kosrae. The observed data wereadjusted subjectively to approximate Kosraeconditions.
The current case study used hourly rainfall datafor Pohnpei, adjusted by the ratio of the meanannual rainfalls for Kosrae and Pohnpei. On thebasis of these data, an hourly rainfall of 178 mm hasa recurrence interval of 23 years.
The design rainfall was intended to be thehourly rainfall with a return period of 25 years. Forpresent conditions this is 190 mm. But Figure VI.6reveals that by 2050 the hourly rainfall with a 25- year return period will have increased to 254 mm.
A recommendat ion was made to the Kosraestate government that the design of the road bemodified so the drainage works can accommodate
an hourly rainfall of 254 mm. This recommendation was accepted, and a climate-proofed design wasprepared and costed.
Figure VI.6. Hourly Rainfall (mm) with aReturn Period of 25 Years, Kosrae
mm = millimeters.Source: CCAIRR findings.
Source: CCAIRR findings.

8/13/2019 Climate Proofing: A Risk-based Approach to Adaptation
http://slidepdf.com/reader/full/climate-proofing-a-risk-based-approach-to-adaptation 57/219
Climate Proofing: A Risk-based Approach to Adaptation30
The results shown in Table VI.3 indicate that theincremental cost of climate proofing the road designand construction for the as yet unbuilt section is inthe vicinity of $500,000.
A cost-benefit analysis of climate proofing theroad took into account the following whendetermining the net present values and internal rateof return shown in Table VI.4:
• construction costs (with and without climateproofing);
• maintenance costs over 50 years (with and without climate proofing); and
• a discount rate of 3%, to allow for differing
importance attached to current and futureinvestments (the choice of discount rate isdiscussed in Chapter VIII.
Figure VI.7 illustrates the above results. Whilethe capital cost of the climate-proofed road will behigher than if the road were constructed to theoriginal design, the accumulated costs, including
Original Design Climate Proofed Net BenefitDesign of climate proofing
No climate change 4,475,000With climate change 7,803,000 4,986,000 2,817,000Internal Rate of Return 11%Note: Net present values ($) over 50 years, with discount rate of 3%Source: CCAIRR findings.
Table VI.4. Total Construction, Maintenance, and Repair Costs of theAs Yet Unbuilt Sectionof RS4 (2004 $)
Figure VI.7. Accumulated Costs(Construction, Repairs, and Maintenance)
for the As Yet Unbuilt Section of RS4
Source: CCAIRR findings.
original design
climate proofed designs
Table VI.3. Construction Costs for the As Yet Unbuilt 6.6-km Section of RS4(2004 $)
Original Design Climate Proofed Design
Road Surface 1,254,000 1,254,000Drainage Works 640,000 1,151,000Total 1,895,000 2,406,000Incremental Cost 511,000
Source: CCAIRR findings.
repairs and maintenance, will be lower after only about 15 years. This is because the repair andmaintenance costs for the climate-proofed road willbe lower.

8/13/2019 Climate Proofing: A Risk-based Approach to Adaptation
http://slidepdf.com/reader/full/climate-proofing-a-risk-based-approach-to-adaptation 58/219
31Climate Proofing: A Risk-based Approach to Adaptation
As noted above, a 3.2-km portion of RS4 hasalready been constructed, including the drainage works. The design for these was based on an hourly rainfall of 178 mm for a 25-year recurrence interval.It is informative to consider the cost of retroactively climate proofing this section of road (i.e., using a
design rainfall of 254 mm). The results are presentedin Table VI.5.
The information presented in Tables VI.3 and VI.5 show that it is more costly to climate proof retroactively: $776,184 for a 3.2-km section of existing road ($243,000 per km) as opposed to$511,000 to climate proof 6.6 km of new road($77,000 per km).
A cost-benefit analysis (Table VI.6) reveals thateven the retroactive climate proofing is still a cost-effective investment, with an internal rate of returnof 13%.
The governments of the FSM and the state of Kosrae were informed of these findings, as well asof possible funding options for climate proofing theas yet unbuilt section of road. The options included
Table VI.5. Construction Costs of 3.2-km Built Section of RS4 (2004 $)
As Built Climate Proofed Design
Road Surface 518,000Drainage Works 406,000 776,000Total 924,000Incremental Cost 776,000
Source: CCAIRR findings.
• not climate proofing the road, since:more important investments may have to bemade (e.g., in health care),the climate may not change in the way thatis projected, andan extreme event (e.g., hourly rainfall of 178
mm) can happen at any time; it is only possible to consider average recurrenceintervals;
• using internal funds—i.e. from the state budget;• using national funds;• using Compact II funds on the basis that the true
(“most likely”) costs of the project haveincreased;
• seeking additional funding from internationalaid provider agencies such as
the Global Environment Facility (GEF);multilateral financial institutions (e.g., ADB);bilateral donors (e.g., Government of Canada); andpublic-private partnerships, possibly including a road toll.
Original Design Climate Proofed Net BenefitDesign of Climate Proofing
No climate change 3,504,000With climate change 6,833,000 3,875,000 2,958,000Internal Rate of Return 13%Note: Net present values ($) over 50 years, with discount rate of 3%Source: CCAIRR findings.
Table VI.6: Total Construction, Maintenance, and Repair Costsof 3.2-km Built Section of RS4 (2004 $)

8/13/2019 Climate Proofing: A Risk-based Approach to Adaptation
http://slidepdf.com/reader/full/climate-proofing-a-risk-based-approach-to-adaptation 59/219
Climate Proofing: A Risk-based Approach to Adaptation32
The last option is a possibility, since the highecological value of the Yela Valley might encouragea philanthropic organization to fund the additionalconstruction costs required to ensure that the roadis climate proofed, and in addition is not going toplace valuable ecosystems at risk.
Based on the information available to it, theKosrae state government decided it would notproceed with construction of the section of RS4north of the Yela valley until additional funds wereavailable to complete the climate proofing.
At the final Tripartite Meeting that reviewed thecase studies, it was agreed to ask ADB to assist insecuring funding for the incremental costs forclimate proofing the road that is yet to be built. As aresult, both the national and Kosrae stategovernments have written to ADB requesting suchassistance.
At the time of writing, support was growing fordeveloping a proposal to the GEF for funding theincremental costs of completing the entire RS4,some 16 km of road. In addition to climate proofing the road, GEF would be asked to meet theincremental costs of “biodiversity proofing” it,including ensuring the continued protection of thevalued ecosystems in the Yela Valley. Prior tocommencing construction, all the environmentaland other approvals required by the State of Kosrae would, of course, have to be in place.
Information on GEF funding of adaptationprojects is provided in Chapter VII, “Key Findingsand Their Implications.”
E. Case Study Two: Climate Proofingthe Design of the Breakwater forthe Newly Developed WesternBasin, Avatiu Harbor, Rarotonga
The domestic tuna industry is becoming a key export earner for the Cook Islands. The number of commercial fishing vessels increased from three in2001 to 17 in 2002 and 44 in 2003. This and futureexpansion of the long-line fishing industry isconstrained by a lack of appropriate infrastructure,and in particular by lack of berth space and otherfacilities within Avatiu Harbor. The Cook Islands
Ports Authority is in the process of developing the Western Basin to accommodate extra vessels,provide sufficient wharf space to minimize delaysin offloading fresh fish, and allow the fishing vesselsto use the harbor in most sea conditions other thanthose associated with cyclones.
As shown in Figure VI.8, the Western Basin isadjacent to, and directly west of, the existing AvatiuHarbor. It is on an existing area of reclamation onthe reef flat, approximately 100 m wide. In the 1980s,construction of a western breakwater wasundertaken, but had not been completed by 1987, when Cyclone Sal ly occurred. The incompletebreakwater was damaged, in part because of theabsence of a planned lining of armored basaltboulders. The internal components of thebreakwater were stripped and spread over the reef flat.
The three major components of the currentdevelopment are excavation of the harbor basin inthe tidal reef flat; reconstruction of the westernbreakwater; and development of facilities including wharves, quays, and ancillary services. The harborbasin is being formed by blasting and excavating thereef down to a nominal 4 m below mean sea level,and by reconstructing a breakwater approximately 350 m long and 20 m back from and parallel to thereef edge. The Basin is intended to be usable by fishing boats and yachts in all southeasterly trade wind and swell conditions. The Basin is not designedto be operable during cyclone conditions. In suchcircumstances, all small vessels will be hauledashore and moved inland while all larger vessels willbe put to sea.
The design brief for the Western Basin statesthat the breakwater and quay walls should bedesigned for a nominal design life of 60 years.Fixtures should be robust enough to withstand acyclone with a 10-year return period, though thebrief acknowledges that any fixture that suffers adirect hit by a boulder or coral head carried in a
storm wave during a sea surge is likely to bedamaged. When Cyclones Val and Sally impactedRarotonga, seven-ton rocks were picked up by storm waves and became projectiles, causing damageinland. The brief acknowledges that fixtures willsustain severe damage in a cyclone with a 50-yearrecurrence interval. It goes on to say that the mainquay should be designed to withstand, with only

8/13/2019 Climate Proofing: A Risk-based Approach to Adaptation
http://slidepdf.com/reader/full/climate-proofing-a-risk-based-approach-to-adaptation 60/219
33Climate Proofing: A Risk-based Approach to Adaptation
minimal damage, the wave forces associated with acyclone with a 50-year return period. Cyclone waveheights should be based on a 50-year return period,a calculated significant wave height of 10.75 m (10thpercentile wave heights of 13.65 m).
A solid breakwater such as a rock revetment isconsidered unsuitable for the Western Basinbreakwater because of the likely disruption to long-
shore movement, meaning that during a sea surgethe previous wave cannot escape, causing anadditional setup to the level of the top of thebreakwater, potentially causing serious damage. Inorder to ensure that this additional setup does notoccur, the breakwater must be sufficiently permeable to ensure that the previous wave can flow away, restoring the water level. More suitable
Figure VI.8. Location of, and Plan for, the Western Basin of Avatiu Harbor
alternatives are a monolithic breakwater with adegree of permeability that allows secondary routesfor seawater to escape from the harbor, or concretearmor units such as “coastal protection energy dissipators” (COPEDs), or tetrapods.
The Western Basin is being developed in stages,based on demand and commensurate withdevelopment of the fishing industry and availability
of funding. The first stage, involving an expenditureof NZ$1 million sourced through a governmentgrant, overseas aid grant, cash reserves, and a loan, was for a wharf facility without added protectionagainst storms over what is provided by an existing breakwater. Even this level of protection, however,is considered to be considerably greater than thatprovided to boats moored in Avatiu Harbor.
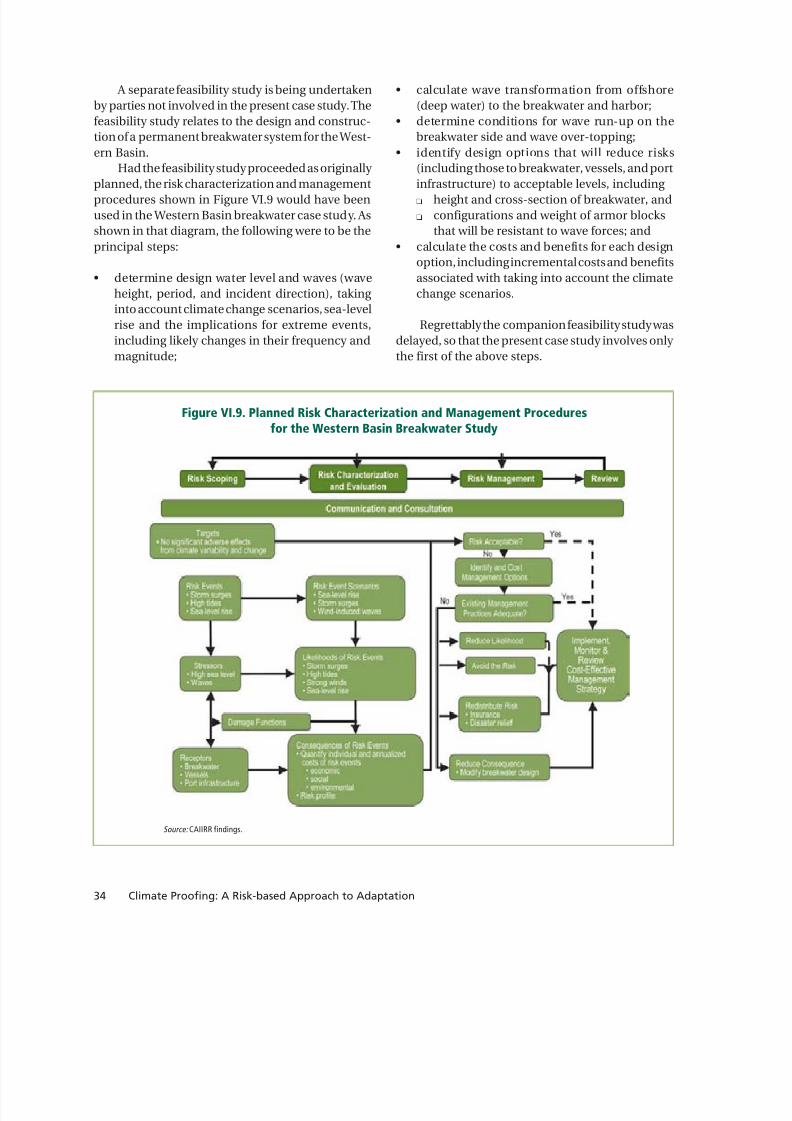
8/13/2019 Climate Proofing: A Risk-based Approach to Adaptation
http://slidepdf.com/reader/full/climate-proofing-a-risk-based-approach-to-adaptation 61/219
Climate Proofing: A Risk-based Approach to Adaptation34
A separate feasibility study is being undertakenby parties not involved in the present case study. Thefeasibility study relates to the design and construc-tion of a permanent breakwater system for the West-ern Basin.
Had the feasibility study proceeded as originally
planned, the risk characterization and managementprocedures shown in Figure VI.9 would have beenused in the Western Basin breakwater case study. Asshown in that diagram, the following were to be theprincipal steps:
• determine design water level and waves (waveheight, period, and incident direction), taking into account climate change scenarios, sea-levelrise and the implications for extreme events,including likely changes in their frequency andmagnitude;
• calculate wave transformation from offshore(deep water) to the breakwater and harbor;
• determine conditions for wave run-up on thebreakwater side and wave over-topping;
• identify design options that will reduce risks(including those to breakwater, vessels, and port
infrastructure) to acceptable levels, including height and cross-section of breakwater, andconfigurations and weight of armor blocksthat will be resistant to wave forces; and
• calculate the costs and benefits for each designoption, including incremental costs and benefitsassociated with taking into account the climatechange scenarios.
Regrettably the companion feasibility study wasdelayed, so that the present case study involves only the first of the above steps.
Figure VI.9. Planned Risk Characterization and Management Proceduresfor the Western Basin Breakwater Study
Source: CAIIRR findings.

8/13/2019 Climate Proofing: A Risk-based Approach to Adaptation
http://slidepdf.com/reader/full/climate-proofing-a-risk-based-approach-to-adaptation 62/219
35Climate Proofing: A Risk-based Approach to Adaptation
Figure VI.10 illustrates the linkages betweenclimate change, tropical cyclones, coastal impacts,and decision information for risk designs. The black parts refer to the cyclone-generated sea conditions,the blue parts to the components of elevated sealevel and runup that impact coastal areas, the yellow
parts to the key parameters of climate change thataffect those relationships, and the orange parts tothe major inputs to risk design for adaptation.
For the Western Basin breakwater, the challenge was to provide assessments of possible futurechanges in i) cyclone intensity, as translated tochanges in significant wave height, H S; and ii) meansea level, as a component of change in total waterelevations during cyclones. As suggested by Figure
VI.10, these changes would provide input for climateproofing the design of the breakwater.
As shown below, the resulting calculations builton the substantial foundation of past engineering reports related to coastal protection in the study area.
Changes in Significant Wave Height
The relationship between maximum windspeed and significant wave height for a given returnperiod was determined using past studies of tropicalcyclone risks for the study area. The results areshown in Table VI.7. In this table the relationshipbetween maximum cyclone wind speed (in m s -1)
Figure VI.10. Linkages Among Climate Change, Tropical Cyclones, Coastal Impacts,and Adaptation Measures
Main Components: Black Lettering = cyclone-generated sea conditions; Dark green lettering = elevated sea levels and run-up that impact coastal areas;green lettering = key parameters of climate change that affect those relationships; and orange lettering = major inputs to risk design for adaptation.Source: CAIIRR findings.

8/13/2019 Climate Proofing: A Risk-based Approach to Adaptation
http://slidepdf.com/reader/full/climate-proofing-a-risk-based-approach-to-adaptation 63/219
Climate Proofing: A Risk-based Approach to Adaptation36
and return period (years) is based on the work of Kirk (1992), who developed the following relationship:
U1.899 = 1,456.265 + 2,046.05 Log Y
The relationship is based on the observational
wind– speed change. The first related a change in wind speed to the corresponding degree of global warming, subsequently scal ing this ratio by thetime-dependent projection of global temperaturechange, viz.:
U t-1990 =( U2x / T2x ).*. U t-1990
where
t = future year of the scenario,U = wind speed change (m s -1),T = global mean temperature change,T2x = global temperature change under
equivalent doubling of atmosphericCO2, and
U2x = wind speed change under equivalentdoubling of atmospheric CO 2.
In order to generate a maximum cyclone windspeed for some future time t, the observed windspeed was perturbed by this change, viz:
U t= Ut * Uobs
where
Uobs is the observed maximum cyclone windspeed.
To implement this method, a value for U2x
/ T2x was required . Henderson-Seller s et al . (1998)
estimate an increase of 10–20% in cyclone intensity based on maximum potential intensity models, butunfortunately do not provide an indication of thecorresponding global temperature change. IPCC(Giorgi and Hewitson, 2001) estimates 5–10%, butagain fail to give a corresponding global temperaturechange. In reviewing the literature, Lal (2002)concludes that cyclone intensities are projected toincrease by 10–20% for a 2–4° increase in sea-surfacetemperature.
In light of these findings, a range of 2.5–10%increase in cyclone intensity per degree of warming was used to implement the first of the two methods.This information was incorporated into SimClim asthree options for cyclone intensity change (low, mid,and high), as were the relationships betweenmaximum cyclone wind speed, significant waveheight, and return periods based on observational
Table VI.7. Relationship BetweenWind Speed and Significant Wave Height
for Given Return Periods for theAvatiu Harbour Area
Climate Proofed Design
Wind speed Wave Height, Hs(ms-1) (m)
2 28.5 2.34
5 33.9 5.5410 37.5 7.3713 38.8 8.1025 41.9 9.4050 44.9 10.75
100 47.8 11.98
Source: JICA 1994.
ReturnPeriod(years)
record and presumably represents “current” climate. As previously noted, however, the historical recordsuggests that the frequency and intensity of cyclonesin the vicinity of Rarotonga are increasing.
For the present study, consideration was givento the impacts of global warming on changes incyclone intensity and, hence, significant waveheights. The literature is equivocal regarding the way in which global warming will affect cyclone fre-quency and intensity. Various methods and studies yield different answers, but with some indicationthat changes in intensity could be region specific.Nonetheless, a major review conducted by a panelof the world’s leading experts on the subject con-cluded that tropical cyclone intensities (as mea-
sured by maximum cyclone wind speed) are apt toincrease as a result of global warming (Henderson-Sellers et al. 1998). This view was confirmed in themost recent Intergovernmental Panel on ClimateChange (IPCC) assessment report (Giorgi andHewitson 2001).
For the present case study, two methods wereused to generate time-dependent scenarios of

8/13/2019 Climate Proofing: A Risk-based Approach to Adaptation
http://slidepdf.com/reader/full/climate-proofing-a-risk-based-approach-to-adaptation 64/219
37Climate Proofing: A Risk-based Approach to Adaptation
data. The options were linked to the SimClimscenario generator. Using SimClim, the following parameter values were selected to create the scenariofor the future change in significant wave height:
• future year : 2065 (in keeping with the
specifications that the breakwater should behave a 60-year design life and assuming construction in 2005);
• cyclone intensity change per degree of global warming: mid-range value;
• emission scenario: SRES A2;• climate sensitivity: best judgment; and• risk design: 50-year return period (in keeping
with the given specifications).
The results are presented in Figure VI.11. Undercurrent climate conditions, the 50-year significant wave height is estimated to be about 10.8 m. Underthe climate projected for the year 2060, the 50-yearsignificant wave height increases to about 12.0 m.
The second method was based on daily maximum wind speed for the GCM grid that includesRarotonga, as estimated by the Canada Climate
Modelling Centre GCM2, using the A2 emissionscenario and best judgment of model sensitivity.
While the GCM data show changes in themaximum wind speed over time (1961–2100), spatialsmoothing of the data means that the valuesunderestimate the extreme wind speed at a specific
location. Consequently, the GCM output was scaledso that the maximum speed estimated for the 1972–1998 period (16.7 m s -1) coincided with the maximumgust observed over the same period at Rarotonga(42.4 m s -1). While land-based measurements of windspeed will normally underestimate the wind speedin the adjacent open waters, no further adjustmentto the data was made due to the fact that the tropicalcyclone generating the maximum wind gust of 42.4m s -1 passed directly over Rarotonga. Moreover, the wind gauge that measured this gust is in a very exposed location only a few meters from the coastof the island towards which the cyclone tracked.
Table VI.8 presents the same information asTable VI.7, but also includes the return periods basedon an analysis of the observed maximum hourly wind gust data and the adjusted GCM wind speeddata.
Figure VI.11. Results of Significant Wave Height Calculations, Using SimClim
Source: CCAIRR findings.

8/13/2019 Climate Proofing: A Risk-based Approach to Adaptation
http://slidepdf.com/reader/full/climate-proofing-a-risk-based-approach-to-adaptation 65/219
Climate Proofing: A Risk-based Approach to Adaptation38
Table VI.8. Estimates of Return Periods for Given Wind Speeds
Return Period (yr)
Wind Speed Kirk (1992) Observed GCM Based Maximum Wind Speed Data(m/sec) (1972–1998) 1961–1990 1991–2020 2021–2050
28.5 2 2 1 1 133.9 5 5 2 2 237.5 10 11 3 4 438.8 13 14 5 5 641.9 25 29 18 16 1444.9 50 57 60 45 3147.8 100 113 120 95 64
GCM = global climate model.Sources: Kirk and Dorrell 1992, CCAIRR findings.
Zi,t-1990 = Zg, t-1990 x Zr, t-1990
whereZi,t-1990 is the projected sea level change (in
cm) at location i, from 1990 to future year t;
Zg, t-1990 is the change in global mean sea level(in cm) as projected by simplerclimate models for a given emissionsscenario and, as reported, for
example, in IPCC (2001);Zr, t-1990 is the change in regional sea level (inmm) pertaining to location i, as pro- jected by a GCM;
Z2x is the global mean sea-level change(in mm) for an equivalent doubling of atmospheric carbon dioxide concen-tration (or, for transient runs of GCMs,the global mean value as averagedover the last several decades of theGCM simulation); and
Znc, t-1990 is the local, nonclimate-related
change in sea level, usually due to ver-tical land movements that affect rela-tive sea level.
The above calculations were undertaken using SimClim. The sea level projections include both a
Strong agreement can be seen between thereturn period estimates of Kirk and those based onobserved data (even though they are not necessarily cyclone-related), suggesting that the Rarotongaanemometer provides extreme gust estimates thatare reasonably representative of open waterconditions. Comparison of the return periodestimates for the 1961–1990 GCM data with theobserved data also reveals good agreement, thoughthe GCM data tend to show slightly shorter returnperiods for lower extreme wind speeds and slightly longer return periods for higher extreme windspeeds.
Arguably the most important finding arising from this analysis is the suggestion that over thecoming 50 years or so the return periods for the mostextreme wind speeds will shorten significantly, by approximately half by 2050.
Sea-Level Change
Regardless of the method used to estimate the
current and projected significant wave heights witha 50-year return period, the risk of damage to thebreakwater in the future will also be influenced by changes in mean sea level. The following method was used to estimate the change in sea level as aconsequence of global warming.
[ ]+ Znc, t-1990Z2x

8/13/2019 Climate Proofing: A Risk-based Approach to Adaptation
http://slidepdf.com/reader/full/climate-proofing-a-risk-based-approach-to-adaptation 66/219
39Climate Proofing: A Risk-based Approach to Adaptation
regional component based on the Canadian GCMresults and a local component based on trends inmean sea level as estimated from tide gauge data. After accounting for the climate-related rise, a localtrend of about 1.7 mm yr -1 seems to be observed,most probably related to vertical land movement.
The resulting projections of sea-level rise, basedon the SRES A2 scenario, are shown in Figure VI.12.For this scenario, by the year 2060 mean sea level isprojected to be 50 to 80 cm higher than today.
Figure VI.12. Projected Values of Sea-levelRise for Rarotonga, Relative to the Current
Mean Sea Level
Note: Green, orange, and blue lines show estimates for high, best judgmentand low levels of model sensitivity, respectively.Source: CCAIRR findings.
Table VI.9Estimated Wave Run-up Elevation for ConditionsRepresentative of Cyclone Sally for a Coastal
Segment Adjacent to Avatiu Harbor, withFuture Sea-level Rise Added (Current Return
Period of Approximately 13 Years)
Elevation (m)
Significant Wave Height 8.1Tide 0.4Barometric Effect 0.3Wind Set-Up 0.16Wave Set-Up 1.35Surf Beat 0.7Wave Height and Run-Up Height 2.99Sea-Level Rise 0.5Total Run-up Elevation 6.4Rate of Overtopping (tons per minute) 2,500
Source: JICA 1994 and Dorrell (personal communication).
F. Case Study Three: Climate ProofingAvatiu-Ruatonga, a communityinland from Avatiu Harbor,Cook Islands
The community of Avatiu-Ruatonga is locatedon the northern coast of Rarotonga, between thenational capital of Avarua and the internationalairport. The main port for the Cook Islands is located within the study area. Figure VI.13 shows the locationof the study area, land elevations, and locations of residential commercial and other structures.
Except in the vicinity of Avatiu Harbour, the landconsists of a narrow coastal reef flat and a narrow beach ridge (elevation 3–4 m). Behind the beachridge is lower-lying land, much of which is swamp,
and part of which is used to grow taro. At thesouthern boundary of the study area the land beginsto rise steeply; in the southeastern portion of thestudy area elevations are already above 9 m. The landfurther to the south forms the steep catchments of the streams that flow into the study area anddischarge into the ocean just to the east of AvatiuHarbour.
In summary, when climate proofing the designof a breakwater, two of the key considerations are (i)how global warming will affect changes in cycloneintensity and frequency (and hence changes in thereturn periods of design wind speeds and of significant wave heights), and (ii) mean sea-levelchange. An example of the design calculations thatare dependent on such estimates is given in Table VI.9.
The brief for the development of the Western
Basin indicates that the breakwater should bedesigned for a nominal design life of 60 years. Giventhis specified design life, the preceding projectionsof return periods for extreme winds (and hencesignificant wave heights), and of sea-level rise, thebreakwater design should be based on a significant wave height of at least 12 m and allow for a sea-levelrise of at least 0.5 m.

8/13/2019 Climate Proofing: A Risk-based Approach to Adaptation
http://slidepdf.com/reader/full/climate-proofing-a-risk-based-approach-to-adaptation 67/219
Climate Proofing: A Risk-based Approach to Adaptation40
buildings are three in number and joint government-commercial two. There are several bulk liquid storagetanks. Collectively, all structures have an estimatedreplacement value of NZ$47,750,000 .
Most of these structures are located on higherland, the exceptions being the port buildings and the
predominantly residential buildings located inlandfrom the harbor. Some of the latter are built on land with elevations at or just below sea level. Many of these structures, and others in adjacent low-lying areas, are flooded as a result of heavy rainfall eventsand/or high sea levels. The latter are usually relatedto storm surge events, which also damage structuresat higher elevations close to the coast.
The remainder of this section will elaborate onthe likelihood components of these specific risk events and subsequently describe in detail theassociated consequence components, as well as thecosts and benefits of implementing a number of risk reduction measures (i.e., adaptation).
Other climate-related risks identified during risk analysis were drought, strong winds, andoutbreaks of infectious diseases associated withadverse weather conditions. These will be addressedas part of the third Cook Islands case study sincesuch risks are best characterized and managed atisland or national scale.
Flooding Associated with Heavy Rainfall Events
Hourly rainfall data at the Rarotonga Aero long-term weather station (located near the coast at the western end of the airport runway) for the period1970–1979 were used to estimate the likelihood of heavy rainfall events associated with flooding in thestudy area. These data were adjusted to representthe rain falling over the catchments, which have atotal area of 1.35 km 2. The multiplier was based onthe relationship between the long-term mean
rainfall at Rarotonga Aero) and that measured at ashort-term monitoring site in the upper catchment.Rainfall totals over 2-hour periods were analyzed,reflecting the time of concentration for the AvatiuStream.
Likelihoods for 2-hourly rainfall totals of 140and 200 mm were determined for both the presentand for 2050. For the latter projections the CSIRO
Figure VI.13: Location of the Avatiu-RuatongaStudy Area, showing (Lower Figure)
Land Elevations and Locations of the221 Structures
Source: CCAIRR findings.
The resident population of 396 occupies 127dwellings. In addition, there are 9 unoccupieddwellings, 64 commercial buildings, 10 community buildings, and 6 storage facilities. Government

8/13/2019 Climate Proofing: A Risk-based Approach to Adaptation
http://slidepdf.com/reader/full/climate-proofing-a-risk-based-approach-to-adaptation 68/219
41Climate Proofing: A Risk-based Approach to Adaptation
area into the harbor. The level of flooding upstreamof the Main Road bridge was estimated based on thedifference between stream flows and the bridge’scapacity. The “storage” volume of the swamp area was calculated using the DEM data , al lowing flooding levels to be estimated by calculating the
volume of water discharged into this area less theestimated volume being discharged to the harbor.
Initial runoff parameters in the model weredetermined using recorded rainfall and stream flow data from the Avatiu site. Validation of the model was undertaken by comparing model outputs withobserved flood extent and depths for the last majorrainstorm to affect the area. This was on January 8,2001. Total storm rainfall was 293.8 mm over aperiod of 14.5 hours. Analyses indicated that thepeak two-hour intensity of this storm (the time of concentration for the catchment) has an annualrecurrence interval of between 1 and 2 years, underpresent conditions.
The spatial extent of flooding as observed in2001, as well as the model-based estimate of theextent of flooding resulting from an event of thismagnitude, is shown in Figure VI.15. In general, agood agreement is observed across the study area.
At present, a 2-hour precipitation total of 200mm has a return period of around 12 years. By 2050,however, the return period is projected to decreaseto only 7 years. Or, stating it another way, by 2050the 2-hour precipitation total with a return periodof about 12 years is projected to be 236 mm.
As shown in Figure VI.16, both the area floodedand the depth of flooding increase for this 236-mmevent. The area flooded has increased from 355,000m 2 to 371,000 m 2 and the maximum flood depth from1.6 m to 1.7 m.
However, the full consequences of the increasedlikelihood of more frequent and intense rainstormscan be seen when the impacts of all the changes inthe precipitation regime are integrated over, say, thenext 50 years (Table VI.10).
It is apparent that the Avatiu-Ruatonga area isalready experiencing high damage costs as a resultof extreme rainfall events. These will be exacerbatedby climate change, and also by an airport extensionthat has also been proposed, unless flood reductionmeasures are put in place.
The model was also used to identify the key hy-draulic controls on the flooding being experienced
Figure VI.14. Likelihood of Two-hour RainfallTotals of at Least 140 mm and 200 mm for thePresent and for 2050, for Given Time Horizons
mm = millimetersSource: CCAIRR fi ndings.
GCM with SRES A1B emission scenario and best judgment of model sensitivity, was used. Comparedto a number of other GCMs, the CSIRO modelverifies more favorably in the South Pacific region.
Figure VI.14 shows that 140 mm of rain over a2-hour period is highly likely under current
conditions and is comparatively insensitive to theglobal warming projected to occur over the next 50 years. Annual recurrence intervals are 3 and 2.5 years, respectively. By contrast, 200 mm of rain overa 2-hour period is at present a relatively rare event, with an annual recurrence interval of 12 years.Global warming makes a significant difference to thelikelihood, especially for time horizons between 5and 30 years. The annual recurrence interval for thisscenario is 7 years.
Using a combination of information fromtopographic maps and a digital elevation model
(DEM), a basic Excel spreadsheet-based floodmodel was developed for the Avatiu-Ruatonga casestudy area. This model used the Rational Method toestimate flows in the Avatiu Stream and in two otherminor streams running into the study area. Thedischarge capacity of the bridge under the MainRoad was calculated, as well as the capacity of a 900-mm pipe that drains part of the low-lying swamp

8/13/2019 Climate Proofing: A Risk-based Approach to Adaptation
http://slidepdf.com/reader/full/climate-proofing-a-risk-based-approach-to-adaptation 69/219
Climate Proofing: A Risk-based Approach to Adaptation42
mm = millimeters.Note: Calculated flood depths greater than 1 m are shown in red; thoseless than 1 m are shown in brown.Source: CCAIRR findings.
Figure VI.15. Calculated (Top) and ObservedAreal Extent (Bottom) of Flooding Associated
with the Rainstorm of January 8, 2001
mm = millimetersSource: CCAIRR findings.
Figure VI.16. Flooded Areas and Depths for a2-Hour Rainstorm with a Return Period of
12 years, for the Present and for 2050

8/13/2019 Climate Proofing: A Risk-based Approach to Adaptation
http://slidepdf.com/reader/full/climate-proofing-a-risk-based-approach-to-adaptation 70/219
43Climate Proofing: A Risk-based Approach to Adaptation
Table VI.10. Projected Costs of Flooding for Avatiu-Ruatonga, as aConsequence of All Heavy Rainfall Events Occurring over the Period Indicated
(NZ$ million)
No Climate Change With Climate Change With Airport ExtensionDiscount Rate Discount Rate Discount Rate
0% 3% 0% 3% 0% 3%
To 2050 23.77 13.04 25.52 13.72 26.94 14.77To 2100 49.06 16.38 66.85 18.64 55.60 18.56
Note: Damage cost calculations for airport extension assume no climate change and a 75% reduction in the swamp water storage capacity.Source: CCAIRR findings.
Figure VI.17: The Study Area, showingLocations of Key Hydraulic Controls on the
Flooding
Note: Left red circle: location where water is diverted into the swamp; centerred circle: sports field drain; right red circle: bridge where the main roadcrosses Avatiu Stream.Source: CCAIRR findings.
in Avatiu-Ruatonga. These were found to be thecapacity of
• the bridge where the Main Road crosses AvatiuStream;
• the drain from the sports field to Avatiu Harbour;and
• the drain along the south side of the airport: when the flow exceeds the drain capacity, somerunoff is diverted into the swamp in order toavoid flooding the airport runway (Figure VI.17).
Costs determined for realistic increases in theflow capacity at these control points were as follows:
• Excavate the stream bed over a distance of 150m above and below the bridge. The cost isNZ$1,620 for every meter the stream bed isdeepened and is assumed to be recurring every 3 years. Additional costs may be incurred if damage prevention is needed due to increasedflow velocities when the stream is in flood.
• Increase size of the culvert between the sports fieldand the harbor. The cost is NZ$64,286 for a 1.2–
diameter culvert and NZ$78,571 for a 1.4–diameterculvert.• Build a larger bridge at western end of the
airfield. This will increase the cross sectional areafrom 4.62 m to 16.8 m at a cost of NZ$140,000.
The cost effectiveness of each of theseadaptation options was investigated in turn. The
results are presented in Table VI.11 and show a highbenefit-cost ratio for deepening the stream bed,even under present conditions. Thus this adaptationqualifies as a “no regrets” adaptation initiative.
Another approach to reducing damage costs isto introduce changes to the building code, and toland use planning and environmental impact
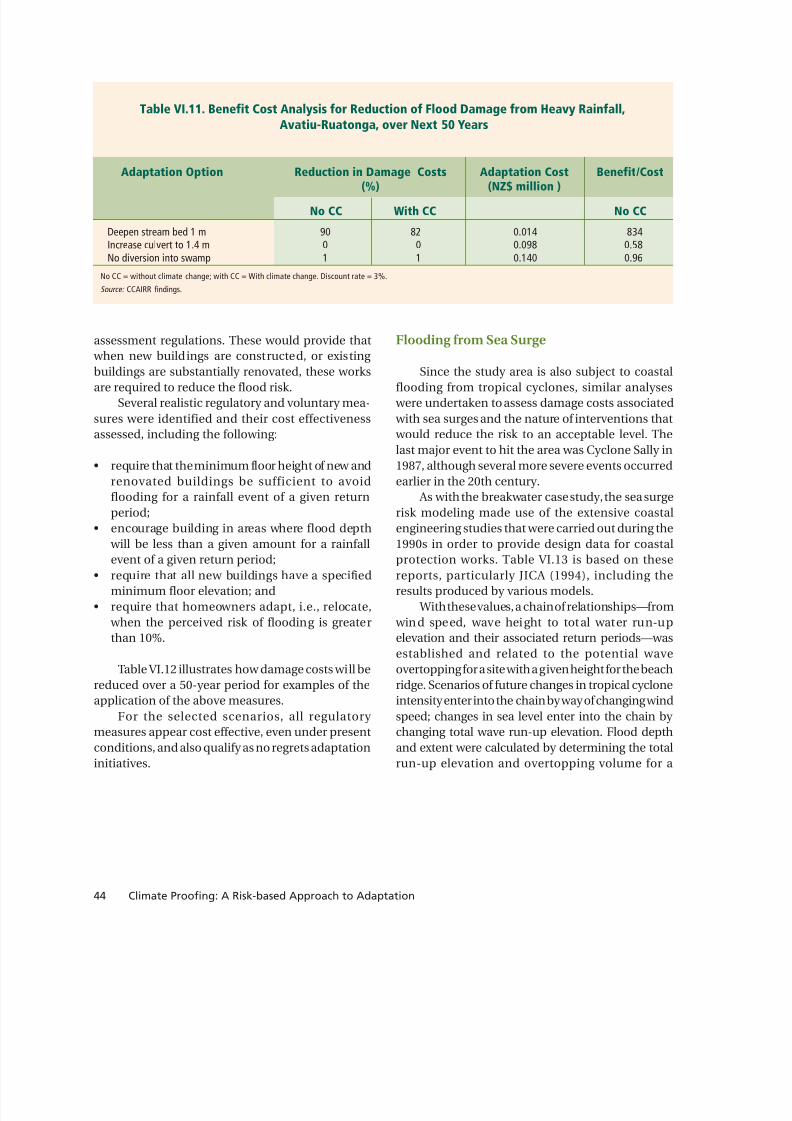
8/13/2019 Climate Proofing: A Risk-based Approach to Adaptation
http://slidepdf.com/reader/full/climate-proofing-a-risk-based-approach-to-adaptation 71/219
Climate Proofing: A Risk-based Approach to Adaptation44
Table VI.11. Benefit Cost Analysis for Reduction of Flood Damage from Heavy Rainfall,Avatiu-Ruatonga, over Next 50 Years
Adaptation Option Reduction in Damage Costs Adaptation Cost Benefit/Cost(%) (NZ$ million )
No CC With CC No CC
Deepen stream bed 1 m 90 82 0.014 834Increase culvert to 1.4 m 0 0 0.098 0.58No diversion into swamp 1 1 0.140 0.96
No CC = without climate change; with CC = With climate change. Discount rate = 3%.Source:CCAIRR findings.
assessment regulations. These would provide that when new buildings are constructed, or existing buildings are substantially renovated, these worksare required to reduce the flood risk.
Several realistic regulatory and voluntary mea-sures were identified and their cost effectivenessassessed, including the following:
• require that the minimum floor height of new andrenovated buildings be sufficient to avoidflooding for a rainfall event of a given returnperiod;
• encourage building in areas where flood depth will be less than a given amount for a rainfallevent of a given return period;
• require that all new buildings have a specifiedminimum floor elevation; and
• require that homeowners adapt, i.e., relocate, when the perceived risk of flooding is greaterthan 10%.
Table VI.12 illustrates how damage costs will bereduced over a 50-year period for examples of theapplication of the above measures.
For the selected scenarios, all regulatory
measures appear cost effective, even under presentconditions, and also qualify as no regrets adaptationinitiatives.
Flooding from Sea Surge
Since the study area is also subject to coastalflooding from tropical cyclones, similar analyses were undertaken to assess damage costs associated with sea surges and the nature of interventions that would reduce the risk to an acceptable level. Thelast major event to hit the area was Cyclone Sally in1987, although several more severe events occurredearlier in the 20th century.
As with the breakwater case study, the sea surgerisk modeling made use of the extensive coastalengineering studies that were carried out during the1990s in order to provide design data for coastalprotection works. Table VI.13 is based on thesereports, particularly JICA (1994), including theresults produced by various models.
With these values, a chain of relationships—from wind speed, wave height to total water run-upelevation and their associated return periods—wasestablished and related to the potential waveovertopping for a site with a given height for the beachridge. Scenarios of future changes in tropical cycloneintensity enter into the chain by way of changing windspeed; changes in sea level enter into the chain by
changing total wave run-up elevation. Flood depthand extent were calculated by determining the totalrun-up elevation and overtopping volume for a

8/13/2019 Climate Proofing: A Risk-based Approach to Adaptation
http://slidepdf.com/reader/full/climate-proofing-a-risk-based-approach-to-adaptation 72/219
45Climate Proofing: A Risk-based Approach to Adaptation
Table VI.12. Cost and Consequent Change in Damage Costs for SelectedRegulatory and Voluntary Measures, for New/Renovated Buildings Only, Over Next 50 Years
Direct Cost ofIntervention(NZ$ million)
Change in Damage Costs
No Climate Change With Climate ChangeMeasure NZ$ million % NZ$ million %
No CC With CC
Require sufficient floor height -1.36 -10.4 -1.53 -11.1 0.34 0.42that no flooding occurs in 25-year storm.1
Encourage new (relocate) building -0.75 -5.8 -0.66 -4.8 Nil Nil(only from aging) where flood depth<0.5 m in 25-year storm.Require new buildings (only from aging) -1.35 -10.6 -1.54 -11.3 Nil Nilto have a minimum floor elevation of 1 m.Require that homeowners relocate -0.85 -6.5 -0.88 -6.4 Nil Nil
when flood risk is greater than 10%(and not from aging).No CC = without climate change; with CC = With climate change. Discount rate = 3%.1 Adaptation cost based on NZ$500 per m2 of floor area per m raised; only for aging properties with longevity of 50 yearsSource: CCAIRR findings.
Table VI.13. Relationships Between Cyclone Parameters and Coastal Risk Parametersfor a Site Representative of a Segment of the Avatiu Coastline
Return Period (yr) Cyclone parameters
Wind speed Wave Height, R-U Elev. O-T Height O-T Vol(m/sec) Hs (m) (m) (m) (m3/sec/m)
2 28.5 2.34 1.92 0.00 0.0005 33.9 5.54 4.54 0.91 0.01610 37.5 7.37 6.04 2.41 0.05013 38.8 8.10 6.64 3.01 0.06425 41.9 9.40 7.71 4.08 0.09450 44.9 10.75 8.81 5.18 0.150100 47.8 11.98 9.84 6.21 0.185
Beach Height: 3.63Note: R-U = run-up; O-T = over-topping; O-T Vol = over-topping volume. Italicized values are interpolated from the adjacent values.Source: JICA 1994.

8/13/2019 Climate Proofing: A Risk-based Approach to Adaptation
http://slidepdf.com/reader/full/climate-proofing-a-risk-based-approach-to-adaptation 73/219
Climate Proofing: A Risk-based Approach to Adaptation46
cyclone with a given return period. The overtopping height was determined as the difference between run-up elevation and the height of the beach ridge. The water was distributed over the study area (downslope) with a negative exponential function, calibrated onthe basis of evidence of the areal extent and depth of
salt water flooding during Cyclone Sally.Figure VI.18 shows the area and depth of
flooding if a 1-in-25-year event occurred today orin 2050. The area modeled for sea surge flooding extends from the western edge of Avatiu Harbor tothe eastern boundary of the larger Avatiu-Ruatongacase study area adjacent to the airport, and inlandfrom the ocean edge.
The damage costs incurred in the area modeledas a result of the ensemble of sea surge eventsprojected to occur over a future time period can alsobe calculated. The method used was analogous tothat used to determine the damage costs fromflooding associated with heavy rainfall eventsoccurring over a specified time period into the future.
Table VI.14 summarizes the key results of thecalculations. It is apparent that sea surges are a majorrisk to structures, infrastructure, and other assets inthe study area, and of course also to the people whoreside and/or work there.
For this case study, too, several realistic
regulatory and voluntary measures were identifiedand their cost effectiveness assessed, including thefollowing:
• require that the minimum floor height of new andrenovated buildings is sufficient to avoid flooding for a rainfall event of a given return period;
• encourage building in areas where flood depth will be less than a given amount for a rainfall eventof a given return period;
• require that all new buildings have a specifiedminimum floor elevation; and
• require that homeowners adapt, i.e., relocate, when the perceived risk of flooding is greaterthan 10%.
Figure VI.18. Depth and Spatial Extent of Flooding from a Sea Surge with aReturn Period of 25 years, for Current Conditions and in 2050
Left = current conditions; right = conditions in 2050.Note: Sea-level rise projections use the Canadian GCM-1 with the A1B emission scenario, best judgment of model sensitivity, and high sensitivity to increase in cycloneintensity. Red is flooding over 5 m, brown is flooding under 5 m, and green is unflooded areas.Source: CCAIRR findings.

8/13/2019 Climate Proofing: A Risk-based Approach to Adaptation
http://slidepdf.com/reader/full/climate-proofing-a-risk-based-approach-to-adaptation 74/219
47Climate Proofing: A Risk-based Approach to Adaptation
Table VI.15. Cost and Consequent Change in Damage Costs for Selected Regulatory and VoluntaryMeasures, for New/Renovated Buildings Only, Over Next 50 Years
Direct Cost of
Intervention(NZ$ million)
Reduction in Damage Costs
No Climate Change With Climate ChangeMeasure NZ$ million % NZ$ million %
No CC With CC
Require sufficient floor height 1.22 4.0 3.11 6.9 1.12 1.20that no flooding occurs in 25-year storm.1
Encourage new (relocate) building 1.20 3.9 1.90 4.0 0 0(only from aging) where flood depth<0.5 m in 25-year storm.Require new buildings (only from aging) 0.98 3.2 1.97 4.1 0 0to have a minimum floor elevation of 1 m.Require that homeowners relocate 0.77 2.5 4.19 8.8 0 0when flood risk is greater than 10%(and not from aging).No CC = without climate change; With CC = with climate change. Discount rate = 3%.1 Adaptation cost based on NZ$500 per m2 of floor area per m raised; only for aging properties with longevity of 50 yearsSource: CCAIRR findings.
Table VI.14. Projected Costs of Sea Surge Flooding of aSelected Area of Avatiu-Ruatonga
(NZ$ million)
No Climate Change With Climate ChangeDiscount Rate Discount Rate
0% 3% 0% 3%
To 2050 56.10 30.77 78.50 40.75To 2100 79.32 26.48 153.56 40.49Source:CCAIRR findings.
Table VI.15 illustrates how damage costs will bereduced over 50 years, for examples where the abovemeasures are applied. All the adaptation interven-tions qualify as no regrets options.
In Table VI.16 a totally unrealistic adaptationmeasure is used to highlight the scale of intervention
that would be required to protect assets if some orall of the above regulatory and voluntary measuresare not implemented. The hypothetical scenarioinvolves building a 5-m-high sea wall at theshoreline, at a cost of NZ$5,000 per meter.
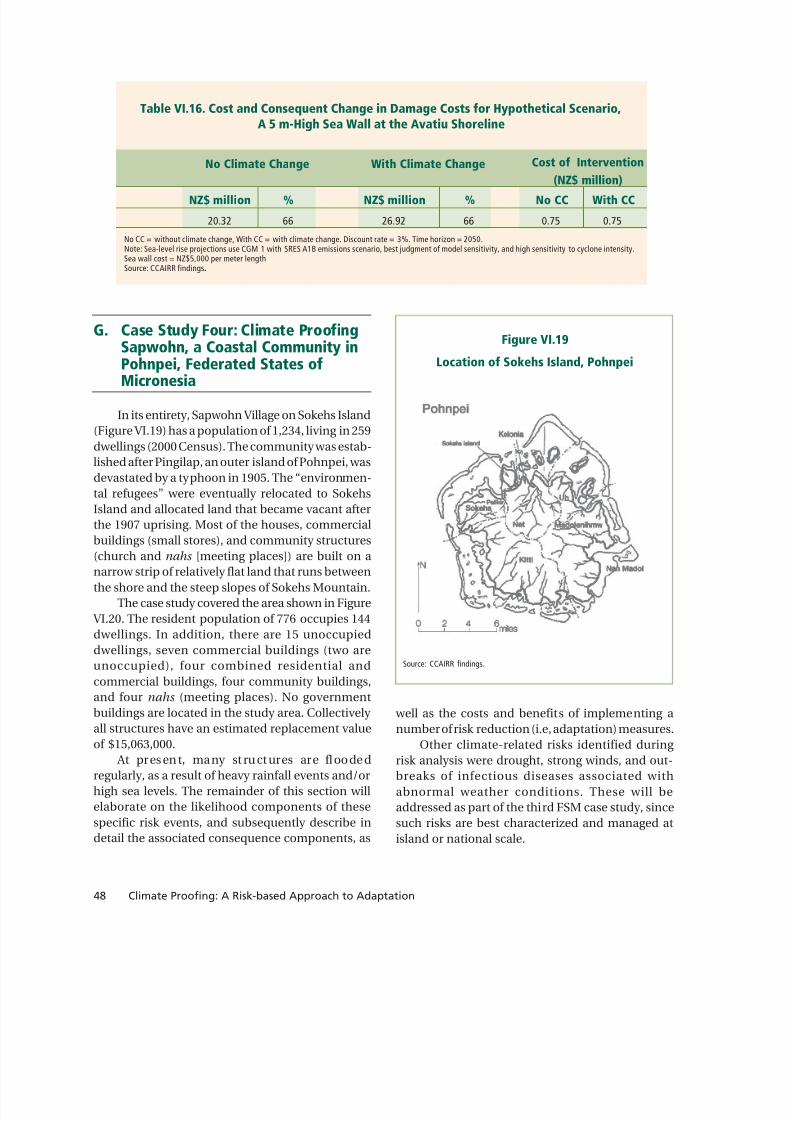
8/13/2019 Climate Proofing: A Risk-based Approach to Adaptation
http://slidepdf.com/reader/full/climate-proofing-a-risk-based-approach-to-adaptation 75/219
Climate Proofing: A Risk-based Approach to Adaptation48
G. Case Study Four: Climate ProofingSapwohn, a Coastal Community in
Pohnpei, Federated States ofMicronesia
In its entirety, Sapwohn Village on Sokehs Island(Figure VI.19) has a population of 1,234, living in 259dwellings (2000 Census). The community was estab-lished after Pingilap, an outer island of Pohnpei, wasdevastated by a typhoon in 1905. The “environmen-tal refugees” were eventually relocated to SokehsIsland and allocated land that became vacant afterthe 1907 uprising. Most of the houses, commercialbuildings (small stores), and community structures(church and nahs [meeting places]) are built on anarrow strip of relatively flat land that runs betweenthe shore and the steep slopes of Sokehs Mountain.
The case study covered the area shown in Figure VI.20. The resident population of 776 occupies 144dwellings. In addition, there are 15 unoccupieddwellings, seven commercial buildings (two areunoccupied), four combined residential andcommercial buildings, four community buildings,and four nahs (meeting places). No governmentbuildings are located in the study area. Collectively all structures have an estimated replacement valueof $15,063,000.
At presen t, many st ruct ures are fl oodedregularly, as a result of heavy rainfall events and/orhigh sea levels. The remainder of this section willelaborate on the likelihood components of thesespecific risk events, and subsequently describe indetail the associated consequence components, as
Table VI.16. Cost and Consequent Change in Damage Costs for Hypothetical Scenario,A 5 m-High Sea Wall at the Avatiu Shoreline
Cost of Intervention
(NZ$ million)
No Climate Change With Climate Change
NZ$ million % NZ$ million % No CC With CC
20.32 66 26.92 66 0.75 0.75No CC = without climate change, With CC = with climate change. Discount rate = 3%. Time horizon = 2050.Note: Sea-level rise projections use CGM 1 with SRES A1B emissions scenario, best judgment of model sensitivity, and high sensitivity to cyclone intensity.Sea wall cost = NZ$5,000 per meter lengthSource: CCAIRR findings.
Figure VI.19
Location of Sokehs Island, Pohnpei
Source: CCAIRR findings.
well as the costs and benefits of implementing anumber of risk reduction (i.e, adaptation) measures.
Other climate-related risks identified during risk analysis were drought, strong winds, and out-breaks of infectious diseases associated withabnormal weather conditions. These will beaddressed as part of the third FSM case study, sincesuch risks are best characterized and managed atisland or national scale.
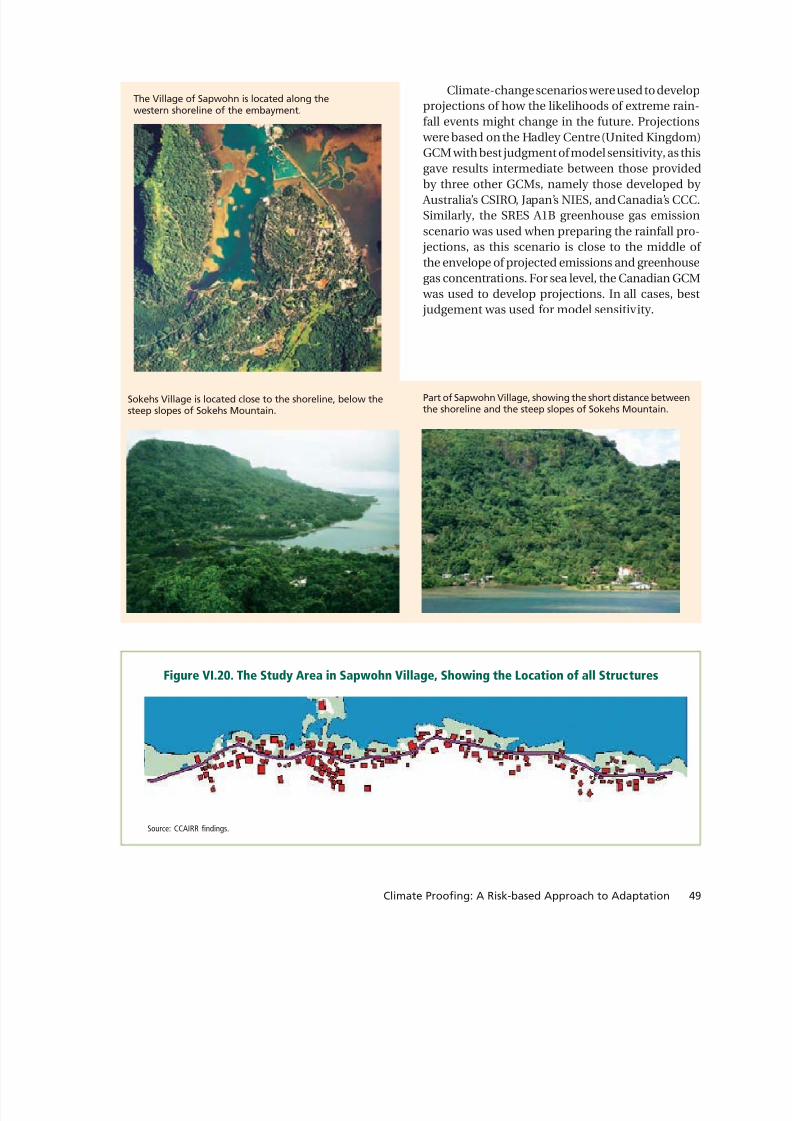
8/13/2019 Climate Proofing: A Risk-based Approach to Adaptation
http://slidepdf.com/reader/full/climate-proofing-a-risk-based-approach-to-adaptation 76/219
49Climate Proofing: A Risk-based Approach to Adaptation
Figure VI.20. The Study Area in Sapwohn Village, Showing the Location of all Structures
Source: CCAIRR findings.
Climate-change scenarios were used to developprojections of how the likelihoods of extreme rain-fall events might change in the future. Projections were based on the Hadley Centre (United Kingdom)GCM with best judgment of model sensitivity, as thisgave results intermediate between those provided
by three other GCMs, namely those developed by Australia’s CSIRO, Japan’s NIES, and Canadia’s CCC.Similarly, the SRES A1B greenhouse gas emissionscenario was used when preparing the rainfall pro- jections, as this scenario is close to the middle of the envelope of projected emissions and greenhousegas concentrations. For sea level, the Canadian GCM was used to develop projections. In all cases, best judgement was used for model sensitivity.
The Village of Sapwohn is located along thewestern shoreline of the embayment.
Part of Sapwohn Village, showing the short distance betweenthe shoreline and the steep slopes of Sokehs Mountain.
Sokehs Village is located close to the shoreline, below thesteep slopes of Sokehs Mountain.

8/13/2019 Climate Proofing: A Risk-based Approach to Adaptation
http://slidepdf.com/reader/full/climate-proofing-a-risk-based-approach-to-adaptation 77/219
Climate Proofing: A Risk-based Approach to Adaptation50
Figure VI.21. Likelihood of an Hourly Rainfallof 200 mm occurring in Pohnpei
within the Indicated Time Horizon (Years)
0 = no chance; 1 = statistical certainty.Source: CCAIRR findings.
0
0.1
0.2
0.3
0.4
0.5
0.6
0.7
0.8
0.9
1
1 5 10 15 20 25 30 35 40 45 50
Time Horizon (y)
L i k e
l i h o o
d
1990
2050
2100
Flooding Associated with Heavy RainfallEvents
Figure VI.21 shows the likelihood of a hourly rainfall of 200 mm occurring within a given timehorizon. The likelihood of such an event will
increase markedly as a result of global warming. While some of the flooding associated with such
heavy rainfall events is due to overtopping of smallchannels that drain the slopes of Sokehs Mountain,most is due to overland flow originating from thehill slopes above the community.
On the basis of the study area’s topography andof the lack of strong channelization of flow, anassumption was made that sheet flow occurs downthe full length of the slope. The study area wasdivided into five subcatchments based around two“gullies.” The subcatchments with gullies wereallocated a greater catchment area as a reflection of the channelization that occurs with these gullies. A
simple Excel-based “conceptual model” wasdeveloped, using first principles (including theRational Method) to estimate flood depths fordifferent segments of the study area. The estimates were based on 1-hour rainfall intensities for givenreturn periods. The model was validated using observed flooding depths associated with a stormin October 2003.
The simple model used in the case study isbased on limited information inputs and has un-dergone very limited ground investigation of possible hydrodynamics within the flood area. Thismodel has been developed to assist in understand-ing how climate change (i.e., changing rainfall
patterns) may alter flood risks, and how adaptationmeasures may reduce unacceptable risks. The mod-eling results should not be used in any way todetermine or estimate precise levels or spatial ex-tent of flooding. More detailed modeling using appropriate hydraulic and hydrodynamic models isrequired if location-specific flood risk estimates areto be derived.
The spatial distributions of flooding for indi-vidual and ensemble rainfall events were estimatedfor the current climate and for scenarios of futureclimate. Consultations with stakeholders identifiedone option to reduce flood depths, namely throughconstructing a diversion channel above the floodarea. The costs and benefits of this potential adap-tation measure have been determined, and aredescribed in detail below. The effectiveness of bothregulatory and voluntary adaptation measures hasalso been assessed.
Figure VI.22 presents estimated depths of flooding in the case study area associated with anhourly rainfall with a return period of 25 years, forcurrent conditions and for 2050. Under currentconditions, the 25-year hourly rainfall (210 mm)results in flooding up to a depth of between 0.4 and0.6 m for most of the area. A small area is flooded toless than 0.2 m. By 2050, the 25-year hourly rainfallis projected to increase to 393 mm. This results in asubstantial increase in flood risk. Maximum flooddepths will be over 1 m, with all areas being floodedto at least 0.2 m.
However, the full consequences of the increasedlikelihood of more frequent and intense rainstormscan be seen when the impacts of all the changes inthe precipitation regime are integrated over, say, the
next 50 years (Table VI.17). While the area is already experiencing highdamage costs as a result of extreme rainfall events, itis apparent that these will be exacerbateddramatically by climate change, even in the next few decades. Measures to reduce the flood risks, andespecially their effectiveness at reducing the risks ina financially sound manner, need to be considered.

8/13/2019 Climate Proofing: A Risk-based Approach to Adaptation
http://slidepdf.com/reader/full/climate-proofing-a-risk-based-approach-to-adaptation 78/219
51Climate Proofing: A Risk-based Approach to Adaptation
contributor to flood risk. Accordingly, the effective-ness of drainage works that would divert this runoff away from the built-up areas was explored. Theeffectiveness of changes to building practices, landuse planning, and environmental impact assess-ment regulations was also investigated. This
included changes to require when new buildings areconstructed, or existing buildings are substantially renovated, the work will include measures to reducethe flood risk.
In addition to the flood diversion option, severalrealistic regulatory and voluntary measures wereidentified and their cost effectiveness assessed,including the following:
• require that the minimum floor height of new andrenovated buildings be sufficient to avoid flooding for a rainfall event of a given return period;
• encourage building in areas where flood depth will be less than a given amount for a rainfallevent of a given return period;
• require that all new buildings have a specifiedminimum floor elevation; and
• require that homeowners adapt, i.e., relocate, when the perceived risk of flooding is greaterthan 10%.
Figure VI.22. Flooded Areas and Depths for a1-Hour Rainstorm with a Return Period of 25years, for Present Day (Left) and 2050 (Right)
Left = present time; right = 22050. Color coding for calculated flood depths:yellow = < 0.2 m, green = 0.2 to 0.4 m, orange = 0.4 to 0.6 m, light brown= 0.6 to 0.8 m, dark brown = 0.8 to 1.0 m; and red = > 1.0 m.Source: CCAIRR findings.
Table VI.17. Projected Costs of Sapwohn Flooding as a
Consequence of Heavy Rainfall($ million)
No Climate Change With Climate ChangeDiscount Rate Discount Rate
0% 3% 0% 3%
To 2050 18.21 9.99 30.84 15.59To 2100 37.59 12.55 90.47 23.01Source:CCAIRR findings.
Consultations with stakeholders, most notably community leaders and residents of the study area,resulted in a number of adaptation measures being identified as potential ways to reduce the flood risk to acceptable levels. Their preference was for “noregrets” options.
The flood modeling confirmed that runoff fromthe steep slopes above the community is a major
Table VI.18 illustrates how damage costs will bereduced over a 50-year period for examples of theapplication of the above measures.
For the selected scenarios, both the diversion works and the regulatory measures qualify as “noregrets” interventions, including being cost effective.

8/13/2019 Climate Proofing: A Risk-based Approach to Adaptation
http://slidepdf.com/reader/full/climate-proofing-a-risk-based-approach-to-adaptation 79/219
Climate Proofing: A Risk-based Approach to Adaptation52
Table VI.18. Cost and Consequent Change in Damage Costs for Selected Regulatoryand Voluntary Measures over Next 50 Years
Change in Damage Costs
No Climate Change With Climate ChangeMeasure $ million % $ million %
No CC With CC
Divert 50% of runoff from a 25-year storm at -4.08 -4.1 -8.34 -53 0.87 1.62US$10 per cubic meterRequire sufficient floor height -1.64 -16 -3.92 -25 0.44 0.94that no flooding occurs in 25-year storm.1
Encourage building where flood depth is -1.02 10 4.1 -25 Nil Nil<0.5 m in 25-year storm.Require that all buildings have a minimum -2.23 -22 -0.89 -7floor elevation of 1 m.
Require that homeowners relocate 8.62 86 21.58 172 8.62 21.58when flood risk is greater than 10%.No CC = without climate change; with CC = with climate change. Discount rate = 3%. Adaptation cost based on $100 per m2 of floor area per m raised; only for agingproperties with longevity of 50 years.No CC = without climate change, With CC = with climate change.Source: CCAIRR findings.
Direct Cost ofIntervention
($ million)
It is instructive to consider the incrementalcosts of the adaptation measures. Table VI.19highlights these, and compares them to theincremental benefits of undertaking adaptation.
In both cases, climate change will imposesignificant incremental costs on the community, butthe incremental benefits of addressing the increasedrisks attributable to climate change are larger, by atleast a factor of four.
Flooding from High Sea Levels
The study area is also subject to coastal flooding resulting from high tides. Rarely are these aconsequence of a tropical cyclone (typhoon). Ratherthe high ocean water levels are usually associated with king tides, strong onshore winds, and the LaNiña phase of ENSO.
Similar analyses to those for rainfall-inducedflooding were undertaken in order to assess both the
Table VI.19. Incremental Costs and Benefits of Selected Adaptation Measures($ million)
Incremental Benefit Incremental Cost
Divert 50% of runoff from a 25-year storm at $10 per cubic meter 4.52 0.75Minimum floor height such that no flooding in 25-year storm1 2.28 0.50Discount rate = 3%.1 Adaptation cost based on $100 per m2 of floor area per m raised; only for aging properties with longevity of 50 years.Source: CCAIRR findings.

8/13/2019 Climate Proofing: A Risk-based Approach to Adaptation
http://slidepdf.com/reader/full/climate-proofing-a-risk-based-approach-to-adaptation 80/219
53Climate Proofing: A Risk-based Approach to Adaptation
damage costs associated with high sealevels and the nature of interventionsthat would reduce the risk to anacceptable level.
Figure VI.23 shows the area anddepth of flooding if a 25-year event
occurred today or in 2050.The damage costs arising within
the area modeled as a result of theensemble of high sea-level eventsprojected to occur over a future timeperiod can also be calculated. Themethod used is analogous to that usedto determine the damage costs fromflooding associated with heavy rainfall eventsoccurring over a specified time period into thefuture. Table VI.20 summarizes the key results of these calculations.
It is apparent that high sea levels (including high tides) present a significant risk to structures,infrastructure, and other assets in the study area,and of course also to the people who reside and/or work there.
In this case study, too, several realistic regulatory and voluntary measures were identified and theircost effectiveness assessed. The measures included:
• requiring that the minimum floor height of new and renovated buildings be sufficient to avoidflooding for a storm surge event of a given returnperiod;
• encouraging building in areas where flood depth will be less than a given amount for a storm surgeevent of a given return period;
• requiring that all buildings have a specifiedminimum floor elevation; and
• requiring homeowners to adapt when theperceived risk is greater than 10%.
Residents of Sapwohn Village are already implementing some of these measures on a voluntary basis, as is shown in the photos on page 54.
Table VI.21 illustrates how damage costs will bereduced over a 50-year period for examples of theapplication of the above measures.
For the selected scenarios all measures qualify as “no regrets” adaptation initiatives, including being cost effective.
Figure VI.23. Spatial Extent of Flooding(Shown in Red) from High Sea Level with a
Recurrence Interval of 25 Years
Current conditions (left): maximum depth 2.3 m; in 2050 (right): maximumdepth 2.6 m.Source:CCAIRR findings.
Table VI.20. Projected Costs of Flooding ofSapwohn Village as a Result of High Sea Levels
($ million)
No Climate Change With Climate ChangeDiscount Rate Discount Rate
0% 3% 0% 3%
To 2050 10.04 5.51 10.54 5.72To 2100 20.72 6.92 23.34 7.38Source: CCAIRR findings.

8/13/2019 Climate Proofing: A Risk-based Approach to Adaptation
http://slidepdf.com/reader/full/climate-proofing-a-risk-based-approach-to-adaptation 81/219
Climate Proofing: A Risk-based Approach to Adaptation54
A raised threshold prevents damage from minor floodingeven though the floor of the dwelling is at ground level.
A recently constructed house in an area of high flooding riskhas its living space elevated well above ground level.
Table VI.21. Cost and Consequent Reduction in Damage Costs for Selected Regulatoryand Voluntary Measures, for New/Renovated Buildings Only, over the Next 50 Years
Reduction in Damage Costs
No Climate Change With Climate ChangeMeasure $ million % $ million %
No CC With CC
Require sufficient floor height that no flooding 1.79 34 1.88 35 0.02 0.02occurs in 25-year storm.1
Encourage new (relocate) building 0.58 11 0.63 12 Nil Nil(only from aging) where flood depth<0.5 m in 25-year storm.Require new buildings (only from aging) 1.79 34 1.88 35 Nil Nilto have a minimum floor elevation of 1 m.Require that homeowners relocate 0.58 11 0.63 12 Nil Nilwhen flood risk is greater than 10%(and not from aging).No CC = without climate change; With CC = with climate change. Discount rate = 3%.1 Adaptation cost based on $100 per m2 of floor area per m raised; only for aging properties with longevity of 50 yearsSource: CCAIRR findings.
Direct Cost ofIntervention
($ million)

8/13/2019 Climate Proofing: A Risk-based Approach to Adaptation
http://slidepdf.com/reader/full/climate-proofing-a-risk-based-approach-to-adaptation 82/219
55Climate Proofing: A Risk-based Approach to Adaptation
H. Case Study Five: Climate Proofingthe Infrastructure, Human Health,and Environment Components ofthe FSM National StrategicDevelopment Plan
Background
In early 2003, the FSM began preparing aStrategic Development Plan (SDP) that outlines thecounty’s broad economic strategy and sectordevelopment policies. In addition to being thecountry’s primary national economic planning mechanism, the SDP is also a requirement underthe Amended Compact of Free Association with theUnited States. That agreement requires the FSM toprepare and maintain a strategic multiyear rolling development plan that is updated through theannual budget process.
The plan also outlines the activities and deliv-erable outputs that, under reasonable assumptions,can be expected to lead to the achievement of theidentified strategic goals. Associated with each out-put is a quantifiable performance measure, so thatduring plan execution it will be possible to monitor whether the activities and outputs have been fully implemented.
The SDP comprises a set of sector chapters.Each chapter begins with a review of the sector,including an assessment of the current situation andsector performance; analysis of problems, issuesand constraints; and assessment of the sector’sdevelopment potential. Building on the introductory review, the second section presents the sector’sstrategic goals, which are supported by a descriptiverationale. Each strategic goal is further elaborated,if needed, through appropriate sector policies. Inorder to assess performance toward attainment of the strategic goals, a list of the associated outcome
performance measures is presented and is discussedat the end of the section. Where it is meaningful todo so, outcome baseline and target measures havebeen specified at a national level. Since many outcomes are state specific, the associated baselinesand targets are frequently unspecified.
The third section details the sector StrategicPlanning Matrix (SPM) and indicates the activities
and outputs associated with each strategic goal. TheSPM is the heart of the strategic plan and provides a working manual for each sector. Since activities andoutputs are state specific, the associated targets havebeen specified only when meaningful. The fourthsection describes the SPM and the linkage between
activities and outputs and the strategic goal. The link-age indicates how the delivery of the activities andoutputs is assumed to contribute to the attainmentof the strategic goal. This section also provides anassessment of linkage risks and weaknesses, to fa-cilitate the anticipated ex post performanceevaluation efforts. A fifth and final section referencesthe Infrastructure Development Plan (IDP), andidentifies the list of infrastructure projects that arecritical to the fulfillment of the sector strategy. Thelist distinguishes between those projects whosemajor function is to support sector developmentdirectly and those whose purpose is indirect orcrosscutting.
Preparation and implementation of the IDPmeets another requirement under the AmendedCompact. The IDP is the FSM’s long-term planning document for public investment in infrastructure.The document has been drafted to cover a 20-yearperiod, while recognizing that priorities outlined,and the specific projects in each sector, will beupdated through the annual budget process. Whilethe IDP is a requirement of funding under theCompact infrastructure sector, the plan iscomprehensive and anticipates funding of projectsfrom the FSM’s own revenues, from its bilateralpartners, from international financial institutions,and from other development partners.
Together, the SDP and IDP provide a compre-hensive economic strategy for the FSM at a criticaltime in its development as an increasingly self-reli-ant nation.
A critical step in the preparation of the SDP andIDP was the convening of the third FSM EconomicSummit from 28 March to 2 April 2004. For the
summit, nine sector committees were established:
• Private Sector Development,• Public Sector Management,• Education,• Health,• Agriculture,• Fisheries,

8/13/2019 Climate Proofing: A Risk-based Approach to Adaptation
http://slidepdf.com/reader/full/climate-proofing-a-risk-based-approach-to-adaptation 83/219
Climate Proofing: A Risk-based Approach to Adaptation56
Figure VI.24. Monthly Admissions to PohnpeiHospital for Influenza and Gastroenteritis
0 = no chance; 1 = statistical certainty.Source: CCAIRR findings.
• Tourism, and• Environment and Gender.
The infrastructure sector had previously beenincorporated into the process through preparationof a draft IDP. The draft IDP was reviewed and
amended by a special subcommittee of sectorrepresentatives. Each sector was also asked to review sector-specific components of the IDP to ensureconsistency with the strategic planning matrices.
Each sector committee reviewed the relevantdraft chapters of the SDP as well as the strategicplanning matrices and prepared an acceptableplanning matrix that had wide endorsement fromall states of the Federation. The revised matrices were presented to the Summit for endorsement andsubsequent integration into the SDP.
ADB provided technical assistance to the FSMfor the preparation of both the SDP and the IDP.
The Case Study
Climate proofing at the national policy level isone of the major ways to mainstream adaptation. Ithelps to strengthen the enabling environment foradaptation while also integrating adaptationplanning and implementation into existing and new development policies, plans, and actions.
Climate proofing at the national policy level was assisted by the preparation of Adap-tation Mainstreaming Guidelines for the FSM.The Guidelines for the FSM are presented in Appendix 3. In addition, a general descriptionof the approaches and methods used whenmainstreaming adaptation in national develop-ment planning and implementation can be foundin Chapter VIII.
In the case of the FSM, climate proofing theSDP and the associated IDP was guided by anumber of considerations, including
• advice from the Project Liaison Committeeand other stakeholders to focus on sectorsknown to face risks related to climatevariability and change, including extremeevents,
• the benefits of using the detailed findings fromthe other case studies,
• the ability to undertake additional studies toevaluate sector-dependent climate risks,
• the opportunity and ability to establish aneffective dialogue with those individuals andgroups responsible for preparing the draftmaterials for the SDP and IDP, and
• the ability to synchronize the sector activities forthe SDP with the climate proofing initiatives.
As a result, the cli mate proofi ng act ivit iesfocused on three sectors: health care, environment,and infrastructure.
In addition to the detailed findings of the casestudies, climate proofing the SDP and IDP drew onthe results of several studies. These are presentedbelow.
Examples of Impact of Climate Changeon Health
Monthly data on the number of patientsadmitted to Pohnpei hospital with infectiousdiseases were examined to determine whether weather and climatic conditions had an influence.Significant relationships were found for twodiseases, influenza and gastroenteritis. Figure VI.24shows the variation in admission numbers for theperiod 1998–2003. The month-to-month variations
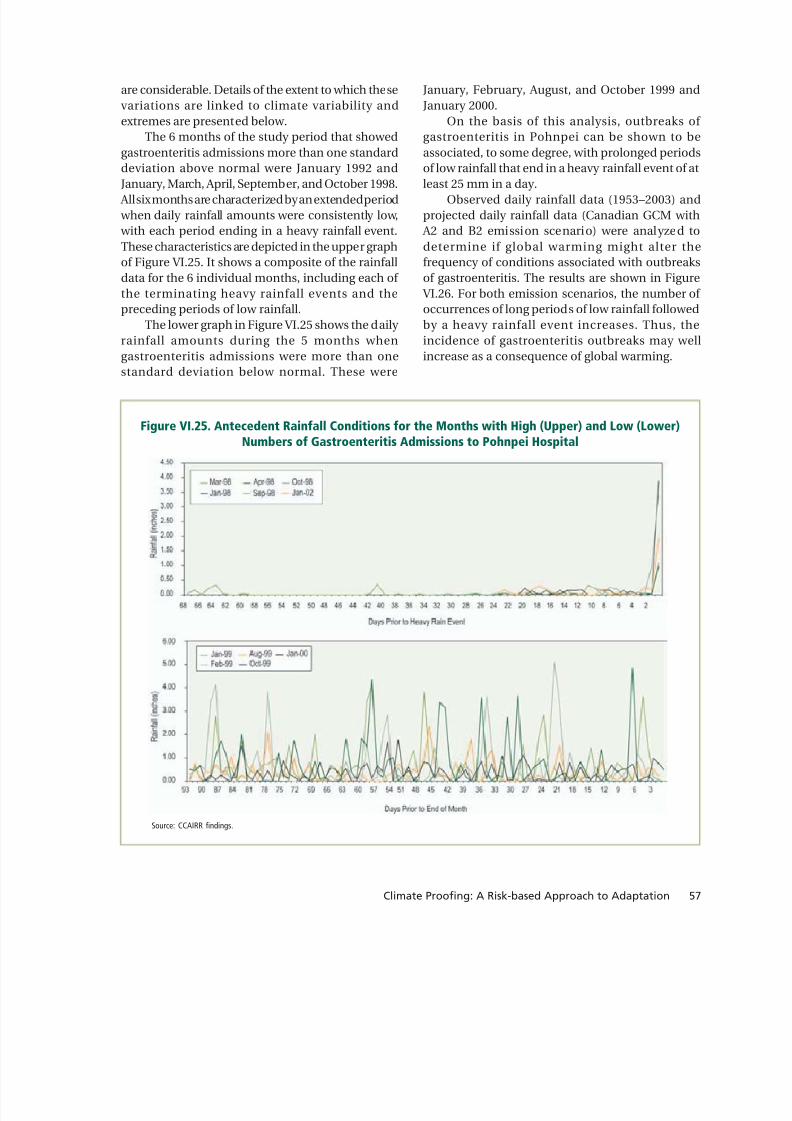
8/13/2019 Climate Proofing: A Risk-based Approach to Adaptation
http://slidepdf.com/reader/full/climate-proofing-a-risk-based-approach-to-adaptation 84/219
57Climate Proofing: A Risk-based Approach to Adaptation
January, February, August, and October 1999 andJanuary 2000.
On the basis of this analysis, outbreaks of gastroenteritis in Pohnpei can be shown to beassociated, to some degree, with prolonged periodsof low rainfall that end in a heavy rainfall event of at
least 25 mm in a day.Observed daily rainfall data (1953–2003) and
projected daily rainfall data (Canadian GCM with A2 and B2 emission scenario) were analyzed todetermine if global warming might alter thefrequency of conditions associated with outbreaksof gastroenteritis. The results are shown in Figure VI.26. For both emission scenarios, the number of occurrences of long periods of low rainfall followedby a heavy rainfall event increases. Thus, theincidence of gastroenteritis outbreaks may wellincrease as a consequence of global warming.
Figure VI.25. Antecedent Rainfall Conditions for the Months with High (Upper) and Low (Lower)Numbers of Gastroenteritis Admissions to Pohnpei Hospital
Source: CCAIRR findings.
are considerable. Details of the extent to which thesevariations are linked to climate variability andextremes are presented below.
The 6 months of the study period that showedgastroenteritis admissions more than one standarddeviation above normal were January 1992 and
January, March, April, September, and October 1998. All six months are characterized by an extended period when daily rainfall amounts were consistently low, with each period ending in a heavy rainfall event.These characteristics are depicted in the upper graphof Figure VI.25. It shows a composite of the rainfalldata for the 6 individual months, including each of the terminating heavy rainfall events and thepreceding periods of low rainfall.
The lower graph in Figure VI.25 shows the daily rainfall amounts during the 5 months whengastroenteritis admissions were more than onestandard deviation below normal. These were

8/13/2019 Climate Proofing: A Risk-based Approach to Adaptation
http://slidepdf.com/reader/full/climate-proofing-a-risk-based-approach-to-adaptation 85/219
Climate Proofing: A Risk-based Approach to Adaptation58
Source: CCAIRR findings.
Figure VI.26. Number of Occurrences in50 Years of Periods of Low Rainfall Ending
in a Heavy Rainfall Event; Observed andProjected Rainfall Data for Pohnpei
Figure VI.27 suggests that outbreaks of influenzain Pohnpei are associated, in part, with periods when the mean daily temperature range for themonth (the difference between the mean daily maximum and minimum temperatures) isincreasing faster than normal.
Climate and Infrastructure
Preceding sections of this book, and notably thecase studies, provide information on climate-relatedrisks of relevance to the design and implementationof infrastructure development projects in the FSM,including risks related to extreme rainfall and to highsea level.
Prolonged periods of drought also pose a risk to water supply, waste water, hydroelectric, andsimilar infrastructure projects.
Figure VI.28 presents, for Pohnpei, the numberof months in each year (1953–2003), and eachdecade, for which the observed precipitation wasbelow the fifth percentile. A monthly rainfall below the fifth percentile is used here as an indicator of drought.
Most of the low rainfall months are concen-trated in the latter part of the period of observation,
indicating that the frequency of drought hasincreased since the 1950s. The years with a greaternumber of months with rainfall below the fifth per-centile coincide with El Niño events.
The results of a similar analysis, in this case forrainfall estimates (1961–1990) and projections
Source: CCAIRR findings.
Figure VI.27. Monthly Admissions to PohnpeiHospital for Influenza, and Observedand Normal Mean Daily Temperature
Ranges for Pohnpei
Figure VI.28. Number of Months in Each Yearor Decade for which Precipitation in Pohnpei
was Below the Fifth Percentile
Source: CCAIRR findings.

8/13/2019 Climate Proofing: A Risk-based Approach to Adaptation
http://slidepdf.com/reader/full/climate-proofing-a-risk-based-approach-to-adaptation 86/219
59Climate Proofing: A Risk-based Approach to Adaptation
(1991–2100) by the Canadian GCM, are shown inFigure VI.29. The results are presented for both the A2 and B2 emission scenarios. The GCM-basedresults replicate the increased frequency of months with extreme low rainfall during the latter part of thelast century. The results also indicate that, regardless
of which emission scenario is used, the frequency of low rainfall months will generally remain as high asit was in the latter part of the last century.
Figure VI.30 shows the annual maximum windgust recorded in Pohnpei for the period from 1974to 2003.
Figure VI.30. Annual Maximum Wind GustRecorded in Pohnpei 1974–2003
Source: CCAIRR findings.
Figure VI.29. Number of Months per Decadefor which Precipitation in Pohnpei is Projected
to be Below the Fifth Percentile
Source: CCAIRR findings.
Strong wind gusts also pose a threat toinfrastructure. Table VI.22 presents return periodsfor extreme high winds in Pohnpei, based onobserved data. Also shown are return periods for1991–2020 and for 2021–2050. The latter areestimated from projections of maximum wind speed
using the Canadian GCM 2 with the A2 emissionscenario.
Figure VI.31 depicts the influence of global warming on the likelihood of a maximum wind gustof 28 m/sec for Pohnpei.
Table VI.22. Return Periods for Maximum Wind Speed, Pohnpei(Years)
Wind Speed (m/sec) Hourly Daily
1974-2003 1961-1990 1991-2020 2021-205020 2 2 2 2
25 8 10 10 9
28 20 47 40 20Note: daily values based on Canadian GCM 2, with A2 emission scenario.Source: CCAIRR findings.
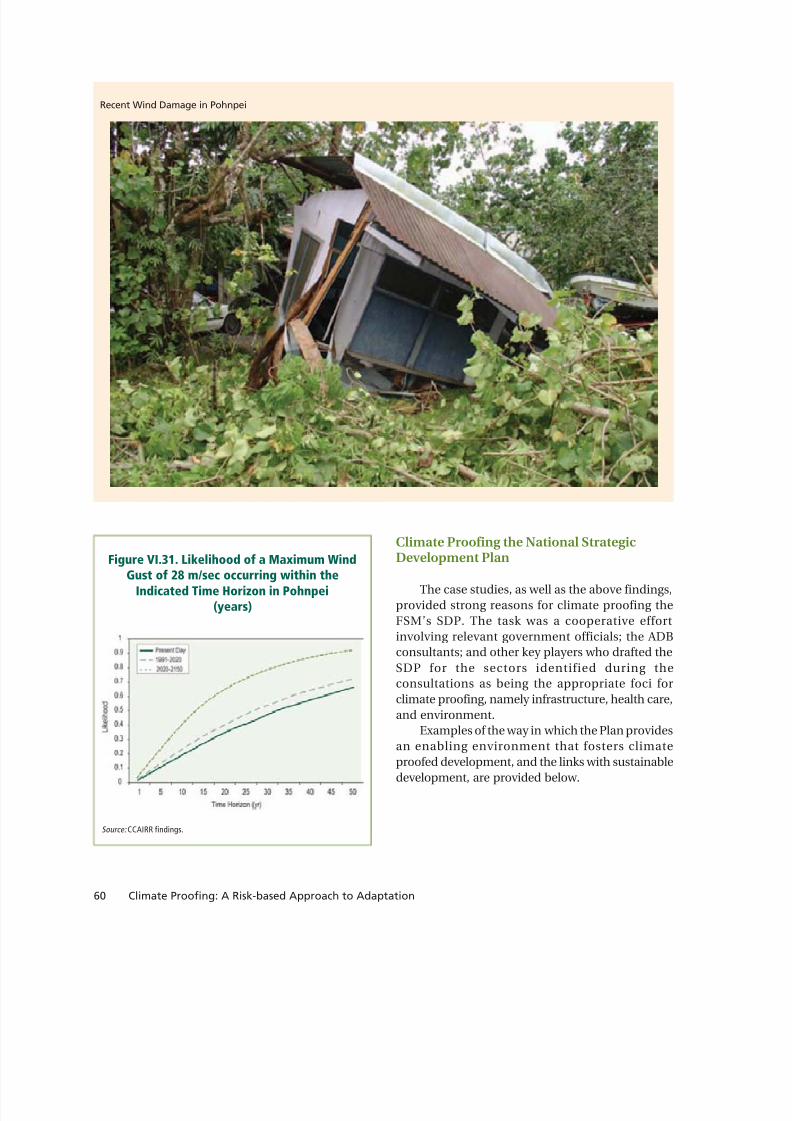
8/13/2019 Climate Proofing: A Risk-based Approach to Adaptation
http://slidepdf.com/reader/full/climate-proofing-a-risk-based-approach-to-adaptation 87/219
Climate Proofing: A Risk-based Approach to Adaptation60
Figure VI.31. Likelihood of a Maximum WindGust of 28 m/sec occurring within the
Indicated Time Horizon in Pohnpei(years)
Source: CCAIRR findings.
Climate Proofing the National StrategicDevelopment Plan
The case studies, as well as the above findings,provided strong reasons for climate proofing theFSM’s SDP. The task was a cooperative effortinvolving relevant government officials; the ADBconsultants; and other key players who drafted theSDP for the sectors identified during theconsultations as being the appropriate foci forclimate proofing, namely infrastructure, health care,and environment.
Examples of the way in which the Plan providesan enabling environment that fosters climateproofed development, and the links with sustainabledevelopment, are provided below.
Recent Wind Damage in Pohnpei

8/13/2019 Climate Proofing: A Risk-based Approach to Adaptation
http://slidepdf.com/reader/full/climate-proofing-a-risk-based-approach-to-adaptation 88/219
61Climate Proofing: A Risk-based Approach to Adaptation
a. Infrastructure
Criteria by which to rank projects nationally across sector and state include
impact of the project on the national
economy;cost benefit of project, taking into accounteconomic and social benefits;contribution of the project toward the healthand safety of the community;contribution of the project toward develop-ment of the FSM workforce to meet the socialand economic challenges;contribution of the project to institutionalstrengthening and restructuring of govern-ment infrastructure agencies;contribution of the project to promoting private sector development;viability, sustainability, potential socialbenefit, environmental impact, and risk exposure of the infrastructure developmentproject.
Risk Assessments Related to Natural Hazards .These studies should be conducted at the statelevel and focus on existing risks to infrastruc-ture (e.g., typhoons, landslides, drought) as wellas determining how those risks will be increasedas a result of changes in the future, including the consequences of global climate change. Thestudy will develop guidelines and identify andrecommend other measures to ensure the ex-posure of infrastructure to current and futurerisks are reduced to acceptable levels.
Strengthen and adapt new building and otherrelevant regulations and codes of goodpractice.
Infrastructure located, built and maintained
in line with codes and practices that ensurefull functionality for the projected lifetime.
Infrastructure designed, located, built andmaintained to avoid unacceptable risks toinfrastructure associated with naturalhazards, including weather and climateextremes, variability and change.
Conduct risk assessments at state level anddevelop national- and state-level guidelines toensure risks to infrastructure developmentprojects are identified and addressed in a costeffective manner at the design stage (Office of the President, FSM 2004).
b. Health Care
Climate variability and change, including sea-level rise, are important determinants of health and of growing concern in the FSM (asit is in all Pacific Island countries). The impactsare mostly adverse. Climate variability andchange can result in reduced quality andquantity of water supplies, loss of coastalresources, reduction in ecosystem productivity and a decline in agricultural productivity.Potential health impacts which have beenidentified include: vector-borne diseases(such as dengue fever and malaria), water-borne diseases (such as viral and bacterialdiarrhea), diseases related to toxic algae (suchas ciguatera fish poisoning which is importantin the FSM where the protein source ispredominantly fish), food-borne diseases,food security and nutrition, heat stress, airpollution, and extreme weather and climateevents (such as cyclones, high tides, droughtsand storm surges). Especially on atoll islandsof the FSM, storm surges can result in injury and drowning. The adverse impacts of many of these events will be exacerbated by sea-levelrise. Thus climate change should be animportant consideration when assessing environmental health issues and theconsequential priorities for the health of people in the FSM.
Conduct assessments of climate-related healthrisks, including vector-borne and water-borne
diseases, and institute relevant early warning andpublic education programs.
Strengthen surveillance and monitoring functionsof the environmental health program (water,hygiene, sanitation, and food safety), including risks related to climate variability and change.

8/13/2019 Climate Proofing: A Risk-based Approach to Adaptation
http://slidepdf.com/reader/full/climate-proofing-a-risk-based-approach-to-adaptation 89/219
Climate Proofing: A Risk-based Approach to Adaptation62
Public health risks related to climate variability and change documented and findings included inrelevant health, education and public awarenessprograms (Office of the President, FSM 2004).
c. Environment
Strategic Goal 1: Mainstream environmentalconsiderations, including climate change, ineconomic development (National Environ-mental Management Strategy, FSMClimateChange Communication, National Biodiver-sity Strategy and Action Plan, Compact Envi-ronmental Strategy).
Strategies and plans that address unaccept-able risks to the natural environment and builtassets, including those arising from naturalhazards such as weather and climate ex-tremes, variability and change.
Develop and implement integrated environ-mental and resource management objectivesthat enhance resilience of coastal and otherecosystems to natural hazards such as thoseassociated with extreme weather events, cli-mate change, high tides and sea-level rise.
All the FSM communities will develop andimplement risk reduction strategies to addressnatural hazards such as those related tocurrent weather and climate extremes andvariability, while at the same time preparing for anticipated impacts of climate change.
Identify structures, infrastructure, and ecosys-tems at risk and explore opportunities to pro-tect critical assets.
Integrate considerations of climate changeand sea-level rise in strategic and operational
(e.g. land use) planning for future develop-ment, including that related to structures,infrastructure, and social and other services.
Document low-lying agricultural areas at risk from the effects of natural hazards, including sea-level rise, and implement appropriateland use planning and other measures.
Determine impact of climate change on thetuna industry as a result of such effects aschanged migration patterns of Pacific tunastocks, and implement strategies to minimizeimpacts on this important industry (Office of the President, FSM 2004) .
Current Status of the Climate-Proofed NationalStrategic Development Plan
At the Third FSM Economic Summit, heldbetween 28 March and 2 April 2004, the climateproofed SDP was endorsed by participants. Subse-quently the SDP was approved by the NationalCongress. It has now become the primary nationaleconomic planning mechanism of the FSM.
Implementation of the climate proofing calledfor in the SDP will be guided by the NationalGuidelines for Mainstreaming Adaptation toClimate Change (see Appendix 3). These Guidelines were approved at the final Tripartite Review Meeting held in the FSM in June, 2004.
I. Case Study Six: Climate Proofingthe Cook Islands NationalDevelopment Strategy
Background
In late 2003, the Cook Islands began preparing a National Development Strategy (NDS) that wo ul d ou tli ne th e co un ty’s br oa d ec on om icstrategy and sector development policies. The firstmajor public consultation to set the stage forformulation of the NDS was the First NationalDevelopment Forum, held in November 2003. As
part of preparations for the Forum, five InterimFocus Groups were established by the NationalPlanning Task Force, which had oversight of preparing the NDS. The Focus Groups performeda stocktaking of developments over the past 20 years and identified issues to be addressed in theareas of economic development, education, healthcare, infrastructure, and law and governance.

8/13/2019 Climate Proofing: A Risk-based Approach to Adaptation
http://slidepdf.com/reader/full/climate-proofing-a-risk-based-approach-to-adaptation 90/219
63Climate Proofing: A Risk-based Approach to Adaptation
Environment was seen as a cross-cutting themeto be considered by all Focus Groups.
The newly established Coordination Unit,based in the Office of the Prime Minister, hadresponsibility to organize the National DevelopmentForum. The Coordination Unit is jointly staffed by
members of the Office of the Prime Minister and theMinistry of Finance and Economic Management.The Unit was assisted by a local consultant and aconsultant provided by ADB.
The Forum had two primary objectives:
• review the overall progress of the Cook Islandsover the last 20 years and determine its develop-ment status; and
• establish a framework for the formulation of thelong-term (20 years) NDS.
All sectors of the community, including theOuter Islands, were well represented at the Forum.The major objective of the first day was to identify recent development achievements and also issuesfacing the nation. Those identified included thefollowing:
• A fourfold increase in visitor arrivals has occurredover the past 20 years.
• Unplanned development places pressure on theenvironment, infrastructure, and land.
• Environmental themes are now being coveredexplicitly in the national education curriculum.
• The divide between Rarotonga and the OuterIslands is increasing; Rarotongan students arebetter equipped to take advantage of opportu-nities.
• Steady improvement has occcurred in the mainhealth indicators, such as rising life expectancy and very low infant and maternal mortality rates.
• The disparity in health standards betweenRarotonga and the Outer Islands needs to be
narrowed.• Water is piped free to most areas, especially inRarotonga.
• Water shortages on Rarotonga will limit new development.
The primary objective of the second day of theForum was to identify the common goals fordevelopment of the Cook Islands over the next 20 years. The goals included
• balanced and equitable socioeconomic
development, with the natural environment very much intact and enhanced;
• service and development efforts that are equally focused on Rarotonga and the Outer Islands;
• greater use of alternative energy sources, both asan environmental enhancement measure and asa means to reducing dependence on importedfuels; and
• significantly reduced numbers of personal trans-port vehicles and a population that routinely relies on bicycles and public transport foron-island mobility.
Subsequent to the National DevelopmentForum, the National Planning Task Force built onits results and prepared a draft matrix of strategicpriority issues. For each strategic priority, the matrix included key challenges, key policy objectives, andkey actions required. The seven strategic priority objectives were
• good governance and law and order;• macroeconomic stability and economic devel-
opment;• improved quality of education;• improved quality of health care services;• improved standard of infrastructure and provi-
sion of utilities, including transport services;• increased agricultural productivity and self-
sufficiency and food security; and• improved development and management of
marine resources.
In subsequent discussions the Task Forceacknowledged the need to add environmental
quality and tourism as strategic priority objectives. With these additions, the draft matrix developed by the Task Force served as the foundation for climateproofing the Cook Islands NDS.

8/13/2019 Climate Proofing: A Risk-based Approach to Adaptation
http://slidepdf.com/reader/full/climate-proofing-a-risk-based-approach-to-adaptation 91/219
Climate Proofing: A Risk-based Approach to Adaptation64
The Case Study
Climate proofing at the national policy level isone of the major ways to mainstream adaptation. Ithelps to strengthen the enabling environment foradaptation, while also integrating adaptation
planning and implementation into existing and new development policies, plans, and actions.
Climate proofing at the national policy level wasassisted by the preparation of AdaptationMainstreaming Guidelines for the Cook Islands.These Guidelines are presented in Appendix 4. Inaddition, a general description of the approachesand methods used when mainstreaming adaptationin national development planning andimplementation can be found in Chapter VIII.
Climate proofing the NDS was also guided by anumber of considerations, including
• advice from the Project Liaison Committee andother stakeholders to ensure that climate-relatedrisks were considered for all the strategic priority objectives;
• the benefits of using the detailed findings fromthe other case studies;
• the ability to undertake additional studies toevaluate sector-dependent climate risks; and
• the opportunity and ability to establish aneffective dialogue with those individuals andgroups responsible for preparing the draftmaterials for the NDS.
In addition to the detailed findings of the casestudies, climate proofing the NDS drew on theresults of several studies. These are presented below.
Examples of the Impact of Climate Changeon Health
Aggregated monthly nodifiable disease records
for Rarotonga were examined to determine whether weather and climatic conditions had an influence.Figure VI.33 shows the variation in admissionsnumbers for the period 1991–2003.
The two diseases with the highest incidencerates, acute respiratory infection (ARI) and dengue, were examined to determine the extent to which theconsiderable month-to-month variations were
Figure VI.32. Monthly Totals of NotifiableDisease Cases for Rarotonga
Note: ARI = acute respiratory i nfection.Source:CCAIRR findings.
Figure VI.33. Number of Cases of Dengue andthe Monthly Total Rainfall, Observed MeanMaximum Temperature, and Normal Mean
Maximum Temperature for Rarotonga
Source: CCAIRR findings.
linked to climate variability and extremes. Theresults are presented below. Figure VI.34 shows, foreach month from 1991 to 2003, the number of casesof dengue and also the monthly total rainfall,observed mean maximum temperature, and normalmean maximum temperature.

8/13/2019 Climate Proofing: A Risk-based Approach to Adaptation
http://slidepdf.com/reader/full/climate-proofing-a-risk-based-approach-to-adaptation 92/219
65Climate Proofing: A Risk-based Approach to Adaptation
Analyses revealed a relati onship be tweendengue cases in a given month and the rainfall totaland mean maximum temperature for the previousmonth, such that
Dengue Cases = -2254 + 77.7 * Rainfall -1 + 0.32 *
Tmax -1. The R 2 was 0.58 (i.e., explained varianceequals 58%) and the standard error equalled 132cases.
Significantly, the above equation does notprovide the ability to predict an outbreak of dengue.Since dengue is not endemic to the Cook Islands,an outbreak results from the arrival in the country of an infected person who is subsequently bitten by a mosquito that is then a vector for spreading thedisease. The above relationship does allow someability to predict whether an existing outbreak will worsen or decline. The latter is more likely to occurif rainfall amounts and maximum temperatures arehigh. This is shown in Table VI.23.
Table VI.23. Number of Dengue Cases in a Month if an Outbreak is AlreadyOccurring, Based on the Rainfall (mm) and Maximum Temperature (°C)
in the Previous Month
R a i n f a l l ( m m ) -
P r e v i o u s M o n t h
Maximum Temperature–Previous Month(°C)
26 27 28 28 30 31 32 33 34
600 0 36 114 114 270 347 425 503 580550 0 20 98 98 254 331 409 487 564500 0 4 82 82 238 315 393 471 548450 0 0 66 66 22 299 377 455 532400 0 0 50 50 206 283 361 439 516350 0 0 34 34 190 267 345 423 500300 0 0 18 18 174 251 329 407 484250 0 0 2 2 158 235 313 391 468200 0 0 0 0 142 219 297 375 452150 0 0 0 0 126 203 281 359 436100 0 0 0 0 110 187 265 343 420
50 0 0 0 0 94 171 249 327 4040 0 0 0 0 78 155 233 311 388
Source: CCAIRR findings.
In addition to showing the potential impact of climate change on dengue cases, the aboverelationship provides a basis for deciding whetherpublic health interventions are required if anoutbreak is already occurring.
The climate risk profile for the Cook Islands
(Appendix 2) reveals that both rainfall andmaximum temperatures are projected to increaseas a consequence of global warming, creating thepotential for an increase in the number of cases of dengue in future outbreaks. Interestingly, for thefour outbreaks of dengue since 1998, each has seena steady increase in both the total and maximumnumber of cases, as shown in Table VI.24. Theduration of an outbreak has not changedsystematically over the same time period. It is notpossible to attribute the observed changes to global warming, but the patt ern is consistent with theobserved changes in the climate. These, in turn, areconsistent with the consequences of global warming.

8/13/2019 Climate Proofing: A Risk-based Approach to Adaptation
http://slidepdf.com/reader/full/climate-proofing-a-risk-based-approach-to-adaptation 93/219
Climate Proofing: A Risk-based Approach to Adaptation66
Figure VI.34. Number of Cases of ARI, MonthlyTotal Rainfall, Observed Mean Minimum
Temperature and Temperature Range, andNormal Mean Maximum Temperature and
Temperature Range for Rarotonga
Source: CCAIRR findings.
Table VI.24. Total and Monthly MaximumNumber of Cases of Dengue in Rarotonga
(1998–2003)
Year of Number of MaximumOutbreak Cases Number in Month
1991 644 231
1995 786 361
1997 1,100 401
2001–02 2,330 767Source: CCAIRR findings.
Figure VI.34 suggests that the number of casesof ARI in a given month in Rarotonga is associated,in part, with lower than normal minimumtemperatures and rainfall and with a temperaturerange that is higher than normal. The relevantcorrelations with ARI were as follows:
Rainfall -0.41Tmin -0.58Text range 0.42 All threevariables 0.58
The R 2 was 0.34 (i.e., explained variance equals34%) and the standard error equalled 148 cases.
This relationship provides the ability to esti-mate the number of ARI cases. An example, for rain-
fall and extreme temperature range only, is providedin Table VI.25.

8/13/2019 Climate Proofing: A Risk-based Approach to Adaptation
http://slidepdf.com/reader/full/climate-proofing-a-risk-based-approach-to-adaptation 94/219
67Climate Proofing: A Risk-based Approach to Adaptation
Climate and Infrastructure
Preceding sections of this book, and notably thecase studies, provide information on climate-relatedrisks of relevance to the design and implementationof infrastructure development projects in the Cook Islands, including risks related to extreme rainfall,strong wind gusts, drought, extreme high tempera-tures, and high sea level. All these extreme eventsare projected to increase in frequency, and hencein magnitude for a given return period, as a conse-quence of global warming.
These findings, which are presented collectively in Appendix 2, have major implications for ensuring the longevity of existing and new infrastructure. Theimplications have been acted upon by climateproofing the NDS for the Cook Islands.
Climate Proofing the National DevelopmentStrategy
The case studies, as well as the above findings,provided strong reasons for climate proofing theCook Islands NDS. The task was a cooperative effortinvolving, in the main, members of the Project
Table VI.25. Number of ARI Cases in a Month Based on the Rainfall (mm)and Maximum Temperature (°C) in the Previous Month
R a i n f a l l ( m m )
Extreme Temperature Range(°C)
6 8 10 12 14 16 20600 97 145 192 240 288 336 432550 118 166 214 262 310 357 453500 139 187 235 283 331 379 474450 160 208 256 304 352 400 496400 182 560 277 325 373 421 517350 203 251 299 347 395 442 538300 224 272 320 368 416 464 559250 245 293 341 389 437 485 581200 267 315 362 410 458 506 602150 288 336 384 432 480 527 623100 309 357 405 453 501 549 644
50 330 378 426 474 522 570 666
0 352 400 447 495 543 591 687Source: CCAIRR findings.
Liaison Committee and participants in a NationalClimate Dialogue.
The process of climate proofing was organizedaround the seven strategic priorities listed above(plus tourism and the environment). Initialdiscussions were aided by the use of questionsdesigned to focus the interactions on the climateproofing dimensions of each strategic priority. Thequestions used are listed in Box VI.4.
The initial responses to the questions were usedas a basis for preparing a series of key challenges,objectives, and actions that would help enhance theenabling environment and facilitate the climateproofing of future development in the Cook Islands.
This draft material was shared with members of the Project Liaison Committee for their review andfeedback. The revised material was subsequently presented at a National Climate Dialogue. After
discussion and some revisions, the Dialogueparticipants agreed that the key challenges, objectives,and actions should be communicated to theGovernment, as a practical and tangible contributionto assist with the climate proofing of the NDS.
The approved key challenges, objectives, andactions are shown in Tables VI.31–VI.39.

8/13/2019 Climate Proofing: A Risk-based Approach to Adaptation
http://slidepdf.com/reader/full/climate-proofing-a-risk-based-approach-to-adaptation 95/219
Climate Proofing: A Risk-based Approach to Adaptation68
BOX VI.4Questions used to Focus Discussions on the Climate Proofing Dimensions of the
Cook Islands National Development Strategy
Strategic Priority 1Good Governance and Law and Order
What req uirements do cl imate var iabili ty and cha ngeimpose on
• institutional arrangements?• planning?
Strategic Priority 2
Macroeconomic Stability and EconomicDevelopment
What are the challenges that climate variabil ity and changepose to
• national economic development?• economic development of the Outer Islands?
Strategic Priority 3
Improved Quality of Education What education initiatives are required if the Cook Islandsis to
• enhance its sustainability?• attain a viable economy?• maintain high environmental quality?• achieve equitable social and economic development?
Strategic Priority 4Improved Quality of Health Care Services
What is impeding efforts to reduce the impacts of c limatevariability and change on public health and well-being?
Strategic Priority 5
Improved Standard of Infrastructure and theProvision of Utilities, Including Transport Services
What can be done to ensure that risks to infrastructure arenot increased due to climate variability and change?
Strategic Priority 6Increase Agricultural Productivity for Self-Sufficiency and Food Security How can agricultural production be made more sustainable,and food security enhanced, despite climate variability andchange?
Strategic Priority 7
Improve Development and Management of MarineResources
What must be done to ensure the sustainabil ity of the Cook Islands’ marine resources despite risks due to climate
variability and change?
Strategic Priority 8
Tourism Development What can be done to reduce the risks that climate variability and change pose to the tourism sector?
Strategic Priority 9
Protection, Conservation, and SustainableManagement of the Environment and NaturalEcosystems 1
Wha t chang es are req uired to environm ental pol icies ,regulations, and procedures (e.g., environmental impactassessment) in order to reduce the risks climate variability and change pose to the Cook Islands?
1 The National Task Force had not developed a strategic priority for the environment at the time the above questions wereprepared. Thus, the wording of strategic priority 9 was designedto assist and guide the Task Force in its work related to thestrategic priority on the environment.
Source: CCAIR findings.

8/13/2019 Climate Proofing: A Risk-based Approach to Adaptation
http://slidepdf.com/reader/full/climate-proofing-a-risk-based-approach-to-adaptation 96/219
69Climate Proofing: A Risk-based Approach to Adaptation
Table VI.26. Strategic Priority 1: Good Governance and Law and Order
Key Challenges Key Objectives Key Actions Required
Note: UNFCCC = United Nations Framework Convention on Climate Change.Source: CCAIRR findings.
Promote information sharing andbottom-up and top-downcommunication.
Plans developed by all government agenciesenhance sustainable development and foodsecurity.
• Maritime surveillance and agriculture ministriesstrengthened.
• Disaster Management Unit fully operational.Weather observation and information gatheringstrengthened.
Promote and provide policyadvice with respect to adaptationpriorities and practices.
• Promote the development of informationtechnology models to assist with decisionmaking.
Comply with International Agreements. • Submit Second National Communication to theUNFCCC.
All institutional arrangements,policies, and plans fostersustainable development.
Government institutions are structured andstrengthened.
• Climate Change Country Team (CCCT)institutionalized.
• Technical Working Group established andreporting to CCCT.
Table VI.27. Strategic Priority 2: Macroeconomic Stability and Economic Development
Key Challenges Key Objectives Key Actions Required
Source: CCAIRR findings.
Recognize the vulnerability of keyeconomic drivers of the economy,including the challenges thatclimate variability will pose.
Promote the integration of polices and plansdirected at reducing climate-related risks.
• Introduce and strengthen legislation andregulations that facilitate adaptation.
• Improve compliance monitoring and enforce-ment capabilities of relevant regulatoryagencies.
• Enhance agricultural pest control.• Enhance water resources management on all
islands.• Develop strategies to deal with erosion of land,
especially on Outer Islands.
Seek alternative and innovativeavenues for economic development
Reduce dependency on tourism and black pearlindustry.
• Promote research programs in the Cook Islands.• Enhance food security.

8/13/2019 Climate Proofing: A Risk-based Approach to Adaptation
http://slidepdf.com/reader/full/climate-proofing-a-risk-based-approach-to-adaptation 97/219
Climate Proofing: A Risk-based Approach to Adaptation70
Table VI.28. Strategic Priority 3: Improved Quality of Education
Key Challenges Key Objectives Key Actions Required
Note: HRD = human resources developmentSource: CCAIRR findings.
Develop the skills of CookIslanders in order to fostersustainable development goals.
Convert awareness into action to deal withvariability and extremes in weather andclimate—at all levels in society.
• Make HRD strategy reflect the need to developin-country expertise and understanding inclimate change.
• Improve training opportunities in science, socialstudies, and technical areas.
• Use technical modelling tools to assist indecision making.
Mainstream climate changeissues within the formal andinformal education and voca-tional training curricula.
Raise awareness of climate change-related risksthrough ongoing media campaigns.
• Identify those responsible for awareness raising.• Ensure that formal education curricula includes
climate change issues.
Table VI.29. Strategic Priority 4: Improved Quality of Health Services
Key Challenges Key Objectives Key Actions Required
Source: CCAIRR findings.
Address the impacts of climatevariability and change (includingextreme events) on the healthand welfare of Cook Islanders.
Recognize and strengthen contingency responseplans for disease outbreaks.
• Improve the effectiveness of thetutaka (annualhealth department inspection of properties)
• Use technical and scientific tools to map andpredict disease outbreaks.
• Strengthen border control.
Establish long-term preventivehealth care programs that takeinto account climate variabilityand change.
Improve the health and well-being of CookIslanders.
• Strengthen public health programs.• Conduct assessments of climate-related health
risks.

8/13/2019 Climate Proofing: A Risk-based Approach to Adaptation
http://slidepdf.com/reader/full/climate-proofing-a-risk-based-approach-to-adaptation 98/219
71Climate Proofing: A Risk-based Approach to Adaptation
Table VI.30. Strategic Priority 5: Improve the Standard of Infrastructure and theProvision of Utilities, including Transport Services
Key Challenges Key Objectives Key Actions Required
Note: EIA = environmental impact assessment; GIS = geographical information system.Source: CCAIRR findings.
Ensure that the risks to infrastruc-ture are not increased due toclimate variability and change.
Ensure compliance and enforcement of building,EIA and related regulations.
• Establish computer models and technicalexpertise to make informed decisions (e.g., useof GIS).
• Revise EIA regulations and codes to reflect newinformation and practices.
• Provide guidance on how to make current landuse practices (buildings, etc.) more resilient andmore sustainable.
Promote sound and sustainableland use practices.
Provide information on risks to buildings andother structures.
• Strengthen advisory capacity of Ministry of Works.
• Promote rainwater harvesting.
Increase the security of water and
energy supplies in bothRarotonga and the Outer Islands,in order to reduce vulnerability of people and industries to droughtsand other extreme events.
Promote renewable energy use. • Promote research programs in the Cook Islands.
• Promote use of alternative sources of watersupply.
Table VI.31. Strategic Priority 6: Increase Agricultural Productivity forSelf-Sufficiency and Food Security
Key Challenges Key Objectives Key Actions Required
Source: CCAIRR findings.
Establish good transport andmarketing systems for agriculturalproduce from the Outer Islands
Improve the system for inter-island transfer of food, e.g., marketing centers and bettertransport.
• Devise mechanisms to move produce from thefarm gate to the market.
Ensure that agricultural produc-tion is environmentally sound andsustainable.
Recognize the need to promote alternativeproduction systems.
Minimize risks to agricultural production andfood security as a result of environmental andrelated changes, including climate variabilityand change.
• Foster alternative production systems such ashydroponics.
• Identify the interactions between agriculturalactivities and the environment.
• Promote research programs such as appropriatecrop strains, including those tolerant to droughtand saline conditions.
• Strengthen the Pesticide Board and implementa-tion of the Pesticide Act.
· Improve controls and management of domesticanimals, e.g., pigs.

8/13/2019 Climate Proofing: A Risk-based Approach to Adaptation
http://slidepdf.com/reader/full/climate-proofing-a-risk-based-approach-to-adaptation 99/219
Climate Proofing: A Risk-based Approach to Adaptation72
Table VI.32. Strategic Priority 7: Improve Development and Management of Marine Resources
Key Challenges Key Objectives Key Actions Required
Note: ENSO = El Niño Southern Oscillation.Source: CCAIRR findings.
Preserve marine resources for thebenefit of current and futuregenerations.
Improve institutional arrangements to minimizerisks to the sustainability of living marineresources and ecosystems.
• Identify the risks arising from interactionsbetween marine resources and the environment.
• Strengthen maritime surveillance.• Identify and manage the links between climate
variability and coral bleaching, crown of thorns,and fish poisoning, and develop appropriatemanagement strategies (e.g., traditionalmanagement/raui measures).
• Identify and manage climate-related risks foraquaculture (e.g., pearl industry in the NorthernGroup).
Minimize risks to thesustainability of living marineresources and ecosystems as a
result of environmental andrelated changes, including climatevariability and change.
Implement plans and polices that reduceadverse impacts of climate change andvariability.
• Establish research programs to improveinformation sharing.
• Strengthen the monitoring of migratory fish
species.• Implement policies and plans that reduce
adverse impacts and exploit beneficial relation-ships (e.g., adaptive management of the tunafishery in light of the impact of ENSO onmigratory fish species).
Table VI.33. Strategic Priority 8: Tourism Development
Key Challenges Key Objectives Key Actions Required
PATA = Pacific Asia Travel Association.Source: CCAIRR findings.
Reduce the vulnerability of thetourism sector to climatevariability and change, includingextreme events.
Implement risk management strategies thatreduce the impact of extreme climate events ontourism to acceptable levels.
• Identify and prioritize the climate-related risksfacing the tourism industry.·Strengthen disastermanagement.
• Develop in-house risk management strategies.
Recognize that high qualityenvironment is the key to a viabletourism business.
Ensure that all tourism businesses are commit-ted and use environmentally friendly practices.
• Implement PATA guidelines for tourist busi-nesses.
• Establish stringent performance standards fortourism.
• Recognize the impacts of over-water resorts andtheir high vulnerability to extreme weather andclimate events.

8/13/2019 Climate Proofing: A Risk-based Approach to Adaptation
http://slidepdf.com/reader/full/climate-proofing-a-risk-based-approach-to-adaptation 100/219
73Climate Proofing: A Risk-based Approach to Adaptation
Table VI.34. Strategic Priority 9: Protection, Conservation, and Sustainable Managementof the Environment and Natural Ecosystems
Key Challenges Key Objectives Key Actions Required
EIA = environmental impact assessment.Source: CCAIRR findings.
Minimize the adverse conse-quences of climate change on theeconomy, society, and environ-ment.
Develop climate change adaptation strategiesand address unacceptable risks arising fromnatural hazards, including climate change.
Integrate climate change and sea-level rise instrategic and operational impact assessmentsand other regulatory procedures.
• Develop simple and easy-to-follow procedures.• Improve technical expertise and decision-making
processes.• Strengthen national institutional arrangements
for the effective implementation of climatechange policies and plans.
Maintain the quality of theenvironment and of naturalecosystems.
Develop robust regulations and guidelines thatprotect the environment.
• Strengthen EIA procedures in ways that reducepolitical interference in environmentalmanagement.
• Ensure that Outer Islands opt into theEnvironment Act.
• Strengthen national and island EnvironmentalCouncils.
Harmonize responses to climatechange with other sustainabledevelopment initiatives.
Increase efficiency of energy use and convert torenewable energy sources to minimize green-house gas emissions.
• Formulate a National Energy Sector Policy.• Decrease the use of imported petroleum fuels
through conservation, efficiency, use of renewable energy, and other measures.
Participants in the National ClimateDialogue also endorsed the NationalGuidelines for Mainstreaming Adaptation toClimate Change (NGMACCs) (see Appendix 4)that had been previously developed inpartnership with, and approved by, the ProjectLiaison Committee.
Both the Guidelines and the proposals forclimate proofing the NDS were subsequently presented to the Cabinet of the Governmentof the Cook Islands, for its approval andadoption. The Acting Prime Minister hadattended the National Climate Dialogue in her
capacity as Minister for the Environment.
The Cabinet resolved to
• approve adoption and implementation of theNGMACC; and
The Adaptation Mainstreaming Guidelines and the ClimateProofing Proposals are submitted to the Cook Islands Cabinet. TheActing Prime Minister is seated at the end of the table.
• approve the recommendations for climateproofing the National Sustainable DevelopmentStrategy that is currently in preparation.

8/13/2019 Climate Proofing: A Risk-based Approach to Adaptation
http://slidepdf.com/reader/full/climate-proofing-a-risk-based-approach-to-adaptation 101/219
Climate Proofing: A Risk-based Approach to Adaptation74
Some of the Participants in the National Climate Dialogue Held in Rarotonga in August, 2004

8/13/2019 Climate Proofing: A Risk-based Approach to Adaptation
http://slidepdf.com/reader/full/climate-proofing-a-risk-based-approach-to-adaptation 102/219
75Key Findings and Recommendations
BOX VII.1Key Points for Policy and Decision Makers
• Follow-up to the case studies has already occurred,
including plans to seek funding from the GlobalEnvironment Facility and other sources to cover theincremental costs of climate proofing the completion of the circumferential road in Kosrae and the protection of assets on the north coast of Rarotonga.
• Project sustainability (e.g., lifetime) can be threatenedby climate change, but climate proofing a project at thedesign stage will normally require an investment that issmall relative to the additional maintenance and repaircosts incurred over the lifetime of the project.
• Many adaptation options qualify as “no regrets”adaptation initiatives, including being cost effective.
• Retroactive climate proofing is likely to be considerably more expensive than that undertaken at the design stageof a project.
• Governments should reflect these findings by ensuring that all projects are climate proofed at the design stage,making this part of good professional practice.
• Governments should also determine the incrementalcosts and benefits of all major development projects andrequest that developed country aid providers and otheragencies fund these incremental costs; the number of funding options is growing.
• National- and subnational-level regulations should beclimate proofed, as this will allow enforcement of policiesand plans that should, themselves, be climate proofedin accordance with the National Guidelines for
Mainstreaming Adaptation to Climate Change (NGMACCs);• ADB should show leadership with respect to adaptationto climate change by
enhancing enabling environments at national levels,consistent with the NGMACCs;maximizing the synergies between ADB’s sustainabledevelopment initiatives (e.g., poverty reduction) andits climate change initiatives; and
ensuring that all development projects with which it
is associated comply with best professional practices,including climate proofing, in order to reduce toacceptable levels the risks that should be described innational climate risk profiles.
• ADB is encouraged to prepare climate risk profiles for allits developing member countries, using as examplesthose already prepared for the Cook Islands and theFederated States of Micronesia.
• Many lessons have been learned and demonstrated inpreparing the case studies, including showing that
a risk-based approach to adaptation is both desirableand practicable;adaptation is a process and has many dimensions;because of this, a framework and associated method-ologies are essential;Climate Change Adaptation through Integrated Risk Reduction provides such a framework, as well asrelevant methodologies; anddecision support tools such as SimClim facilitateprioritization of adaptation options.
• Most barriers to the successful application of a risk-basedapproach to adaptation relate to the existence of, andaccess to, information.
• Numerous recommendations arose from in-country discussions; arguably the most significant relate toadvocating the use of the risk-based approach toadaptation, both within the region and internationally.
• A deficiency of the current project- and community-focused case studies is that they all relate to high islandsand, with one exception, to islands on which the nationalcapital is located; additional case studies, both in Asiaand the Pacific, are required.
Source: CCAIRR findings.
Key Findings and RecommendationsCHAPTER VII

8/13/2019 Climate Proofing: A Risk-based Approach to Adaptation
http://slidepdf.com/reader/full/climate-proofing-a-risk-based-approach-to-adaptation 103/219
Climate Proofing: A Risk-based Approach to Adaptation76
A. Follow-Up to the Case Studies
Updates on the status and subsequent key stepsare provided for each of the six case studies.
Climate Proofing a Portion of theCircumferential Road, Kosrae, the FederatedStates of Micronesia
Before proceeding to build the road, thegovernment of the state of Kosrae isseeking funding from bilateral ormultilateral aid providers, to cover the
incremental costs of the climate proofing. Serious
consideration is being given to seeking funds fromthe Global Environment Facility (GEF) to cover theincremental costs of climate proofing the designand construction of the entire unbuilt section of RS4. Funding would also be requested to cover theincremental costs of maintaining and protecting the biodiversity of the areas the road wouldtraverse, including the Terminalia forest. Protecting
biodiversity, and ensuring that the road could withstand both present and anticipated climate-related risks, would help ensure that the roadbuilding project received all environmental and other approvalsfrom the state. These must be received beforeconstruction commences.
Climate Proofing the Western BasinBreakwater, Avatiu Harbour, Rarotonga,Cook Islands
The Government of the Cook Islands is, withthe cooperation and assistance of the SouthPacific Applied Geosciences Commission and Australian Assistance for International Development,proceeding with the feasibility study for coastalprotection systems, including the breakwater. The
study will use the design parameters generated inthe case study.
In part as a result of the quantification of currentand anticipated risks to economic and social assetson the north coast of Rarotonga, consideration isbeing given to seeking funding from GEF to coverthe incremental costs of providing enhancedprotection to those assets.
Walung, a community at the southwest corner of Kosrae,would be one of the many beneficiaries of the Circumfer-ential Road’s Completion.
Stakeholders discuss the findings of theBreakwater Case Study.

8/13/2019 Climate Proofing: A Risk-based Approach to Adaptation
http://slidepdf.com/reader/full/climate-proofing-a-risk-based-approach-to-adaptation 104/219
77Key Findings and Recommendations
Climate Proofing the Community of Avatiu-Ruatonga, Rarotonga, Cook Islands
At a meeting of the Cabinet of the Governmentof the Cook Islands held on August 10, 2004, theCabinet
• instructed the Ministry of Works and Environ-ment Services to develop and implement anacceptable plan for regular excavation of graveland other materials that have accumulated in thebeds of streams in Rarotonga, as an urgent mea-sure to reduce the risk of flooding, now and inthe future; and
• approved submission of a proposal to New Zealand Assistance for International Develop-ment for funding the Cook Islands NationalSustainable Land Development and ResourceManagement Project.
The latter project builds on the approach taken,and methods used, in the Avatiu-Ruatonga CaseStudy. Significantly, the proposed decision supportsystem and land use management tools willconsider many factors in addition to climate-relatedrisks, in order to promote sustainable landmanagement plans and practices.
Climate Proofing the Community of Sapwohn,Sokehs Island, Pohnpei, the Federated Statesof Micronesia
A meet ing held to update members of thecommunity regarding the findings of the case study
resulted in the following recommendations:
• If funding assistance can be realized to put intoaction the findings of the case study, thenpriority should be accorded those who will beaffected most by climatic conditions, such asflooding from surface runoff or high sea levels.
• Make the road going up to the upper portion of the village an all-weather road, so that people who have land in the upper portion of the villagecan relocate to this area.
• Negotiate with the Nanmarki of Sokehs (theparamount traditional chief of Sokehs), the stategovernor, and whoever is responsible for publiclands, to make land available for the relocationof those who are staying with families inthe village but do not have land in the village.
• Discourage more dredging of the reef in front of the village.
• Have the Pohnpei state government relocate thesewage outfall situated on the leeward side of the
The Acting Prime Minister of the Cook Islands is briefed onthe case study findings.
At a Sapwohn Community Meeting, local residents discussthe findings of the case study.

8/13/2019 Climate Proofing: A Risk-based Approach to Adaptation
http://slidepdf.com/reader/full/climate-proofing-a-risk-based-approach-to-adaptation 105/219

8/13/2019 Climate Proofing: A Risk-based Approach to Adaptation
http://slidepdf.com/reader/full/climate-proofing-a-risk-based-approach-to-adaptation 106/219
79Key Findings and Recommendations
and appropriate evidence is to assess the recent andprojected changes in relevant variables for a locationor area of interest. The climate risk profiles (CRPs)for the FSM and the Cook Islands (Appendixes 1 and2, respectively) present the results of just suchassessments. They contain persuasive evidence that
significant changes in climate (notably in bothextreme events and interannual variability) will takeplace in the coming decades. Moreover, thesechanges are consistent with changes observed overthe past few decades, and in some cases even longer.
The variables considered in the risk profiles are:
• heavy rainfall events;• drought;• high sea levels and storm waves;• strong winds; and• extreme high air temperatures.
How will Climate Change Reduce ProjectSustainability (e.g., Lifetime)?
The increases in extreme events that form partof climate change will place increasing stresses onstructures, infrastructure, communities, and otherassets and entities. Take, for example, the portionof Kosrae’s circumferential road that is scheduled forconstruction this year or next. It will have a designlife of 50 years, and the design rainfall is the hourly rainfall with a return period of 25 years. Prior to thecase study activities, the road had been designedbased on an hourly rainfall of 177 mm. But moreaccurate estimates of hourly rainfall for Kosrae (noobserved data were available) suggested that thedesign rainfall should have been 190 mm and thatthis may increase to 254 mm by 2050.
Maintenance and repair costs for the 6.6 km of road were estimated for present conditions and forthe conditions projected to prevail under climate
change. The accumulated costs over the 50-year lifeof the road were $16 million and $5 million,respectively. These costs must be compared to theoriginal construction costs: $2 million if built to the
original design and $2.5 million if built to a climateproofed design. Clearly, the escalating repair andmaintenance costs will threaten the long-termviability of the road if it is not built to a climate-proofed design.
This example is used to underpin a general
response to the question. Project viability will bethreatened as a result of climate change unlessmeasures to address the increases in climate-relatedrisks are incorporated into the initial design of theproject.
How can Project Sustainability be MaintainedDespite Climate Change?
The short answer is by climate proofing theproject at the design stage.
Again, using the Kosrae road as an example, netpresent values for the 50-year life of the road wereestimated to be as follows:
Current design• no climate change $4.4 million• with climate change $7.8 million
Climate-proofed design• with climate change $5.0 million
The climate-proofed design yields an internalrate of return of 11%.
In Kosrae a similar section of road has already been built. It is instructive to compare theincremental costs of climate proofing the twosections of road. The incremental cost to climateproof the as yet unbuilt section is $77,000 per km, while the cost of retroactively climate proofing thecompleted portion is $243,000 per km—a muchmore expensive option.
The key message is that project viability is bestassured by ensuring that measures to address the
increasing climate-related risks are incorporatedinto the project design. Retroactive climate proofing adds significantly to project costs and may lead to afailed project.

8/13/2019 Climate Proofing: A Risk-based Approach to Adaptation
http://slidepdf.com/reader/full/climate-proofing-a-risk-based-approach-to-adaptation 107/219
Climate Proofing: A Risk-based Approach to Adaptation80
Will Addressing Climate Change IncreaseProject Costs and/or Reduce Project Viability?
Climate proofing may increase the capital costsof a project, but normally immediate gains will berealized, due to reduced maintenance and repair
costs. A key question is when will the savings offset
the higher initial costs? For the as yet unbuilt sectionof the Kosrae road, the answer is about 15 years. Thisemphasizes the need to assess costs over the designlife of the project (including decommissioning, if appropriate), rather than simply focusing onminimizing the initial capital costs.
What are the Implications for Governments?
Governments will have to cope with significantimplications, but they can be summarized asfollows:
• The likelihood of adverse weather and climateconditions has been shown to be already highand projected to increase in the future.
• The likelihood of adverse consequences of these weather and climate events is also already very high, and is likely to increase markedly as a resultof climate change.
• Most climate-related risks can be reduced in acost-effective manner.
• Care should be exercised to ensure that futuredevelopment does not exacerbate climate-related risks.
• Governments should ensure that all proposed,new, and upgraded development projects areclimate proofed at the design stage:
This should be part of good professionalpractice.National and state CRPs should be used asthe basis for “climate proofing”.
Compliance with this requirement should beassessed as part of enhanced (climateproofed) environmental impact assessment(EIA) procedures.
• Governments should undertake cost-benefitanalyses of all major development projects,including determining the incremental costs andbenefits. If it is a developing country, and the
incremental costs are large, the Governmentshould request developed country aid providersand other relevant agencies to fund thoseincremental costs.
• Governments should ensure that all regulations(e.g., building codes, public health regulations)
are also climate proofed, as this will allow enforcement of policies and plans that should,themselves, be climate proofed.
• Governments should consider developing andimplementing NGMACCs, similar to those in Appendixes 3 and 4, for the Federated States of Micronesia and the Cook Islands, respectively.
What are the Implications for ADB Operations?
Climate change poses a threat to importantdevelopment issues such as poverty reduction, water and energy supply, waste management , wastewater treatment, food security, human health,natural resources, and protection against natural
Figure VII.1. Linkages Between SustainableDevelopment, Climate Change, and the
Policies in these Areas
Source: CCAIRR findings.

8/13/2019 Climate Proofing: A Risk-based Approach to Adaptation
http://slidepdf.com/reader/full/climate-proofing-a-risk-based-approach-to-adaptation 108/219
81Key Findings and Recommendations
hazards. Development also impacts on climatechange.
Linkages between climate change anddevelopment are increasingly recognized (Figure VII.1) . Cl imate change is largely the result of human-induced greenhouse gas emissions that
are driven by socioeconomic development patternscharacterized by economic growth, technology,population growth, and patterns of governance.These socioeconomic development patterns, inturn, determine vulnerability to climate change andthe human capacity for greenhouse gas mitigationand for adaptation to climate change. The impactsof climate change on human and natural systemsin turn influence socioeconomic developmentpatterns and, hence, greenhouse gas emissions.
Increasingly, it is recognized that the artificialseparation of these activities results in missedopportunities for synergies, unrecognized andundesirable trade-offs, and mutual interference inensuring successful outcomes. The effect of climatepolicy integrated into wider development policiescan be greater than the sum of concurrent, unrelatedpolicies.
As noted by the GEF (2004) , the linkagesbetween adaptation and sustainable developmentcan be made at several different scales or levels:
Local level. The most severely impacted communi-ties in the developing countries will be those com-munities living in regions most exposed to climaticimpacts (e.g., flood- and drought-prone areas withincountries). As these people are often poorer than therest of the population within the country, they arein special need of targeting to provide support foradaptation to climate change.
Sector level . Within countries, the most adversely impacted sectors would include agriculture, water resource management, and coastal zone man-agement, as well as disaster management (e.g.,
floods, cyclones, and droughts). Policy makers, plan-ners, and managers in those sectors need toconsider the future impacts of climate change intheir sector planning;
National level . At the national level, policy makersneed to take into account the potential adverse impacts of climate change in planning their devel-
opment strategies within and across sectors. Animportant feature of national policymaking is theneed to strengthen existing policies and actions thatenhance a country’s ability to respond to its vulner-abilities to climate change, while seeking to ceasepolicies and actions that may lead to “maladapta-
tion” to climate change.
Regional and subregional level . Many climatechange impacts will be felt acutely at the regionaland subregional level in a number of key parts of the world; thus regional and subregional planning and coordinated actions may be called for.
Global level. The global nature of the challenge willrequire the global community to act together underthe United Nations Framework Convention onClimate Change (UNFCCC) as well as to respondcollectively to the impacts of climate change withinother development efforts: for example, many of theMillennium Development Goals may be in dangerof not being achieved due to the adverse impacts of climate change.
By way of example, the expected greatly increased frequency of extreme climate events hassignificant implications for energy supply, transfor-mation, distribution, use, and demand. Examplesinclude
• increased difficulty in supplying fuel fortransport and power generation from the highseas, making marine transport to islandsproblematic at times;
• damage to roads and bridges by high winds thatrestricts fuel deliveries by truck or tanker;
• physical storm impacts from winds and flying debris on photovoltaic energy supply systems;
• changes in rainfall quantities and patterns forhydro total energy generation and vulnerability to droughts, and thus the need to consider
increased storage in new and renovated hydroschemes;• increased maximum wind speeds impacting on
turbine and tower survivability risks for windpower;
• increased risks of damage to generation plantbuildings, infrastructure, distribution lines, andtransformers; and

8/13/2019 Climate Proofing: A Risk-based Approach to Adaptation
http://slidepdf.com/reader/full/climate-proofing-a-risk-based-approach-to-adaptation 109/219
Climate Proofing: A Risk-based Approach to Adaptation82
• increased demand for climate control to countermore frequent extreme high temperatures, suchas by the tourism sector.
For ADB to show leadership with respect toadaptation to climate change, it must ensure that
both its internal policies and procedures, and thenational implementation activities with which it isassociated, recognize the importance of
• enhancing enabling environments at thenational level, in the manner indicated in theNGMACCs (Annexes 3 and 4);
• maximizing the synergies between ADB’ssustainable development initiatives (e.g., poverty reduction) and its climate change initiatives;
• ensuring that all development projects with which it is associated comply with best profes-sional practices, including climate proofing projects, policies, and plans in ways that reduce,to an acceptable level, the risks identified innational CRPs; and
• preparing CRPs for all of ADB’s Pacific develop-ing member countries.
Experience in both the Cook Islands and theFSM is highlighting the importance of the enabling environment for successful adaptation, across allthe many dimensions of adaptation (see Figure IV.2).
Experience in both the Cook Islands and FSMis also highlighting the opportunities to exploit
synergies between ADB’s sustainable developmentinitiatives and climate change adaptation initiatives.Examples include ADB’s technical assistance inpreparing national and sector strategic developmentplans and in strengthening the regulatory environment and environmental management inthe Outer Islands of both countries.
Thus, we are seeing the benefits of the very strong and intentional complementarities betweenthe adaptation mainstreaming initiatives being undertaken within ADB and those developed anddemonstrated at the country level via the six casestudies prepared under TA 6064-REG ClimateChange Adaptation Program for the Pacific (SecondPhase, Country Level Activities), 2003.
Figure VII.2 highlights areas where efforts canbe made to maximize the synergies. Table VII.1indicates ways in which ADB might modify its
Figure VII.2. Nexus of ADB and Country-Level Adaptation Mainstreaming Activities
ADB = Asian Development Bank.Source: CCAIRR findings.

8/13/2019 Climate Proofing: A Risk-based Approach to Adaptation
http://slidepdf.com/reader/full/climate-proofing-a-risk-based-approach-to-adaptation 110/219
83Key Findings and Recommendations
policies and procedures to ensure that the designand funding implications associated with climateproofing its infrastructure, community, and otherdevelopment projects are addressed early in theproject cycle. Such initiatives mean that climateproofing will become an integral part of bestpractice, rather than a later add-on.
It would require that ADB continue to developmethods to identify, early in the project cycle, theincremental costs of this climate proofing (see Appendix 5), so that these costs can be met fromsources other than loans, etc., to the developing country. Sources could include the GEF and other
funding sources managed by ADB. Such moves would allow ADB to set and demonstrate a standardof good practice among multilateral lending institutions, with the hope that others will follow.
The following principles were used to guide thespecific suggestions as to how the ADB mightmainstream climate change adaptation in itspolicies and procedures:
• additions to policies and procedures must beconsistent with and add value to existing policiesand procedures;
• they must expedite project preparation andimplementation rather than add furtherrequirements and place additional work demands on staff; and
• they must not only reflect best practice, but infact lead it.
At a strategic level, CRPs (see Appendixes 1 and2 for examples) can help ensure that the Country Environmental Analysis gives adequate recognition
to climate-related risks. In turn, such risks shouldbe reflected in the Country Strategy and Program(CSP). Climate risks would be featured in the CSPin at least two ways: i) highlighting the need forprojects and other initiatives to be climate proofed,in order to address the risks identified in the CRP;and ii) identifying projects and other initiatives thatcould reduce the level of risk and at the same time
Table VII.1. Tools and Timing for Mainstreaming Adaptation in ADB Procedures
Source: CCAIRR findings.
Procedure Entry Point Timing Tools
Country Strategy and Program(CSP)
CSP Update(CSPU)
Country Environmental Analysis
CSP/CSPU
[Strategic EnvironmentalAssessment]
Climate Risk Profile
Management Status and GapAnalysis
Project PreparationTechnical Assistance
Technical Assistance Paper
Environmental Assessment, incl.Environmental Management Plan
Report and Recommendation of the President
Pre-DesignProject Design
Project Adaptation BriefTerms of ReferenceRapid Environmental AssessmentEnvironmental ImpactAssessment
Implementation Project Performance Report Project Implementation Environmental Management Pl
Project Completion andEvaluation
Project Completion Report
Project Audit Report Project Completion Performance Audit

8/13/2019 Climate Proofing: A Risk-based Approach to Adaptation
http://slidepdf.com/reader/full/climate-proofing-a-risk-based-approach-to-adaptation 111/219
Climate Proofing: A Risk-based Approach to Adaptation84
contribute to sustainable development. The CSPUpdate (CSPU) would be an ideal instrument toensure that the new understanding regarding climate-related risks, and how they might best beaddressed, is reflected and acted upon withoutundue delay.
At the operational (project) level, the CRP wouldprovide guidance to ADB staff who are preparing theproject preparatory technical assistance (PPTA).Specifically, the CRP would be used to ensure thatthe terms of reference for the technical assistanceinclude the requirement that climate risks bereflected in both pre-design work and the actualproject design. Under normal circumstances, bestpractice would automatically result in thisoccurring. But experience shows that many professionals are unaware of the need to take intoaccount current, let alone future, climate-relatedrisks. At best, they may be aware of the need, butlack the information and tools to meet such astandard. The CRP meets these needs, aided wherenecessary by a Project Adaptation Brief—in effect,a CRP tailored to a specific project.
If the process works as intended, reflecting climate-related risks in project design will becomestandard practice. Any lapses in the quality of the work will be detected in peer reviews of reportspresenting the results of the Initial EnvironmentalExamination and/or the EIA.
Further quality control on the process will comevia Project Performance Reports on the effectivenessof the Environmental Management Plan. The planshould include contingencies if the measures toaddress climate-related risks prove inadequate. Another, but similar, level of quality control wouldoccur after project completion, via the ProjectPerformance Audit.
At a higher level, these procedures would needto be recognized and formalized within ADB’spolicies.
C. The Global Environment Facility asOne Mechanism for FinancingAdaptation 2
The GEF is one source of financing for climate
proofing development projects, communities, andother vulnerable entities.
In response to the urgent needs of vulnerablecountries, in the last few years the Conference of theParties (COP) to the UNFCCC has given increasing recognition to the issues of climate changevulnerability and adaptation. The COP has requestedthe GEF to manage three new climate change funds.Only the first of the three funds described below isoperational. The Strategic Priority on Adaptation andthe Small Grants Program are also operational. Bothare also described below.
Least Developed Countries Fund
One specifically defined role for the LeastDeveloped Countries Fund is support of preparationand implementation of national adaptation programsof action (NAPAs) in Least Developed Countries.NAPAs are aimed at identifying the most at-risk areasand sectors in those countries and prioritizing urgent adaptation measures that they shouldimplement. The COP has thus requested the GEF tosupport implementation of NAPAs as soon aspossible after their completion and to develop draftoperational guidelines for this Fund.
Other activities supported through the Fundinclude
• strengthening national focal points to enableimplementation,
• training in negotiating skills and language,• promotion of public awareness programs,
• development of adaptive technology, and• strengthening of the capacity of meteorologicaland hydrological services to collect anddisseminate information.
Contributions to the Fund are voluntary.
2 Information in this section is based primarily on “GEF Assistance to AddressAdaptation”, GEF/C.23/Inf.8, 28 April 2004.
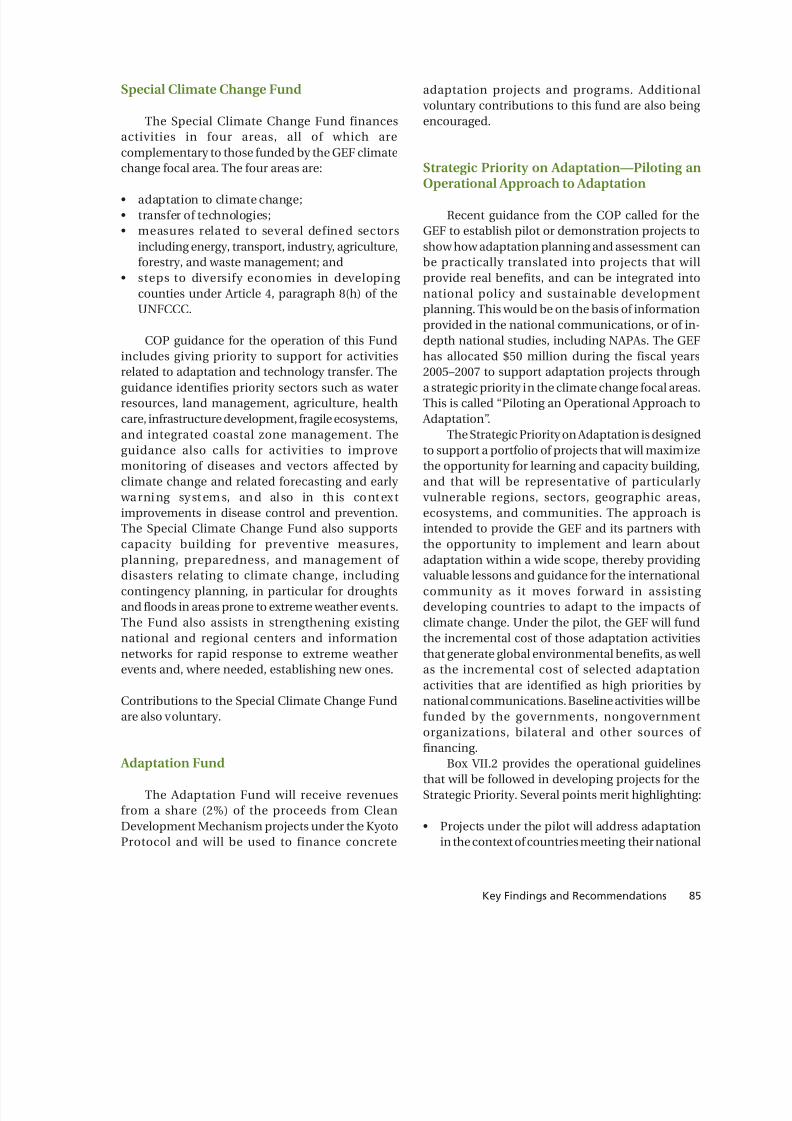
8/13/2019 Climate Proofing: A Risk-based Approach to Adaptation
http://slidepdf.com/reader/full/climate-proofing-a-risk-based-approach-to-adaptation 112/219
85Key Findings and Recommendations
Special Climate Change Fund
The Special Climate Change Fund financesactivities in four areas, all of which arecomplementary to those funded by the GEF climatechange focal area. The four areas are:
• adaptation to climate change;• transfer of technologies;• measures related to several defined sectors
including energy, transport, industry, agriculture,forestry, and waste management; and
• steps to diversify economies in developing counties under Article 4, paragraph 8(h) of theUNFCCC.
COP guidance for the operation of this Fundincludes giving priority to support for activitiesrelated to adaptation and technology transfer. Theguidance identifies priority sectors such as waterresources, land management, agriculture, healthcare, infrastructure development, fragile ecosystems,and integrated coastal zone management. Theguidance also calls for activities to improvemonitoring of diseases and vectors affected by climate change and related forecasting and early warni ng syst em s, and al so in th is cont ex timprovements in disease control and prevention.The Special Climate Change Fund also supportscapacity building for preventive measures,planning, preparedness, and management of disasters relating to climate change, including contingency planning, in particular for droughtsand floods in areas prone to extreme weather events.The Fund also assists in strengthening existing national and regional centers and informationnetworks for rapid response to extreme weatherevents and, where needed, establishing new ones.
Contributions to the Special Climate Change Fundare also voluntary.
Adaptation Fund
The Adaptation Fund will receive revenuesfrom a share (2%) of the proceeds from CleanDevelopment Mechanism projects under the KyotoProtocol and will be used to finance concrete
adaptation projects and programs. Additionalvoluntary contributions to this fund are also being encouraged.
Strategic Priority on Adaptation—Piloting an
Operational Approach to Adaptation
Recent guidance from the COP called for theGEF to establish pilot or demonstration projects toshow how adaptation planning and assessment canbe practically translated into projects that willprovide real benefits, and can be integrated intonational policy and sustainable developmentplanning. This would be on the basis of informationprovided in the national communications, or of in-depth national studies, including NAPAs. The GEFhas allocated $50 million during the fiscal years2005–2007 to support adaptation projects througha strategic priority in the climate change focal areas.This is called “Piloting an Operational Approach to Adaptation”.
The Strategic Priority on Adaptation is designedto support a portfolio of projects that will maximizethe opportunity for learning and capacity building,and that will be representative of particularly vulnerable regions, sectors, geographic areas,ecosystems, and communities. The approach isintended to provide the GEF and its partners withthe opportunity to implement and learn aboutadaptation within a wide scope, thereby providing valuable lessons and guidance for the internationalcommunity as it moves forward in assisting developing countries to adapt to the impacts of climate change. Under the pilot, the GEF will fundthe incremental cost of those adaptation activitiesthat generate global environmental benefits, as wellas the incremental cost of selected adaptationactivities that are identified as high priorities by national communications. Baseline activities will befunded by the governments, nongovernment
organizations, bilateral and other sources of financing.Box VII.2 provides the operational guidelines
that will be followed in developing projects for theStrategic Priority. Several points merit highlighting:
• Projects under the pilot will address adaptationin the context of countries meeting their national

8/13/2019 Climate Proofing: A Risk-based Approach to Adaptation
http://slidepdf.com/reader/full/climate-proofing-a-risk-based-approach-to-adaptation 113/219
Climate Proofing: A Risk-based Approach to Adaptation86
development objectives; adaptation activitiesmust be country-driven and integrated intonational sustainable development planning andpoverty reduction strategies.
• The pilot will offer the opportunity to testselected adaptation measures in key vulnerable
sectors; the experience and lessons from the pilotshould assist the global community as it seeks toaddress the issue of adaptation to climatechange.
• Selection of particularly vulnerable sectors willbe based on information contained in thenational communications to the UNFCCC,NAPAs, and other major national or regionalstudies.
• The pilot will include a mixture of large andmedium-sized projects; financing will also beprovided through the Small Grants Program.
• The level of GEF financing will be determinedon the basis of incremental cost reasoning; GEFresources will be related to the generation of global environmental benefits and will bedetermined on the basis of the incrementalcost principle. In addition, the GEF, when
appropriate, will finance the incremental cost of additional activities that a country must include within its development planning in order toaddress climate change impacts.
• It is expected that the incremental cost approachand cofinancing will be consistent with the GEFoverall portfolio experience. Cofinancing for eachproject will depend on the delivery of globalenvironmental benefits, additional costs associ-ated with actions necessitated by climate change,and the degree of capacity building; the larger theproject, the greater the expected cost sharing.
BOX VII.2Operational Guidelines for the Strategic Priority “Piloting an Operational Approach to Adaptation”
The following operational guidelines apply to the pilot:
• The guidance from the United Nations Framework Convention on Climate Change requests the GlobalEnvironment Facility (GEF) to establish “pilot ordemonstration projects to show how adaptation planning and assessment can be practically translated into national
policy and sustainable development planning.”• “Activities to be funded should be country-driven, cost-
effective, and integrated into national sustainabledevelopment and poverty-reduction strategies.” Theadaptation measures will be guided by such preparatory work as the fir st and second national communications,National Adaptation Programs of Action (NAPAs), andother relevant country studies.
• The portfolio is designed to maximize the opportunity for learning and capacity building and will berepresentative of particularly vulnerable regions, sectors,geographic areas, ecosystems, and communities.
• The experiences and lessons from the projects should beapplicable in a wide context: the GEF will use experiencefrom the strategic priority to develop good practices andestimates of the costs of adaptation to better mainstreamadaptation into the full range of GEF activities;
• The pilot or demonstration projects must include (i)activities within a natural resources management contextthat generate global environmental benefits, and (ii)
adaptation measures that provide other majordevelopment benefits (e.g., water, energy, healthcare,agriculture, biodiversity).
• The existing eligibility criteria for GEF funding, such ascountry drivenness, ecological and financial sustainability,replicability, stakeholder involvement, etc., will be appliedto the projects submitted under the Strategic Priority;
• The Strategic Priority is funded to $50 million over 3 yearsand will require a mixture of 20 to 30 large and medium-sized projects to construct an appropriate portfolio. It isenvisaged that about $5 million will be set aside for theSmall Grants Program.
• It is expected that the incremental cost approach andcofinancing will be consistent with GEF practices andoverall portfolio experience; cofinancing for each project will depend on the del ivery of glob al envi ronmentalbenefits, additional costs associated with actionsnecessitated by climate change, and the degree of capacity building. The larger the project, the greater theexpected cost sharing;
• A monitoring and learning program to achieve activelearning and dissemination during the development andimplementation of the whole portfolio will be considered.
The pilot on adaptation became operational on July 1, 2004.
Source: Information in this section is based primarily on “GEF Assistance to Address Adaptation”, GEF/C.23/Inf.8, 28 April 2004.

8/13/2019 Climate Proofing: A Risk-based Approach to Adaptation
http://slidepdf.com/reader/full/climate-proofing-a-risk-based-approach-to-adaptation 114/219
87Key Findings and Recommendations
Small Grants Program
Recognizing that small communities are oftenthe most severely affected, yet the least equipped todeal with the impacts of climate change, up to 10%of the resources under the Strategic Priority on
Adaptation will be allocated to the GEF Small GrantsProgram. It will work with the GEF Secretariat andthe implementing agencies to pilot community adaptation initiatives through its existing smallgrants program. The Program will
• develop community-based capacity and tools torespond to adaptation;
• finance diverse community-based adaptationprojects in a number of selected countries; and
• capture and disseminate lessons learned at thecommunity level.
In order to be eligible for GEF funding,community adaptation projects must also satisfy thecriteria of adaptation incrementally (Box VII.2).Interventions will include both activities thatgenerate global environmental benefits andactivities that generate broader development andlocal benefits (e.g., in the water, health care, andagriculture sectors).
Pilot activities under the Small Grants Program will be implemented in three overlapping phases:
• Phase I. Program-wide capacity development onadaptation and developing effective manage-ment procedures for the use of grants: capacity development will be at the global level, country program level, and local level.
• Phase II. Funding for a portfolio of community-based adaptation projects in a number of selectedcountries: this phase will also focus on capacity development, primarily at the local level.
• Phase III. The final phase is meant for effectivecapturing of lessons; it will involve continuous
monitoring and evaluation of the country programs to assess lessons, and disseminate theoverall results of the pilot program.
The Small Grants Program strategy will facilitateinterlinkage of the pilot community adaptation mea-sures with other GEF and non-GEF national adapta-tion activities. It is envisaged that communities living
in countries representing different ecosystems andnatural resource management practices will beselected for funding of adaptation initiatives. Forexample, the portfolio will include some Least Devel-oped Countries and Small Island Developing States,as well as countries with mountainous ecosystems,
coastal ecosystems, flood plains, and dry lands.
Mainstreaming Adaptation into Other GEFFocal Areas
Projects funded under the Strategic Priority for Adaptation will build on and expand the scope of theexisting adaptation experience of the GEF portfolio, which generates global environmental benefits andemphasizes linkages among all focal areas.
Vulnerability and adaptation to climate changeare becoming increasingly relevant components inprojects across all GEF focal areas. The GEFportfolio in biodiversity, international waters, andland degradation includes selected examples of activities that build capacity or support measuresthat help countries respond to the consequencesof climate change. However, this support is typically indirect and rarely if ever undertaken specifically because of ongoing or expected climate risks.Untapped opportunities to integrate adaptationconcerns into these focal areas appear to exist,thereby strengthening within GEF-financed projectsthe linkages between climate change and theattainment of other global environmental objectives.
At the end of the pilot, in addition to the lessonsthat are learned from projects directly financedunder the Strategic Priority, the GEF should also beable to point to a strengthened portfolio of activitiesin all areas that serve to enhance the capabilities of countries to adapt to climate change impacts in allfocal areas. At the end of the pilot, adaptation shouldthus be fully mainstreamed in the GEF portfolio.
D. Lessons Learned and Demonstrated
Numerous lessons were learned during thepreparation of the case studies, and from associatedactivities. Those demonstrated by the case studiesare summarized in Box VII.3.

8/13/2019 Climate Proofing: A Risk-based Approach to Adaptation
http://slidepdf.com/reader/full/climate-proofing-a-risk-based-approach-to-adaptation 115/219
Climate Proofing: A Risk-based Approach to Adaptation88
BOX VII.3Key Lessons Learned and Demonstrated
Climate change will manifest itself largely as changes in thefrequency and consequences of extreme events andinterannual variations (e.g., the El Niño Southern Oscillation),rather than as long-term trends in average conditions.
The climate risk profiles for both the Cook Islands and theFederated States of Micronesia reveal high current levels of risk related to extreme rainfall, drought, strong winds, highsea levels, and extremely high temperatures, with most of these risks projected to increase substantially in the nearterm as a consequence of global warming.
While uncertainties abound in projection s of greenhousegas emissions, and of the response of the global climate asestimated by models and other methods, confidence inestimates of future changes in climate-related risks areimproving, due to the consistency in i) model-basedprojections of changes in the likelihoods of extreme eventsand climate variability, and ii) between these projectionsand the observed changes in these likelihoods over recentdecades.
While incon sistent with international conventions, at apractical level adaptation should thus focus on reducing both present and future risks related to climate variability and extremes. In many instances current l evels of climaterisk are already high, due to increases in risk over the pastfew decades. Adapting to current climate extremes andvariability prevents precious financial and other resourcesfrom being squandered on disaster recovery andrehabilitation, and is an essential step to being able to withstand the pending changes in cl imate.
A risk-based approach to adaptation is both desirable andpracticable:
• It combines both the likelihood and consequencecomponents of climate-related impacts.
• It assesses risks for both current and anticipatedconditions, with the option of examining either specificevents or an integration of those events over time.
• Risk assessment and management are common to many sectors—e.g., health care, financial, transport,agriculture, energy, and water resources.
• Familiarity of planners and decision makers with risk management facilitates mainstreaming of risk-basedadaptation.
• It facilitates an objective and more quantitativeapproach, including cost-benefit analyses that result inevaluation of the incremental costs and benefits of adaptation and assist in prioritizing adaptation options.
• It involves many players but also provides a framework that facilitates coordination and cooperation, including the sharing of information that might otherwise beretained by information “gate keepers”.
• It is linked to sustainable development by identifying those risks to future generations that present generations would find unacceptable.
Adaptation has many dimensions and must be viewed as aprocess. This means that a framework and associatedmethodology are essential:
• Adaptation takes place at many levels, and these need tobe linked across the full ranges of time frames, spatialscales, and sectors.
• The success of adaptation is enhanced by integration of bottom-up and top-down approaches.
• Top-down activities should focus on creating a favorableenabling environment, such as by climate proofing policies, plans, and regulations. This is a prerequisite tosuccessful adaptation and should be the major emphasis
and benefit of adaptation mainstreaming.• Bottom-up approaches reflect the fact that adaptationtypically takes place at the local level—in communities,households, businesses, etc.
• Climate Change Adaptation through Integrated Risk Reduction (CCAIRR) operationalizes the framework andprovides relevant methodologies.
• Decision support tools, such as SimClim, that facilitateintercomparison of adaptation measures, are fun-damental to ensuring the effectiveness of adaptation.
Typically, adaptation is a cost-effective intervention,especially when implemented at the concept and designstages of a project. Retrospective adaptation normally incurs far greater costs.
Climate change, especially through changes in extremeevents and variability, has the potential to reduce projectsustainability, such as the effective lifetime of infrastructure,community, and other development projects.
Project sustainability can be maintained, however, despiteclimate change, through timely identification of theclimate-related risks and implementation of measures toreduce those risks to an acceptable level.
Addressing climate change is unlikely to increase projectcosts, and hence reduce project viability, but this requiresthat costs and benefits be evaluated over somewhat longertimeframes than is common practice today.
The case studies give rise to messages that must be listenedto and acted upon by governments, multilateral financialinstitutions, and the other players who have key roles inenhancing the enabling environment for adaptation.
Source: CCAIRR findings
8/13/2019 Climate Proofing: A Risk-based Approach to Adaptation
http://slidepdf.com/reader/full/climate-proofing-a-risk-based-approach-to-adaptation 116/219
89Key Findings and Recommendations
E. Barriers to Successful Applicationof the CCAIRR Framework andMethods
Before generalized findings and lessons can bedrawn from case studies prepared using a risk-basedapproach to adaptation, many more examples willneed to be developed. As noted above, all the currentproject- and community-focused case studiespresented in this book relate to high islands in thePacific and, with only one exception, to islands on which the national capital is located.
Experience gained in using the Climate Change Adaptati on through Integrat ed Risk Reduct ion(CCAIRR) framework and methods has resulted inthe recognition of a number of impediments to itsmore widespread application. None of these is criti-cal, and advance knowledge of the challenges andlimitations will help ensure that planning for thepreparation of additional case studies, as well as forthe practical application of adaptation measures,can take these limitations into consideration andthus reduce their impact appreciably.
It is desirable to have internationally consistentassessment methodologies. International agencies,such as the IPCC, play major roles in establishing best practices. They would need to formally endorseand encourage a risk-based approach to adaptationbefore widespread uptake occurs. Present bestpractice favors the more traditional assessments of vulnerability and of adaptation options. Thelimitations of such approaches have traditionally included
• a lack of formal assessment of the likelihood of future extreme events or variations in climate orof baseline conditions;
• a focus on individual events (e.g., an extremerainstorm or a cyclone) or on a future date, rather
than on an aggregation of the anticipatedclimatic conditions over a specified time periodin the future;
• the inability to differentiate between the costs of current climate extremes and variability and thefuture costs of those events, plus any systematictrend (i.e., inability to evaluate the incrementalcosts of climate change);
• the difficulty of incorporating economic, social,and wider environmental scenarios into theassessment procedures;
• lack of a functional link between the vulnerability and adaptation assessments; and
• lack of formal procedures for priorit izing
adaptation options on the basis of cost and othermeasures of efficiency and effectiveness.
Until a risk-based approach to adaptation isformally endorsed and encouraged, documentationand training opportunities will be lacking. While arisk-based approach requires no greater skills andexperience than are called for in the traditionalassessments, building a cadre of in-country expertiseis necessary. While parallel frameworks andmethodologies are being advocated, confusion andarguments for maintaining the status quo will occur.
Once these initial barriers have been overcome,and a commitment has been reached to undertakea specific risk-based assessment, operationalbarriers may occur. Most of these exist even withthe more traditional vulnerability and adaptationassessments, but some barriers may be increased,at least in the initial implementation of a risk-basedapproach. Many barriers also relate to informationaccess, but additional barriers include the need for
• formal specification of risk-based targets thatdefine future levels of acceptable risk, requiring consultation with, and consensus among, key stakeholders;
• specification of relationships betweenmagnitude and consequence of risk events of relevance, which are usually presented in theform of stage-damage curves (see Chapter VIII);
• “rules” that specify future social, economic, and wider environmental changes; and
• appropriate discount rates to be applied to futurecosts and benefits: in SimClim the discount rateis set by the user and can be adjusted without
needing to rerun each simulation.
For the current case studies, all these barriers were overcome. Future efforts to develop additionalcase studies, as well as to support the practicalapplication of adaptation measures, can build onboth the methodologies and experience gained inpreparing the current case studies. Thus, the barriers

8/13/2019 Climate Proofing: A Risk-based Approach to Adaptation
http://slidepdf.com/reader/full/climate-proofing-a-risk-based-approach-to-adaptation 117/219
Climate Proofing: A Risk-based Approach to Adaptation90
are unlikely to be as imposing as for the initial work reported in this book.
The barriers to information access may proveto be more intractable, though again, experience inpreparing the current case studies provides somegrounds for optimism. A risk-based approach to
adaptation is also an “information-based” approach.This is both a demonstrated strength and a potential weakness.
Information is required to define current returnperiods (and hence likelihoods) for the risk eventsof interest (e.g., extreme high sea levels). In somecases, data may not be available for the study region,or only a short period of record is available. Suchproblems are not specific to the risk-basedapproach. Thus, regardless of the approach,innovative solutions must be found. For example,as noted in the Kosrae road case study, no in situmeasurements of sea level have been made inKosrae. However, satellite-based measurements of sea level were shown to be consistent with moreconventional observations (see Appendix 1) andtherefore provide a way to overcome the absence of in situ measurements. Another example relates tothe unavailability of long-term rainfall data for thespecific catchment that contributes to the flooding of Avatiu-Ruatonga. Fortunately, short-term rainfalland runoff measurements were available for thatcatchment. These were used to scale the long-termrainfall records available for a site that was not asrepresentative of the catchment conditions. Butsome data were missing from the long-term daily rainfall records for Rarotonga. A relationshipbetween rainfall observations for that and a nearby station was used to fill in the missing data.
Significantly, the available information usually requires additional processing in order to estimatecurrent return periods for the risk events. A simpletabulation of descriptive statistics such as the mean,or even percentiles, is insufficient. Moreover, thedata must have an appropriate time resolution:
hourly, daily, monthly, annual. For example, if therisk events are extreme rainfall and associatedflooding, and the catchments are of a size similar tothose in Kosrae, Pohnpei, and Rarotonga, an hourly or 2-hourly time resolution will be required. On theother hand, drought studies can use monthly rainfalltotals.
The preceding requirements mean that theoriginal data must be accessible, in order to allow for these customized analyses. The main challengeis often gaining access to the original data, ratherthan issues related to data format or the subsequentanalyses. Decision support tools, such as SimClim,
support the importing of data in various formats andenable return periods and related statistics to bedetermined with ease.
The case study experience also provides someoptimism regarding access to original observeddata. First, requests were made by local membersof the CCAIRR team. These individuals were alsotrained in undertaking the subsequent analyses.Both these approaches were also consistent with thephilosophy of enhancing local capacity. Secondly,information providers saw the planned analyses asadding importance and value to the data in theirpossession. They were also given the opportunity to undertake the necessary analyses, increase theirown expertise, and thus be able to respond to futurerequests from any parties.
A si mi la r si tuat ion exis ts rega rding theinformation required to determine risk event returnperiods for times in the future. Scenarios of climate-related risk events are normally based on the outputof GCMs, but the standard GCM output must beprocessed in order to derive the return periods andrelated statistics. An alternative approach is to usea decision support tool such as SimClim, which usesinbuilt routines, including GCM results, to scale theobserved data and subsequently determine therequired statistics for a specified time in the future(see Chapter VIII).
Other data requirements include the informationnecessary to characterize the topography of the study area (for flooding due to rain and/or high sea levels)as well as the socioeconomic conditions. As isevident from the Avatiu-Ruatonga and Sapwohncase studies, available elevation data seldom havethe spatial and elevation resolutions required to
estimate flood depths and extent. The former casestudy showed that it is possible to generate therequired information relatively quickly, at low cost,and with adequate spatial and height resolutions,provided the necessary Global Positioning Satellite(GPS) equipment and suitably qualified operatorsare available. For Sapwohn, it was necessary to use

8/13/2019 Climate Proofing: A Risk-based Approach to Adaptation
http://slidepdf.com/reader/full/climate-proofing-a-risk-based-approach-to-adaptation 118/219
91Key Findings and Recommendations
Total Station Survey equipment, in part because theoverhead vegetation made GPS equipmentinoperable. That approach was more time-consuming, but did demonstrate alternative ways tomeet the need for such information.
The area and location of structures can be
obtained from diverse sources or by a variety of methods. For the Sapwohn and Avatiu-Raratongacase studies, these included use of aerial photo-graphs, census records, and direct observation.
For the Sapwohn case study, other socioeco-nomic information was obtained from the censusrecords, or by way of simple and rapid on-the-ground observations. Normally, census data is only available in aggregated form, and not for individualstructures. To overcome this constraint, a localmember of the CCAIRR team was sworn in as a cen-sus officer. He subsequently processed the data intothe aggregated form required for analysis, using SimClim.
In the case of the Avatiu-Ruatonga case study,the necessary socioeconomic information wasacquired from census data in the public domain orby direct observation.
Finally, another important item of informationis the cost of the adaptation measures being evalu-ated in the cost-benefit and other analyses. Appro-priately qualified and experienced professionals were asked to estimate the costs, with a representa-tive value being chosen for the analyses. In SimClim,these costs are set by the user, who can subsequently assess the extent to which uncertainties in these costestimates impact on the prioritization of the adap-tation options.
F. Recommendations
Several recommendations evolved frompreparing the case studies and from associatedactivities. Many were prepared, reviewed, andendorsed at the concluding Tripartite Review Meetings held in the FSM and the Cook Islands.
Recommendations Arising from the Final Tri-partite Review Meeting—Cook Islands
The four Cabinet decisions related to theClimate Change Adaptation Program for the Pacific(CLIMAP) should be followed up and implemented
in a timely manner:
• NGMACCs: implementation will strengthen theenabling environment for adaptation andintegrate adaptation with other developmentinitiatives.
• Climate proofing the National SustainableDevelopment Strategy: implementation willenhance the sustainability of developmentinitiatives, in a cost-effective manner.
• Developing a plan for excavating gravel and othermaterials from stream beds in Rarotonga:implementation will reduce current and futurerisks of flooding from heavy rainfall events.
• Securing funding and implementing the activi-ties proposed in the Cook Islands National Sus-tainable Land Development and Resource Man-agement Project: this is a vehicle for applying therisk-based approach to adaptation and extend-ing it to the Outer Islands as well as to theremainder of Rarotonga.
The Government of the Cook Islands should beassisted to secure financing to cover at least theincremental costs of climate proofing communitiesand other assets on the north coast of Rarotonga,and in other vulnerable areas.
The Ministry of Works should continue to actas the focal point for facilitating implementation of the risk-based approach to adaptation.
The Disaster Management Unit should be madefully resourced and functional, and its work harmonized with adaptation initiatives in Rarotongaand the Outer Islands.
The Climate Change Country Team of key play-
ers and stakeholders should be strengthened andinstitutionalized, so as to have oversight of a pro-grammatic approach to climate change responsesin the Cook Islands, with emphasis on empowering and delegating responsibilities to communities.

8/13/2019 Climate Proofing: A Risk-based Approach to Adaptation
http://slidepdf.com/reader/full/climate-proofing-a-risk-based-approach-to-adaptation 119/219
Climate Proofing: A Risk-based Approach to Adaptation92
The Climate Change Adaptation Program forthe Pacific (CLIMAP) results should be used in theCook Islands Second National Communication tothe UNFCCC.
The use of the risk-based approach should bepromoted regionally and internationally, in part by
including sessions on the CLIMAP case studies inregional and international workshops being convened to address climate, development, andrelated issues.
Existing information should be made accessibleto those undertaking future assessments of climaterisk and adaptation.
The case study findings should be made widely available, including being used in preparing materials for the media and in other awareness-raising initiatives.
Follow-up on the case studies should becoordinated and integrated with initiativesundertaken as part of the Comprehensive Hazard Assessment and Risk Management program.
Roles and priorities should be assessed inclimate change work, awareness raising, and action,especially at the community level, including
• developing and highlighting viable adaptiveresponses to climate change —”action, notgloom and doom”;
• identifying ways for awareness of climate changeto initiate action in multiple target groups,including grassroots;
• using Cook Islands Maori in consultations andin preparation and delivery of materials, and inthe gathering of anecdotal and other informationon community examples; and
• assessing the effectiveness of consultation,awareness raising, education, and relatedprograms undertaken at community level(possibly by a research student).
Climate change should be incorporated into the
NDS and actions should be discussed at theupcoming National Environment Forum, including assessments of climate-related risks.
Integration of science and social science in pri-mary school should be encouraged, where appro-priate, and climate change should be promoted asa context for learning in science and social science.
The World Wide Fund for Nature initiative inenvironmental education should be supported.
Local resources (e.g., funding, teacher training)should be provided for the schools to promoteclimate change.
Recommendations Arising from the FinalTripartite Review Meeting—Federated States of Micronesia
State governments should strengthen existing and pending regulations in ways that reflectprojected increases in climate-related risks.
National and state governments should adoptthe NGMACCs.
The national and state governments should cli-mate proof relevant policies and plans in order tostrengthen the enabling environment for adapta-tion, thereby ensuring that future infrastructure andother development projects are themselves climateproofed.
ADB should facilitate the climate proofing of allfuture infrastructure and other developmentprojects in the FSM; the first few projects to beclimate proofed should be documented anddisseminated as case studies.
ADB should assis t participating countr ies tosecure external funding of the incremental costs of adaptation for the case study projects.
Given that the case studies were developed aspart of a regional project, ADB should convene aspecial regional workshop, or add sessions to already scheduled workshops, to enhance the uptake of thecase study findings and methods by other PacificIsland Countries.
The management and administrative arrange-
ments that contributed to the successful preparationof the case studies should be highlighted, specifically in the FSM, as well as the lessons learned that wouldfacilitate improved implementation of similar ADBactivities in the future.

8/13/2019 Climate Proofing: A Risk-based Approach to Adaptation
http://slidepdf.com/reader/full/climate-proofing-a-risk-based-approach-to-adaptation 120/219

8/13/2019 Climate Proofing: A Risk-based Approach to Adaptation
http://slidepdf.com/reader/full/climate-proofing-a-risk-based-approach-to-adaptation 121/219
Climate Proofing: A Risk-based Approach to Adaptation94
• Use national CRPs to provide guidance to ADBstaff preparing PPTAs, thus ensuring that theterms of reference for the technical assistanceinclude the requirement that climate risks bereflected in both pre-design work and the actualproject design.
• Adopt the Project Adaptation Brief as a way totailor the CRP to a specific project.
The results of the present case studies shouldbe used to highlight the following observations:
• It is possible to enhance the sustainability (e.g.,lifetime) of projects at risk to climate change by climate proofing such projects at the design stage,noting that this will normally require a smallinvestment relative to the additional maintenanceand repair costs otherwise incurred over thelifetime of the project.
• Many adaptation options qualify as “no regrets”adaptation initiatives, including being costeffective.
• Retroactive climate proofing is likely to beconsiderably more expensive than thatundertaken at the design stage of a project.
• Governments should reflect these findings by ensuring that all projects are climate proofed atthe design stage, making this part of goodprofessional practice.
• Governments of developing countries shoulddetermine the incremental costs and benefits of
all major development projects and request thatdeveloped country aid providers and otheragencies fund these incremental costs.
• National- and subnational-level regulationsshould be climate proofed, as this will allow enforcement of policies and plans that should
themselves be climate proofed in accordance with the NGMACCs.
If a risk-based approach to adaptation is to gainfull acceptance, further attention needs to be givento methods that support
• formal specification of risk-based targets thatdefine future levels of acceptable risk;
• determination of the damage costs of flooding from heavy rainfall and sea surges, in combi-nation;
• specification of relationships between thelikelihood and consequence of risk events of relevance, and especially the refinement of stage-damage curves;
• quantification of the social, environmental, and wider economic costs of climate variability andchange, including extreme events;
• “rules” specifying future social, economic and wider environmental changes; and
• selection of appropriate discount rates to beapplied to future costs and benefits.

8/13/2019 Climate Proofing: A Risk-based Approach to Adaptation
http://slidepdf.com/reader/full/climate-proofing-a-risk-based-approach-to-adaptation 122/219
95Elaboration of the Approach, Methods, and Tools
A. Introduction
As indicated in Figure VIII.1, this chapter
provides additional information on theapproach, methods, and tools usedduring preparation of the case studies. It
also elaborates the methods that might be used toincorporate climate change adaptation into policy development, planning, and decision-making processes at the national level.
B. Approach, Methods, and Tools foran Integrated, Risk-Based Approachto Adaptation
Consistent with the idea of adaptation as anongoing, flexible process, a comprehensive, inte-grated approach is required. It must address thecapacity to adapt, as well as facilitate implementa-tion of specific adaptation measures. Consequently,and as illustrated in Figure IV.1, the approach de-veloped and applied in the case studies included thefollowing linked initiatives and activities:
• capacity building, including awareness raising,empowerment, advocacy, and institutionalstrengthening;
• provision, enhancement, and application of data,tools, and knowledge;
Elaboration of the Approach,
Methods, and Tools
BOX VIII.1Key Points for Policy and Decision Makers
Additional information is provided on
• an integrated risk-based approach to adaptation, andspecifically the Climate Change Adaptation throughIntegrated Risk Reduction framework and methodology;
• application of risk characterization and managementmethods to adaptation;
• characterizing baseline conditions;• building and characterizing scenarios, including
scenarios for climate change, sea-level rise, andsocioeconomic conditions;
• cost-benefit analysis for evaluating adaptation;• mainstreaming adaptation in national development
planning and implementation;
• adaptation mainstreaming guidelines; and• SimClim, a decision support tool for a r isk-based
approach to adaptation.
Source: CCAIRR findings.
• identification, characterization, and manage-ment of risks related to climate variability andchange, including extreme events;
• mainstreaming climate change and adaptationinto policies, plans, and development strategies;and
• monitoring and evaluation so that the manage-ment of risks and response capabilities are as-sessed and improved over time.
CHAPTER VIII

8/13/2019 Climate Proofing: A Risk-based Approach to Adaptation
http://slidepdf.com/reader/full/climate-proofing-a-risk-based-approach-to-adaptation 123/219
Climate Proofing: A Risk-based Approach to Adaptation96
Consultation with stakeholders is an ongoing process, and is one way in which the necessarily strong linkages between these components can beassured.
It is important that, over time, economic andsocial development should proceed with due regardfor the need to implement specific adaptationmeasures. These include avoidance of developmentin highly hazardous areas; soft and hard coastalprotection; safe building practices and infrastructuredesigns; and strengthened policies, plans, and
regulations that address climate-related risks. In thismanner, development becomes climate-proofed toacceptable levels of risk associated with futurechanges in climate and sea level.
Since the approach is both risk-based andintegrated, it is referred to as “climate changeadaptation through integrated risk assessment,” or
Figure VIII.1. Structure and Content of the Chapter
Source:CCAIRR findings.
CCAIRR (pronounced “care”). The collection of activities makes up the “CCAIRR package”. It isimportant to note that the application of CCAIRR isiterative, involving a number of repetitions of theprocess. CCAIRR can be used in both a rapidassessment mode or in a more comprehensive risk-based approach to adaptation. Both were used inthe preparation of the case studies presented in thisbook. The rapid assessment mode was employed aspart of the initial consultation process to identify potential case studies (see Figures VI.1 and V1.2),
including the nature of the climate-related risks,current capacities to address the risks, shortfalls inthis capacity, and availability of relevantinformation. The framework and methods thatconstitute the full CCAIRR package were used in thepreparation of the case studies selected forpresentation in this book.

8/13/2019 Climate Proofing: A Risk-based Approach to Adaptation
http://slidepdf.com/reader/full/climate-proofing-a-risk-based-approach-to-adaptation 124/219
97Elaboration of the Approach, Methods, and Tools
Adaptation Rapid Assessment Methodology
The first iteration of the CCAIRR approach, the Adaptation Rapid Assessment (ARA) mode, is usedto provide a situation analysis for a risk-basedadaptation study, including documenting the
baseline conditions for subsequent implementationof more comprehensive initiatives leading toadaptation. The procedures for a first-order ARA areconsistent with the five components of the CCAIRRpackage spelled out below. It is important to bear inmind that, in practice, the components are bestaddressed in parallel activities, rather than as linearand sequential steps.
a. Component 1: Capacity Assessment andStrengthening
The rapid assessment begins with anassessment of the extent to which climate changeand climate-related risks are part of the currentmanagement of resources, assets, and development. A consultative and interactive approach is used todevelop the broad picture of the study area and typesof risks faced in the local situation. It also involvesan initial appraisal of the level of skills and technicalcapacity for characterizing and managing such risks.
b. Component 2: Knowledge, Data, and Tools
This component involves a first-orderidentification and assessment of sources of existing knowledge, data, and tools that are applicable tohigh-priority risks, areas, and development projects.
c. Component 3: Rapid Risk Assessment
The third component is based around a first-order assessment of the current risks posed by climate variability and extreme events, as well as anestimation of the extent to which future changes in
the climate and sea level could exacerbate theserisks.
d. Component 4: Mainstreaming
As noted earl ie r, ma inst ream ing requiresactions intended to result in the reflection of alldimensions of adaptation to climate variability and
change in development policies, plans, strategies,regulations, and practices—potentially from local,regional, and state through to national (and eveninternational) levels. The intention is to create anenabling environment that will encourage andpromote, in a routine and sustained manner, both
the capacity to adapt and the incorporation of specific adaptation measures into evolving patternsof socioeconomic development and change.
e. Component 5: Monitoring and Evaluation
Ultimately, the success of the adaptationinitiatives depends on the degree to which theprocess is self-sustaining. If adaptation is viewedcorrectly as a dynamic, evolving process that canadjust to changing information and circumstancesover time, procedures for monitoring and evaluating any changes in risk, and the success and failures of adaptation initiatives, must be in place in order toprovide the necessary feedback. Such feedback willlead to modification of policies, plans, andimplementation measures. Thus, Component 5includes a first-order appraisal of the existing capacity for such monitoring and evaluation, andidentifies the requirements and mechanisms for any strengthening that might be needed.
Collectively, the components of the CCAIRR ARA mode provide a solid foundation and blueprintfor the next iterations of the comprehensive CCAIRRapproach, as demonstrated here using the casestudies. In combination, the five components of the ARA will paint an initial, integrated picture of
• the types and relative importance of climate andsea-level extremes and the nature and relativemagnitude of the risks they pose to communitiesand other groupings, including priority foci forsubsequent detailed assessments;
• the extent to which such risks and managementoptions are currently perceived and incorporated
into policy, planning, and decision making atvarious levels, from local practices andregulations to national policy, and the windowsof opportunity for improvement; and
• the existing capacity to adapt to present andfuture risks in the context of sustainabledevelopment and management, and the ways in which the adaptive capacity could be enhanced

8/13/2019 Climate Proofing: A Risk-based Approach to Adaptation
http://slidepdf.com/reader/full/climate-proofing-a-risk-based-approach-to-adaptation 125/219
Climate Proofing: A Risk-based Approach to Adaptation98
by strengthening individual skills, technical andinstitutional capabilities, and the enabling environment for decision making.
In short, because it is largely a consultativerather than a highly technical process, the CCAIRR
ARA sketches the baseline situat ion and lays thefoundation upon which subsequent activities andactions can build in order to promote climate changeadaptation through integrated risk reduction.
The following sections describe the mainelements of the CAAIRR framework and methods.Each element corresponds to a component of the Adapta ti on Rapi d Asse ss ment me th odol ogy discussed above, but involves more detailed andcomprehensive assessments and analyses.
Using Risk Characterization and ManagementMethods in Support of Adaptation
Risk characterization and management are thebasis of Component 3 of the CCAIRR Methodology. As shown in Figu re VIII .2 , the approach tocharacterizing and managing risk is well established.
When its is used within the CCAIRR framework,the risk-based methodology makes explicit the link between climate-related risks and the actions (i.e.,adaptation measures) required to reduce them toacceptable levels. In this way a major shortcoming of the widely used approach of vulnerability and
adaptation assessments is overcome. In thatapproach, no mechanism directly links the findingsof the vulnerability assessment with the process of identifying and prioritizing appropriate adaptationstrategies.
As noted in the previous chapter, a risk-basedapproach also avoids other limitations in the moreconventional vulnerability and adaptationassessments. These include the absence of a formalassessment of the likelihood of future extremeevents or variations in climate or baselineconditions; emphasis on individual events or on afuture date, rather than on an aggregation of theanticipated climatic conditions over a specified timeperiod into the future; the inability to evaluate theincremental costs of climate change; the difficulty of incorporating economic, social, and widerenvironmental scenarios into the assessmentprocedures; and the absence of formal procedures
Figure VIII.2. Generic Steps and Activities for Characterizing and Managing Risk
Source: CCAIRR findings.

8/13/2019 Climate Proofing: A Risk-based Approach to Adaptation
http://slidepdf.com/reader/full/climate-proofing-a-risk-based-approach-to-adaptation 126/219
99Elaboration of the Approach, Methods, and Tools
for prioritizing adaptation options on the basis of cost and other measures of efficiency andeffectiveness.
The widely-used procedures for characterizing and managing risk provide the basis for thefollowing procedures, which relate specifically to
climate risks (Figure VIII.3).
a. Step A: Risk Scoping
Through a consultative process involving stakeholders and in-country experts, risk reductiontargets and criteria are established. These are basedon identifying levels of risk that are acceptable to
stakeholders. Existing information sources andexpert judgment are used to identify possibleclimate-related risk events, and the associated
Figure VIII.3. Procedures Used in the Characterization and Management of Climate-related Risks
Source: CCAIRR findings.

8/13/2019 Climate Proofing: A Risk-based Approach to Adaptation
http://slidepdf.com/reader/full/climate-proofing-a-risk-based-approach-to-adaptation 127/219

8/13/2019 Climate Proofing: A Risk-based Approach to Adaptation
http://slidepdf.com/reader/full/climate-proofing-a-risk-based-approach-to-adaptation 128/219
101Elaboration of the Approach, Methods, and Tools
• maps (current and historical);• aerial photographs (current and historical);• satellite imagery (current and historical);• descriptions (written, oral) of adverse weather
and climate events affecting the study areas inthe past;
• inventories of land and marine resources;• population and dwelling data (past, present, and
projected);• health data (past, present, and projected);• employment data (past, present, and projected);• history of, and plans for, infrastructure and other
major investments; and• income and expenditures (family, study areas,
and national).
Building and Characterizing Scenarios
Scenarios of future climate, sea-level, andsocioeconomic changes are required. These must
• meet given sector requirements (e.g., coastalflooding, health care) and provide “time slices”in the future (e.g., 2040, 2080);
• satisfy the requirements of risk assessments (e.g.,be applied to extreme events; daily, monthly orseasonal temporal resolutions; or spatial patternsor site-specific time-series data);
• take account of the scientific uncertainties inmodeling;
• take account of different scenarios of futuregreenhouse gas emissions; and
• be updated as knowledge and informationchange.
In short, CCAIRR requires a degree of flexibility and customization in scenario construction. Thisrequirement is not always met by the conventional,top-down approach involving the provision of externally prepared, fixed scenarios. Such scenarios
do not always match the needs of risk assessmentsand cannot be easily modified.For this reason, CCAIRR uses flexible scenario-
generating tools that can be applied and maintainedby in-country users. These tools are designed tobuild in-country technical capacity for generating customized scenarios in support of sustainableadaptation.
The scenario-generating tools themselves areimbedded within an integrated model system calledSimClim (see Section 9). Customized versions of SimClim have been developed for the FSM and theCook Islands, including tools for generating climate,sea-level, and socioeconomic scenarios. The flexible
scenario-generating tools allow the user to developcustomized scenarios applicable to the FSM or Cook Islands, choosing between future time horizons,emission scenarios, GCM patterns, and levels of model sensitivity.
a. Climate Change Scenarios
Scenarios of local climate change are generated within SimClim using a “pattern-scaling” technique.Three categories of data are required in order toapply this technique.
Category 1: year-by-year projections (from 1990to 2100) of global mean temperature change forvarious greenhouse-gas emission scenarios. Theseinclude the set of global projections produced by the IPCC (IPCC 2001). The projections wereobtained through the IPCC Data Distribution Centreand through personal communication with themodelers responsible for developing the IPCC’sprojections.
Category 2: regional patterns of monthly meantemperature and precipitation changes due to thebuildup of greenhouse gases in the atmosphere, assimulated by very complex global climate models(GCMs). These data were also obtained fromIntergovernmental Panel on Climate Change (IPCC)Data Distribution Centre and “down-scaled” to areasof interest in the Federated States of Micronesia (FSM)and Cook Islands using simple interpolationtechniques. Significantly, the patterns were expressedper degree of global warming. This is a “normalizing”procedure that extracts the differences between GCMsregarding their overall sensitivity to greenhouse gasincreases. It allows the temperature change
estimates to be comparable across the variousGCMs.Category 3: observed, historical climate data for
the FSM and Cook Islands. These datasets includedtime-series climate data (e.g., hourly, daily andmonthly) for specific sites on the islands as well asspatially interpolated monthly climatologies fortemperature and precipitation.

8/13/2019 Climate Proofing: A Risk-based Approach to Adaptation
http://slidepdf.com/reader/full/climate-proofing-a-risk-based-approach-to-adaptation 129/219
Climate Proofing: A Risk-based Approach to Adaptation102
Locally relevant scenarios of climate change aregenerated within SimClim in the following manner:Using the pattern-scaling technique, the normalizedpatterns (from Category 2) are scaled by theprojections of global mean temperature change(from Category 1) in order to produce time-
dependent (i.e., applicable to specific future dates)changes in climate for areas of interest in the FSMor Cook Islands. These projected changes in climateare then used to perturb the baseline climatology (from Category 3), thus producing a “new” climate(or scenario) that reflects changes in atmosphericconcentrations of greenhouse gases.
b. Sea-Level Scenarios
For scenarios of future sea-level changes,pattern-scaling techniques similar to those used forclimate scenarios were employed. These techniqueshave been developed and recently incorporated intothe SimClim system in order to make themaccessible to in-country users. The key componentsof the method include global-mean sea-levelprojections, regional GCM patterns of sea-levelchanges, and local historical sea-level data.Projections of global mean-sea-level changes, from1990 to 2100, as developed by the IPCC (IPCC 2001), were incorporated into SimClim.
As for climate, sea level is not expected to changeuniformly around the world. Due to differences inthe rates of thermal expansion of the oceans and in
ocean circulation and wind patterns, sea-levelchanges vary from one region to another. Theseregional patterns are simulated by the coupledocean-atmosphere GCMs. Four GCM patterns wereobtained from the Hadley Centre (UK) and thespatially dependent changes over time were again
expressed as a function of global temperaturechange.
Finally, at the local scale, long-term trends inrelative sea level due to local factors, usually verticalland movements, were taken into account, using tide gauge data.
Development of sea-level scenarios was basedon all three components—global, regional and local(Figure VIII.4). Again, SimClim facilitates thegeneration of sea-level projections for user-definedfuture time horizons, emission scenarios, modeling assumptions (high, best-judgment and low sensitivity), and GCM patterns.
c. Socioeconomic Scenarios
Socioeconomic data and relationships areincorporated into a “land use scenario generator”in SimClim, in order to provide the capacity forgenerating future patterns of coastal settlement forthe purpose of simulating future risks related toextreme events.
Whil e cl im at e change takes ef fect , ot he rchanges are taking place as well. Economic anddemographic pressures cause changes in the way
Figure VIII.4. Generating Future Sea-level Scenarios: Combining Global, Regional, andLocal Information on Sea-Level Changes
Source:CCAIRR findings.

8/13/2019 Climate Proofing: A Risk-based Approach to Adaptation
http://slidepdf.com/reader/full/climate-proofing-a-risk-based-approach-to-adaptation 130/219
103Elaboration of the Approach, Methods, and Tools
land is used. The land use change model simulatesthese changes.
Generically defined to cope with changes in“land use”, the model is also capable of dealing witha very specific type of land use: structures, that isbuildings or properties. Structures can be built,
demolished, or renovated, and they can (and will)change over time. Structures have properties suchas value, floor height, and age.
These properties are important in assessing theeffects of flooding, with the flooding characteristicschanging over time because of climate change. Floorheight is used to determine the percentage damagecaused by flooding (given the flood level).Subsequently, the property (and contents) value isused to calculate the actual flood damage. Propertiesage, and when they become too old they arerenovated or rebuilt. Another reason for renovationor rebuilding, or even relocation, is the risk of flooding. If this becomes too high, the occupantsmay decide to make in situ changes to their building,or relocate.
The sequence for the land use change model isas follows:
1. What is the current land use? Determine whereall the structures are, their value, their age, theirfloor height.
2. What changes will take place for each of thestructure types? How many new houses arenecessary, how many shops and community buildings? This is driven by economic anddemographic changes that are user defined. Thechanges are specified as percentage increase (ordecrease) in total occupied area for each land usetype. Thus the total number of new buildingsnecessary is known, but not their (spatial)location.
3. Each building is assessed. Is it reaching an age when rebui lding, renovat ion, or relocation isimminent?
4. If the (expected) flood damage to a building isexceeding a threshold, again a decision can bemade to rebuild, renovate, or relocate.
5. Rebuilding/renovation can change the floor levelof a property (possibly depending on adapta-tion), while relocation can “move” a building toa different (probably safer or more suitable)location.
6. The model “loops” over the whole study area,determining the likelihood for all possible landuse transitions.
7. These likelihoods depend on the current land usetype, but also on the types in the neighboring cells (near and far), as well as on other factors
determining the suitability of a location,including roads, proximity to water, and theslope.
8. Given the likelihood of all possible transitions,the model makes a selection consistent with thetotal area for each land use type, as specified inPoint 2.
9. The model repeats these steps for each timeinterval of the simulation, allocating, aging andrenovating buildings.
For every simulated year, the land use changemodel prepares an updated collection of structures.Flood exposure is assessed, to estimate the expecteddamages.
Adaptation options aimed at lowering flooddamage to structures control the way buildings areaging, rebuilt, renovated, or relocated, e.g., by raising the floor level or decreasing the suitability forstructures at a location with a high risk of flooding.By keeping track of both the damage costs and thecosts of implementing the adaptation options, acost-benefit analysis can be undertaken. Furtherdetails are provided in Appendix 6.
Cost-Benefit Analysis for Evaluating Adaptation
For the current case studies, evaluation of adaptation options focused on their comparativecost and their effectiveness in reducing damagecosts. As noted later in this chapter, adaptationoptions also need to be subjected to an assessmentof their environmental and social impacts andoverall contribution to sustainable development.
Such assessments will be facilitated if adaptation ismainstreamed, including the climate proofing of relevant legislation, regulations, and otherdevelopment and planning instruments.
Once the expected risks from climate changeat a specific location are understood, decisions needto be made about how much, if any, of today’sresources should be invested to reduce the risks to

8/13/2019 Climate Proofing: A Risk-based Approach to Adaptation
http://slidepdf.com/reader/full/climate-proofing-a-risk-based-approach-to-adaptation 131/219
Climate Proofing: A Risk-based Approach to Adaptation104
an acceptable level. “Adaptation option” is the termused to describe a proposed investment of this type.Different adaptation options may have differentdegrees of effectiveness at reducing climate-induced risks, and each will come at a different cost.The purpose of cost-benefit analysis is to compare
all feasible adaptation options at a particularlocation and select those with the greatest economicvalue.
Economic analysis in this context is necessarily a long-run analysis (see Figure VIII.5), as it mustcapture the effects of changes in the physicalenvironment (climate change itself) over decades,and express them in terms of value in the present. As noted in the previous section, a long time horizonmeans that fundamental changes will also occur inthe human environment, e.g., in infrastructure,demographics, and growth and mix of economic
activity; these need to be taken into account.Changes in vulnerability and risk are the product of the changing frequency of extreme events and thechanging value on the ground of the assets thatmight be damaged (or the productive activities thatmight be curtailed).
The first step is to determine the economicvalue of the expected risks from climate change forthe location being analyzed, which for presentpurposes is the “project site.” The project site mightbe a coastal residential community, a port facility, apower plant, a road, or any other definable asset.The discussion and examples below refer to a coastalresidential community, but the concepts apply equally to other categories of sites.
The stock of buildings and importantinfrastructure is surveyed and valued at replacementcost to reflect the cost of repairing or, in the extreme,
Figure VIII.5. The Approach used in Assessing Economic and Other Losses, Costs, and Benefits*
Note : Adaptation Initiatives are shown in orange.* These can be determined for an Individual risk event, or for all occurrences of the risk event within a specified time period.Source: CCAIRR findings.
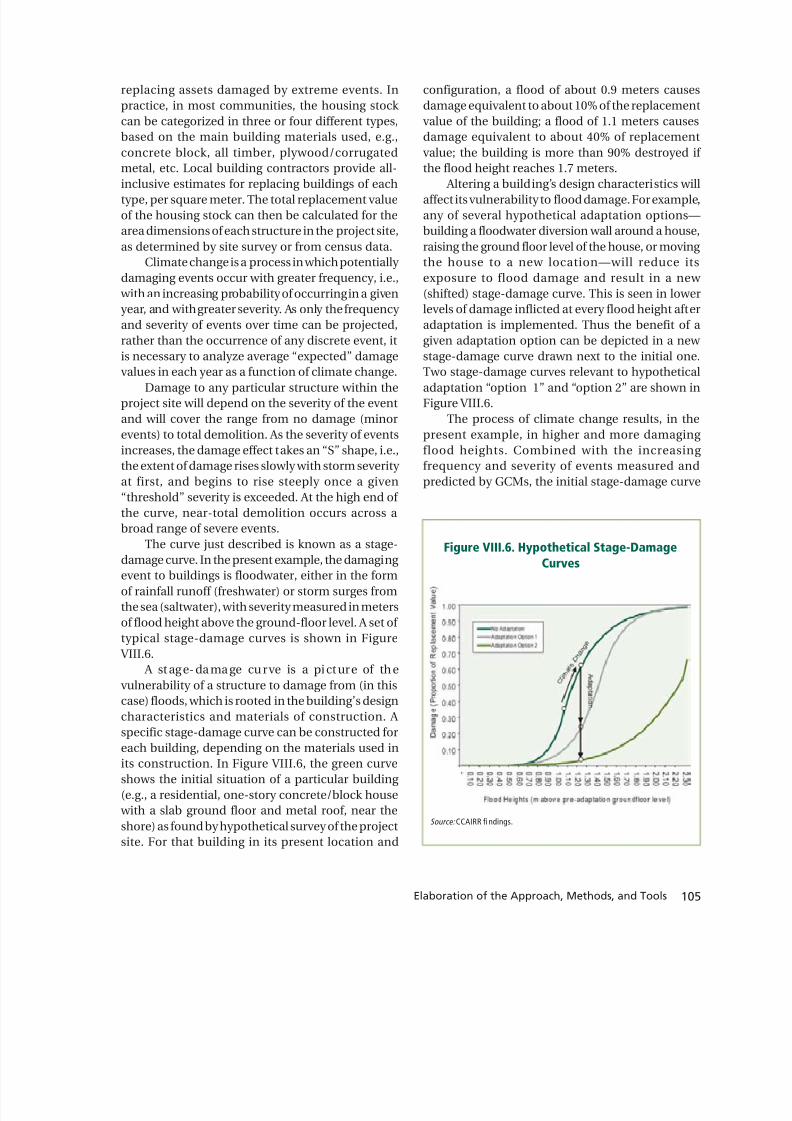
8/13/2019 Climate Proofing: A Risk-based Approach to Adaptation
http://slidepdf.com/reader/full/climate-proofing-a-risk-based-approach-to-adaptation 132/219
105Elaboration of the Approach, Methods, and Tools
replacing assets damaged by extreme events. Inpractice, in most communities, the housing stock can be categorized in three or four different types,based on the main building materials used, e.g.,concrete block, all timber, plywood/corrugatedmetal, etc. Local building contractors provide all-
inclusive estimates for replacing buildings of eachtype, per square meter. The total replacement valueof the housing stock can then be calculated for thearea dimensions of each structure in the project site,as determined by site survey or from census data.
Climate change is a process in which potentially damaging events occur with greater frequency, i.e., with an increasing probability of occurring in a given year, and with greater severity. As only the frequency and severity of events over time can be projected,rather than the occurrence of any discrete event, itis necessary to analyze average “expected” damagevalues in each year as a function of climate change.
Damage to any particular structure within theproject site will depend on the severity of the eventand will cover the range from no damage (minorevents) to total demolition. As the severity of eventsincreases, the damage effect takes an “S” shape, i.e.,the extent of damage rises slowly with storm severity at first, and begins to rise steeply once a given“threshold” severity is exceeded. At the high end of the curve, near-total demolition occurs across abroad range of severe events.
The curve just described is known as a stage-damage curve. In the present example, the damaging event to buildings is floodwater, either in the formof rainfall runoff (freshwater) or storm surges fromthe sea (saltwater), with severity measured in metersof flood height above the ground-floor level. A set of typical stage-damage curves is shown in Figure VIII.6.
A st age- damage cu rve is a pi ct ure of thevulnerability of a structure to damage from (in thiscase) floods, which is rooted in the building’s designcharacteristics and materials of construction. A
specific stage-damage curve can be constructed foreach building, depending on the materials used inits construction. In Figure VIII.6, the green curveshows the initial situation of a particular building (e.g., a residential, one-story concrete/block house with a slab ground floor and metal roof, near theshore) as found by hypothetical survey of the projectsite. For that building in its present location and
configuration, a flood of about 0.9 meters causesdamage equivalent to about 10% of the replacementvalue of the building; a flood of 1.1 meters causesdamage equivalent to about 40% of replacementvalue; the building is more than 90% destroyed if the flood height reaches 1.7 meters.
Altering a building’s design characteristics willaffect its vulnerability to flood damage. For example,any of several hypothetical adaptation options—building a floodwater diversion wall around a house,raising the ground floor level of the house, or moving the house to a new location—will reduce itsexposure to flood damage and result in a new (shifted) stage-damage curve. This is seen in lowerlevels of damage inflicted at every flood height afteradaptation is implemented. Thus the benefit of agiven adaptation option can be depicted in a new stage-damage curve drawn next to the initial one.Two stage-damage curves relevant to hypotheticaladaptation “option 1” and “option 2” are shown inFigure VIII.6.
The process of climate change results, in thepresent example, in higher and more damaging flood heights. Combined with the increasing frequency and severity of events measured andpredicted by GCMs, the initial stage-damage curve
Figure VIII.6. Hypothetical Stage-DamageCurves
Source: CCAIRR fi ndings.

8/13/2019 Climate Proofing: A Risk-based Approach to Adaptation
http://slidepdf.com/reader/full/climate-proofing-a-risk-based-approach-to-adaptation 133/219
Climate Proofing: A Risk-based Approach to Adaptation106
Table VIII.1. Comparison of HypotheticalPresent Values of Expected Damages
Under Climate Change
Present Values Total Savingsof Expected Due To
Damage Adaptation($) ($)
No Adaptation 6,163,000Adaptation Option 1 2,609,000 3,553,000Adaptation Option 2 634,000 5,529,000
etc
Source: CCAIRR findings.
for each structure can be used to calculate thedamage expected to occur each year as t ime passes. When these are summarized across all structures,and the calculations are repeated for each year inthe planning period, a stream of expected annualdamage values results. These are expressed in a
present value (PV), representing the totalincremental damage expected in the project site dueto climate change.
Adaptation options are analyzed within thesame framework. As mentioned, adaptation for agiven structure results in a shifted stage-damagecurve showing, for each flood event, a lesser degreeof damage than without adaptation. For a particularadaptation option, the above procedures arerepeated to calculate the present value of expecteddamage after the adaptation option is implemented.The difference between the PV of expected damagein the no-adaptation case and the PV of theadaptation option measures the gross benefit of implementing the adaptation option. Theprocedures are repeated again for all feasibleadaptation options. Table VIII.1 illustrates the resultsthat might be obtained from such analysis for acoastal community.
The PV of savings due to adaptation option 1 inthis example—that is, the PV of the damage avoided by implementing option 1—is about $3.55 million.If the initial cost of adaptation option 1 is no greaterthan $3.55 million, then investment in the option will save the community resources in the long run.Similarly, if the initial cost of option 2 is not greater
than $5.53 million, investment in option 2 will saveresources in the long run. Once the analysis of thebenefits of potential adaptation options has beencarried through to this stage, selection between thetwo options (and others that may also be feasible) will depend upon the initial cost and, hence, the
economic return available to each. A discount rate is used to calculate the present
value of a stream of future costs, in recognition thata given cost incurred in the future is worth less thanthe same cost incurred today. The actual discountrate chosen reflects a subjective valuation of now versus the future: a lower discount rate reflects ahigher concern about future costs, and vice versafor a higher discount rate. In particular, use of alower discount rate reflects a higher valuation of future cost savings from adaptation relative to thepresent or initial costs of adaptation, leading togreater investment in adaptation.
The choice of an “appropriate” discount rate touse in cost-benefit analysis depends on the natureof the economic problem. As climate change is along-term process that coincides with majordemographic changes, economic development, andintergenerational transfers of assets, a national andinternational concern over climate change itself isindicative of a relatively high concern to avoid futurecosts that may affect the well-being of the nextgeneration of the country’s long-term growthpotential. It would therefore seem anomalous toapply a “high” discount rate to the expected futurecosts of climate change, given a high level of confidence in projections of the future costs. A rateas high as, say, that normally used to evaluateshorter-term financial investments (e.g., 10%) willalmost certainly result in a misallocation of resources away from adaptation. Nevertheless it iscertainly possible that the “international” discountrate for future costs from climate change isconsistently lower than the discount rate implicitly used by many countries and perhaps most
individuals. A lower “international” discount rate(e.g., 3%) may reflect a higher awareness among world bodies of the dynamics of climate change andconsequently greater confidence in the predictionsof the rate and the degree by which the climate willchange; or it may reflect a heightened appreciationof the threat that climate change poses to the worldeconomy and the pace of development. Whatever
8/13/2019 Climate Proofing: A Risk-based Approach to Adaptation
http://slidepdf.com/reader/full/climate-proofing-a-risk-based-approach-to-adaptation 134/219
107Elaboration of the Approach, Methods, and Tools
the case, international resources are and will beavailable to assist small and vulnerable countries toinvest in adaptation and to contain risk.
For most of the cost-benefit analyses related tothe case studies presented in this book, results arepresented for discount rates of zero and 3%,
reflecting the above discussion.
SimClim: a Software Tool for SimulatingClimate Risks and Evaluating AdaptationOptions
Preparation of the case studies was assisted by having access to both a method for integrating complex arrays of data and to compute models toproduce assessments of risks and adaptation. Thisneed was motivated by a desire to demonstrate thebenefits of adaptation in relation to the costs, witha clear demarcation between those costs arising from natural variability and those associated withfuture climate change. Given the complexity involved, such assessments could only beconducted efficiently through model simulations.For this purpose, the SimClim system was used.
a. Overview of the SimClim system
SimClim is a generic, “open-framework”software modeling tool for examining impacts andadaptations to climate variability and future change,including extreme events. The system contains toolsfor spatial analyses (like a geographic informationsystem) as well as tools for temporal analyses atspecific sites (for example, for examining climatetime-series data or estimating return periods of extreme events). As a flexible, open-framework system, SimClim can be implemented for any country,region, or area for which the required input data exist.
At its core, SimClim contains a climate changescenario generator. This component allows the user
to produce customized, regionally specificscenarios, drawing upon a range of IPCC projectionsof global warming and regional patterns of changefrom GCM results. The specific method of “patternscaling” used by SimClim (which combines resultsof simple GCMs with those of complex ones) is widely accepted both in concept (as described by IPCC 2001 and Houghton et al. 2001) and in practice
(for example, through the model SCENGEN asdisseminated by the United Nations DevelopmentProgramme [Hulme et al. 2000]). The climate data, whether current baseline climate or scenarios of future climates, can be analyzed in their own rightor used to drive sector impact models in a seamless
manner within SimClim.Sector models are attached to the system in
order to examine the impacts of climate variability and change, for example, on agriculture, coasts, or water resources. Such models are forced, either solely or in part, by climate variables. Importantly, SimClimhas the capacity to provide hourly, daily, monthly, orseasonal climate data to these models, either asspatially interpolated averages or time-series,depending on their specific input requirements. Withthese tools, SimClim provides a system to helpanswer the key questions regarding risks andadaptation—when, where, and how much?
b. Implementation of SimClim for the CaseStudies
For the Cook Islands and FSM case studies, aset of “second generation” features of SimClim wasimplemented. These features have been the subjectof model developments carried out concurrently inthe Pacific island region under the Assessment of Impacts and Adaptation to Climate Change (AIACC)program (funded by the United Nations Environ-mental Programme-GEF and executed by System for Analysis, Research and Training (START) and in New Zealand (funded by the New Zealand Foundationfor Research, Science and Technology). Theseunderscore the synergistic relationship betweendevelopment partner-sponsored activities in thePacific region. These features include
• fine spatial resolution modeling capacity, toprovide capacity for risk analyses at the localscale, where adaptation options are typically
implemented;• explicit components for assessing adaptationoptions, to provide capacity for systematiccomparative analyses of adaptive responses;
• incorporation of “human dimension” layers intothe model (e.g., roads, infrastructure, people, andproperty), to provide a basis for quantifying risksto society and the economy;

8/13/2019 Climate Proofing: A Risk-based Approach to Adaptation
http://slidepdf.com/reader/full/climate-proofing-a-risk-based-approach-to-adaptation 135/219
Climate Proofing: A Risk-based Approach to Adaptation108
• land use scenario generator, to examine theimplications of development pathways as factorsin increasing or reducing risks;
• capacity to run simulations in transient (time-dependent) mode, in order to capture the fulleffects of climate and land use that are changing
(not just changed) over time; and• tools for economic evaluation of risk damage and
adaptation, in order to provide a basis fordecision making for investments to reduce therisks of climate variability and change.
Figure VIII.7 shows how these new features wereimplemented structurally within the core SimClimsystem, for the flood-related (both inland and seaflooding) case studies in both the Cook Islands andFSM. A brief description of each component follows.
c. Climate and Sea-Level Scenario Generator
The local case study areas in the Cook Islandsand FSM were relatively small. Flooding in theseareas, whether from inland runoff or storm-generated elevated sea levels, is sensitive to extreme
events occurring on small time-scales. For thisreason, hourly rainfall and sea-level (from tidegauges) time-series data were acquired toimplement the various flood models. Of particularconcern were the extremes in the time-series thatcontribute to unacceptable risk. The scenariogenerator made it possible to perturb these baselinetime-series with combinations of IPCC emissionscenarios and GCM patterns of rainfall or sea-levelchange (as well as possible changes in tropicalcyclone intensity), and thereby rerun the floodmodels under different future climates over selectedtime horizons (e.g., to the year 2050).
Figure VIII.7. Implementation of SimClim for Assessing Flood Risks and Adaptationand their Changes due to Climate Change
Source:CCAIRR findings.

8/13/2019 Climate Proofing: A Risk-based Approach to Adaptation
http://slidepdf.com/reader/full/climate-proofing-a-risk-based-approach-to-adaptation 136/219
109Elaboration of the Approach, Methods, and Tools
Flood Models. Relatively simple rainfall-dischargeand sea-flooding models were developed for thecase study areas in each country. In terms of inlandflooding, variations of the Rational Method,commonly used in water engineering, were used,in which Discharge (Q) = CiA, where C is the runoff
coefficient, i is the rainfall intensity, and A is thecatchment area. Extreme discharges were related tochannel capacity and surface flooding in order tosimulate the spatial patterns of flooding. For seaflooding at Avatiu-Ruatonga in the Cook Islands, themethods used in SimClim were built on estimatesof the components of storm surge, wave run-up, anddune overtopping and their return periods, as madein previous engineering reports commissioned by the Government. In SimClim, these values wereperturbed by changes in sea-level and cycloneintensity, as derived from the scenario generator, inorder to simulate future conditions. For sea flooding at Sapwohn Village in the FSM, the only availabledata were hourly tide-gauge data and reports fromresidents regarding previous sea-flood events. Using the extreme-event tools and sea-level scenariogenerator in SimClim, extreme high-water eventsand their elevations above mean sea level weresimulated.
Property and Area at Risk. This component containsgeo-referenced data on building types and theirindividual characteristics pertinent to flooding (floor heights, construction materials, age, etc) andother land uses at risk from flooding. Underlying these data was a digital elevation model (DEM). This was used to relate properties to ground elevationand thus to flood risk. For each case study, these data were obtained via field surveys.
Land Use Scenario Generator. This componentprovides the capacity to “evolve” the patterns of settlement in the case study sites. Rules can bespecified, for example, to discourage building in
high-risk zones or to reflect high or low populationpressures as they could affect risk.
Adaptation Options. Specific adaptation measures were chosen for each site to reflect a certain category of response to risk, for example, channelization or water diversion (modifying the extreme event) ;elevation of minimum floor heights (modifying
susceptibility to flooding); avoidance of building inhigh-risk zones (modifying damage potential). Foreach adaptation measure, the user specified theextent of application (e.g., minimum floor height)and the unit cost of implementation.
Spatial evaluator. This component contains toolsfor examining, in “time-slice” mode (e.g., for the year2040, 2080), the spatial patterns of flood effects (seeFigure VIII.5). For example, the user could chooseto examine the flood extent and depth for the 100- year return period flood under current climate, andthen investigate how those flood characteristics would change under a future scenario of climate orsea-level change. Both 2-D maps and 3-D flyovertools were available for visualization.
Economic evaluator. The economic evaluator, incalling on the flood model, requires simulations of floods in “transient” (e.g., year-by-year) mode andfor the range of flood frequencies at each time step(see Figure VIII.5). The flood heights were related tostage-damage curves, which were developed foreach building type in order to estimate damages tobuildings in dollar values. For any given flood, thetotal damages were calculated for the area flooded. At each time step, the expected damages weresummarized over the range of return period floods.For each simulation run over a specified time period,the expected damages for each year were discountedand aggregated to give an annualized expecteddamage, in present value. This provided a basis forcost-benefit comparisons of adaptation options.Multiple simulations with and without climatechange, and with and without adaptation, provideda basis for identifying the incremental benefits andcosts associated specifically with climate change (asopposed to natural climate variability). The outputsare presented in nonspatial graphical and tabularformat.
d. Other SimClim tools used in Preparation of the Case Studies
SimClim also provided tools in support of analyses for other case study applications of climaterisks. The Site Data Importer allowed the user toeasily import time-series climate and sea-level datainto the system. Once the data were in the system,

8/13/2019 Climate Proofing: A Risk-based Approach to Adaptation
http://slidepdf.com/reader/full/climate-proofing-a-risk-based-approach-to-adaptation 137/219
Climate Proofing: A Risk-based Approach to Adaptation110
the Extreme Event Analyzer proved to be especially useful for extracting extreme events and estimating their return periods, including changes inmagnitude and/or frequency, with scenarios of climate change generated by the system. As shownin Figure VIII.8, the user has flexibility in selecting
the climate variable, the time period during the yearfrom which extreme events are selected, and thenumber of consecutive hours or days upon whichthe extreme event is defined. Significantly, theExtreme Event Analyzer is linked directly to theScenario Generator, which is used to perturb thetime-series with a user-selected scenario of climatechange in order to assess future changes in risk.
In the preparation of the case studies, the ExtremeEvent tools were used, for example, to estimate
• changes in return periods of rainfall events thatcould damage the proposed new road in Kosrae,
• changes in significant wave heights and theirreturn periods for engineering the design of the western breakwater at Avatiu, and
• changes in extreme sea-level events in Pohnpei.
C. Mainstreaming Adaptation inNational Development Planningand Implementation
Climate proofing at the national policy level is
achieved largely through mainstreaming adaptationin national development policies and plans.
What is meant by “Mainstreaming Adaptation”?
In the context of addressing climate change andrelated issues, the term “mainstreaming” is used todescribe the integration of policies and measuresto address climate change into ongoing and new development policies, plans, and actions of poli-cies and measures to address climate change.Mainstreaming aims to enhance the effectiveness,efficiency and longevity of initiatives directed atreducing climate-related risks while at the sametime contributing to sustainable development andimproved quality of life.
Figure VIII.8. The Extreme Event Analyzer in SimClim
Source: CCAIRR findings.

8/13/2019 Climate Proofing: A Risk-based Approach to Adaptation
http://slidepdf.com/reader/full/climate-proofing-a-risk-based-approach-to-adaptation 138/219
111Elaboration of the Approach, Methods, and Tools
3 “No regrets” measures for adaptation are consistent with sound environmentalmanagement and wise resource use, and are thus appropriate responses to naturalhazards and climate variability, including extreme events; they are thereforebeneficial and cost effective, even in the absence of climate change.
Mainstreaming also endeavors to address thecomplex tensions between development policiesaimed at immediate issues and the aspects of climate policy aimed at longer-term concerns. Thetensions often become most apparent when choiceshave to be made about the disbursement of limited
government funds—for example, choices betweensupporting education and health care programs onthe one hand, and funding climate changeadaptation initiatives on the other. Indeed,mainstreaming is largely about reducing tensionsand conflicts, and avoiding the need to makechoices, by identifying synergistic, win-winsituations. Thus mainstreaming focuses on “noregrets” measures for adaptation. 3
Why Mainstream Adaptation?
Even in the near future, climate change is likely to impose untenable social, environmental, andeconomic costs. Most Pacific island countries arealready experiencing disruptive conditions that areconsistent with many of the anticipated adverseconsequences of climate change, including but notlimited to extensive coastal erosion, drought,flooding, coral bleaching, and higher sea levels.
The risks associated with the full spectrum of climate-related hazards, from extreme events to theconsequences of long-term changes in the climate,should be managed in a holistic manner as anintegral part of national development planning andmanagement. Most countries already have policiesand plans to manage financial risks, human healthrisks, biosecurity risks, agricultural risks, risks to thetransport sector, and energy supply risks. Climate-induced disasters and climate change and variability should also be included in the national risk management portfolio.
National and local development plans andsector plans should include harmonized disaster
risk management strategies and climate changeadaptation measures that will ensure that risks arereduced to acceptable levels. These measures, and
the related strategies, will help strengthen decision-making processes by requiring that specificprograms and projects include plans and measuresto manage risks associated with extreme events, as well as with climate change and variability. Theoverall goal should be to manage, in a holistic
manner and as an integral part of national andsubnational development planning, the risksassociated with the full spectrum of weather,climate, and oceanic hazards, from extreme eventsto the consequences of long-term climate change.
What is the “E nabl ing Envi ronment” fo r Adaptation?
The “enabling environment” for adaptationcomprises the high-level and robust systems andcapabilities that foster the adaptation process,including innovation, revitalization of traditionalknowledge and practices, application of humanknowledge and skills, policies, financing, legislationand regulations, information, markets, and decisionsupport tools. It encourages and supports theclimate proofing of development projects andrelated initiatives, as well as being supportive of the wider sustainable development process. This isshown in Table VIII.2. It highlights the multipledimensions of the enabling environment. Longer-term interventions at national and subnationallevels, often with support from the internationalcommunity, are required to create and strengthenthe enabling environment.
The Adaptation Mainstreaming Guidelines
The Guidelines are grouped into threecategories, namely those related to
• the principles underlying the mainstreaming of
adaptation,• enhancement of the enabling environment foradaptation, and
• the process of mainstreaming adaptation.
The Guidelines approved for the Cook Islands andFSM include examples of their national application.These are provided in Appendixes 3 and 4.

8/13/2019 Climate Proofing: A Risk-based Approach to Adaptation
http://slidepdf.com/reader/full/climate-proofing-a-risk-based-approach-to-adaptation 139/219
Climate Proofing: A Risk-based Approach to Adaptation112
a. Guidelines Relating to the PrinciplesUnderpinning the Mainstreaming of Adaptation
Guideline 1: Manage climate risks as an integral part of sustainable development.
Climate change is largely the result of green-house gas emissions associated with humanactivities. The latter are driven by socioeconomicdevelopment patterns characterized by economicgrowth, technology uptake and application, popula-
tion growth and migration, and adjustments ingovernance. In turn, these socioeconomic develop-ment patterns influence vulnerability to climatechange as well as the human capacity for mitigationand adaptation. The cycle is completed as a result of climate change impacting on human and natural sys-tems, to influence socioeconomic developmentpatterns and, hence, greenhouse gas emissions.
The artificial separation of these activitiesresults in missed opportunities for synergies,unrecognized and undesirable trade-offs, andmutual interference in ensuring successful out-comes. The benefits arising from integrating climate policy into wider development policiescan be greater than the sum of concurrent but inde-pendent policy initiatives. Effective management of the risks to natural and human systems that arisefrom climate variability and change, and their inte-gration into planning for sustainable development,
gives rise to additional guidelines.Policymaking, planning practices, and develop-ment activities should ensure that all futuregenerations will be able to enjoy every importantaspect of life, including peace and security, a healthy environment, a small risk of preventable catastro-phe (including those related to climate variability and change), conservation of knowledge, stable
Table VIII.2. The Multiple Dimensions of the Enabling Environment
Enabling Environment forSustainable Development
Enabling Environment forClimate-Proofed Development
Climate-ProofedDevelopment
Note: The dimensions related to climate proofing are shown in red.
Climate-Proofed• Development plans• Resource use plans• Regulations• Codes• Permitting procedures
Economic and socialdevelopment programs andprojects that are compliantwith climate-proofedpolicies and plans
Favorable macroeconomic conditionsAvailable and affordable financingRobust and responsive legal andregulatory regimes
Climate-proofed national developmentstrategy
Empowered and equitably involvedstakeholders
Equitable allocation of rights, responsi-bilities, and benefits
Needs-driven and targeted information
Relevant and applicable standards,codes, methodologies, and tools
Functional, sustainable technologies(hard and soft)
Supportive human and institutionalcapacities

8/13/2019 Climate Proofing: A Risk-based Approach to Adaptation
http://slidepdf.com/reader/full/climate-proofing-a-risk-based-approach-to-adaptation 140/219

8/13/2019 Climate Proofing: A Risk-based Approach to Adaptation
http://slidepdf.com/reader/full/climate-proofing-a-risk-based-approach-to-adaptation 141/219
Climate Proofing: A Risk-based Approach to Adaptation114
and also when the compliance monitoring and en-forcement capabilities of relevant regulatory agen-cies are improved.
Guideline 11: Strengthen institutions to support the climate proofing of development.
Organize and strengthen institutions in waysthat i) enhance communication between climaterisk assessors and adaptation policy makers andimplementers; ii) reduce the likelihood of conflictand duplication of effort when managing climate-related risks; iii) lessen the chances of mistrust andmisunderstanding between policy and decisionmakers and other stakeholders in adaptationactivities; and iv) overall, help to provide consistent,defensible, and useful advice to policy and decisionmakers with respect to adaptation priorities andpractices.
Guideline 12: Ensure that macroeconomic policies and conditions favor climate proofing.
Macroeconomic conditions that favor success-ful adaptation activities include those that fostereconomic transparency. Such conditions are neededin order to ensure that climate-related risks are notmasked or compensated by hidden subsidies andthereby transferred to the wrong parties. Involve-ment of the private sector in adaptation (e.g., inves-tors and other players in the finance sector) will beencouraged by macroeconomic conditions that willdeliver low inflation; stable and realistic exchangeand interest rates; pricing that reflects the true (mar-ginal and fully internalized) costs of materials,energy, labor, and other inputs; deregulation; freemovement of capital; operation of competitive mar-kets; open trade policies; and transparent foreigninvestment policies.
Guideline 13: Ensure favorable access to affordable financing of cl imate-proofed development initiatives.
Address the current reluctance of banks andother lending institutions to finance adaptationactivities, due to the perception that they involvelonger-term projects that have high levels of risk.Help address this barrier by promoting institutions,arrangements, and mechanisms that can provide
innovative financing, including microfinance, greenfinance, concessionary loans, leasing arrangements,and public-private partnerships, thereby allowing adaptation to increase, without governmentintervention.
c. Guidelines Relating to the Process of Mainstreaming Adaptation
Guideline 14: Characterize climate-related risks that require sustained attention.
Document the relevant major risks to theeconomy, environment, and society resulting fromclimate variability and change (including extremeevents), characterizing these in terms of their prob-abilities of occurrence and associated economic andsocial consequences.
Guideline 15: Replicate the knowledge, motivation,and skills that facilitate successful adaptation.
Identify the motivations that drive variousstakeholders to engage in the adaptation process,and replicate these motivations in other players,through education, training, and other initiativesthat empower people.
Guideline 16: Enhance the capacity for continuous adaptation.
Adaptive capacity is a complex and dynamicmix of social, economic, technological, biophysical,and political conditions that determine the capac-ity of a system to adapt. These factors vary over time,location, and sector. The main features of commu-nities, countries, and regions that determine theiradaptive capacity include economic wealth, tech-nology, information and skills, infrastructure, insti-tutions, and equity. Addressing these factors makesit possible to enhance adaptive capacity.
Guideline 17: Ensure that climate proofing activi-ties complement other development initiatives.
Emphasis must be placed on coordinating activities, taking advantage of synergies, minimizing duplication, and avoiding redundancies. This willhelp ensure that climate-proofing activitiescomplement other development efforts. Priority should be given to adaptation activities that deliver

8/13/2019 Climate Proofing: A Risk-based Approach to Adaptation
http://slidepdf.com/reader/full/climate-proofing-a-risk-based-approach-to-adaptation 142/219
115Elaboration of the Approach, Methods, and Tools
tangible and visible benefits, rather than toexploratory studies, i.e., emphasis should be onactivities that deliver outputs and outcomes thatare of at least equal relevance and value to thoseprovided by mainline government ministries; thiscan help offset the fact that climate change is often
perceived as a longer-term issue, while otherchallenges, including food security, water supply,sanitation, education, and health care, require moreimmediate attention.
Guideline 18: Initiate a process of continual im-provement in adaptation outcomes.
A commitment should be made to initiate andpractice monitoring, reviewing, and strengthening adaptation activities. Methods used should empha-size transparency, consistency, and accountabili ty,
as well as fostering continued improvement in theefficiency with which outcomes are delivered, andin their contributions to sustainable national devel-opment.

8/13/2019 Climate Proofing: A Risk-based Approach to Adaptation
http://slidepdf.com/reader/full/climate-proofing-a-risk-based-approach-to-adaptation 143/219
Climate Proofing: A Risk-based Approach to Adaptation116
The case studies presented here have demon-strated the climate proofing of infrastruc-ture and community development projectsand the mainstreaming of climate change
considerations into national strategic developmentplans. The field studies and other activities to de-velop the six case studies were undertaken in theCook Islands and the Federated States of Micronesia.However, the innovative methodologies and tools,as well as the findings, are applicable to all SmallIsland Developing States, and even to larger devel-oping and developed countries.
The ultimate aim of the case studies was to show why and demonstrate how reducing climate-relatedrisks is an integral part of sustainable development.The results highlight the fact that many adaptationmeasures meet the criteria of no regrets adaptationinitiatives, including being cost effective. Imple-mentation of specific risk-reduction measures atproject and local levels can be facilitated if land useplanning and associated regulations and permitting procedures for structure, infrastructure, and com-munity development projects incorporate require-ments that are designed to reduce risks related tocurrent and future climate extremes and variations.
The overall goal of a risk-based approach toclimate change adaptation is to manage both thecurrent and future risks associated with the full
spectrum of atmospheric and oceanic hazards. Thecase studies were chosen to highlight the range of levels at which adaptation takes place and thelinkages between them. The levels are i) project, ii)regulation and compliance, iii) short- and mid-termpolicy making and planning at the subnational level,and iv) national strategic development planning.The studies demonstrated the importance of
Summary and Conclusions
mainstreaming adaptation, including strengthening the enabling environment for adaptation in orderto increase the likelihood of successful adaptationat project and community levels.
The work undertaken included assessments of both the risks arising from current climate variabil-ity and extremes and from the future, incrementalchanges in those risks as a result of longer-termchanges in climate extremes and variability. Signifi-cantly, the case studies demonstrated methods forprioritizing adaptation strategies and specific mea-sures in terms of both their costs and benefits. A major goal—and challenge—was to determine, in arigorous and quantitative manner, the incrementalcosts of adaptation to climate change.
For both the Cook Islands and the FederatedStates of Micronesia (FSM), climate risk profiles were prepared. Extreme climate events that arerelatively rare at present (likelihood in one year lessthan 0.05), as a result of global warming areprojected to become relatively common (in many cases likelihoods are projected to increase to over0.20 by 2050).
In order to ensure stakeholder buy-in andsustained uptake, five principles underscoredpreparation of the case studies:
• all activities were to be undertaken in an
inclusive, transparent and participatory manner;• wherever possible, existing information andother resources were to be used;
• local experts should work alongside and at timeslead their international counterparts;
• all outcomes should have high relevance to key stakeholders, add value to current and plannedinitiatives, and be sustainable; and
CHAPTER IX

8/13/2019 Climate Proofing: A Risk-based Approach to Adaptation
http://slidepdf.com/reader/full/climate-proofing-a-risk-based-approach-to-adaptation 144/219
117Summary and Conclusions
• selection of the case s tudies was to be inaccordance with criteria established by the AsianDevelopment Bank (ADB) and expanded throughconsultation with stakeholders in each country (governments, nongovernment organizations(NGOs), private sector, and communities).
In addition to the technical and policy-oriented work, considerable effort was devoted to a key dimension of adaptation, namely capacity building,including awareness raising, empowerment andaction, and institutional strengthening.
Climate-related risks facing both the infrastruc-ture projects and the communities are already con-siderable, but in all cases are projected to increasesubstantially as a result of increases in climateextremes and variability. For infrastructure projects,it is possible to avoid most of the damage costs at-tributable to climate change, and to do this in a cost-effective manner, if climate proofing is undertakenat the design stage of the project. Cost effectivenesscan be further enhanced if environmental impactassessment (EIA) and related procedures require thatall development be climate proofed. Climate proof-ing communities can also be cost effective if plan-ning and regulatory measures take into account bothcurrent and future climate-related risks.
Climate proofing national strategic develop-ment plans enhances the enabling environment foradaptation; establishes the requirement for climateproofing sector and subnational (e.g., state, islandand community) development plans as well as in-dividual development projects; and helps to ensurethat actions to reduce climate-related risks are anintegral part of, and harmonized with, sustainabledevelopment initiatives. Such initiatives will befacilitated through the use of national AdaptationMainstreaming Guidelines, such as those preparedand approved for the FSM and the Cook Islands.
Many key lessons have been learned anddemonstrated. Climate change will manifest itself
largely as changes in the frequency andconsequences of extreme events and interannualvariations, rather than as long-term trends inaverage conditions. While uncertainties inhere inprojections of greenhouse gas emissions and of theresponse of the global climate as estimated by models, confidence in estimates of future changesin climate-related risks are high. This is due to the
consistency in model-based projections of changesin the likelihood of extreme events and climatevariability as well as between these projections andthe observed changes in these likelihoods overrecent decades.
Whil e incons is te nt wi th in te rnat iona l
conventions, at a practical level adaptation shouldthus focus on reducing both the present and futurerisks of climate variability and extremes. In many instances, current levels of climate risk are already high, because risks have increased over the past few decades. Moreover, adapting to current climateextremes and variability prevents precious financialand other resources from being squandered ondisaster recovery and rehabilitation and is anessential step toward being able to withstand thepending climate changes.
A risk-based approach to adaptation is bothdesirable and practicable. It combines both thelikelihood and consequence components of climate-related impacts and can assess risks for bothcurrent and anticipated conditions, with the optionof examining either specific events or an integrationof those events over time. Furthermore, risk assessment and management are common to many sectors—e.g., health care, financial, transport,agriculture, energy, and water resources—and thefamiliarity of planners and decision makers with risk management facilitates mainstreaming of risk-based adaptation. Compared to the moreconventional approaches used in vulnerability andadaptation assessments, a risk-based approach alsofacilitates an objective and more quantitativeapproach, including cost benefit analyses that resultin evaluation of the incremental costs and benefitsof adaptation and assist in prioritizing adaptationoptions. Many players are usually involved in therisk- and cost-benefit-based assessments, but theapproach provides a framework that facilitatescoordination and cooperation, including thesharing of information that might otherwise be
retained by information “gate keepers”.The risk-based approach is also linked tosustainable development because it identifies thoserisks to future generations that present generations would find unacceptable. The case studies havehighlighted the need to ensure that futuredevelopment does not exacerbate climate-relatedrisks.

8/13/2019 Climate Proofing: A Risk-based Approach to Adaptation
http://slidepdf.com/reader/full/climate-proofing-a-risk-based-approach-to-adaptation 145/219
Climate Proofing: A Risk-based Approach to Adaptation118
Adaptation has many dimensions and mustalso be viewed as a process. This means a framework and associated methodology are essential. ClimateChange Adaptation through Integrated Risk Reduction (CCAIRR) provides an operationalframework as well as relevant methodologies. The
success of adaptation has enhanced CCAIRR’sbottom-up and top-down approach: top-downactivities should focus on creating a favorableenabling environment, for instance, by climateproofing policies, plans and regulations. This is aprerequisite to successful adaptation and should bethe major emphasis and benefit of adaptationmainstreaming. Bottom-up activities should befounded on meaningful consultation and widespread empowerment of key players. Decisionsupport tools, such as SimClim, that facilitateintercomparison of adaptation measures, arefundamental to ensuring the effectiveness of adaptation.
Most barriers to the successful application of arisk-based approach to adaptation relate to theexistence of, and access to, information. The barriersto information are somewhat intractable, thoughagain, experience in preparing the current casestudies provides some grounds for optimism.
Before generalized findings and lessons can bedrawn from case studies prepared using a risk-basedapproach to adaptation, many more examples willneed to be developed. It is desirable to have inter-nationally consistent assessment methodologies.International agencies, such as the IPCC, play major roles in establishing best practices. Theseagencies would need to formally endorse andencourage a risk-based approach to adaptation
before their widespread uptake occurs. At present,best practice favors the more traditional assess-ments of vulnerability and of adaptation options.These have many limitations compared to a risk-based approach.
Until a risk-based approach to adaptation is for-
mally endorsed and encouraged, documentationand training opportunities will also be lacking. Whilea risk-based approach requires no greater skills andexperience than are called on in the traditionalassessments, a cadre of in-country expertise willneed to be built. While parallel frameworks andmethodologies are being advocated, confusion andarguments for maintaining the status quo willoccur.
Additional barriers include the need for formalspecification of risk-based targets that define futurelevels of acceptable risk. This requires consultation with, and consensus among, key stakeholders;specification of relationships between magnitudeand consequence of risk events of relevance; “rules”that specify future social, economic, and widerenvironmental changes; and appropriate discountrates to be applied to future costs and benefits. InSimClim, the discount rate is set by the user and canbe adjusted without needing to rerun thesimulation.
For the present case studies, all these barriers were overcome. Future efforts to develop additionalcase studies, as well as to support the practicalapplication of adaptation measures, can build onboth the methodologies and the experience gainedin preparing the current case studies. Thus thebarriers are unlikely to be as imposing as for theinitial work.

8/13/2019 Climate Proofing: A Risk-based Approach to Adaptation
http://slidepdf.com/reader/full/climate-proofing-a-risk-based-approach-to-adaptation 146/219
119References
Australian Bureau of Meteorology, no date. Available:http://www.bom/gov.au/ climate/averages/c l i m a t o l o g y / t r o p i c a l _ c y c l o n e s /tropical_cycl.shtml.
Campbell, J. R., and K. McGregor. 1993. Cllimate Change Adaptation: Incorporating Climate Change Adaptation into Development Activities in Pacific Island Countries: A Set of Guidelines for Policy Makers and Planners . Apia , Samoa: Sout h Paci fi c Regi onalEnvironment Programme.
Cook Island News . 2004. Proofing for ClimateChange. 5 February.
D’Aubert, A.-M., and P. D. Nunn. 1994. Catalogue of Tropical cyclones and Droughts in theTropical Pacific, 1800–Present. UnpublishedReport. Suva, Fiji Islands: University of theSouth Pacific.
Dorrell, Don E. Owner and Managing Director,Coastal Environmental International Ltd.,Rarotonga, Cook Islands.
Fiji Meteorological Service. 1994. List of Tropical Cyclones in the South West Pacific 1969/70– Presen t. Information Sheet No. 21. Nadi, FijiIslands.
Giorgi, F. and B. Hewitson. 2001. Regional climateinformation - evaluation and projections.Chapter 10. In: IPCC (2001). Climate Change
2001: The Scientific Basis. Contribution of Working Group I to the Third AssessmentReport of the Intergovernmental Panel onClimate Change. Cambridge and New York:Cambridge University Press. pp. 583–638.
Global Environment Facility. 2004. GEF Assistance to Address Adaptation . GEF/C.23/Inf.8, April
References
28, 2004. Available: http://thegef.org/Documents/Council_ Documents/GEFC23/C.2.Inf.8.Rev.1_Adaptation Councilpaper FINAL.doc.
Government of the FSM (Federated States of Micronesia). 1999. FSM Climate Change Program . Prepared under the UnitedNations Framework Convention on ClimateChange. Palikir.
Hay, J. D., and R. Kay. 1993. Possible futureDirections for Integrated Coastal ZoneManagement in the Eastern Hemisphere: A Discussion Paper. In Eastern Hemisphere workshop on the Vulnerability Assessment of Sea Level Rise and Coastal Zone Management ,edited by N. Mimura and R. McLean. Tsukuba,Japan: Intergovernmental Panel on ClimateChange Regional Workshop.
, and K. McGregor. 1993. Climate Changeand Sea Level Rise Issues in the FederatedStates of Micronesia. Apia, Western Samoa:South Pacific Regional EnvironmentProgramme.
Hay, J. E., N. Mimura, J. Campbell, S. Fifita, K. Koshy,R. F. McLean, T. Nakalevu, P. Nunn, and N.de Wet. 2003. Climate Variability and Change and Sea-level Rise in the Pacific Islands Region: A Resource Book for Policy and Decision Makers, Educators and Other Stakeholders. Apia, Samoa: South Pacific
Regional Environment Programme.
Henderson-Sellers, A., H. Zhang, G. Berz, K. Emanuel, W. Gray, C. Landsea, G. Holland, J. Lighthill,S.-L. Shieh, P. Webster, and K. McGuffie. 1998.Tropical cyclones and global climate change:a post-IPCC assessment. Bulletin of the American Meteorological Society 79: 19-38.
8/13/2019 Climate Proofing: A Risk-based Approach to Adaptation
http://slidepdf.com/reader/full/climate-proofing-a-risk-based-approach-to-adaptation 147/219
Climate Proofing: A Risk-based Approach to Adaptation120
Hulme, M., T. Wigley, E. Barrow, S. Raper, A. Centella,S. Smith, and A. Chipanshi. 2000. Using aClimate Scenario Generator for Vulnerability and Adaptation Assessments : MAGICC andSCENGEN Version 2.4 Workbook, Norwich,UK: Climatic Research Unit.
IPCC (Intergovernmental Panel on Climate Change).
2001. Climate Change 2001: The ScientificBasis. Contribution of Working Group I to theThird Assessment Report of the Intergovern-mental Panel on Climate Change. Cambridgeand New York: Cambridge University Press.
JPL (Jet Propulsion Laboratory). No Date. Available: www. Podaac-esip.jpl.nasa.gov.
JICA (Japan International Cooperation Agency).
1994. The Additional Study on CoastalProtection and Port Improvement in theCook Islands. Draft Final Report for Ministry of Planning and Economic Development—The Cook Islands. Pacific ConsultantsInternational and The Overseas Coastal AreaDevelopment Institute of Japan.
Kerr, I. S. 1976. Tropical Storms and Hurricanes inthe Southwest Pacific, November 1939 to April 1969. Misc. Pub. 148. Wellington, NZ:New Zealand Meteorological Service,Ministry of Transport.
Kirk, R. and D. E. Dorrell. 1992. Analysis and Nu-merical Modelling of Cyclone Sea-states Avarua and Nike Areas. Report commis-sioned by Government of the Cook Islands.
Office of the President, FSM (Federated States of
Micronesia). 2004. Proceedings, Third FSMEconomic Summit. Plaice, Pohnpei, Federa-tion States of Micronesia. 28 March–2 April.
Ready, Steve. Meteorologist, New ZealandMeteorological Service.
Revell, C. G. 1981. Tropical Cyclones in the SouthwestPacific, November 1969 to April 1979. Misc.Pub. 170. Wellington, NZ: New ZealandMeteorological Service, Ministry of Transport.
Swart, R., J. Robinson and S. Cohen. 2003. ClimateChange and Sustainable Development:Expanding the Options. Climate Policy 3S1:S19–S40.
UNDP-GEF (United Nations DevelopmentProgramme-Global Environment Facility).2003. UNDP-GEF Capacity Developmentand Adaptation Cluster. Adaptation Policy Framework. New York.

8/13/2019 Climate Proofing: A Risk-based Approach to Adaptation
http://slidepdf.com/reader/full/climate-proofing-a-risk-based-approach-to-adaptation 148/219
121Appendix 1
Appendix 1
Federated States of Micronesia —Climate Risk Profile
Summary
The likelihood (i.e., probability) componentsof climate-related risks in the FederatedStates of Micronesia (FSM) are evaluated, forboth present-day and future conditions.
Changes over time reflect the influence of global warming.
The risks evaluated are extreme rainfall events(both hourly and daily), drought, high sea levels,strong winds, and extreme high air temperatures.
Projections of future climate-related risk arebased on the output of global climate models, forgiven emission scenarios and model sensitivity.
With the exception of maximum wind speed,
projections of all the likelihood components of climate-related risk show marked increases as aresult of global warming.
A. Introduction
Formally, risk is the product of the consequenceof an event or happening and the likelihood (i.e.,probability) of that event taking place.
Whil e the consequence component of aclimate-related risk will be site or sector specific, in
general the likelihood component of a climate-related risk will be applicable over a largergeographical area and to many sectors. This is dueto the spatial scale and pervasive nature of weatherand climate. Thus the likelihood of, say, an extremeevent or climate anomaly is often evaluated for acountry, state, small island, or similar geographicalunit. While the likelihood may well be within a given
unit, information is often insufficient to assess thisspatial variabili ty, or the variations are judged to beof low practical significance.
The following climate conditions are consid-ered to be among the potential sources of risk:
• extreme rainfall events,• drought,• high sea levels,• strong winds, and• extreme high air temperatures.
B. Methods
Preparation of a climate risk profile for a givengeographical unit involves an evaluation of currentlikelihoods of all relevant climate-related risks,based on observed and other pertinent data.
Climate change scenarios are used to developprojections of how the likelihoods might change inthe future. For rainfall and temperature projections,the Hadley Centre (United Kingdom) global climatemodel (GCM) was used, as it gave results interme-diate between those provided by three other GCMs,namely those developed by the Australian Com-monwealth Scientific and Industrial ResearchOrganisation, Japan’s National Institute for Environ-
mental Science, and the Canadian Climate Centre.For drought, strong winds, and sea level, the Cana-dian GCM was used to develop projections.
Similarly, the SRES A1B greenhouse gasemission scenario was used when preparing rainfall,temperature, and sea level projections. Figure A1.1shows that this scenario is close to the middle of theenvelope of projected emissions and greenhouse

8/13/2019 Climate Proofing: A Risk-based Approach to Adaptation
http://slidepdf.com/reader/full/climate-proofing-a-risk-based-approach-to-adaptation 149/219
Climate Proofing: A Risk-based Approach to Adaptation122
gas concentrations. For drought both the A2 and B2emission scenarios were used, while for strong winds only the A2 scenario was used.
C. Information Sources
Daily and hourly rainfall, daily temperatures,and hourly wind data were obtained through thePohnpei Weather Service Office and with theassistance of Mr. Chip Guard, National Oceanic and Atmospheric Administration, Guam. Sea-level datafor Pohnpei were supplied by the National TidalFacility, The Flinders University of South Australia,and are copyright reserved. The sea-level dataderived from Topex-Poisidon satellite observations were obtained from www.//podaac-esip.jpl.nasa.gov.
D. Data Specifications
While much of the original data was reportedin Imperial units, all data are presented using SystemInternational units.
E. Uncertainties
The sources of uncertainty in projections of thelikelihood components of climate-related risks arenumerous. They include uncertainties in green-house gas emissions and those arising from model-ing the complex interactions and responses of theatmospheric and ocean systems. Figure A1.2 shows
how uncertainties in greenhouse gas emissionsimpact on estimates of the return periods of a daily precipitation of at least 250 mm for Pohnpei.
Similar graphs can be prepared for other GCMsand extreme events, but are not shown here. Policy and decision makers need to be cognizant of uncertainties in projections of the likelihoodcomponents of extreme events.
F. Graphical Presentations
Many of the graphs that follow portray thelikelihood of a given extreme event as a function of a time horizon. This is the most appropriate anduseful way in which to depict risk since design life(i.e., time horizon) varies depending on the natureof the infrastructure or other development project.
Figure A1.1. Scenarios of CO 2 Gas Emissions andConsequent Atmospheric Concentrations of CO 2
(a) CO2 emmisions
(b) CO2 concentrations
Notes: CO2 = carbon dioxide; Gt C/yr = gigatonnes of carbon per year.Source: IPCC 2001.

8/13/2019 Climate Proofing: A Risk-based Approach to Adaptation
http://slidepdf.com/reader/full/climate-proofing-a-risk-based-approach-to-adaptation 150/219
123Appendix 1
G. Extreme Rainfall Events
Daily Rainfall
Figure A1.3 shows the frequency distribution of daily precipitation for Pohnpei. A daily total above250 mm is a relatively rare event, with a returnperiod (i.e., recurrence interval) of 10 years.
Figure A1.4 shows the likelihood of such anextreme rainfall event occurring in Pohnpei andKosrae, within a given time horizon ranging from 1to 50 years.
As shown in Table A1.1, global warming willsignificantly alter the return periods, and hence thelikelihoods, of the extreme rainfall events. Forexample, Figure A1.5 illustrates how the likelihoodof a daily rainfall of 250 mm will increase over the
remainder of the present century.
Figure A1.2. Return Periods for Daily Rainfall of250 mm in Pohnpei for Given Greenhouse
Gas Emission Scenarios
Note: Calculations used Hadley Center GCM with Best Judgment of Sensitivity.Source: CCAIRR findings.
Figure A1.3. Frequency Distribution of Daily Precipitation for Pohnpei(1953–2003)
mm = millimeters.Note: The numbers above the bars represent the frequency of occurrence, in percentages, for the given data interval.Source: CCAIRR findings.

8/13/2019 Climate Proofing: A Risk-based Approach to Adaptation
http://slidepdf.com/reader/full/climate-proofing-a-risk-based-approach-to-adaptation 151/219

8/13/2019 Climate Proofing: A Risk-based Approach to Adaptation
http://slidepdf.com/reader/full/climate-proofing-a-risk-based-approach-to-adaptation 152/219
125Appendix 1
Table A1.2: Return Periods for Hourly Rainfall,Pohnpei and Kosrae
(years)
Rainfall Present 2025 2050 2100 (mm)
Pohnpei
50 2 1 1 1100 6 3 2 1150 14 7 4 2200 23 12 7 4250 34 18 11 5300 47 25 15 8350 61 32 20 10400 77 40 26 13
Kosrae
50 2 2 1 1
100 8 6 5 3150 16 13 10 6200 28 21 16 11250 41 31 24 16300 56 42 33 22350 73 55 43 29400 91 68 54 37
Source: CCAIRR findings.
Figure A1.6. Frequency Distribution of Hourly Precipitation for Pohnpei
Notes: Data are for 1980 to 2002, with gaps. The numbers above the bars represent the frequency of occurrence for the given data interval, in percent of hours of observed rainfall.Source: CCAIRR findings.
Figure A1.7. Likelihood of an Hourly Rainfallof 200 mm Occurring in Pohnpei Within the
Indicated Time Horizon(years)
Notes: 0 = zero chance; 1 – statistical certainty. Values for present day based onobserved data for 1980–2002, with gaps.Source: CCAIRR findings.
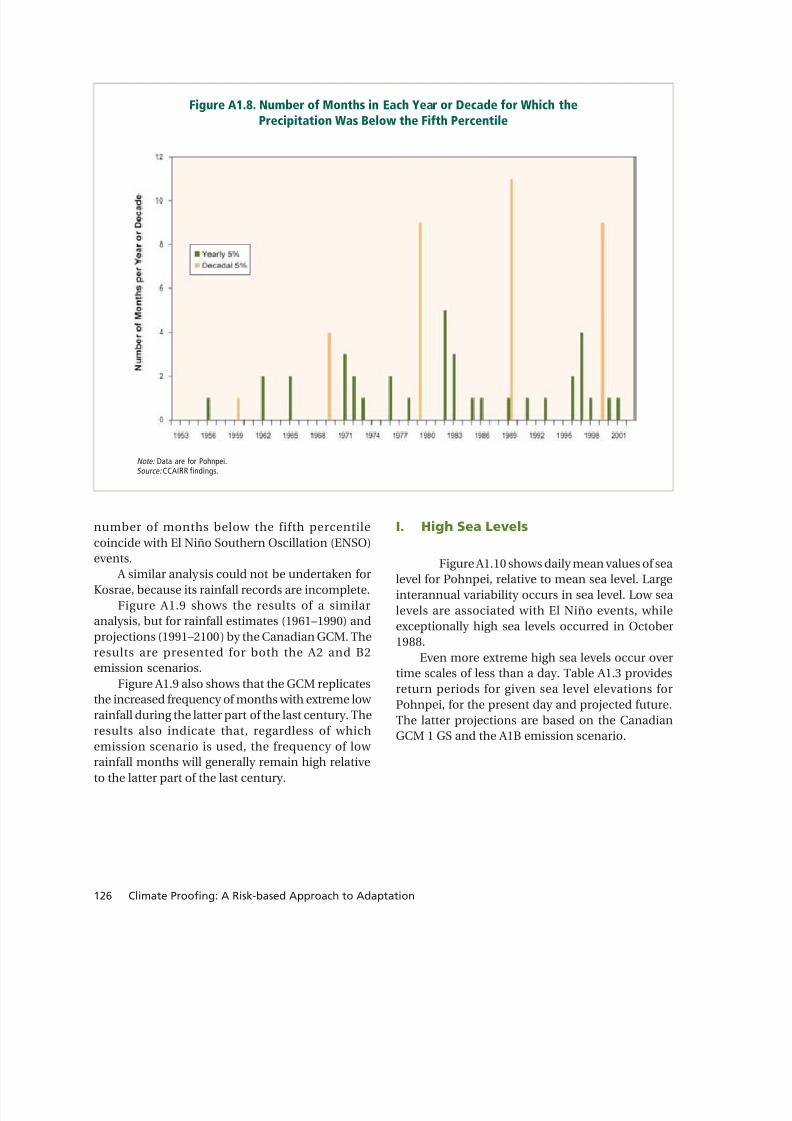
8/13/2019 Climate Proofing: A Risk-based Approach to Adaptation
http://slidepdf.com/reader/full/climate-proofing-a-risk-based-approach-to-adaptation 153/219
Climate Proofing: A Risk-based Approach to Adaptation126
number of months below the fifth percentilecoincide with El Niño Southern Oscillation (ENSO)events.
A similar analysis could not be undertaken forKosrae, because its rainfall records are incomplete.
Figure A1.9 shows the results of a similaranalysis, but for rainfall estimates (1961–1990) andprojections (1991–2100) by the Canadian GCM. Theresults are presented for both the A2 and B2emission scenarios.
Figure A1.9 also shows that the GCM replicatesthe increased frequency of months with extreme low rainfall during the latter part of the last century. The
results also indicate that, regardless of whichemission scenario is used, the frequency of low rainfall months will generally remain high relativeto the latter part of the last century.
Figure A1.8. Number of Months in Each Year or Decade for Which thePrecipitation Was Below the Fifth Percentile
Note: Data are for Pohnpei.Source: CCAIRR findings.
I. High Sea Levels
Figure A1.10 shows daily mean values of sealevel for Pohnpei, relative to mean sea level. Largeinterannual variability occurs in sea level. Low sealevels are associated with El Niño events, whileexceptionally high sea levels occurred in October1988.
Even more extreme high sea levels occur overtime scales of less than a day. Table A1.3 providesreturn periods for given sea level elevations forPohnpei, for the present day and projected future.The latter projections are based on the Canadian
GCM 1 GS and the A1B emission scenario.

8/13/2019 Climate Proofing: A Risk-based Approach to Adaptation
http://slidepdf.com/reader/full/climate-proofing-a-risk-based-approach-to-adaptation 154/219
127Appendix 1
Figure A1.9. Number of Months per Decade for Which Pecipitation forPohnpei is Projected to be Below the Fifth Percentile
Note: data from the Canadian Global Climate Model, with A2 and B2 emission scenarios and best estimate for GCM sensitivity.Source: CCAIRR findings.
Figure A1.10: Daily Mean Values of Sea Level for Pohnpei(1974–2003)
Note: The sea level elevations are relative to surveyed mean sea level.Source: CCAIRR findings.
0
-100
-200
-300
600
500
400
300
200
100
-400
S e a
L e v e
l ( m m
)

8/13/2019 Climate Proofing: A Risk-based Approach to Adaptation
http://slidepdf.com/reader/full/climate-proofing-a-risk-based-approach-to-adaptation 155/219
Climate Proofing: A Risk-based Approach to Adaptation128
The indicated increases in sea level over thenext century are driven by global and regionalchanges in mean sea level as a consequence of global warming. Figure A1.11 illustrates themagnitude of this contribution.
Sea level elevations are not recorded in situ forKosrae. However, satellite observations of sea levelsare available and can add some understanding toboth historic and anticipated changes in sea levels.
Table A1.3. Return Periods for ExtremeHigh Sea Levels, Pohnpei
(years)
Sea Level Present 2025 2050 2100 (mm) Day
80 1 1 1 190 1 1 1 1100 4 2 1 1110 14 5 2 1120 61 21 5 1130 262 93 20 1140 1,149 403 86 2Note: cm = centimeters.Source: CCAIRR findings.
Figure A1.11 Sea-Level Projections for Pohnpei,Based on the Canadian GCM 1GS and the
A1B Emission Scenario
cm = centimeters; GCM = global climate model. Uncertainties related to GCMsensitivity are indicated by the blue, red, and green lines, representing high,best estimate, and low sensitivities, respectively.Source: CCAIRR findings.
Figure A1.12. Sea Level (departure from normal) as Determined by thePohnpei Tide Gauge and by Satellite
rms = root mean square.Source: CCAIRR findings..
A high level of agreement occurs between thetide gauge and satellite measurements of sea level,at least for monthly averaged data (Figure A1.12).
Pohnpei Tide Gauge vs. T/P Altimeter
cm
rms = 2.0 cm
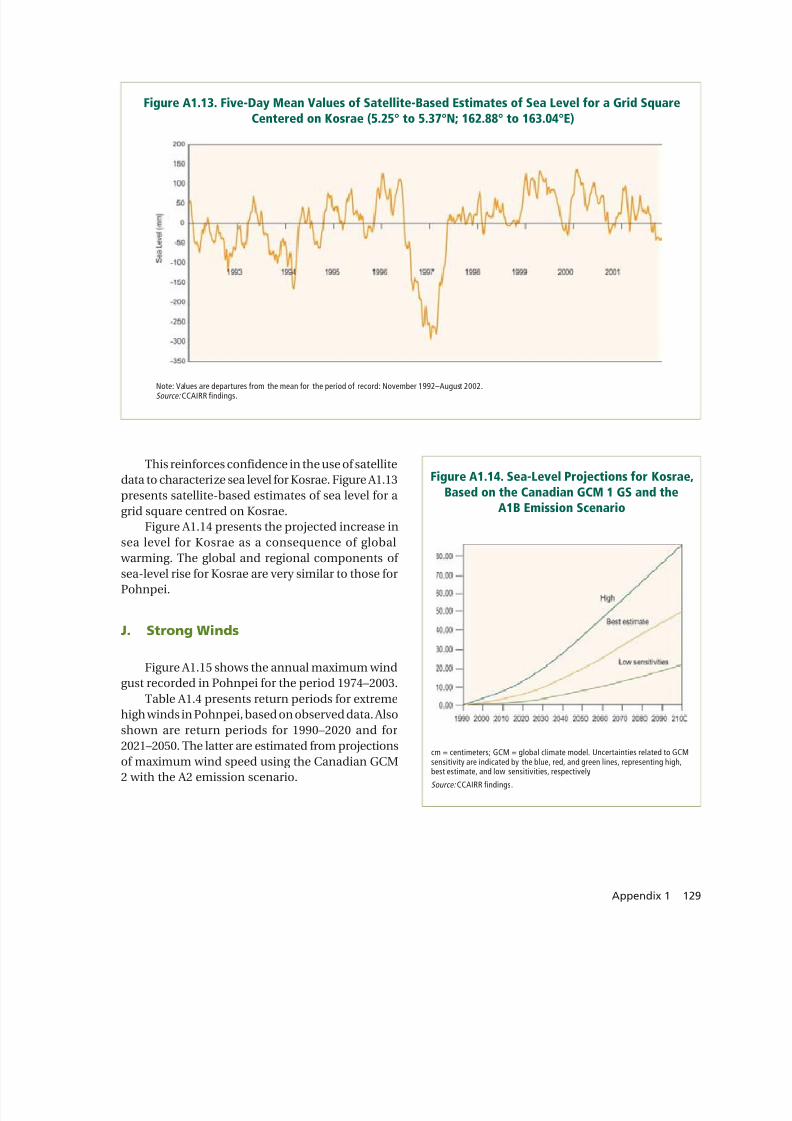
8/13/2019 Climate Proofing: A Risk-based Approach to Adaptation
http://slidepdf.com/reader/full/climate-proofing-a-risk-based-approach-to-adaptation 156/219

8/13/2019 Climate Proofing: A Risk-based Approach to Adaptation
http://slidepdf.com/reader/full/climate-proofing-a-risk-based-approach-to-adaptation 157/219
Climate Proofing: A Risk-based Approach to Adaptation130
Figure 1.15. Annual Maximum Wind Gust Recorded in Pohnpei for the Period 1974–2003
Note: m/s = meters per second.Source: CCAIRR findings.
Figure A1.16 depicts the impact of global warming on the likelihood of a maximum wind gustof 28 m s-1 for Pohnpei.
K. Extreme High Temperatures
Figure A1.17 presents the frequency distribu-tion of daily maximum temperature for Pohnpei.
Table A1.4. Return Periods for MaximumWind Speed, Pohnpei
(years)
Wind Speed Hourly Daily(ms-1) 1974–2003 1961–1990 1991–2020 2021–2050
20 2 2 2 225 8 10 10 928 20 47 40 20
Source: CCAIRR findings.
Figure A1.16 Likelihood of a Maximum WindGust of 28 m s-1 Occurring Within theIndicated Time Horizon in Pohnpei
(years)
0 = zero chance; 1 – statistical certainty.Note: Values based on Canadian Global Climate Model 2, wi th A2 emissionscenario.Source: CCAIRR findings.
L i k e
l i h o o
d

8/13/2019 Climate Proofing: A Risk-based Approach to Adaptation
http://slidepdf.com/reader/full/climate-proofing-a-risk-based-approach-to-adaptation 158/219
131Appendix 1
Table A1.5 details the return periods for daily maximum temperature for Pohnpei, based onobserved data (1953–2001) and projections using the Hadley Centre GCM and the A1B emissionscenario.
Figure A1.18 depicts the impact of global
warming on the likelihood of a daily maximumtemperature of 36°C for Pohnpei.
Figure A1.17. Frequency Distribution of Daily Maximum Temperature for Pohnpei
Source:Based on observed data 1953–2001.
Figure A1.18. Likelihood of a MaximumTemperature of 36°C Occurring Within the
Indicated Time Horizon in Pohnpei(years)
Likelihood 0 = zero chance; 1 – statistical certainty.Notes: Values based on observed data (1953–2001) and on projections fromthe Hadley Centre Global Climate Module (GCM) with A1B emission scenarioand best estimate of GCM sensitivity.Source: CCAIRR findings.
Table A1.5. Return Periods for Daily MaximumTemperature, Pohnpei
(years)
Maximum Observed ProjectedTemperature (1953–2001) 2025 2050 2100
(°C)
32 1 1 1 1
33 1 1 1 134 4 2 2 135 24 11 6 236 197 80 39 1037 2,617 1,103 507 101
Source: CCAIRR findings.

8/13/2019 Climate Proofing: A Risk-based Approach to Adaptation
http://slidepdf.com/reader/full/climate-proofing-a-risk-based-approach-to-adaptation 159/219
Climate Proofing: A Risk-based Approach to Adaptation132
Appendix 2
The Cook Islands—Climate Risk Profile 1
Summary
The likelihood (i.e., probability) componentsof climate-related risks in the Cook Islandsare evaluated, for both present-day andfuture conditions. Changes into the future
reflect the influence of global warming.The risk events for which current and future
likelihoods are evaluated are extreme rainfall events(both hourly and daily), drought, high sea levels,strong winds, and extreme high air temperatures.Tropical cyclone frequencies over the past century are also examined. Some climate-related humanhealth and infrastructure risks are also investigated.
Projections of future climate-related risk are
based on the output of global climate models, forgiven emission scenarios and model sensitivity. All the likelihood components of projected
climate-related risk show marked increases as aresult of global warming.
A. Introduction
Formally, risk is the combination of theconsequence of an event and the likelihood (i.e.,probability) of that event taking place.
Whil e the consequence componen t of aclimate-related risk will be site or sector specific, ingeneral the likelihood component of a climate-related risk will be applicable over a largergeographical area and many sectors. This is due to
the spatial scale and pervasive nature of weather andclimate. Thus, the likelihood of, say, an extremeevent or climate anomaly is often evaluated for acountry, state, small island, or similar geographicalunit. While the likelihood may well vary within agiven unit, information is often insufficient to assessthis spatial variability, or the variations are judgedto be of low practical significance.
The following climate conditions areconsidered to be potential sources of risk:
• extreme rainfall events,• drought,• high sea levels and extreme wave heights,• strong winds, and• extreme high air temperatures.
Some climate-related human health andinfrastructure risks are also investigated.
B. Methods
Preparation of a climate risk profile for a givengeographical unit involves an evaluation of currentlikelihoods of all relevant climate-related risks,based on observed and other pertinent data.
Climate change scenarios are used to develop
projections of how the likelihoods might change inthe future. For rainfall and temperature projections,the Australian Commonwealth Scientific andIndustrial Research Organization global climatemodel (GCM) was used, as it is considered to work best in the South Pacific. For drought, strong winds,and sea level, the Canadian GCM was used to
1 At this time the profile is limited to Rarotonga.

8/13/2019 Climate Proofing: A Risk-based Approach to Adaptation
http://slidepdf.com/reader/full/climate-proofing-a-risk-based-approach-to-adaptation 160/219
133Appendix 2
envelope of projected emissions, and hence of greenhouse gas concentrations. For drought, boththe A2 and B2 emission scenarios were used, whilefor extreme wind gusts, only the A2 scenario wasused. Again, the required projections were availableonly for these scenarios.
C. Information Sources
Daily and hourly rainfall, daily temperature, andhourly wind data were obtained through the Cook Islands Meteorological Service Office. Sea-level datafor Rarotonga were supplied by the National TidalFacility, The Flinders University of South Australia,and are copyright reserved.
D. Uncertainties
Sources of uncertainty in projections of thelikelihood components of climate-related risks arenumerous. These include uncertainties in greenhousegas emissions and those arising from modelling thecomplex interactions and responses of theatmospheric and ocean systems. Figure A2.2 showshow uncertainties in greenhouse gas emissionsimpact on estimates of the return periods of a daily precipitation of at least 250 mm for Rarotonga.
Similar graphs can be prepared for other GCMsand extreme events, but are not shown here. Policy and decision makers need to be cognizant of uncertainties in projections of the likelihoodcomponents of extreme events.
E. Graphical Presentations
Many of the graphs that follow portray thelikelihood of a given extreme event as a function of a time horizon. This is the most appropriate and
useful way in which to depict risk, since design life(i.e., time horizon) varies depending on the natureof the infrastructure or other development project.
Figure A2.1. Scenarios of CO 2 Gas Emissionsand Consequent Atmospheric Concentrations
of CO2
(a) CO2 emmisions
(b) CO2 concentrations
Notes: CO2 = carbon dioxide; Gt C/yr = gigatonnes of carbon per year.Source: IPCC 2001.
develop the projections, as this was the only GCMfor which the required data were available.
The SRES A1B greenhouse gas emissionscenario was used when preparing rainfall,temperature, and sea-level projections. Figure A2.1shows that this scenario is close to the middle of the
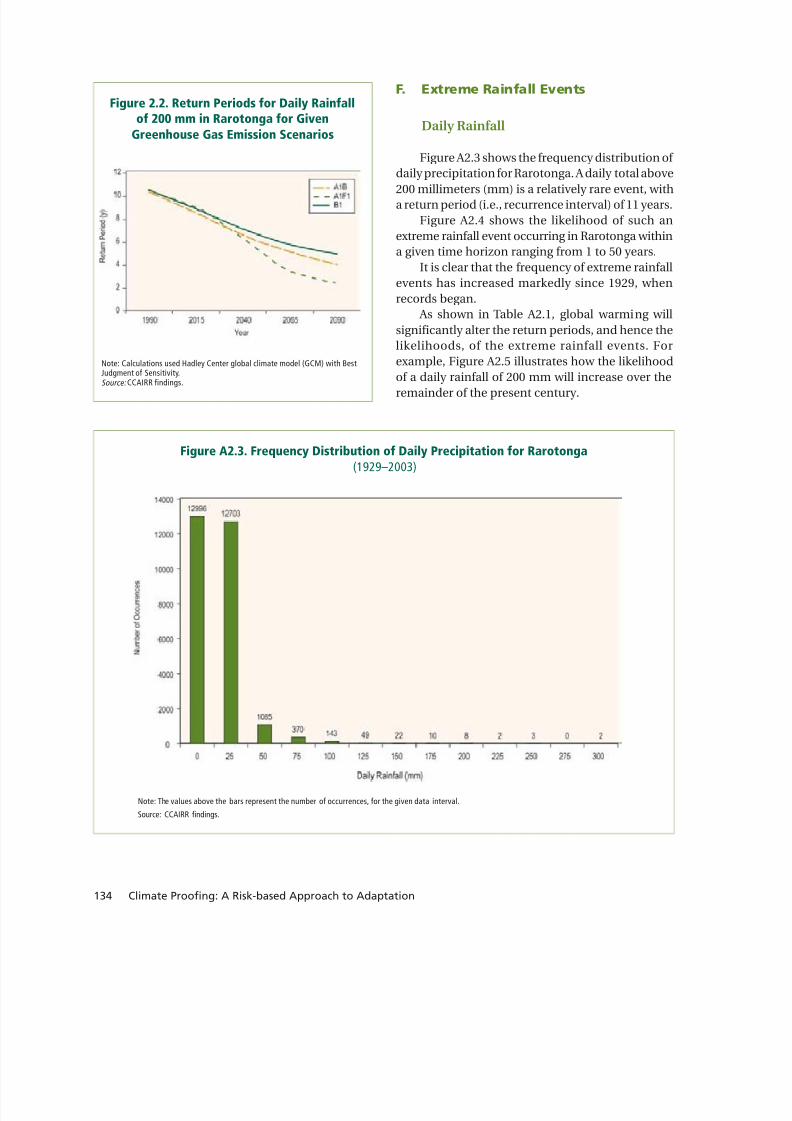
8/13/2019 Climate Proofing: A Risk-based Approach to Adaptation
http://slidepdf.com/reader/full/climate-proofing-a-risk-based-approach-to-adaptation 161/219
Climate Proofing: A Risk-based Approach to Adaptation134
Figure 2.2. Return Periods for Daily Rainfallof 200 mm in Rarotonga for Given
Greenhouse Gas Emission Scenarios
Note: Calculations used Hadley Center global climate model (GCM) with BestJudgment of Sensitivity.Source: CCAIRR findings.
F. Extreme Rainfall Events
Daily Rainfall
Figure A2.3 shows the frequency distribution of daily precipitation for Rarotonga. A daily total above200 millimeters (mm) is a relatively rare event, witha return period (i.e., recurrence interval) of 11 years.
Figure A2.4 shows the likelihood of such anextreme rainfall event occurring in Rarotonga withina given time horizon ranging from 1 to 50 years.
It is clear that the frequency of extreme rainfallevents has increased markedly since 1929, whenrecords began.
As shown in Table A2.1, global warming willsignificantly alter the return periods, and hence thelikelihoods, of the extreme rainfall events. For
example, Figure A2.5 illustrates how the likelihoodof a daily rainfall of 200 mm will increase over theremainder of the present century.
Figure A2.3. Frequency Distribution of Daily Precipitation for Rarotonga(1929–2003)
Note: The values above the bars represent the number of occurrences, for the given data interval.Source: CCAIRR findings.

8/13/2019 Climate Proofing: A Risk-based Approach to Adaptation
http://slidepdf.com/reader/full/climate-proofing-a-risk-based-approach-to-adaptation 162/219
135Appendix 2
Table A2.1: Return Periods and Likelihood of Occurrence in 1 Year 1 for Daily Rainfall in Rarotonga
Present(1970–2003) 2025 2050 2100
RP LO RP LO RP LO RP LO100 1 0.78 1 .81 1 0.83 1 0.87150 3 0.34 3 .38 2 0.44 2 0.56200 7 0.14 6 .16 5 0.20 3 0.31250 18 0.06 13 .08 10 0.10 6 0.17300 38 0.03 26 .04 19 0.05 11 0.09350 76 0.01 47 .02 35 0.03 19 0.05400 141 0.01 81 .01 59 0.02 31 0.03450 248 0 130 .01 95 0.01 50 0.02500 417 0 201 0 148 0.01 78 0.01
Notes: RP = return period; LO = likelihood of occurrence.1 A likelihood of 0 equals zero chance while a likelihood of 1 equates to a statistical certainty that the event will occur within a year.Source: CCAIRR findings.
Rainfall(mm)
(at least)
Figure A2.4. Likelihood of a Daily Rainfallof at Least 200 mm Occurring within the
Time Horizon(years)
Note: 0 = zero chance; 1 = statistical certainty. Data for Rarotonga, forindicated data periods.Source: CCAIRR findings.
Figure A2.5. Likelihood of a Daily Rainfallof at Least 200 mm Occurring within the
Indicated Time Horizon(years)
Note: 0 = zero chance; 1 = statistical certainty. Data for Rarotonga.Source:CCAIRR findings.

8/13/2019 Climate Proofing: A Risk-based Approach to Adaptation
http://slidepdf.com/reader/full/climate-proofing-a-risk-based-approach-to-adaptation 163/219
Climate Proofing: A Risk-based Approach to Adaptation136
An obvious question arises: are the past changesin the probability component consistent with thechanges projected to occur in the future as a resultof global warming? The trend of increasing likelihoodthat was apparent in the historical data for much of the last century is projected to continue, in a
consistent manner, through the present century.Observed and projected likelihoods of at least 250mm of rain falling in a day are presented in Figure A2.6. A high degree of consistency is apparent. It isimportant to note that this consistency does notprove the existence of a global warming signal in theobserved data. More detailed analyses are requiredbefore any such attributions can be made.
F. Hourly Rainfall
Figure A2.7 shows the frequency distribution of hourly precipitation for Rarotonga. An hourly totalabove 50 mm is a relatively rare event. Table A2.2 showssuch a rainfall has a return period of 3 years, and thatglobal warming will have a significant impact on thereturn periods of extreme rainfall events.
Figure A2.6. Observed and Projected Likelihoodsof a Daily Rainfall of at Least 250 mm
Occurring in a Year
Notes: black symbols = observed likelihoods; green symbols = projected
likelihoods. Data for Rarotonga.Source: CCAIRR findings.
Figure A2.7. Frequency Distribution of Hourly Precipitation for Rarotonga
Notes: Data for 1970–1979. The values above the bars represent the number of occurrences for the given data interval.Source: CCAIRR findings.

8/13/2019 Climate Proofing: A Risk-based Approach to Adaptation
http://slidepdf.com/reader/full/climate-proofing-a-risk-based-approach-to-adaptation 164/219
137Appendix 2
Table A2.2: Return Periods and Likelihood of Occurrence in 1 Year for Daily Rainfall Rarotonga
Present 2025 2050 2100
RP LO RP LO RP LO RP LO
25 1 0.93 1 0.92 1 0.93 1 0.9350 3 0.29 3 0.36 3 0.39 2 0.4575 18 0.05 12 0.08 8 0.12 6 0.18100 91 0.01 57 0.02 25 0.04 13 0.08125 384 0 246 0 67 0.01 25 0.04150 N/A N/A 980 0 159 0.01 46 0.02
Notes: RP = return period in years; LO = likelihood of occurrence.Source: CCAIRR findings.
Rainfall (mm)(at least)
Figure A2.8 depicts the impact of global
warming on the likelihood of an hourly rainfall of 75 mm for Rarotonga.
F. Drought
Figure A2.9 presents, for Rarotonga, the numberof months in each year (1929–2003) and each decadefor which the observed precipitation was below the10th percentile. Monthly rainfall below the fifthpercentile is used here as an indicator of drought.
Most of the low rainfall months are concentratedin the latter part of the period of observation,indicating that the frequency of drought hasincreased since the 1930s. The years with a highnumber of months below the fifth percentilecoincide with El Niño Southern Oscillation (ENSO)events.
Figure A2.10 shows the results of a similaranalysis, but for rainfall estimates (1961–1990) andprojections (1991–2100).
The results indicate that prolonged and moreintense periods of drought will occur during theremainder of the 21st century.
Figure A2.8. Likelihood of an Hourly Rainfallof at Least 75 mm Occurring Within the
Indicated Time Horizon in Rarotonga(years)
Notes: Likelihood 0 = zero chance; 1 = statistical certainty. Values for presentday based on observed data for 1980–2002, with gaps.Source: CCAIRR findings.

8/13/2019 Climate Proofing: A Risk-based Approach to Adaptation
http://slidepdf.com/reader/full/climate-proofing-a-risk-based-approach-to-adaptation 165/219
Climate Proofing: A Risk-based Approach to Adaptation138
Figure A2.9. Number of Months in Each Year and Decade for which thePrecipitation was Below the Fifth Percentile
Note:data for Rarotonga.Source: CCAIRR findings.
Figure A2.10. Number of Months Per Year and Per Decade for Which Precipitation inRarotonga was Observed, and is Projected to Be, Below the Fifth Percentile
Notes: data from the Canadian global climate module (GCM), with A2 emission scenarios and best estimate for GCM sensitivity.Source: CCAIRR findings.
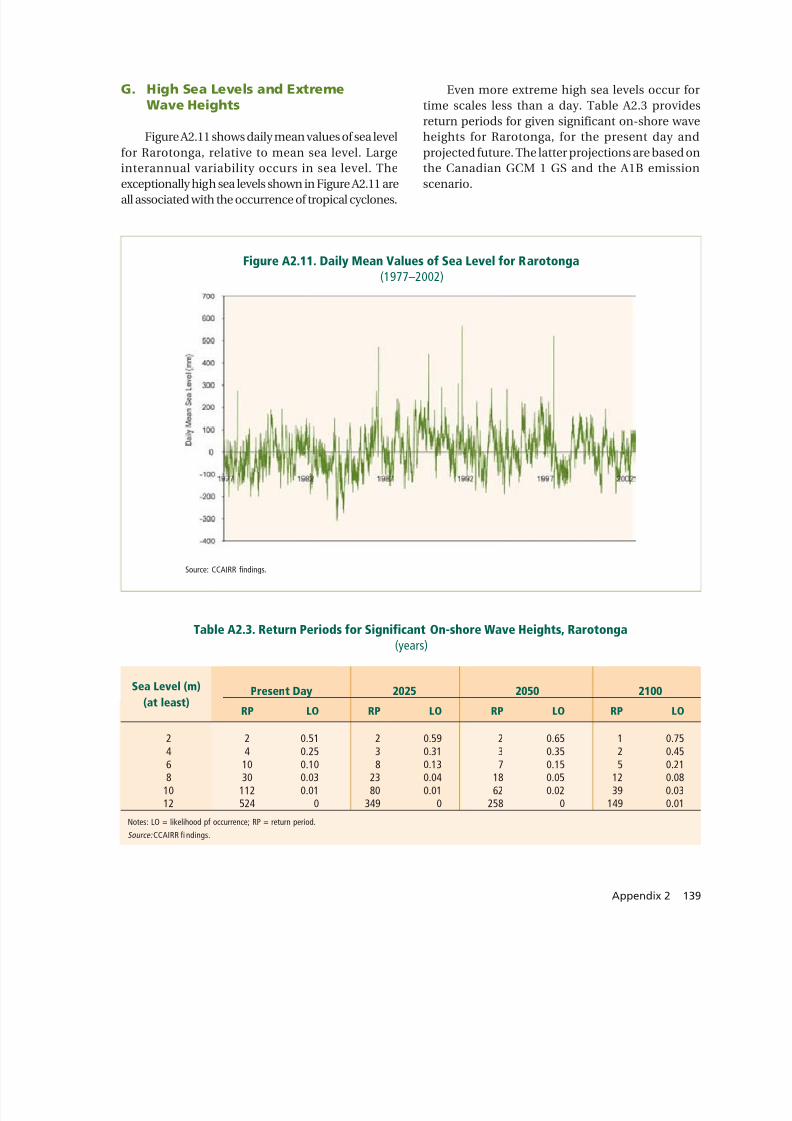
8/13/2019 Climate Proofing: A Risk-based Approach to Adaptation
http://slidepdf.com/reader/full/climate-proofing-a-risk-based-approach-to-adaptation 166/219
139Appendix 2
Sea Level (m)(at least)
G. High Sea Levels and ExtremeWave Heights
Figure A2.11 shows daily mean values of sea levelfor Rarotonga, relative to mean sea level. Largeinterannual variability occurs in sea level. The
exceptionally high sea levels shown in Figure A2.11 areall associated with the occurrence of tropical cyclones.
Even more extreme high sea levels occur fortime scales less than a day. Table A2.3 providesreturn periods for given significant on-shore waveheights for Rarotonga, for the present day andprojected future. The latter projections are based onthe Canadian GCM 1 GS and the A1B emission
scenario.
Figure A2.11. Daily Mean Values of Sea Level for Rarotonga(1977–2002)
Source: CCAIRR findings.
Table A2.3. Return Periods for Significant On-shore Wave Heights, Rarotonga(years)
Present Day 2025 2050 2100
RP LO RP LO RP LO RP LO
2 2 0.51 2 0.59 2 0.65 1 0.754 4 0.25 3 0.31 3 0.35 2 0.456 10 0.10 8 0.13 7 0.15 5 0.218 30 0.03 23 0.04 18 0.05 12 0.08
10 112 0.01 80 0.01 62 0.02 39 0.0312 524 0 349 0 258 0 149 0.01
Notes: LO = likelihood pf occurrence; RP = return period.Source: CCAIRR fi ndings.

8/13/2019 Climate Proofing: A Risk-based Approach to Adaptation
http://slidepdf.com/reader/full/climate-proofing-a-risk-based-approach-to-adaptation 167/219
Climate Proofing: A Risk-based Approach to Adaptation140
The indicated increases in sea level over thenext century are driven by global and regionalchanges in mean sea level as a consequence of global warming. Figure A2.12 illustrates the magnitude of this contribution.
Figure A2.12. Sea Level Projectionsfor Rarotonga
Notes: Uncertainties related to global climate model sensitivity are indicatedby the blue, red and green lines, representing high, best estimate, and lowsensitivities, respectively.Source: CCAIRR findings.
Figure A2.13. Annual Maximum Wind GustRecorded in Rarotonga for the Period
1972–1999
Source: CCAIRR findings.
Figure A2.14. Likelihood of a Wind Gust of40 m/sec (78 kt) Occurring Within theIndicated Time Horizon, Rarotonga
Notes: 0 = zero chance; 1 = statistical certainty. Data for Rarotonga, CookIslands (1972–1999). A wind gust of 40 ms-1 has a return period of 20 years.Source: CCAIRR findings.
H. Strong Winds
Figure A2.13 shows the annual maximum windgust recorded in Rarotonga for the period 1972–1999.
Figure 2.14 presents the likelihood of a windgust of at least 40 m/sec occurring at Rarotonga within the specified time horizon.
Table A2.4 presents the return periods based onan analysis of the observed maximum hourly windgust data and the adjusted GCM wind speed data.
The return period estimates of Kirk are for open water conditions. Strong agreement is observed
between these and the return periods based onobserved data, suggesting that the Rarotongaanemometer provides extreme gust estimates thatare reasonably representative of open waterconditions.
Comparison of the return period estimates forthe 1961–1990 GCM data with the observed data alsoreveals good agreement, though the GCM data tend
to show slightly shorter return periods for lowerextreme wind speeds and slightly longer returnperiods for higher extreme wind speeds.
Arguably the most important finding arising from this analysis is the suggestion that, over thecoming 50 years or so, the return periods for themost extreme wind speeds will reduce significantly,decreasing by approximately half by 2050.

8/13/2019 Climate Proofing: A Risk-based Approach to Adaptation
http://slidepdf.com/reader/full/climate-proofing-a-risk-based-approach-to-adaptation 168/219
141Appendix 2
I. Extreme High Temperatures
Figure A2.15 presents the frequency distribu-tion of daily maximum temperature for Rarotonga.
Table A2.5 details the return periods for daily
maximum temperature for Rarotonga, based onobserved data (1961–2003) and GCM projections.
Figure A2.16 shows the likelihood of amaximum temperature of at least 35°C occurring within the indicated time horizon.
Figure A2.15. Frequency distribution of Monthly Extreme Maximum Temperature for Rarotonga
Note: Based on observed data from 1961 to 2003.Source: CCAIRR findings.
Table A2.4: Estimates of Return Periods for Given Maximum Wind Speeds, Rarotonga(years)
Return Period (years)
Wind Speed Kirk Observed Data GCM Based Maximum Wind Speed Data(m/sec) (1992) (1972–1999) 1961–1990 1991–2020 2021–2050
28.5 2 2 1 1 133.9 5 5 2 2 237.5 10 11 3 4 438.8 13 14 5 5 641.9 25 29 18 16 1444.9 50 57 60 45 3147.8 100 113 120 95 64
Note: GCM = global climate module.Source: CCAIRR findings.

8/13/2019 Climate Proofing: A Risk-based Approach to Adaptation
http://slidepdf.com/reader/full/climate-proofing-a-risk-based-approach-to-adaptation 169/219
Climate Proofing: A Risk-based Approach to Adaptation142
improved substantially over the same time period,it is unwise to read too much into the markedcontrast in frequency between the first and secondhalves of the 20th century. The record for the lastfew decades is much more reliable, hence thedoubling in decadal frequencies between the 1950sand 1990s may well be closer to the truth. It iscertainly consistent with the fact, since the 1970sthat El Niño episodes have tended to be morefrequent, without intervening La Niña events. Theduration of the 1990–95 El Niño is unprecedentedin the climate record of the past 124 years.
Studies by Australia’s Bureau of Meteorology (Figure A2.18a and b) reveal the consequences of the weakened trade winds and eastward movementof the warm waters of the western tropical Pacificduring El Niño events. Because convective systems(e.g., thunderstorms and rainstorms) and tropicalcyclones preferentially occur over warmer waters,changes in the pattern of sea surface temperaturesis reflected in the distribution of rainfall and tropicalcyclones.
A poss ib le consequence of the increasedpersistence of El Niño conditions in recent decadesis the apparent intensification of tropical cyclones,as reflected in the systematic increase in upper 10percentile heights of open water waves associated with tropical cyclones occurring in the vicinity of Rarotonga (Table A2.6).
Fig A2.16 Likelihood of a MaximumTemperature of at Least 35°C Occurring Within
the Indicated Time Horizon in Rarotonga(years)
Note: 0 = zero chance; 1 = statistical certainty.Source: CCAIRR findings.
J. Tropical Cyclones
The number of tropical cyclones passing closeto, and affecting Rarotonga appears to haveincreased during the last century (Figure A2.17).However, since observing and reporting systems
Table A2.5. Return Periods for Monthly Extreme Maximum Temperature, Rarotonga(years)
Observed Projected(1961-2003) 2025 2050 2100
RP LO RP LO RP LO RP LO
31 1 0.72 1 0.90 1 0.97 1 132 3 0.33 2 0.54 1 0.71 1 0.9433 9 0.12 5 0.22 3 0.34 2 0.6434 29 0.03 14 0.07 9 0.12 3 0.2935 108 0.01 52 0.02 29 0.03 10 0.1036 435 0 208 0 115 0.01 37 0.03
Notes: LO = likelihood of occurrence; RP = return period.Source: CCAIRR findings.
MaximumTemperature
(oC)

8/13/2019 Climate Proofing: A Risk-based Approach to Adaptation
http://slidepdf.com/reader/full/climate-proofing-a-risk-based-approach-to-adaptation 170/219
143Appendix 2
Figure A2.17. Number of Tropical Cyclones per Year passing Close to, and Affecting, Rarotonga
Sources: Kerr 1976, Revell 1981, Thompson et al. 1992, d’Aubert and Nunn 1994, Fiji Meteorological Service 2004, and Ready (personal co mmunication).
Figure A2.18a. Average Annual number of Tropical Cyclones for El Niño Years
Source: Australian Bureau of Meteorology, n.d. Reproduced by permission

8/13/2019 Climate Proofing: A Risk-based Approach to Adaptation
http://slidepdf.com/reader/full/climate-proofing-a-risk-based-approach-to-adaptation 171/219
Climate Proofing: A Risk-based Approach to Adaptation144
Table A2.6. Open Water Wave Height (Average of Top 10%)Associated with Tropical Cyclones Recently Affecting Rarotonga
Cyclone Wave Height(name and year) (m)
Charles (1978) 11Sally (1987) 10Val (1991) 14Pam (1997) 14Dovi (2003) 17Heta (2004) 17
Nancy (2005) 22Percy (2005) 19
Source: Dorrell (personal communication).
Figure A2.18b. Average Annual number of Tropical Cyclones for La Niña Years
Source: Australian Bureau of Meteorology, n.d. Reproduced by permission

8/13/2019 Climate Proofing: A Risk-based Approach to Adaptation
http://slidepdf.com/reader/full/climate-proofing-a-risk-based-approach-to-adaptation 172/219
145Appendix 3
Appendix 3
Guidelines for Policy and DecisionMakers and Other Key Players—Federated States of Micronesia
A. Background and Purpose of theseGuidelines
Under its Climate Change AdaptationProgram for the Pacific, the AsianDevelopment Bank (ADB) is facilitating preparation of case studies 1 that demon-
strate a risk-based approach to adapting to climatevariability and change (including extreme events),and the mainstreaming of the adaptation process.The present Guidelines for mainstreaming adapta-tion to climate change are based on the findings of the case studies. They are also informed by experi-ence gained through other investigations and by operational practice.
The Guidelines are intended to assist the Gov-ernment of the Federated States of Micronesia(FSM) and other relevant stakeholders in imple-menting policies, plans, and operational proceduresthat result in integrating adaptation to climate vari-ability and change into national and localdevelopment planning, decision making and opera-tions as an an integral and sustainable part of thedevelopment process.
The Guidelines are presented in the context of
a series of questions that arose, and were answered,in the course of preparing the case studies. Eachguideline has an associated box that provides apractical example of the application of the guideline,
with respect to one of the case studies prepared inthe Federated States of Micronesia (FSM).
Mainstreaming adaptation is the principalfocus of these Guidelines. They do not refer explicitly to other related and important matters, including
• adaptation policy frameworks—for details onthis topic refer, for example, to UNDP-GEF(2003); and
• adaptation measures as such—for nationalexamples see Government of the FSM (1999) andfor regional examples see Hay et al. (2003).
B. Basic Principles for Adaptation toClimate Change
Although, as mentioned above, these Guidelinesfocus on the mainstreaming of adaptation, ratherthan adaptation per se, a listing of some of the basicprinciples for adaptation to climate change will pro-vide a useful foundation for considering themainstreaming process. These include the following:
• Adaptation is, in large part, a continuous,dynamic process that reduces the exposure of
society to risks arising from climatic variability and extremes.• Adaptation must reflect both recurrent historical
risks and new risks associated with climatechange.
• Exploring and undertaking actions to adapt tocurrent climate extremes and variability is of value, both in dealing with today’s problems and
1 Three case studies were carried out in the FSM and three in the Cook Islands.Details are provided in the main part of this book.

8/13/2019 Climate Proofing: A Risk-based Approach to Adaptation
http://slidepdf.com/reader/full/climate-proofing-a-risk-based-approach-to-adaptation 173/219
Climate Proofing: A Risk-based Approach to Adaptation146
as an essential step toward building long-termresilience to withstanding the pending changesin climate;
• Many disaster and climate change responsestrategies are the same as those that contributein a positive manner to sustainable development,
sound environmental management, and wiseresource use; they are also appropriate responsesto climate variability and other present-day andemerging stresses on social, cultural, economic,and environmental systems.
• Effective management of climate-related risksprevents precious resources from being squan-dered on disaster recovery and rehabilitation.
• While many climate-related risks and losses aremanifested locally, measures to alleviate themhave important national and internationaldimensions.
• If adaptation is reactive, as opposed toanticipatory, the range of response options islikely to be narrower and adaptation may wellprove more expensive, socially disruptive, andenvironmentally unsustainable.
• Many development plans and projects at presentunder consideration have life expectanciesrequiring that due consideration be given tofuture climate conditions and sea levels.
• It is easier to enhance the ability of ecosystemsto cope with climate change if they are healthy and not already stressed and degraded.
• Adaptation requires enhancement of institu-tional capacity, development of expertise, andthe building of knowledge. All these take time.
• People will, as a result of their own resourceful-ness or out of necessity, adapt to climate vari-ability and change (including extreme events),based on their understanding and assessment of the anticipated or observed effects, and on theperceived options and benefits for response. Inmany cases, such adaptations will be adequate,effective, and satisfactory.
• However, under some circumstances, such adap-tation may not be satisfactory or successful; anexternal entity, such as central or local govern-ment, may need to facilitate the adaptationprocess to ensure that obstacles, barriers, andinefficiencies are addressed in an appropriatemanner.
C. What is Meant by “MainstreamingAdaptation”?
In the context of addressing climate change andrelated issues, the term “mainstreaming” is used todescribe the integration of policies and measuresto address climate change in ongoing and new development policies, plans, and actions.Mainstreaming adaptation aims to enhance theeffectiveness, efficiency, and longevity of initiativesdirected at reducing climate-related risks, while atthe same time contributing to sustainabledevelopment and improved quality of life.
Mainstreaming also endeavors to address thecomplex tensions between development policiesaimed at immediate issues and the aspects of climate policy aimed at longer-term concerns. The
tensions often become most apparent when choiceshave to be made about the disbursement of limitedgovernment funds—for example, choices betweensupporting education and health care programs onthe one hand and funding climate changeadaptation initiatives on the other. Indeed,mainstreaming is largely about reducing tensionsand conflicts, and avoiding the need to makechoices, by identifying synergistic, win-winsituations. Thus mainstreaming focuses on “noregrets” measures for adaptation. 2
D. Why Mainstream Adaptation?
Even in the near future, climate change is likely to impose untenable social, environmental, andeconomic costs on the FSM. Most of the country isalready experiencing disruptive conditions that areconsistent with many of the anticipated adverseconsequences of climate change, including extensive coastal erosion, drought, flooding andassociated landslides, coral bleaching, and highersea levels.
The risks associated with the full spectrum of climate-related hazards, from extreme events to theconsequences of long-term changes in the climate,
2 “No regrets” measures for adaptation are consistent with sound environmentalmanagement and wise resource use, and are thus appropriate responses to naturalhazards and climate variability, including extreme events; they are thereforebeneficial and cost effective, even if no climate change occurs.

8/13/2019 Climate Proofing: A Risk-based Approach to Adaptation
http://slidepdf.com/reader/full/climate-proofing-a-risk-based-approach-to-adaptation 174/219
147Appendix 3
should be managed in a holistic manner as anintegral part of national development planning andmanagement (Figure A3.1). Most countries already have policies and plans to manage financial risks,human health risks, biosecurity risks, agriculturalrisks, transport sector risks, and energy supply risks.
Climate-induced disasters, and climate change andvariability, should also be included in the nationalrisk management portfolio.
National and state development plans and sec-tor plans should include disaster risk managementstrategies and climate change adaptation measuresto ensure that risks are reduced to acceptable lev-els. These measures, and the related strategies, willhelp strengthen decision-making processes by re-quiring that specific programs and projects includeplans and measures to manage risks associated withextreme events and with climate change and vari-ability. The overall goal should be to manage, in aholistic manner and as an integral part of nationaldevelopment planning, the risks associated with thefull spectrum of weather, climate, and oceanic haz-ards, from extreme events to the consequences of long-term climate change.
Guideline 1
Document the relevant major risks to theeconomy and society resulting from climatevariability and change (including extreme events),characterizing these in terms of their probabilities
of occurrence and associated economic and socialconsequences (Box A3.1).
F. At a Practical level, What DoesAdaptation Mainstreaming Entail?
Adap ta ti on ma inst ream ing has two key practical components:
• creating and strengthening the enabling environment for adaptation; and
• integrating adaptation planning and implemen-tation into existing and new development poli-cies, plans, and actions.
Figure A3.1. The “Optimal Response “ to Climate Change
Sources: adapted from Kay and Hay (1993), Hay and McGregor (1994), and Campbell and de Wet (1999).

8/13/2019 Climate Proofing: A Risk-based Approach to Adaptation
http://slidepdf.com/reader/full/climate-proofing-a-risk-based-approach-to-adaptation 175/219
Climate Proofing: A Risk-based Approach to Adaptation148
G. What is the “Enabling Environment”for Adaptation?
The “enabling environment” for adaptationcomprises the systems and capabilities that fosterthe adaptation process, including innovation,revitalization of traditional practices, application of human knowledge and skills, policies, financing,legislation and regulations, information, markets,and decision support tools. It provides the context within which development projects and relatedinitiatives occur (Figure A3.2) and ensures that they are effectively “climate proofed”. 3
The multiple dimensions of the enabling environment are evident in Figure A3.3. Longer-term interventions at national and subnationallevels, often with support from the international
community, are required to create and strengthenthe enabling environment.
H. How can the Enabling Environmentfor Adaptation be Enhanced?
Guideline 2
Organize and strengthen institutions in ways that
• enhance communication between climate risk assessors and adaptation policy makers andimplementers;
• reduce the likelihood of conflict and duplicationof effort when managing climate-related risks;
• lessen the chances of mistrust and misunder-standing between decision and policy makersand other stakeholders in adaptation activities;and
• overall, help to provide consistent, defensible,and useful advice to decision and policy makers wi th respec t to adapta ti on pr io ri ti es and
practices (Box A3.2).
Box A3.1
In Sokehs community, Pohnpei, climate change will alter the risk of flooding due to high sea levels.
Hourly Sea Level for Recurrence Interval of
25 Years —Pohnpei
For a roadbuilding project in Kosrae, climate
change alters construction requirements and costs if the design risk is kept at 1 in 100 years.
Hourly Sea Level for Recurrence Interval of25 Years —Pohnpei
For Pohnpei public health, climate change willalter the frequency and duration of drought, theending of which is associated with major outbreaksof gastroenteritis .
Frequency and Duration of Drought–Pohnpei
Number of Consecutive Low Rainfall Days
3 Climate proofing is a shorthand term for identifying risks to a developmentproject, or any other specified natural or human asset, as a consequence of climate variability and change, and ensuring that those risks are reduced toacceptable levels through long-lasting and environmentally sound, economicallyviable, and socially acceptable changes implemented at one or more of thefollowing stages in the project cycle: planning, design, construction, operation,and decommissioning.

8/13/2019 Climate Proofing: A Risk-based Approach to Adaptation
http://slidepdf.com/reader/full/climate-proofing-a-risk-based-approach-to-adaptation 176/219
149Appendix 3
Source: CCAIRR findings.
Figure A3.2: Linkages Between Longer-Term Activities to Create an Enabling Environmentfor Adaptation and the Climate Proofing of Shorter-Term Development Projects and
Protection of Natural and Human Assets
I m m e d i a t e, P r o j e
c t L e v e l
L o n g T e r m, N a t i
o n a l L e v e l
I m p l e m e n t a
t i o n s
E n a b l i n g E n v i r
o n m e n t
Figure A3.3. The Multiple Dimensions of the Enabling Environment for Adaptation toClimate Variability and Change
Source: CCAIRR findings.
Reflecting Climate Risks in NationalDevelopment Planning
Demonstrated byClimate Proofing the NationalStrategic Development Plans
Reflecting Climate Risks in Land UsePlanning, Regulations, and PermittingDemonstrated by Climate Proofing
Landuse Plans, Building Codes,EIA, Regulations and Procedures,
Health Regulations, etcReflecting Climate Risks inInfrastructure Design and Local
Decision Making Demonstrated byClimate Proofing Development
Projects and Related Assets

8/13/2019 Climate Proofing: A Risk-based Approach to Adaptation
http://slidepdf.com/reader/full/climate-proofing-a-risk-based-approach-to-adaptation 177/219
Climate Proofing: A Risk-based Approach to Adaptation150
BOX A3.2
When the Climate Change Adaptation through IntegratedRisk Reduction project was in its early stages, Pohnpei’s
governor established an Inter-Agency Task Force to Assessand Manage Weather- and Climate-Related Risks, to overseethe ongoing program of climate risk assessments andimplementation of adaptation in Pohnpei. At that time, theGovernor decreed that the Task Force would have oversightfor the coordination and cooperation required to ensuretimely and cost-effective assessments of, and responses to,the weather- and climate-related risks facing Pohnpei. Healso required that in no case would it disrupt the existing allocation of responsibilities and resources afforded togovernment agencies. Rather, it would be a mechanism forexploring and implementing collaborative activities that are
Guideline 3
Wherever possible andpractical, make use of exist-ing information and infor-mation management sys-tems. This may well requireadditional initial effort tosource and harmonize dis-persed and disparate sets of information, but it is likely toresult in a strengthening of existing information man-agement systems as opposedto their marginalization (Box A3.3).
of mutual benefit to the agencies involved, as well as to thepeople of Pohnpei.
The Director of the Task Force is a member of the NationalClimate Change Country Team for the Federated States of Micronesia, and chairs its meetings on a rotational basis.
At the technical level, the Task Force is being assisted by thePohnpei Climate Change Adaptation through IntegratedRisk Reduction Team, made up of technical specialists, key individuals from nongovernment organizations, andrepresentatives of the Sokehs and wider communities.
Source: CCAIRR findings.
BOX A3.3
For the Sokehs case study, local data holdings were identified, including information ingeographic information systems maintained by the Environmental Protection Agency, theDepartment of Lands, the Public Utilities Corporation, (all state agencies) and the CensusDivision of the national Government. Health data for the state and the Sapwohncommunity were obtained from the Pohnpei State Hospital. The Conservation Society of Pohnpei and the local office of The Nature Conservancy also had relevant information. Aerial photographs and maps were obtained from the Department of Lands. Relevanthistorical information is held by the Micronesian Seminar. Some weather data wereobtained from the (US) National Oceanic and Atmospheric Administration (NOAA)National Weather Service Office in Pohnpei. Additional weather data were sourced fromthe National Climate Data Center in the USA, via the NOAA office in Guam, while tidegauge data were obtained from the University of Hawaii and from the National Tidal Centrein Australia. Documents such as the First National Communication to the United NationsFramework Convention on Climate Change and state and national disaster reports werealso consulted.
Spot heights and locations of structures and infrastructure in the Sapwohn study area weredetermined using a Total Station survey system. At the same time, detailed descriptiveand flood damage information were obtained for each structure, through visual inspectionand interviews conducted by members of the Pohnpei Climate Change Adaptation through
Integrated Risk Reduction (CCAIRR) Team.
All data used in the case study have been p laced in a cooperative archive maintained by the Department of Lands on behalf of the Pohnpei CCAIRR Team.
Source: CCAIRR findings.

8/13/2019 Climate Proofing: A Risk-based Approach to Adaptation
http://slidepdf.com/reader/full/climate-proofing-a-risk-based-approach-to-adaptation 178/219
151Appendix 3
Guideline 4
Enhance and employ in-country expertise inthe technical and policy dimensions of adaptationto climate change (Box A3.4).
Guideline 5
The enabling environment for adaptation isenhanced when legislation and regulations thatfacilitate adaptation are introduced and strength-ened, and also when the compliance monitoring and enforcement capabilities of relevant regulatory agencies are improved (Box A3.5).
Guideline 6
Wherever possible and practical, make use of existing decision support tools and regulatory instru-ments to guide selection and facilitate implementa-tion of adaptation measures; examples includeenvironmental impact assessments and building codes. This is likely to result in a strengthening of existing tools and regulations, rather than weaken-ing them through confusion and inadequate en-forcement (Box A3.6).
Guideline 7
Identify the motivations that drive variousstakeholders to engage in the adaptation process, andreplicate these motivations in other players, througheducation, training, and other initiatives (Box A3.7).
Guideline 8
Build the willingness and ability of communi-ties to adapt continuously to new circumstances andchallenges, and to realize this increased potential.High levels of awareness, motivation, and empower-ment within the public and private sectors and in civil
society will help ensure that people, communities,and wider societies are able to adapt continuously tonew circumstances and challenges. This requires along-term approach to developing and delivering comprehensive and targeted awareness-raising andeducational programs (Box A3.8).
BOX A3.4
Local technical capabilities in such areas as geographicalinformation systems (GIS), surveying, and vulnerability andadaptation assessments were identified, with technically qualified personnel forming the Pohnpei Climate Change Adaptation through Integrated Risk Reduction (CCAIRR)Team. Members of the team undertook the field work todetermine spot heights and locations of structures andinfrastructure in the Sapwohn study area, as well as gathering detailed descriptive and flood damage information throughvisual inspection and interviews. All information for theSapwohn study area was imported to a GIS and members of the CCAIRR Team processed it.
BOX A3.5
The Sokehs case study resulted in a recommendation thatthe Building Code, the Environmental Impact AssessmentRegulations and other appropriate regulatory instrumentsoverseen by the state of Pohnpei be amended to provide that when new buildings are constructed, or existing buildingsare modified substantially, allowance is made for:
• surface flooding as a result of hourly rainfall intensitiesof at least 40.6 centimeters (such an event has aprojected return period of 25 years in 2050);
• surface flooding as a result of sea level being at least1.2 m above mean sea level (such an event has aprojected return period of 25 years in 2050 (therequirement in the draft building code is 3 m); and
• the possibility of wind gusts exceeding 209 kilometersper hour (kph) (this event has a projected returnperiod of 25 years in 2050; current practice is to use193 kph as the design wind speed).
It is also recommended that Pohnpei State strengthenexisting policies and plans in ways that reflect projectedincreases in the following:
• extended periods of low rainfall (i.e., drought); and• outbreaks of gastroenteritis.
Source: CCAIRR findings.

8/13/2019 Climate Proofing: A Risk-based Approach to Adaptation
http://slidepdf.com/reader/full/climate-proofing-a-risk-based-approach-to-adaptation 179/219
Climate Proofing: A Risk-based Approach to Adaptation152
BOX A3.6
The risk-based approach to adaptation used in the ClimateChange Adaptation Program for the Pacific case studies fol-lows methods consistent with international risk manage-ment standards, including Australia and New Zealand stan-dard 4360 .
The Risk Assessment Framework Used in the CLIMAPCase Studies
The assessment of climate-related risks, and the cost-benefitanalyses of adaptation measures, have beenfacilitated by the use of SimClim, an “open-framework” mod-elling system to integrate data and models forexamining impacts of and adaptation to climate variability and change. User-friendly, Windows-based interfaces allow users to import climate (and other) data for geographical ar-eas and spatial resolutions of their own choice and to attachimpact models for relevant sectors (e.g., agricultural, coastal,health, water resources). By selecting among emission sce-
narios, global climate model (GCM), climate change patterns,climate sensitivity values, and time horizons, the user hasconsiderable flexibility in generating scenarios of future cli-mate changes that can be used to drive impact models. Sim-Clim contains a custom-built geographic information systemfor spatial analyses of results and tools for examining site-specific time-series data, including analyzing extreme eventsand estimating return periods.
SimClim combines site-specific and spatial data (fromglobal, regional, and national to local scale, depending onuser specification). Required inputs include spatially interpolated monthly climatologies for precipitation andminimum, maximum, and mean temperature; GCM spatialpatterns of climate changes; and site time-series climatedata (hourly, daily, and/or monthly). Key outputs are user-specified spatial and temporal patterns and parameters of baseline climatologies; scenarios of future climates; andoutputs from the climate-driven impact model.
Source: CCAIRR findings.
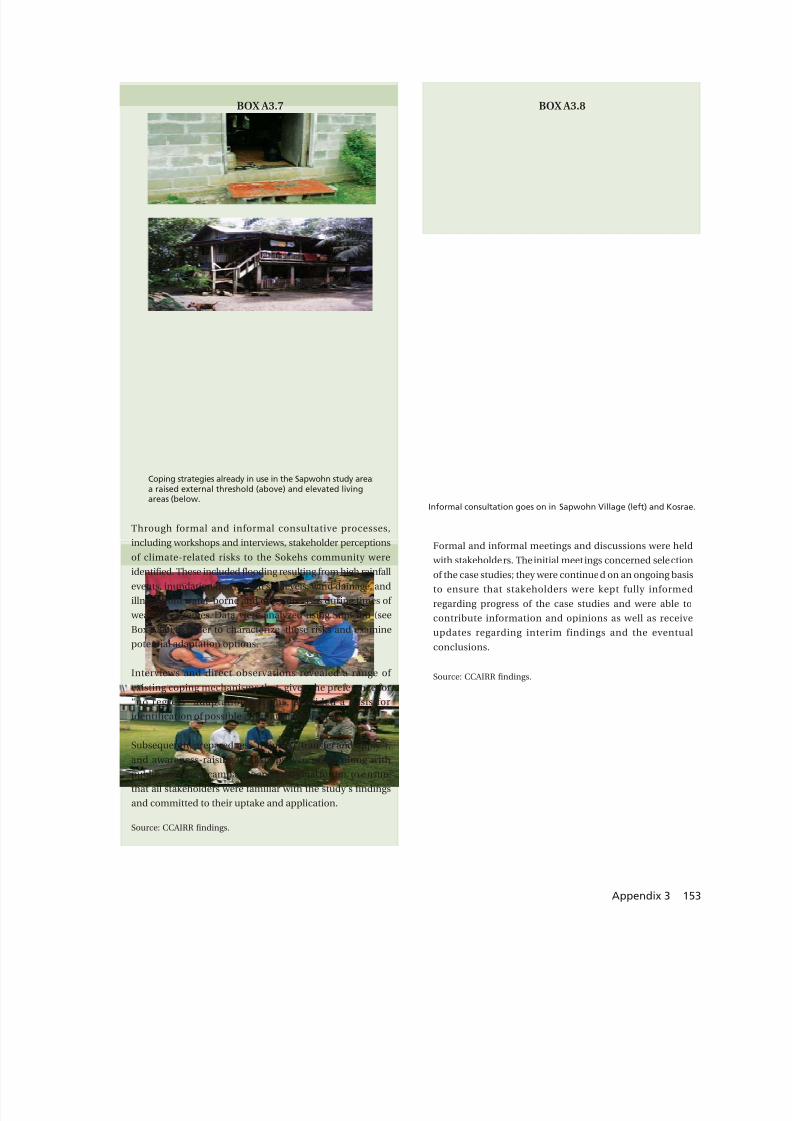
8/13/2019 Climate Proofing: A Risk-based Approach to Adaptation
http://slidepdf.com/reader/full/climate-proofing-a-risk-based-approach-to-adaptation 180/219
153Appendix 3
BOX A3.7
Through formal and informal consultative processes,including workshops and interviews, stakeholder perceptionsof climate-related risks to the Sokehs community wereidentified. These included flooding resulting from high rainfallevents, inundation due to high sea levels, wind damage, andillness from water-borne and other diseases during times of weather extremes. Data were analyzed using SimClim (seeBox A3.6) in order to characterize these risks and examinepotential adaptation options.
Interviews and direct observations revealed a range of existing coping mechanisms that, given the preference for“no regrets” adaptation options, provided a basis foridentification of possible adaptation measures.
Subsequently, preparedness, training (“transfer and apply”),and awareness-raising workshops were used, along withpublic awareness campaigns and a national forum, to ensurethat all stakeholders were familiar with the study’s findingsand committed to their uptake and application.
Source: CCAIRR findings.
Coping strategies already in use in the Sapwohn study area:a raised external threshold (above) and elevated livingareas (below.
BOX A3.8
Formal and informal meetings and discussions were held with stakeholders. The initial meetings concerned selectionof the case studies; they were continued on an ongoing basisto ensure that stakeholders were kept fully informedregarding progress of the case studies and were able tocontribute information and opinions as well as receiveupdates regarding interim findings and the eventualconclusions.
Source: CCAIRR findings.
Informal consultation goes on in Sapwohn Village (left) and Kosrae.

8/13/2019 Climate Proofing: A Risk-based Approach to Adaptation
http://slidepdf.com/reader/full/climate-proofing-a-risk-based-approach-to-adaptation 181/219
Climate Proofing: A Risk-based Approach to Adaptation154
Guideline 9
Address the present reluctance of banks andother lending institutions to finance adaptationactivities, due to the perception that they involvelonger-term projects that have high levels of risk.
Help reduce this barrier by promoting institutions,arrangements, and mechanisms that can provideinnovative financing, including microfinance, greenfinance, secured loans, leasing arrangements, andpublic-private partnerships, thereby allowing adaptation to proceed without governmentintervention (Box A3.9).
Guideline 10
Decisions as to when and how to adapt to climatechange should be based on credible, comparable, andobjective information. Ideally, the measurements andassessments required to provide this information willbe made using internationally recognized, but locally adapted, methodologies and tools, thereby helping to ensure comparability among data collected by different assessors (Box A3.10).
BOX A3.9
All lenders have an interest in protecting the value of theasset against which a loan is secured. In Pohnpei, new residential construction and substantive improvements in
existing dwellings are financed through low-interest loansfrom the Rural Development Bank. Senior officials in theBank are aware of the incremental risks due to climatechange and are considering making approval of loanscontingent on the climate proofing of construction.
The Government is also considering seeking support fromthe international community to meet the documentedincremental costs of adaptation to climate change, with afocus on the Climate Fund established by the United NationsFramework Convention on Climate Change and overseenby the Global Environment Facility. The intention would beto establish a trust fund for the community. Interest fromthe fund would cover, on an ongoing basis, the incrementalcosts of adaptation for new dwellings and for thereplacement and renovation of existing residences.
Source: CCAIRR findings.
BOX A3.10
Cost-benefit analysis of climate-related risks and adaptationmeasures uses a state-of-the-art model. The damage arising from any given event is valued as the percentage of thecurrent baseline value of each of the sectors that is destroyedby the event, e.g., a flood of a certain magnitude destroys x % of the current housing stock plus y% of public buildings,etc.,—i.e., the “damage function” is specified. These damagevalues are summarized for each event, e.g., a specified flood will resu lt in damage valued at $X mill ion to infrastructureand land forms. Given the probability of the damageoccurring or, to put it differently, the average frequency with which it occurs under the baseline or under climate change,an annual expected damage value for each scenario iscalculated, thus forming a time series of expected damage
values associated with each possible event. In each casestudy, the expected damages resulting from all relevantevents are summarized for each year. The differencebetween the annual expected damage values under (i) aclimate change scenario and (ii) the baseline is the annual
Cost-Benefit Analysis of Climate Proofing Parts of theKosrae Circumferential Road
New Road Existing RoadSection Section(6.3 km) (3.5 km)
Cost to Build RoadOriginal Design $1,895,000 $ 924,000Climate Proofed Design $2,406,000 $1,700,000
Incremental Cost $ 511,000 $ 776,000Internal Rate of Return 11% 13%
Thus, while retroactive climate proofing is more costly, thehigh internal rate of return shows it is still a viable investment.
Source: CCAIRR findings.
increase in expected damage due to climate change. Thisdifference is the maximum potential benefit under thescenario of introducing adaptation measures.

8/13/2019 Climate Proofing: A Risk-based Approach to Adaptation
http://slidepdf.com/reader/full/climate-proofing-a-risk-based-approach-to-adaptation 182/219
155Appendix 3
BOX A3.11
Successful adaptation is dependent on an increasedawareness of climate change issues and a commitment totaking action to address them. Often people with technical
backgrounds are reasonably aware of the issues involved inclimate change and the responses required, but, overall,policy makers are not so well informed on the issues andhence not so aware of the actions that are required. Theirbuy-in can be facilitated by enabling them to recognize thatboth disasters and climate change are significantimpediments to successful economic development—i.e.,they represent risks to regional, national, and localeconomies—and that countries are already experiencing themanifestations of these risks, in the form of recent disasters,but also via climate variability. Such information will helpsecure high-level political endorsement for adaptationactivities, ensuring their efficient and effectiveimplementation.
Source: CCAIRR findings.
Guideline 11
Adapta ti on acti vi ti es should be based oncooperation to bring about desired changes, fromthe bottom up as well as from the top down. Thiscalls for enduring partnerships at all stages of the
adaptation process, ensuring active and equitableparticipation of private and public stakeholders,including business, legal, financial, and otherstakeholders (Box A3.11).
Guideline 12
Transfer and use of inadequate, unsustainable,or unsafe technologies for adaptation must beavoided. Technology recipients should be able toidentify and select technologies that are appropriateto their actual needs, circumstances, and capacitiesand are classed as “sustainable technologies”—i.e.,environmentally sound, economically viable, andsocially acceptable. For example, some approachesto coastal protection have proven to be inadequate(e.g., weight of rocks making up a breakwater, relativeto energy of the significant wave), unsustainable(e.g., sea walls often accelerate erosion for adjacent,unprotected areas of the coast) or unsafe (e.g., a
To help avoid the uptake and application of inadequate,unsustainable, or unsafe technologies, the United NationsEnvironment Programme has developed a decision supporttool for use by stakeholders, including communities and localgovernments. Environmental Technology Assessment (EnTA)is a systematic procedure whereby a proposed technology intervention is described and appraised in terms of itspotential influence on the environment, the implications forsustainable development, and the likely cultural andsocioeconomic consequences. Furthermore, the assessmentprocess requires consideration of alternative technologiesand other options, thereby providing a mechanism forcomparing the impact of a variety of possible interventions.
breakwater may, in some instances, exacerbate thevolume and speed of seawater overtopping theforeshore area) (Box A3.12).
EnTA is designed to facilitate multistakeholder dialogueleading to consensus decision making. It helps planners,decision makers in government, the private sector,communities, and other stakeholders to reach a consensuson the proposed technology investment, by facilitating anagreement to select a technology that will be the mostenvironmentally sound, socially acceptable, andeconomically viable, for a specified location and application.
Through early recognition of key issues, possiblealternatives, potential solutions, and areas of consensus,EnTA allows further effort to focus on points of major conflictand dispute. This reduces information and timerequirements and facilitates disclosure of all relevantinformation to decision makers, so that a fully informeddecision can be made.
BOX A3.12
Source: CCAIRR findings.

8/13/2019 Climate Proofing: A Risk-based Approach to Adaptation
http://slidepdf.com/reader/full/climate-proofing-a-risk-based-approach-to-adaptation 183/219
Climate Proofing: A Risk-based Approach to Adaptation156
Figure A3.4: Linkages Between SustainableDevelopment, Climate Change, and the
Policies in These Areas
Source: after Swart et al. 2003.
Guideline 13
Macroeconomic conditions that favor successfuladaptation activities include those that fostereconomic transparency. Such conditions are neededin order to ensure that climate-related risks are not
masked or compensated for by hidden subsidies andare thereby transferred to the wrong parties.Involvement of the private sector in adaptation (e.g.,investors and other players in the finance sector) willbe encouraged by macroeconomic conditions thatinclude low inflation; stable and realistic exchange andinterest rates; pricing that reflects the true (marginaland fully internalized) costs of materials, energy, laborand other inputs; deregulation; free movement of capital; operation of competitive markets; open tradepolicies; and transparent foreign investment policies(Box A3.13).
BOX A3.13
An adaptation plan under consideration for Sapwohn Villageis for international agencies and aid providers to makeinitial contributions to a trust fund. Subsequently, interestfrom the fund would be used to cover the incremental costsof adaptation. For example, when a home is rebuilt orrenovated, the State Building Code and other regulations willrequire the owner to “climate proof” the structure. The
additional expense involved would be covered by the trustfund, thus reducing the size of the loan the homeowner would need to obtain from the financial sector.
Source: CCAIRR findings.
I. Why Integrate Adaptationinto Development?
The linkages between socioeconomic develop-
ment and the need for adaptation are becoming increasingly clear. The linkages between sustainabledevelopment, climate change, and the respectivepolicies form a cyclic process (Figure A3.4).
Climate change is largely the result of green-house gas emissions associated with humanactivities. The latter are driven by socioeconomicdevelopment patterns characterized by economic
growth, technology uptake and application, popu-lation growth and migration, and adjustments ingovernance. In turn, these socioeconomic develop-ment patterns influence vulnerability to climatechange, as well as the human capacity for mitiga-tion and adaptation. The cycle is completed when
climate change impacts on human and natural sys-tems, to influence socioeconomic developmentpatterns and, thereby, greenhouse gas emissions.
The artificial separation of these activitiesresults in missed opportunities for synergies, inunrecognized and undesirable trade-offs, and inmutual interference in ensuring successfuloutcomes. The benefits arising from integrating climate policy into wider development policies canbe greater than the sum of concurrent, unrelatedpolicy initiatives. Effective management of the risksto natural and human systems that arise fromclimate variability and change and their integration with planning for sustainable development givesrise to additional guidelines.

8/13/2019 Climate Proofing: A Risk-based Approach to Adaptation
http://slidepdf.com/reader/full/climate-proofing-a-risk-based-approach-to-adaptation 184/219
157Appendix 3
Guideline 14
Any risks that present generations may findunacceptable should not be imposed on futuregenerations (Box A3.14).
Guideline 15
Policymaking, planning practices, and develop-ment activities should ensure that all future genera-tions will be able to enjoy every important aspect of life, including peace and security, a healthy environment, a small risk of preventable catastro-phe, conservation of knowledge, stable governance,a good life for children, and opportunities for living (Box A3.15).
Guideline 16
Successful adaptation to climate variability andchange requires a programmatic approach that pro-vides institutional and operational support forindividual projects. This will help minimize the limi-
tations resulting from the short-term and narrow nature of projects, thus reducing administrative andrelated burdens and providing much more controlover the direction taken by individual projects. Theapproach also increases the possibility of sustain-ing the benefits of a project, even after funding hasceased, and expedites the proposal developmentand approval processes, as well as implementation(Box A3.16).
BOX A3.14
Indicative damage costs (upper green line) for Sapwohn Village as a result of flooding from heavy rainfall events are shown. Without adaptation, the damage costs increase over time, and will have to be covered by future generations.
Source: CCAIRR findings.

8/13/2019 Climate Proofing: A Risk-based Approach to Adaptation
http://slidepdf.com/reader/full/climate-proofing-a-risk-based-approach-to-adaptation 185/219
Climate Proofing: A Risk-based Approach to Adaptation158
BOX A3.15
The Federated States of Micronesia (FSM) hasrecently completed preparation of its first NationalStrategic Development Plan, with financial and
technical support provided by the Asian DevelopmentBank (ADB).
For this case study, the ADB technical advisory team worked with relevant government officials and withthe ADB consultants who drafted the Plan for thesectors identified during the consultations as being the appropriate foci for climate proofing, namely infrastructure, health care, and environment.
The following examples taken from the Plan show how it provides an enabling environment that fostersclimate-proofed development, and the links withsustainable development.
Infrastructure
Criteria by which to rank projects nationally acrosssector and state include
• impact of the project on the national economy;• cost-benefit of project, taking into account
economic and social benefits;• contribution of the project toward the health
and safety of the community;• contribution of the project toward development
of the workforce in FSM to meet the social andeconomic challenges;
• contribution of the project to institutional
strengthening and restructuring of governmentinfrastructure agencies;• contribution of the project to promoting private
sector development; and• viability, sustainability, potential social benefit
and environmental impact, and risk exposure of the infrastructure development project.
Risk Assessments Related to Natural Hazards
These studies should be conducted at the state leveland focus on existing risks to infrastructure (e.g.,typhoons, landslides, drought) as well as determining how those risks will be increased as a result of changesin the future, including the consequences of globalclimate change. The study will develop guidelines andidentify and recommend other measures to ensurethat the exposure of infrastructure to current andfuture risks is reduced to acceptable levels.
Strengthen and adapt new building and otherrelevant regulations and codes of good practice.
Infrastructure [should be] located, built andmaintained in line with codes and practices thatprovide full functionality for projected life time.
Infrastructure [should be] designed, located, built, andmaintained to avoid unacceptable risks to infrastructureassociated with natural hazards, including weather andclimate extremes, variability, and change.
Conduct risk assessments at state level and developnational- and state-level guidelines to ensure that risksto infrastructure development projects are identifiedand addressed in a cost-effective manner at the designstage (Office of the President, FSM 2004).
Health
Climate variability and change, including sea-level rise,are important determinants of health and of growing concern in FSM (as it is in all Pacific island countries).The impacts are mostly adverse. Climate variability andchange can result in reduced quality and quantity of water supplies, loss of coastal resources, reduction inecosystem productivity, and a decline in agriculturalproductivity. Potential health impacts that have beenidentified include vector-borne diseases (such asdengue fever and malaria), water-borne diseases (suchas viral and bacterial diarrhea), diseases related to toxicalgae (such as ciguatera fish poisoning, which isimportant in FSM where the protein source is fish),food-borne diseases, food security and nutrition, heatstress, air pollution, and extreme weather and climate
events (such as cyclones, high tides, droughts and stormsurges). Especially on atoll islands of FSM, storm surgescan result in injury and drowning. The adverse impactsof many of these events will be exacerbated by sea-levelrise. Thus, climate change should be an importantconsideration when assessing environmental healthissues and the consequent priorities for the health of people in FSM (Office of the President, FSM 2004).
Environment
STRATEGIC GOAL 1 : Mainstream environmentalconsiderations, including climate change, in economicdevelopment ( NEMS, FSMCCC, NBSAP, CES).
[Adopt] strategies and plans that address unacceptablerisks to the natural environment and built assets,including those arising from natural hazards such as weather and climate extremes, variability, and change.Develop and implement integrated environmental andresource management objectives that enhance resilience
(continued)

8/13/2019 Climate Proofing: A Risk-based Approach to Adaptation
http://slidepdf.com/reader/full/climate-proofing-a-risk-based-approach-to-adaptation 186/219
159Appendix 3
BOX A3.16
NDS = national development strategy; UNFCCC = United Nations Framework Convention on Climate Change.
Source: CCAIRR findings.
BOX A3.15 (continued)
of coastal and other ecosystems to natural hazardssuch as those associated with extreme weather events,climate change, high tides, and sea-level rise.
All FSM communities wil l deve lop and implement risk reduction strategies to address natural hazards such as thoserelated to current weather and climate extremes andvariability, while at the same time preparing for anticipatedimpacts of climate change.
Identify structures, infrastructure, and ecosystems at risk and explore opportunities to protect critical assets.
Integrate considerations of climate change and sea-level riseinto strategic and operational (e.g., land use) planning forfuture development, including that related to structures,
infrastructure, and social and other services.Document low-lying agricultural areas at risk from the effectsof natural hazards, including sea-level rise, and implementappropriate land use planning and other measures.
Determine impact of climate change on the tuna industry as aresult of such effects as changed migration patterns of Pacifictuna stocks, and implement strategies to minimize impacts onthis important industry (Office of the President, FSM 2004).
Source: CCAIRR findings .

8/13/2019 Climate Proofing: A Risk-based Approach to Adaptation
http://slidepdf.com/reader/full/climate-proofing-a-risk-based-approach-to-adaptation 187/219
Climate Proofing: A Risk-based Approach to Adaptation160
BOX A3.18
A major req uirem ent is the rev iew in g and rev isi on of priorities, given that there will never be sufficient capacity (financial, human, technological, etc.) to undertake allactivities that could reduce national and local vulnerability to climate variability and change (including extreme events). A key question that must be asked continually is whetherthe activities to be implemented will be sufficient to allow the country to maintain its economic, social, andenvironmental systems despite changes in the climate. The
Federated States of Micronesia’s climate-proofed NationalStrategic Development Plan will help ensure an affirmativeresponse to this question.
Source: CCAIRR findings .
BOX A3.17
The establishment and ongoing work of the Pohnpei Task Force to Assess and Manage Weather- and Climate-relatedRisks and of the Pohnpei Climate Change Adaptationthrough Integrated Risk Reduction Team (see Box A3.2)have resulted in improved coordination of climate-relatedactivities at the state level. The climate proofing of theNational Strategic Development Plan (see Box A3.15) andof relevant regulations (see Box A3.5) has also givendirection to climate risk assessment and provided the
mechanisms whereby climate-related risks can bemanaged within the planning and regulatory environments.
Source: CCAIRR findings .
Guideline 17
Emphasis must be placed on coordinating ac-tivities—taking advantage of synergies, minimizing duplication, and avoiding redundancies—in orderto complement other development efforts. Priority
should be given to adaptation activities that delivertangible and visible benefits, rather than on explor-atory studies, i.e., to activities that deliver outputsand outcomes that are of at least equal relevanceand value to those provided by mainline ministries;this can help offset the fact that climate change isoften perceived as a longer-term issue, while otherchallenges, including food security, water supply,sanitation, education, and health care, require moreimmediate attention (Box A3.17).
Guideline 18
A commitment should be made to the ongoing practice of monitoring, reviewing, and strengthen-ing adaptation activities. Methods used should em-phasize transparency, consistency, and accountabil-
ity, as well as fostering continued improvement inthe efficiency with which outcomes are delivered,and in their contributing to sustainable nationaldevelopment.
8/13/2019 Climate Proofing: A Risk-based Approach to Adaptation
http://slidepdf.com/reader/full/climate-proofing-a-risk-based-approach-to-adaptation 188/219
161Appendix 4
Appendix 4
Guidelines for Policy and DecisionMakers and Other Key Players—Cook Islands
A. Background and Purpose of theseGuidelines
Under its Climate Change AdaptationProgramme for the Pacific, the AsianDevelopment Bank (ADB) is facilitating
preparation of case studies 1 that demonstrate a risk-based approach to adapting to climate variability and change (including extreme events), and themainstreaming of the adaptation process. TheseGuidelines for Mainstreaming Adaptation toClimate Change are based on the findings of the casestudies. They also reflect experience gained throughother investigations and by operational practice.
The Guidelines are intended to assist theGovernment of the Cook Islands and other relevantstakeholders in implementing policies, plans, andoperational procedures that result in integrating adaptation to climate variability and change intonational and local development planning, decisionmaking and operations as an an integral andsustainable part of the development process.
Prior to presenting the specific Guidelines,important background information is provided by asking and answering a series of questions that arose
in the course of preparing the case studies. Withrespect to the Guidelines themselves, each has anassociated box that provides a practical example of the application of the Guideline, with respect to oneof the case studies prepared in the Cook Islands.
Mainstreaming adaptation is the principalfocus of these Guidelines. They do not refer explicitly to other related and important matters, including
• adaptation policy frameworks—for details onthis topic refer, for example, to UNDP-GEF(2003); and
• adaptation measures as such—for nationalexamples see “First National Communication of Cook Islands to the UNFCCC”; for regionalexamples see Hay et al. (2003).
B. What is Meant by “MainstreamingAdaptation”?
In the context of addressing climate changeand related issues, the term “mainstreaming” isused to describe the integration of policies andmeasures to address climate change into ongoing and new development policies, plans, and actions.Mainstreaming adaptation aims to enhance theeffectiveness, efficiency, and longevity of initia-tives directed at reducing climate-related risks, while at the same time contributing to sustainabledevelopment and improved quality of life.
Mainstreaming also endeavors to address thecomplex tensions between development policiesaimed at immediate issues and the aspects of climate policy aimed at longer-term concerns. Thetensions often become most apparent when choiceshave to be made about the disbursement of limitedgovernment funds—for example, choices betweensupporting education and health care programs on
1 Three case studies were carried out in the FSM and three in the Cook Islands.Details are provided in the main part of this book.

8/13/2019 Climate Proofing: A Risk-based Approach to Adaptation
http://slidepdf.com/reader/full/climate-proofing-a-risk-based-approach-to-adaptation 189/219
Climate Proofing: A Risk-based Approach to Adaptation162
the one hand and funding climate changeadaptation initiatives on the other. Indeed,mainstreaming is largely about reducing tensionsand conflicts, and avoiding the need to makechoices, by identifying synergistic, win-winsituations. Thus mainstreaming focuses on “no
regrets” measures for adaptation. 2
C. Why Mainstream Adaptation?
Even in the near future, climate change is likely to impose untenable social, environmental, andeconomic costs on the Cook Islands. Most of thecountry is already experiencing disruptiveconditions that are consistent with many of theanticipated adverse consequences of climatechange, including extensive coastal erosion,drought, flooding and associated landslides, coralbleaching, and higher sea levels.
The risks associated with the full spectrum of climate-related hazards, from extreme events to theconsequences of long-term changes in the climate,should be managed in a holistic manner as anintegral part of national development planning andmanagement. Most countries already have policiesand plans to manage financial risks, human healthrisks, biosecurity risks, agricultural risks, transportsector risks, and energy supply risks. Climate-induced disasters and climate change and variability should also be included in the national risk management portfolio.
National and state development plans and sec-tor plans should include disaster risk managementstrategies and climate change adaptation measuresto ensure that risks are reduced to acceptable lev-els. These measures, and the related strategies, willhelp strengthen decision-making processes by re-quiring that specific programs and projects includeplans and measures to manage risks associated withextreme events and with climate change and vari-
ability. The overall goal should be to manage, in aholistic manner and as an integral part of nationaldevelopment planning, the risks associated with the
full spectrum of weather, climate, and oceanic haz-ards, from extreme events to the consequences of long-term climate change.
D. What are the Strategic Considerations
that Underpin Adaptation toClimate Change?
Key strategic considerations regarding adaptation include the following:
• Just as today’s development decisions will influ-ence tomorrow’s climate, so too will tomorrow’sclimate influence the success of today’s devel-opment decisions.
• Effective management of climate-related risksprevents precious resources from being squan-dered on disaster recovery and rehabilitation.
• Many disaster and climate change responsestrategies are the same as those that contributein a positive manner to sustainable development,sound environmental management, and wiseresource use; they are also appropriate responsesto climate variability and other present-day andemerging stresses on social, cultural, economic,and environmental systems.
• Many development plans and projects underconsideration at present have life expectanciesthat require future climate conditions and sealevels to be given due consideration;
• Exploring and undertaking actions to adapt tocurrent climate extremes and variability is of value, both in dealing with today’s climate-related problems and as an essential step inbuilding long-term resilience to withstand thepending climate changes.
• While many climate-related risks and losses aremanifested locally, measures to alleviate themhave important national and internationaldimensions.
• If adaptation is reactive, as opposed toanticipatory, the range of response options islikely to be narrower and adaptation may wellprove more expensive, socially disruptive, andenvironmentally unsustainable.
• It is easier to enhance the ability of ecosystemsto cope with climate change if they are healthy and not already stressed and degraded.
2 “No regrets” measures for adaptation are consistent with sound environmentalmanagement and wise resource use, and are thus appropriate responses to naturalhazards and climate variability, including extreme events; they are thereforebeneficial and cost effective, even in the absence of climate change.

8/13/2019 Climate Proofing: A Risk-based Approach to Adaptation
http://slidepdf.com/reader/full/climate-proofing-a-risk-based-approach-to-adaptation 190/219
163Appendix 4
• Adaptation is, in large part, a continuousdynamic process that reduces the exposure of society to risks arising from climatic variability and extremes.
• Adaptation must reflect both recurrent historicalrisks and new risks associated with climate
change.• Adaptation requires enhancement of institu-
tional capacity, development of expertise, andthe building of knowledge. All these take time.
• People will, as a result of their own resourceful-ness or out of necessity, adapt to climate vari-ability and change (including extreme events),based on their understanding and assessment of the anticipated or observed effects, and on theperceived options and benefits for response. Inmany cases, such adaptations will be adequate,effective, and satisfactory.
• Under some circumstances, however, suchadaptation may not be satisfactory or success-ful; an external entity, such as central or local gov-ernment, may need to facilitate the adaptationprocess to ensure that obstacles, barriers, andinefficiencies are addressed in an appropriatemanner.
E. At a Practical Level, What doesAdaptation Mainstreaming Entail?
Adapta ti on mainst reamin g has two key practical components:
• creating and strengthening the enabling environment for adaptation; and
• integrating adaptation planning and implemen-tation into existing and new development poli-cies, plans, and actions.
F. What is the “Enabling Environment”for Adaptation?
The “enabling environment” for adaptationcomprises the systems and capabilities that fosterthe adaptation process, including innovation,revitalization of traditional practices, application of human knowledge and skills, policies, financing,legislation and regulations, information, markets,
and decision support tools. It provides the context within which development projects and relatedinitiatives occur and ensures that they are effectively “climate proofed” (Table A4.1).
G. The Adaptation MainstreamingGuidelines
The following Guidelines are grouped into threecategories, related to
• the principles underlying the mainstreaming of adaptation,
• enhancing the enabling environment foradaptation, and
• the process of mainstreaming adaptation.
Guidelines Relating to the PrinciplesUnderpinning the Mainstreaming of Adaptation
Guideline 1
Manage climate risks as an integral part of sustainable development. Climate change is largely the result of greenhouse gas emissions associated with human act ivi ties. The lat ter are driven by socioeconomic development patterns characterizedby economic growth, technology uptake andapplication, population growth and migration, andadjustments in governance. In turn, thesesocioeconomic development patterns influencevulnerability to climate change, as well as the humancapacity for mitigation and adaptation. The cycle iscompleted when climate change impacts on humanand natural systems, to influence socioeconomicdevelopment patterns and, thereby, greenhouse gasemissions.
The artificial separation of these activities results
in missed opportunities for synergies, unrecognizedand undesirable trade-offs, and mutual interferencein ensuring successful outcomes. The benefits aris-ing from integrating climate policy into widerdevelopment policies can be greater than the sumof concurrent but independent policy initiatives.Effective management of the risks to natural andhuman systems that arise from climate variability

8/13/2019 Climate Proofing: A Risk-based Approach to Adaptation
http://slidepdf.com/reader/full/climate-proofing-a-risk-based-approach-to-adaptation 191/219
Climate Proofing: A Risk-based Approach to Adaptation164
and change, and their integration with planning forsustainable development, gives rise to additionalguidelines.
Policy making, planning practices, and devel-opment activities should ensure that all future gen-erations will be able to enjoy every important as-pect of life, including peace and security, a healthy environment, a small risk of preventable catastro-phes (including those related to climate variability and change), conservation of knowledge, stable gov-
ernance, a good life for children, and opportunitiesfor living (Box A4.1).
Guideline 2: Ensure IntergenerationalEquity Related to Climate Risks
Any climate-related risks that present genera-tions may find unacceptable should not be imposedon future generations (Box A4.2).
Guideline 3
Adopt a coordinated, integrated, and long-term
approach to adaptation. Successful adaptation toclimate variability and change requires a program-matic approach that provides institutional andoperational support for individual projects; this will help minimize the limitations resulting fromthe short-term and narrow nature of projects, thus
Table A4.1. The Multiple Dimensions of the Enabling Environment
Enabling Environment forSustainable Development
Enabling Environment forClimate-Proofed Development
Climate-ProofedDevelopment
Note: Longer-term interventions at national and subnational levels, often with support from the international community, are required to create and strengthen theenabling environment.Source: CCAIRR findings.
Climate Proofed:• Development plans• Resource use plans• Regulations• Codes• Permitting procedures
Economic and socialdevelopment programs andprojects that are compliantwith climate-proofedpolicies and plans
Favorable macroeconomic conditionsAvailable and affordable financingRobust and responsive legal andregulatory regimes
Climate-proofed national developmentstrategy
Empowered and equitable involvedstakeholders
Equitable allocation of rights, responsi-bilities, and benefits
Needs-driven and targeted information
Relevant and applicable standards,codes, methodologies, and tools
Functional, sustainable technologies(hard and soft)
Supportive human and institutionalcapacities

8/13/2019 Climate Proofing: A Risk-based Approach to Adaptation
http://slidepdf.com/reader/full/climate-proofing-a-risk-based-approach-to-adaptation 192/219
165Appendix 4
BOX A4.1
The Cook Islands is currently preparing a National Development Strategy, with financial and technical support provided by the Asian Development Bank and regional organizations. The Climate Change Adaptation Program for the Pacific technical assistanceteam worked with relevant government officials and other stakeholders, and suggested ways in which the strategy might be
climate proofed.
Examples of the way in which the strategy provides an enabling environment that fosters climate-proofed development, and thelinks with sustainable development, are provided below.
Strategic Priority 4: Improved Quality of Health Services
Key Challenges Key Objectives Key Actions Required
Address the impacts of climatevariability and change (includingextreme events) on the healthand welfare of Cook Islanders.
Recognize and strengthen contingency responseplans for disease outbreaks.
• Improve the effectiveness of thetutaka (annualhealth department inspection of properties).
• Use technical and scientific tools to map andpredict disease outbreaks.
• Strengthen border control.
Establish long-term preventive
health care programs that takeinto account climate variabilityand change.
Improve the health and well-being of Cook
Islanders.
• Strengthen public health programs.
• Conduct assessments of climate-related healthrisks.
Note: PATA = Pacific Asia Travel Association.Source: CCAIRR findings.
Reduce the vulnerability of thetourism sector to climatevariability and change, includingextreme events.
Implement risk management strategies thatreduce the impact of extreme climate events ontourism to acceptable levels.
• Identify and prioritize the climate-related risksfacing the tourism industry.·Strengthen disastermanagement.
• Develop in-house risk management strategies.
Recognize that high-qualityenvironment is the key to a viabletourism business.
All tourism businesses are committed and useenvironmentally friendly practices.
• Implement PATA guidelines for tourist busi-nesses.
• Establish stringent performance standards fortourism.
• Recognize the impacts of over-water resorts andtheir high vulnerability to extreme weather andclimate events.
Strategic Priority 4: Improved Quality of Health Services
Key Challenges Key Objectives Key Actions Required
(continued)

8/13/2019 Climate Proofing: A Risk-based Approach to Adaptation
http://slidepdf.com/reader/full/climate-proofing-a-risk-based-approach-to-adaptation 193/219
Climate Proofing: A Risk-based Approach to Adaptation166
BOX A4.1 (continued)
Strategic Priority 9: Protection, Conservation, and Sustainable Managementof the Environment and Natural Ecosystems 1
Key Challenges Key Objectives Key Actions Required
Note: EIA = environmental impact assessment.1 A strategic priority related to the environment is being developed and discussed by the National Task Force. The information provided here is
intended to assist and guide the Task Force in its work concerning the strategic priority on the environment.
Source: CCAIRR findings.
Minimize the adverse conse-quences of climate change on theeconomy, society, and environ-ment.
Develop climate change adaptation strategiesthat address unacceptable risks arising fromnatural hazards including climate change.
Integrate climate change and sea-level rise instrategic and operational impact assessmentsand other regulatory procedures.
• Develop simple and easy-to-follow procedures.• Improve technical expertise and decision-making
processes.• Strengthen national institutional arrangements
for the effective implementation of climatechange policies and plans.
Maintain the quality of theenvironment and of naturalecosystems.
Develop robust regulations and guidelines thatprotect the environment.
• Strengthen EIA procedures in ways that reducepolitical interference in environmentalmanagement.
• Ensure that Outer Islands opt into theEnvironment Act.
• Strengthen National and Island EnvironmentalCouncils.
Harmonize responses to climatechange with other sustainabledevelopment initiatives.
Increase efficiency of energy use and convert torenewable energy sources to minimize green-house gas emissions.
• Formulate a national energy sector policy.• Decrease the use of imported petroleum fuels
through conservation, efficiency, use of renewable energy, and other measures.
reducing administrative and related burdens andgiving much more control over the direction takenby individual projects. The approach also increasesthe possibility of sustaining the benefits of a projecteven after funding has ceased, and expedites theproposal development and approval processes, as
well as implementation (Box A4.3).
Guideline 4
Achieve the full potential of partnerships. Ad-aptation activities should be based on cooperationto bring about desired changes, from the bottom up
as well as from the top down; this calls for enduring partnerships at all stages of the adaptation process,ensuring active and equitable participation of pri-vate and public stakeholders, including business,legal, financial, and other stakeholders (Box A4.4).
Guideline 5
Adaptation should exploit the potential of sus-tainable technology transfer; use of inadequate,unsustainable, or unsafe technologies for adapta-tion must be avoided. Technology recipients shouldbe able to identify and select technologies that are

8/13/2019 Climate Proofing: A Risk-based Approach to Adaptation
http://slidepdf.com/reader/full/climate-proofing-a-risk-based-approach-to-adaptation 194/219
167Appendix 4
Adaptat ion aims to enhance the resilience and decrease thevulnerability of the society, economy, and environment to theadverse consequences of climate variability and change,
including extreme events. In most situations, this will be carriedout through a combination of effective social and economicdevelopment planning, sound environmental management, andpro-active approaches to disaster reduction. The challenge is toensure that all three are harmonized through a long-term andcoordinated approach.
Source: Adapted from Raymund Hay (1993), Hay and MacGergor(1994), and deWet (1999).
BOX A4.3
appropriate to their actual needs, circumstances,and capacities and are classed as “sustainable tech-nologies”—i.e., environmentally sound, economi-cally viable, and socially acceptable. For example,some approaches to coastal protection have provento be inadequate (e.g., weight of rocks making up a
breakwater is inadequate relative to the energy of thesignificant wave), unsustainable (e.g., sea walls of-ten accelerate erosion for adjacent, unprotected ar-eas of the coast) or unsafe (e.g., a breakwater may, insome instances, exacerbate the volume and speed of seawater overtopping the foreshore area) (Box A4.5).
Guideline 6
Base decisions on credible, comparable, and ob- jective information. Ideally, the measurements andassessments required to provide this information will be made using internationally recognized, butlocally adapted, methodologies and tools, thereby helping to ensure comparability between informa-tion collected by different assessors (Box A4.6).
BOX A4.4
Successful adaptation is dependent on increased awarenessof climate change issues, and a commitment to taking actionto address them. Often people with technical backgroundsare reasonably aware of the issues related to climate changeand the responses that are required, but overall, policy makers are not so well informed on the issues and, hence,not so aware of the actions that are required. Their buy-incan be facilitated by having them recognize that bothdisasters and climate change are significant impedimentsto successful economic development—i.e., they representrisks to regional, national, and local economies—and thatcountries are already experiencing the manifestations of these risks, in the form of recent disasters, but also via
climate variability. Such information will help secure high-level political endorsement for adaptation activities,ensuring their efficient and effective implementation.
Source: CCAIRR findings.
BOX A4.2
Indicative damage costs are shown (sloping line) for the Avatiu-Ruatonga study area as a result of flooding from heavy rain fall events. Without adaptation, the damage costs increase over time, and willbe an imposition on future generations .
Source: CCAIRR findings.

8/13/2019 Climate Proofing: A Risk-based Approach to Adaptation
http://slidepdf.com/reader/full/climate-proofing-a-risk-based-approach-to-adaptation 195/219
Climate Proofing: A Risk-based Approach to Adaptation168
BOX A4.5
To help avoid the uptake and application of inadequate,unsustainable, or unsafe technologies, the United NationsEnvironment Programme has developed a decision support
tool for use by stakeholders, including communities andlocal governments. Environmental Technology Assessment(EnTA) is a systematic procedure whereby a proposedtechnology intervention is described and appraised in termsof its potential influence on the environment, theimplications for sustainable development, and the likely cultural and socioeconomic consequences. Furthermore,the assessment process requires consideration of alternativetechnologies and other options, thereby providing amechanism for comparing the impact of a variety of possibleinterventions
EnTA is designed to facilitate multistakeholder dialogueleading to consensus decision making. It helps planners,decision makers in government, the private sector,
communities, and other stakeholders to reach a consensus onthe proposed technology investment, by facilitating anagreement to select a technology that will be the mostenvironmentally sound, socially acceptable, and economically viable, for a specified location and application.
Through early recognition of key issues, possible alternatives,potential solutions, and areas of consensus, EnTA allowsfurther effort to focus on points of major conflict and dispute.This reduces information and time requirements andfacilitates disclosure of all relevant information to decisionmakers, so that a fully informed decision can be made.
Source: CCAIRR findings.
BOX A4.6
An impor tant part of the Climate Change Adaptation Program for the Pacific is the cost-benefit analyses of climate-related risksand adaptation measures. These are undertaken using a state-of-the-art model. The damage arising from any given event isvalued as the percentage of the current baseline value of each of the sectors that is destroyed by the event, e.g., a flood of a certainmagnitude destroys x % of the current housing stock plus y %of public buildings, etc.—i.e., the “damage function” is specified.These damage values are summarized for each event, e.g., a specified flood will result in damage valued at $X million toinfrastructure and land forms. Given the probability of the damage occurring or, equivalently, the average frequency with whichit occurs under the baseline or under climate change, an annual expected damage value for each scenario is calculated, thusforming a time series of expected damage values associated with each possible event. In each case study, the expected damagesresulting from all relevant events are summarized for each year. The difference between the annual expected damage valuesunder (i) a climate change scenario, and (ii) the baseline is the annual increase in expected damage due to climate change. Thisdifference is the maximum potential benefit under the scenario of introducing adaptation measures .
Cost-Benefit Analysis for Reduction of Flood Damage From Heavy Rainfall, Avatiu-Ruatonga 1
Source: CCAIRR findings.
Adaptation Option Reduction in Damage Costs Adaptation Cost Cost/Benefit(%) (NZ$ thousand) (%)
No CC With CC
Deepen Stream Bed 1 m 60.6 59.3 1,620 0.92Increase Culvert to 1.4 m 0 0 78,571 0

8/13/2019 Climate Proofing: A Risk-based Approach to Adaptation
http://slidepdf.com/reader/full/climate-proofing-a-risk-based-approach-to-adaptation 196/219
169Appendix 4
BOX A4.7
For the case studies undertaken in the Cook Islands, localdata holdings were identified, including information ingeographical information systems maintained by theMinistry of Works and the Statistics Office. Health care datafor Rarotonga were obtained from the Public Health tutaka(annual inspection of properties by local health departmentofficials), of the Ministry of Health. Aerial photographs andmaps were obtained from the Ministry of Works. Relevanthistoric information is held by National Library and National Archive . Weather data were sourced through the Coo k Islands Meteorological Service. Tide gauge data wereobtained from the University of Hawaii and from theNational Tidal Centre in Australia. Documents such as FirstNational Communication to the United Nations Framework Convention on Climate Change and state and nationaldisaster reports were also consulted.
Spot heights and locations of structures and infrastructurein the Avatiu-Ruatonga study area were determined using aglobal positioning survey survey system, supplemented by data available from earlier surveys. At the same time,detailed descriptive and flood damage information wereobtained for each structure, through visual inspection andinterviews conducted by members of the Cook IslandsClimate Change Adaptation Program for the Pacific Team. All dat a used in the case stu dy hav e bee n placed in acooperative archive maintained by the Ministry of Works andthe Meteorological Office.
Source: CCAIRR findings.
Guideline 7
Maximize the use of existing information andmanagement systems. Wherever possible and prac-tical, make use of existing management systems. Thismay well require additional initial effort to source
and harmonize dispersed and disparate sets of information, but is likely to result in a strengthening of existing information management systems asopposed to their marginalization (Box A4.7).
Guideline 8
Strengthen and utilize in-country expertise inthe technical and policy dimensions of adaptationto climate change (Box A4.8).
BOX A4.8
Local technical capabilities in such areas as geographicalinformation system (GIS), surveying, and vulnerability andadaptation assessments were identified, with technically
qualified personnel forming the Cook Islands ClimateChange Adaptation Program (CLIMAP) for the Pacific Team.Members of the Team undertook the field work to determinespot heights and locations of structures and infrastructurein the Avatiu-Ruatonga study area, as well as gathering detailed descriptive and flood damage information throughvisual inspection and interviews. All information for the Ava ti u- Ruat on ga st ud y ar ea wa s im po rt ed to a GIS;members of the CLIMAP team based in the Ministry of Worksundertook to process the information.
Source: CCAIRR findings.
Guideline 9
Wherever possible and practical, strengthen andmaximize use of existing regulations, codes, tools,and regulatory instruments to guide selection andfacilitate implementation of adaptation measures:examples of this process include environmentalimpact assessments and building codes. This is likely to result in a strengthening of existing tools andregulations, rather than weakening them throughconfusion and inadequate enforcement (Box A4.9).
Guidelines Relating to Enhancing theEnabling Environment for Adaptation
Guideline 10
Climate proof relevant legislation andregulations. The enabling environment for
adaptation is enhanced when legislation andregulations that facilitate adaptation are introducedand strengthened, and also when the compliancemonitoring and enforcement capabilities of relevantregulatory agencies are improved (Box A4.10).

8/13/2019 Climate Proofing: A Risk-based Approach to Adaptation
http://slidepdf.com/reader/full/climate-proofing-a-risk-based-approach-to-adaptation 197/219
Climate Proofing: A Risk-based Approach to Adaptation170
BOX A4.9
The risk-based approach to adaptation used in the Climate Change Adaptation Program for the Pacific case studies follows method sconsistent with international risk management standards, including Australia and New Zealand standard 4360.
The Risk Assessment Framework Used in the CLIMAP Case Studies
The assessment of climate-related risks, and the cost-benefit analyses of adaptation measures, have been facilitated by the use of SimClim, an “open-framework” modelling system to integrate data and models for examining impacts of and adaptation to climatevariability and change. User-friendly, Windows-based interfaces allow users to import climate (and other) data for geographicalareas and spatial resolutions of their own choice and to attach impact models for relevant sectors (e.g., agricultural, coastal,health, water resources). By selecting among emission scenarios, global climate model (GCM) climate change patterns, climatesensitivity values, and time horizons, the user has considerable flexibility in generating scenarios of future climate changes thatcan be used to drive impact models. SimClim contains a custom-built geographic information system for spatial analyses of results, and tools for examining site-specific time-series data, including analyzing extreme events and estimating return periods.
SimClim combines site-specific and spatial data (from global, regional, national to local scale, depending on user specification).Required inputs include spatially interpolated monthly climatologies for precipitation and minimum, maximum, and meantemperature; GCM spatial patterns of climate changes; and site time-series climate data (hourly, daily, and/or monthly). Key outputs are user-specified spatial and temporal patterns and parameters of baseline climatologies; scenarios of future climates;and outputs from the climate-driven impact model.
Source: CCAIRR findings .

8/13/2019 Climate Proofing: A Risk-based Approach to Adaptation
http://slidepdf.com/reader/full/climate-proofing-a-risk-based-approach-to-adaptation 198/219
171Appendix 4
BOX A4.10
The Avatiu-Ruatonga case study resulted in a recommen-dation that the Building Code, health regulations, environ-mental impact assessment regulations, and other appropri-
ate regulatory instruments be amended to includeprovisions such that when new buildings are constructed,or existing buildings are modified substantially, allowanceis made for the following climate-derived risks:
• Within the next few decades, wind gusts may exceed thecurrent design wind speed of 49 ms s-1;
• Erecting structures in locations where the risk of flooding as a consequence of heavy rainfall, storm surges, or thesein combination is significant should be avoided.
• New structures are required to have a minimum floorheight that prevents them from being flooded as aconsequence of heavy rainfall, storm surges, or these incombination.
Source: CCAIRR findings.
BOX A4.11
During the early stages of planning for the Climate Change Adaptation Program for the Pacific Project (CLIMAP) in theCook Islands, a decision was made not to establish a new
body that would serve as the CLIMAP Project LiaisonCommittee. Rather, the existing National Climate ChangeCountry Team was strengthened in both breadth andrelevance of membership and the preparation and approvalof formal terms of reference.
Among the key benefits of this approach:• the Committee is already institutionalized and
recognized by the Government and other stakeholders;• the time of the limited number of national and local
experts is used more efficiently and effectively;• continuity and collective memory can be called on,
as the Country Team is an ongoing entity;• enhanced linkages exist with other climate-related
projects being undertaken within the Cook Islands;• the Government and other stakeholders will have one
ongoing source of consistent advice;• the Country Team includes representatives from the
Outer Islands as well as Rarotonga; and• the Country Team maintains effective linkages with
regional organizations and climate change teams inother countries in the region.
Source: CCAIRR findings.
Guideline 11
Strengthen institutions to support the climateproofing of development . Organize and strengtheninstitutions in ways that
• enhance communication between climate risk assessors and adaptation policy makers andimplementers;
• reduce the likelihood of conflict and duplicationof effort when managing climate-related risks;
• lessen the chances of mistrust and misunder-standing between decision and policy makersand other stakeholders in adaptation activities;and
• overall, help to provide consistent, defensibleand useful advice to policy and decision makers
wi th respec t to adap ta ti on pr io ri ti es andpractices (Box A4.11).
Guideline 12
Ensure that macroeconomic policies andconditions favor climate proofing. Macroeconomic
conditions that favor successful adaptationactivities include those that foster economictransparency. Such conditions are needed in orderto ensure that climate-related risks are not maskedor compensated for by hidden subsidies and thereby transferred to the wrong parties. Involvement of theprivate sector in adaptation (e.g., investors and otherplayers in the finance sector) will be encouraged by macroeconomic conditions that include low inflation, stable and realistic exchange and interest
rates, pricing that reflects the true (marginal andfully internalized) costs of materials, energy, laborand other inputs; deregulation; free movement of capital; operation of competitive markets; opentrade policies, and transparent foreign investmentpolicies (Box A4.12).

8/13/2019 Climate Proofing: A Risk-based Approach to Adaptation
http://slidepdf.com/reader/full/climate-proofing-a-risk-based-approach-to-adaptation 199/219
Climate Proofing: A Risk-based Approach to Adaptation172
BOX A4.12
An ad ap ta tion pl an un de r co ns id er at io n fo r Ava ti u-Ruatonga is for international agencies and aid provider tomake initial contributions to a trust fund. Subsequently,
interest from the fund would be used to cover theincremental costs of adaptation. For example, when a homeis rebuilt or renovated, the National Building Code and otherregulations will require the owner to climate proof thestructure. The additional expense to do this would becovered by the trust fund, thereby reducing the size of theloan the homeowner would need to obtain from thefinancial sector.
Source: CCAIRR findings.
BOX A4.13
All lenders have an interest in protecting the value of theasset against which a loan is secured. In Rarotonga, new residential construction, and substantive improvements in
existing dwellings, are financed through loans from a variety of private sector financial institutions. Senior officials inthese institutions are aware of the incremental risks due toclimate change and are considering making approval of loans contingent on the climate-proofing of any constructionbeing..
The Government is also considering seeking support fromthe international community to meet the documentedincremental costs of adaptation to climate change, with afocus on the Climate Fund established by the United NationsFramework Convention on Climate Change and overseenby the Global Eenvironment Facility. The intention wouldbe to establish a trust fund for the community. Interest fromthe fund would cover, on an ongoing basis, the incrementalcosts of adaptation for new dwellings and for thereplacement and renovation of existing dwellings.
Source: CCAIRR findings.
Guideline 13
Ensure favorable access to affordable financing for climate-proofed development initiatives. Address the present reluctance of banks and otherlending institutions to finance adaptation activities,due to the perception that they involve longer-termprojects that have high levels of risk. Help reducethis barrier by promoting institutions, arrangements,and mechanisms that can provide innovativefinancing, including microfinance, green finance,
secured loans, leasing arrangements, and public-private partnerships, thereby allowing adaptation toproceed without government intervention (Box A4.13).
Guidelines Relating to the Process of Mainstreaming Adaptation
Guideline 14
Document the relevant major risks to theeconomy and society resulting from climatevariability and change (including extreme events),characterizing these in terms of their probabilitiesof occurrence, associated economic and socialconsequences, and degree that they requiresustained attention (Box A4.14).
Guideline 15
Replicate the knowledge, motivation, and skillsthat facilitate successful adaptation. Identify themotivations that drive various stakeholders toengage in the adaptation process, and replicate thesemotivations in other players, through education,training, and other initiatives (Box A4.15).
Guideline 16
Enhance the capacity for continuous adaptation. Adaptive capacity is a complex and a dynamic mix of social, economic, technological, biophysical, and
political conditions that determines the capacity of asystem to adapt. These factors vary over time, location,and sector. The main features of communities,countries, and regions that determine their adaptivecapacity include economic wealth, technology,information and skills, infrastructure, institutions, andequity. By addressing these factors, it is possible toenhance adaptive capacity (Box A4.16).
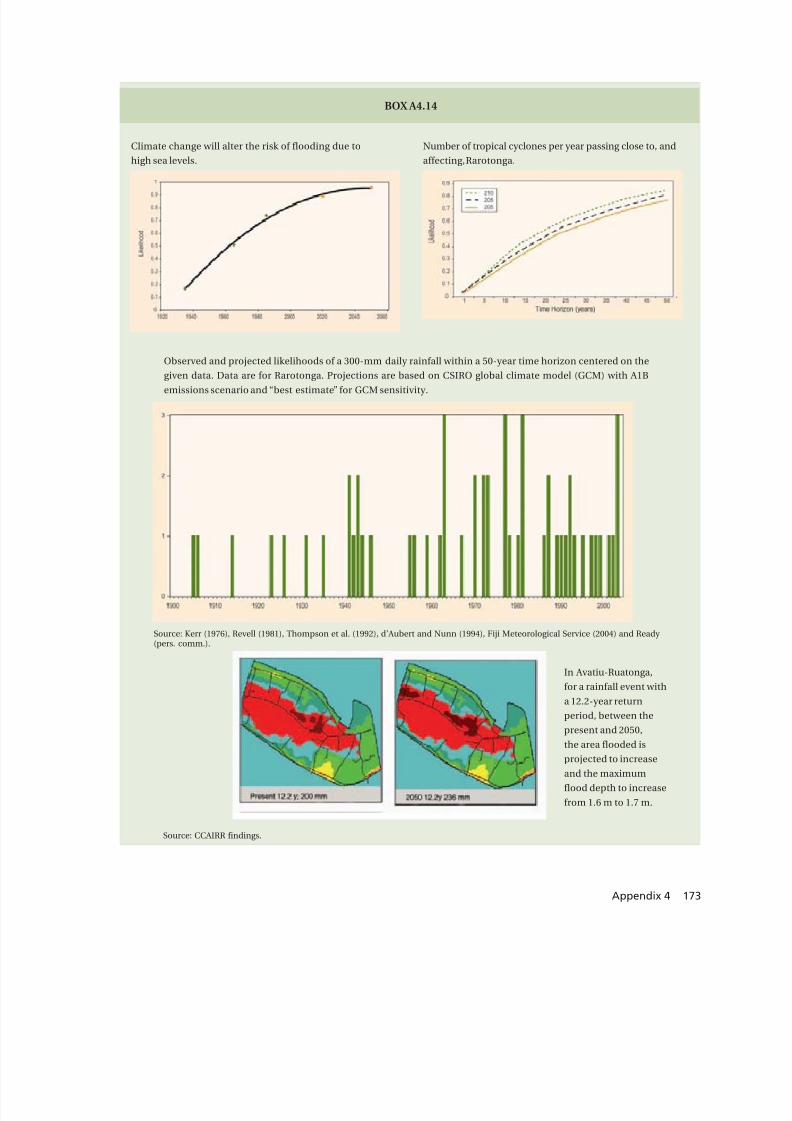
8/13/2019 Climate Proofing: A Risk-based Approach to Adaptation
http://slidepdf.com/reader/full/climate-proofing-a-risk-based-approach-to-adaptation 200/219
173Appendix 4
BOX A4.14
Climate change will alter the risk of flooding due tohigh sea levels.
Number of tropical cyclones per year passing close to, andaffecting, Rarotonga.
Source: CCAIRR findings.
Observed and projected likelihoods of a 300-mm daily rainfall within a 50-year time horizon centered on thegiven data. Data are for Rarotonga. Projections are based on CSIRO global climate model (GCM) with A1Bemissions scenario and “best estimate” for GCM sensitivity.
Source: Kerr (1976), Revell (1981), Thompson et al. (1992), d’Aubert and Nunn (1994), Fiji Meteorological Service (2004) and Ready (pers. comm.).
In Avatiu-Ruatonga,for a rainfall event witha 12.2-year returnperiod, between thepresent and 2050,the area flooded isprojected to increaseand the maximumflood depth to increasefrom 1.6 m to 1.7 m.
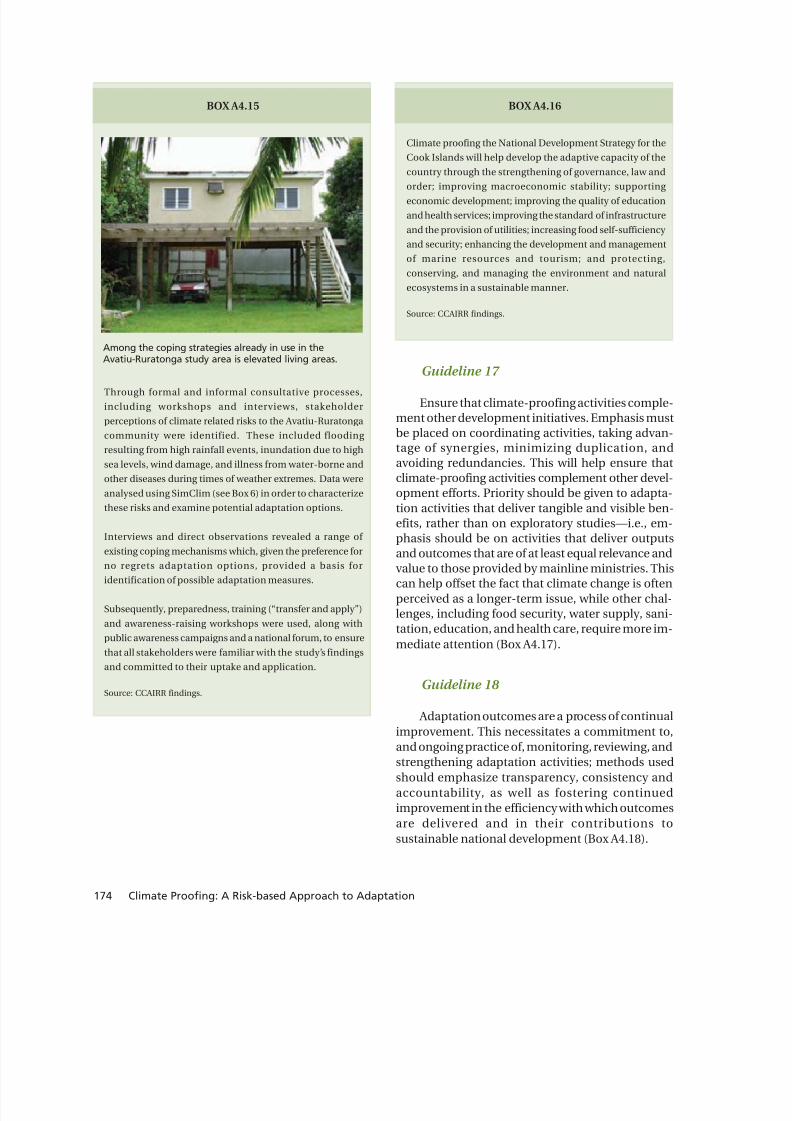
8/13/2019 Climate Proofing: A Risk-based Approach to Adaptation
http://slidepdf.com/reader/full/climate-proofing-a-risk-based-approach-to-adaptation 201/219
Climate Proofing: A Risk-based Approach to Adaptation174
BOX A4.15
Through formal and informal consultative processes,including workshops and interviews, stakeholderperceptions of climate related risks to the Avatiu-Ruratongacommunity were identified. These included flooding resulting from high rainfall events, inundation due to highsea levels, wind damage, and illness from water-borne andother diseases during times of weather extremes. Data wereanalysed using SimClim (see Box 6) in order to characterizethese risks and examine potential adaptation options.
Interviews and direct observations revealed a range of
existing coping mechanisms which, given the preference forno regrets adaptation options, provided a basis foridentification of possible adaptation measures.
Subsequently, preparedness, training (“transfer and apply”)and awareness-raising workshops were used, along withpublic awareness campaigns and a national forum, to ensurethat all stakeholders were familiar with the study’s findingsand committed to their uptake and application.
Source: CCAIRR findings.
Among the coping strategies already in use in theAvatiu-Ruratonga study area is elevated living areas.
Guideline 17
Ensure that climate-proofing activities comple-ment other development initiatives. Emphasis mustbe placed on coordinating activities, taking advan-tage of synergies, minimizing duplication, andavoiding redundancies. This will help ensure thatclimate-proofing activities complement other devel-opment efforts. Priority should be given to adapta-tion activities that deliver tangible and visible ben-efits, rather than on exploratory studies—i.e., em-phasis should be on activities that deliver outputsand outcomes that are of at least equal relevance andvalue to those provided by mainline ministries. Thiscan help offset the fact that climate change is oftenperceived as a longer-term issue, while other chal-lenges, including food security, water supply, sani-tation, education, and health care, require more im-mediate attention (Box A4.17).
Guideline 18
Adaptation outcomes are a process of continual
improvement. This necessitates a commitment to,and ongoing practice of, monitoring, reviewing, andstrengthening adaptation activities; methods usedshould emphasize transparency, consistency andaccountability, as well as fostering continuedimprovement in the efficiency with which outcomesare delivered and in their contributions tosustainable national development (Box A4.18).
BOX A4.16
Climate proofing the National Development Strategy for theCook Islands will help develop the adaptive capacity of thecountry through the strengthening of governance, law and
order; improving macroeconomic stability; supporting economic development; improving the quality of educationand health services; improving the standard of infrastructureand the provision of utilities; increasing food self-sufficiency and security; enhancing the development and managementof marine resources and tourism; and protecting,conserving, and managing the environment and naturalecosystems in a sustainable manner.
Source: CCAIRR findings.

8/13/2019 Climate Proofing: A Risk-based Approach to Adaptation
http://slidepdf.com/reader/full/climate-proofing-a-risk-based-approach-to-adaptation 202/219
175Appendix 4
BOX A4.18
A maj or req uir ement is the rev iewin g and rev isi on of priorities, given that there will never be sufficient capacity (financial, human, technological, etc.) to undertake all
activities that could reduce national and local vulnerability to climate variability and change (including extreme events). A key question that must be asked continually is whether theactivities to be implemented will be sufficient to allow thecountry to maintain its economic, social, and environmentalsystems despite changes in the climate. The climate-proofedNational Development Strategy for the Cook Islands will helpensure an affirmative response to this question.
Source: CCAIRR findings.
BOX A4.17
Strengthened capacity and the ongoing work of the NationalClimate Change Country Team (see Box A4.11) have resultedin improved coordination of climate-related activities at
both the national and local (e.g., Outer Island) levels. Theclimate proofing of the National Development Strategy (seeBox A4.1) and of relevant regulations (see Box A4.10) has alsogiven direction to climate risk assessment and provided themechanisms by which climate-related risks can be managed within the planning and regulatory environments.
Source: CCAIRR findings.

8/13/2019 Climate Proofing: A Risk-based Approach to Adaptation
http://slidepdf.com/reader/full/climate-proofing-a-risk-based-approach-to-adaptation 203/219
Climate Proofing: A Risk-based Approach to Adaptation176
Appendix 5
Mainstreaming the EconomicAnalysis of Adaptation to ClimateChange Within ADB
A. Introduction
The purpose of this Annex is to amplify the work of the Asian Development Bank’s(ADB’s) Climate Change Adaptation Pro-gram for the Pacific (CLIMAP) Technical
Assi stance regarding the economic impact of climate change risks and the costs and benefits of measures to reduce such risks. The ultimate objec-tive of CLIMAP, after demonstrating the practical sig-nificance of climate change in the Pacific region, isto assist in the “mainstreaming” of climate changerisk assessment and adaptation into economicdevelopment and investment planning in general,
and into ADB program/project preparation in par-ticular. Mainstreaming climate change consider-ations within ADB will have a direct impact on ADB’sactivities throughout Asian and Pacific countries,and is likely to have a substantial indirect impacton the parallel activities of member governmentsand other aid providers.
As described in the body of this book, theCLIMAP Technical Assistance has taken twocomplementary paths: i) an ADB-level review of at-tempts to deal with climate change in past projectsin the Pacific, and recommendations based on les-
sons learned for incorporating (“mainstreaming”)climate change considerations (including adapta-tion) into ongoing and future ADB projects and pro-grams; and ii) a detailed, country-level, on-the-ground preparation of specific climate risk casestudies in the Federated States of Micronesia (FSM)and Cook Islands, with quantification of climate risk
in selected study areas and development of meth-odologies for assessing the costs and benefits of adaptation.
For ease of reference, the ADB-level reviews andcountry-level case studies that have been carried outby CLIMAP are summarized below (Table A5.1). Thereviews provide a Climate Profile for each of eightPacific island countries 1 and 19 Project AdaptationBriefs (preliminary project-level risk assessments)for ADB “pipeline” projects in those countries. Thereviews do not include detailed specification orcosting of adaptation options on which economicanalysis could be performed; rather, this is identifiedas the next step in project development, to beundertaken by the respective project preparatory technical assistance (PPTA) consultants. The casestudies in the FSM and Cook Islands provide six in-depth risk assessments of selected study areas basedon physical and community surveys and detailedcomputer modeling, and include specification andcosting of adaptation options and associated cost-benefit analyses.
The country-level case studies carried out in theFSM and Cook Islands have documented a substan-tial impact of climate change on infrastructureprojects, sectors, and national development in those
countries, mirrored at the project and sector levelby the ADB-level reviews carried out for eightPacific island countries. Climate change is a globalissue of major concern, as it has a high potential to
1 Cook Islands, Fiji Islands, FSM, Kiribati, Republic of the Marshall Islands, Samoa,Tonga, and Tuvalu.

8/13/2019 Climate Proofing: A Risk-based Approach to Adaptation
http://slidepdf.com/reader/full/climate-proofing-a-risk-based-approach-to-adaptation 204/219
177Appendix 5
Table A5.1. Climate Change Adaptation Program for the Pacific—ADB-Level Reviews
Countries with aClimate Profile
Projects for which aProject Adaptation Brief
has been PreparedSuggested Possible
Adaptation Measures
Cook Islands Water and Sanitation Project forRarotonga and Aitutaki
FloodsDroughtSevere weather
Catchment protectionWatershed managementDesign modificationsAlternative sites
Review of Electric GenerationCapacity and Alternative EnergyProject
FloodsHigh winds
Flood preventionDaesign modificationsAlternative sites
Design modificationsAlternative sitesErosion controlBreakwaters
Fiji Islands Fisheries Sector Review Project Higher seawater temperatures(reducing catches)Lagoon and reef sedimentationSevere weatherStorm surge
Coastal managementCatchment protectionDesign modificationsAlternative sites
Design modificationsAlternative sitesAlternative cropsDesign modificationsAlternative sites
Increased water storageDesign modificationsAlternative sites
Fourth Roadbuilding Upgrade Project FloodsSea-level riseSevere weatherStorm surgeDesign modificationsAlternative sites
Tourism and Infrastructure Project
Urban Development Project
Omnibus InfrastructureDevelopment Project
FloodsDroughtSea-level riseSevere weatherStorm surge
Watershed managementDesign modificationsAlternative sitesErosion control
Outer Island Transport Project Design modificationsAlternative sitesErosion controlBreakwaters
FSM
Waste Management and EnvironmentProject
FloodsSea-level riseSevere weatherStorm surge
Identified Risk Factors
Capacity Building for WaterUse Project
FloodsDroughtSea-level riseSevere weatherStorm surge
Watershed managementDesign modificationsAlternative sitesErosion controlBreakwaters
National Water Resources AssessmentProject
Kiribati Kiribati Mariculture Project Higher seawater temperatures(reducing catches)FloodsSea-level riseSevere weatherStorm surge
Change species cultivatedShift to alternative livelihoods
continued

8/13/2019 Climate Proofing: A Risk-based Approach to Adaptation
http://slidepdf.com/reader/full/climate-proofing-a-risk-based-approach-to-adaptation 205/219
Climate Proofing: A Risk-based Approach to Adaptation178
Table A5.1. (continued)
Countries with aClimate Profile
Projects for which aProject Adaptation Brief
has been Prepared Identified Risk FactorsSuggested Possible
Adaptation Measures
RMI
Outer Islands TransportInfrastructure Project
FloodsSevere weatherStorm surge
Design modificationsAlternative sites
Outer Islands Basic Social Services Project FloodsDroughtSevere weatherStorm surge
Increased water storageDesign modificationsAlternative sites
Watershed managementDesign modificationsAlternative sitesErosion controlBreakwaters
Notes: FSM = Federated States of Micronesia; RMI = Republic of Marshall Islands.Source: ADB records.
undermine the process of economic developmentand growth in countries and across regions, and toreduce the returns on investment in infrastructure,social services, and income opportunities. Climatechange represents a permanent long-term net cost. Adaptation to climate change is a means of mini-mizing, but not eliminating, that net cost. In thislight, the economic analysis of climate change im-
pacts and adaptation options is ultimately identicalto the least-cost analysis normally undertaken by ADB and other agencies for mainstream project andprogram development. The purpose of the balanceof this Appendix is to outline methods of integrat-ing the economic analysis associated with climatechange into ADB’s conventional procedures, and toprovide illustrative examples.
Waste Management and Recycling ProjectTuvalu Flooding(contamination of groundwater)Drought (depletion of groundwater)Severe weatherStorm surge
Catchment protectionDesign modificationsAlternative sites
Water, Sanitation, andWaste Management Project
Samoa
Tonga
Preparation of Sanitation andDrainage Project II
FloodsDroughtSea-level riseSevere weatherStorm surge
Design modificationsAlternative sitesErosion controlBreakwaters
Agriculture Development Project FloodsDroughtSea-level riseSevere weather
Savai’i Energy Project FloodsDroughtSevere weatherStorm surge
Watershed managementDesign modificationsAlternative water sourcesErosion controlBreakwaters

8/13/2019 Climate Proofing: A Risk-based Approach to Adaptation
http://slidepdf.com/reader/full/climate-proofing-a-risk-based-approach-to-adaptation 206/219
179Appendix 5
Table A5.2. Climate Change Adaptation Program for the Pacific Country-level Case Studies
CountriesStudy Areas for which DetailedAnalysis has been Completed Identified Risk Factors
Adaptation MeasuresSpecified
Notes: FSM = Federated States of Micronesia.* Feasibility study delayed.Source: ADB, CCAIRR findings.
Climate Proofing Cook IslandsNational Development Strategy
All climate-related impacts
Climate Proofing the Community of Avatiu-Ruatonga, Rarotonga
Flood (2-hourly rainfall with12-year recurrence increases frompresent 200 mm to 236 mm by2050)Storm surgesSevere weather
Deeper drainage channelsBetter land use regulations andbuilding codes
Cook Islands Climate Proofing the Western BasinBreakwater, Avatiu Harbor, RarotongaStorm surges (at least 12 m)Sea-level rise (at least 0.5 m) Modified design of the breakwater*
Identification of sectors of highclimate riskMore sector-specific risk assessmentBetter climate-related information
and better capacity to use itAppropriate legislation and localregulations as required
FSM Climate Proofing a Portion of theCircumferential Road in Kosrae
Flooding (increase in designextreme rainfall event from7 to 10 inches per hour)Storm surges
Modifications to the hydraulicdesign features
Climate Proofing the Community of Sapwohn, Sokehs Island, Pohnpei
Flood (25-year hourly rainfallincreases from present 210 mm to393 mm by 2050)High sea levels
Modifications to drainage channelsBetter land use regulations andbuilding codes
Climate Proofing the FSMSustainable Development Plan
All climate-related impacts (mainfocus on health care, environment,and infrastructure)
Identification of sectors of highclimate-riskMore sector-specific risk assessmentBetter climate-related informationand better capacity to use itAppropriate legislation and localregulations as required

8/13/2019 Climate Proofing: A Risk-based Approach to Adaptation
http://slidepdf.com/reader/full/climate-proofing-a-risk-based-approach-to-adaptation 207/219
Climate Proofing: A Risk-based Approach to Adaptation180
B. Methodology
To mainstream a new concept such as climatechange in ADB’s preparation of programs andprojects requires that documentation be i) suffi-ciently rigorous and appropriate to each step of thepreparation process, from country strategy toproject implementation, to ensure clear and defen-sible results; and ii) reasonably congruent withexisting procedures, thus minimizing any additionalburdens imposed on either staff time or consultantservices. In outline, the documentation recom-mended by CLIMAP begins with a Climate Risk Profile (CRP), which provides a general assessmentof climate risk at the country level and identifies cli-mate-sensitive projects in the pipeline. 2 For theclimate-sensitive projects, a Project Adaptation Brief
(PAB) is then prepared, which provides a prelimi-nary assessment of climate risk to the project. If therisk is assessed to be unacceptable, the PAB is thentransferred into the PPTA process with appropriatechanges to the PPTA terms of reference, 3 following which a more detailed Project Adaptation Assess-ment (PAA) is prepared by the PPTA consultants,containing a full risk assessment and analyzing anumber of potential adaptation options with a com-parative cost-benefit analysis.
This structure for documentation meets theabove criteria in appropriate rigor at the various
stages of project/program preparation, and issubstantially integrated with the existing documentation structure. The CRP merges at thecountry level with preparation of the Country Strategy and Program (CSP) and CSP Update(CSPU), in which the project pipeline is identified. A PAB would be prepared only for those projects for which a significant climate risk is identified in theCRP. Finally, the PAA, if required, would beintegrated into the conventional PPTA process. Thestructure provides for an appropriate level of review
along the way to ensure that climate-relatedopportunities and constraints are not overlooked.
Preparation of intervention at ADB takes on adistinct character depending on the context in which projects and programs are set, and this willaffect the details of how climate change aspects are
incorporated. Broadly speaking, three basic contextsappear to be relevant for present purposes:
• New projects. The bulk of ADB lending andconsiderable ADB technical assistance aredirected to new projects, mainly infrastructuresuch as roads, power sector facilities, etc. Theclimate change objective in this context is tospecify a least-cost project that, among the usualdesign considerations, meets an acceptableclimate-risk criterion. The methodology foreconomic analysis of such a project is identical with conventional methodology (i.e., will remainfocused on the project’s delivery of benefits toend-users), provided that the initial and operationand maintenance (O&M) cost estimates reflect theclimate proofed design.
• Climate-proofing existing facilities. Countries willincreasingly request ADB and other internationaldevelopment partners to strengthen existing facilities to lower climate risks, e.g., to harden anexisting road with better drainage or build abreakwater to protect a port. Here the project isitself partly adaptation, and the economicmethodology and decision will focus on the specificeffectiveness of the selected adaptation option. Foran existing facility, the economic decisionregarding delivery of services to end-users hasalready been made and no longer needs to beconsidered.
• Climate-proofing as a sector program. Similarly, ADB and other aid providers will increasingly beasked for assistance in mainstreaming climate
change analysis and adaptation at the country level, in respect of sectors such as transport,communications, water supply, and housing. Insuch cases, adaptation is a long-term processimplemented in stages, and often in step with theretirement and replacement of existing assets.The financial costs of adaptation will fall on thesector owners, including, prominently, the private
2 As described in the main text, the Climate Risk Profile could be prepared inconjunction with the Country Environmental Assessment (CEA), as the datarequired for the CRP are similar to those required for the CEA and could becollected without significant additional cost.
3 The PABs prepared by CLIMAP contain project-specific suggested terms of reference for the PPTA consultants appointed to prepare each project. As thefollowing discussion attempts to demonstrate, no additional requirementsspecific to economic analysis with respect to climate change or adaptation arerecommended, as the methodology of such analysis follows conventional lineswith which the PPTA consultants will already be familiar.
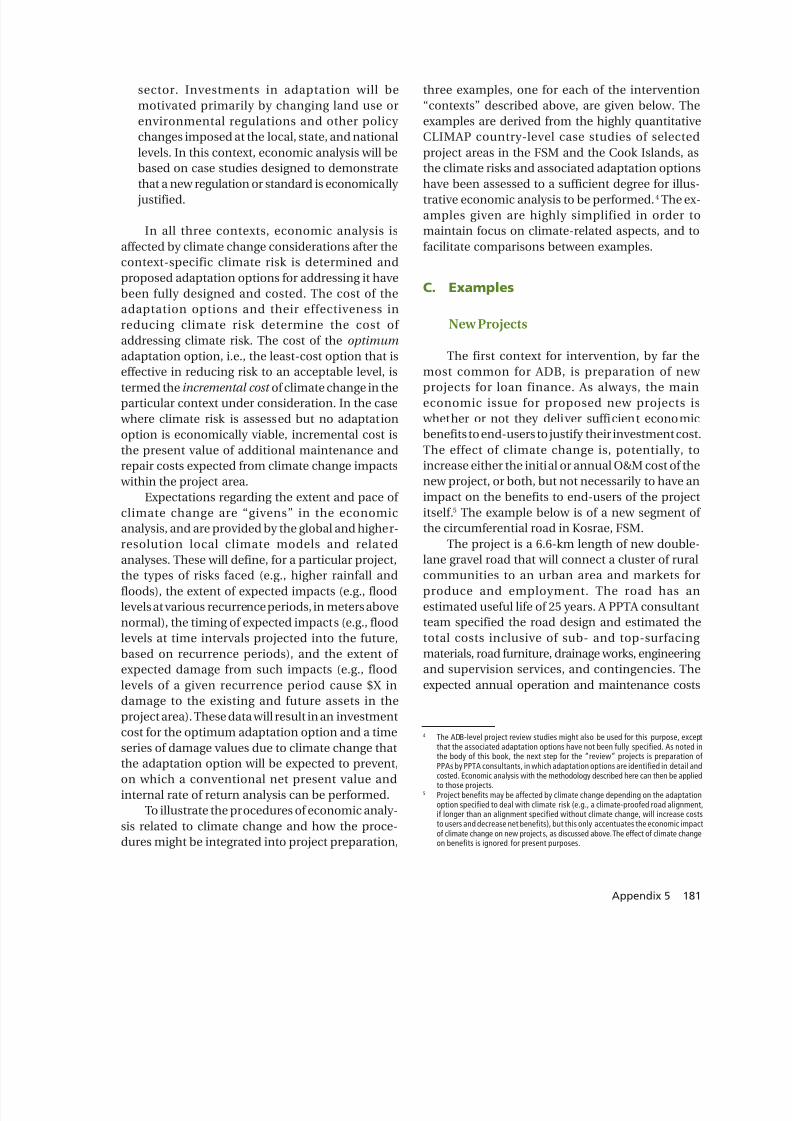
8/13/2019 Climate Proofing: A Risk-based Approach to Adaptation
http://slidepdf.com/reader/full/climate-proofing-a-risk-based-approach-to-adaptation 208/219
181Appendix 5
sector. Investments in adaptation will bemotivated primarily by changing land use orenvironmental regulations and other policy changes imposed at the local, state, and nationallevels. In this context, economic analysis will bebased on case studies designed to demonstrate
that a new regulation or standard is economically justified.
In all three contexts, economic analysis isaffected by climate change considerations after thecontext-specific climate risk is determined andproposed adaptation options for addressing it havebeen fully designed and costed. The cost of theadaptation options and their effectiveness inreducing climate risk determine the cost of addressing climate risk. The cost of the optimumadaptation option, i.e., the least-cost option that iseffective in reducing risk to an acceptable level, istermed the incremental cost of climate change in theparticular context under consideration. In the case where climate risk is assessed but no adaptationoption is economically viable, incremental cost isthe present value of additional maintenance andrepair costs expected from climate change impacts within the project area.
Expectations regarding the extent and pace of climate change are “givens” in the economicanalysis, and are provided by the global and higher-resolution local climate models and relatedanalyses. These will define, for a particular project,the types of risks faced (e.g., higher rainfall andfloods), the extent of expected impacts (e.g., floodlevels at various recurrence periods, in meters abovenormal), the timing of expected impacts (e.g., floodlevels at time intervals projected into the future,based on recurrence periods), and the extent of expected damage from such impacts (e.g., floodlevels of a given recurrence period cause $X indamage to the existing and future assets in theproject area). These data will result in an investment
cost for the optimum adaptation option and a timeseries of damage values due to climate change thatthe adaptation option will be expected to prevent,on which a conventional net present value andinternal rate of return analysis can be performed.
To illustrate the procedures of economic analy-sis related to climate change and how the proce-dures might be integrated into project preparation,
three examples, one for each of the intervention“contexts” described above, are given below. Theexamples are derived from the highly quantitativeCLIMAP country-level case studies of selectedproject areas in the FSM and the Cook Islands, asthe climate risks and associated adaptation options
have been assessed to a sufficient degree for illus-trative economic analysis to be performed. 4 The ex-amples given are highly simplified in order tomaintain focus on climate-related aspects, and tofacilitate comparisons between examples.
C. Examples
New Projects
The first context for intervention, by far themost common for ADB, is preparation of new projects for loan finance. As always, the maineconomic issue for proposed new projects is whether or not they deliver sufficient economicbenefits to end-users to justify their investment cost.The effect of climate change is, potentially, toincrease either the initial or annual O&M cost of thenew project, or both, but not necessarily to have animpact on the benefits to end-users of the projectitself. 5 The example below is of a new segment of the circumferential road in Kosrae, FSM.
The project is a 6.6-km length of new double-lane gravel road that will connect a cluster of ruralcommunities to an urban area and markets forproduce and employment. The road has anestimated useful life of 25 years. A PPTA consultantteam specified the road design and estimated thetotal costs inclusive of sub- and top-surfacing materials, road furniture, drainage works, engineering and supervision services, and contingencies. Theexpected annual operation and maintenance costs
4 The ADB-level project review studies might also be used for this purpose, excepthat the associated adaptation options have not been fully specified. As noted inthe body of this book, the next step for the “review” projects is preparation of PPAs by PPTA consultants, in which adaptation options are identified in detail andcosted. Economic analysis with the methodology described here can then be appliedto those projects.
5 Project benefits may be affected by climate change depending on the adaptationoption specified to deal with climate risk (e.g., a climate-proofed road alignment,if longer than an alignment specified without climate change, will increase coststo users and decrease net benefits), but this only accentuates the economic impactof climate change on new projects, as discussed above. The effect of climate changeon benefits is ignored for present purposes.

8/13/2019 Climate Proofing: A Risk-based Approach to Adaptation
http://slidepdf.com/reader/full/climate-proofing-a-risk-based-approach-to-adaptation 209/219
Climate Proofing: A Risk-based Approach to Adaptation182
of the new road are as shown in Table A5.3. Theestimated operating and maintenance costs areassumed to adhere to international “best practice”for maintenance of gravel roads, with majorresurfacing works budgeted every 4th year andminor touch-ups scheduled in intervening years.
For present purposes, it is assumed initially thatthe design of the road (especially drainage works)and estimated costs do not reflect considerationsof climate change, but rather are based on historicalpractice. Historical practice for this area is to designroad drainage works to cater for the runoff from adesign maximum rainfall of 178 mm per hour.
The estimated gross economic benefits (2ndcolumn from the right in the table) are exogenousand based on an assessment of the road’s potentialto improve the delivery of social services andincrease the potential for income generation in thecluster of rural communities concerned. Theeconomic internal rate of return (EIRR) is calculatedon the stream of net economic benefits (grosseconomic benefits less total costs over each year of the road’s useful life). As shown, under theseassumptions of costs and economic benefits, theEIRR is calculated at 17%, which comfortably exceeds the standard economic opportunity cost of capital (EOCC) of 12% and thus indicates aneconomically viable project. The project’s netpresent value discounted at the EOCC is $660,000.
When climate change is introduced to this sce-nario, the costs in the initial analysis conducted without climate change are seen to be underesti-mated, and the EIRR and net present value (NPV)are no longer valid. Climate change will result inheavier-than-anticipated rainfall; indicated bestpractice is to design road drainage works to caterfor the runoff from a design maximum rainfall of 254 mm per hour, instead of 178 mm. Without thelarger drainage works, climate change will result insubstantially higher annual road maintenance costs,as shown in Table A5.4 below.
As shown, the higher maintenance costs andconstant gross benefits of the project to end-usersreduce the actual EIRR to below 14% and reduce theactual NPV by about two thirds, which indicates amarginally viable project. Allowing for variations ininitial costs and benefits, as would be done inconventional sensitivity analysis, the project
without design modifications is seen, under theseassumptions, to be risky. In effect, it has not beendemonstrated to be of least cost among the availablealternatives.
With climate change appropriately recognizedat the outset by the PPTA engineers, and
incorporated into the project design and costestimates, a least-cost solution can be found by increasing the capacity of the drainage works tocater for the higher design rainfall event. Forsimplicity, it is assumed that the larger drainage works are fully effective in preventing an increasein average maintenance costs due to increasedrunoff, as shown in Table A5.5.
With these assumptions, the initial cost of theroad project is increased relative to the previouscases, but annual maintenance costs are lower thanthey would be without the adaptation to climatechange (in this case, larger road drainage works).The project is least-cost with respect to initial costsand annual O&M costs taken together, and results,for a constant stream of gross economic benefits toend-users, in an EIRR of about 15% and an NPV of about $470,000. Both are lower than the without-climate-change case, but higher than the with-climate-change case when climate risk is ignored.
This highly simplified example has beendesigned to bring to the fore two considerations inrespect of new projects:
• Ignoring climate change in project design islikely to lead to underspecification of thetechnical components and result in higher life-cycle project costs (i.e., will not result in a least-cost design); and
• Including the optimum climate-adaptiveelement in project design allows straightforwardconventional economic analysis to indicate the“true” economic performance of the projectunder changing climate conditions, which innearly all cases will be below the economic
performance of the same project in the absenceof climate change.
The cost of the optimum adaptation optionincluded in climate-proofed project design isequivalent to the incremental cost of climate changeto the beneficiaries of the new project.

8/13/2019 Climate Proofing: A Risk-based Approach to Adaptation
http://slidepdf.com/reader/full/climate-proofing-a-risk-based-approach-to-adaptation 210/219
183Appendix 5
Table A5.3. New Road Project under Current Design Without Climate Change Impact
EIRR = Estimated internal rate of return; NPV = net present value; O&M = operation and maintenance.Source: CCAIRR fi ndings.
640,2336 1,254,414 1,894,647 (1,894,647)1 15,875 15,875 345,901 330,0262 18,343 18,343 352,819 334,4763 20,811 20,811 359,875 339,0654 197,863 197,863 367,073 169,2105 17,304 17,304 374,414 357,1106 19,902 19,902 381,903 362,0017 22,586 22,856 389,541 366,955
8 215,670 215,670 397,332 181,6619 18,574 18,574 405,278 386,70410 21,561 21,561 413,384 391,82211 24,534 24,534 421,651 397,11712 235,081 235,081 430,085 195,00413 20,133 20,133 438,686 418,55414 23,409 23,409 447,460 424,05115 26,685 26,685 456,409 429,72416 256,238 256,238 465,537 209,29917 21,945 21,945 474,848 452,90318 25,515 25,515 484,345 458,83019 29,086 29,086 494,032 464,94620 279,299 279,299 503,913 224,61321 23,920 23,920 513,991 490,07122 27,812 27,812 524,271 496,45923 31,704 31,074 534,756 503,05224 304,436 304,436 545,451 241,01525 26,072 26,072 556,360 530,288
EIRR = 17.02%Road Investment Cost per mile: $ 462,109 NPV @ 12% $ 660,332
Total Cost under Current Design (No Climate Change)
All OtherTechnical
Component
O&MCosts
($)Total Costs
($)
GrossEconomicBenefits
($)
NetEconomicBenefits
($)
Investment Costs
YearsDrainage
Works

8/13/2019 Climate Proofing: A Risk-based Approach to Adaptation
http://slidepdf.com/reader/full/climate-proofing-a-risk-based-approach-to-adaptation 211/219
Climate Proofing: A Risk-based Approach to Adaptation184
Table A5.4. New Road Project under Current Design with Climate Change Impact
EIRR = Estimated internal rate of return; NPV = net present value; O&M = operation and maintenance.Source: CCAIRR findings.
Total Cost under Current Design (With Climate Change)
All OtherTechnical
Component
O&MCosts
($)Total Costs
($)
GrossEconomicBenefits
($)
NetEconomicBenefits
($)
Investment Costs
Years
DrainageWorks
($)
640,233 1,254,414 1,894,647 (1,894,647)1 17,599 17,599 345,091 328,3022 22,326 22,326 352,819 330,4933 27,590 27,590 359,875 332,2864 283,798 283,798 367,073 83,2755 26,698 26,698 374,414 347,7166 32,867 32,867 381,903 349,0357 39,753 39,753 389,541 349,788
8 403,010 403,010 397,332 (5,678)9 36,725 36,725 405,278 368,55310 44,973 44,973 413,384 368,41111 53,838 53,838 421,651 367,81412 541,381 541,381 430,085 (111,296)13 48,551 48,551 438,686 390,13614 58,993 58,993 447,460 388,46715 70,146 70,146 456,409 386,26316 701,394 701,394 465,537 (235,857)17 62,451 62,451 474,848 412,39718 75,384 75,384 484,345 408,96119 89,092 89,092 494,032 404,94020 885,825 885,825 503,913 (381,912)21 78,460 78,460 513,991 435,53022 94,248 94,248 524,271 430,02323 110,880 110,880 534,756 423,87624 1,097,771 1,097,771 545,451 (552,320)25 96,846 96,846 556,360 459,515
EIRR = 13.90%Road Investment Cost per mile: $ 462,109 NPV @ 12% $ 204,979

8/13/2019 Climate Proofing: A Risk-based Approach to Adaptation
http://slidepdf.com/reader/full/climate-proofing-a-risk-based-approach-to-adaptation 212/219
185Appendix 5
Table A5.5. New Road Project under Adapted Design with Change Impact
EIRR = Estimated internal rate of return; NPV = net present value; O&M = operation and maintenance.Source: CCAIRR fi ndings.
Total Cost under Current Design (With Climate Change)
All OtherTechnical
Component
O&MCosts
($)Total Costs
($)
GrossEconomicBenefits
($)
NetEconomicBenefits
($)
Investment Costs
YearsDrainage
Works
850,00 1,254,414 2,104,414 (2,104,414)1 15,875 15,875 345,901 330,0262 18,343 18,343 352,819 334,4763 20,811 20,811 359,875 339,0654 197,863 197,863 367,073 169,2105 17,304 17,304 374,414 357,1106 19,902 19,902 381,903 362,0017 22,586 22,856 389,541 366,955
8 215,670 215,670 397,332 181,6619 18,574 18,574 405,278 386,70410 21,561 21,561 413,384 391,82211 24,534 24,534 421,651 397,11712 235,081 235,081 430,085 195,00413 20,133 20,133 438,686 418,55414 23,409 23,409 447,460 424,05115 26,685 26,685 456,409 429,72416 256,238 256,238 465,537 209,29917 21,945 21,945 474,848 452,90318 25,515 25,515 484,345 458,83019 29,086 29,086 494,032 464,94620 279,299 279,299 503,913 224,61321 23,920 23,920 513,991 490,07122 27,812 27,812 524,271 496,45923 31,704 31,074 534,756 503,05224 304,436 304,436 545,451 241,01525 26,072 26,072 556,360 530,288
EIRR = 15.28%Road Investment Cost per mile: $ 513,272 NPV @ 12% $ 473,040
8/13/2019 Climate Proofing: A Risk-based Approach to Adaptation
http://slidepdf.com/reader/full/climate-proofing-a-risk-based-approach-to-adaptation 213/219
Climate Proofing: A Risk-based Approach to Adaptation186
Climate Proofing Existing Facilities
The second main context for interventionrelates to the protection of existing facilities fromthe effects of climate change. It is likely that, asclimate change is progressively mainstreamed
among the ADB member countries, governmentsand the private sector will increasingly requestassistance in protecting facilities that were originally designed without taking climate change intoaccount and are therefore at rising risk. The grosseconomic benefit to end-users of services from theexisting facility has already formed the basis of thepast decision to invest in the facility, and need notbe considered further. Rather, economic analysis inthis context focuses on whether a “retrofitted”adaptation option provides sufficient benefits in theform of avoided future maintenance and repair coststo justify its initial cost. The economic analysis of retrofit climate proofing can be demonstrated by continuing the previous example, this time by applying higher capacity road drainage works to anexisting segment of the circumferential road inKosrae, FSM.
The project venue is a 3.2-km length of existing double-lane gravel road, for which higher operating and maintenance costs are expected due to runoff that exceeds the capacity of the existing drainage works, originally designed for a maximum 178-mm-per-hour rainfall event. The “project” entailsremoval of the existing road drainage works andreplacement with larger works that can absorb therunoff of a 254-mm-per-hour rainfall event.Economic costs in this case include removing theexisting drainage and replacing it with largercapacity drainage. The gross economic benefits arethe expected future savings in road maintenancecosts due to the new drainage.
In Case Study 1 in this book, it was estimatedthat the total resource cost of retrofitting largercapacity drainage onto the existing 3.2-km gravel
road segment was about $370,000, or about $243,000per km (nearly three times as much additional costas climate proofing an as-yet-unbuilt road to thesame standard in the same area, as per the previousexample). Illustrative road maintenance costs withand without larger drainage works installed areshown in Table A5.6; net economic benefits of theadaptation project are equal to the difference
between O&M costs without the project and withthe project. Although substantial future cost savingsare projected, the calculated EIRR of the adaptationproject is about 7 percent, reflecting the higher costand lower return of retrofitting adaptation onto anexisting road (and by analogy, any facility). However,
an EIRR of about 7% may still be acceptable for thisor similar retrofit projects to proceed, dependentlargely on the source of funds for the investment. 6
Three general comments are suggested by thisexample:
• In this context, in contrast with the previousexample, the economic focus is on theadaptation option itself, rather than on theeconomic benefit of the facility to ultimate users.
• In comparison with the previous example and with the economic analysis of “new projects” ingeneral, investments to retrofit adaptation ontoexisting facilities will be less attractive thanincorporating equivalent adaptation into new projects before they are built.
• The economic analysis of an adaptation optionas a retrofit “project” follows entirely conventional methodology, provided that allresource costs associated with the retrofit areaccounted for (including the costs of removing existing assets that may have substantial residuallife) and that benefits of adaptation areaccurately expressed as future operating andmaintenance cost savings.
Consistent with the previous example, the costof the optimum (i.e., least-cost) adaptation optionchosen for retrofit is equivalent to the incrementalcost of climate change to the beneficiaries of theexisting facility. In many “retrofit” cases, theoptimum adaptation option will be do nothing :dealing with the consequences of climate changeas they come, in the form of higher maintenance
and repair costs and possibly shortened asset life,may make more sense economically than an up-front investment in retrofit adaptation. In suchcases, the incremental cost of climate change is
6 The aid provider community is earmarking increasing resources to assist smalland vulnerable developing countries to meet the incremental costs of adaptation. These funds are essentially nonfungible.

8/13/2019 Climate Proofing: A Risk-based Approach to Adaptation
http://slidepdf.com/reader/full/climate-proofing-a-risk-based-approach-to-adaptation 214/219
187Appendix 5
equivalent to the present value of the highermaintenance and repair costs so borne.
Climate Proofing as a Sector Program
The third main context for intervention relates
to country-level mainstreaming of climate changeconsiderations into long-term infrastructure andeconomic planning at the national, state, and locallevels. Vulnerability to climate change, as discussedabove, is certainly demonstrable at the project level,but also affects entire communities and sectors suchas health care, education, transport, agriculture, wate r/wast ewat er, power supp ly, and ur bandevelopment. At these macro levels, it is generally not feasible to retrofit effective adaptation in the
short term. Rather, adaptation will proceed in step with the retirement and replacement of assets andthrough the construction of new assets. The costsof implementation will be borne by communitiesand governments and, to a highly significant degree,by the private sector. The investments of these
groups will be guided by voluntary good practicesand regulations generated by government agencies,private sector professional societies, and others, thatincreasingly reflect awareness of climate changeimpacts. In this way, climate change will bemainstreamed into economic planning, land useregulations and zoning codes, commercial bank lending guidelines, and the like.
The economic issue in this context is whetherproposed regulations or planning guidelines are
Table A5.6. Retrofitting Adaptation: Total Road Costs with Climate Change
EIRR = estimated internal rate of return; NPV = net present value.Source: CCAIRR findings.
Investment(Drainage
Works)
TotalCosts
($)
MaintenanceCosts
($)
Investment(Drainage
Works)
TotalCosts
($)
MaintenanceCosts
($)
Investment(DrainageWorks) ($)
TotalCosts
($)
MaintenanceCosts
($)
Total Costs under Current Design Total Costs under Upgrade Design Net Benefits of Upgrade Design
370,331 370,331 (370,331 (370,3318,364 8,364 7,744 7,774 620 620
10,379 10,379 8,948 8,948 1,432 1,43212,588 12,588 10,152 10,152 2,436 2,436
127,404 127,404 96,518 96,518 30,886 30,88611,817 11,817 8,441 8,441 3,376 3,37614,368 14,368 9,708 9,708 4,660 4,66017,187 17,187 11,018 11,018 6,170 6,170
172,536 172,536 105,205 105,205 67,331 67,33115,584 15,584 9,060 9,060 6,524 6,52418,932 18,932 10,518 10,518 8,414 8,41422,500 22,500 11,968 11,968 10,532 10,532
224,760 224,760 114,674 114,674 110,087 110,08720,034 20,034 9,821 9,821 10,214 10,21424,208 24,208 11,419 11,419 12,789 12,78928,637 28,637 13,017 13,017 15,620 15,620
284,987 284,987 124,994 124,994 159,992 159,99225,263 25,263 10,705 10,705 14,558 14,55830,370 30,370 12,447 12,447 17,923 17,92335,755 35,755 14,188 14,188 21,566 21,566
354,233 354,233 136,244 136,244 217,990 217,990
31,270 31,270 11,668 11,668 19,602 19,60237,444 37,444 13,567 13,567 23,878 23,87843,992 43,992 15,465 15,465 28,456 28,456
433,636 433,636 148,506 148,506 285,131 285,13138,155 38,155 12,718 12,718 25,436 25,436
NPVs@ 3.0% $ 1,280,368 $ 990,771 EIRR = 6.73%

8/13/2019 Climate Proofing: A Risk-based Approach to Adaptation
http://slidepdf.com/reader/full/climate-proofing-a-risk-based-approach-to-adaptation 215/219
Climate Proofing: A Risk-based Approach to Adaptation188
economically justified, or whether existing regulations have begun to impose hidden costs dueto climate change. Does the process of planning anddevelopment take proper account of climateconstraints? What are the long-term opportunitiesto minimize climate-related costs affecting
communities, sectors, or the country as a whole? As demonstrated in several of the CLIMAP
country-level case studies, the initial stages of addressing such questions take a considerable effortin primary surveys, studies, scenario generation,and analyses. CLIMAP has developed an analytictool, SimClim, that greatly helps these processes. Itis expected that as climate mainstreaming proceeds, well -founded regula ti ons and gu id el ines wi llgradually replace the need for primary surveys andanalyses, and climate-aware development willbecome self-sustaining. However, as long asmainstreaming is in its preliminary stages, much work remains to be done across a wide variety of sectors and communities in a large number of countries.
The example briefly discussed here is of the casestudy of the Sapwohn coastal community inPohnpei, FSM, described in detail as Case Study 4.The following focuses on the methods of analysisused in the case study, as a model of the kind of analysis that may have to be replicated for othercommunities and sectors in the FSM and in othercountries.
Sapwohn is a coastal “bedroom” community onSokehs Island close to the Pohnpei state capital,Kolonia. The sample area for the case study contains178 structures, mostly residential, which form theassets that are vulnerable to climate change. Themain climate risks, based on observations andconsultations with community leaders andresidents, are flooding from extreme rainfall eventsand sea level changes. In order to quantify the risk,it was necessary to undertake a detailed structure-by-structure survey of the sample area, to determine
each structure’s precise elevation, proximity torunoff channels, orientation to the sea, uses of thestructure, and materials of its construction.Discussions with experienced building contractorsin Pohnpei provided estimates of the cost to repairor replace structures that suffered various levels of damage from natural causes, based on replacementvalue.
Because each structure in the sample area hasa unique location and hence a unique risk of flooding, and is composed of particular materials with different abilities to withstand flood damage,it was necessary to construct an economic modelthat included each structure, and correlate the
results to develop a composite picture of the samplearea. Buildings were categorized by constructionmaterials. For each category, damages caused by floods were estimated on a sliding scale of floodheights, thus allowing a damage estimate to bederived for each structure for any given flood event, which depends only on the st ructure’s three-dimensional location and construction materials.The necessity of this type of structure-by-structureanalysis was the most time-consuming andanalytically intensive part of the case study of thesample area.
Sector analysis differs from the project analysisof the previous examples in terms of the applicabletime horizon. Whereas the useful life of infrastructure projects rarely exceeds 25–30 years,a sector or a community is subject to eventsoccurring over a much longer time frame, say 50–100 years. Within such periods, very little can beconsidered “fixed.” For certain, the climate changespalpably; human activities evolve; and the local,state, national, and world economies change. Thus,risk assessments at the sector or community levelmust take into account not only climate risks butalso land use changes due to population pressuresor transforming economic activity. Land usechanges are at once a “risk factor,” in that they may increase the vulnerability of a community to a givenextreme event, and an opportunity to adaptgradually and in a robust way to increasing climaterisk. The SimClim model features a land use scenariogenerator that allows analysts to simulate futureeconomic development in the study area as anadaptive response to climate change, providing apowerful tool for development and testing of
adaptation guidelines.The case study in Sapwohn (and a similar casestudy in Rarotonga, Cook Islands) highlighted thefact that “modern” communities in coastal areas of island countries (and very likely communities inother environments of developing countries) arehighly vulnerable to natural disasters that, becauseof climate change, are becoming increasingly prob-
8/13/2019 Climate Proofing: A Risk-based Approach to Adaptation
http://slidepdf.com/reader/full/climate-proofing-a-risk-based-approach-to-adaptation 216/219
189Appendix 5
able. It would appear that the process of economicdevelopment over the decades since World War II,involving a transformation away from traditionalsubsistence toward reliance on a cash economy andexternal markets, has resulted in increasing vulner-ability to natural disasters that has overwhelmed any
attempts to adapt. The case studies found that thecommunities are highly vulnerable, irrespective of climate change, but that climate change signifi-cantly exacerbates the vulnerability. Climate-relatedsector analysis is thus indicated as an urgent need,difficult and demanding as it may be initially; suchcase studies should be repeated in other communi-ties and in other countries.
The economic model developed for thecommunity case studies of Sapwohn and Rarotongaprovides a structure-by-structure assessment of climate-related risk in the communities, a valuationof the assets, and integration across structures andacross extreme events of the damage expected to besustained from various climate change scenarios,making it possible to test the effectiveness of different development scenarios and long-termadaptive responses and select for voluntary-guideline and regulatory purposes. The economicmodel is built in as an integral component of theSimClim software developed for CLIMAP, and isavailable for use in similar case studies.
In the context of economic analysis foradaptation, the following observations are relevant:
• Sec tor ana lysi s i s long term and involvestransformations in the local climate and localeconomy that may be opposed or mutually reinforcing.
• The appropriate adaptation response to assessedrisks is gradual and implemented throughvoluntary guidelines; where necessary, land useregulations are designed to minimize individualand community costs.
• A large portion of the costs of adaptation in this
context will be borne by individuals and theprivate sector rather than by governments, andis therefore less amenable to direct ADBintervention than is conventional projectfinance.
• The practical methodology of economic analysisis highly dependent on the sector or particularcommunity selected as the study area.
• The analysis involves highly complex integrations spatially and temporally, and will beaided by use of the SimClim software developedfor CLIMAP, or a similar tool.
• Sector analysis will constitute an increasing focusof government and multilateral agencies as
climate awareness is increasingly mainstreamedinto local, state, and national planning processes.
Conclusions
The three “contexts” for climate-related analysisdescribed above, viz, (i) new projects, (ii) retrofitting existing assets, and (iii) sector analysis are in approxi-mate order of current priority for governments andinternational agencies, given the emerging state of climate awareness. The primary focus on analysis fornew projects stems from an awareness of the poten-tial for climate change to undermine the effectivenessof new projects and their potential to contribute todevelopment and poverty reduction. The secondary focus on retrofitting existing assets stems essentially from the same concerns and a recognition that many assets with considerable useful life remaining are ill-designed to cope with climate impacts.
The third context, however, is most directly related to local, national, and global mainstreaming of climate awareness, and is of paramount impor-tance for the long term, albeit relatively remote fromimmediate concerns. Though comparatively difficultand complex to carry out, sector and community case studies will provide valuable insights to guiderobust and economically well-founded adaptive re-sponses to climate change in the future. Applicationof requisite resources for them in the near term is akind of bellwether of the success of mainstreaming efforts in general. The need for primary research willgradually lessen as data are gathered, organized, andapplied across similar sectors, communities, andcountries as mainstreaming proceeds.
Efforts within ADB to mainstream climateawareness into project and program development will have a powerful effect, not only on activitiesdirectly financed by ADB, but indirectly on parallelprojects and sectors addressed by governments andother aid providers, as ADB’s institutional credibility promotes wider acceptance of climate-awareprocesses and procedures.
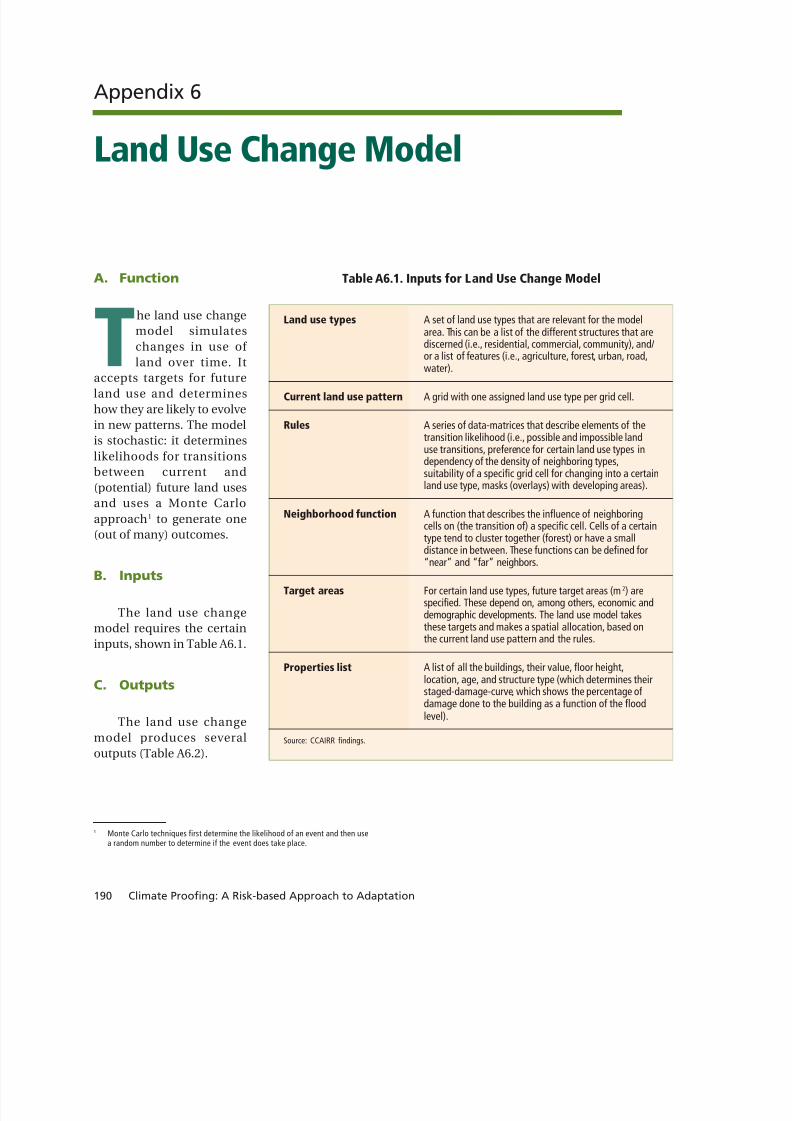
8/13/2019 Climate Proofing: A Risk-based Approach to Adaptation
http://slidepdf.com/reader/full/climate-proofing-a-risk-based-approach-to-adaptation 217/219
Climate Proofing: A Risk-based Approach to Adaptation190
Appendix 6
Land Use Change Model
A. Function
The land use changemodel simulateschanges in use of
land over time. Itaccepts targets for futureland use and determineshow they are likely to evolvein new patterns. The modelis stochastic: it determineslikelihoods for transitionsbetween current and(potential) future land usesand uses a Monte Carloapproach 1 to generate one(out of many) outcomes.
B. Inputs
The land use changemodel requires the certaininputs, shown in Table A6.1.
C. Outputs
The land use change
model produces severaloutputs (Table A6.2).
1 Monte Carlo techniques first determine the likelihood of an event and then usea random number to determine if the event does take place.
Table A6.1. Inputs for Land Use Change Model
Land use types A set of land use types that are relevant for the modelarea. This can be a list of the different structures that arediscerned (i.e., residential, commercial, community), and/or a list of features (i.e., agriculture, forest, urban, road,water).
Current land use pattern A grid with one assigned land use type per grid cell.
Rules A series of data-matrices that describe elements of thetransition likelihood (i.e., possible and impossible landuse transitions, preference for certain land use types independency of the density of neighboring types,suitability of a specific grid cell for changing into a certainland use type, masks (overlays) with developing areas).
Neighborhood function A function that describes the influence of neighboringcells on (the transition of) a specific cell. Cells of a certaintype tend to cluster together (forest) or have a small
distance in between. These functions can be defined for“near” and “far” neighbors.
Target areas For certain land use types, future target areas (m2) arespecified. These depend on, among others, economic anddemographic developments. The land use model takesthese targets and makes a spatial allocation, based onthe current land use pattern and the rules.
Properties list A list of all the buildings, their value, floor height,location, age, and structure type (which determines theirstaged-damage-curve, which shows the percentage of damage done to the building as a function of the floodlevel).
Source: CCAIRR findings.

8/13/2019 Climate Proofing: A Risk-based Approach to Adaptation
http://slidepdf.com/reader/full/climate-proofing-a-risk-based-approach-to-adaptation 218/219
191Appendix 6
Table A6.3. Parameters for Land Use Change Model
Longevity This parameter controls the aging and therefore the relocation or renovation of structures.
Acceptable risk The risk (effects of flood events) that occupants of a structure accept before they decide to change (eitherrenovate or relocate).
Structure Several parameters control the condition of new or renovated properties (e.g., a minimum floor level,parameters either generic or depending on the local flood risks).
Rebuilding When structures are “renewed”, it is possible to renovate them (on the spot) or rebuild themstrategy (possibly in a different location).
Neighborhood Neighborhood is defined as the percentage of cells per land use type “around” a center cell at a certaindistance (“near” or “far”). This percentage can be weighted with the distance.
Monte Carlo As the land use change model determines only the likelihood of transitions in land use, the actualparameters transition is a stochastic process. Parameters can be set to control this process: to make selections based
on the maximum likelihood or to repeat the random path (in order to reproduce results).Source: CCAIRR findings.
E. Cost-Benefit Model
The cost-benefit model calculates thediscounted costs of damage to structures becauseof flood events (either from inland flooding or fromstorm surges) with and without climate change, as well as the benefi ts (under both condit ions) of adaptation options (regarding the flood events).
F. Expected Damages
Given a list of structures with value (structure andcontents), location, and the appropriate staged-damage curve, for any given flood event (characterizedby flood-levels at all locations), the damages resulting from these flood events can be computed.
Each of these flood events has a return period andan associated probability of occurring. The expectedcosts for a certain event are its probability times theassociated costs. The annual expected costs are theintegral over all events.
As both the flood events (climate change) and thestructures (land use change) can develop over time,the annual expected costs will be different for every year. All these future costs can be discounted to currentdollars (using a discount rate) and correlated to findthe total expected costs at the present time.
Table A6.2. Outputs of Land Use Change Model
New land use pattern A grid with all the (new)land use types, satisfying thetotal area (m2) needed foreach land use type.
Update properties list A property list reflecting allthe changes that have comeinto effect during the lastyear (e.g., age, floor level,location).
Transition balance An overview of all theindividual changes that havetaken place, referencing therules that have been used.
Costs Costs of changes (usuallyassociated with adaptation).
Source: CCAIRR findings.
D. Parameters
The land use change model implements certainrules and mechanisms with respect to structures.Some mechanisms are parameterized control theirbehavior (Table A6.3).

8/13/2019 Climate Proofing: A Risk-based Approach to Adaptation
http://slidepdf.com/reader/full/climate-proofing-a-risk-based-approach-to-adaptation 219/219