Embed Size (px)
Citation preview
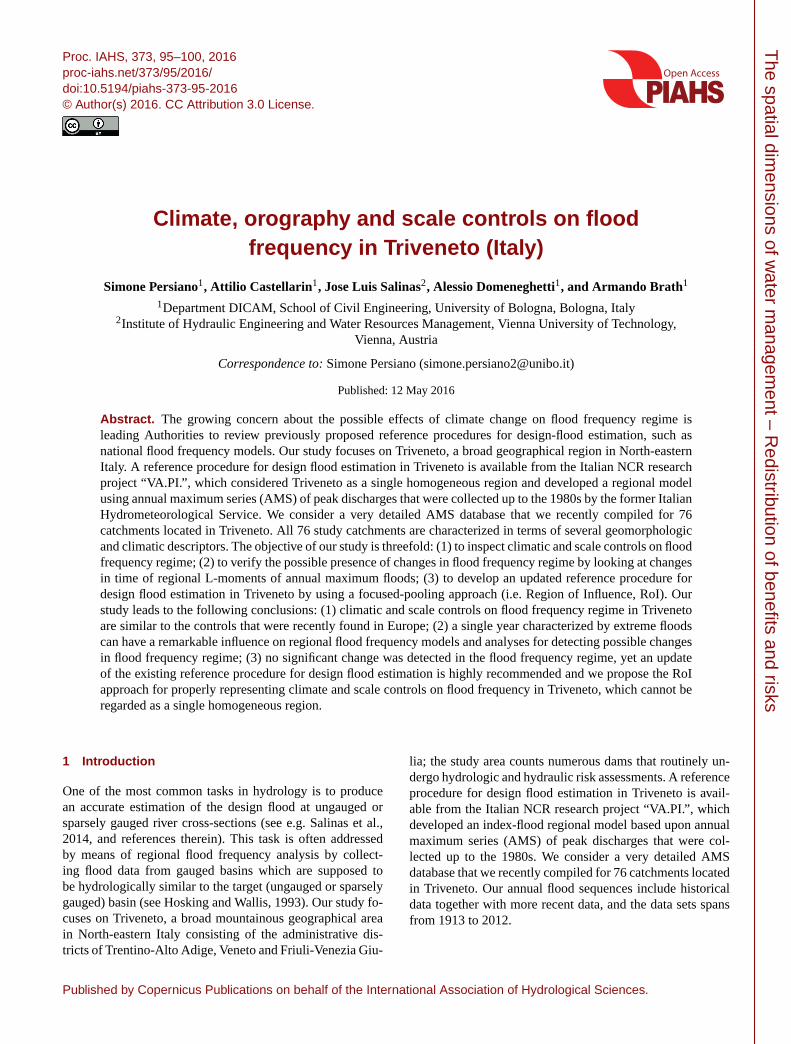
Proc. IAHS, 373, 95–100, 2016
proc-iahs.net/373/95/2016/
doi:10.5194/piahs-373-95-2016
© Author(s) 2016. CC Attribution 3.0 License.
Open Access
The
spatia
ldim
ensio
ns
ofw
ate
rm
anagem
ent–
Redis
tributio
nofbenefits
and
risks
Climate, orography and scale controls on flood
frequency in Triveneto (Italy)
Simone Persiano1, Attilio Castellarin1, Jose Luis Salinas2, Alessio Domeneghetti1, and Armando Brath1
1Department DICAM, School of Civil Engineering, University of Bologna, Bologna, Italy2Institute of Hydraulic Engineering and Water Resources Management, Vienna University of Technology,
Vienna, Austria
Correspondence to: Simone Persiano ([email protected])
Published: 12 May 2016
Abstract. The growing concern about the possible effects of climate change on flood frequency regime is
leading Authorities to review previously proposed reference procedures for design-flood estimation, such as
national flood frequency models. Our study focuses on Triveneto, a broad geographical region in North-eastern
Italy. A reference procedure for design flood estimation in Triveneto is available from the Italian NCR research
project “VA.PI.”, which considered Triveneto as a single homogeneous region and developed a regional model
using annual maximum series (AMS) of peak discharges that were collected up to the 1980s by the former Italian
Hydrometeorological Service. We consider a very detailed AMS database that we recently compiled for 76
catchments located in Triveneto. All 76 study catchments are characterized in terms of several geomorphologic
and climatic descriptors. The objective of our study is threefold: (1) to inspect climatic and scale controls on flood
frequency regime; (2) to verify the possible presence of changes in flood frequency regime by looking at changes
in time of regional L-moments of annual maximum floods; (3) to develop an updated reference procedure for
design flood estimation in Triveneto by using a focused-pooling approach (i.e. Region of Influence, RoI). Our
study leads to the following conclusions: (1) climatic and scale controls on flood frequency regime in Triveneto
are similar to the controls that were recently found in Europe; (2) a single year characterized by extreme floods
can have a remarkable influence on regional flood frequency models and analyses for detecting possible changes
in flood frequency regime; (3) no significant change was detected in the flood frequency regime, yet an update
of the existing reference procedure for design flood estimation is highly recommended and we propose the RoI
approach for properly representing climate and scale controls on flood frequency in Triveneto, which cannot be
regarded as a single homogeneous region.
1 Introduction
One of the most common tasks in hydrology is to produce
an accurate estimation of the design flood at ungauged or
sparsely gauged river cross-sections (see e.g. Salinas et al.,
2014, and references therein). This task is often addressed
by means of regional flood frequency analysis by collect-
ing flood data from gauged basins which are supposed to
be hydrologically similar to the target (ungauged or sparsely
gauged) basin (see Hosking and Wallis, 1993). Our study fo-
cuses on Triveneto, a broad mountainous geographical area
in North-eastern Italy consisting of the administrative dis-
tricts of Trentino-Alto Adige, Veneto and Friuli-Venezia Giu-
lia; the study area counts numerous dams that routinely un-
dergo hydrologic and hydraulic risk assessments. A reference
procedure for design flood estimation in Triveneto is avail-
able from the Italian NCR research project “VA.PI.”, which
developed an index-flood regional model based upon annual
maximum series (AMS) of peak discharges that were col-
lected up to the 1980s. We consider a very detailed AMS
database that we recently compiled for 76 catchments located
in Triveneto. Our annual flood sequences include historical
data together with more recent data, and the data sets spans
from 1913 to 2012.
Published by Copernicus Publications on behalf of the International Association of Hydrological Sciences.
96 S. Persiano et al.: Climate, orography and scale controls on flood frequency, Triveneto
Figure 1. Location of the 76 Triveneto gauging stations (black
points) considered in the present study. Grey lines represent catch-
ments boundaries. Pieve di Cadore, an example target basin, is high-
lighted in red.
The objective of our study is threefold: (1) to check
whether climatic and scale controls on flood frequency
regime in Triveneto are similar to the controls that were re-
cently found in Europe; (2) to verify the possible presence
of changes in flood frequency regime by looking at changes
in time of regional L-moments of annual maximum floods
(see Hosking and Wallis, 1993, for an introduction to L-
moments); (3) to develop an updated reference procedure
for design flood estimation in Triveneto by using a focused-
pooling approach (i.e. Region of Influence, RoI; see Burn,
1990).
2 Area and MAP control on regional flood frequency
distribution
The selection of the most suitable regional parent distribu-
tion is a key aspect in any regional flood frequency analysis.
The scientific literature recommends using the L-moment ra-
tio diagrams for addressing this task (see e.g. Hosking and
Wallis, 1993). Because of the unavailability or high uncer-
tainty of sample statistics for ungauged or poorly gauged
regions, many studies have focused on the relationships be-
tween sample L-moments and catchment descriptors. In par-
ticular, a recent study by Salinas et al. (2014) on a data set
of annual maximum series (AMS) of peak flow from a total
of 813 catchments (in Austria, Italy and Slovakia) shows the
great importance of incorporating into regional models infor-
mation on mean annual precipitation (MAP) and basin area
as surrogates of climate and scale controls. The first main
aim of our study is to check whether climatic and scale con-
trols on flood frequency regime in Triveneto are similar to the
controls that were recently found in Europe by Salinas et al.
(2014).
●
●
●
●
●
●
●
●
●
●
●
●
●
●
●
●
●
●
●
●
●
●
●
●
●
●
●
●
●
●
●
●
●
●
●
●
●
●
●
●
●
●
●●
●
●
●
●
●
●●
●
●●
●
●●
●
●
●
●
●
●
●
●
●
●
●
●
●
●
●
●
●
●
●
●
●
●
●
●●
●
●
●
●
●
●
●
●
●
●
●
●
●
●
●
●
●
●
●
●
●
●
●
●
●
●
●●
●
●
●
●
●
●
●
●
●
●
●
●
●
●
●
●
●
●
●
●
●
●
●
●
●
●
●
●
●
●
●
●
●
●
●
●
●●
●
●
●●
●
●
●
●
●
●
● ●
●
●
●
●
●
●
●
●
●●
●
●
●
●
● ●
●●
●
●
●
●
●
●
●
●
●
●
●
●
●
●
●
●●
●
●
●
●
●
●
●
●
●
●
●●
●
●
●
●
●
●
●
●
●●
● ●
●
●
●
●
●
●
●
● ●
●
●
●
●
●
●
●
●
●
●
●
●
●
●
●
●
●
●
●
●
●
●
●
●
●
●
●
●
●
● ●
●
●
●
●
●
●
●
●
●
●
●●
● ●
●●
●
●
●
●
●●
●
●
●
●
●
●
●
●
●
●
●
●
●
●
●●
●
●
●
●
●
●
●
●
●
●
●
●
●
●
●
●
●
●
●
●
●
●
●
●
●
●
●
●
●
●
●
●
●
●
●
●
●
●
●
●
●
●
●
●
●
●
●
●
●
●●
●
●
●
●
●
●
●
●
●
●●
●
●
●
●
●
●
●
●
●
●
●
●
●
●
●●
●
●
●
●
●
●
●
●
●
●
●
●
●
●
●
●
●
●
●
●
●
●
●
●
●●
●
●
●●
●
●
●
●
●
●
●
● ●
●
●
●
●
●
●
●
●
●
●
●
●
●
●
●
●
●●
●
●
●
●
●
● ●
●
●
●
●
●
●
●
●
●
●
●
●
●
●
●
●
●
●
●●
●●
●
●
●
●
●
●
●
●
●
●
●
●
●
●
●
●
●●
●
●
●
●
●
●
●
●
●
●
●
●
●
●
●
●
●
●
●
●
●
●
●
●
●
●
●
●
●
●
●
●●
●
● ●
●
●
●
●
●
●
●
●
●
●
●
●
●
●
●
●
●
●
●
●
●
●
●●
●
●
●●
●
●
●
●
●
●
●
●
●
●
●
●
●
●
●
●
●
●
●●
●
●
●
●
●
●
●
●
●
●
●
●
●
●
●
●
●
●
●
●
●
●●●●
●
●
●
●
●
●
●
●●
●
●
●
●●
●
●
●
●
●
●
●●
●
●●
●●
●
●
●
● ●●
●
●●●
●
●
●
●
●●
●
●
●
●
●
●
●
● ● ●●
● ●
●
●●
●
●
●
●
●
●
●
●
●
●
●
●
●
●
●
●
●
●
●
●
●
●●
●
●
●
●
●
●
●
●
●
●
●
●
●
●
●
●
●
●● ●●●
●
●
●
●
●
●
● ●
●
●
●
●●
●
●
●
●
●
●
●
●
● ●●
●●
●
●
●
●
●
●●
●
●
●
●
●
●●
●
●
●
●●
●
●
●
● ●
●
●●
●
●
●
●
●
●
●
●
●
●
●
●
●
●
●●
●
●
●●● ●
●
●
●●
●
●
●●
● ●●
●
●
●
●
●
●
●
●
●
● ●●
●●
●
●●
●
●
●●
●
●
●
● ●
●
●
●
●
●
●
●
● ●
●
●
●
●
●
●
●●
●
●
●●
●●
●●
●
●
●
●
●
●
●●
●
●
●
●
●● ●
●
●
●
●
●
●
●●
●
●●
●
●
●
●
●
●
●
●
●
●
●
●
●
●
●
●●
●
●
●
●
●
●
●●
●
● ●
●
●
●
●
●
●
●●
●
●
●
●
●
●
●● ●
●●
●
●
●
●●
●
●
●●
● ●●
●
●
●●
●
● ●
●
●
●●
●
●
● ●
●
●
●
●
●
●
●
●
●●
●
●
●●
●●●
● ●●
●
●
●
●
●
●
●
●
●
●
●●
●●●
● ●●
●
●
● ● ● ●●●●
●
●
●●●
●
● ● ●●●●
●● ●
●
●
●
●
●
●
●
●●
●●
●
●●
● ● ●
●
●
●
●
●●
●●
●
●
●
●
●
●●
●●
●
●
●
●
●
●
●
●
●
●●
● ●● ●
●
●
●
● ●
●●●
●
●
●
●
●●
●
●
●
●
●
500
1000
1500
2000
Area (km2)
MA
P (
mm
yr−1
)
10 100 1000 10000 100000
●
●
●
●
●
●●
●
●
●
●●
●●
●
●
●●
●●
●●● ●
●
●● ●
●
●●●●
●
●
●
● ●●●●
●
●
●
●
●
●
●
●●
●●
● ●●
●
●
●
● ●●
●●
●
●
●
●
●
●
●
●
●
●●
●
●
Smaller Inter−mediate
Larger
Wetter
Medium
Drier
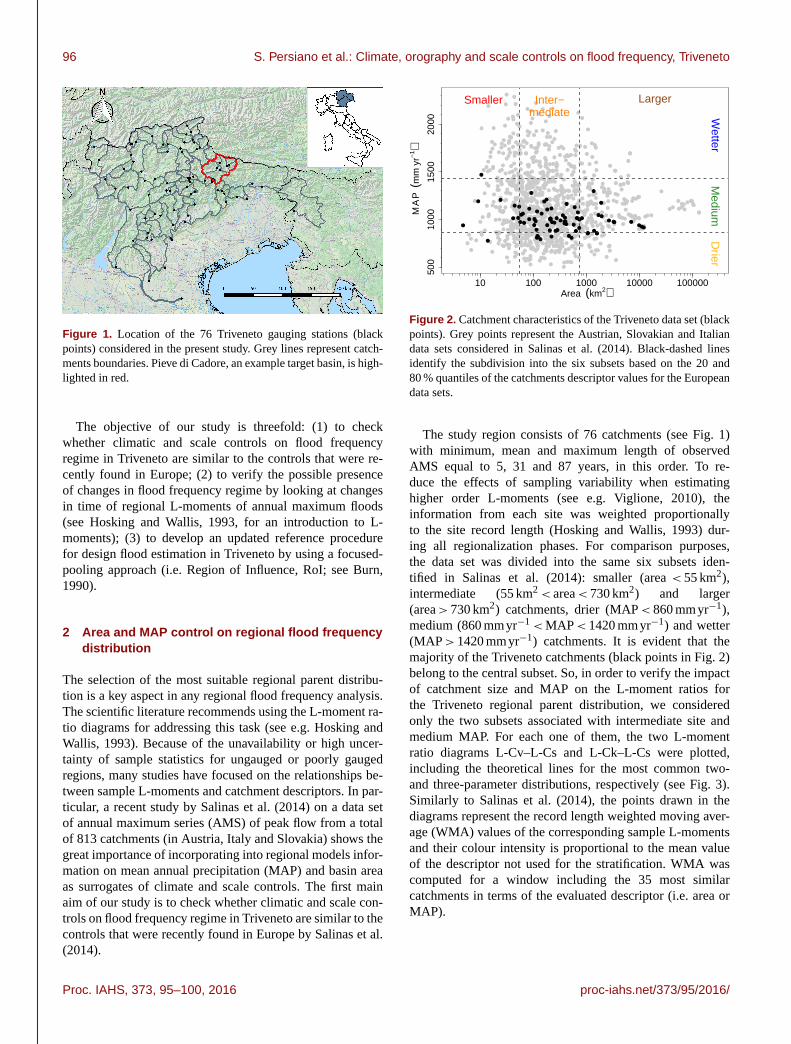
Figure 2. Catchment characteristics of the Triveneto data set (black
points). Grey points represent the Austrian, Slovakian and Italian
data sets considered in Salinas et al. (2014). Black-dashed lines
identify the subdivision into the six subsets based on the 20 and
80 % quantiles of the catchments descriptor values for the European
data sets.
The study region consists of 76 catchments (see Fig. 1)
with minimum, mean and maximum length of observed
AMS equal to 5, 31 and 87 years, in this order. To re-
duce the effects of sampling variability when estimating
higher order L-moments (see e.g. Viglione, 2010), the
information from each site was weighted proportionally
to the site record length (Hosking and Wallis, 1993) dur-
ing all regionalization phases. For comparison purposes,
the data set was divided into the same six subsets iden-
tified in Salinas et al. (2014): smaller (area < 55 km2),
intermediate (55 km2 < area < 730 km2) and larger
(area > 730 km2) catchments, drier (MAP < 860 mmyr−1),
medium (860 mmyr−1 < MAP < 1420 mmyr−1) and wetter
(MAP > 1420 mmyr−1) catchments. It is evident that the
majority of the Triveneto catchments (black points in Fig. 2)
belong to the central subset. So, in order to verify the impact
of catchment size and MAP on the L-moment ratios for
the Triveneto regional parent distribution, we considered
only the two subsets associated with intermediate site and
medium MAP. For each one of them, the two L-moment
ratio diagrams L-Cv–L-Cs and L-Ck–L-Cs were plotted,
including the theoretical lines for the most common two-
and three-parameter distributions, respectively (see Fig. 3).
Similarly to Salinas et al. (2014), the points drawn in the
diagrams represent the record length weighted moving aver-
age (WMA) values of the corresponding sample L-moments
and their colour intensity is proportional to the mean value
of the descriptor not used for the stratification. WMA was
computed for a window including the 35 most similar
catchments in terms of the evaluated descriptor (i.e. area or
MAP).
Proc. IAHS, 373, 95–100, 2016 proc-iahs.net/373/95/2016/
S. Persiano et al.: Climate, orography and scale controls on flood frequency, Triveneto 97
0.15 0.20 0.25 0.30 0.35
0.15
0.20
0.25
0.30
0.35
0.40
L −Cs
L−Cv
GUMEXPGAMLN2
(a)● ● ●●●●●●●●●●●●
●●●●●●●●●●●●● ●●●●●●
●●●●●●●●●●●●●●●●●●●●●●●●●●●●●●●●●●●●●●●●●●●
●●●●●●●●●●● ●●●●●●●●●●●●●●●●●●●●●●●●●●●●●●●●●●● ●●●●●●●●●●●●●●●●●●●●●●●●●●●●●●●
●●●●●●●●●●●●●●●●●
●●●●●●●●●●●●●●●●●●●●●●●●●●●●●●●●●●●●●●●●●●●●●●●●●●●●●●●●●●●●●●●●●●●●●●●●●●●●●●● ●●
●●●●●●●●●●●●●●●●
●●●●●●●●●●●●●●●●●●●●●●● ●●●●●●●●●●●●●●● ●●●●●●●●●●●●●●●●●●●●●
●●●●●●●●●●●●●● ●●●●●●●●●●●●●●●●●●●●●●●●●●●●●●●●●●● ●●●●●●
●●●●●●●●●●●●●●●●●●●
●●●●●●●●●●●●●●●●●●●●●●●●●
●●●●●●●●●●●●●●●●●●●●●●●●●●●●●●● ●●●
●●●●●●●●●●●●●●●●●●●●●●●●●●●●●●●●●●●●●●●●●
●●●●●●●●●●●●●●●●●●●●●●●●●●●●●●●●●●●●●●●●●●●
●●●●●●●●●●●●●●●●●●●●●●●●●●●● ●●●●
●●●●●●●●
●●●●
●●●
Intermediate600 1700MAP (mm yr−1)
0.15 0.20 0.25 0.30 0.35
0.15
0.20
0.25
0.30
0.35
0.40
L −Cs
L−Cv
GUMEXPGAMLN2
(b)Medium
30 20000Area (km2)
●●●●●●●●
●●●●●●●● ●●●●●●●●●●●●●●●●●●●●●●●●●●●●●●●●●●●● ●●●●●●●●●●●●●●●●●●●●●●●●●● ●●●●●
●●●●●●●●●●●●●●●●●●
●●●●●●●●●●●●●●●●●●●●●● ●●●●●●
●●●●●●●●●●●●●●●●●●●●●●● ●●●●●●●●●●●●●●●●●●●●●●●●●●●●●●●●●●●●●●●
●●●●●●●●●●●●●●●●●●●●●
●●●●●●●●●●●
● ●●●●●●●● ●●●●●●●●●●●●●●●●●●●●●●●●●●●●●●●●●●●●●●●●●●● ●●●●●●●●●●●●●●●
●●●●●●●●●●●● ●●●●●
●●● ●●
●●●●●●●●●●●●●●●●
●●●●● ●●●●●●●●●●●●●●●●●●●●●●●●●●●●●●●●●●●●●
●● ●●●●●●●●●●●●●●●●●●●●●●●●●●●●●●●●●●●●●●●●
●●●●●●●●● ●●●●●●●●●●●●● ●●● ●●●●● ●●●●●●●●●●●●●●●●●●●●●●●●●●●●●●●●●●●●●●●●●●●●
●●●●●●●●●●●●●●●●●●●●
●●●●●●●●●●●●●●●●●●●●●●●●●●●
●●●●●●●●●●●●●●●●●●●●●●●●●●●●
●●●
●●●●●●
●●●
● ●●● ●●
●●●●●●
●●●●●
0.15 0.20 0.25 0.30 0.35
0.16
0.18
0.20
0.22
0.24
0.26
L −Cs
L−Ck
GEVGLOLN3PE3
●
●●●●●●●●
●●●●●●
●●●●●
●●●
●●●
●●●
●●
●●●● ●●
●●●●●●●
●●
●●●●●●
●●●
●●●
●●
●
●●●
●●●●●●
●●●
● ●●
●●●●●
●●●
●●●
●●●
●●●
●●●
●●
●●●
●●●
●●●
●●●●
●●●●●
●●●
●●●
●●●●●●
●●
●●●
●●●●●●●
●●
●●●
●●●
●●
●●●●●●
●●●●
●●
●●●●●
●●●●●●●
●●●
●●●●
●●●
●●●●●●●
●●●●●●●●●●
●●●
●
●●●
●●
●
●●●●●●●●
●●●
●●
●●●●●●●
●●●●●●●
●●●●●●●●●●●
●●●●
●●●●
●●●●●●
●●●●
●●●●●●●●●
●●●●●●
●
●●●
●●●●
●●●●●●
●●●●●●
●●● ●●
●●●●●●●●
●●
●●●●●●●
●● ●●
●●●
●
●●●●●●●●
●●
●●●●●●●●●
●●●●●●
●●●●●●●
●●●●●●●●●●●
●●●●●●
●●●●●●●●
●●●●
●●●●
●●●●
●●●
●●●●●
●●●●●●
●●●●●●●●●
●●●●●
●
●●●●
●●●●
●●
●
●●●●●
●●●●
●●●●●● ●●●●●●●●●●●
●●●
●●●
●●
●●
●●
●●●●●●●●●●●●●●
●●●
●●●●●●●
●●●
●●
●●●
●●●
●●●
●
●●●●●
●●●●
●●●●●●●●
●●●
●●●●●●●●●●●
●●●●●●●●
●●●
●●●●
●●●
●●●●
●●●●
●●
●●
●●●●
●●
●●●
●
●
(c)Intermediate
600 1700MAP (mm yr−1)
0.15 0.20 0.25 0.30 0.35
0.16
0.18
0.20
0.22
0.24
0.26
L −Cs
L−Ck
GEVGLOLN3PE3
●●●
●●●●●
●●●●
●●●●
●●●
●●●●●●
●●●●●
●●●
●
●●●●●
●●
●●●●●
●●●●●● ●●
●●
●●
●●●
●●●●
●●●●
●●●●
●●●●●
●●
●●
●●●●●●●●
●●●●
●●●
●●●●
●●●●●●●●●●●●●●
●●●●●●●●●●●●●
●●●
●●●●●●●
●●●
●●●●●●●●●
●●
●
●●●●●●
●●●
●●●
●●●●
●●
●●●●●●●
●●●●●●●●
●●●●●●●●●●
●●●●
●●●
●
●●●●●●●●●●●●
●●●●●●●●
●●●
●●
●●
●
●●
●●●●
●●●●
●●●●●●●
●●●●●●
●●●
●●●
●●●
●●●●●●●●●●●
●●●●
●●●●●●
●●
●●●●●●●
●●●●●
●●●
●●●●●
●●●
●●●●
●
●●●●●●●●●
●●●●●
●●●● ●●●●●●●●●●●●●●●●●●●
●●●●●●●●●●●●●●●●
●●●●
●●●●●
●●●●●●●●
●●●●
●●●●●●●
●●●●●●●●
●●●●●●●●
●
●●
●●●●●●
●●●
●●●●●
●●●●● ●
●●
●●●●
●●●●●
●●●●●●●
●●●
●●●●
●●●●●●●
●●●●●●●●●
●●●●●●●●
●●●
●●
●●●●●
●●
●●
●●●
●●●●
●●
●●●●●●●
●●●
●●●
●●
●●●●●●●●
●●●
●●●●●●●●●●●●●●●
●●●●
●●●●●●●●●
●●
●
●●●●
●
●● ●●
●
● ●● ●●●
●●●
●●
●
●●●
●
Medium
30 20000Area (km2)
(d)
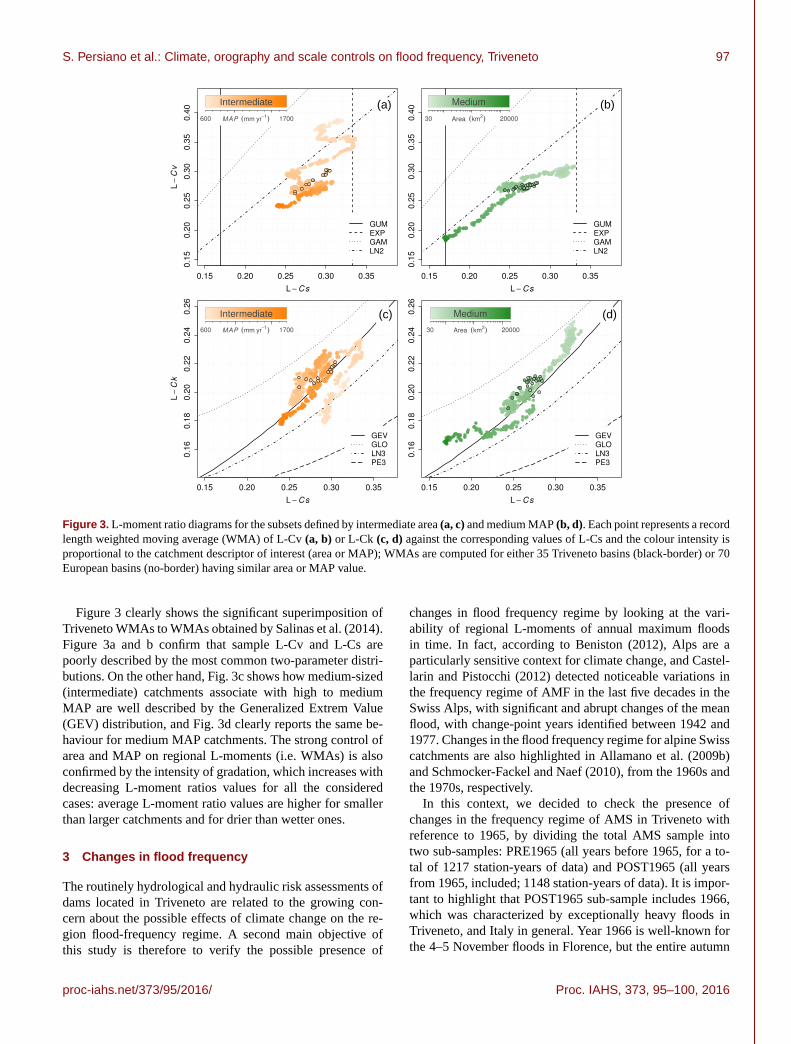
Figure 3. L-moment ratio diagrams for the subsets defined by intermediate area (a, c) and medium MAP (b, d). Each point represents a record
length weighted moving average (WMA) of L-Cv (a, b) or L-Ck (c, d) against the corresponding values of L-Cs and the colour intensity is
proportional to the catchment descriptor of interest (area or MAP); WMAs are computed for either 35 Triveneto basins (black-border) or 70
European basins (no-border) having similar area or MAP value.
Figure 3 clearly shows the significant superimposition of
Triveneto WMAs to WMAs obtained by Salinas et al. (2014).
Figure 3a and b confirm that sample L-Cv and L-Cs are
poorly described by the most common two-parameter distri-
butions. On the other hand, Fig. 3c shows how medium-sized
(intermediate) catchments associate with high to medium
MAP are well described by the Generalized Extrem Value
(GEV) distribution, and Fig. 3d clearly reports the same be-
haviour for medium MAP catchments. The strong control of
area and MAP on regional L-moments (i.e. WMAs) is also
confirmed by the intensity of gradation, which increases with
decreasing L-moment ratios values for all the considered
cases: average L-moment ratio values are higher for smaller
than larger catchments and for drier than wetter ones.
3 Changes in flood frequency
The routinely hydrological and hydraulic risk assessments of
dams located in Triveneto are related to the growing con-
cern about the possible effects of climate change on the re-
gion flood-frequency regime. A second main objective of
this study is therefore to verify the possible presence of
changes in flood frequency regime by looking at the vari-
ability of regional L-moments of annual maximum floods
in time. In fact, according to Beniston (2012), Alps are a
particularly sensitive context for climate change, and Castel-
larin and Pistocchi (2012) detected noticeable variations in
the frequency regime of AMF in the last five decades in the
Swiss Alps, with significant and abrupt changes of the mean
flood, with change-point years identified between 1942 and
1977. Changes in the flood frequency regime for alpine Swiss
catchments are also highlighted in Allamano et al. (2009b)
and Schmocker-Fackel and Naef (2010), from the 1960s and
the 1970s, respectively.
In this context, we decided to check the presence of
changes in the frequency regime of AMS in Triveneto with
reference to 1965, by dividing the total AMS sample into
two sub-samples: PRE1965 (all years before 1965, for a to-
tal of 1217 station-years of data) and POST1965 (all years
from 1965, included; 1148 station-years of data). It is impor-
tant to highlight that POST1965 sub-sample includes 1966,
which was characterized by exceptionally heavy floods in
Triveneto, and Italy in general. Year 1966 is well-known for
the 4–5 November floods in Florence, but the entire autumn
proc-iahs.net/373/95/2016/ Proc. IAHS, 373, 95–100, 2016
98 S. Persiano et al.: Climate, orography and scale controls on flood frequency, Triveneto
0.15 0.20 0.25 0.30 0.35
0.16
0.18
0.20
0.22
0.24
0.26
L − Cs
L−
Ck
GEVGLOLN3PE3
●●
●
●●●
PRE1965POST1965POST1965 without 1966
●●●●●●●●●●●●●●●●
●●●●●●●●●●●●●●●●●●●●●●●●●●●●●●●●●●●●●●●●●●
●●●●●●●●●●●●●●●●●●●●●●●●●●●●●●●●●●●●●●●●●●●●●●●●●●●●●●●●●●●●●●●●●●
●●●●●●●●●●●●●●●●●●●●●●●●●●●●●●●●●●●●●●●●●●●●●●●●●●●●●●●●●●●●●●●●●●●●●●●●●●●●●●●●●●●●●●●●●●●●●●●●●●●●●●
●●●●●●●●●●●●●●●●●●●●●●●●●●●●●●●●●●●●●●●●●●●●●●●●●●●●●●●●●●●●●●●●●●●●●●●●●●●●●●●●●●●●●●●●●●●●●●●●●●●●●
●●●●●●●●●●●●●●●●●●●●●●●●●●●●●●●●●●●●●●●●●●●●●●●●●●●●●●●●●●●●●●●●●●●●●●●●●●●●●●●●●●●●●●●●●●●●●●●●●●●●●●●●●●●●●●●●●●●●●●●●●●●●●●●●●●●●●●●●●●●●
●●●●●●●●●●●●●●●●●●●●●●●●●●●●●●●●●●●●●●●●●●●●●●●●●●●●●●●●●●●●●●●●●●●●●●●●●●●●●●●●●●●●●●●●●●●●●●●
●●●●●●●●●●●●●●●●●●●●●●●●●●●●●●●●●●●●●●●●●●●●●●●●●●●●●●●●●●●●●●●●●●●●●●●●●●●●●●●
●●●●●●●●●●●●●●●●●●●●●●●●●●●●●●●●●●●●●●●●●●●●●●●●●●●●●●●●●●●●●●●●●●●●●●
●●●●●●●●●●●●●●●●●●●●●●●●●●●●●●●●●●●●●●●●●●●●●●●●●●●●●●●●●●●●●●●
●●●●●●●●●●●●●●●●●●●●●●●●●●●●●●●●●●●●●●●●●●●●●●●●●●●●●●●
●●●●●●●●●●●●●●●●●●●●●●●●●●●●●●●●●●●●●
●●●●●●●●●●●●●●●●●●●●●●●●●●●●●●●●●
●●●●●●●●●●●●●●●●●
●●●●●●●●●●●●●●●●●●●●●●●●●●●●●●
●●●●●●●●●●●●●
●●●●●●●●●●
●●●●●●●●●●●●●●
●●●●●●●●
●●● ● ●
●
−1 0 1 2 3 4 5
01
23
4
Reduced variate, − log(− log(F))
Qua
ntile
2 5 10 20 50 100 200
Return period
PRE1965, GLOPOST1965, LN3POST1965 without 1966, LN3
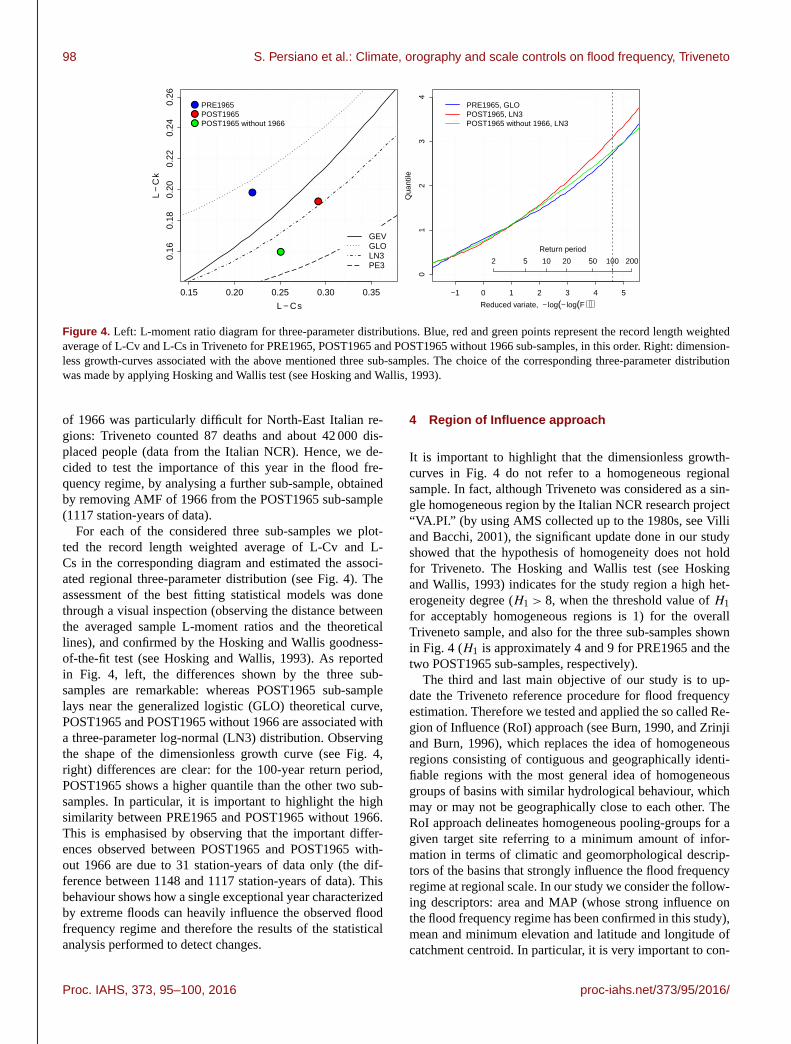
Figure 4. Left: L-moment ratio diagram for three-parameter distributions. Blue, red and green points represent the record length weighted
average of L-Cv and L-Cs in Triveneto for PRE1965, POST1965 and POST1965 without 1966 sub-samples, in this order. Right: dimension-
less growth-curves associated with the above mentioned three sub-samples. The choice of the corresponding three-parameter distribution
was made by applying Hosking and Wallis test (see Hosking and Wallis, 1993).
of 1966 was particularly difficult for North-East Italian re-
gions: Triveneto counted 87 deaths and about 42 000 dis-
placed people (data from the Italian NCR). Hence, we de-
cided to test the importance of this year in the flood fre-
quency regime, by analysing a further sub-sample, obtained
by removing AMF of 1966 from the POST1965 sub-sample
(1117 station-years of data).
For each of the considered three sub-samples we plot-
ted the record length weighted average of L-Cv and L-
Cs in the corresponding diagram and estimated the associ-
ated regional three-parameter distribution (see Fig. 4). The
assessment of the best fitting statistical models was done
through a visual inspection (observing the distance between
the averaged sample L-moment ratios and the theoretical
lines), and confirmed by the Hosking and Wallis goodness-
of-the-fit test (see Hosking and Wallis, 1993). As reported
in Fig. 4, left, the differences shown by the three sub-
samples are remarkable: whereas POST1965 sub-sample
lays near the generalized logistic (GLO) theoretical curve,
POST1965 and POST1965 without 1966 are associated with
a three-parameter log-normal (LN3) distribution. Observing
the shape of the dimensionless growth curve (see Fig. 4,
right) differences are clear: for the 100-year return period,
POST1965 shows a higher quantile than the other two sub-
samples. In particular, it is important to highlight the high
similarity between PRE1965 and POST1965 without 1966.
This is emphasised by observing that the important differ-
ences observed between POST1965 and POST1965 with-
out 1966 are due to 31 station-years of data only (the dif-
ference between 1148 and 1117 station-years of data). This
behaviour shows how a single exceptional year characterized
by extreme floods can heavily influence the observed flood
frequency regime and therefore the results of the statistical
analysis performed to detect changes.
4 Region of Influence approach
It is important to highlight that the dimensionless growth-
curves in Fig. 4 do not refer to a homogeneous regional
sample. In fact, although Triveneto was considered as a sin-
gle homogeneous region by the Italian NCR research project
“VA.PI.” (by using AMS collected up to the 1980s, see Villi
and Bacchi, 2001), the significant update done in our study
showed that the hypothesis of homogeneity does not hold
for Triveneto. The Hosking and Wallis test (see Hosking
and Wallis, 1993) indicates for the study region a high het-
erogeneity degree (H1 > 8, when the threshold value of H1
for acceptably homogeneous regions is 1) for the overall
Triveneto sample, and also for the three sub-samples shown
in Fig. 4 (H1 is approximately 4 and 9 for PRE1965 and the
two POST1965 sub-samples, respectively).
The third and last main objective of our study is to up-
date the Triveneto reference procedure for flood frequency
estimation. Therefore we tested and applied the so called Re-
gion of Influence (RoI) approach (see Burn, 1990, and Zrinji
and Burn, 1996), which replaces the idea of homogeneous
regions consisting of contiguous and geographically identi-
fiable regions with the most general idea of homogeneous
groups of basins with similar hydrological behaviour, which
may or may not be geographically close to each other. The
RoI approach delineates homogeneous pooling-groups for a
given target site referring to a minimum amount of infor-
mation in terms of climatic and geomorphological descrip-
tors of the basins that strongly influence the flood frequency
regime at regional scale. In our study we consider the follow-
ing descriptors: area and MAP (whose strong influence on
the flood frequency regime has been confirmed in this study),
mean and minimum elevation and latitude and longitude of
catchment centroid. In particular, it is very important to con-
Proc. IAHS, 373, 95–100, 2016 proc-iahs.net/373/95/2016/
S. Persiano et al.: Climate, orography and scale controls on flood frequency, Triveneto 99
0.15 0.20 0.25 0.30 0.35
0.16
0.18
0.20
0.22
0.24
0.26
L − Cs
L−
Ck
GEVGLOLN3PE3
●●
●
●
●●●●
PRE1965POST1965POST1965 without 1966Total RoI sample
−1 0 1 2 3 4 5
01
23
45
Reduced variate, − log(− log(F))
Qua
ntile
2 5 10 20 50 100 200
Return period
● ●●●●●●●●●●
●●●●●●●●
●●●●●●●●●
●●●●●
●●●●●
●●●●
●●
● ●
●
●
●●
●
●
PRE1965, GLOPOST1965, GEVPOST1965 without 1966, LN3Total RoI sample, GLOAMS at Pieve di Cadore1966 AMF at Pieve di Cadore
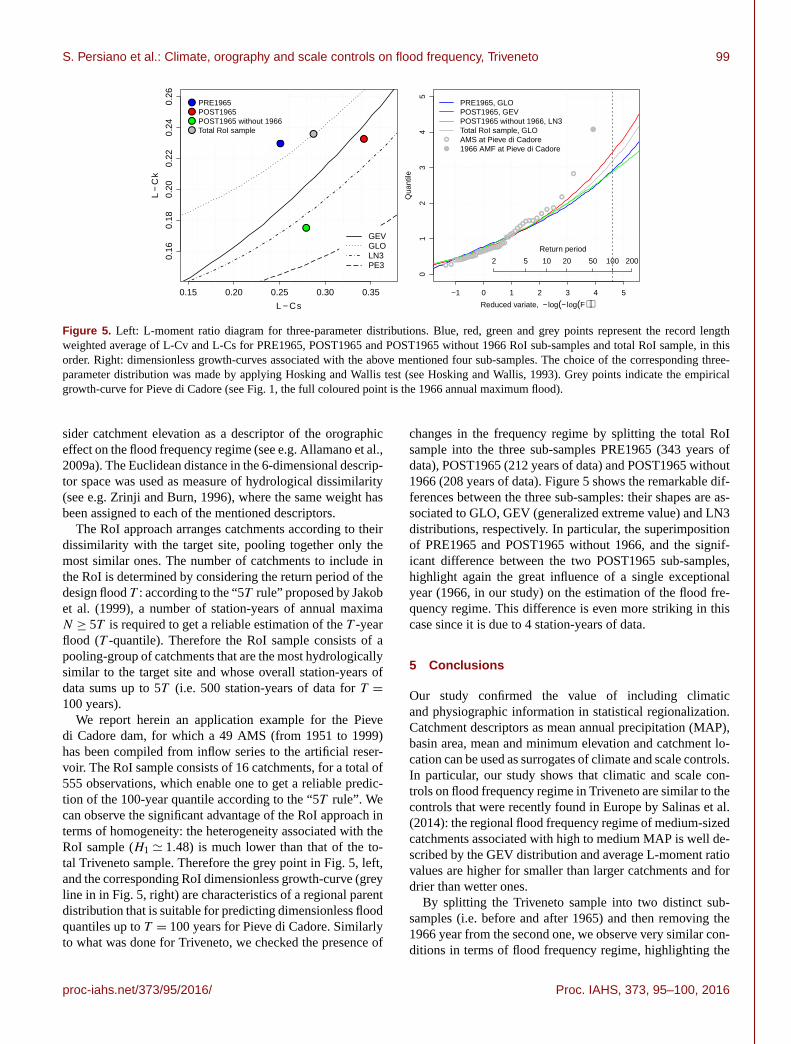
Figure 5. Left: L-moment ratio diagram for three-parameter distributions. Blue, red, green and grey points represent the record length
weighted average of L-Cv and L-Cs for PRE1965, POST1965 and POST1965 without 1966 RoI sub-samples and total RoI sample, in this
order. Right: dimensionless growth-curves associated with the above mentioned four sub-samples. The choice of the corresponding three-
parameter distribution was made by applying Hosking and Wallis test (see Hosking and Wallis, 1993). Grey points indicate the empirical
growth-curve for Pieve di Cadore (see Fig. 1, the full coloured point is the 1966 annual maximum flood).
sider catchment elevation as a descriptor of the orographic
effect on the flood frequency regime (see e.g. Allamano et al.,
2009a). The Euclidean distance in the 6-dimensional descrip-
tor space was used as measure of hydrological dissimilarity
(see e.g. Zrinji and Burn, 1996), where the same weight has
been assigned to each of the mentioned descriptors.
The RoI approach arranges catchments according to their
dissimilarity with the target site, pooling together only the
most similar ones. The number of catchments to include in
the RoI is determined by considering the return period of the
design flood T : according to the “5T rule” proposed by Jakob
et al. (1999), a number of station-years of annual maxima
N ≥ 5T is required to get a reliable estimation of the T -year
flood (T -quantile). Therefore the RoI sample consists of a
pooling-group of catchments that are the most hydrologically
similar to the target site and whose overall station-years of
data sums up to 5T (i.e. 500 station-years of data for T =
100 years).
We report herein an application example for the Pieve
di Cadore dam, for which a 49 AMS (from 1951 to 1999)
has been compiled from inflow series to the artificial reser-
voir. The RoI sample consists of 16 catchments, for a total of
555 observations, which enable one to get a reliable predic-
tion of the 100-year quantile according to the “5T rule”. We
can observe the significant advantage of the RoI approach in
terms of homogeneity: the heterogeneity associated with the
RoI sample (H1 ' 1.48) is much lower than that of the to-
tal Triveneto sample. Therefore the grey point in Fig. 5, left,
and the corresponding RoI dimensionless growth-curve (grey
line in in Fig. 5, right) are characteristics of a regional parent
distribution that is suitable for predicting dimensionless flood
quantiles up to T = 100 years for Pieve di Cadore. Similarly
to what was done for Triveneto, we checked the presence of
changes in the frequency regime by splitting the total RoI
sample into the three sub-samples PRE1965 (343 years of
data), POST1965 (212 years of data) and POST1965 without
1966 (208 years of data). Figure 5 shows the remarkable dif-
ferences between the three sub-samples: their shapes are as-
sociated to GLO, GEV (generalized extreme value) and LN3
distributions, respectively. In particular, the superimposition
of PRE1965 and POST1965 without 1966, and the signif-
icant difference between the two POST1965 sub-samples,
highlight again the great influence of a single exceptional
year (1966, in our study) on the estimation of the flood fre-
quency regime. This difference is even more striking in this
case since it is due to 4 station-years of data.
5 Conclusions
Our study confirmed the value of including climatic
and physiographic information in statistical regionalization.
Catchment descriptors as mean annual precipitation (MAP),
basin area, mean and minimum elevation and catchment lo-
cation can be used as surrogates of climate and scale controls.
In particular, our study shows that climatic and scale con-
trols on flood frequency regime in Triveneto are similar to the
controls that were recently found in Europe by Salinas et al.
(2014): the regional flood frequency regime of medium-sized
catchments associated with high to medium MAP is well de-
scribed by the GEV distribution and average L-moment ratio
values are higher for smaller than larger catchments and for
drier than wetter ones.
By splitting the Triveneto sample into two distinct sub-
samples (i.e. before and after 1965) and then removing the
1966 year from the second one, we observe very similar con-
ditions in terms of flood frequency regime, highlighting the
proc-iahs.net/373/95/2016/ Proc. IAHS, 373, 95–100, 2016
100 S. Persiano et al.: Climate, orography and scale controls on flood frequency, Triveneto
remarkable influence that a single exceptional year (1966)
can have in the representation of flood frequency regime.
Finally, our update of Triveneto AMS data set falsified
the main assumption of the current reference procedure for
design-flood estimation in Triveneto (see Villi and Bacchi,
2001), showing that the study region is not homogeneous in
terms of flood frequency regime. Therefore, we developed
an updated reference procedure by using the Region of Influ-
ence (RoI) approach. The RoI approach delineates homoge-
neous pooling-groups of sites for any given target site refer-
ring to selected climatic and geomorphological descriptors
that are particularly relevant for describing regional flood fre-
quency (e.g. the ones listed above). We observe that the re-
gional sample obtained through the RoI approach for Pieve
di Cadore (used as an example) is characterized by a homo-
geneity degree which is much higher than the Triveneto one,
and shows no differences between past and present flood fre-
quency regime, confirming again the great importance of the
flood information collected in the exceptional year 1966 for
correctly representing the site flood frequency distribution.
Acknowledgements. The study is part of the research activities
carried out by the working group: Anthropogenic and Climatic Con-
trols on WateR AvailabilitY (ACCuRAcY) of Panta Rhei – Every-
thing Flows Change in Hydrology and Society (IAHS Scientific
Decade 2013–2022).
References
Allamano, P., Claps, P., and Laio, F.: An analytical model of the ef-
fects of catchment elevation on the flood frequency distribution,
Water Resour. Res., 45, W01402, doi:10.1029/2007WR006658,
2009a.
Allamano, P., Claps, P., and Laio, F.: Global warming increases
flood risk in mountainous areas, Geophys. Res. Lett., 36,
L24404, doi:10.1029/2009GL041395, 2009b.
Beniston, M.: Impacts of climatic change on water and associated
economic activities in the Swiss Alps, J. Hydrology, 412–413,
291–296, doi:10.1016/j.jhydrol.2010.06.046, 2012.
Burn, D. H.: Evaluation of regional flood frequency analysis with
a region of influence approach, Water Resour. Res., 26, 2257,
doi:10.1029/WR026i010p02257, 1990.
Castellarin, A. and Pistocchi, A.: An analysis of change in
alpine annual maximum discharges: implications for the se-
lection of design discharges, Hydrol. Process., 26, 1517–1526,
doi:10.1002/hyp.8249, 2012.
Hosking, J. R. M. and Wallis, J. R.: Some statistics useful in re-
gional frequency analysis, Water Resour. Res., 29, 271–281,
doi:10.1029/92WR01980, 1993.
Jakob, D., Reed, D. W., and Robson, A. J.: Choosing a pooling-
group, in: Flood Estimation Handbook, Institute of Hydrology,
Wallingford, UK, Volume 3, 1999.
Salinas, J. L., Castellarin, A., Kohnová, S., and Kjeldsen, T. R.: Re-
gional parent flood frequency distributions in Europe – Part 2:
Climate and scale controls, Hydrol. Earth Syst. Sci., 18, 4391–
4401, doi:10.5194/hess-18-4391-2014, 2014.
Schmocker-Fackel, P. and Naef, F.: Changes in flood frequencies in
Switzerland since 1500, Hydrol. Earth Syst. Sci., 14, 1581–1594,
doi:10.5194/hess-14-1581-2010, 2010.
Viglione, A.: Confidence intervals for the coefficient of L-variation
in hydrological applications, Hydrol. Earth Syst. Sci., 14, 2229–
2242, doi:10.5194/hess-14-2229-2010, 2010.
Villi, V. and Bacchi, B.: Valutazione delle piene nel Triveneto,
CNR-GNDCI, Padova-Brescia, Italia, 2001.
Zrinji, Z. and Burn, D. H.: Regional Flood Frequency with Hierar-
chical Region of Influence, J. Water Res. Pl.-ASCE, 122, 245–
252, 1996.
Proc. IAHS, 373, 95–100, 2016 proc-iahs.net/373/95/2016/