Embed Size (px)
Citation preview
Climate of Antarctica 1
Climate of Antarctica
Surface temperature of Antarctica in winter andsummer from the European Centre for
Medium-Range Weather Forecasts
The climate of Antarctica is the coldest on the whole of Earth.Antarctica has the lowest naturally occurring temperature everrecorded on the surface on Earth: −89.2°C (−128.6°F) at VostokStation. Satellites have recorded even lower temperatures, down to-93.2°C(-135.8°F). It is also extremely dry (technically a desert),averaging 166mm (6.5in) of precipitation per year. On most parts ofthe continent the snow rarely melts and is eventually compressed tobecome the glacial ice that makes up the ice sheet. Weather frontsrarely penetrate far into the continent. Most of Antarctica has an icecap climate (Köppen EF) with very cold, generally extremely dryweather.
TemperatureThe lowest reliably measured temperature of a continuously occupied station on Earth of −89.2 °C (−128.6 °F) wason 21 July 1983 at Vostok Station.[1] For comparison, this is 10.7 °C (19.3 °F) colder than subliming dry ice (at sealevel pressure). The altitude of the location is 3,900 meters (12,800 feet).The lowest recorded temperature of any location on Earth surface was −93.2 °C (−135.8 °F) at 81.8°S 59.3°E [2],which is on an unnamed Antarctic plateau between Dome A and Dome F, on August 10, 2010. The temperature wasdeduced from radiance measured by the Landsat 8 satellite, and discovered during a National Snow and Ice DataCenter review of stored data in December, 2013. This temperature is not directly comparable to the -89.2 quotedabove, since it is a skin temperature deduced from satellite-measured upwelling radiance, rather than athermometer-measured temperature of the air 1.5m above the ground surface.The highest temperature ever recorded in Antarctica was 14.6°C (58.3°F) in two places, Hope Bay and VandaStation, on 5 January 1974. The mean annual temperature of the interior is −57°C (−70°F). The coast is warmer.Monthly means at McMurdo Station range from −26°C (−14.8°F) in August to −3°C (26.6°F) in January.[3] At theSouth Pole, the highest temperature ever recorded was −12.3°C (9.9°F) on 25 December 2011. Along the AntarcticPeninsula, temperatures as high as 15°C (59°F) have been recorded,Wikipedia:Please clarify though the summertemperature is below 0°C (32°F)in most time. Severe low temperatures vary with latitude, elevation, and distancefrom the ocean. East Antarctica is colder than West Antarctica because of its higher elevation.Wikipedia:Citationneeded The Antarctic Peninsula has the most moderate climate. Higher temperatures occur in January along the coastand average slightly below freezing.

Climate of Antarctica 2
Precipitation
Map of average annual precipitation onAntarctica (mm liquid equivalent)
The total precipitation on Antarctica, averaged over the entirecontinent, is about 166 mm (6.5 in) per year (Vaughan et al., J Climate,1999). The actual rates vary widely, from high values over thePeninsula (meters/yards per year) to very low values (as little as50 mm (2 in) per year) in the high interior. Areas that receive less than250 mm (10 in) of precipitation per year are classified as deserts.Almost all Antarctic precipitation falls as snow. Note that the quotedprecipitation is a measure of its equivalence to water, rather than beingthe actual depth of snow. The air in Antarctica is also very dry. Thelow temperatures result in a very low absolute humidity, which meansthat dry skin and cracked lips are a continual problem for scientists andexpeditioners working in the continent.
Weather condition classification
The weather in Antarctica can be highly variable,and the weatherconditions can often change dramatically in short periods of time. There are three classifications for describingweather conditions in Antarctica. At least one of the following criteria must be met for each category describedbelow:Condition 1
Windspeed over 55 knots (100 km/h)Visibility less than 30 metres (98 ft)Wind chill below −73 °C (−99 °F)Description: Dangerous conditions; outside travel is not permitted.
Condition 2Windspeed of 48 to 55 knots (90 to 100 km/h)Visibility 400 to 30 metres (1/4 of a mile to 100 feet)Wind chill of −60 °C (−76 °F) to −73 °C (−99 °F)Description: Unpleasant conditions; outside travel is permitted but not recommended.
Condition 3Windspeed below 48 knots (90 km/h)Visibility greater than 400 metres (1/4 of a mile)Wind chill above −60 °C (−76 °F)Description: Pleasant conditions; all outside travel is permitted.
Ice coverNearly all of Antarctica is covered by an ice sheet that is, on average, at least a mile thick (1.6 km). Antarctica contains 90% of the world's ice and more than 70% of its fresh water. If all the land-ice covering Antarctica were to melt — around 30 million cubic kilometres of ice — the seas would rise by over 60 metres. This is, however, very unlikely within the next few centuries. The Antarctic is so cold that even with increases of a few degrees, temperatures would generally remain below the melting point of ice. Warmer temperatures are expected to lead to more snow, which would increase the amount of ice in Antarctica, offsetting approximately one third of the expected
Climate of Antarctica 3
sea level rise from thermal expansion of the oceans. During a recent decade, East Antarctica thickened at an averagerate of about 1.8 centimetres per year while West Antarctica showed an overall thinning of 0.9 centimetres peryear.[4] For the contribution of Antarctica to present and future sea level change, see sea level rise. Because iceflows, albeit slowly, the ice within the ice sheet is younger than the age of the sheet itself.
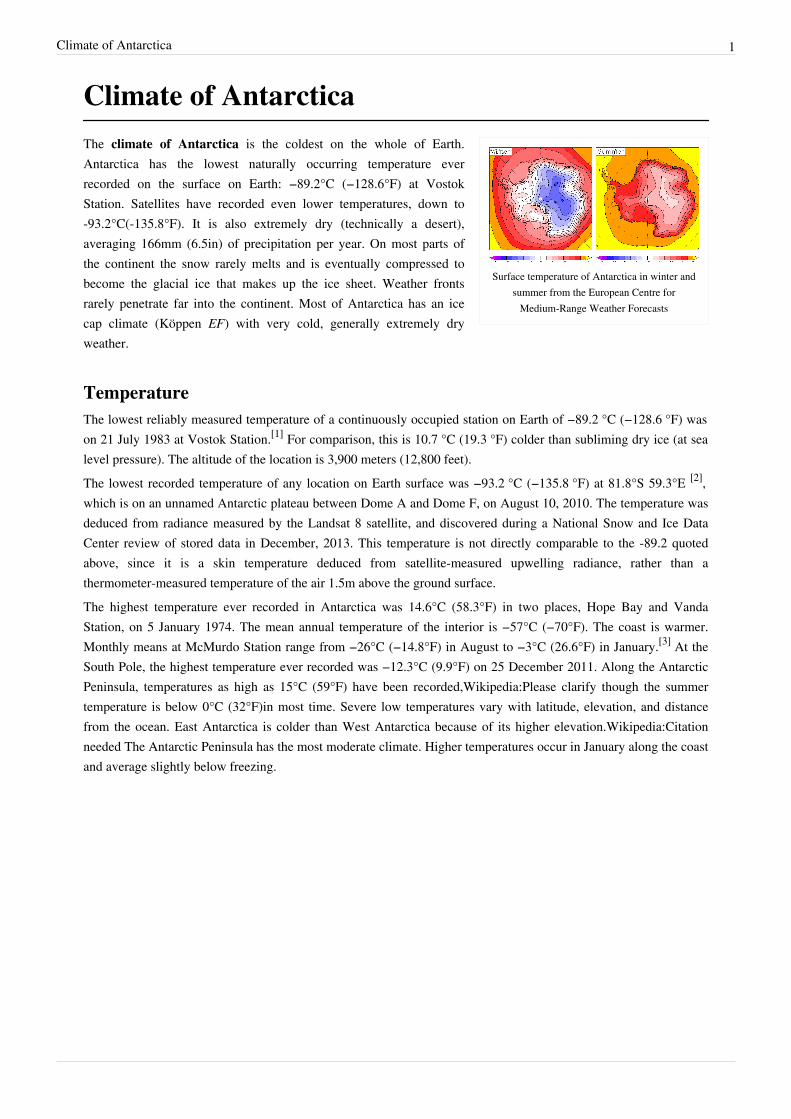
Morphometric data for Antarctica (from Drewry, 1983)
Surface Area(km²)
Percent Mean icethickness
(m)
Volume(km³)
Percent
Inland ice sheet 11,965,700 85.97 2,450 29,324,700 97.39
Ice shelves 1,541,710 11.08 475 731,900 2.43
Ice rises 78,970 .57 670 53,100 .18
Glacier ice (total) 13,586,380 2,160 30,109,800¹
Rock outcrop 331,690 2.38
Antarctica (total) 13,918,070 100.00 2,160 30,109,800¹ 100.00
¹The total ice volume is different from the sum of the component parts because individual figures have been rounded.
Regional ice data (from Drewry and others, 1982; Drewry, 1983)
Region Area(km²)
Meanice
thickness(m)
Volume(km³)
East Antarctica
Inland ice 9,855,570 2,630 25,920,100
Ice shelves 293,510 400 117,400
Ice rises 4,090 400 1,600
West Antarctica (excluding Antarctic Peninsula)
Inland ice sheet 1,809,760 1,780 3,221,400
Ice shelves 104,860 375 39,300
Ice rises 3,550 375 1,300
Antarctic Peninsula
Inland ice sheet 300,380 610 183,200
Ice shelves 144,750 300 43,400
Ice rises 1,570 300 500
Ross Ice Shelf
Ice shelf 525,840 427 224,500
Ice rises 10,320 500 5,100
Filchner-Ronne Ice Shelf
Ice shelf 472,760 650 307,300
Ice rises 59,440 750 44,600

Climate of Antarctica 4
Ice shelves
Antarctic ice shelves, 1998
Most of the coastline of Antarctica is ice shelves (floating ice sheet) orice walls (grounded ice). Melting or breakup of floating shelf ice doesnot affect global sea levels, and happens regularly as shelves grow.Known changes in coastline ice:
•• Around the Antarctic Peninsula:• 1936–1989: Wordie Ice Shelf significantly reduced in size.• 1995: Prince Gustav Channel no longer blocked by ice. Last
open from about 1900 years ago to 6500 years ago, probably dueto warmth during the Holocene Climatic Optimum.
• Parts of the Larsen Ice Shelf broke up in recent decades.•• 1995: The Larsen A ice shelf disintegrated in January 1995.
•• 2001: 3,250 km² of the Larsen B ice shelf disintegrated in February 2001. It had been gradually retreatingbefore the breakup event.
The George VI Ice Shelf, which may be on the brink of instability,[5] has probably existed for approximately 8000years, after melting 1500 years earlier.[6] Warm ocean currents may have been the cause of the melting. The idea thatit was warmer in Antarctica 10,000 years ago is supported by ice cores, though the timing is not quite right.
Climate change
Antarctic Skin Temperature Trends between 1981 and 2007, based on thermalinfrared observations made by a series of NOAA satellite sensors. Skin
temperature trends do not necessarily reflect air temperature trends.
The continent-wide average surfacetemperature trend of Antarctica is positiveand significant at >0.05°C/decade since1957.[7][8][9][10] The West Antarctic icesheet has warmed by more than0.1°C/decade in the last 50 years, and isstrongest in winter and spring. Although thisis partly offset by fall cooling in EastAntarctica, this effect is restricted to the1980s and 1990s.
Research published in 2009 found thatoverall the continent had become warmersince the 1950s, a finding consistent withthe influence of man-made climate change:
"We can't pin it down, but it certainlyis consistent with the influence ofgreenhouse gases from fossil fuels",said NASA scientist Drew Shindell,another study co-author. Some of theeffects also could be naturalvariability, he said.[11]
The British Antarctic Survey, which has undertaken the majority of Britain's scientific research in the area, has thefollowing positions: [12]
• Ice makes polar climate sensitive by introducing a strong positive feedback loop.

Climate of Antarctica 5
•• Melting of continental Antarctic ice could contribute to global sea level rise.• Climate models predict more snowfall than ice melting during the next 50 years, but models are not good enough
for them to be confident about the prediction.•• Antarctica seems to be both warming around the edges and cooling at the center at the same time. Thus it is not
possible to say whether it is warming or cooling overall.• There is no evidence for a decline in overall Antarctic sea ice extent.[13]
•• The central and southern parts of the west coast of the Antarctic Peninsula have warmed by nearly 3°C. The causeis not known.
•• Changes have occurred in the upper atmosphere over Antarctica.
September 20, 2007 NASA map showing previously un-meltedsnowmelt
The area of strongest cooling appears at the South Pole,and the region of strongest warming lies along theAntarctic Peninsula. A possible explanation is that lossof UV-absorbing ozone may have cooled thestratosphere and strengthened the polar vortex, apattern of spinning winds around the South Pole. Thevortex acts like an atmospheric barrier, preventingwarmer, coastal air from moving into the continent'sinterior. A stronger polar vortex might explain thecooling trend in the interior of Antarctica. [14]
In their latest study (September 20, 2007) NASAresearchers have confirmed that Antarctic snow ismelting farther inland from the coast over time, meltingat higher altitudes than ever and increasingly meltingon Antarctica's largest ice shelf.[15]
There is also evidence for widespread glacierretreat[16] around the Antarctic Peninsula.[17]
Researchers reported December 21, 2012 in NatureGeoscience that from 1958 to 2010, the average temperature at the mile-high Byrd Station rose by 2.4 degreesCelsius, with warming fastest in its winter and spring. The spot which is in the heart of the West Antarctic Ice Sheetis one of the fastest-warming places on Earth.[18][19]
References[1] http:/ / wmo. asu. edu/ world-lowest-temperature[2] http:/ / tools. wmflabs. org/ geohack/ geohack. php?pagename=Climate_of_Antarctica& params=81. 8_S_59. 3_E_dim:10000km[3] Antarctica Climate Data and Climate Graphs (http:/ / www. coolantarctica. com/ Antarctica fact file/ antarctica environment/ climate_graph/
vostok_south_pole_mcmurdo. htm)[4] Davis et al., Science 2005 Snowfall-Driven Growth in East Antarctic Ice Sheet Mitigates Recent Sea-Level Rise, Science, 24 June 2005: Vol.
308 no. 5730 pp. 1898-1901[5] Millennial-scale variability of George VI Ice Shelf, Antarctic Peninsula (http:/ / www. antarctica. ac. uk/ BAS_Science/ Highlights/ 2001/
george_vi. html)[6] http:/ / igloo. gsfc. nasa. gov/ wais/ pastmeetings/ abstracts00/ Bentley2. htm[7] Retrieved=2009-01-22 (http:/ / climatechangepsychology. blogspot. com/ 2009/ 01/ eric-j-steig-temperature-in-west. html)[8] Retrieved=2009-01-22 (http:/ / www. ess. washington. edu/ web/ ess/ people/ faculty_bio/ steig-bio. html)[9] Retrieved=2009-01-22 (http:/ / www. nature. com/ nature/ journal/ v457/ n7228/ full/ nature07669. html)[10] Retrieved=2009-01-22 (http:/ / news. smh. com. au/ breaking-news-world/
global-warming-hitting-all-of-antarctica-scientists-20090122-7mul. html)[11] Antarctica study challenges warming skeptics (http:/ / www. msnbc. msn. com/ id/ 28693329/ ns/ us_news-environment/ t/
antarctica-study-challenges-warming-skeptics/ #. T1Rp_d2dyAs), Jan 21, 2009[12] http:/ / www. antarctica. ac. uk/ Key_Topics/ Climate_Change/ Climate_Change_Position. html

Climate of Antarctica 6
[13] In Antarctica, melting may beget ice; Disintegration of floating glaciers could be responsible for freezing of seawater (http:/ / www.sciencenews. org/ view/ generic/ id/ 349277/ description/ In_Antarctica_melting_may_beget_ice) March 29, 2013 Vol.183 #9 Science News
[14] http:/ / earthobservatory. nasa. gov/ Newsroom/ NewImages/ images. php3?img_id=17257[15] "NASA Researchers Find Snowmelt in Antarctica Creeping Inland" September 20, 2007 (http:/ / www. nasa. gov/ centers/ goddard/ news/
topstory/ 2007/ antarctic_snowmelt. html)[16] http:/ / toolserver. org/ %7Edispenser/ cgi-bin/ dab_solver. py?page=Climate_of_Antarctica& editintro=Template:Disambiguation_needed/
editintro& client=Template:Dn[17] IPCC 2007, Intergovernmental Panel on Climate Change, Climate Change 2007: The Physical Science Basis. Contribution of Working
Group I to the Fourth Assessment Report of the Intergovernmental Panel on Climate Change (http:/ / www. ipcc. ch/ pdf/ assessment-report/ar4/ wg1/ ar4-wg1-chapter4. pdf), Cambridge University Press, 2007, page 376.
[18] West Antarctica warming fast; Temperature record from high-altitude station shows unexpectedly rapid rise (http:/ / www. sciencenews.org/ view/ generic/ id/ 347241/ description/ West_Antarctica_warming_fast) December 21, 2012 Science News
[19] Figure 1: Map of Antarctica and annual spatial footprint of the Byrd temperature record. (http:/ / www. nature. com/ ngeo/ journal/ v6/ n2/fig_tab/ ngeo1671_F1. html)
Notes• D. G. Vaughan, G. J. Marshall, W. M. Connolley, J. C. King, and R. M. Mulvaney (2001). "Devil in the detail".
Science 293 (5536): 1777–9. doi: 10.1126/science.1065116 (http:/ / dx. doi. org/ 10. 1126/ science. 1065116).PMID 11546858 (http:/ / www. ncbi. nlm. nih. gov/ pubmed/ 11546858).
• M.J. Bentley, D.A. Hodgson, D.E. Sugden, S.J. Roberts, J.A. Smith, M.J. Leng, C. Bryant (2005). "EarlyHolocene retreat of the George VI Ice Shelf, Antarctic Peninsula". Geology 33 (3): 173–6. Bibcode:2005Geo....33..173B (http:/ / adsabs. harvard. edu/ abs/ 2005Geo. . . . 33. . 173B). doi: 10.1130/G21203.1 (http:/ /dx. doi. org/ 10. 1130/ G21203. 1).
External links
Climate• Climate data from Antarctic surface stations with trends (http:/ / www. antarctica. ac. uk/ met/ gjma/ )• Temperature data from the READER project (http:/ / www. antarctica. ac. uk/ met/ READER/ )• A pamphlet about the weather and climate of Antarctica (http:/ / www. antarctica. ac. uk/ met/ jds/ weather/
weather. htm)• Information concerning recent ice shelf [[Ice calving|calving (http:/ / www. antarctica. ac. uk/ met/ bas_publ.
html)]]• (unreliable) maps of snowfall and temperature (http:/ / www. antarctica. ac. uk/ met/ climate/ wmc/ )• Temperature statistics at the Amundsen-Scott station on the South Pole (http:/ / wayback. archive. org/ web/
20120229073011/ http:/ / www. nerc-bas. ac. uk/ icd/ gjma/ pole. temps. html)• Warmer temperatures, more snow... (http:/ / www. science. org. au/ nova/ 082/ 082key. htm) Australian Academy
of Science• Antarctica's central ice cap grows while glaciers melt (http:/ / sfgate. com/ cgi-bin/ article. cgi?f=/ c/ a/ 2005/ 05/
20/ MNGS9CS5141. DTL& type=science)• "AWS and AMRC Real-Time Weather Observations and Data" (http:/ / amrc. ssec. wisc. edu/ realtime. html).
University of Wisconsin-Madison's Antarctic Weather Stations Project and Antarctic Meteorological ResearchCenter. Retrieved May 31, 2005.
• Antarctica Climate and Weather (http:/ / www. coolantarctica. com/ Antarctica fact file/ antarctica environment/climate_graph/ climate_weather. htm)

Climate of Antarctica 7
Climate change in Antarctica• http:/ / www. antarctica. ac. uk/ Key_Topics/ Climate_Change/ Climate_Change_Position. html Wikipedia:Link
rot• http:/ / www. antarctica. ac. uk/ Key_Topics/ IceSheet_SeaLevel/ ice_shelf_loss. html Wikipedia:Link rot• Western Antarctica warming confirmed (http:/ / www. usatoday. com/ story/ tech/ sciencefair/ 2012/ 12/ 23/
antarctica-warming-global/ 1782829/ ) December 23, 2012 USA Today
Antarctic ice• "Sea Ice Index – Trends in extent – Southern Hemisphere (Antarctic)" (http:/ / www. nsidc. org/ data/
seaice_index/ ). National Snow and Ice Data Center. Retrieved Jan 9, 2009.• "Coastal-Change and Glaciological Maps of Antarctica" (http:/ / pubs. usgs. gov/ fs/ 2005/ 3055/ ). USGS Fact
Sheet 2005–3055. Retrieved May 31, 2005.• "Coastal-Change and Glaciological Maps of Antarctica" (http:/ / pubs. usgs. gov/ fs/ fs50-98/ ). USGS Fact Sheet
050–98. Retrieved February 28, 2005.• "Coastal-change and glaciological map of the Eights Coast area, Antarctica; 1972–2001" (http:/ / pubs. usgs.
gov/ imap/ 2600/ E). U.S. Geological Survey Scientific Investigations Series Map, I-2600-E. RetrievedFebruary 28, 2005.
• "Coastal-change and glaciological map of the Bakutis Coast area, Antarctica; 1972–2002" (http:/ / pubs. usgs.gov/ imap/ 2600/ F). U.S. Geological Survey Scientific Investigations Series Map, I-2600-F. RetrievedFebruary 28, 2005.
• "Coastal-change and glaciological map of the Saunders Coast area, Antarctica; 1972–1997" (http:/ / pubs.usgs. gov/ imap/ 2600/ G). U.S. Geological Survey Scientific Investigations Series Map, I-2600-G. RetrievedFebruary 28, 2005.
• "Satellite Image Atlas of Glaciers of the World – Antarctica" (http:/ / pubs. usgs. gov/ prof/ p1386b/ ). U.S.Geological Survey Professional Paper 1386-B. Retrieved February 28, 2005.
Further reading• Warm Snap Turned Antarctica Green Around the Edges; Thawed-out continent was lined with trees 15 million
years ago, study says. (http:/ / news. nationalgeographic. com/ news/ 2012/ 06/120620-green-antarctica-trees-global-warming-science-ancient/ ) June 20, 2012 National Geographic
• Taking Antarctica's temperature; Frozen continent may not be immune to global warming (http:/ / www.sciencenews. org/ view/ feature/ id/ 351507/ description/ Taking_Antarcticas_temperature) July 27, 2013;Vol.184 #2 Science News

Article Sources and Contributors 8
Article Sources and ContributorsClimate of Antarctica Source: https://en.wikipedia.org/w/index.php?oldid=610209185 Contributors: -Midorihana-, 1to0to-1, 3centsoap, A.amitkumar, Accurizer, Achowat, Addshore,Aetheling, Agalyon, AjitPD, Alan Liefting, Alansohn, Anaxial, Anna Frodesiak, Anna512, Ante.mijic, Antiqueight, Ardonik, ArielGold, Arthur Rubin, AsceticRose, Austin512, Avoided, Beland,Betacommand, Bgwhite, BitterMan, Blanchardb, Bobblewik, Bogey97, Bongwarrior, Bouette, Brunton, Brusegadi, Bullzeye, Burntsauce, Canpop, Cboyfan1, ChadThomson, Chester Markel,Chris the speller, Christian75, Chupon, Circeus, Closedmouth, CogitoErgoSum14, Cohesion, Coolguy911, Courcelles, Courtaz, CoyneT, CrazyC83, CsDix, CurtisSwain, Cyclopia, Cynical,DAK4Blizzard, DARTH SIDIOUS 2, Darth Panda, Dave souza, Daven200520, Davnor, Decoolguy, Denisarona, Dfrg.msc, Disambigutron, Discospinster, Dittaeva, DiverDave, Domitori,Donner60, DoorsAjar, Dotconnect, Dspradau, Duncan.france, Dysepsion, Dzordzm, Earlypsychosis, Edward, Ego White Tray, Elm-39, EuroCarGT, Evil Monkey,Fairytaleswithunicornsandrainbows, Faithlessthewonderboy, Faizan, Festive Butz, Fig wright, Fikri, Fireaxe888, Flyer22, Fplay, Fraggle81, France3470, Freakmighty, Fredrik, Frze, GaiusCornelius, Geonarva, Gilliam, Glane23, Guttlekraw, Guy Macon, Gökhan, H3nrik3sommer, HMSSolent, Halowand, Hammersoft, HexaChord, Hike395, Hmains, Hot Kafe, Howcheng,HueSatLum, Hurricane111, I dream of horses, Icystar181, Id5276, Iketsi, Ivanelo, Ja 62, Jackol, Jeffjnet, Jianhui67, John Cline, Johnminerson, Jonverve, Joseph Solis in Australia, Joyous!,Juliancolton, Jun73521, K6ka, Kairos, Katalaveno, Keta, KimDabelsteinPetersen, Kingpin13, Krenair, Krusty627, L Kensington, LanthanumK, LeaveSleaves, Legotech, Lieutenant of Melkor,Lightmouse, Logan, Lulu of the Lotus-Eaters, MONGO, Mariordo, Materialscientist, Matt Heard, Maurreen, McGeddon, McSaucePaste, Mendaliv, Mentifisto, Michael Hardy, Michael Shields,Mike Peel, Mild Bill Hiccup, Musical Linguist, Muu-karhu, N5iln, NCdave, NJA, Nasa-verve, NatureA16, Nilli, NinjadudeXD, Njardarlogar, Nonewmail, Ondewelle, One Ton Depot,One-dimensional Tangent, PBP, PL290, Phanly, PhilKnight, Philip Trueman, Pinethicket, Prokaryotes, Prophet0014, Quadell, Quizimodo, R dash4057, RA0808, RDBrown, Racerx11, Rdsmith4,RedWolf, Regibox, Rich Farmbrough, Rjwilmsi, Rling, Rmhermen, Robofish, Rsrikanth05, RyanJones, SEWilco, Sagredo, Salvio giuliano, Secret Squïrrel, SevanMilis, Sfoske70, Shadowjams,Shell Kinney, SilentBobxy2, Skizzik, Skyezx, Snow Blizzard, Sonicyouth86, StephenHudson, Stevertigo, Strangerer, Suite Pete, Sweettooth, SwisterTwister, TAKASUGI Shinji, THEN WHOWAS PHONE?, Tanvir Ahmmed, Tarquin, Telecineguy, Teles, The Red, The Thing That Should Not Be, Tinndel, Tohd8BohaithuGh1, Tommyc15rocks, Trieste, Tznkai, U340, Undescribed,UniReb, Varenilus, Vieque, Vsmith, Ward3001, Wavelength, Who, Widr, William Avery, William M. Connolley, Wombatvvv, Wordysworth, Wshun, Wsiegmund, Wyatt915, Wælgæst wæfre,Ybbor, Yintan, Yowanvista, 七 战 功 成, 538 anonymous edits
Image Sources, Licenses and ContributorsFile:Antarctic surface temperature.png Source: https://en.wikipedia.org/w/index.php?title=File:Antarctic_surface_temperature.png License: GNU Free Documentation License Contributors:EugeneZelenko, Maxim Razin, Tano4595, Verdy p, W!B:, 1 anonymous editsFile:File-Dgv-surfbal-1.gif Source: https://en.wikipedia.org/w/index.php?title=File:File-Dgv-surfbal-1.gif License: GNU Free Documentation License Contributors: William M. Connolley(talk)File:Antarctica ice shelves.gif Source: https://en.wikipedia.org/w/index.php?title=File:Antarctica_ice_shelves.gif License: Public Domain Contributors: Original uploader was SEWilco aten.wikipediaImage:Antarctic Temperature Trend 1981-2007.jpg Source: https://en.wikipedia.org/w/index.php?title=File:Antarctic_Temperature_Trend_1981-2007.jpg License: Public Domain Contributors: Robert SimmonImage:Antarctic Ice Melt-First Year.jpg Source: https://en.wikipedia.org/w/index.php?title=File:Antarctic_Ice_Melt-First_Year.jpg License: Public Domain Contributors: NASA/RobSimmon
LicenseCreative Commons Attribution-Share Alike 3.0//creativecommons.org/licenses/by-sa/3.0/