Embed Size (px)
Citation preview
Climate MRV for Africa – Phase 2
Development of National GHG Inventory
Land Representation
Project of the European Commission
DG Clima Action EuropeAid/136245/DH/SER/MULTI
Tomasz Kowalczewski, Paolo Prosperi Forestry Experts 2017
Lead partner
Outline
The managed land
Key categories
Representation of lands
Practical excesses
The Managed Land Proxy
In 2003 the IPCC reported that the scientific
community cannot currently provide a
practicable methodology that would factor out
direct human-induced effects from indirect
human-induced and natural effects for any broad
range of LULUCF activities and circumstances
Therefore the IPCC (in the 2003) adopted the use
of estimates of GHG emissions and removals on
managed land as a proxy for the estimation of
anthropogenic emissions and removals
Rationale and assumptions underlying the
managed land proxy
The distinction between anthropogenic and natural emissions is clear
in most sectors apart from LULUCF / AFOLU.
Estimating all carbon stock changes in LULUCF/AFOLU would capture
management, all disturbances, indirect anthropogenic effects and
natural processes, IPCC guidelines provides appropriate details on
how to estimate these stock changes.
Although the effects of particular factors may be estimated, because
of interactions it is less clear if it is possible to apportion the total
carbon stock change uniquely to individual drivers (e.g. possible
biomass increases or decreases driven by differing management
regimes, age distribution of forests, natural disturbances, CO2 and
nitrogen fertilisation etc.).
Rationale and assumptions underlying the managed land proxy
The IPCC guidelines recommend using emissions and removals
from managed land as a proxy for anthropogenic emissions and
removals
Anthropogenic emissions and removals means that greenhouse
gas emissions and removals included in national inventories are a
result of human activities.
The distinction between natural and anthropogenic emissions and
removals follows straightforwardly from the data used to quantify
human activity.
In the Agriculture, Forestry and Other Land Use (AFOLU) Sector,
emissions and removals on managed land are taken as a proxy for
anthropogenic emissions and removals, and interannual variations
in natural background emissions and removals, though these can
be significant, are assumed to average out over time.
(2006 Guidelines Vol. 1 Ch. 1 Page 1.4)
Rationale and assumptions underlying the managed land proxy
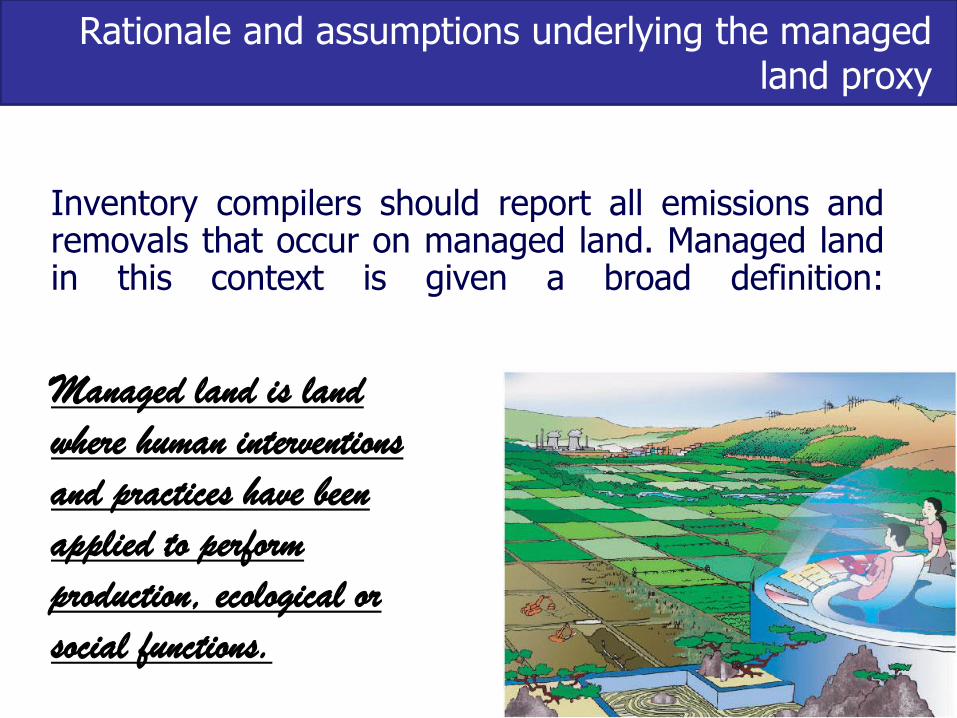
Inventory compilers should report all emissions and removals that occur on managed land. Managed land in this context is given a broad definition:
Managed land is land
where human interventions
and practices have been
applied to perform
production, ecological or
social functions.
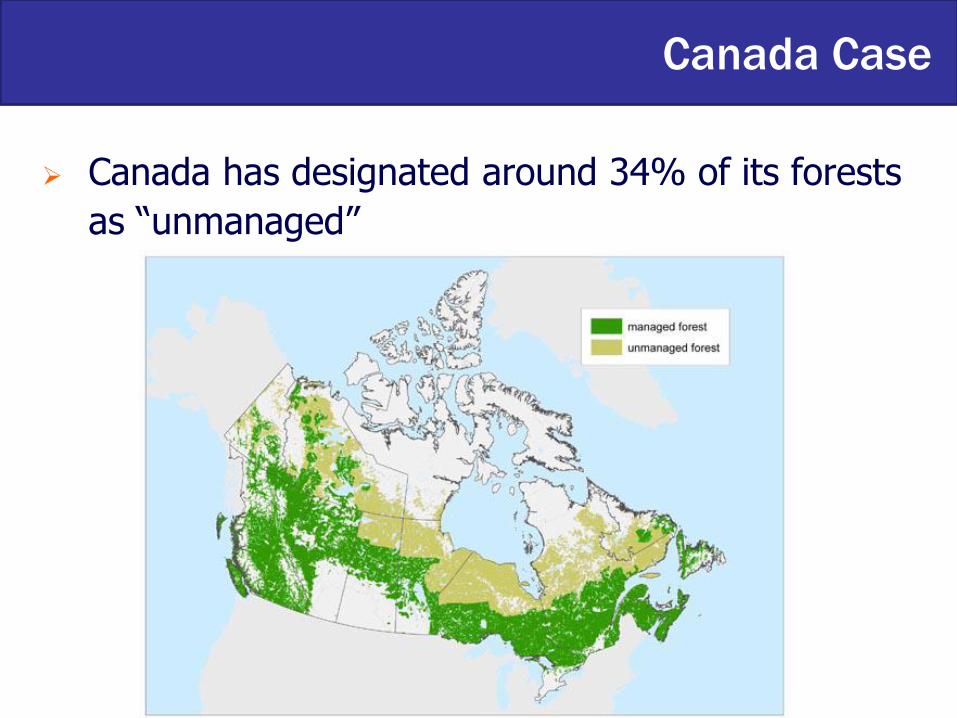
Canada Case
Canada has designated around 34% of its forests
as “unmanaged”
IPCC 2006 guidelines- assistance
IPCC 2006 assists Parties in identifying the key categories:
land categories (e.g. forest land, cropland, etc.)
gases (CO2, CH4 and N2O)
carbon pools (living biomass, dead organic matter and soil organic carbon).
The decision trees given in IPCC 2006 could be adopted:
Decision trees at two levels of disaggregation:
Land remaining in the same land-use category (e.g. forest land remaining forest land)
Land converted to another land-use category (e.g. grassland converted to forest).
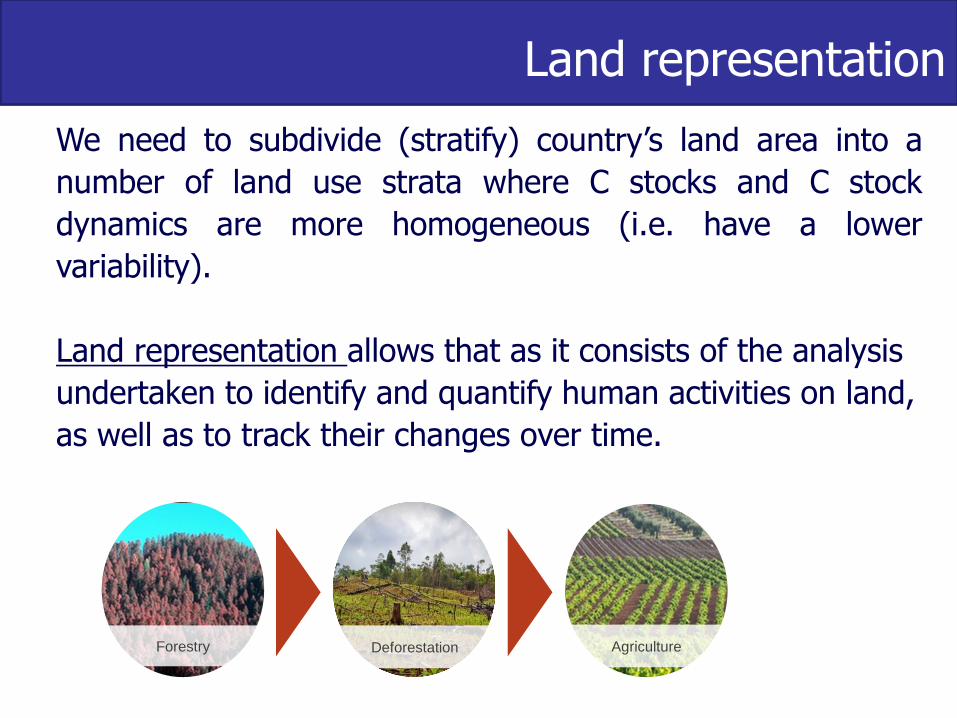
Land representation
We need to subdivide (stratify) country’s land area into a
number of land use strata where C stocks and C stock
dynamics are more homogeneous (i.e. have a lower
variability).
Land representation allows that as it consists of the analysis
undertaken to identify and quantify human activities on land,
as well as to track their changes over time.
Forestry Deforestation Agriculture
Activity (in terms of land representation refers to): A practice or system of practices that take place on a delineated area over a given period of time. Land representation: the analysis undertaken to identify and quantify human activities on land, as well as to track their changes over time. Its result is a stratification of the total area of the country according to a number of variables with the purpose of making the GHG inventory compilation practicable while enhancing the accuracy of GHG estimates Strata (singular stratum): a stratum is a homogeneous population (e.g. vegetation, management practices) with respect to one or more of the variables. Unit of land: a unit of land corresponds to a stratum
Definitions
Land Representation
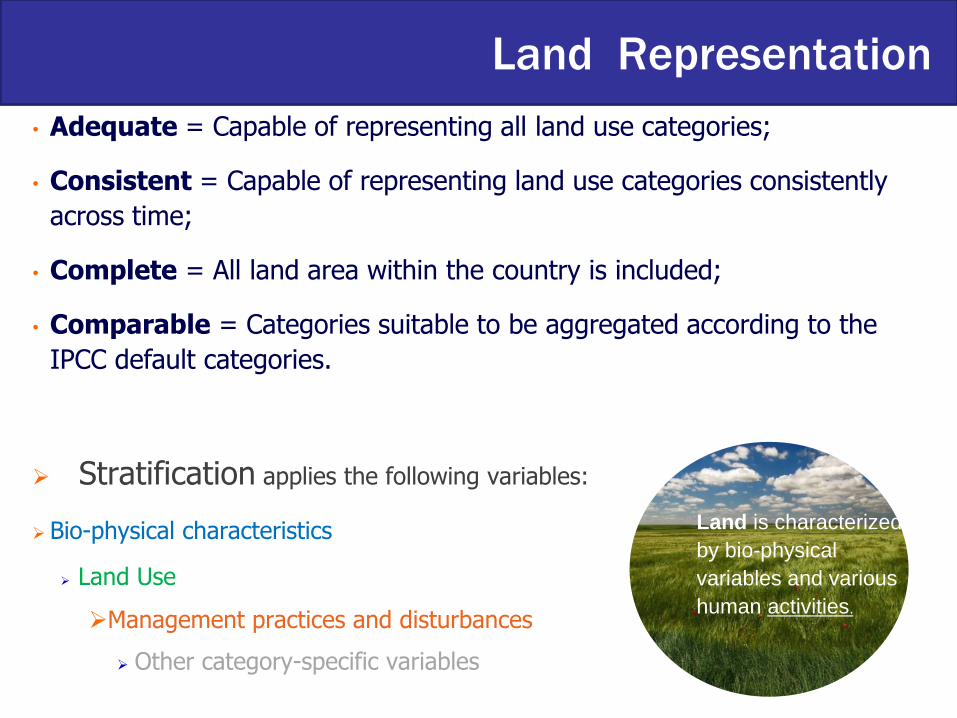
• Adequate = Capable of representing all land use categories;
• Consistent = Capable of representing land use categories consistently
across time;
• Complete = All land area within the country is included;
• Comparable = Categories suitable to be aggregated according to the
IPCC default categories.
Stratification applies the following variables:
Bio-physical characteristics
Land Use
Management practices and disturbances
Other category-specific variables
Land is characterized
by bio-physical
variables and various
human activities.
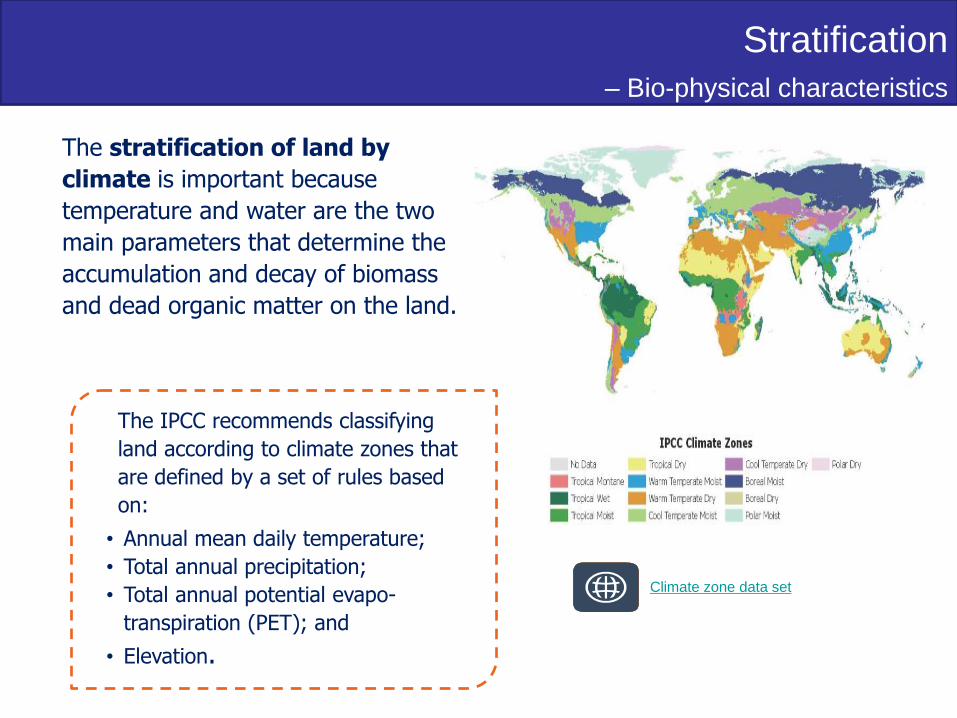
The stratification of land by
climate is important because
temperature and water are the two
main parameters that determine the
accumulation and decay of biomass
and dead organic matter on the land.
Climate zone data set
The IPCC recommends classifying
land according to climate zones that
are defined by a set of rules based
on:
• Annual mean daily temperature;
• Total annual precipitation;
• Total annual potential evapo-
transpiration (PET); and
• Elevation.
Stratification
– Bio-physical characteristics
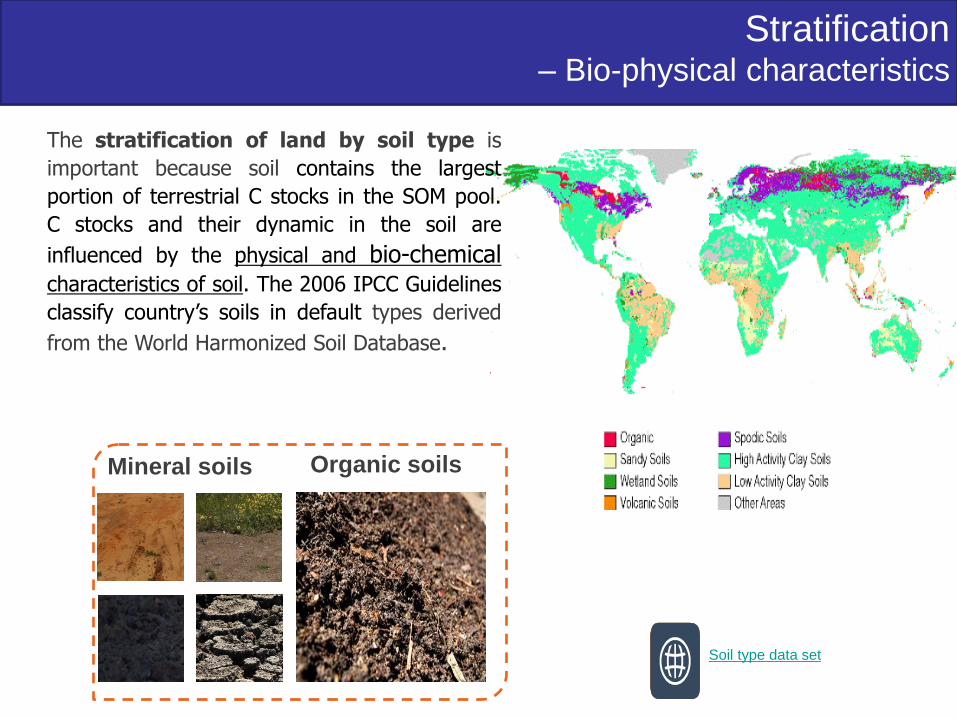
The stratification of land by soil type is
important because soil contains the largest
portion of terrestrial C stocks in the SOM pool.
C stocks and their dynamic in the soil are
influenced by the physical and bio-chemical characteristics of soil. The 2006 IPCC Guidelines
classify country’s soils in default types derived
from the World Harmonized Soil Database.
Soil type data set
Mineral soils Organic soils
Stratification – Bio-physical characteristics
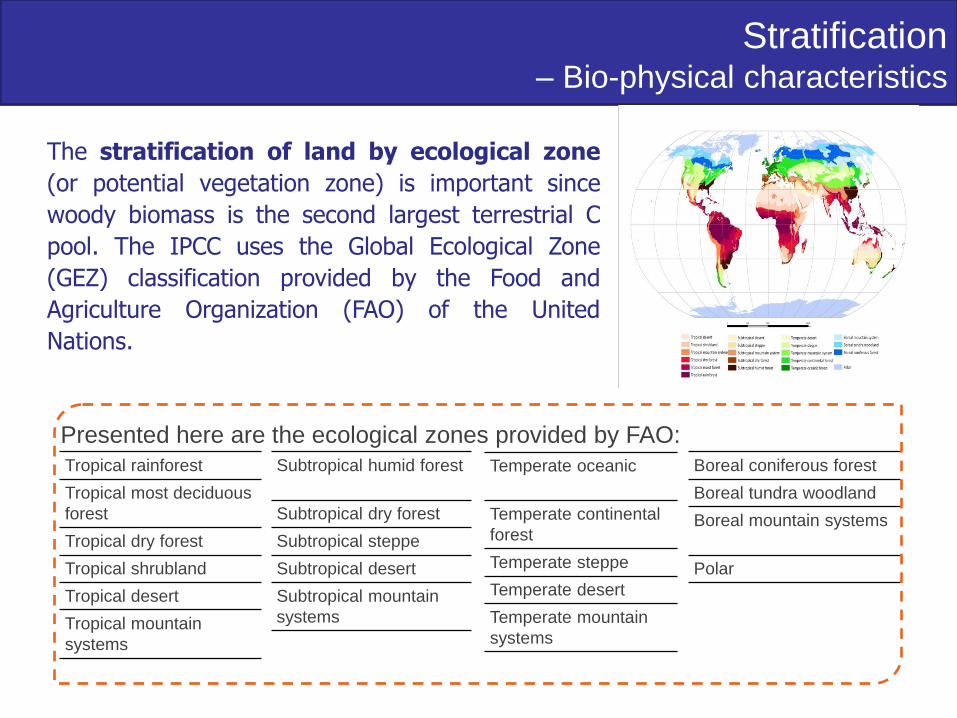
The stratification of land by ecological zone
(or potential vegetation zone) is important since
woody biomass is the second largest terrestrial C
pool. The IPCC uses the Global Ecological Zone
(GEZ) classification provided by the Food and
Agriculture Organization (FAO) of the United
Nations.
Presented here are the ecological zones provided by FAO:
Tropical rainforest
Tropical most deciduous
forest
Tropical dry forest
Tropical shrubland
Tropical desert
Tropical mountain
systems
Subtropical humid forest
Subtropical dry forest
Subtropical steppe
Subtropical desert
Subtropical mountain
systems
Temperate oceanic
Temperate continental
forest
Temperate steppe
Temperate desert
Temperate mountain
systems
Boreal coniferous forest
Boreal tundra woodland
Boreal mountain systems
Polar
Stratification
– Bio-physical characteristics
Stratification – Land use
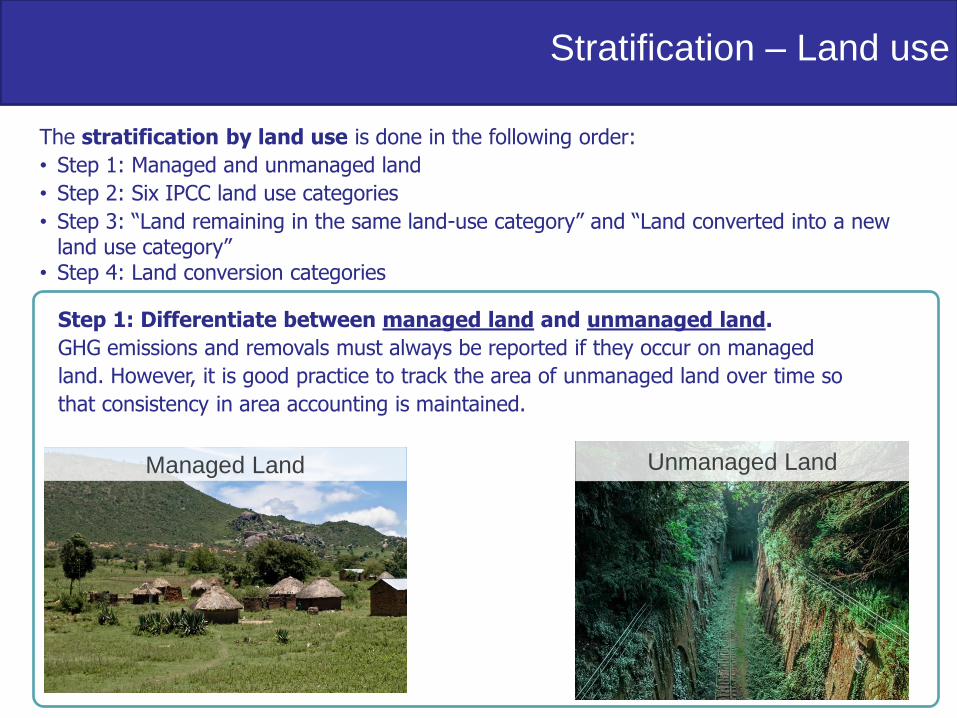
The stratification by land use is done in the following order:
• Step 1: Managed and unmanaged land
• Step 2: Six IPCC land use categories
• Step 3: “Land remaining in the same land-use category” and “Land converted into a new land use category”
• Step 4: Land conversion categories
Click on
each step.
Step 1: Differentiate between managed land and unmanaged land.
GHG emissions and removals must always be reported if they occur on managed
land. However, it is good practice to track the area of unmanaged land over time so
that consistency in area accounting is maintained.
Unmanaged Land Managed Land
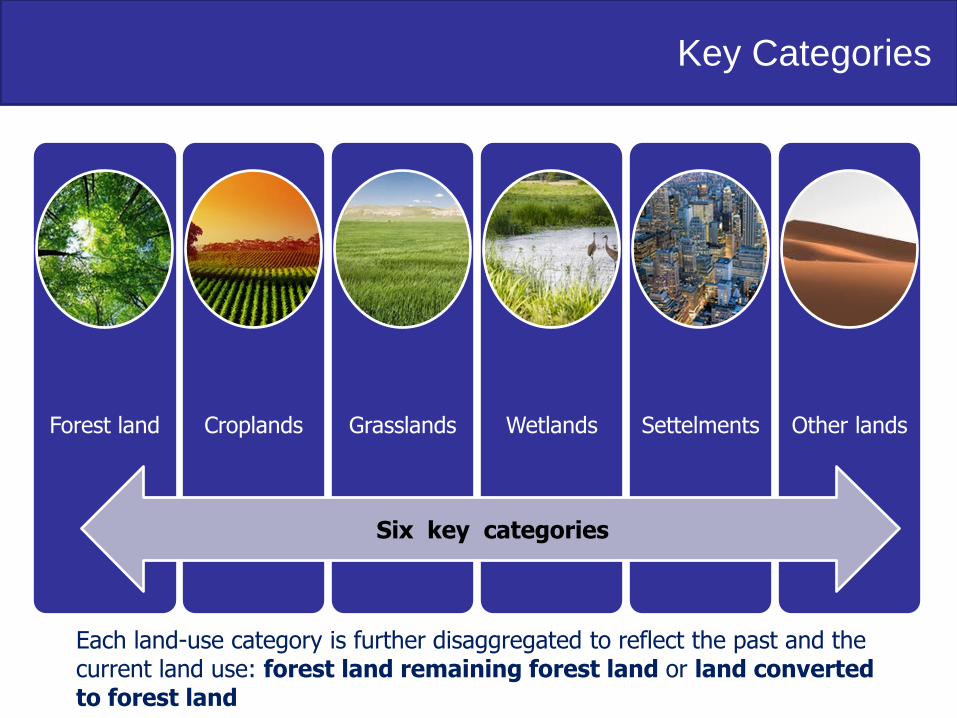
Key Categories
Forest land Croplands Grasslands Wetlands Settelments Other lands
Six key categories
Each land-use category is further disaggregated to reflect the past and the current land use: forest land remaining forest land or land converted to forest land
Land use vs Land cover
Land cover is determined by the bio-physical coverage of land (for
example, crops, trees, buildings and roads or lakes),
Land use is determined by the socioeconomic use that is made of
land (for example, agriculture, forestry, residential use or recreation);
at any one place, there may be multiple (e.g. agro-forestry) and
alternate (e.g. rotation between cropland and grassland) land uses.
Most of spatial datasets contain information on land cover since this is readily derived from image analysis. However, for estimating GHG fluxes the information needed is the land use, and using land cover data instead of land use information may largely impact the GHG estimates, in particular when the reporting of GHG emissions and removals does not cover all NGHGI categories, as it is the case of project activities as, for example, REDD-plus activities.
Methodological difference between land cover and
land use
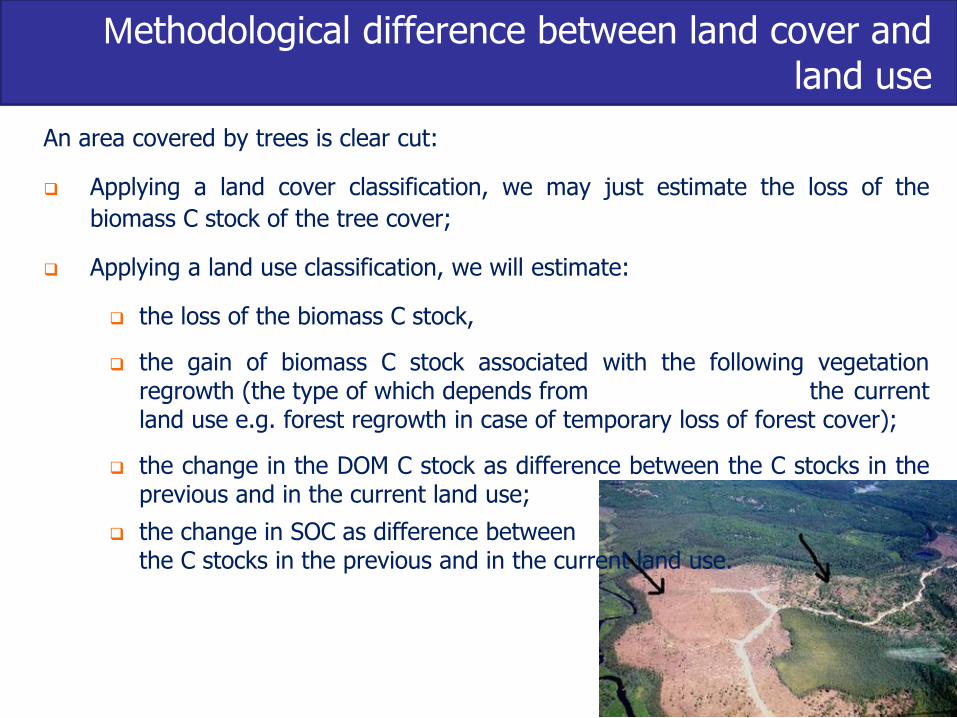
An area covered by trees is clear cut:
Applying a land cover classification, we may just estimate the loss of the
biomass C stock of the tree cover;
Applying a land use classification, we will estimate:
the loss of the biomass C stock,
the gain of biomass C stock associated with the following vegetation regrowth (the type of which depends from the current land use e.g. forest regrowth in case of temporary loss of forest cover);
the change in the DOM C stock as difference between the C stocks in the previous and in the current land use;
the change in SOC as difference between the C stocks in the previous and in the current land use.
Click on
each step.
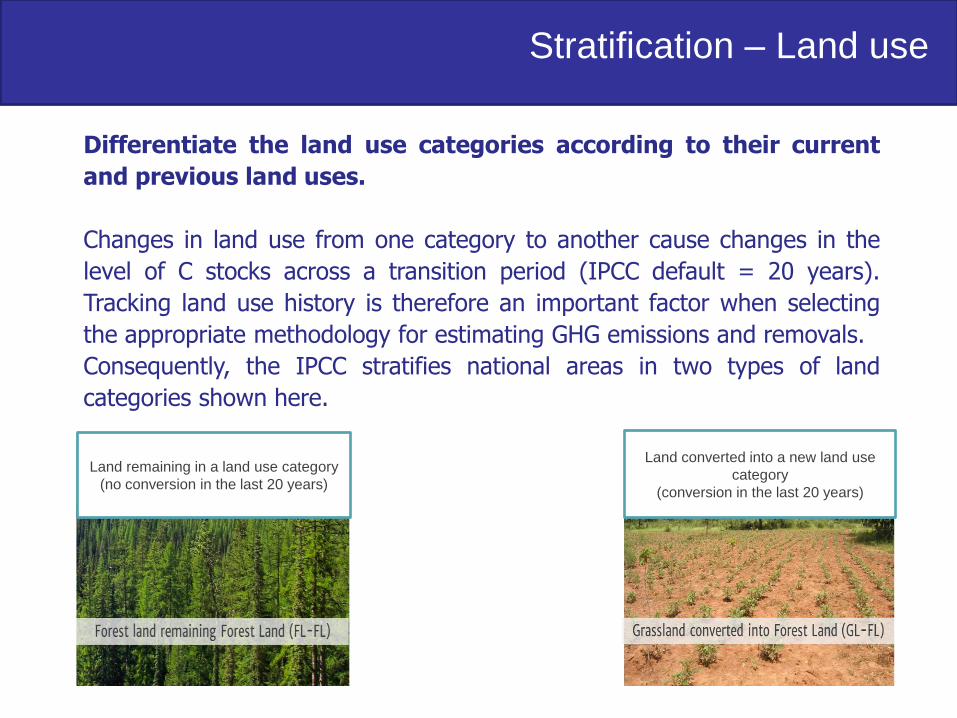
Differentiate the land use categories according to their current
and previous land uses.
Changes in land use from one category to another cause changes in the
level of C stocks across a transition period (IPCC default = 20 years).
Tracking land use history is therefore an important factor when selecting
the appropriate methodology for estimating GHG emissions and removals.
Consequently, the IPCC stratifies national areas in two types of land
categories shown here.
Land remaining in a land use category
(no conversion in the last 20 years)
Land converted into a new land use
category
(conversion in the last 20 years)
Stratification – Land use
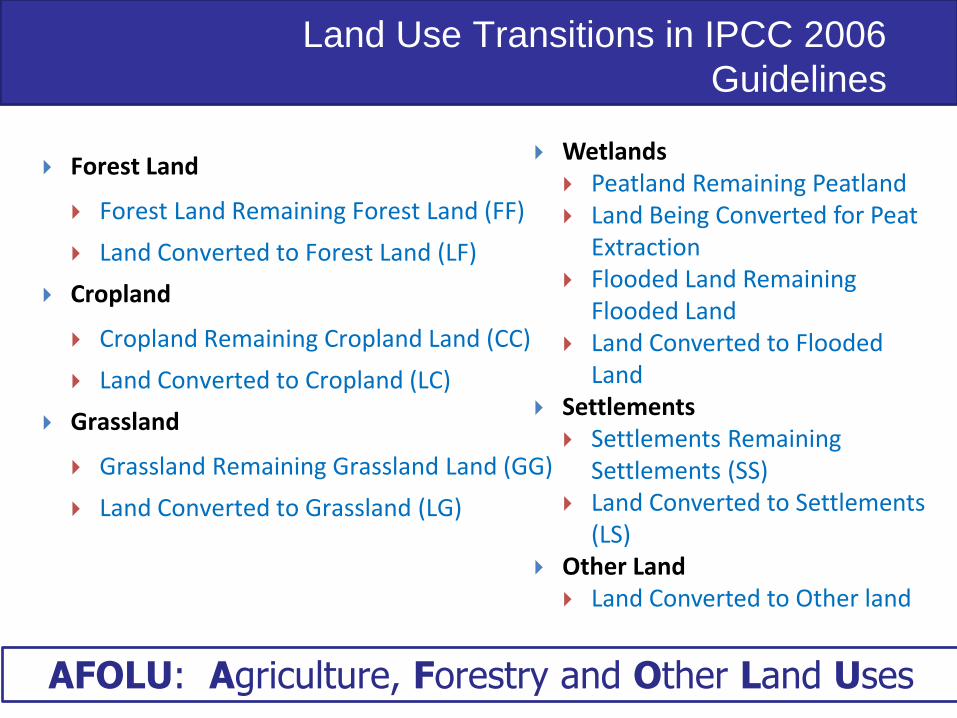
Land Use Transitions in IPCC 2006
Guidelines
Forest Land
Forest Land Remaining Forest Land (FF)
Land Converted to Forest Land (LF)
Cropland
Cropland Remaining Cropland Land (CC)
Land Converted to Cropland (LC)
Grassland
Grassland Remaining Grassland Land (GG)
Land Converted to Grassland (LG)
Wetlands Peatland Remaining Peatland Land Being Converted for Peat
Extraction Flooded Land Remaining
Flooded Land Land Converted to Flooded
Land Settlements
Settlements Remaining Settlements (SS)
Land Converted to Settlements (LS)
Other Land Land Converted to Other land
AFOLU: Agriculture, Forestry and Other Land Uses
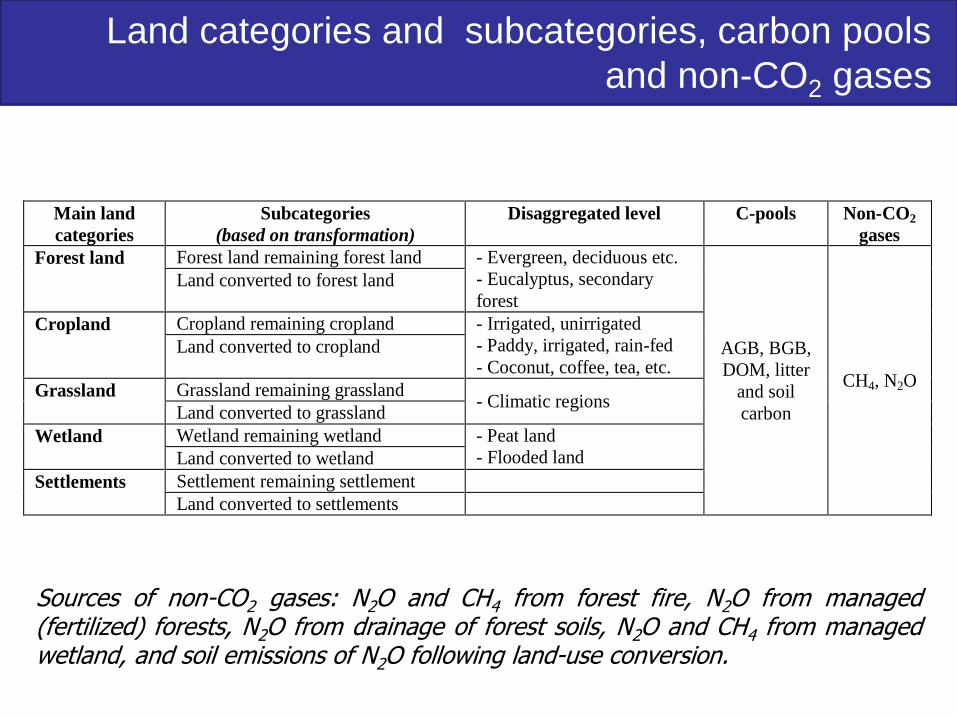
Land categories and subcategories, carbon pools
and non-CO2 gases
Main land
categories
Subcategories
(based on transformation)
Disaggregated level C-pools Non-CO2
gases
Forest land Forest land remaining forest land - Evergreen, deciduous etc.
- Eucalyptus, secondary
forest
AGB, BGB,
DOM, litter
and soil
carbon
CH4, N2O
Land converted to forest land
Cropland Cropland remaining cropland - Irrigated, unirrigated
- Paddy, irrigated, rain-fed
- Coconut, coffee, tea, etc. Land converted to cropland
Grassland Grassland remaining grassland - Climatic regions
Land converted to grassland
Wetland Wetland remaining wetland - Peat land
- Flooded land Land converted to wetland
Settlements Settlement remaining settlement
Land converted to settlements
Sources of non-CO2 gases: N2O and CH4 from forest fire, N2O from managed (fertilized) forests, N2O from drainage of forest soils, N2O and CH4 from managed wetland, and soil emissions of N2O following land-use conversion.
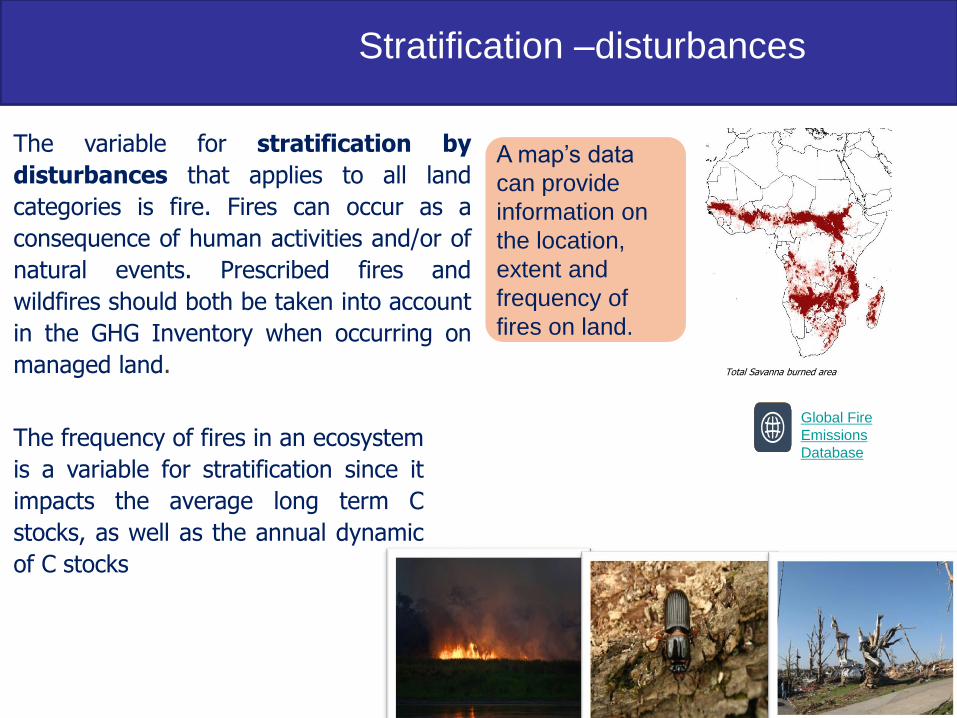
The variable for stratification by
disturbances that applies to all land
categories is fire. Fires can occur as a
consequence of human activities and/or of
natural events. Prescribed fires and
wildfires should both be taken into account
in the GHG Inventory when occurring on
managed land. Total Savanna burned area
Global Fire
Emissions
Database The frequency of fires in an ecosystem
is a variable for stratification since it
impacts the average long term C
stocks, as well as the annual dynamic
of C stocks
Stratification –disturbances
A map’s data
can provide
information on
the location,
extent and
frequency of
fires on land.
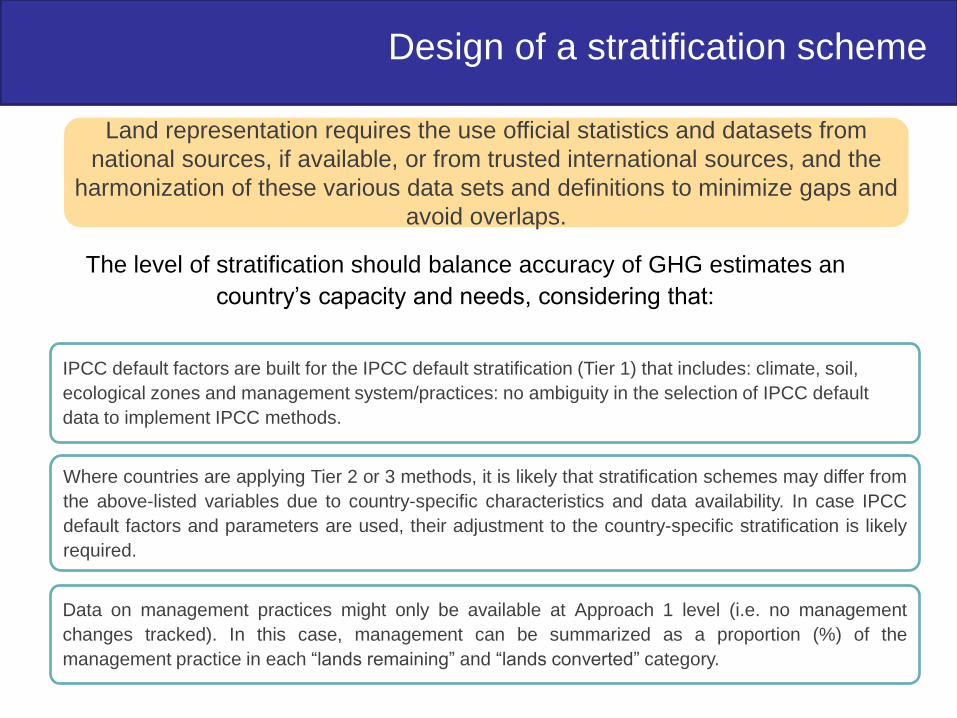
Design of a stratification scheme
Land representation requires the use official statistics and datasets from
national sources, if available, or from trusted international sources, and the
harmonization of these various data sets and definitions to minimize gaps and
avoid overlaps.
The level of stratification should balance accuracy of GHG estimates an
country’s capacity and needs, considering that:
IPCC default factors are built for the IPCC default stratification (Tier 1) that includes: climate, soil,
ecological zones and management system/practices: no ambiguity in the selection of IPCC default
data to implement IPCC methods.
Where countries are applying Tier 2 or 3 methods, it is likely that stratification schemes may differ from
the above-listed variables due to country-specific characteristics and data availability. In case IPCC
default factors and parameters are used, their adjustment to the country-specific stratification is likely
required.
Data on management practices might only be available at Approach 1 level (i.e. no management
changes tracked). In this case, management can be summarized as a proportion (%) of the
management practice in each “lands remaining” and “lands converted” category.
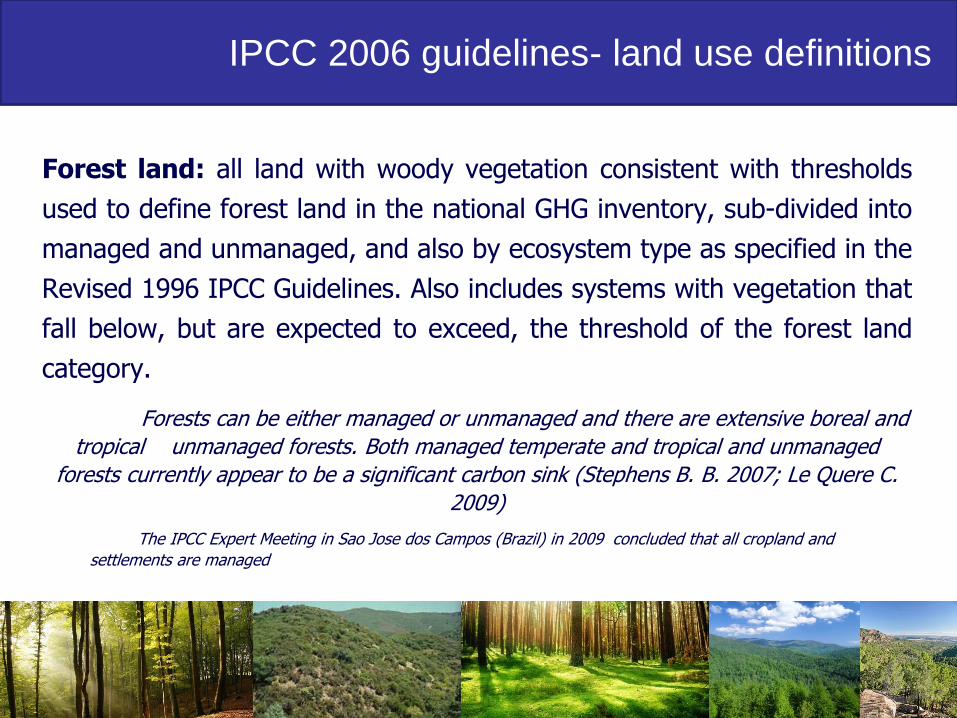
IPCC 2006 guidelines- land use definitions
Forest land: all land with woody vegetation consistent with thresholds
used to define forest land in the national GHG inventory, sub-divided into
managed and unmanaged, and also by ecosystem type as specified in the
Revised 1996 IPCC Guidelines. Also includes systems with vegetation that
fall below, but are expected to exceed, the threshold of the forest land
category.
Forests can be either managed or unmanaged and there are extensive boreal and
tropical unmanaged forests. Both managed temperate and tropical and unmanaged
forests currently appear to be a significant carbon sink (Stephens B. B. 2007; Le Quere C.
2009)
The IPCC Expert Meeting in Sao Jose dos Campos (Brazil) in 2009 concluded that all cropland and
settlements are managed
Features of Forest Land
Estimates carbon stock changes and GHG emissions/removals associated with
changes in biomass and soil organic carbon on forest land and lands
converted to forest land
Provides methodology for five carbon pools
Links biomass and soil carbon pools for the same land areas (at higher tiers)
Estimates annual increase in living biomass (AGB + BGB) carbon stocks,
decrease in carbon stocks and net change in carbon stocks
Estimates carbon stock change in deadwood, litter and net annual change in
carbon stock in DOM
Estimates carbon stock change in mineral soils and organic soils and net
annual change in carbon stock in soils
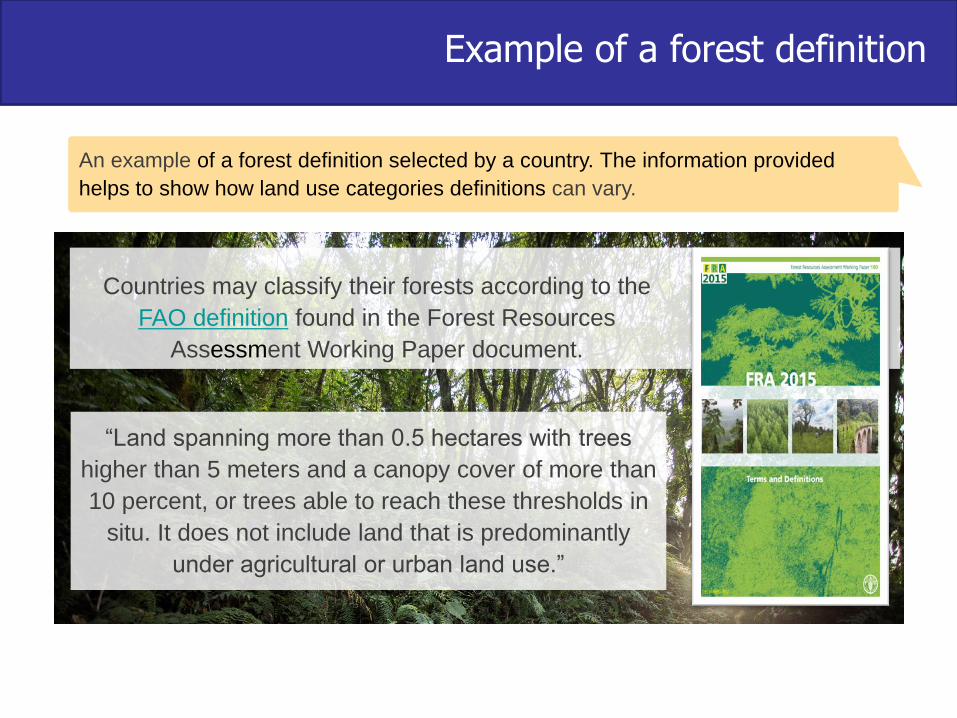
“Land spanning more than 0.5 hectares with trees
higher than 5 meters and a canopy cover of more than
10 percent, or trees able to reach these thresholds in
situ. It does not include land that is predominantly
under agricultural or urban land use.”
An example of a forest definition selected by a country. The information provided
helps to show how land use categories definitions can vary.
Countries may classify their forests according to the
FAO definition found in the Forest Resources
Assessment Working Paper document.
Example of a forest definition
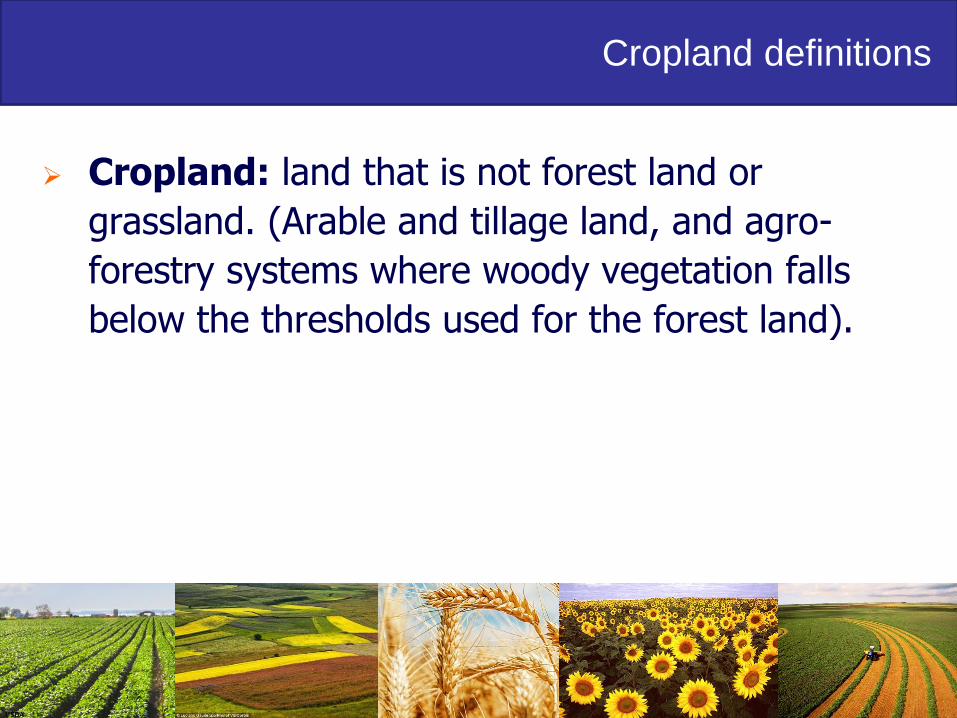
Cropland definitions
Cropland: land that is not forest land or
grassland. (Arable and tillage land, and agro-
forestry systems where woody vegetation falls
below the thresholds used for the forest land).
Features of Cropland
Provides methods for estimating carbon stock changes in cropland and N2O emissions
from land-use conversions to cropland
Estimates annual change in carbon stocks in living biomass based on: annual area of
cropland with perennial woody biomass and annual growth rate of perennial woody
biomass and deducting the harvest of biomass carbon
Estimates annual change in carbon stocks in organic soils based on: estimates of land
area under organic soils and emission factor for organic soils subjected to cultivation
Estimates annual change in carbon stocks in living biomass, mineral soils and organic
soils for different land categories converted to cropland
Estimates annual emission of N2O from mineral soils due to addition of N (in the form
of fertilizer, manure and crop residue) and N released by soil organic matter
mineralization
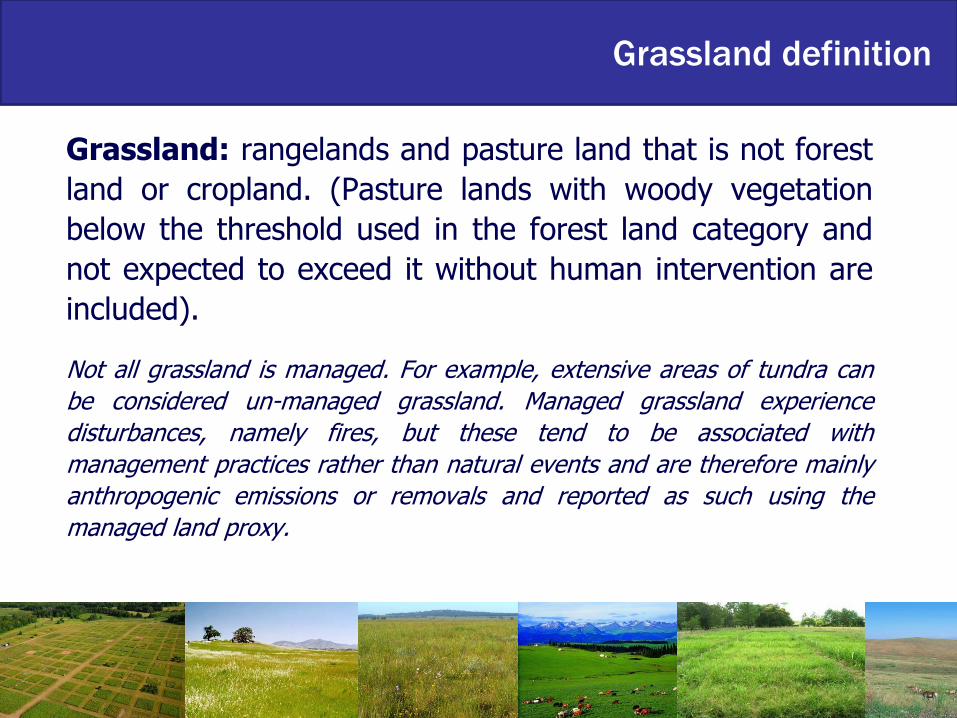
Grassland definition
Grassland: rangelands and pasture land that is not forest
land or cropland. (Pasture lands with woody vegetation
below the threshold used in the forest land category and
not expected to exceed it without human intervention are
included).
Not all grassland is managed. For example, extensive areas of tundra can
be considered un-managed grassland. Managed grassland experience
disturbances, namely fires, but these tend to be associated with
management practices rather than natural events and are therefore mainly
anthropogenic emissions or removals and reported as such using the
managed land proxy.
Features of Grasslands
Carbon stocks in grasslands are influenced by human activities and
natural disturbances, including harvesting of woody biomass,
rangeland degradation, grazing, fires, rehabilitation, pasture
management, etc.; BGB, including root biomass and soil organic
matter, dominates grasslands
Estimates annual change in carbon stocks in living biomass and soil
carbon (mineral soils and cultivated organic soils) in grassland
remaining grassland and lands converted to grassland
IPCC provides methodology for estimating non-CO2 emissions from
vegetation fires based on: area of grassland burnt, mass of available
fuel, combustion efficiency and emission factor for each GHG from
grassland remaining grassland and land converted to grassland
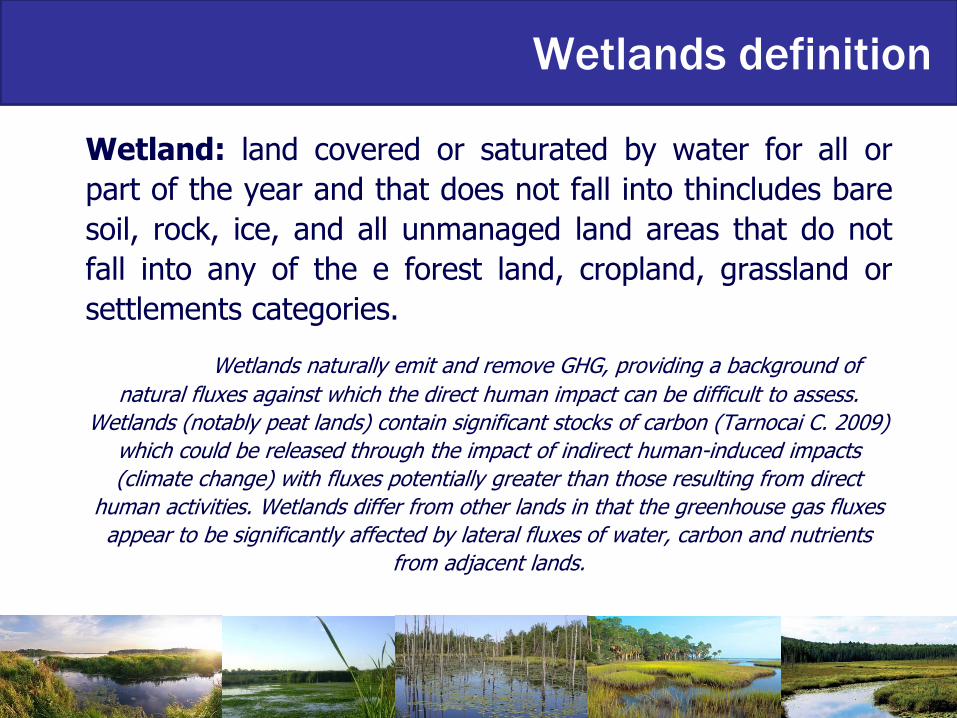
Wetlands definition
Wetland: land covered or saturated by water for all or
part of the year and that does not fall into thincludes bare
soil, rock, ice, and all unmanaged land areas that do not
fall into any of the e forest land, cropland, grassland or
settlements categories.
Wetlands naturally emit and remove GHG, providing a background of
natural fluxes against which the direct human impact can be difficult to assess.
Wetlands (notably peat lands) contain significant stocks of carbon (Tarnocai C. 2009)
which could be released through the impact of indirect human-induced impacts
(climate change) with fluxes potentially greater than those resulting from direct
human activities. Wetlands differ from other lands in that the greenhouse gas fluxes
appear to be significantly affected by lateral fluxes of water, carbon and nutrients
from adjacent lands.
Features of wetlands
Includes land that is covered or saturated by water for all or part of the
year and that does not fall into forest and other categories
For GHG inventory, it is necessary to distinguish between managed and
unmanaged wetlands
Methodology for estimating GHGs for ‘wetlands remaining wetlands’ is
given in the appendix and for GHGs from ‘lands converted to wetlands’ in
the main text
Estimates changes in carbon stocks in lands converted to wetlands due to
peat extraction and land converted to flooded land
Estimates N2O emissions from peatland drainage and flooded lands and
CH4 emissions from flooded land
Estimates annual change in carbon stocks in living biomass in lands
converted to flooded lands
Settlements definitions
Settlements: all developed land, including transportation
infrastructure and human settlements of any size, unless
they are already included under other categories. This
should be consistent with the selection of national
definitions.
Features of Settlements
This includes all classes of urban tree formation and village
trees
Provides methodology for estimating CO2 emissions and
removals for ‘lands converted to settlements’ and for
‘settlements remaining settlements’ (in the appendix)
Methods for estimating annual change in carbon stocks in
living biomass in ‘forest lands converted to settlements’
based on area of land converted and carbon stock in living
biomass immediately before and after conversion to
settlements
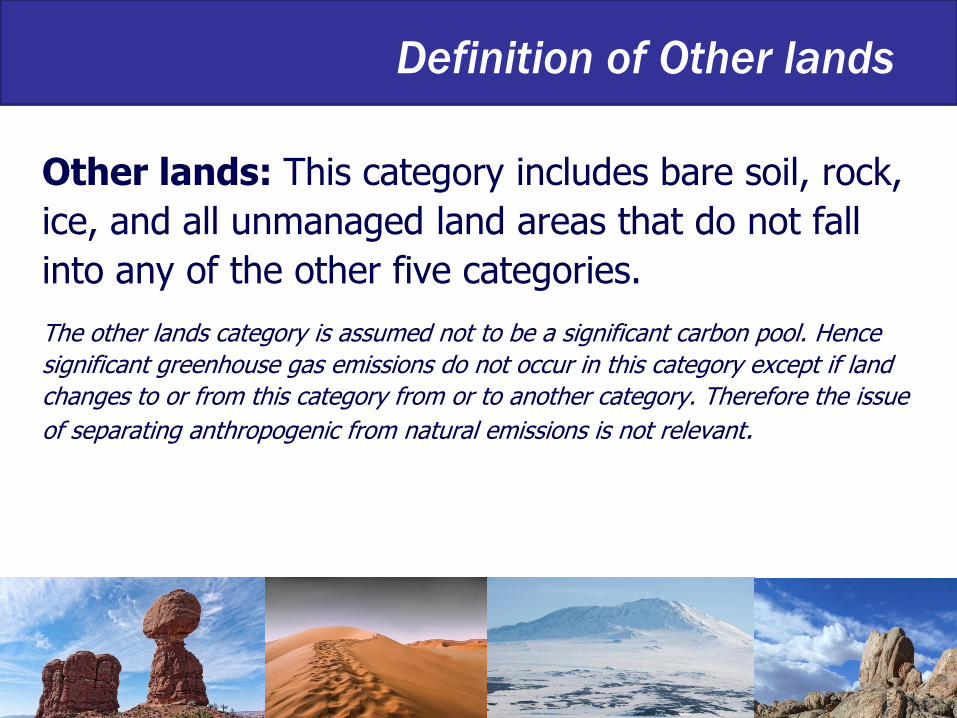
Definition of Other lands
Other lands: This category includes bare soil, rock,
ice, and all unmanaged land areas that do not fall
into any of the other five categories.
The other lands category is assumed not to be a significant carbon pool. Hence
significant greenhouse gas emissions do not occur in this category except if land
changes to or from this category from or to another category. Therefore the issue
of separating anthropogenic from natural emissions is not relevant.
Features of Other lands
Includes bare soil, rock, ice and all unmanaged land areas
that do not fall into any other land-use category
Changes in carbon stocks and non-CO2
emissions/removals need not be assessed for category of
‘other land remaining other land’
Methodology provided for estimating annual change in
carbon stocks in ‘land converted to other land’ based on
estimates of change in carbon stocks in living biomass
and SOC
Important notice…
Classify land under only one category to prevent double counting.
It is good practice to combine or disaggregate the existing land classes of a land-use classification in order to use the categories presented here, and to report on the procedure adopted.
It is good practice to specify national definitions for all categories used in the inventory and report any threshold or parameter values used in the definitions.
Representing land-use areas
Three approaches that may be used to represent areas of
land use using the categories
Approaches are differentiated by increasing information
content.
The Approaches are not presented as hierarchical tiers
and do not imply any increase or decrease in accuracy but
reflect collection methods and attributes and, therefore,
appropriate ways to use the data
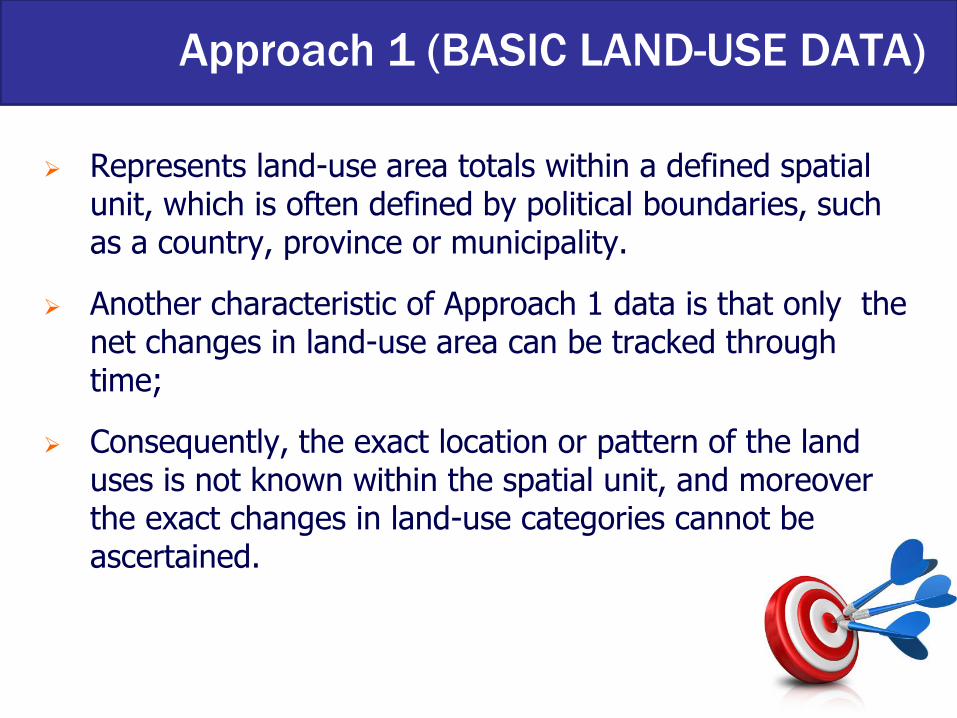
Approach 1 (BASIC LAND-USE DATA)
Represents land-use area totals within a defined spatial unit, which is often defined by political boundaries, such as a country, province or municipality.
Another characteristic of Approach 1 data is that only the net changes in land-use area can be tracked through time;
Consequently, the exact location or pattern of the land uses is not known within the spatial unit, and moreover the exact changes in land-use categories cannot be ascertained.
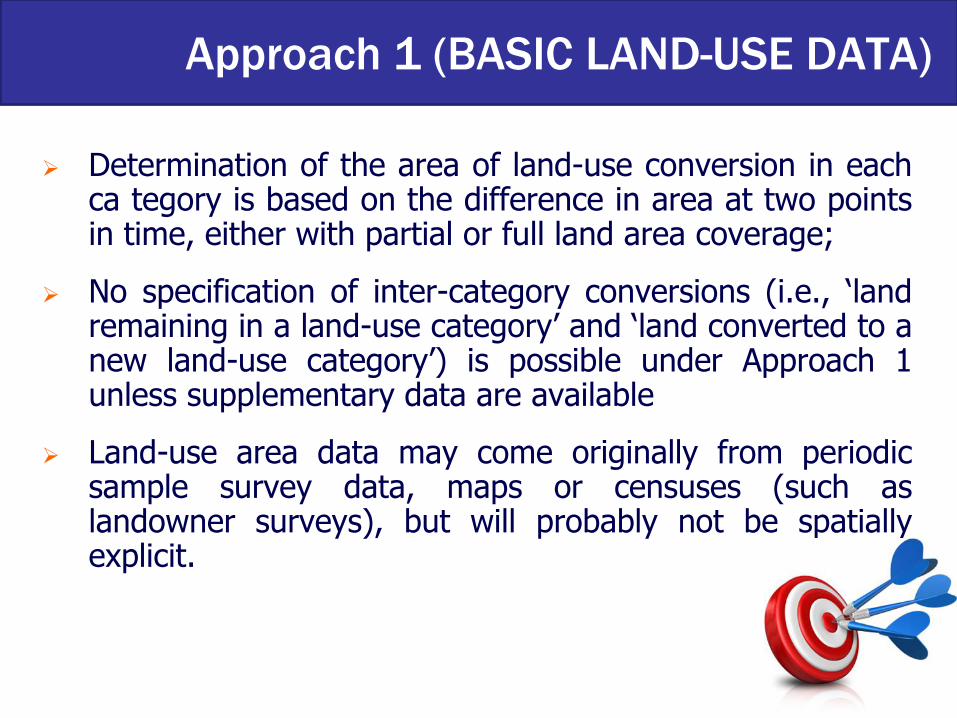
Approach 1 (BASIC LAND-USE DATA)
Determination of the area of land-use conversion in each ca tegory is based on the difference in area at two points in time, either with partial or full land area coverage;
No specification of inter-category conversions (i.e., ‘land remaining in a land-use category’ and ‘land converted to a new land-use category’) is possible under Approach 1 unless supplementary data are available
Land-use area data may come originally from periodic sample survey data, maps or censuses (such as landowner surveys), but will probably not be spatially explicit.
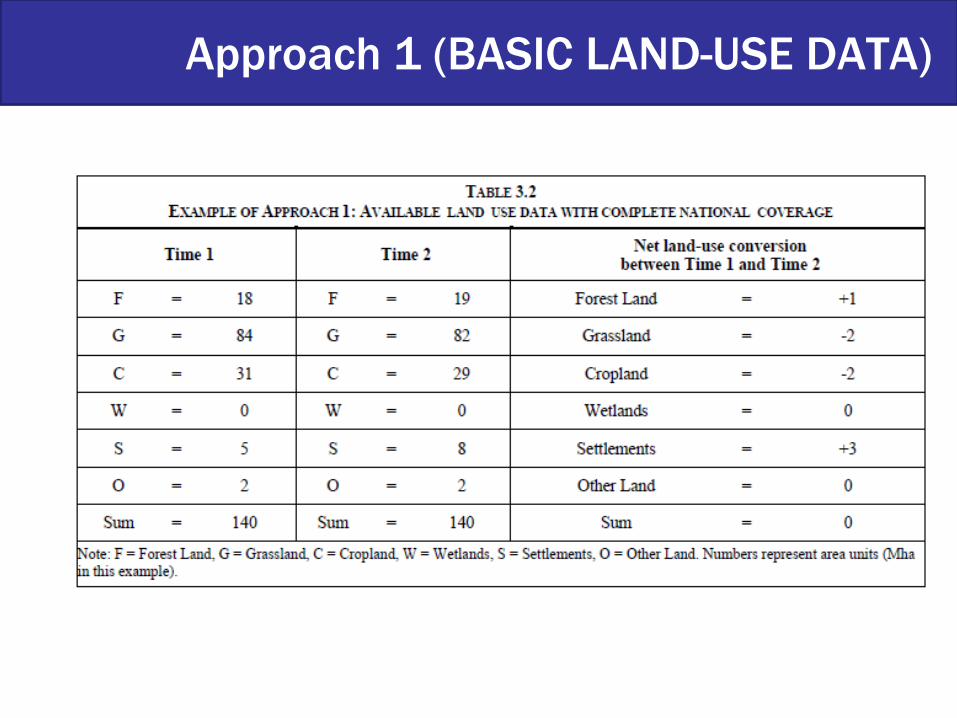
Approach 1 (BASIC LAND-USE DATA)
Approach 2 total land-use area, incl. changes
between categories
Approach 2 differs from Approach 1 in that it includes information on conversions between categories, but is still only tracking those changes without spatially-explicit location data, often based on political boundaries (i.e., locations of specific land use and land-use conversions are not known);
Tracking land-use conversions in this manner will normally require estimation of initial and final land-use categories for all conversion types, as well as of total area of unchanged land by category;
Final results of this Approach can be presented as a non-spatially-explicit land-use conversion matrix.
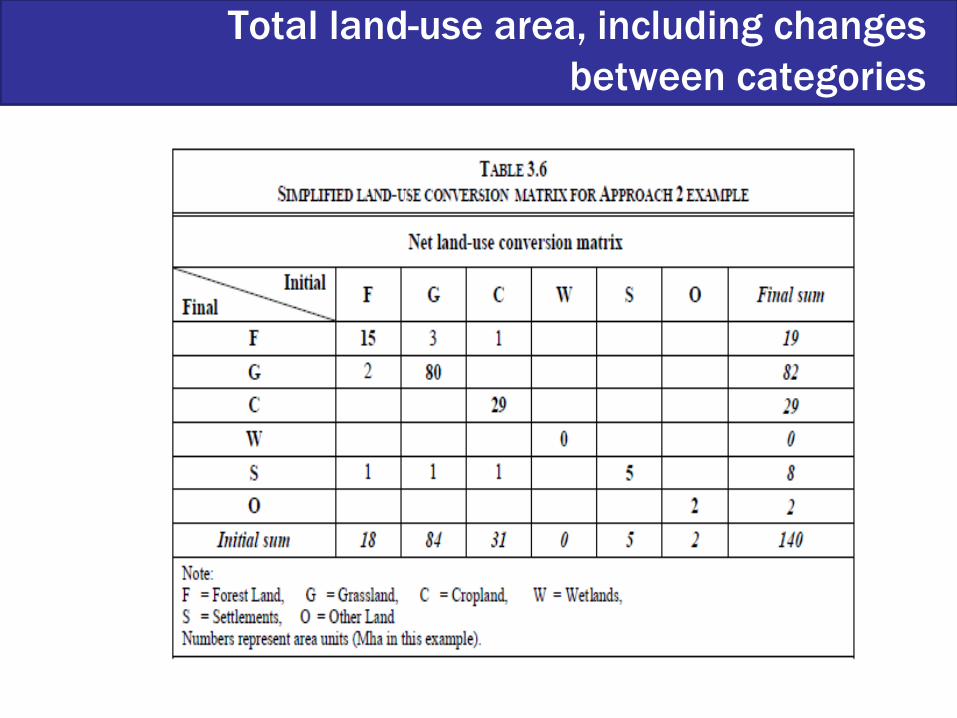
Total land-use area, including changes
between categories
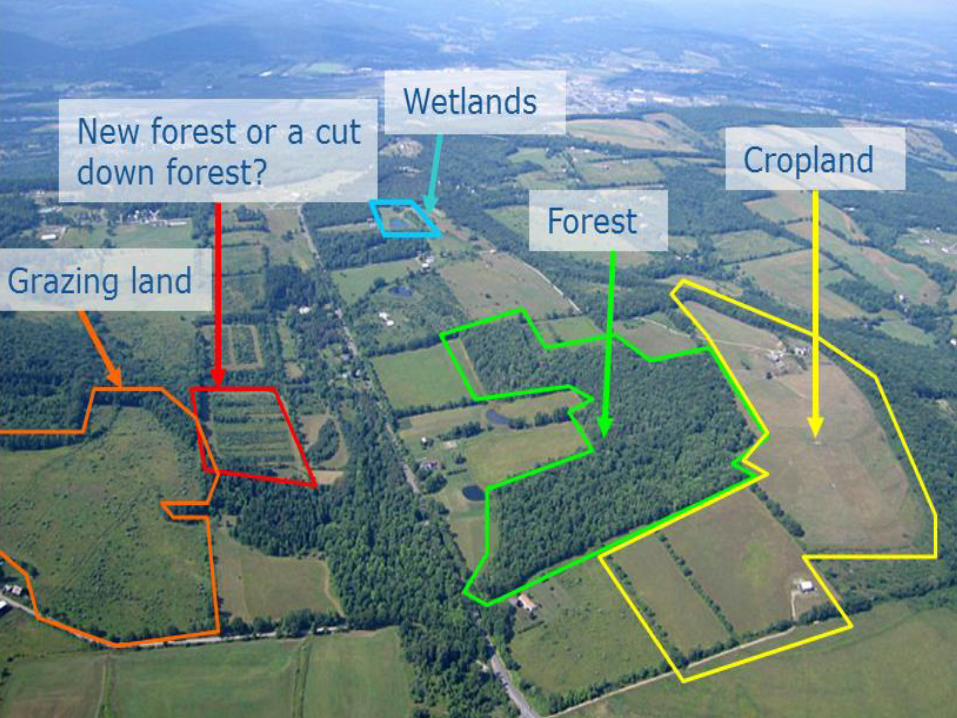
Approach 3 Spatially-explicit land-use
conversion data
Approach 3 is characterized by spatially-explicit observations of
land-use categories and land-use conversions, often tracking
patterns at specific point locations and/or using gridded map
products, such as derived from remote sensing imagery;
The data may be obtained by various sampling, wall-to-wall
mapping techniques, or combination of the two methods.
The main advantage of spatially-explicit data is that analysis
tools such as Geographic Information Systems (GIS) can be
used to link multiple spatially-explicit data sets (such as those
used for stratification) and describe in detail the conditions on
a particular piece of land prior to and after a land-use
conversion.
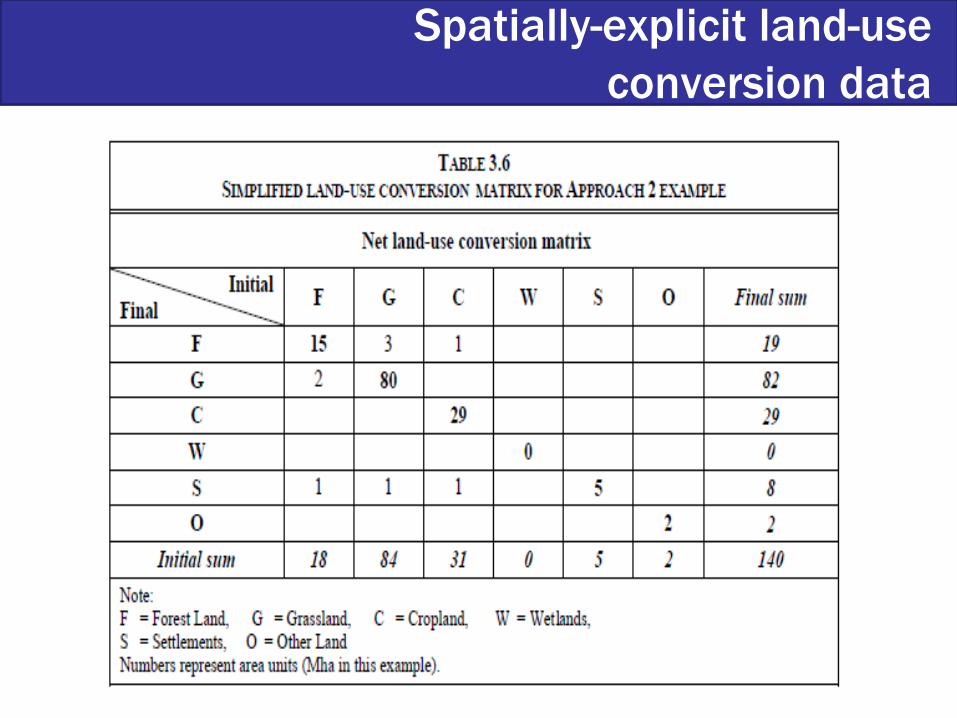
Spatially-explicit land-use
conversion data
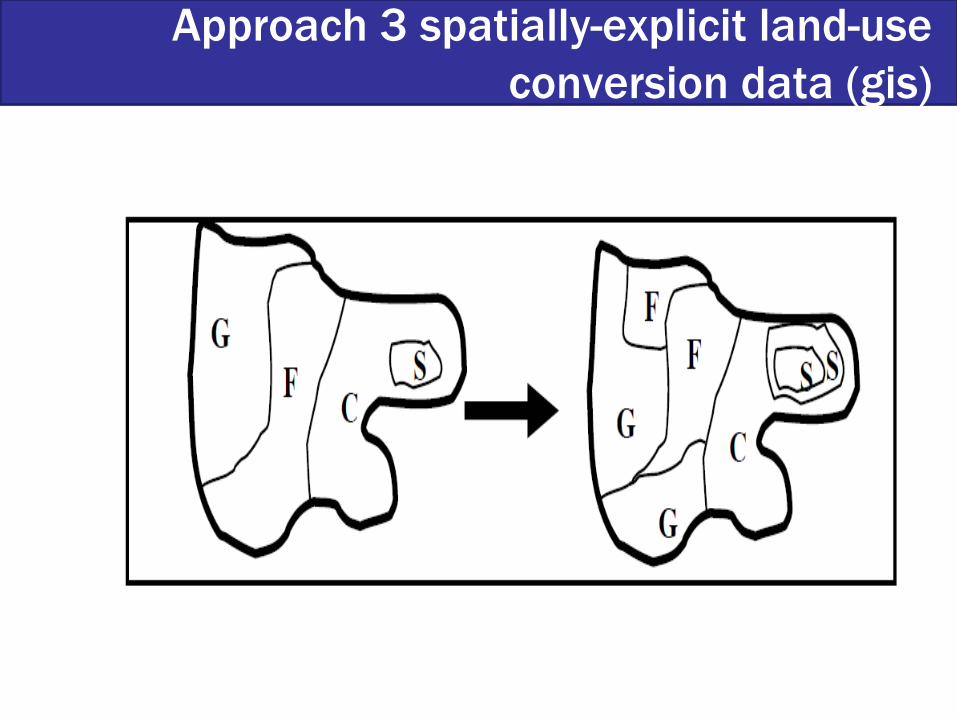
Approach 3 spatially-explicit land-use
conversion data (gis)
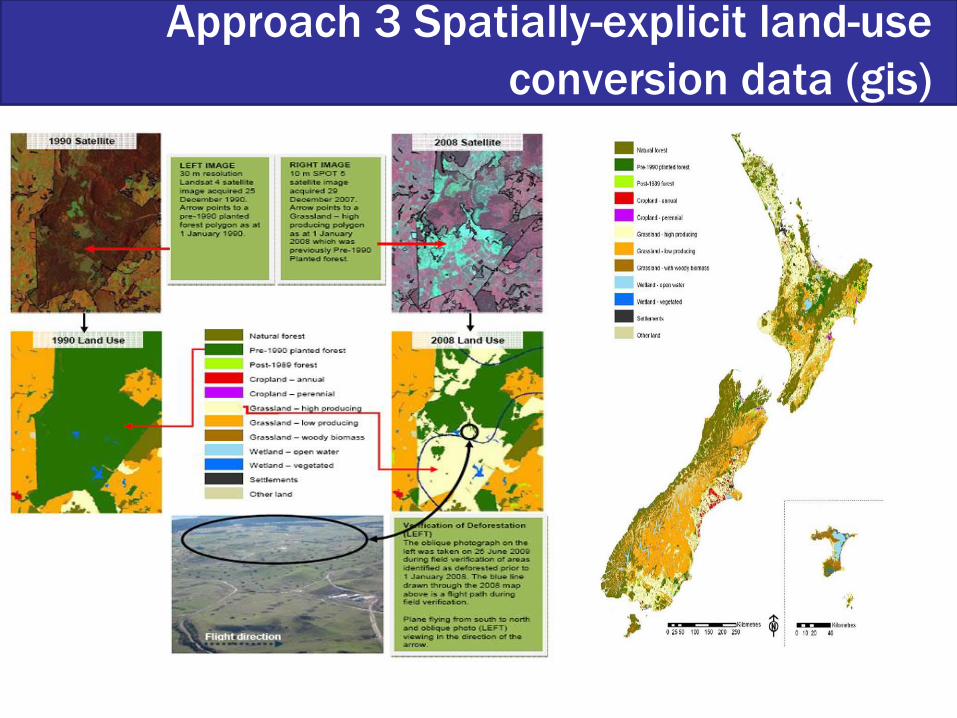
Approach 3 Spatially-explicit land-use
conversion data (gis)
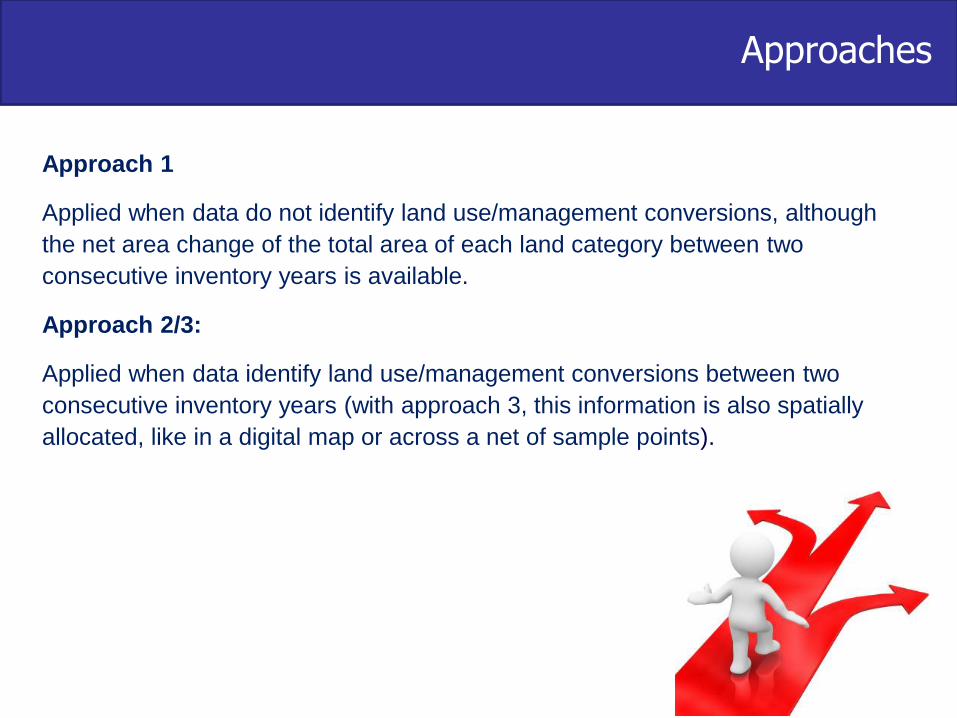
Approaches
Approach 1
Applied when data do not identify land use/management conversions, although
the net area change of the total area of each land category between two
consecutive inventory years is available.
Approach 2/3:
Applied when data identify land use/management conversions between two
consecutive inventory years (with approach 3, this information is also spatially
allocated, like in a digital map or across a net of sample points).
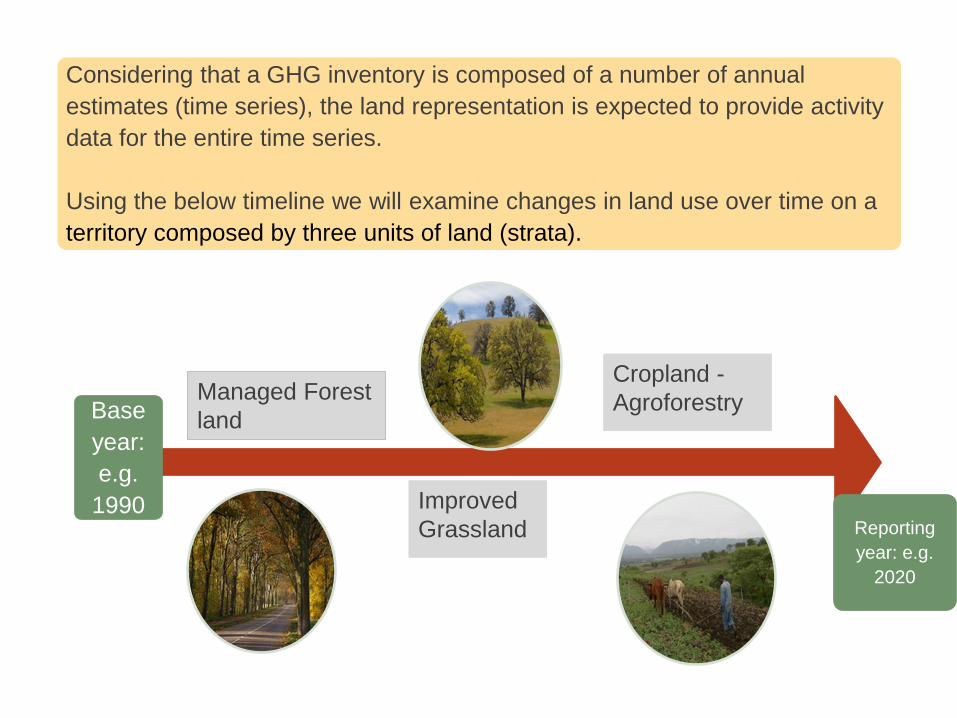
Considering that a GHG inventory is composed of a number of annual
estimates (time series), the land representation is expected to provide activity
data for the entire time series.
Using the below timeline we will examine changes in land use over time on a
territory composed by three units of land (strata).
Managed Forest
land
Improved
Grassland
Cropland -
Agroforestry Base
year:
e.g.
1990 Reporting
year: e.g.
2020
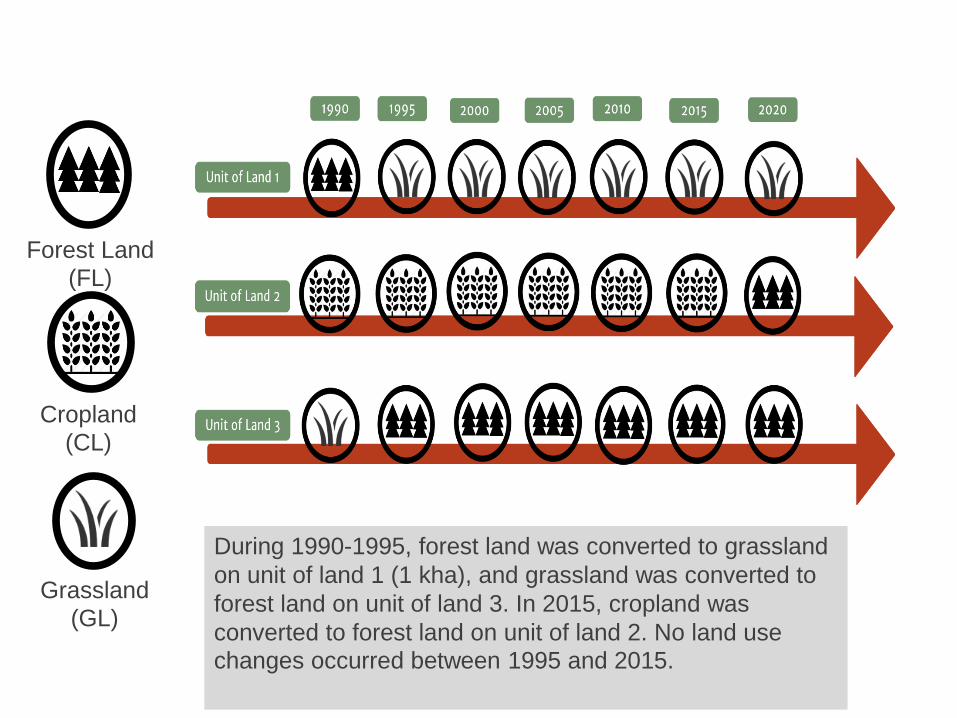
During 1990-1995, forest land was converted to grassland
on unit of land 1 (1 kha), and grassland was converted to
forest land on unit of land 3. In 2015, cropland was
converted to forest land on unit of land 2. No land use
changes occurred between 1995 and 2015.
Cropland
(CL)
Forest Land
(FL)
Grassland
(GL)
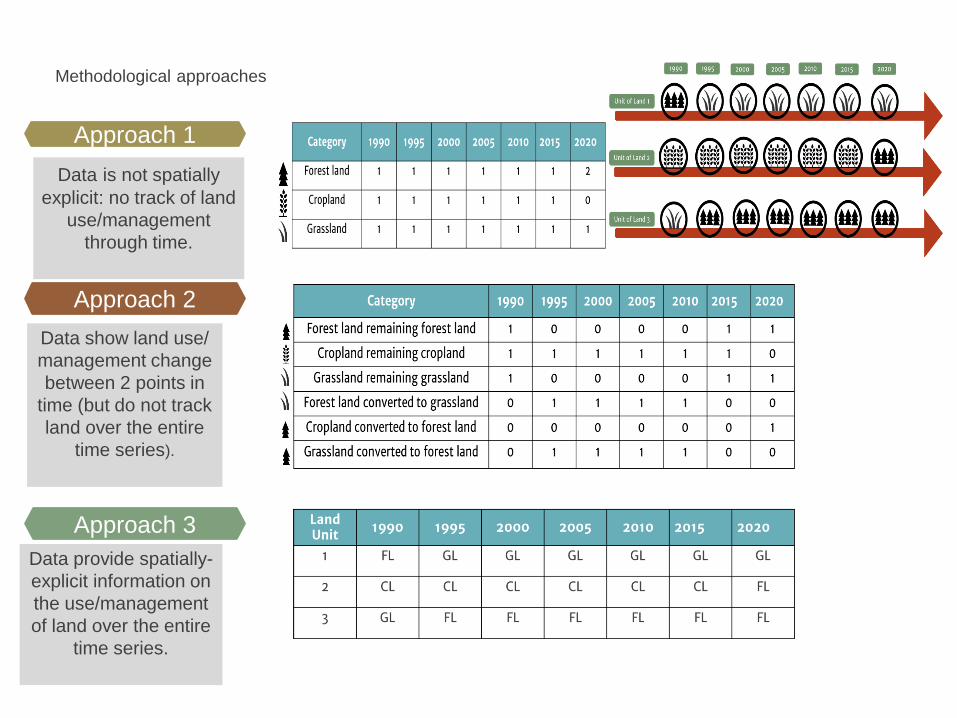
Approach 1
Data is not spatially
explicit: no track of land
use/management
through time.
Methodological approaches
Data show land use/
management change
between 2 points in
time (but do not track
land over the entire
time series).
Approach 2
Data provide spatially-
explicit information on
the use/management
of land over the entire
time series.
Approach 3
Land representation of
project activities
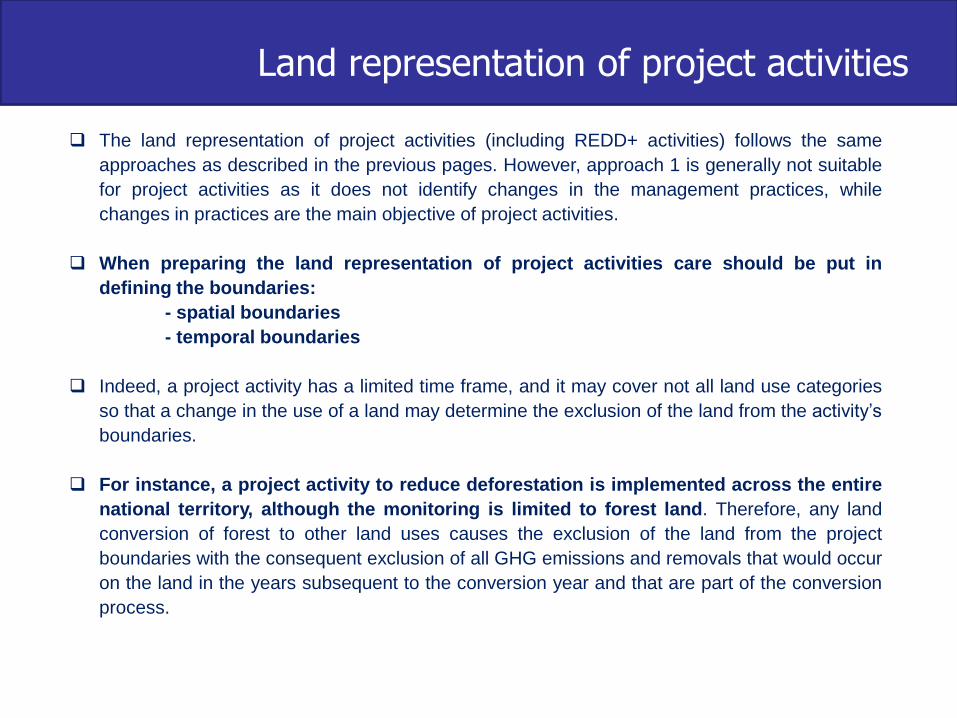
Land representation of project activities
The land representation of project activities (including REDD+ activities) follows the same
approaches as described in the previous pages. However, approach 1 is generally not suitable
for project activities as it does not identify changes in the management practices, while
changes in practices are the main objective of project activities.
When preparing the land representation of project activities care should be put in
defining the boundaries:
- spatial boundaries
- temporal boundaries
Indeed, a project activity has a limited time frame, and it may cover not all land use categories
so that a change in the use of a land may determine the exclusion of the land from the activity’s
boundaries.
For instance, a project activity to reduce deforestation is implemented across the entire
national territory, although the monitoring is limited to forest land. Therefore, any land
conversion of forest to other land uses causes the exclusion of the land from the project
boundaries with the consequent exclusion of all GHG emissions and removals that would occur
on the land in the years subsequent to the conversion year and that are part of the conversion
process.
Land representation of project activities
It is therefore good practice that once a land is
included in the project boundaries, it remained
included until the end of the activity and GHG
emissions and removals associated with the land
were estimated and reported across the entire
implementation period of the activity.
When this is not possible, an option would be to report at
once the total GHG emissions and removals associated
with the entire conversion process.
Under the UNFCCC and its Paris Agreement countries have agreed to recognize and support
mitigation actions in the forest sector implemented in developing countries:
• Reducing emissions from deforestation;
• Reducing emissions from forest degradation
• Conservation of forest carbon stocks;
• Sustainable management of forests;
• Enhancement of forest carbon stocks;
Although these activities may cover only a portion of the forest-related IPCC
NGHGI categories (e.g. REDD+ sustainable forest management activities may have been
implemented in an portion of the national forest land), their impact (GHG emissions and
removals) is estimated by applying the same IPCC methodologies applied for
NGHGI through stratification.
Stratification within the NGHGI categories ensures full consistency of REDD+
GHG estimates with NGHGI and IPCC guidelines and it also avoids double
counting of GHG emissions and removals.
NGHGIs, Paris Agreement and REDD+
NGHGIs, Paris Agreement and REDD+
Once REDD+ activities will cover the entire forest area of a country,
NGHGI categories do not need to be stratified anymore since the
GHG estimates of the forest-related NGHGI categories properly report
GHG emissions and removals associated with REDD+ activities.
In practice, when GHG emissions and removals from the following
NGHGI categories are reported:
• Forest land remaining forest land;
• Land converted to forest land;
• Forest land converted to other uses of land,
these GHG estimates may be readily used for accounting for the
results of the implementation of REDD+ activities.

Thank you!
Tomasz Kowalczewski, Paolo Prosperi


![GHG INVENTORY FOR SOUTH AFRICA · GHG INVENTORY FOR SOUTH AFRICA 2000 - 2010 11 3.3.6.4.1 Commercial/ Institutional [1A4a] 109 3.3.6.4.2 Residential [1A4b] 109 3.3.6.4.3 Agriculture](https://img.pdfslide.us/doc/110x75/60401f3664fcc03b421a882e/ghg-inventory-for-south-africa-ghg-inventory-for-south-africa-2000-2010-11-33641.jpg)