Embed Size (px)
Citation preview

ELICITPart 1A: Watch the movie clip “Let’s Do the Math” from the movie The Martian (2015) (https://www.youtube.com/watch?v=YD1rlE5tp_0)
ENGAGEPart 1B: The clip you watch shows that astronaut Mark Watney (played by Matt Damon) needed to figure out how to grow food on the planet Mars in order to survive. As you could probably guess, the environment on the planet Mars is far different from our environment here on Earth, and humans will face many more challenges than just trying to grow potatoes like astronaut Watney. For one, the climate on Mars is much different than it is here on Earth. Check out the image below:
In the image, the average temperature for each planet is shown by the planet’s location, and the temperature where water freezes is also shown. Notice anything? It’s freezing! Literally! How can our future astronauts and Mars explorers overcome this problem? With your help of course! You mission is to design a dwelling that will allow humans to survive in the freezing temperatures on Mars. In order to do this, you will need to learn quite a bit about thermodynamics (a fancy term for the study of heat)
Let’s start with what we think, what we know, what we need to learn?
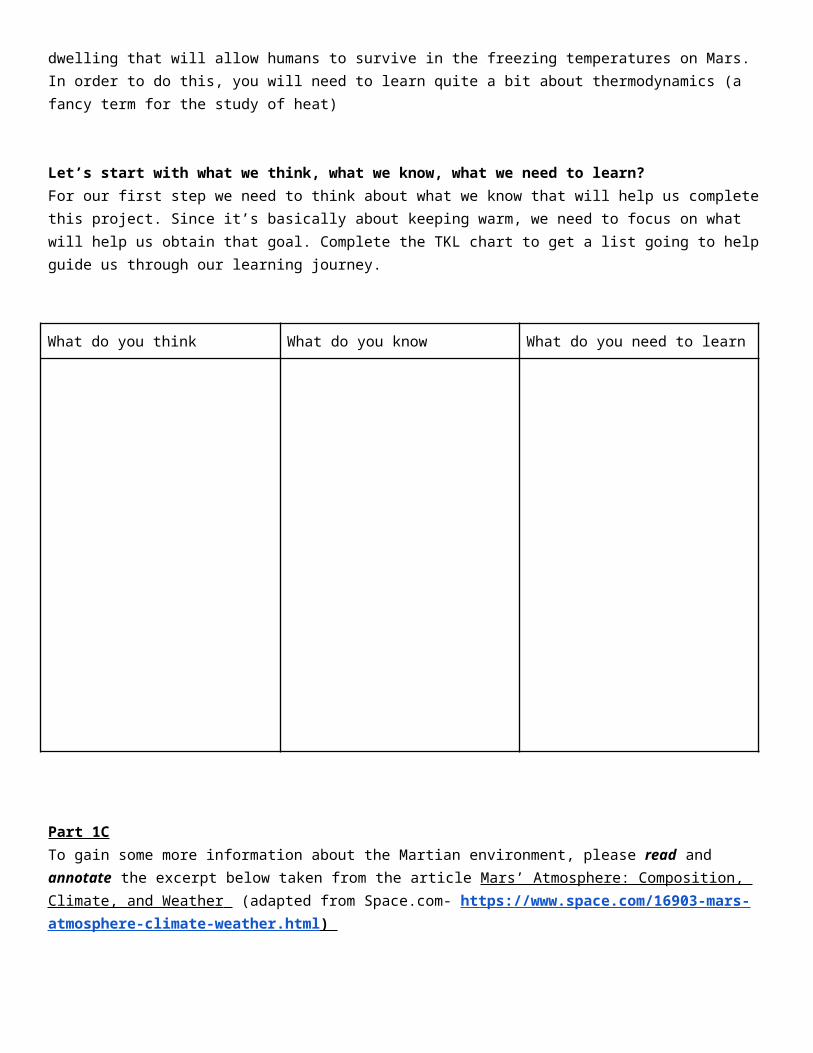
For our first step we need to think about what we know that will help us complete this project. Since it’s basically about keeping warm, we need to focus on what will help us obtain that goal. Complete the TKL chart to get a list going to help guide us through our learning journey.
What do you think What do you know What do you need to learn
Part 1CTo gain some more information about the Martian environment, please read and annotate the excerpt below taken from the article Mars’ Atmosphere: Composition, Climate, and Weather (adapted from Space.com- https://www.space.com/16903-mars-atmosphere-climate-weather.html )
Using evidence from the article, write a response to the prompt below:What are the major challenges that the Martian environment poses to sustaining human life on Mars?
Climate
Mars is much colder than Earth, in large part due to its greater distance from the sun. The average temperature is about minus 80 degrees Fahrenheit (minus 60 degrees Celsius), although they can vary from minus 195 F (minus 125 C) near the poles during the winter to as much as 70 F (20 C) at midday near the equator.
Mars has a thin atmosphere — too thin to easily support life as we know it. The carbon-dioxide-rich atmosphere of Mars is also roughly 100 times less dense than Earth's on average, but it is nevertheless thick enough to support weather, clouds and winds. The density of the atmosphere

varies seasonally, as winter forces carbon dioxide to freeze out of the Martian air. Here's a breakdown of the composition of Mars’s atmosphere:
● Carbon dioxide: 95.32 percent● Nitrogen: 2.7 percent● Argon: 1.6 percent● Oxygen: 0.13 percent
● Carbon monoxide: 0.08 percent● Also, minor amounts of: water, nitrogen oxide, neon, hydrogen-deuterium-oxygen, krypton and xenon
The thin atmosphere of Mars today composed mainly of carbon dioxide as depicted in this artist's illustration
Credit: NASA
The axis of Mars, like Earth's, is tilted with relation to the sun. This means that like Earth, the amount of sunlight falling on certain parts of the planet can vary widely during the year, giving Mars seasons.
However, the seasons that Mars experiences are more extreme than Earth's because the red planet's elliptical, oval-shaped orbit around the sun is more elongated than that of any of the other major planets. When Mars is closest to the sun, its southern hemisphere is tilted toward the sun, giving it a short, very hot summer, while the northern hemisphere experiences a short, cold winter. When Mars is farthest from the sun, the northern hemisphere is tilted toward the sun, giving it a long, mild summer, while the southern hemisphere experiences a long, cold winter.

Weather
Even though Mars’s atmosphere is roughly 100 times thinner than Earth's, it is still thick enough to support weather, clouds and winds.
NASA’s Mars Reconnaissance Orbiter found the first definitive detections of carbon-dioxide snow clouds, making Mars the only body in the solar system known to host the unusual winter weather. The red planet also causes water-ice snow to fall from the clouds.
The extremely thin air on Mars can also become very dusty. Giant dust devils routinely kick up the oxidized iron dust that covers Mars' surface. The dust storms of Mars are the largest in the solar system, capable of blanketing the entire red planet and lasting for months. One theory as to why dust storms can grow so big on Mars starts with airborne dust particles absorbing sunlight, warming the Martian atmosphere in their vicinity. Warm pockets of air flow toward colder regions, generating winds. Strong winds lift more dust off the ground, which in turn heats the atmosphere, raising more wind and kicking up more dust.
EXPLORE

Part 1D:Plotting data, examining graphs, and making connections
Your instructor will hand out a copy of temperature data from a “sol” (a sol is a martian day) and assign each group a specific sol’s data (Sol 2, or Sol 3, or Sol 4, etc.) to plot on a graph of time vs temperature. The data was obtained from the Mars Pathfinder and is found at this site:http://www-k12.atmos.washington.edu/k12/mars/LOPS_MPF_subset_data.html)
After your class’s groups have plotted the data, compare each group’s sol temperature data to one another (you may wish to hang them all up across the wall to make this easier). After looking at all the sol temperature data, answer the following questions:
1. What trends or patterns can you see in the data? Describe.
2. What does the graph of data show about Mar’s temperature throughout the day? Explain.
3. Only considering the temperature data that your class graphed, what do you think you need to make sure your Martian dwelling is able to do? Will it need to have different functions depending on the time of the day? Explain your thinking.
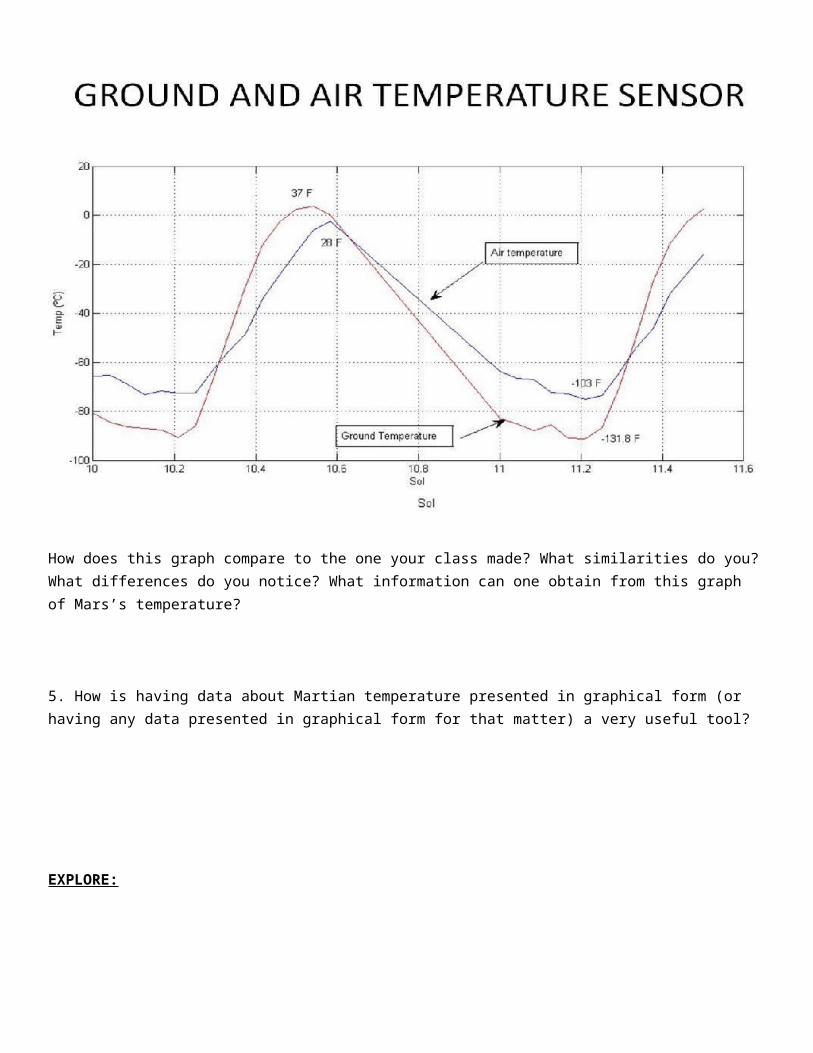
4. Below is a graph of Martian temperature data as measured by NASA’s Curiosity Rover. https://www.nasa.gov/mission_pages/msl/multimedia/pia16081.html
How does this graph compare to the one your class made? What similarities do you? What differences do you notice? What information can one obtain from this graph of Mars’s temperature?
5. How is having data about Martian temperature presented in graphical form (or having any data presented in graphical form for that matter) a very useful tool?
EXPLORE:
Part 2: How are heat and temperature related?
Part 2A- Phet SimulationYou will use the Phet computer simulation called “States of Matter” to explore what occurs at the molecular level when thermal energy (heat) is added or taken away from a system. https://phet.colorado.edu/en/simulation/states-of-matter-basics
Play around with the simulation to answer the questions below.
1. What changes do you notice occurs to the motion of the atoms or molecules as heat is added and the temperature increases? What about when heat is taken away from the system and temperature decreases?
2. Notice how not all the atoms or molecules are moving with the exact same speed at any certain temperature. You can see that some are faster or slower than the others. Why do you think there is this difference?
3. Kinetic energy is the energy of movement, and how much kinetic energy something has depends greatly on the speed at which it is traveling. Based on what you see occurring on average to the molecule (ignoring the few that have a far different speed than the rest), what could you say about the average molecular kinetic energy of a substance at a high temperature? At a low temperature?
4. It is important to collect data to determine how well your design performs. Since our mission is to make a Martian dwelling able to reach and maintain a temperature conducive for human inhabitation, we will need to take temperature data. Based on what you observed in this computer simulation, what do you think temperature is actually a measure of?
Part 2B- You’re dying to try this!

You will be given 2 small beakers (or clear plastic cups), a dropper and some colored dye. One beaker or cup you are to fill with cold water, and the other you are to fill with warm water. You can use a thermometer to record the temperatures of the waters to ensure that they are indeed different temperatures, one warm and one cold. Next, using the dropper, put a few drops of dye into each beaker and observe what occurs.
1. Make drawings of your observation of what happens to the dye within the first few seconds, after a minute, and after 5 minutes.
2. Write what you saw occur and detail how the dye behaved differently in the warm versus cold water.3. Based on what you saw in the Phet computer sim, formulate an explanation as to why the dye acted
differently in the different temperature waters.
Part 2C: EXPLAIN:Now watch the following video clip by the science youtube phenom Mr. Anderson for a bit more information and explanation on what you just explored in class: https://www.youtube.com/watch?v=B6hAwZH2mmA
Part 3: Heat Transfer and Thermal Equilibrium?
3A: Thinking about the terms:You will explore how heat is transferred between two objects at different temperatures, and what happens to those object’s temperatures over a length of time. One important term we will be using to describe what eventually occurs is called thermal equilibrium.Can you use clues from your own experience to guess what this word means?
Let’s just look at the first part of the term- “thermal.” Where have you heard the word thermal used, or what objects have you used or seen in everyday life that may have part of the word thermal in them? Discuss with your group and make a list.
When looking at your list of objects you just made, what is common among them? What are they all related to?Using these clues, what do you think the word thermal means?
Now let’s look at the second term- “equilibrium”. What word does the beginning of that word look similar to? (Hint: you use the word in math class all the time)
Now that you have used your background knowledge to analyze the word thermal equilibrium, what do you think the term means? With your group, come up with a definition and write it down. Be ready to share with the class and the instructor.
Part 3B: Thermal Equilibrium Lab

You will now design an experiment to investigate the question: What will happen to the temperatures of 3 containers of water (room temperature, hot water, and cold or ice water) that are left out to sit in the classroom for 15 minutes?
1.Hypothesis: Make a hypothesis with your group members as to what will occur to the temperatures of each beaker of water. You hypothesis should be in the “if...then” statement form. For example, “If I leave ice water out in the classroom for 15 minutes, then the temperature of the ice water will….”Make sure your group has a hypothesis written about what will occur for each beaker of water (all 3).
2. Create a prediction graph:It’s time to sketch what you think the graph of the temperature data will look like for the 3 beakers over the 15 minutes you will be collecting data.
● Discuss with your group members which variable (time or temperature) you think should go on the x-axis, and which should be on the y-axis.
● What type of scaling should you use for your graph?● Now on a sheet of graph paper, set up a rough graph and then using three different colored pencils,
draw lines of how you think the temperature of the water in each cup will change over the 15 minute time interval. (Be sure to include a key that tells which beaker, hot, cold, room temp., each line corresponds to).
● Next to your graph, write down your reasoning as to why you sketched each line on the graph the way you did (this should be based on your hypothesis)
3. Design your experiment:Discuss with your group members your experimental design. Some things to consider and discuss are:-what things should you try to keep constant (same)-what will you use to measure the water, what should hold the water, and how much water should you use? -how often should you take temperature data during the 15 minutes?-what should your data table look like? How will it be organized?
After you have discussed and the group has reached an agreement, write down your materials list (bulleted list) and your experimental procedure (numbered steps).
Show this to your instructor for feedback and/or approval. Once approved, you may begin your experiment and collecting data (Be sure to have your data table created and ready!)
4. Data and Graph:
Be sure to have your data table fully filled out. Get a sheet of graph paper and using three different colored pencils, graph the temperatures from the data table onto one set of axes.
5.Results Analysis/Conclusion:
Examining the results from the experiment by looking at your data and graph. Now it’s time to write the conclusion for your lab report. Your conclusion include discussions of the following:
● What was the purpose of this experiment? (What question was it designed to investigate?)● What was your hypothesis? Did the data support your prediction or not? How do you know?● What specifically happened to the temperature of each beaker of water? (make sure you discuss all
three, and include references to data to support your claims)● Where did the heat transfer come from in each case? (make sure you discuss all three)● Did the experiment show evidence of thermal equilibrium? Why or why not? If not, why do you think
that is? What would have to be changed to allow this?● How would you improve the design of your experiment? (what would you do differently next time and
why)● How can you use what this experiment showed to help you in the design of your Martian dwelling?
Part 3B- Explain:To learn more about how heat transfer will always flow from a hotter substance to a colder substance until they reach thermal equilibrium (and to learn more about what this thermal equilibrium concept is all about), check out the following:
https://www.youtube.com/watch?v=gzy4YFuKg9A
https://www.youtube.com/watch?v=vcgYQ-u7qfc
Part 3C- Elaborate:A student conducts an experiment in which a metal can of hot water is placed into a styrofoam cup of colder water. The student then takes temperature data for the two beakers each minute for several minutes.

The student then graphs his results and gets the following:
Use the graph to answer the following:
1. Which line represents hot water and which line represents the cold water? Explain your reasoning for your choice in terms of what you learned about the direction of heat transfer.
2. Looking at the shape of the lines (curved rather than straight), what information does this tell you about the rate of heat transfer and how it was changing during the experiment?
3. Why do the lines appear as though they will meet in the middle? What does this mean in regards to the temperature of each water?
4. If the student continued to take temp data for another hour, will the lines ever cross each other, or will they stay flat, or would they divert away from each other again? Explain what you think the graph would most likely look like and why. Draw a sketch of the extrapolated graph.
Part 4: Heat Transfer and Insulators and Conductors
Part 4A: A Touchy-Feely Heat Transfer Activity
Touch something metal in your classroom, such as the metal leg of your chair or desk. How does it feel? Now touch something made out of wood in your classroom, such as your desktop or a bookcase. How does that feel? Both of the materials you touched in the classroom have been in the same room for a very long time; so guess what that means in terms of their temperatures? If you said they should be in thermal equilibrium with

the temperature of the room, you did a great job relating what we learned last lesson to this experience. So the question remains, why do they feel like they are at different temperatures? Discuss with your group members and be prepared to share with your instructor and class.
If your discussions, some of your may have figured out that what you experienced has something to do with how various materials transfer heat differently. Scientist use the term conductor for something that easily allows heat transfer, and the term insulator for something that does not easily allow heat to transfer. From the “feeling experiment” you started with today, which of the materials you touched do you think are a conductor? Which are most likely a insulator? Discuss with your group.
In a moment you will be doing an experiment to determine which materials are an insulator or conductor. Before you do the lab, your instructor may want you to explore how animals use the concepts of insulation to help keep them alive in frigid climates. Here’s a link to Steve Spangler’s “Blubber Glove” activity; a fun and active way to relate this concept to the world all around us.
https://www.stevespanglerscience.com/lab/experiments/blubber-gloves/
Part 4B: Insulator vs. Conductor Materials LabYour instructor will provide you with various materials that you will be testing to see how easily they allow heat to be transferred through them to an icecube. Your group will be measuring the time it takes for the ice cube to melt for each material, and then use this data to conclude which material you think is a good insulator, and which is a good conductor of heat.
Conductors and Insulators Lab Materials and Procedure
SETUP AND TESTING PROCEDURE
o Create a data table that includes two columns:
o Material nameo Time required to melt ice cube
o Send one person from your group up to pick up the supplies:
o One small beakero One medium beakero Material #1
o Send one person up to pick up a graduated cylinder of hot water and an ice cube
o Put the hot water into the medium beaker and immediately return the graduated cylinder to front
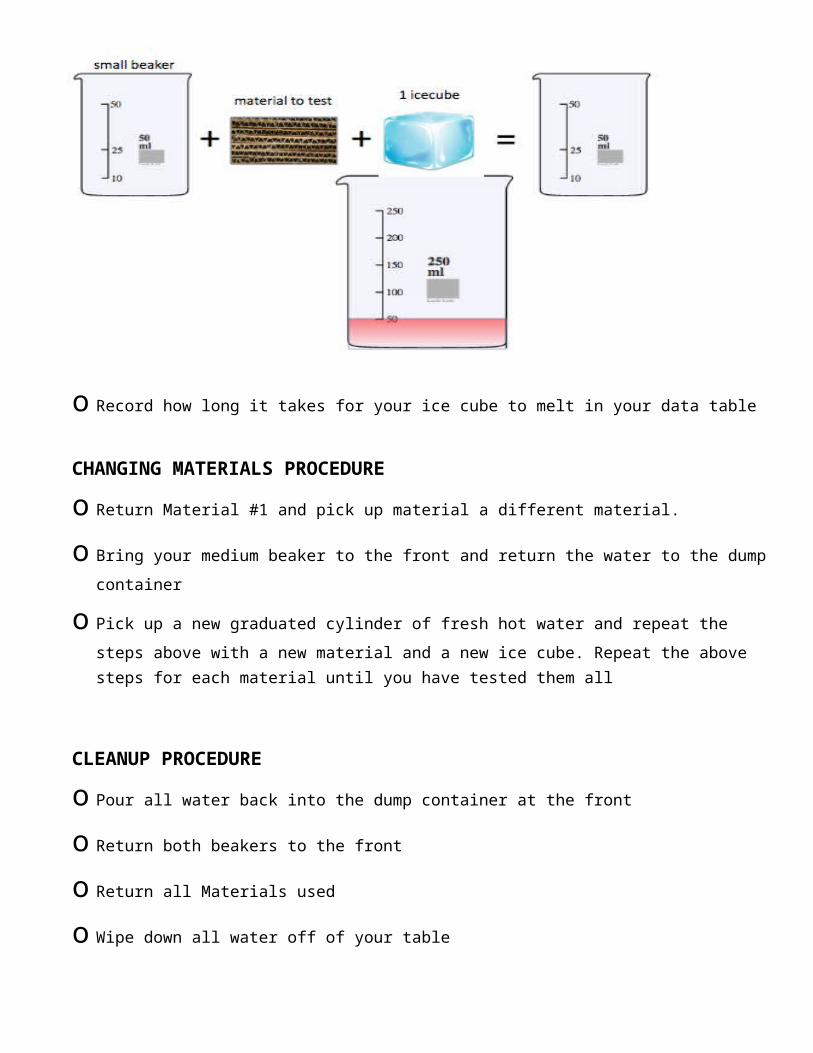
o Put Material #1 in the small beaker, place the ice cube on top of Material #1, and put the small
beaker into the medium beaker (See diagram)

o Record how long it takes for your ice cube to melt in your data table
CHANGING MATERIALS PROCEDURE
o Return Material #1 and pick up material a different material.
o Bring your medium beaker to the front and return the water to the dump container
o Pick up a new graduated cylinder of fresh hot water and repeat the steps above with a new
material and a new ice cube. Repeat the above steps for each material until you have tested them all
CLEANUP PROCEDURE
o Pour all water back into the dump container at the front
o Return both beakers to the front
o Return all Materials used
o Wipe down all water off of your table
Conclusion Questions: 1. Rank the materials from best conductor to best insulator. Explain using your observations and
data from the experiment why you gave each the ranking you did.2. How will you use what the lab today demonstrated about conductors and insulators to help you in
the design of your Martian dwelling?

Part 4C- Explain:
Check out the following links for some more content on definitions, examples, and differences between thermal conductors and insulators:
https://www.ck12.org/physical-science/Thermal-Conductors-and-Insulators-in-Physical-Science/lesson/Thermal-Conductors-and-Insulators-MS-PS/
http://www.bbc.co.uk/bitesize/ks2/science/materials/heat/read/1/
Part 4D- Elaborate:
Writing Task: CER ParagraphYou stop by Dunkin Donuts on the way home from school to buy a hot coffee. The cashier gives you three options:
1) An aluminum coffee cup2) A plastic cup3) A Styrofoam cup
If your goal is for the coffee to stay hot for as long as possible, which of the containers would be the worst choice and which one would be the best choice?
You should write two CER (Claim, Evidence, Reasoning) paragraphs below: ● One paragraph that says which cup is the best choice and why● One paragraph that says which cup is the worst choice and why● Be sure to include the words “conductor”, “insulator”, and “heat transfer” in your response
Part 5: Specific Heat
Part 5A: Examining heating data and making inferences:

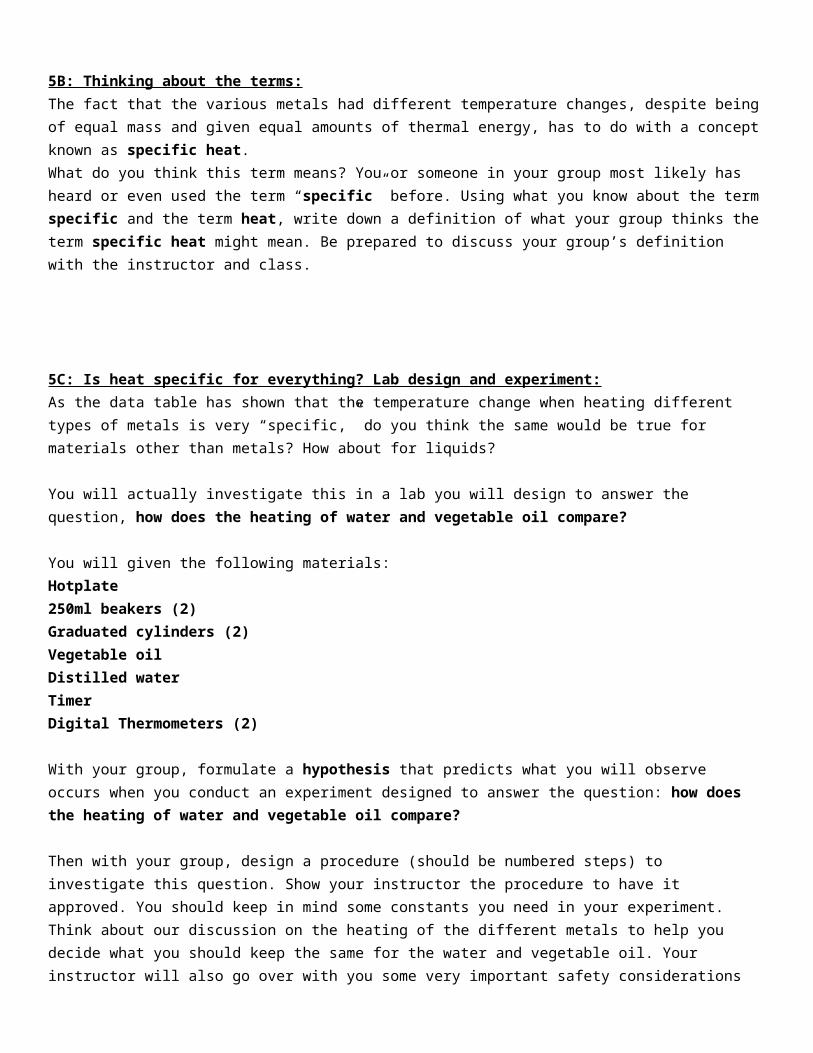
A student is given 4 different metals of equal mass (100 grams). The student heats each metal for equal amounts of time, giving each equal amounts of thermal energy (3000J). The student then created a data table that shows how much each metal changed its temperature.
With your group, examine the data table. Discuss and answer the following questions:
● What conclusions can be made from the data table?● Since the same amount of heat was added to equal amounts of mass, what do you think caused the
results? (Why did the data come out like this? What do you think caused that to happen?)● Could you design your own follow up experiment that could be used to confirm or refute what the
student observed happened in their experiment? What would your experiment look like? What would you do?
5B: Thinking about the terms:The fact that the various metals had different temperature changes, despite being of equal mass and given equal amounts of thermal energy, has to do with a concept known as specific heat. What do you think this term means? You or someone in your group most likely has heard or even used the term “specific” before. Using what you know about the term specific and the term heat, write down a definition of what your group thinks the term specific heat might mean. Be prepared to discuss your group’s definition with the instructor and class.
5C: Is heat specific for everything? Lab design and experiment:As the data table has shown that the temperature change when heating different types of metals is very “specific,” do you think the same would be true for materials other than metals? How about for liquids?
You will actually investigate this in a lab you will design to answer the question, how does the heating of water and vegetable oil compare?
You will given the following materials:Hotplate250ml beakers (2)Graduated cylinders (2)Vegetable oilDistilled waterTimerDigital Thermometers (2)
With your group, formulate a hypothesis that predicts what you will observe occurs when you conduct an experiment designed to answer the question: how does the heating of water and vegetable oil compare?
Then with your group, design a procedure (should be numbered steps) to investigate this question. Show your instructor the procedure to have it approved. You should keep in mind some constants you need in your experiment. Think about our discussion on the heating of the different metals to help you decide what you should keep the same for the water and vegetable oil. Your instructor will also go over with you some very important safety considerations for this lab, since you will be using a hotplate, glassware, and will be heating water and oil.
After your procedure has been approved, create a data table with your group to be used to collect data during the experiment. It should have columns for time intervals, and temperatures for the substances (water and oil)
Conduct your experiment and take down the data as well as any observations.
Using a piece of graph paper, construct a line graph of your data. The heating data for both the water and vegetable oil should be on the same graph (temperature y-axis and time x-axis), so it may be helpful to use a different colored pencil for water and vegetable oil data.
Examining the results from the experiment by looking at your data and graph. Now it’s time to write the conclusion for your lab report. Your conclusion include discussions of the following:
● What was the purpose of this experiment? (What question was it designed to investigate?)● What was your hypothesis? Did the data support your prediction or not? How do you know?● Compare how the water vs the oil each heated. Use data to back up your claims.● What do your results indicate about how easy it is to heat up water vs vegetable oil? How is this
related to our discussion about the term specific heat? ● Connecting what you did in lab to the real world, how do you think your lab results help you
understand why people often use vegetable oil for cooking?● How would you improve the design of your experiment? (what would you do differently next time and
why)
5D: Explain- what specifically is specific heat anyways?Once again we will turn to our friend Mr. Anderson to give us some information on what exactly is specific heat and how it explains why different materials change temperatures differently when given the same amount of thermal energy
https://www.youtube.com/watch?v=OBVbV5dpCCA&t=240s
Check out some more about specific heat and how we can use it, the mass of the object, and the temperature change to determine the exact amount of heat (thermal energy) that was transferred:
http://hyperphysics.phy-astr.gsu.edu/hbase/thermo/spht.html
Here’s a video of a sample calculation:
https://www.youtube.com/watch?v=5UzbzPOwIwQ
5 E: Elaborate- Do your calculations!After having read about specific heat and thermal energy and watching the sample calculations, calculate the amount of thermal energy (heat) that was transferred into the water, and also into the vegetable oil. The specific heat value of vegetable oil is 1,670 J/gC and the specific heat of water is 4,184 J/gC. (Hint: 1ml of water = 1g, and assume that 1ml vegetable oil is = 1g)
Show your calculations below
Based on the known values of the specific heat of vegetable oil and water given above, how does this information help you explain what you saw occur in your lab and your lab’s results?
5F: Extend: 1. How is this knowledge of what we did and learned about specific heat help us understand our results
and what occurred in our previous conductors and insulators lab? Explain2. Go to the site: https://concord.org/stem-resources/conduction-heat-conduction-through-materials
Watch the simulation of heat transfer through the various materials. Based on the data from the simulation, which of the materials do you think has the lowest specific heat; which would have the highest?Look up the values of specific heat for the materials at: http://www.engineeringtoolbox.com/specific-heat-capacity-d_391.htmlDo these values support what you thought?3. Will you need materials of low specific heat, high specific heat, or both for use in your Martian dwelling? Explain your reasoning for your choices.
Part 6- Explore: Methods of Heat Transfer
Part 6A: Methods of Heat Transfer Stations
Your instructor has set up 3 different stations around the room, each showing a different method of heat transfer.
Station 1: Conduction- beaker of hot water with metal, plastic, and wooden spoonStation 2: Convection- beaker of room temperature water, with small beaker with warm colored water (red) and small beaker with cold colored water (blue) and 2 droppers
Station 3: Radiation- different colored paper (white, black, shiny aluminum) under a heat lamp
With your group, you will rotate to each station, making predictions, observing what occurs, and answering the questions below:
Conduction Station Questions:
1) Feel each spoon. Which spoon allows the transfer of heat to happen easier? Which spoon does not easily transfer heat?
2) Only the end of each spoon is submerged in the hot water. How do you think the heat is transferred up to the top of the spoon?
3) From your experience with the spoons, which material do you think would be a good conductor and which do you think would be a good insulator?
Convection Demo Questions:
1) What do you think will happen to the cold water (blue) when a few drops of it is put into the beaker of room temperature water?
2) What do you think will happen to the hot water (red) when a few drops of it are put into the beaker of room temperature water?
3) After you observe what happens to the drops of cold water and the drops of hot water, write down why you think the hot water and cold water behave this way?
4) What do you think will happen to the cold water if it got heated up? (i.e. where will it go in the beaker?)
Radiation Questions:
1) Feel each surface (white paper, black paper, silver foil). Which feels the hottest, which feels the coolest?
2) Why do you think each material feels differently if they each are getting the same amount of thermal energy (heat) from the heat lamp?
3) Based on what you observed at this station,if it was a hot sunny day and you were outside without any shade, what color shirt would you probably not want to wear? Why? What color shirt do you think would be best to wear on a hot sunny day?
Part 6B: Explain-After finishing each station and discussing what occurred with your group members and your class, go to the following link to get to the Eureka Physics Video Player. http://www.animatedscience.co.uk/flv/Watch videos #24, 27, 29 and take notes to learn about the 3 methods of heat transfer: conduction, convection, radiationAlso check out Mr. Anderson’s video for a great overview of the 3 methods of heat transfer as well as a quick review of some heat concepts we learned earlier in this unit.https://www.youtube.com/watch?v=ldMcDvm29eA
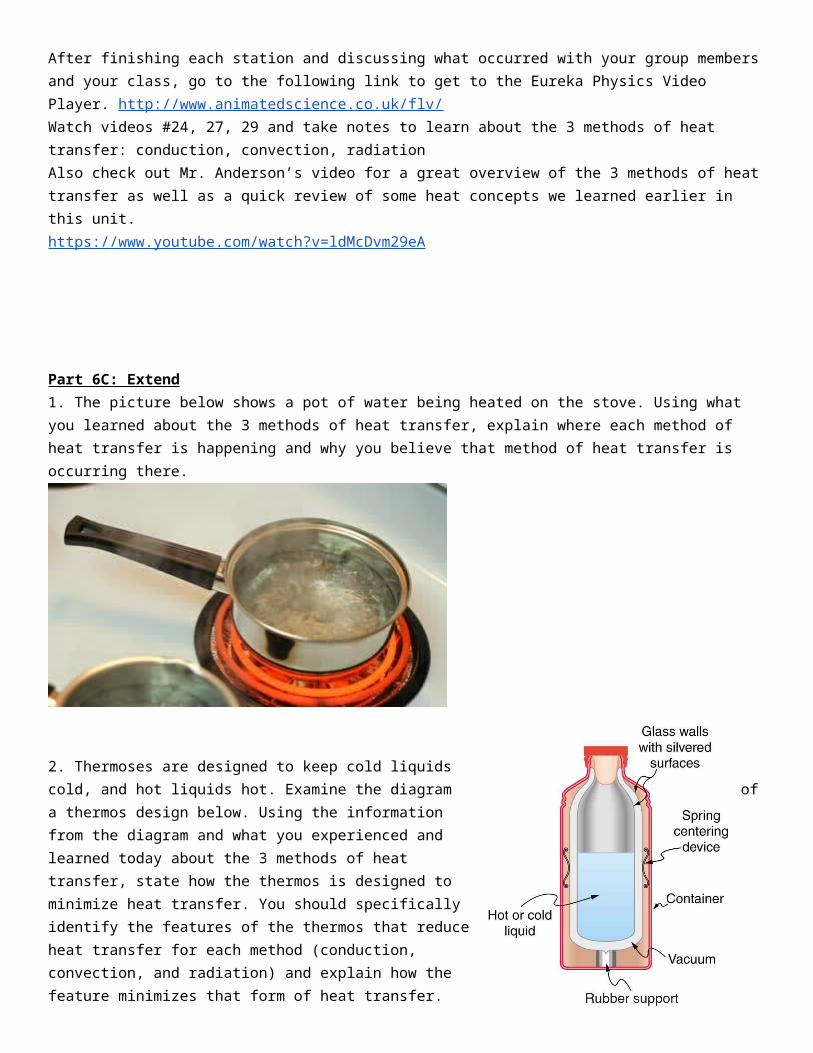
Part 6C: Extend1. The picture below shows a pot of water being heated on the stove. Using what you learned about the 3 methods of heat transfer, explain where each method of heat transfer is happening and why you believe that method of heat transfer is occurring there.
2. Thermoses are designed to keep cold liquids cold, and hot liquids hot. Examine the diagram of a thermos design below. Using the information from the diagram and what you experienced and learned today about the 3 methods of heat transfer, state how the thermos is designed to minimize heat transfer. You should specifically identify the features of the thermos that reduce heat transfer for each method (conduction, convection, and radiation) and explain how the feature minimizes that form of heat transfer.
3. How can you incorporate all 3 methods of heat transfer effectively in your Martian dwelling. Be specific and explain!

Part 7: Elaborate- Bringing the Heat to Mars!
When you were first introduced to this unit, you learned a bit about the Martian environment and the challenges it poses to sustaining human life. One major consideration is the climate on Mars. You studied Martian temperature data and graphs and learned there are large temperature fluctuations, and that in general the average temperature on Mars is quite cold.
Your mission is to design a dwelling that is able to maximize the amount the transfer of solar energy from the sun into thermal energy (heat). You have probably seen solar panels on houses or even on your calculator that convert solar energy into electrical energy. Solar panels will be handy on Mars to help power vehicles and the devices that you would have in your Martian home (such as lights, computers, etc.),, but for this project we want you to directly convert solar energy into heat.
You need to design your dwelling to reach the highest possible temperature inside within the 15 minute time frame. You also want to make sure that your device is insulated enough that it will not lose heat to the outside air while it is heating during the cooling phase. If you are successful in this project, your proof of concept will help NASA translate features of your design into building future Martian shelters that are able to keep our astronauts from freezing!
You will need to discuss with your group members what materials you should use and how the device should be designed, look, and function. Your instructor may provide some materials for you to use (such as cardboard boxes, aluminum foil, plastic wrap, tape, etc.), but you may also be able to bring in some of your own. Check with your teacher.
You should consider all we learned in this unit and use that knowledge to help your group complete this mission. (For example, so things to consider are:. What materials were good conductors, what were good insulators, where should these materials be incorporated? How can your device use all 3 methods of heat transfer? What features should your device have to allow it to capture heat, and then also keep it in?)
Eventually your group will have to present their design, data, and results to the class. There are a variety of formats you can use to do this, such as a paper, poster, video, or combination of these, but each group will have to present their findings to the class in a five minute presentation in which every member of the group contributes equally (equal talk time).
For your presentation, regardless of what format you choose, your group should consider the following:
● Data tables and graphs are typical ways scientists present their results, so be sure to have these!● A hypothesis statement as to why you choose your design and materials (backed by sound scientific
reasoning)● What was the total temperature change of the air inside the dwelling during the 15 minute time frame?● Did your dwelling include features for both absorbing heat, and also for keeping the heat in? If so,
explain how.● Discuss where each of the 3 methods of heat transfer is occurring in your dwelling, and explain how
your design could take advantage of each of the 3 methods of heat transfer (conduction, convection, radiation)

● Describe the direction of heat flow and how this works to heat your dwelling ● Discuss what would happen to the temperature inside the dwelling if you took it away from direct
sunlight. Be sure to relate what you think will happen to the concept of thermal equilibrium.● Compare your results with the class data—how did your design do? If you were to take a trip to Mars,
would you use your dwelling, or a different group’s dwelling? Explain.● After testing your dwelling, what do you think worked well? What would you do differently next time if
you could design it again?● Where could there have been (experimental!) errors in your data collection?● What question(s) would you ask in a follow-up experiment, that would extend this experiment, clarify
uncertainties, or take it in a new direction?● How is what you learned in this experiment important for others to know? (i.e., How could it help a
future scientist or astronaut getting ready for a trip to Mars?)
Grading Rubric(see next page)
For Instructors- Heat Unit Project Based Unit Information
Grade Level/Subject 9-12, Introductory Physics
Suggested Time Approx. 3 weeks (50min-60min.) periods; less time for block schedule (80-90min)
Purpose Students will learn concepts of thermodynamics by relating it to a challenging problem framed within a real world context. Scientific and engineering principles will be utilized by students to throughout the unit.
Objectives By the end of this project based unit, SWBAT:● Visualize, model, and describe the kinetic molecular theory of heat● Understand and relate to real context the flow of heat transfer and
thermal equilibrium● Identify and distinguish between thermal conductors and insulators
and understand the importance this distinction has to engineering.● Relate the relationship of the amount of thermal energy needed to the
variables of mass, specific heat, and temperature change using quantitative means and mathematics.
● Explain the three different mechanisms of heat transfer and relate to real world examples/contexts
● Engineer a device requiring certain constraints that incorporates the above knowledge into its design.
Standards
[MA 2016 Science and Technology (NGSS)/Common Core/Science & Engineering Practices]
MA 2016 Sci/Tech Standards:
HS-PS3-1. Use algebraic expressions and the principle of energy conservation to calculate the change in energy of one component of a system when the change in energy of the other component(s) of the system, as well as the total energy of the system including any energy entering or leaving the system, is known. Identify any transformations from one form of energy to another, including thermal, kinetic, gravitational, magnetic, or electrical energy, in the system.
HS-PS3-2. Develop and use a model to illustrate that energy at the macroscopic scale can be accounted for as either motions of particles and objects or energy stored in fields.
HS-PS3-3. Design and evaluate a device that works within given constraints to convert one form of energy into another form of energy.*
HS-PS3-4a. Provide evidence that when two objects of different temperature are in thermal contact within a closed system, the transfer of thermal energy from higher- temperature objects to lower-temperature objects results in thermal equilibrium, or a more uniform energy distribution among the objects and that temperature changes necessary to achieve thermal equilibrium depend on the specific heat values of the two substances.
Common Core:
CCSS.ELA-LITERACY.RST.9-10.3Follow precisely a complex multistep procedure when carrying out experiments, taking measurements, or performing technical tasks, attending to special cases or exceptions defined in the text.
CCSS.ELA-LITERACY.RST.9-10.4Determine the meaning of symbols, key terms, and other domain-specific words and phrases as they are used in a specific scientific or technical context relevant to grades
CCSS.ELA-LITERACY.RST.9-10.5Analyze the structure of the relationships among concepts in a text, including relationships among key terms (e.g., force, friction, reaction force, energy).
CCSS.ELA-LITERACY.RST.9-10.7Translate quantitative or technical information expressed in words in a text into visual form (e.g., a table or chart) and translate information expressed visually or mathematically (e.g., in an equation) into words.
CCSS.ELA-LITERACY.RST.9-10.1Cite specific textual evidence to support analysis of science and technical texts, attending to the precise details of explanations or descriptions.
Science and Engineering Practices:
All 8 of the science and engineering practices are incorporated within this project based unit. For reference, the eight science and engineering practices are:
1. Asking questions and Defining Problems2. Developing and Using Models3. Planning and Carrying Out Investigations4. Analyzing and Interpreting Data5. Using Mathematics and Computational Thinking6. Construction Explanations and Designing Solutions7. Engaging in Arguments from Evidence8. Obtaining, Evaluating and Communicating Information
For further information about the Sci/Eng Practices, please see appendix F in the NGSS standards. A direct link to the NGSS appendices:https://www.nextgenscience.org/get-to-know
Assessment The main crux of assessing the students’ learning from this unit is through the development, progress, and presentation of the final project. A rubric is included in the unit for student reference of expectations as well as a guide for instructor grading.Of course, numerous formative assessments should be employed by the educator through the unit, which can take the form of discussions, questioning, total participation practices, etc. Responses to the various readings, questions, and labs throughout the unit can serve as mini-summative assessments for the instructor gauge the progression of student understandings as well as providing material for grading throughout the unit.
7E Learning Cycle Model:http://searkscience.pbworks.com/f/Slide1.JPG