Embed Size (px)
Citation preview
Climate Means and Climate Variability Scenarios for Mainland Southeast Asia for Impact and
Vulnerability Assessments
Anond Snidvongs1
John L. McGregor2
Nguyen Kim Chi2
Wirote Laongmanee1
Weerasak Weerakant1
Jantira Ratanarat1
1Southeast Asia START Regional Center, Bangkok, Thailand2CSIRO Atmospheric Research, Aspendale, Australia
Outline
Why do we need climate mean and climate variability
CCAM for SE domain and its ‘raw’ outputs
Empirical adjustment of CCAM rainfall outputs
Climate change scenario for each sub-domain
Our scenarios in comparison with others
Projected climate means and variability for each sub domain and at our 3 IV&A Assessment sites
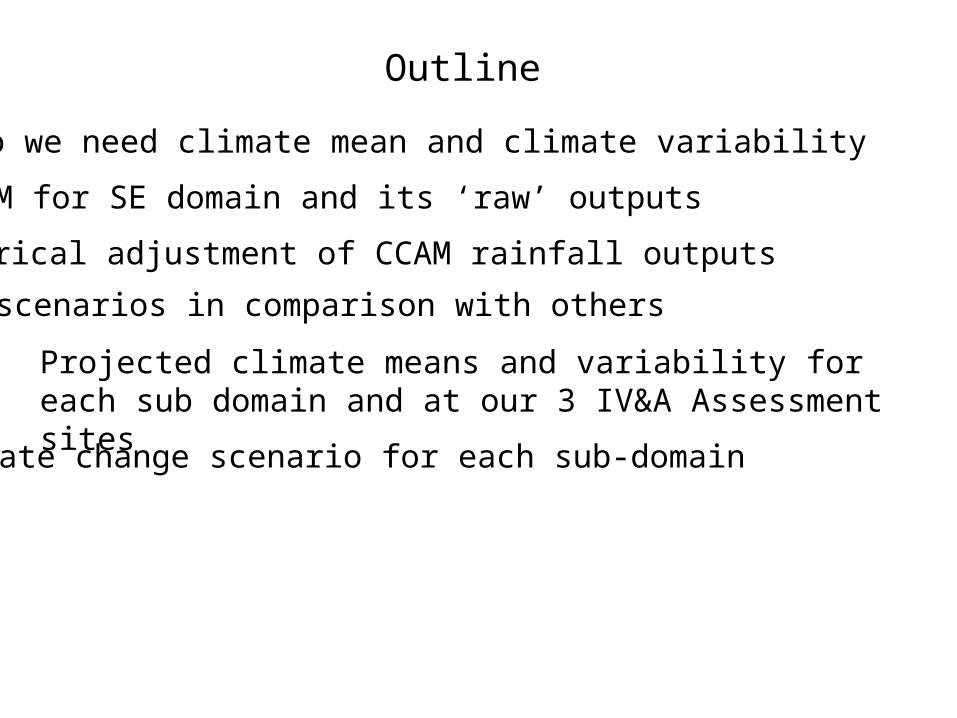
CCAM for Southeast AsiaSome Important Features•18 vertical levels•Final output domain: 5o-35o N and 92o-110o E•Output resolution was interpolated to 0.1o (about 10 km)
Some Selected Daily Outputs•Tmax, min and avg T (oC)•Rainfall (mm/d)•Wind speed (m/s) and direction•Radiation (W/m2)•Specific humidity (kg/kg)•Heat flux (W/m2)•Pressure (hPa)•Cloud cover (%)
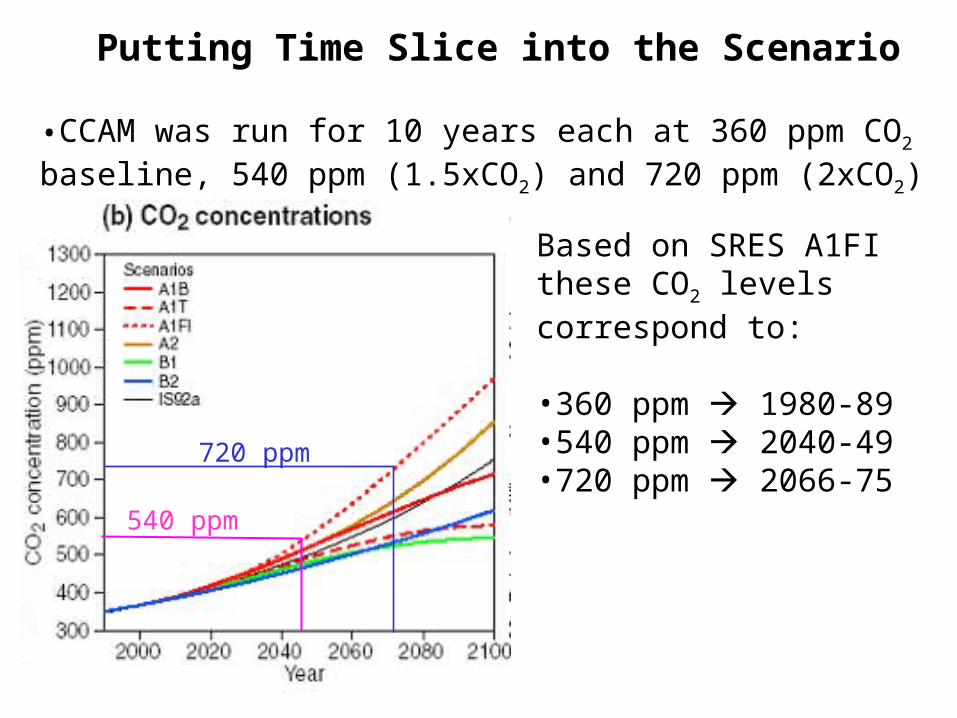
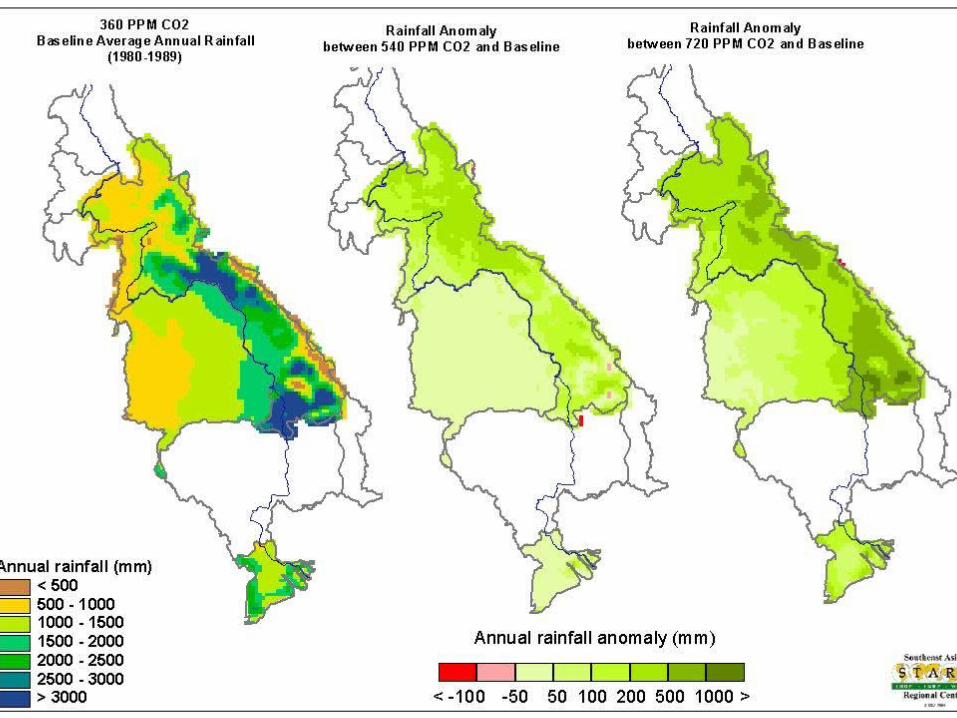
Putting Time Slice into the Scenario
•CCAM was run for 10 years each at 360 ppm CO2 baseline, 540 ppm (1.5xCO2) and 720 ppm (2xCO2)
540 ppm
720 ppm
Based on SRES A1FI these CO2 levels correspond to:
•360 ppm 1980-89•540 ppm 2040-49•720 ppm 2066-75
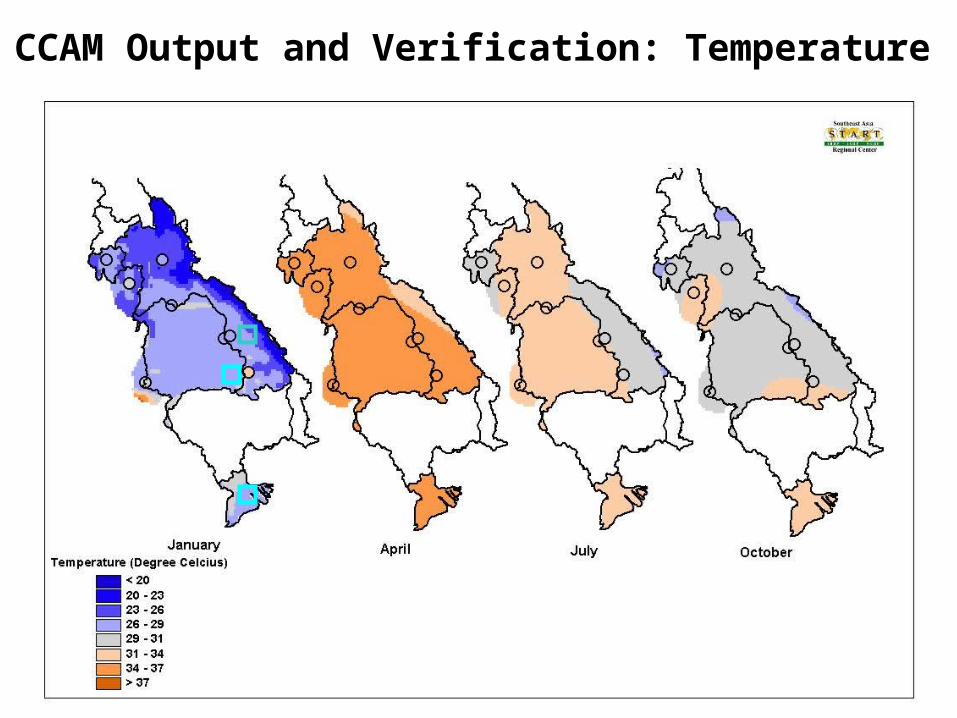
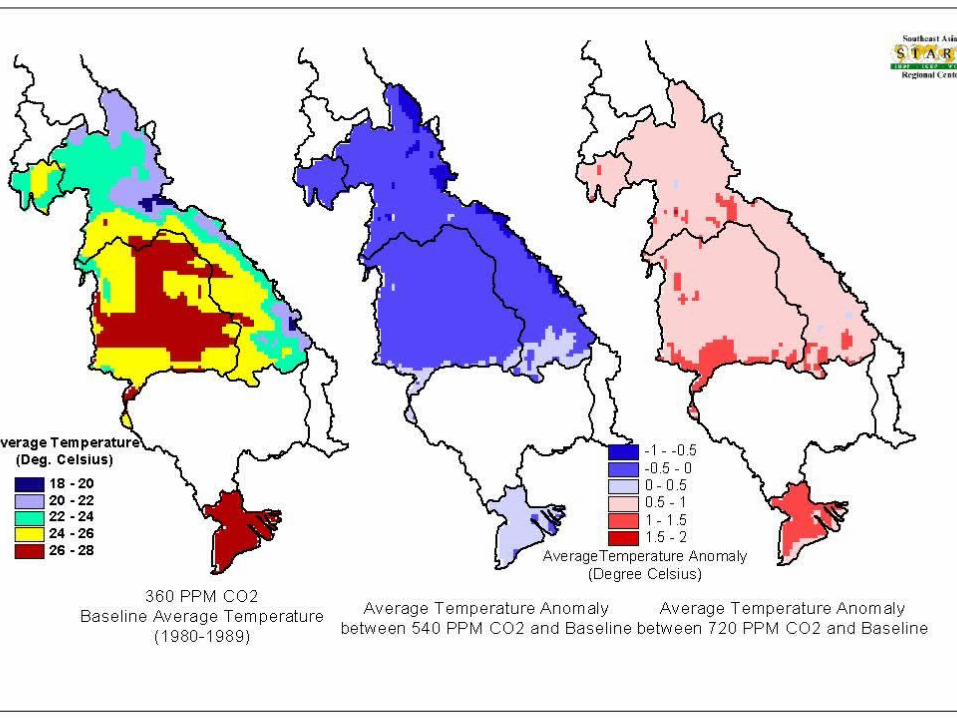
CCAM Output and Verification: Temperature
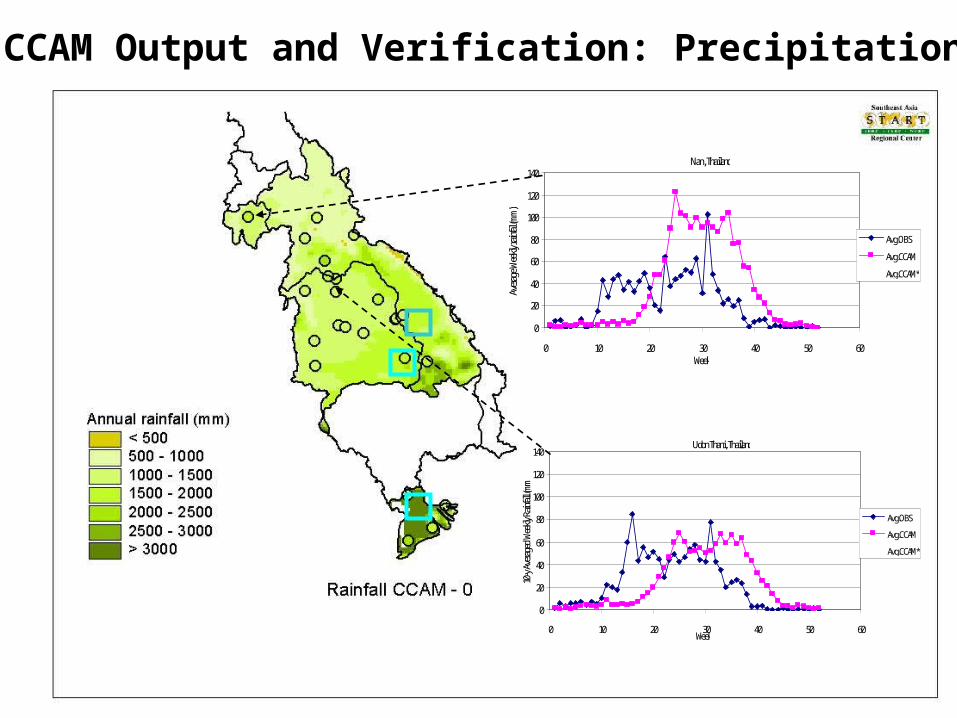
CCAM Output and Verification: Precipitation
Nan, Thailand
0
20
40
60
80
100
120
140
0 10 20 30 40 50 60Week
Averag
e Wee
kly ra
infal
(mm)l
Avg.OBS
Avg.CCAM
Avg.CCAM*
Udon Thani, Thailand
0
20
40
60
80
100
120
140
0 10 20 30 40 50 60Week
10-y Ave
rage
d Wee
kly Rain
fall (mm)
Avg.OBS
Avg.CCAM
Avg.CCAM*
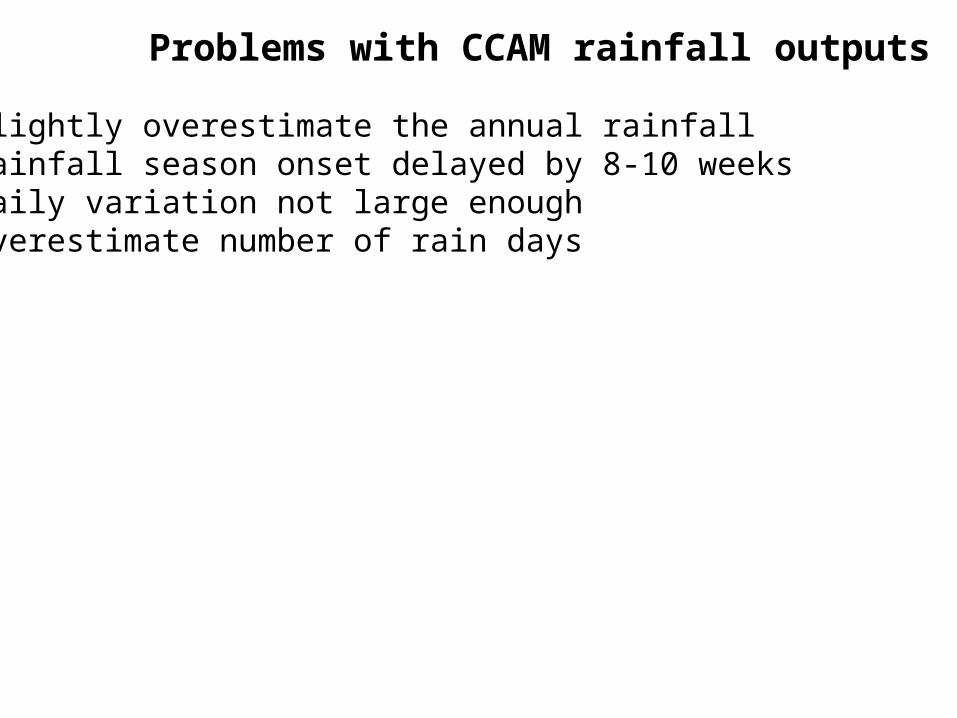
Problems with CCAM rainfall outputs
1. Slightly overestimate the annual rainfall2. Rainfall season onset delayed by 8-10 weeks3. Daily variation not large enough4. Overestimate number of rain days
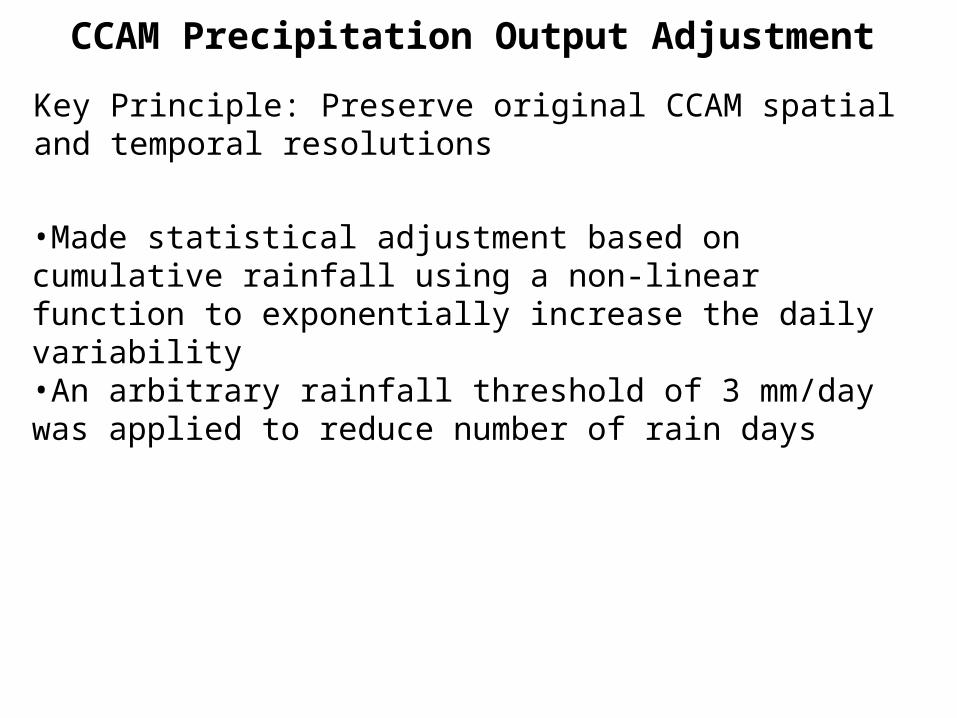
CCAM Precipitation Output Adjustment
Key Principle: Preserve original CCAM spatial and temporal resolutions
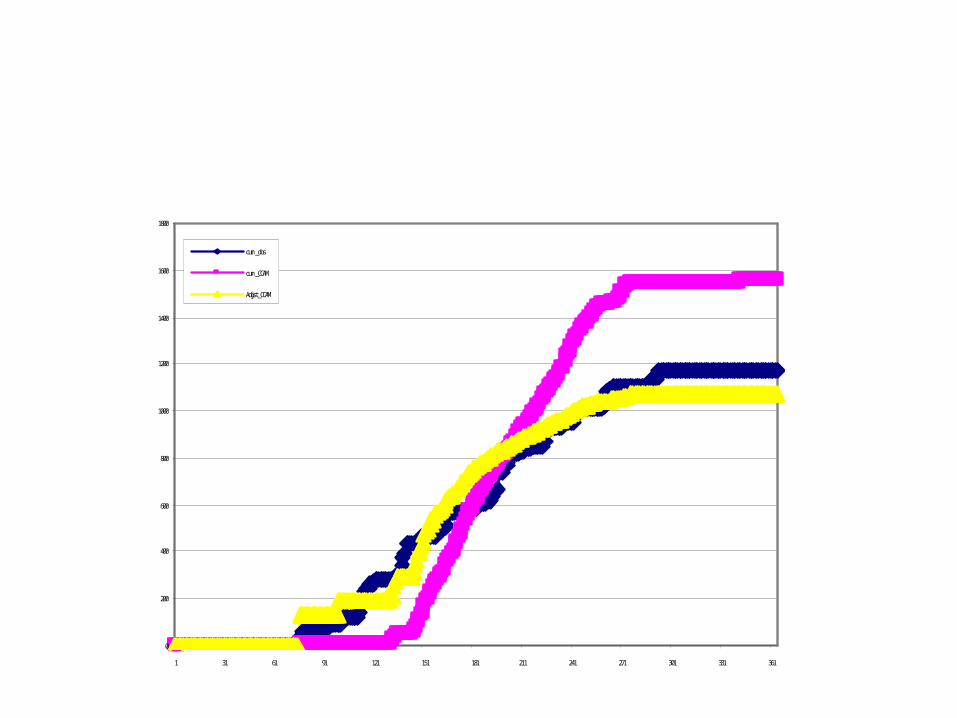
•Made statistical adjustment based on cumulative rainfall using a non-linear function to exponentially increase the daily variability•An arbitrary rainfall threshold of 3 mm/day was applied to reduce number of rain days
0
200
400
600
800
1000
1200
1400
1600
1800
1 31 61 91 121 151 181 211 241 271 301 331 361
cum_obs
cum_CCAM
Adjust_CCAM
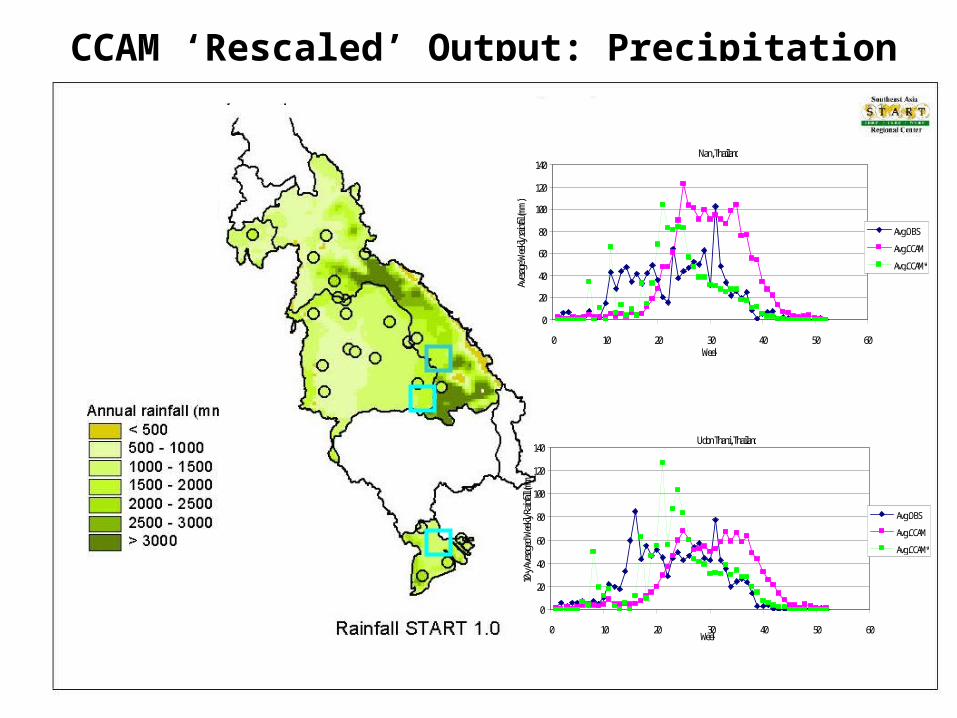
CCAM ‘Rescaled’ Output: Precipitation
Udon Thani, Thailand
0
20
40
60
80
100
120
140
0 10 20 30 40 50 60Week
10-y Ave
rage
d Wee
kly Rain
fall (mm)
Avg.OBS
Avg.CCAM
Avg.CCAM*
Nan, Thailand
0
20
40
60
80
100
120
140
0 10 20 30 40 50 60Week
Averag
e Wee
kly ra
infal
(mm)l
Avg.OBS
Avg.CCAM
Avg.CCAM*
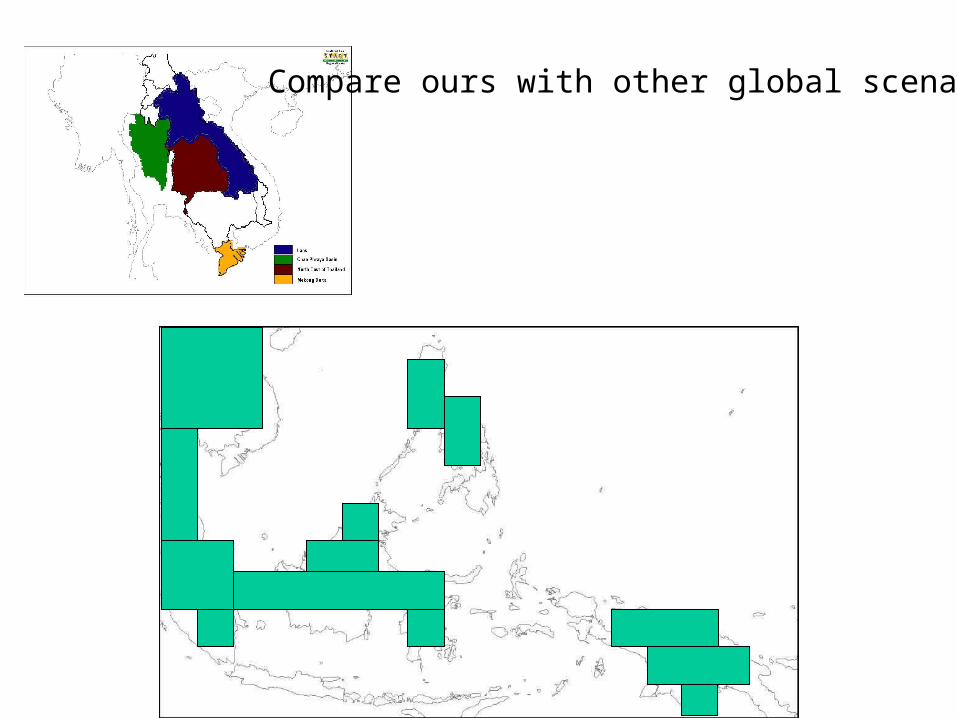
Compare ours with other global scenarios
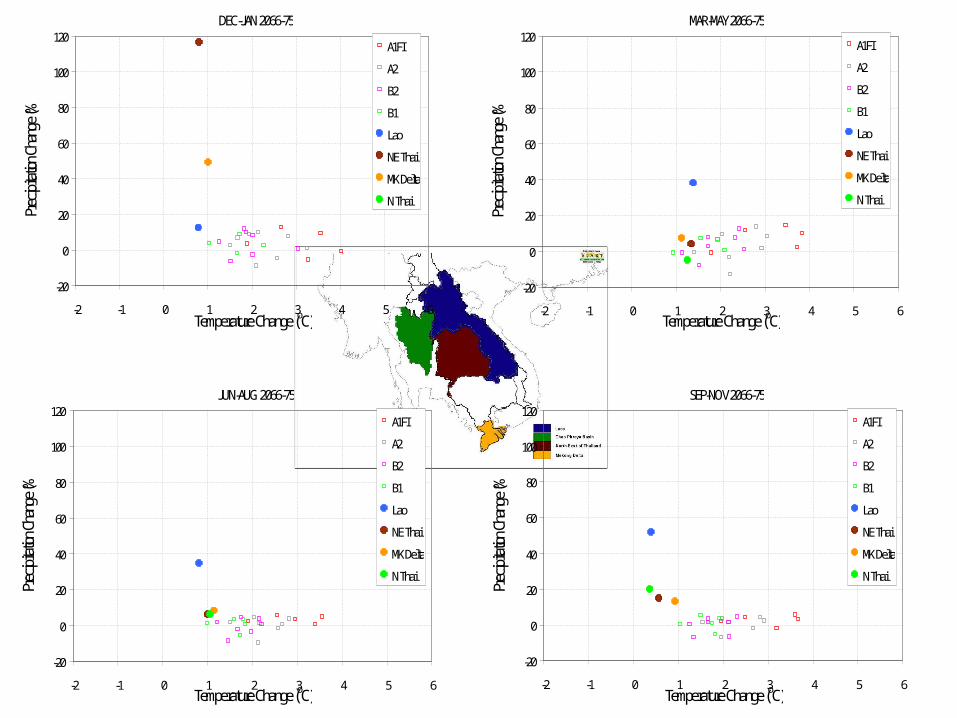
DEC-JAN 2066-75
-20
0
20
40
60
80
100
120
-2 -1 0 1 2 3 4 5 6Temperature Change (oC)
Prec
ipita
tion C
hang
e (%)
A1FI
A2
B2
B1
Lao
NE Thai
MK Delta
N Thai
MAR-MAY 2066-75
-20
0
20
40
60
80
100
120
-2 -1 0 1 2 3 4 5 6Temperature Change (oC)
Prec
ipita
tion C
hang
e (%)
A1FI
A2
B2
B1
Lao
NE Thai
MK Delta
N Thai
JUN-AUG 2066-75
-20
0
20
40
60
80
100
120
-2 -1 0 1 2 3 4 5 6Temperature Change (oC)
Prec
ipita
tion C
hang
e (%)
A1FI
A2
B2
B1
Lao
NE Thai
MK Delta
N Thai
SEP-NOV 2066-75
-20
0
20
40
60
80
100
120
-2 -1 0 1 2 3 4 5 6Temperature Change (oC)
Prec
ipita
tion C
hang
e (%)
A1FI
A2
B2
B1
Lao
NE Thai
MK Delta
N Thai
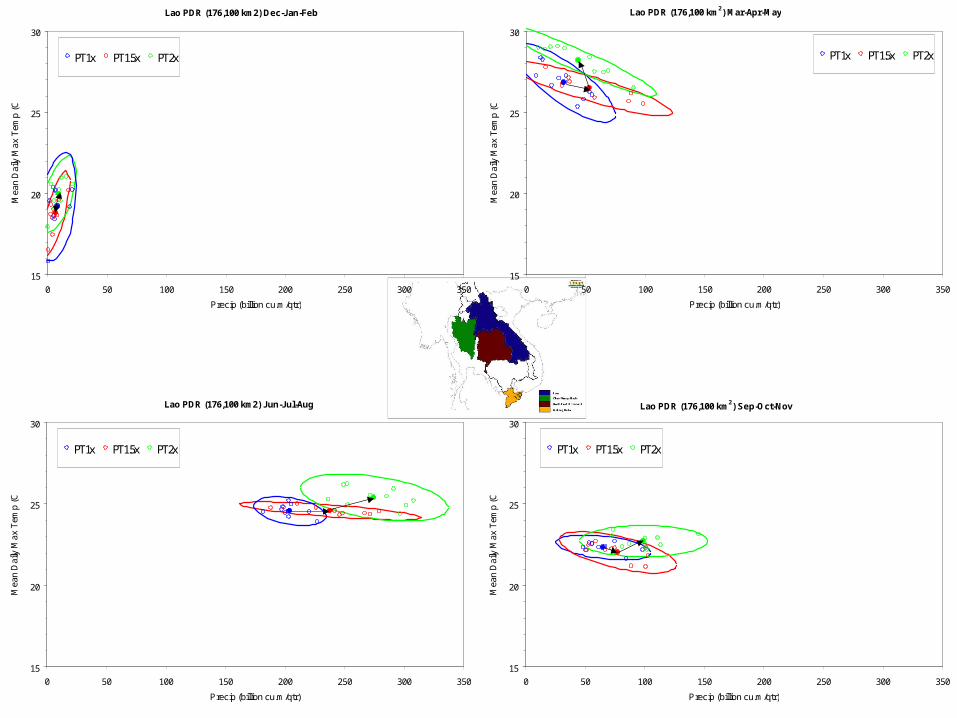
15
20
25
30
0 50 100 150 200 250 300 350
Precip (billion cu.m/qtr)
Mea
n D
aily
Max
Tem
p (C
)
PT 1x PT 1.5x PT 2x
Lao PDR (176,100 km2) Mar-Apr-May
15
20
25
30
0 50 100 150 200 250 300 350
Precip (billion cu.m/qtr)
Mea
n D
aily
Max
Tem
p (C
)
PT 1x PT 1.5x PT 2x
Lao PDR (176,100 km2) Jun-Jul-Aug
15
20
25
30
0 50 100 150 200 250 300 350
Precip (billion cu.m/qtr)
Mea
n D
aily
Max
Tem
p (C
)
PT 1x PT 1.5x PT 2x
Lao PDR (176,100 km2) Sep-Oct-Nov
15
20
25
30
0 50 100 150 200 250 300 350
Precip (billion cu.m/qtr)
Mea
n D
aily
Max
Tem
p (C
)
PT 1x PT 1.5x PT 2x
Lao PDR (176,100 km2) Dec-Jan-Feb
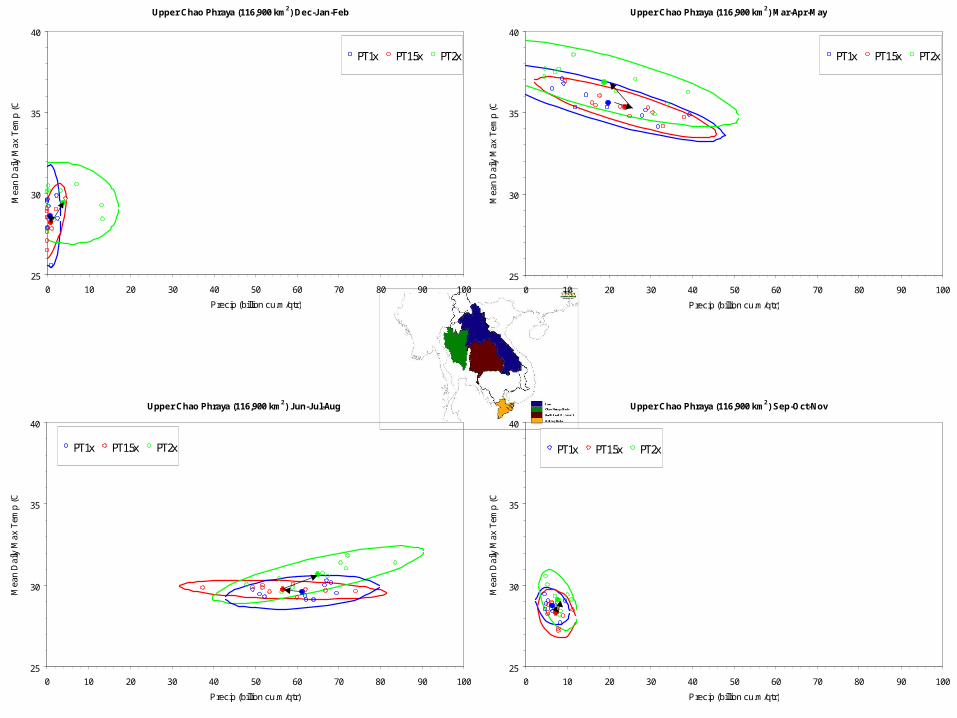
25
30
35
40
0 10 20 30 40 50 60 70 80 90 100
Precip (billion cu.m/qtr)
Mea
n D
aily
Max
Tem
p (C
)
PT 1x PT 1.5x PT 2x
Upper Chao Phraya (116,900 km2) Jun-Jul-Aug
25
30
35
40
0 10 20 30 40 50 60 70 80 90 100
Precip (billion cu.m/qtr)
Mea
n D
aily
Max
Tem
p (C
)
PT 1x PT 1.5x PT 2x
Upper Chao Phraya (116,900 km2) Sep-Oct-Nov
25
30
35
40
0 10 20 30 40 50 60 70 80 90 100
Precip (billion cu.m/qtr)
Mea
n D
aily
Max
Tem
p (C
)
PT 1x PT 1.5x PT 2x
Upper Chao Phraya (116,900 km2) Dec-Jan-Feb
25
30
35
40
0 10 20 30 40 50 60 70 80 90 100
Precip (billion cu.m/qtr)
Mea
n D
aily
Max
Tem
p (C
)
PT 1x PT 1.5x PT 2x
Upper Chao Phraya (116,900 km2) Mar-Apr-May
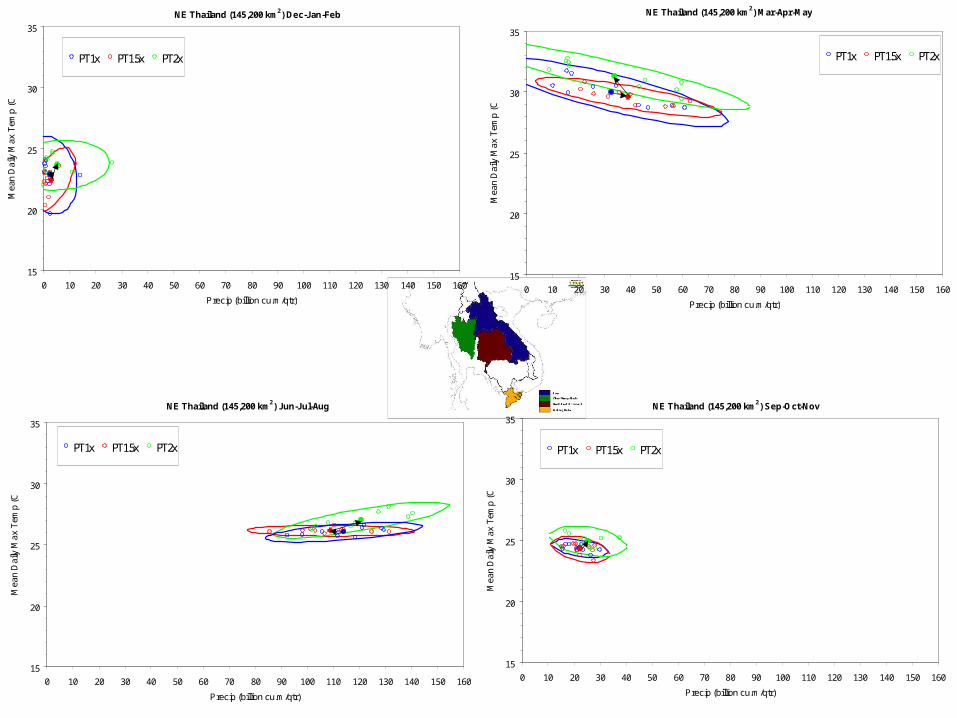
15
20
25
30
35
0 10 20 30 40 50 60 70 80 90 100 110 120 130 140 150 160
Precip (billion cu.m/qtr)
Mea
n D
aily
Max
Tem
p (C
)
PT 1x PT 1.5x PT 2x
NE Thailand (145,200 km2) Jun-Jul-Aug
15
20
25
30
35
0 10 20 30 40 50 60 70 80 90 100 110 120 130 140 150 160
Precip (billion cu.m/qtr)
Mea
n D
aily
Max
Tem
p (C
)
PT 1x PT 1.5x PT 2x
NE Thailand (145,200 km2) Sep-Oct-Nov
15
20
25
30
35
0 10 20 30 40 50 60 70 80 90 100 110 120 130 140 150 160
Precip (billion cu.m/qtr)
Mea
n D
aily
Max
Tem
p (C
)
PT 1x PT 1.5x PT 2x
NE Thailand (145,200 km2) Dec-Jan-Feb
15
20
25
30
35
0 10 20 30 40 50 60 70 80 90 100 110 120 130 140 150 160
Precip (billion cu.m/qtr)
Mea
n D
aily
Max
Tem
p (C
)
PT 1x PT 1.5x PT 2x
NE Thailand (145,200 km2) Mar-Apr-May
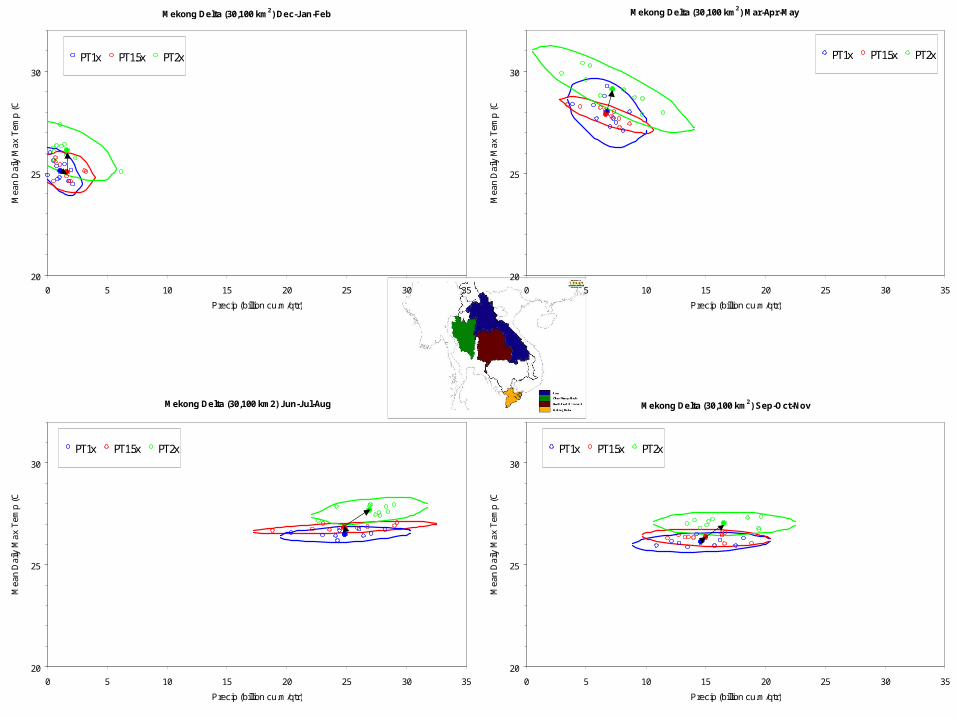
20
25
30
0 5 10 15 20 25 30 35
Precip (billion cu.m/qtr)
Mea
n D
aily
Max
Tem
p (C
)
PT 1x PT 1.5x PT 2x
Mekong Delta (30,100 km2) Dec-Jan-Feb
20
25
30
0 5 10 15 20 25 30 35
Precip (billion cu.m/qtr)
Mea
n D
aily
Max
Tem
p (C
)
PT 1x PT 1.5x PT 2x
Mekong Delta (30,100 km2) Mar-Apr-May
20
25
30
0 5 10 15 20 25 30 35
Precip (billion cu.m/qtr)
Mea
n D
aily
Max
Tem
p (C
)
PT 1x PT 1.5x PT 2x
Mekong Delta (30,100 km2) Jun-Jul-Aug
20
25
30
0 5 10 15 20 25 30 35
Precip (billion cu.m/qtr)
Mea
n D
aily
Max
Tem
p (C
)
PT 1x PT 1.5x PT 2x
Mekong Delta (30,100 km2) Sep-Oct-Nov
0
10
20
30
40
50
60
0 4 0 0 8 0 0 1 2 0 0
Temp
and P
recip
(o C &
mm/d)
-50
0
50
100
150
200
250
Solar
dadia
tion (
W/m
2 /d)
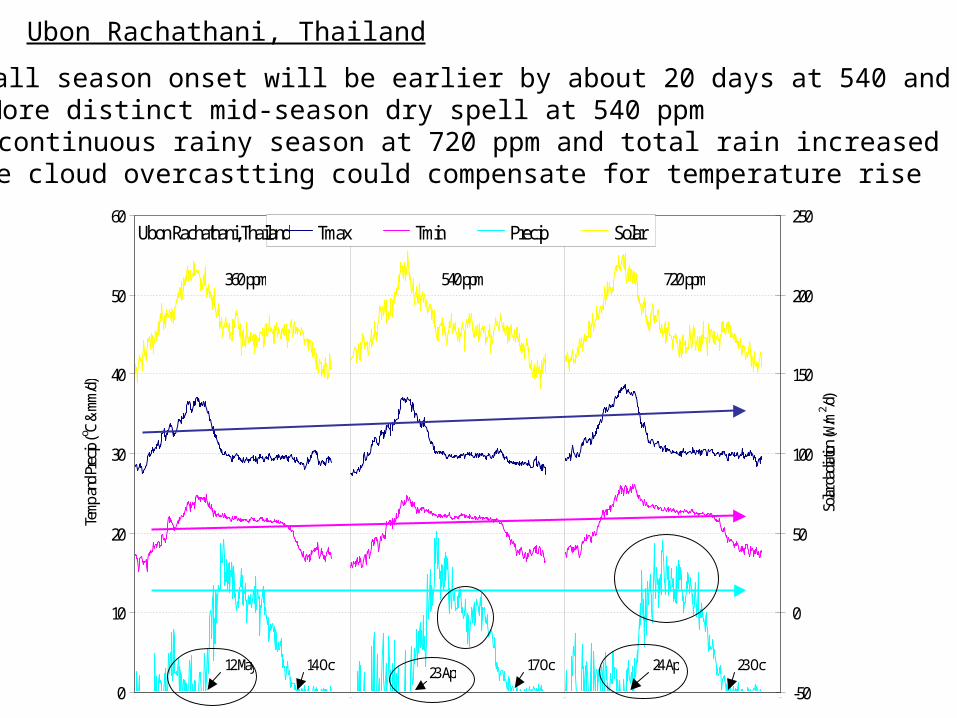
Tmax Tmin Precip SolarUbon Rachathani, Thailand
360 ppm 540 ppm 720 ppm
12 May 14 Oct 23 Apr 17 Oct 24 Apr 23 Oct
Ubon Rachathani, Thailand
2. More distinct mid-season dry spell at 540 ppm 3. More continuous rainy season at 720 ppm and total rain increased by about 10%4. More cloud overcastting could compensate for temperature rise
1. Rainfall season onset will be earlier by about 20 days at 540 and 720 ppm
10
30
50
70
90
110
130
0 4 0 0 8 0 0 1 2 0 0
Temp
eratu
re (o C)
-150
-75
0
75
150
225
300
Prec
ip. an
d Sola
r Rad
. (mm/
d & W
/m2/d
)
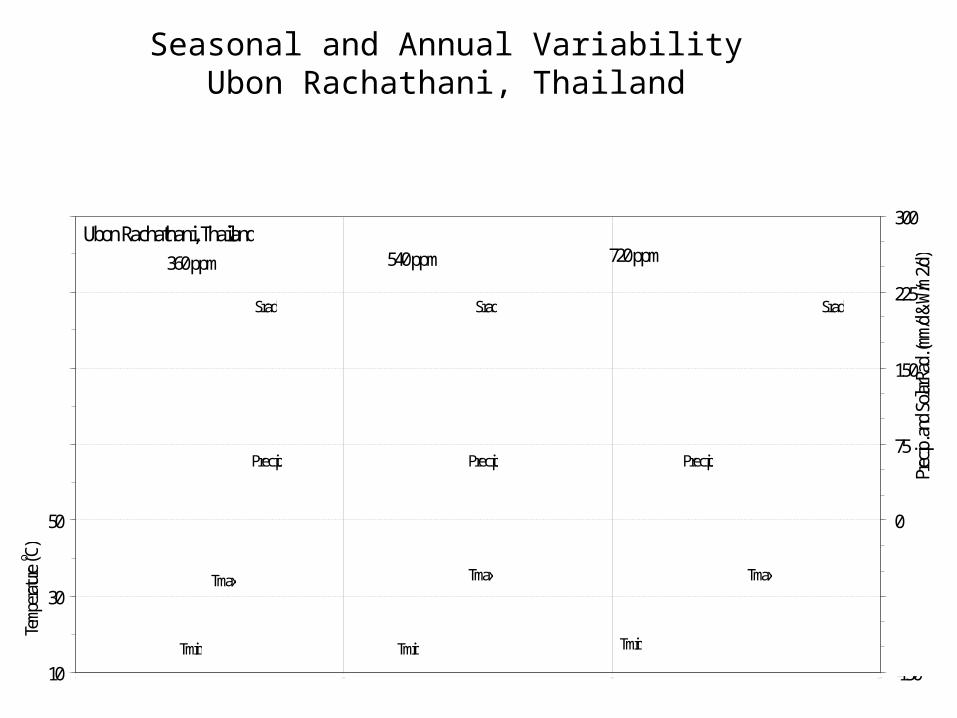
Ubon Rachathani, Thailand360 ppm 540 ppm 720 ppm
Srad Srad Srad
Precip Precip Precip
Tmax Tmax Tmax
Tmin Tmin Tmin
Seasonal and Annual VariabilityUbon Rachathani, Thailand
0
10
20
30
40
50
60
0 4 0 0 8 0 0 1 2 0 0
Temp
and Pr
ecip (o C
& mm
/d)
-50
0
50
100
150
200
250
Solar
dad
iation
(W/m2 /d
)
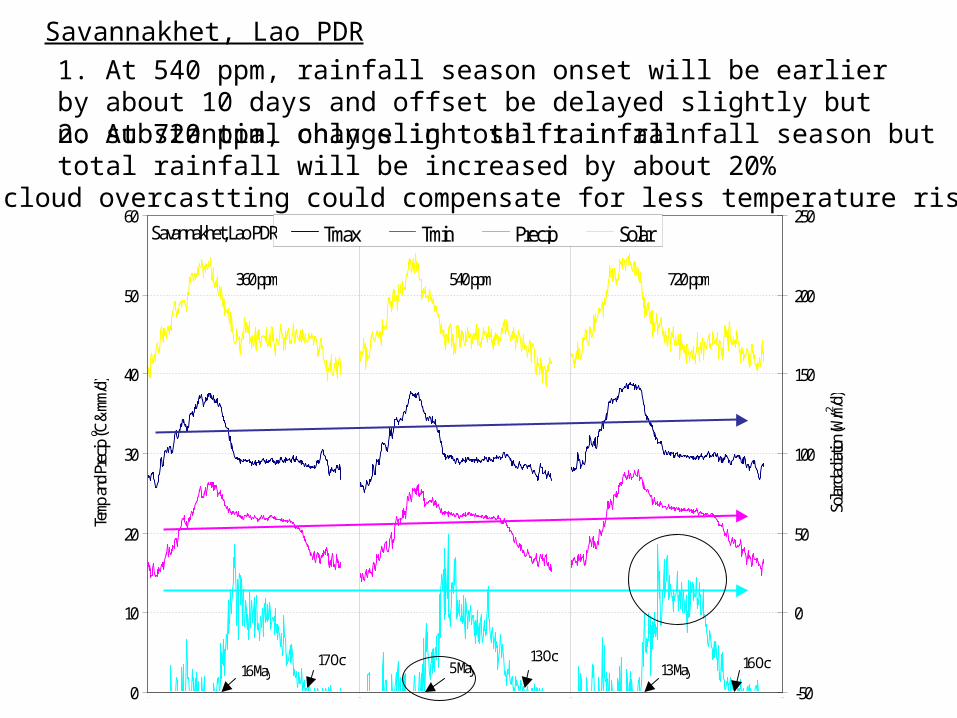
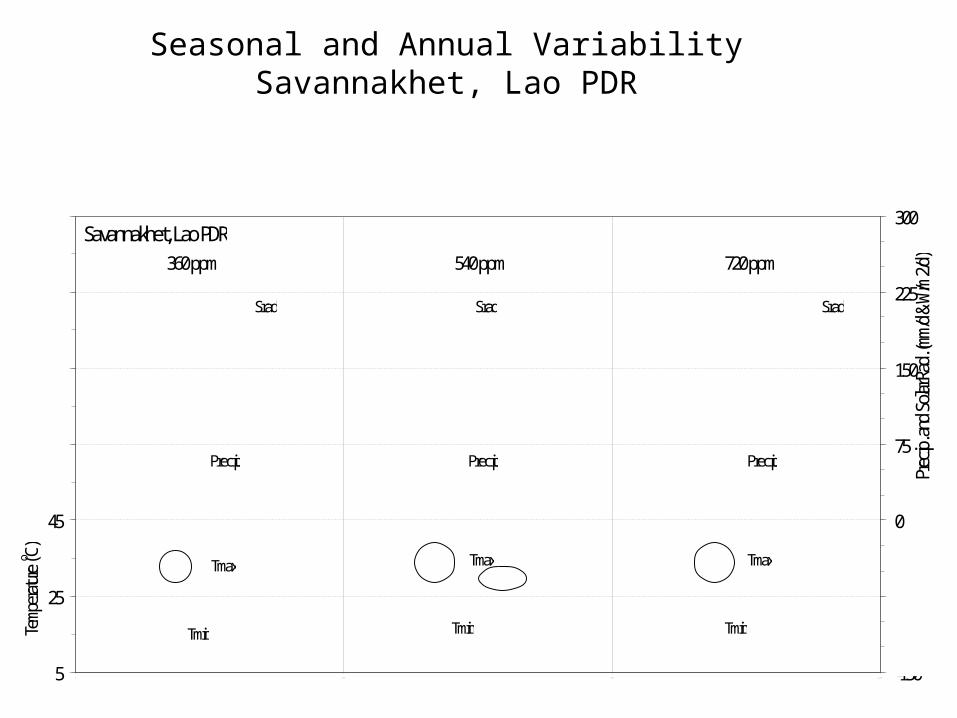
Tmax Tmin Precip SolarSavannakhet, Lao PDR
360 ppm 540 ppm 720 ppm
16 May17 Oct 5 May
13 Oct13 May 16 Oct
Savannakhet, Lao PDR
3. More cloud overcastting could compensate for less temperature rise
1. At 540 ppm, rainfall season onset will be earlier by about 10 days and offset be delayed slightly but no substantial change in total rainfall2. At 720 ppm, only slight shift in rainfall season but total rainfall will be increased by about 20%
5
25
45
65
85
105
125
0 4 0 0 8 0 0 1 2 0 0
Temp
eratu
re (o C)
-150
-75
0
75
150
225
300
Prec
ip. an
d Sola
r Rad
. (mm/
d & W
/m2/d
)
Savannakhet, Lao PDR360 ppm 540 ppm 720 ppm
Srad Srad Srad
Precip Precip Precip
Tmax Tmax Tmax
Tmin Tmin Tmin
Seasonal and Annual VariabilitySavannakhet, Lao PDR
0
10
20
30
40
50
60
0 4 0 0 8 0 0 1 2 0 0
Temp
and Pr
ecip (o C
& mm
/d)
-50
0
50
100
150
200
250
Solar
dad
iation
(W/m2 /d
)
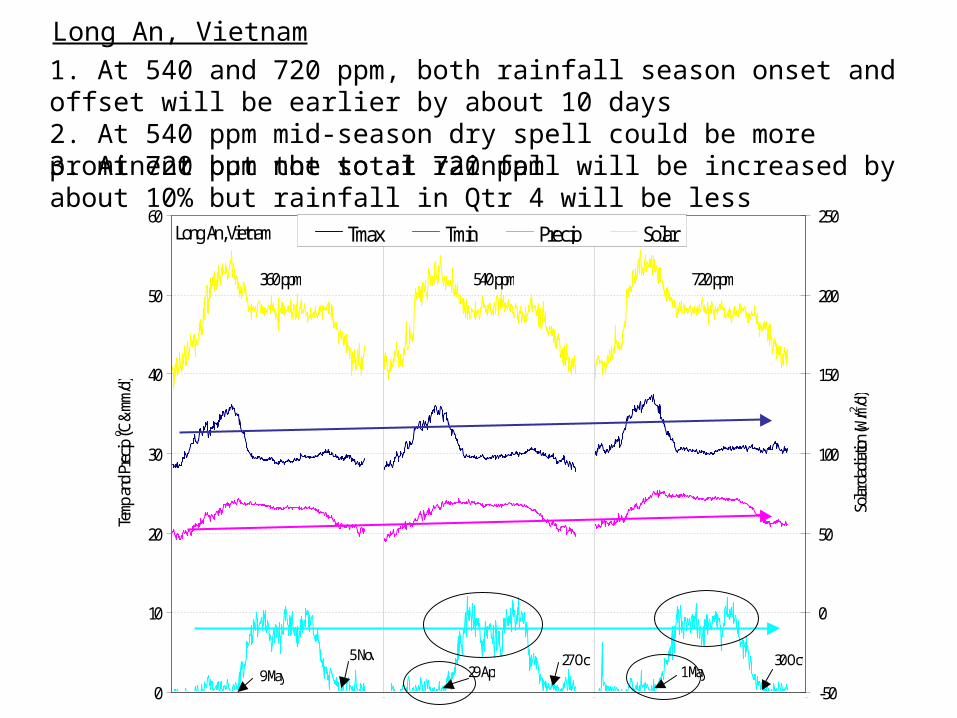
Tmax Tmin Precip SolarLong An, Vietnam
360 ppm 540 ppm 720 ppm
9 May5 Nov
29 Apr27 Oct
1 May30 Oct
Long An, Vietnam
1. At 540 and 720 ppm, both rainfall season onset and offset will be earlier by about 10 days
3. At 720 ppm the total rainfall will be increased by about 10% but rainfall in Qtr 4 will be less
2. At 540 ppm mid-season dry spell could be more prominent but not so at 720 ppm
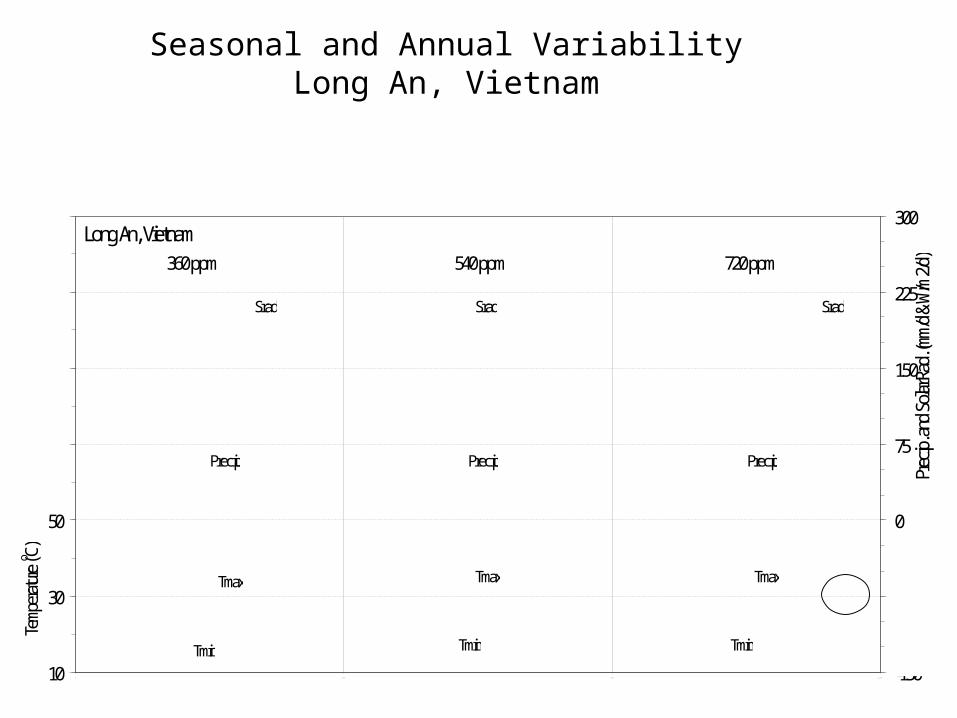
Seasonal and Annual VariabilityLong An, Vietnam
10
30
50
70
90
110
130
0 4 0 0 8 0 0 1 2 0 0
Temp
eratu
re (o C)
-150
-75
0
75
150
225
300
Prec
ip. an
d Sola
r Rad
. (mm/
d & W
/m2/d
)
Long An, Vietnam360 ppm 540 ppm 720 ppm
Srad Srad Srad
Precip Precip Precip
Tmax Tmax Tmax
Tmin Tmin Tmin
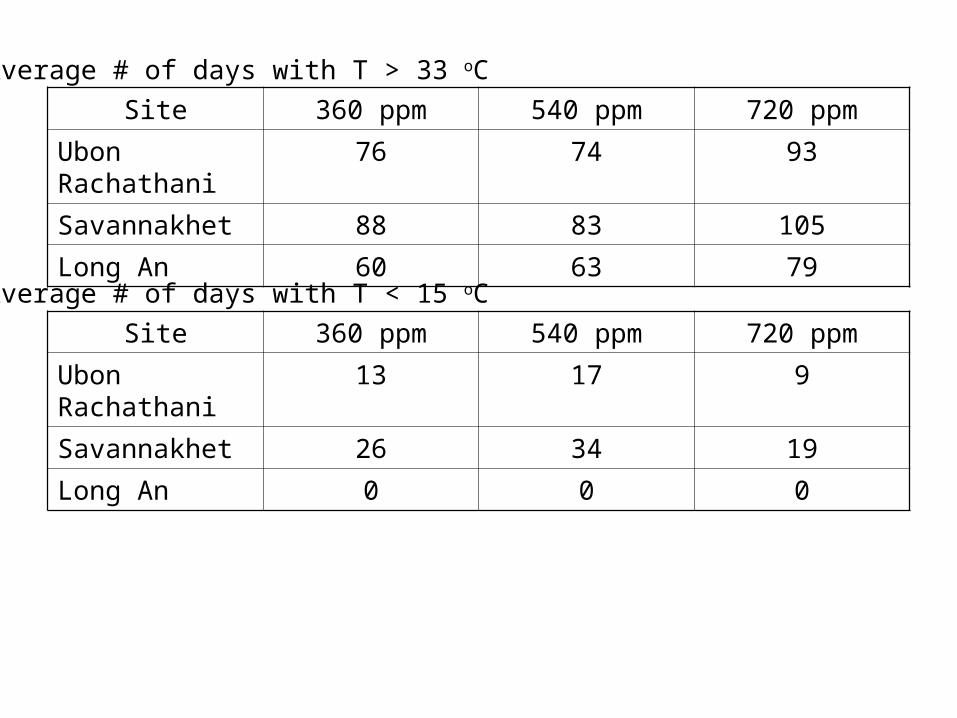
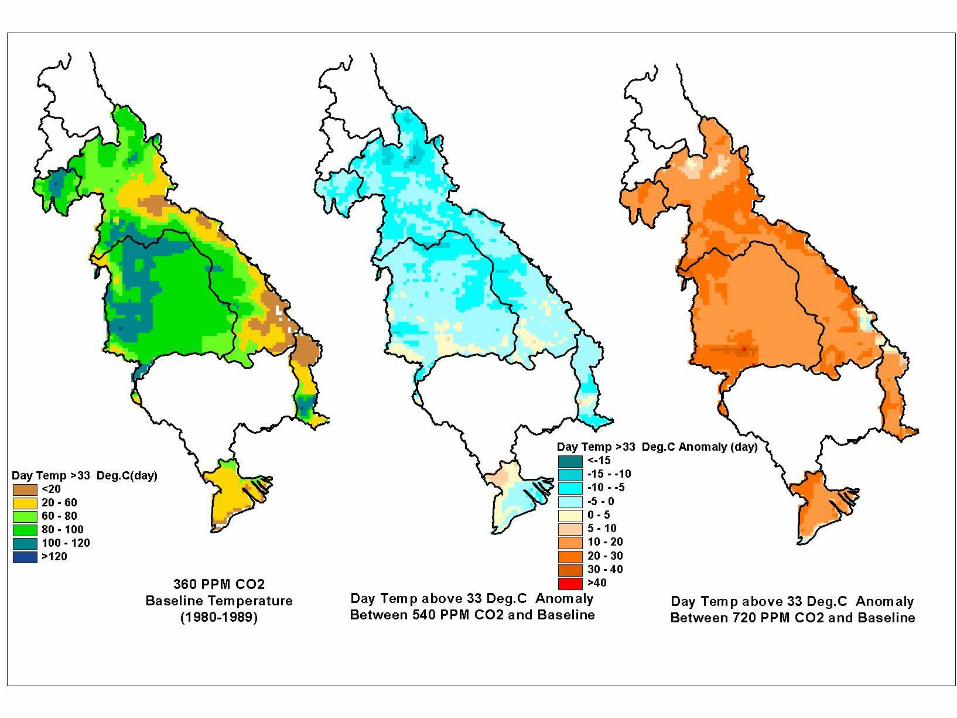
Site 360 ppm 540 ppm 720 ppm
Ubon Rachathani 76 74 93
Savannakhet 88 83 105
Long An 60 63 79
Average # of days with T > 33 oC
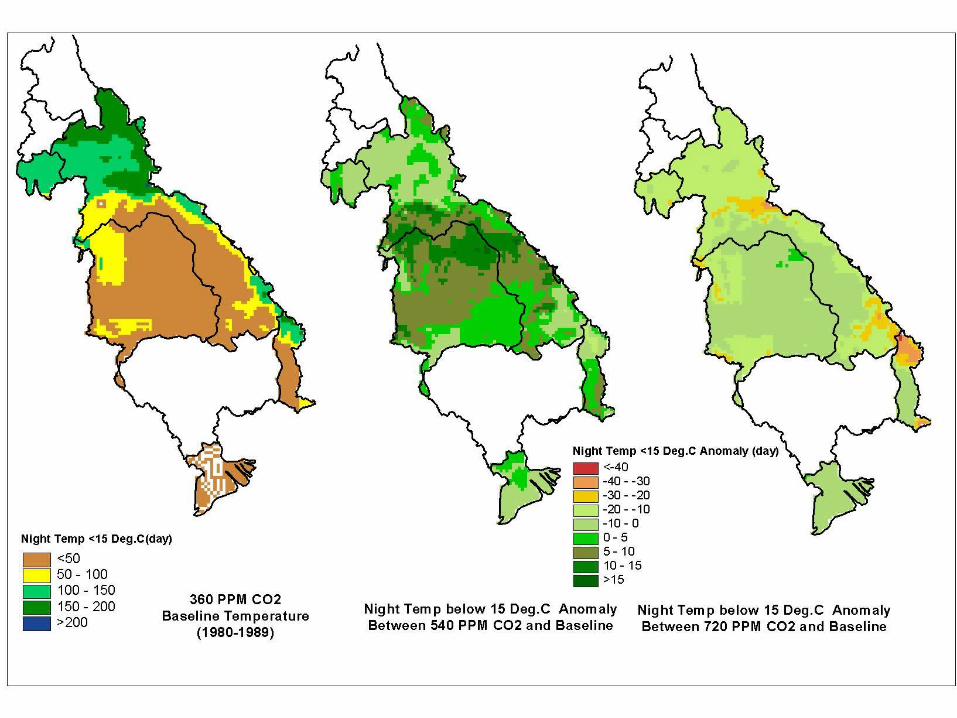
Average # of days with T < 15 oC
Site 360 ppm 540 ppm 720 ppm
Ubon Rachathani 13 17 9
Savannakhet 26 34 19
Long An 0 0 0
Some Conclusions and Implications
1. Under elevated CO2 environment the mean climate of the region will be slightly more wet (10-20%) and more warm (1-2 oC) which may only has a slight effect on water resource (or even be positive impact)
2. Even though the mean climates (T and Precip) will generally not be much affected by CO2 increase but the change in climate variability and seasonality will be more important and the rain-fed agricultural sector is naturally more susceptible to this
3. Inland part of the Mekong Basin (i,.e., Lao PDR and Thailand) has a more abrupt rainy season onset than the delta part (I.e., Vietnam). Ability to do seasonal forecast for rainfall onset will certainly increase capacity of rice farmer to cope with future change in climate variability