Embed Size (px)
Citation preview

Climate Literacy
Session: Climate, Climatology of California
Elissa LynnAugust 5, 2015
Climate, Climatology of California
• California Climate
• Climate Signals
• Atmospheric Rivers

California Geography (Major Climate Factor)
• 1340 miles of coastline
(~75% coast of lower US)
• 800 miles long
• 250 miles wide
• LA is east of Reno
• Land area of 163,696 sq. miles
3.79 million sq. miles –
3rd biggest after AK and TX

California Geography (Major Climate Factor)
• 1340 miles of coastline
(~75% coast of lower US)
• 800 miles long
• 250 miles wide
• LA is east of Reno
• Land area of 163,696 sq. miles
3.79 million sq. miles –
3rd biggest after AK and TX
Mediterranean Climate - warm dry summer, cool wet winter

California Topography (Major Climate Factor)

Greatest Precipitation falls in northern mountains in CA
Biggest Population centers are along coasts and southern part of CA
Precipitation: Limited Locations
Dettinger et al, 2011

Just a few storms each year provideCalifornia’s water supply
5-10 stormy days or storm events each winter
December, January, February responsible for 50% of precipitation
Precipitation: Limited Opportunity
Dettinger et al, 2011
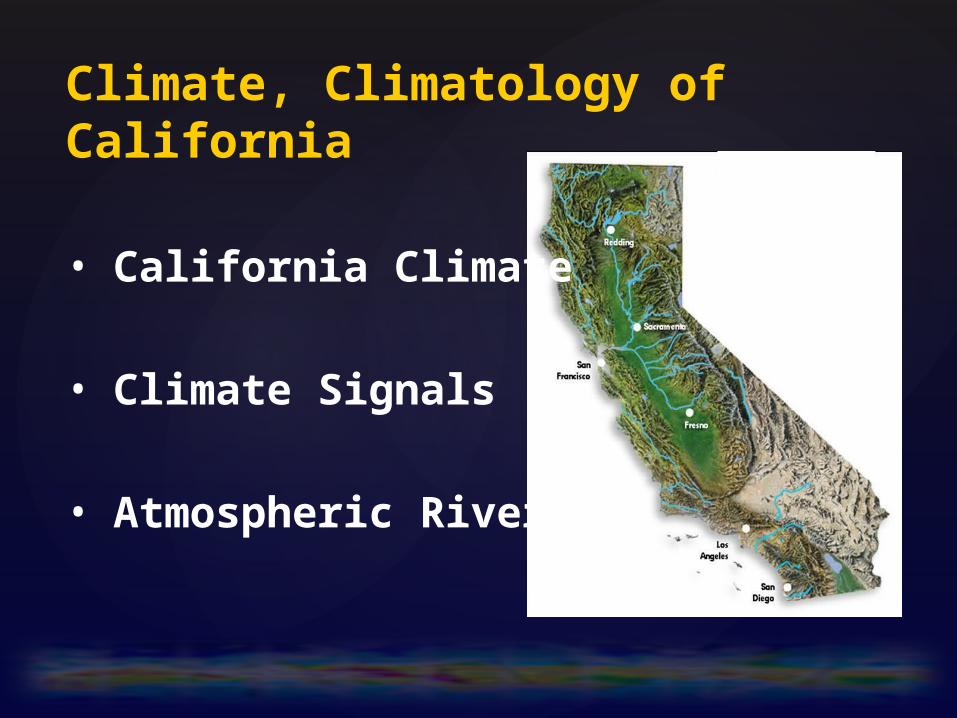
Measuring CA Precipitation
Northern Sierra 8 Station Index
Annual Average: 50 inchesMaximum Year (1983): 88.5 inchesMinimum Year (1924): 17.1 inchesPeriod of Record 1921- Present
Average of:
Mt. Shasta City QuincyShasta Dam Sierraville RSMineral Pacific HouseBrush Creek RS Blue Canyon
1921
1922
1923
1924
1925
1926
1927
1928
1929
1930
1931
1932
1933
1934
1935
1936
1937
1938
1939
1940
1941
1942
1943
1944
1945
1946
1947
1948
1949
1950
1951
1952
1953
1954
1955
1956
1957
1958
1959
1960
1961
1962
1963
1964
1965
1966
1967
1968
1969
1970
1971
1972
1973
1974
1975
1976
1977
1978
1979
1980
1981
1982
1983
1984
1985
1986
1987
1988
1989
1990
1991
1992
1993
1994
1995
1996
1997
1998
1999
2000
2001
2002
2003
2004
2005
2006
2007
2008
2009
2010
2011
2012
2013
2014
0
20
40
60
80
100
Water Year
Pre
cip
ita
tio
n (
Inc
he
s)

1949
1950
1951
1952
1953
1954
1955
1956
1957
1958
1959
1960
1961
1962
1963
1964
1965
1966
1967
1968
1969
1970
1971
1972
1973
1974
1975
1976
1977
1978
1979
1980
1981
1982
1983
1984
1985
1986
1987
1988
1989
1990
1991
1992
1993
1994
1995
1996
1997
1998
1999
2000
2001
2002
2003
2004
2005
2006
2007
2008
2009
2010
2011
2012
2013
2014
0102030405060708090
Water Year
Pre
cip
ita
tio
n (
Inc
he
s)
Annual Average: 40 inchesMaximum Year (1983) 77.4 inchesMinimum Year (1924) 14.8 inchesPeriod of Record 1949 - Present
Average of:
Calaveras Big TreesHetch HetchyYosemite HQNorth Fork Ranger StationHuntington Lake
Measuring CA Precipitation
Southern Sierra 5 Station Index

Snowpack

Drought
Worst Years for SnowpackApril 1 Percent of Average
2015 5
2014 25
1977 25
1988 29
1976 37
2007 39
2013 42
1963 45
1990 45
1994 52
2012 52

Each of last 4 years are in the top-10 lowest snowpacks5 of 10 driest years in last hundred have been this decade
1977 used to be worst; 2014 tied at 25% of average2015 was 20% of EITHER of those; only 5% of average
System managed better than in 1977; but worse hydrologyIn recent years, it’s WARMER
Drought

Runoff Observations: Timing Shift
Brochure Page 3

California 1895-PresentCourtesy: Western Region Climate
Center
Observed Maximums
Observed Minimums
Temperatures

Climate Signal; El
Nino

El Niño conditions are present
Warm Sea Surface Temperatures over Eastern Pacific (us!)
Greater than 90% chance that El Niño will continue through winter, and around an 80% chance it will last into early spring 2016.
Climate Signal; El
Nino

Climate Signal; Pacific Decadal Oscillation

Storm Track changes
Flooding & water supply
MJO/Tropical Convection ENSO
Polar Processes
Atmospheric
River
Easterly Wave
Cyclogensis
L
Different Hydrologic Outcomes Result from the Combination of Key Processes Evolving at
Different Space/Time Scales
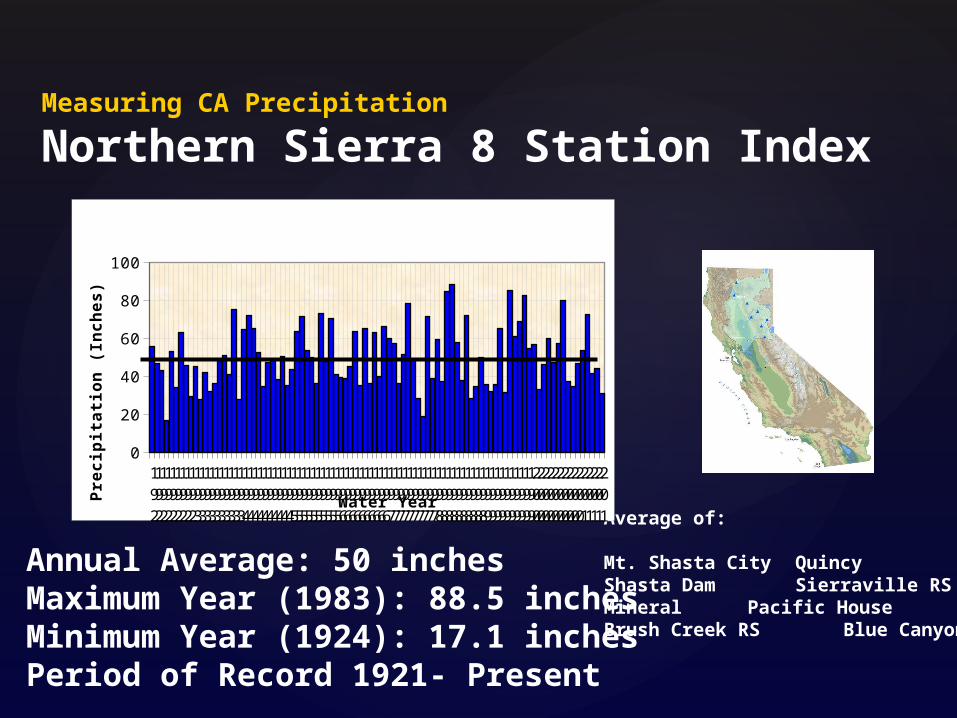
Climate Signal; Atmospheric Rivers -> KEY for Water Supply/Flooding
https://www.youtube.com/watch?v=MgKT__9ThSs&feature=youtu.be
Atmospheric Rivers (CalWater Research) DWR YouTube

Take Home PointsCalifornia has a Mediterranean Climate
Topography/Geography very important for CA precipitation
Lots of variability in space and time
Many processes in play to create events in historic record
Atmospheric Rivers important for floods and water supply
Climate Change will impact these relationships; drought, etc.