Embed Size (px)
Citation preview
Climate Interactive Ratchet Success Pathway:
Assumptions and Results
John Sterman1 2, Andrew Jones2, Ellie Johnston2, Lori Siegel2
29 November 2015
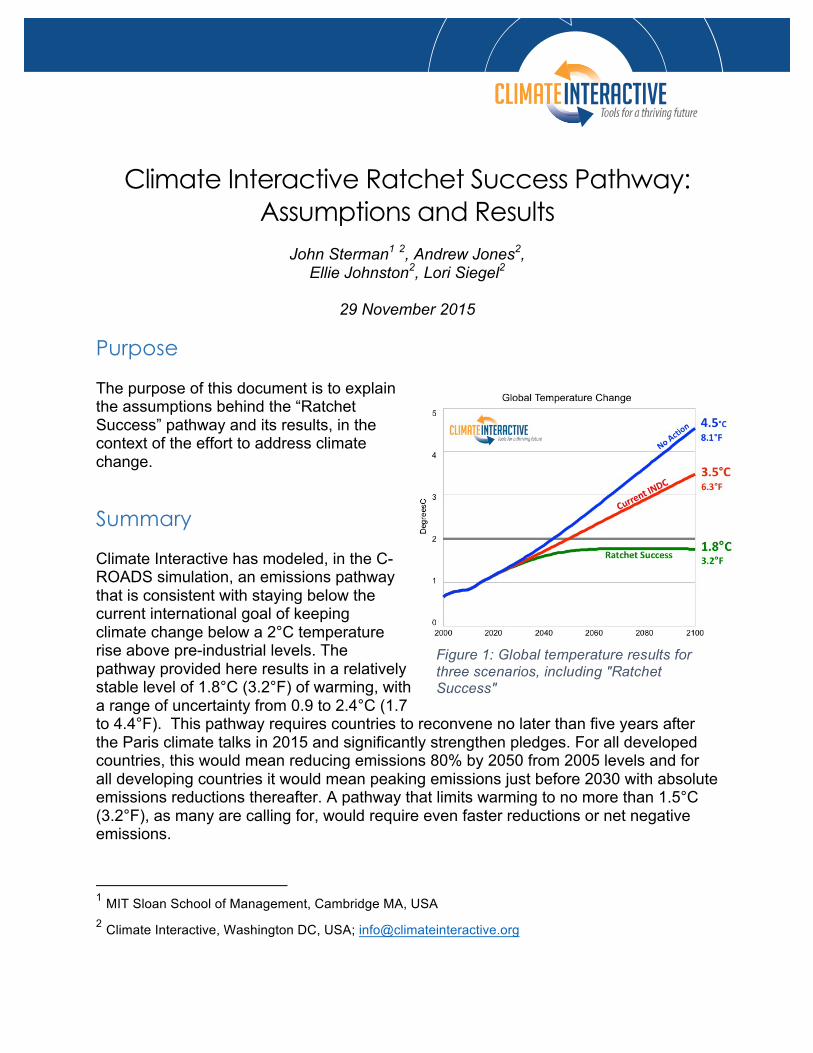
Purpose The purpose of this document is to explain the assumptions behind the “Ratchet Success” pathway and its results, in the context of the effort to address climate change.
Summary Climate Interactive has modeled, in the C-ROADS simulation, an emissions pathway that is consistent with staying below the current international goal of keeping climate change below a 2°C temperature rise above pre-industrial levels. The pathway provided here results in a relatively stable level of 1.8°C (3.2°F) of warming, with a range of uncertainty from 0.9 to 2.4°C (1.7 to 4.4°F). This pathway requires countries to reconvene no later than five years after the Paris climate talks in 2015 and significantly strengthen pledges. For all developed countries, this would mean reducing emissions 80% by 2050 from 2005 levels and for all developing countries it would mean peaking emissions just before 2030 with absolute emissions reductions thereafter. A pathway that limits warming to no more than 1.5°C (3.2°F), as many are calling for, would require even faster reductions or net negative emissions.
1 MIT Sloan School of Management, Cambridge MA, USA 2 Climate Interactive, Washington DC, USA; [email protected]
Figure 1: Global temperature results for three scenarios, including "Ratchet Success"

2
Overview Most all nations have put forward contributions to the December 2015 Paris climate change negotiations. Collectively, these nations account for over 90% of global greenhouse gas emissions. The level of ambition in the plans to date varies widely. Collectively, however, the INDCs do not reduce global emissions enough to limit expected warming to no more than 2°C (3.6°F). Current plans, know as Intended Nationally Determined Contributions (INDCs), specify emissions only to 2030. The negotiations in Paris are considering the adoption of 5-year review periods, under which countries would reconvene at regular intervals and commit to deeper reductions so as to close the gap between what is needed and what has been offered. In this analysis, we consider what the contributions need to be in five years to ensure the world does not overshoot the 2°C (3.6°F) limit. From 2015-2020, we assume all countries begin to implement their contributions to COP21. We then explore the INDCs needed by 2020 when the nations of the world would ratchet up their pledges.
The C-ROADS Simulator The C-ROADS (Climate Rapid Overview And Decision Support) model is designed to build shared understanding of climate dynamics in a way that is nonpartisan and rigorously grounded in the best available science, yet understandable by and useful to non-specialists, from policymakers to the public. C-ROADS:
• is based on the best available peer-reviewed science and calibrated to state-of-the-art climate models;
• tracks GHGs including CO2, CH4, N2O, SF6, halocarbons, aerosols and black carbon;
• distinguishes emissions from fossil fuels and from land use and forestry policies;
• allows users to select different business as usual (BAU) scenarios, and to define their own;
• enables users to capture any emissions reduction scenario for each nation portrayed;
• reports the resulting GHG concentrations, global mean temperature change, sea level rise, ocean pH, per capita emissions, and cumulative emissions;
• allows users to assess the impact of uncertainty in key climate processes;
Figure 2: C-ROADS Overview

3
• is easy to use, running on a laptop computer in seconds so users immediately see the impact of the scenarios they test;
• provides an independent, neutral process to ensure that different assumptions and scenarios can be made available to all parties;
• is freely available at climateinteractive.org.
The Scenarios Our analysis explores three scenarios, with particular emphasis on the third—Ratchet Success—modeled using the C-ROADS climate policy simulator:
1. No Action - Nations continue on a business-as-usual trajectory with continued emissions growth leading to 4.5°C (8.1°F)with a range of uncertainty from 2.6 to 5.9°C (4.8 to 10.6°F of warming. This scenario is calibrated to, and aligns with, the IPCC’s AR5 RCP8.5 scenario.
2. Current INDCs - The INDCs offered as of November 29, 2015, assuming no further progress with the pledges after they end. This would put the world on track for a global temperature increase of 3.5°C (6.3°F) above pre-industrial levels, with a range of uncertainty from 2.1 to 4.7°C (3.7 to 8.4°F). For more on this scenario see: https://www.climateinteractive.org/tools/scoreboard/scoreboard-science-and-data/
3. Ratchet Success - INDCs are improved as per the assumptions listed below and limit warming to 1.8°C (3.2°F), with a range of uncertainty from 0.9 to 2.4°C (1.7 to 4.4°F).
Assumptions Assumptions for the Ratchet Success scenario for five regions of the world are shown in Figure4:Summaryofassumptionsforthe"RatchetSuccess"scenario. The emissions pathways are aggregated from the 15 nations/regions used as inputs to the C-ROADS model in the Ratchet Success scenario.
Figure 3: Global greenhouse gas emissions 2000-2100 for three scenarios, including "Ratchet Success"
4
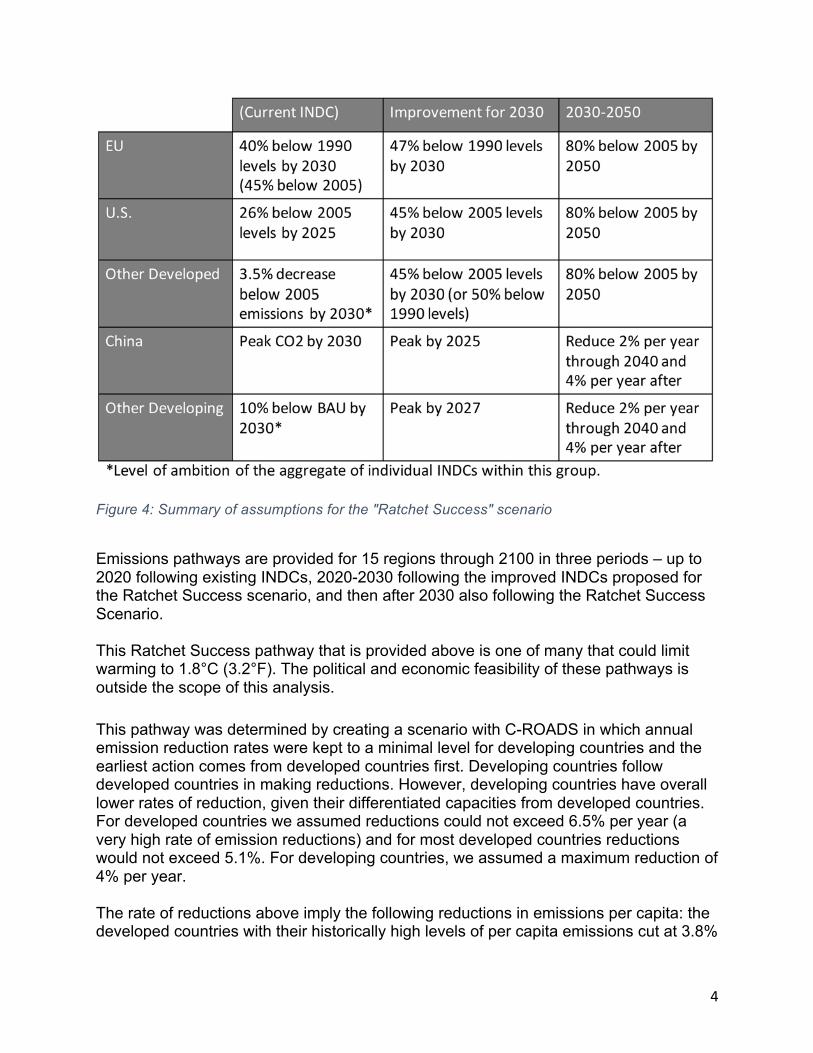
Figure 4: Summary of assumptions for the "Ratchet Success" scenario
Emissions pathways are provided for 15 regions through 2100 in three periods – up to 2020 following existing INDCs, 2020-2030 following the improved INDCs proposed for the Ratchet Success scenario, and then after 2030 also following the Ratchet Success Scenario. This Ratchet Success pathway that is provided above is one of many that could limit warming to 1.8°C (3.2°F). The political and economic feasibility of these pathways is outside the scope of this analysis. This pathway was determined by creating a scenario with C-ROADS in which annual emission reduction rates were kept to a minimal level for developing countries and the earliest action comes from developed countries first. Developing countries follow developed countries in making reductions. However, developing countries have overall lower rates of reduction, given their differentiated capacities from developed countries. For developed countries we assumed reductions could not exceed 6.5% per year (a very high rate of emission reductions) and for most developed countries reductions would not exceed 5.1%. For developing countries, we assumed a maximum reduction of 4% per year. The rate of reductions above imply the following reductions in emissions per capita: the developed countries with their historically high levels of per capita emissions cut at 3.8%
5
to 6.6% per year, while developing countries reduce per capita emissions at 0.1% to 4.7% per year, with the highest reduction rates occurring after 2050. Similarly, reductions in carbon intensity (emissions per GDP) are greatest and earliest from developed countries, but note that limiting warming to no more than 2°C requires all countries to participate in reductions.
Global Climate Results The following figures and data provide a look at the specifics of the Ratchet Success scenario.
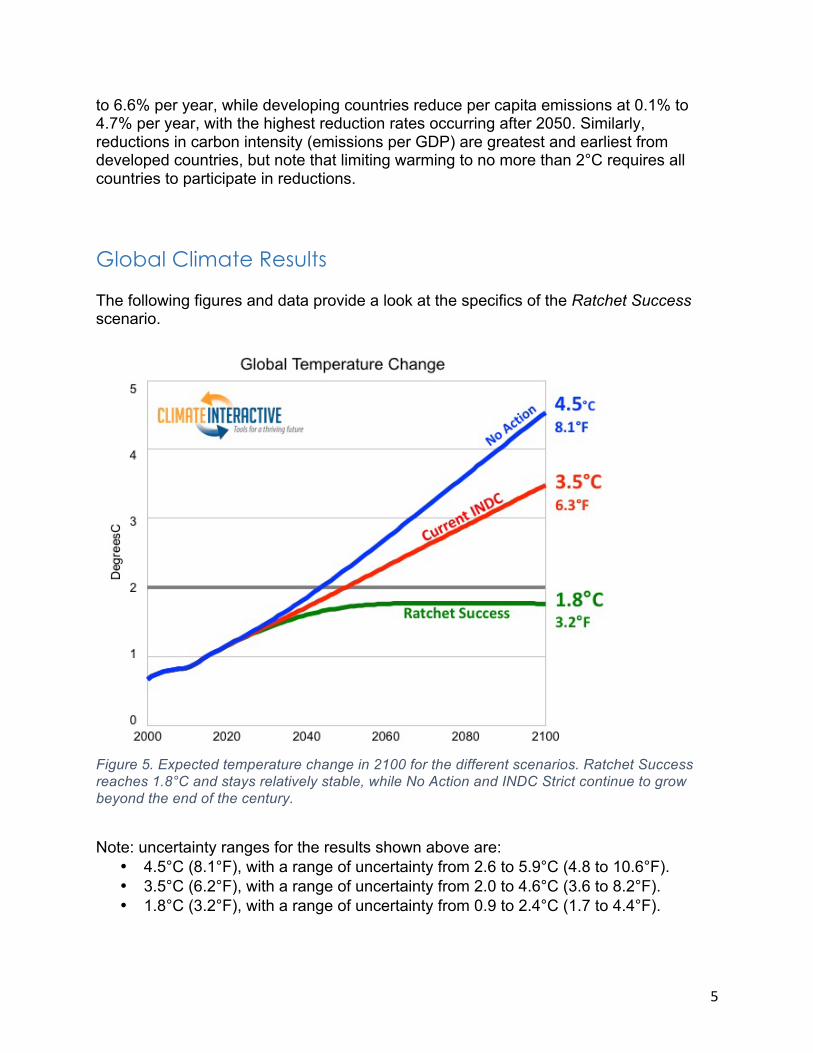
Figure 5. Expected temperature change in 2100 for the different scenarios. Ratchet Success reaches 1.8°C and stays relatively stable, while No Action and INDC Strict continue to grow beyond the end of the century.
Note: uncertainty ranges for the results shown above are:
• 4.5°C (8.1°F), with a range of uncertainty from 2.6 to 5.9°C (4.8 to 10.6°F). • 3.5°C (6.2°F), with a range of uncertainty from 2.0 to 4.6°C (3.6 to 8.2°F). • 1.8°C (3.2°F), with a range of uncertainty from 0.9 to 2.4°C (1.7 to 4.4°F).
6
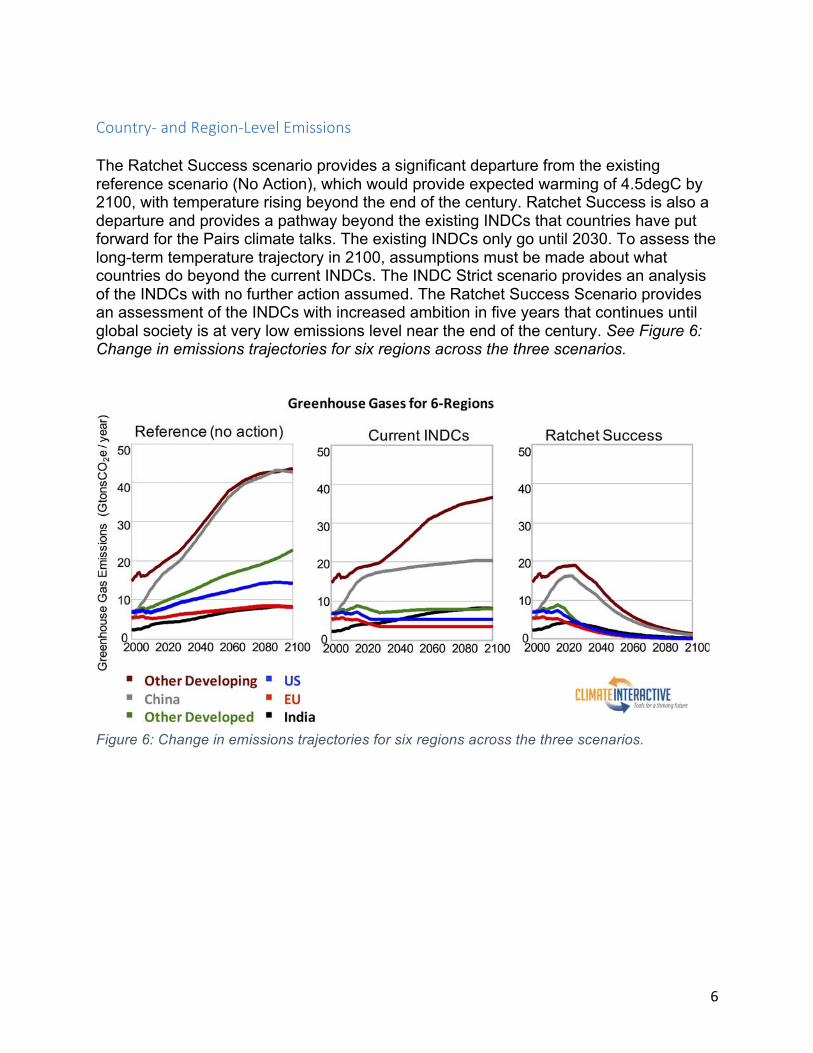
Country-andRegion-LevelEmissions The Ratchet Success scenario provides a significant departure from the existing reference scenario (No Action), which would provide expected warming of 4.5degC by 2100, with temperature rising beyond the end of the century. Ratchet Success is also a departure and provides a pathway beyond the existing INDCs that countries have put forward for the Pairs climate talks. The existing INDCs only go until 2030. To assess the long-term temperature trajectory in 2100, assumptions must be made about what countries do beyond the current INDCs. The INDC Strict scenario provides an analysis of the INDCs with no further action assumed. The Ratchet Success Scenario provides an assessment of the INDCs with increased ambition in five years that continues until global society is at very low emissions level near the end of the century. See Figure 6: Change in emissions trajectories for six regions across the three scenarios.
Figure 6: Change in emissions trajectories for six regions across the three scenarios.
7
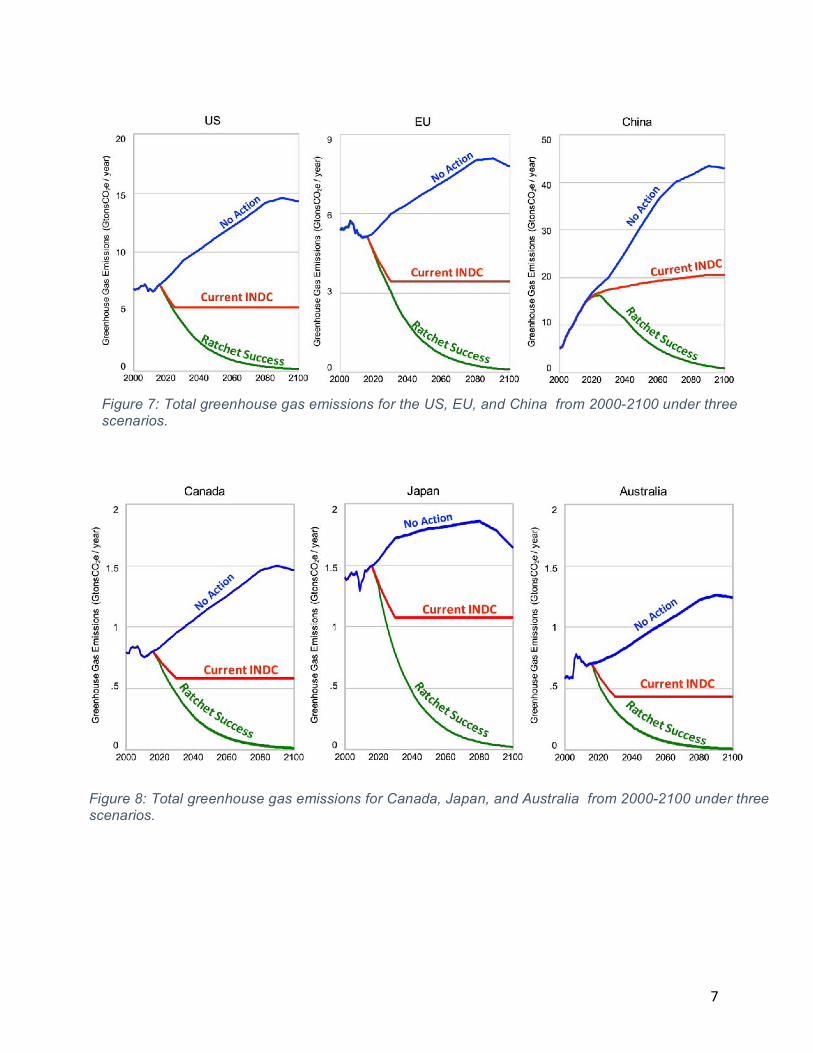
Figure 7: Total greenhouse gas emissions for the US, EU, and China from 2000-2100 under three scenarios.
Figure 8: Total greenhouse gas emissions for Canada, Japan, and Australia from 2000-2100 under three scenarios.
8
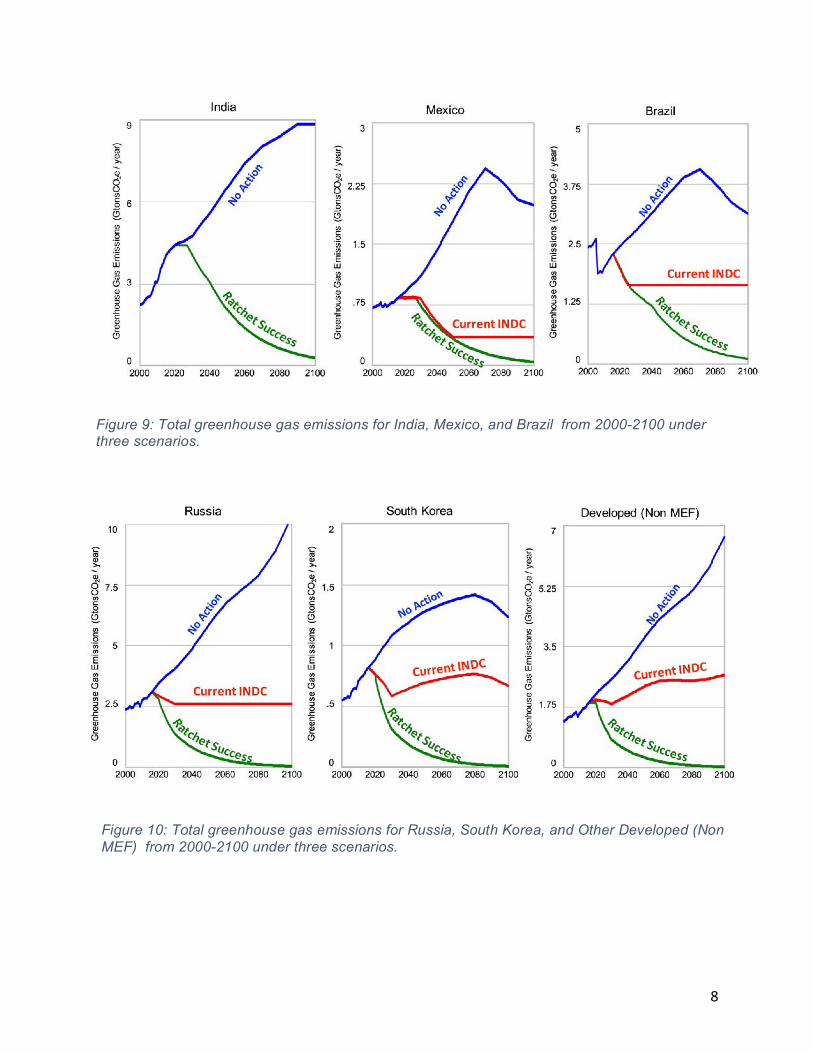
Figure 9: Total greenhouse gas emissions for India, Mexico, and Brazil from 2000-2100 under three scenarios.
Figure 10: Total greenhouse gas emissions for Russia, South Korea, and Other Developed (Non MEF) from 2000-2100 under three scenarios.
9
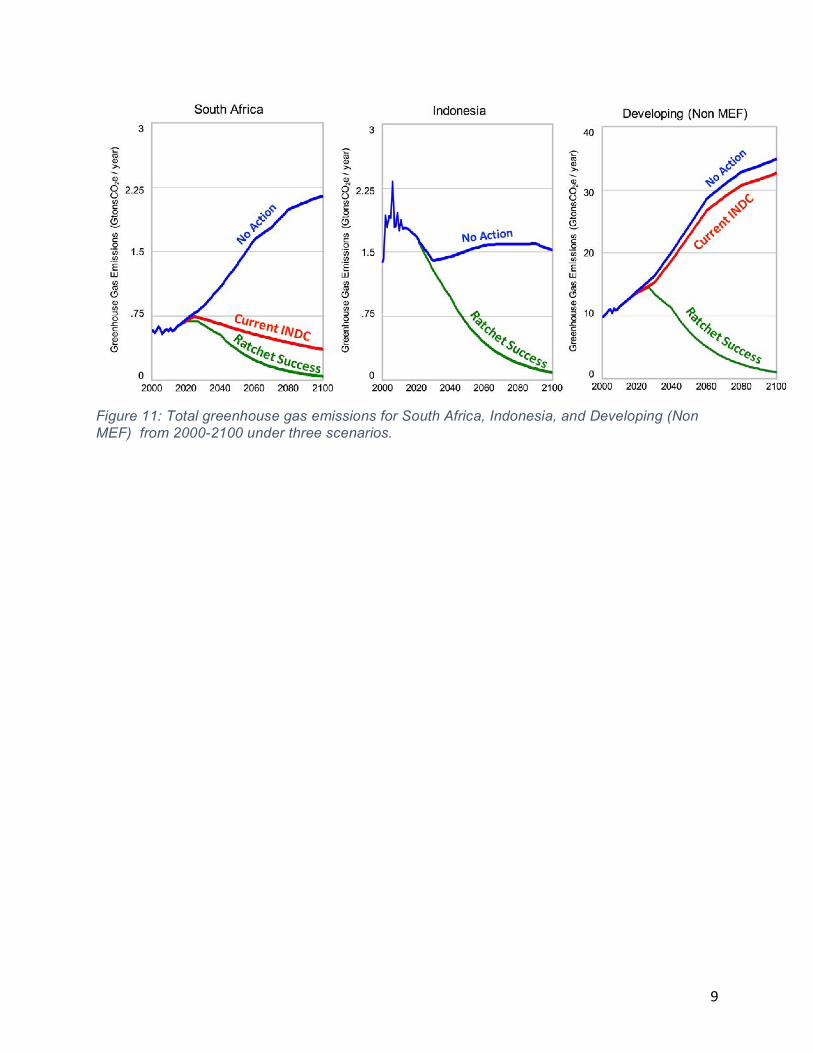
Figure 11: Total greenhouse gas emissions for South Africa, Indonesia, and Developing (Non MEF) from 2000-2100 under three scenarios.
10
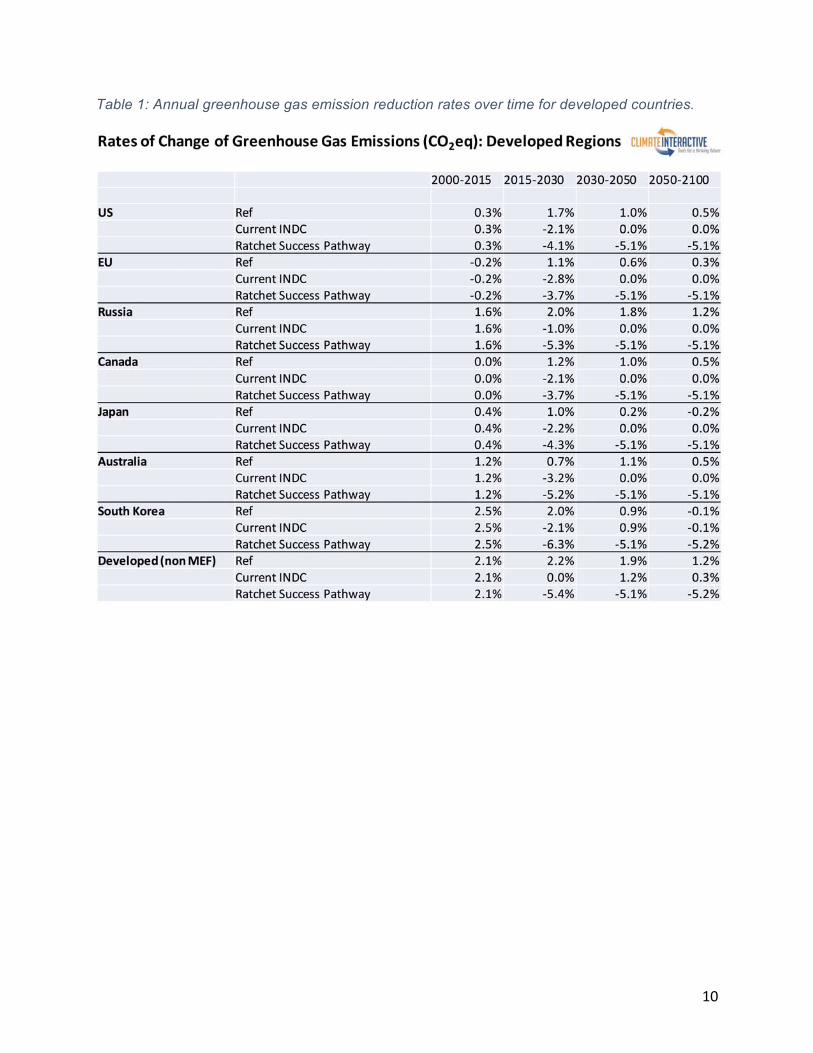
Table 1: Annual greenhouse gas emission reduction rates over time for developed countries.
11
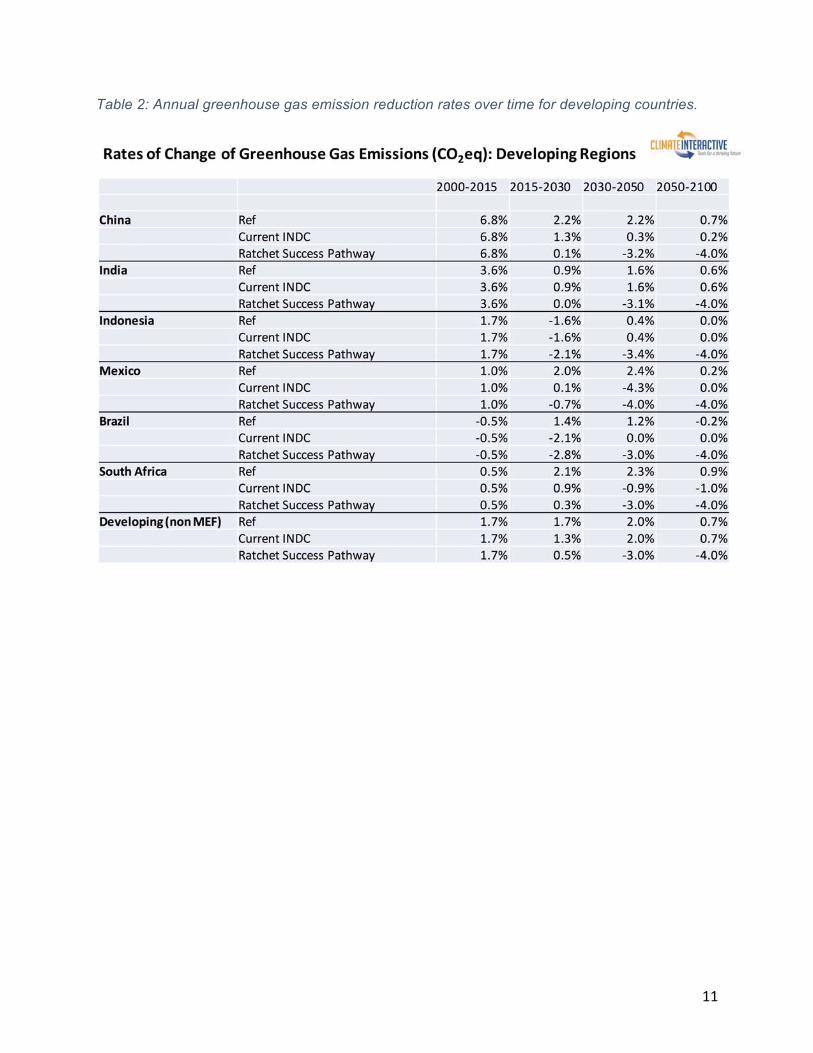
Table 2: Annual greenhouse gas emission reduction rates over time for developing countries.
12
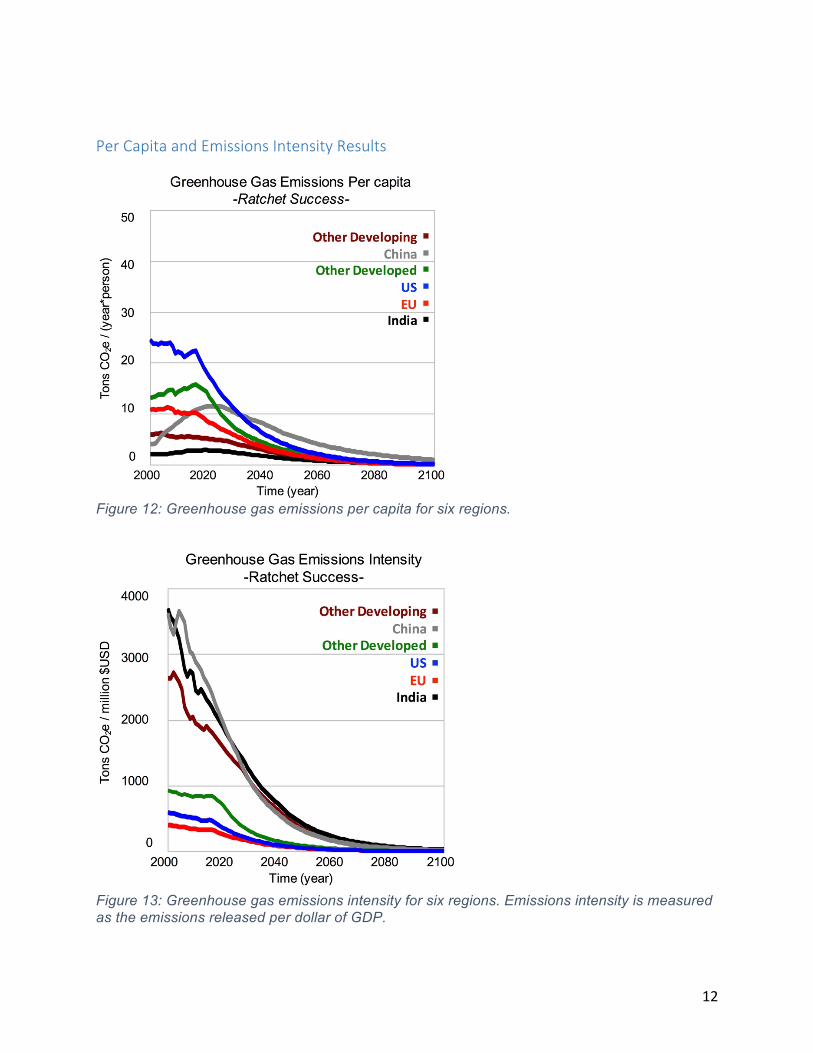
PerCapitaandEmissionsIntensityResults
Figure 12: Greenhouse gas emissions per capita for six regions.
Figure 13: Greenhouse gas emissions intensity for six regions. Emissions intensity is measured as the emissions released per dollar of GDP.
13
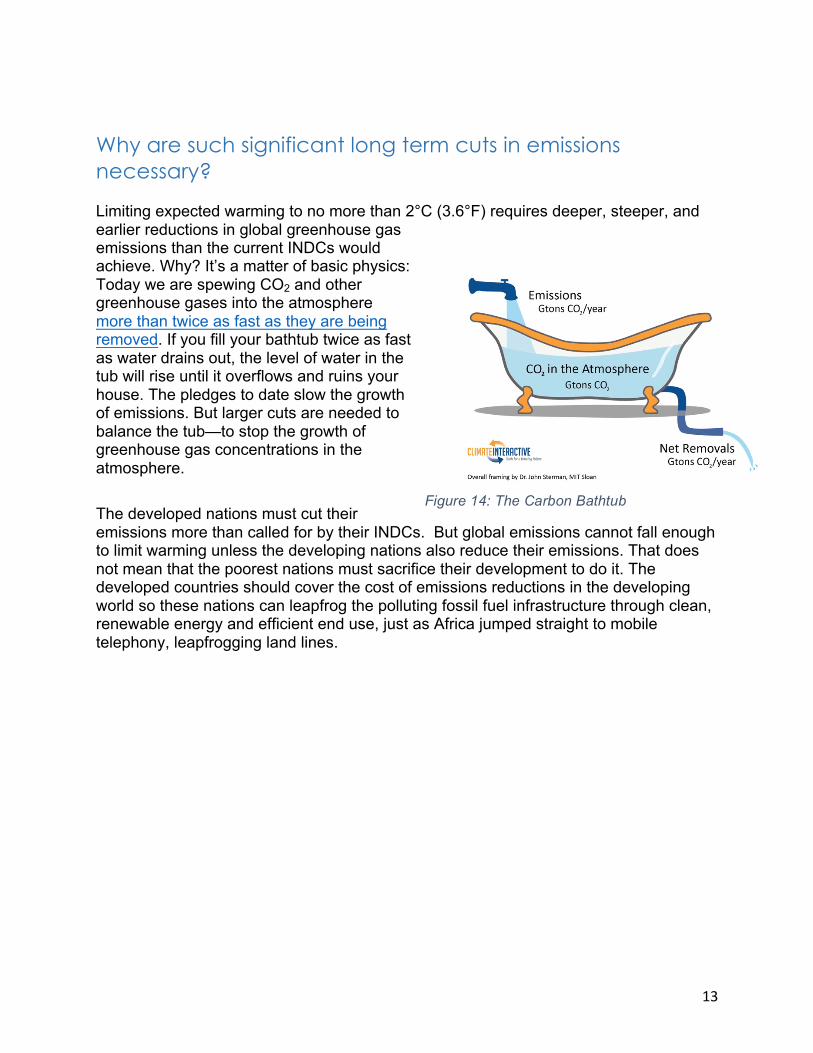
Why are such significant long term cuts in emissions necessary? Limiting expected warming to no more than 2°C (3.6°F) requires deeper, steeper, and earlier reductions in global greenhouse gas emissions than the current INDCs would achieve. Why? It’s a matter of basic physics: Today we are spewing CO2 and other greenhouse gases into the atmosphere more than twice as fast as they are being removed. If you fill your bathtub twice as fast as water drains out, the level of water in the tub will rise until it overflows and ruins your house. The pledges to date slow the growth of emissions. But larger cuts are needed to balance the tub—to stop the growth of greenhouse gas concentrations in the atmosphere.
The developed nations must cut their emissions more than called for by their INDCs. But global emissions cannot fall enough to limit warming unless the developing nations also reduce their emissions. That does not mean that the poorest nations must sacrifice their development to do it. The developed countries should cover the cost of emissions reductions in the developing world so these nations can leapfrog the polluting fossil fuel infrastructure through clean, renewable energy and efficient end use, just as Africa jumped straight to mobile telephony, leapfrogging land lines.
Figure 14: The Carbon Bathtub

14
Appendix A Table 3: National groupings for C-ROADS.
SixRegions MEFCategories
MEFRegions IndividualNations
UnitedStates(US)
DevelopedNationsinMEF
UnitedStates(US) UnitedStates(US)
EuropeanUnion(EU)
EuropeanUnion(EU)27(EU27)(plusIceland,NorwayandSwitzerland)
Austria,Belgium,Bulgaria,Cyprus,CzechRepublic,Denmark,Estonia,Finland,France,Germany,Greece,Hungary,Ireland,Italy,Latvia,Lithuania,Luxemburg,Malta,theNetherlands,Poland,Portugal,Romania,Slovakia,Spain,SwedenandtheUnitedKingdom,Iceland,NorwayandSwitzerland.(includesformerCzechoslovakia)
OtherDevelopedCountries
Russia Russia(includesfractionofformerUSSR)Canada Canada(includesrestofotherNorthAmerica)Japan JapanAustralia AustraliaSouthKorea SouthKorea
DevelopedNonMEF
NewZealand NewZealandOtherEasternEurope
Albania,Bosnia&Herzegovinia,Croatia,Macedonia,Slovenia,Armenia,Azerbaijan,Belarus,Georgia,Kazakhstan,Kyrgyzstan,Tajikistan,Turkmenistan,Ukraine,Uzbekistan(includesformerYugoslaviaandfractionofformerUSSR)
China DevelopingNationsinMEF
China ChinaIndia India IndiaOtherDevelopingCountries
Indonesia IndonesiaBrazil BrazilSouthAfrica SouthAfricaMexico Mexico
DevelopingNonMEF
OtherLargeDevelopingAsia
Philippines,Thailand,Taiwan,HongKong,Malaysia,Pakistan,Singapore
MiddleEast Bahrain,Iran,Iraq,Israel,Jordan,Kuwait,Lebanon,Oman,Qatar,SouthArabia,Syria,Turkey,UnitedArabEmirates,Yemen,WestBankandGaza(OccupiedTerritory)
OtherLatinAmerica
Argentina,Chile,Colombia,Peru,Uruguay,Venezuela,Bolivia,CostaRica,Cuba,DominicanRep.,Ecuador,ElSalvador,Guatemala,Haïti,Honduras,Jamaica,Nicaragua,Panama,Paraguay,PuertoRico,TrinidadandTobago,andCaribbeanIslands
OtherAfrica Algeria,Angola,Benin,Botswana,BurkinaFaso,Burundi,Cameroon,CapeVerde,CentralAfricanRepublic,Chad,ComoroIslands,Congo,Côted'Ivoire,Djibouti,EquatorialGuinea,EritreaandEthiopia,Gabon,Gambia,Ghana,Guinea,GuineaBissau,Kenya,Lesotho,Liberia,Libya,Madagascar,Malawi,Mali,Mauritania,Mauritius,Morocco,Mozambique,Namibia,Niger,Nigeria,Reunion,Rwanda,SaoTome&Principe,Senegal,Seychelles,SierraLeone,Somalia,SouthSudan,Sudan,Swaziland,Tanzania,Togo,Tunisia,Uganda,Zaire,Zambia,Zimbabwe,Mayotte,SaintHelena,WestSahara
OtherSmallAsia Bangladesh,Burma,Nepal,SriLanka,Afghanistan,Cambodia,Laos,Mongolia,N.Korea,Vietnam,23SmallEastAsianations