Embed Size (px)
Citation preview

CLIMATE CONTROL UTILIZING SOLAR POWERED VENTILATION SYSTEM
FOR PARKED CAR
TENGKU MARISSA BINTI TENGKU AHMAD
A project report submitted in partial fulfillment of the requirement for the award of the
Master of Electrical Engineering
Faculty of Electrical and Electronic Engineering
Universiti Tun Hussein Onn Malaysia
JANUARY 2013

v
ABSTRACT
The heating phenomenon produces by hot weather caused the car’s compartment to
gain the heat from the surrounding and the sunlight radiation, while inside the
compartment will have a higher temperature compared to the outside surroundings.
The high heat trapped in the enclose compartment will bring uncomfortable and
suffocation feel for the driver and passengers when they enter the parked car at the
open parking areas. This occurs due to the process of heat transfer from the external
environment to the interior of the car. Higher air condition power is necessary to
cope with this situation. However, it only functions when the engine is running.
Therefore, this research intended to invent a ventilation system and use the
application of solar energy as the power source during the engine is not operating.
The aim of this system is to eliminate and mitigate the effects of heat in the car when
parked. This research also is to determine the temperature increment inside the car
compartment under direct sunlight. The heat analysis was done to determine the total
heat flux produced in the parked car compartment. The value then are used to
determine the flow rate, cubit feet per minutes (CFM) that needed by the ventilation
fan and used to determine the sizing of the solar panel and the battery capacity.
Result from this study shows that this system manages to reduce temperature inside
the car compartment from 49.6°C less to 41.3°C with 53% of the effectiveness. As a
conclusion, the model of the ventilation system is successfully built with the AC
blowing fan and a set of electronic circuit board to control the motor level of the
blower speed and powered by the solar energy. The bigger area of solar power source
produces a high of electricity to generate power to ensure the system can operate
with high efficiency.

vi
ABSTRAK
Fenomena pemanasan yang dihasilkan oleh cuaca panas menyebabkan peningkatan
haba di dalam ruangan kereta kesan oleh haba dari sekeliling dan sinaran cahaya
matahari, manakala ruang di dalam kereta akan mempunyai suhu yang lebih tinggi
berbanding dengan persekitaran luar. Haba tinggi yang terperangkap di dalam
ruangan tertutup akan menyebabkan rasa tidak selesa dan lemas untuk pemandu dan
penumpang apabila mereka memasuki kereta yang diletakkan di kawasan tempat
letak kereta terbuka. Ini berlaku disebabkan oleh proses pemindahan haba dari
persekitaran luar ke dalam ruangan kereta. Penggunaan penyaman udara pada
kelajuan yang tinggi adalah perlu untuk menangani masalah ini.
Walaubagaimanapun, ianya hanya berfungsi apabila enjin sedang beroperasi. Oleh
itu, kajian ini dilakukan bertujuan untuk mencipta sebuah sistem pengudaraan dan
menggunakan aplikasi tenaga solar sebagai sumber kuasa semasa enjin tidak
beroperasi. Objektif sistem ini adalah untuk mengurangkan kesan haba dalam kereta
apabila kereta berada di tempat letak kereta. Kajian ini juga adalah untuk
menentukan kenaikan suhu di dalam ruangan kereta di bawah pancaran terus cahaya
matahari. Analisis haba telah dilakukan untuk menentukan jumlah fluks haba yang
dihasilkan dalam ruangan kereta di tempat letak kereta. Kemudiannya, data
berkenaan digunakan untuk menentukan kadar aliran, kaki hasta per minit (CFM)
yang diperlukan oleh kipas pengudaraan dan digunakan untuk menentukan saiz panel
solar dan kapasiti bateri. Keputusan daripada kajian ini menunjukkan bahawa sistem
ini berjaya untuk mengurangkan suhu di dalam ruangan kereta dari 49.6 ° C kepada
41.3 ° C iaitu dengan kecekapan sebanyak 53%. Kesimpulannya, model sistem
pengudaraan berjaya dibina dengan menggunakan kipas penghembus AC dan satu
set litar elektronik untuk mengawal tahap kelajuan kipas penghmbus yang dikuasai
oleh tenaga solar. Semaikin luas kawasan solar yang terdedah, semakin tinggi tenaga
elektrik yang dihasilkan untuk menjana sistem ini pada kecekapan yang lebih tinggi.

vii
TABLE OF CONTENTS
TITLE i
DECLARATION ii
DEDICATION
ACKNOWLEDGEMENT
ABSTRACT
CONTENTS
LIST OF TABLE
LIST OF FIGURE
LIST OF SYMBOLS AND ABBREVIATIONS
LIST OF APPENDICES
iii
iv
v
vii
x
xi
xiii
xv
CHAPTER 1 INTRODUCTION
1.1 Overview of the Project
1.2 Problem statement
1
4
1.3 Objectives 5
1.4 Scope of Work
1.5 Thesis Structure
5
5
CHAPTER 2 LITERATURE REVIEW
2.1 Overview 7
2.2 Previous Study 8
viii
2.3 Studies on Preliminary Design of Ventilation
System in The Car Using Solar Energy
2.3.1 Studies on Solar Energy
2.3.2 Solar Panel
2.3.4 Battery
2.4 Car Air Ventilation
2.5 Ventilation With Solar Energy
2.5.1 Ventilation Fan
2.6 Theory of Heat Analysis in Cars Based Solar
Radiation
11
12
12
14
15
16
16
18
CHAPTER 3 METHODOLOGY
3.1 Introduction 21
3.2 Project Planning Flowchart 23
3.3 Device and Apparatus Selection
3.3.1 Fans As Heat Removing Device
3.3.2 Thermometer
3.3.3 Multimeter, Tachometer And Lux Meter
Device
25
25
26
26
3.4 Designing and Fabricating the Ventilation
System
3.4.1 Experiment Set Up
3.5 Analysis Method
27
28
29
CHAPTER 4 RESULT AND ANLYSIS
4.1 Introduction
4.2 Heat Analysis Inside The Car
4.2.1 Heat Analysis On Car Windscreen
4.2.2 Heat Analysis On Car Rear Mirror
4.2.3 Heat Analysis On Car Side Mirror
4.3 Ventilation Fan Sizing Analysis
30
31
32
34
37
39

ix
4.4 Solar Panel Sizing Analysis
4.5 Battery Sizing Analysis
4.6 Result Data
4.7 DC Motor Controller Using PIC16F877A
4.7.1 The Motor Speed At Level 1
4.7.2 The Motor Speed At Level 2
4.7.3 The Motor Speed At Level 3
4.7.4 The Motor Speed At Level 4
4.7.5 The Motor Speed At Level 5
4.8 The Performance Of Battery Storage
4.9 Temperature Sensor Circuit
4.10 Temperature Analysis Without Ventilation
System Install
4.11 Temperature Average Without Ventilation
System Install
4.12 Temperature Analysis With Ventilation
System Install
4.13 Temperature Average With Ventilation
System Install
4.14 Temperature Comparison
4.15 Effectiveness Of The System
4.16 Propose New Design
40
40
41
42
43
44
45
46
47
48
50
51
52
53
54
55
56
57
CHAPTER 5 CONCLUSION AND RECOMMONDATION
5.1 Discussion
5.2 Conclusion
5.3 Future Recommendations
REFERENCES
APPENDICES
63
65
66
67
70

x
LIST OF TABLE
4.1 Result for the motor level and motor speed based on the 41
temperature range
4.2 Result for PWM Pulse 48
4.3 Result of the temperature and voltage from output LM35 50
4.4 Effectiveness Of the Ventilation System 56

xii
LIST OF FIGURE
1.1 Type of accidents among children from 2006 until 2011 2
1.2 Graph the Number Death of Children in Vehicle cause by 3
Hyperthermia
2.1 Temperature variation with the time at different locations 8
2.2 Part of the simulation model 9
2.3 Temperature distribution in the car without ventilation rear 9
view
2.4 The Diagram of Percentage Temperatures Efficiency versus 10
Flow Rate Q Bjorn Jenssen Wachenfeldt
2.5 Typical trend of dashboard surface temperature during 11
parking conditions in summer
2.6 Flow of air when the vehicle moves forward 15
2.7 Squirrel cage that used to help move air throughout the 15
passenger compartment
2.8 Schematic diagram of light radiation through the glass 20
3.1 General Flow Chart Of The Project 21
3.2 Flow Chart Of Project Planning 23
3.3 Blower ( Centrifugal Fan Type) 25
3.4 Digital Temperature to measure temperature inside the 26
Car compartment
3.5 Tachometer and Digital Multimeter 27
3.6 Lux Meter 27
3.7 Schematic Diagram of the Project by using Proteous 28
Sofware
3.7 Diagram for Location of the System Components 29
4.1 Side view Car Windscreen 32

xii
4.2 Side view Car Windscreen 34
4.3 Side view windows Front and Rear Side Car 37
4.4 Waveform of PWM during Time High (TH) cycle. 43
4.5 Waveform of PWM during Time Low (TL) cycle 44
4.6 Waveform of PWM during Time High (TH) cycle 44
4.7 Waveform of PWM during Time Low (TL) cycle 45
4.8 Waveform of PWM during Time High (TH) cycle 45
4.9 Waveform of PWM during Time Low (TL) cycle 46
4.10 Waveform of PWM during Time High (TH) cycle 46
4.11 Waveform of PWM during Time Low (TL) cycle 47
4.12 Waveform of PWM during Time High (TH) cycle 47
4.13 Graph of The Performance Of Battery Storage 49
4.14 Graph the performance of output voltage without solar 49
charging, and with solar charging
4.15 Graph of Voltage VS Temperature 51
4.16 Temperatures without Ventilation System Install 52
4.17 Average Temperatures chart for Without Ventilation System 53
Install
4.18 Temperatures with Ventilation System Install 54
4.19 Average Temperature chart with Ventilation System Install 55
4.20 Temperature’s Comparison Chart 56
4.21 Graph of Temperature Data 58
4.22 Propose New Design from the Outside View 61
4.23 Propose New design from the Cross Section View 62

xiii
LIST OF ABBREVIATIONS
Dosp - Daily output of solar panel ( W h per day at 12V)
II - Current at load or other current specification of solar panel (A)
Di - Daily Insolation (peak-hour per day)
Nsp - Minimum number of solar panel
Re - Daily equipment of appliances (W h per day)
Dosp - Daily output of one module( W h per day at 12V)
Ŋbc - Charging effiency of battery (%)
Ct - Total usable capacity needed (A h at 12V)
Re - Daily requirement of appliances (W h per day)
Sd - Period of storage required (days)
Nb - Minimum number of 12V batteries needed
Ct - Total usable capacity needed (A h at 12V)
Cb - Full capacity specified for one 12V battery (A h)
Rmaks - maximum depth of cycle (%)
RPM - Rotation Per Minutes
W - Power (Watt)
V - Voltage (Volt)
I - Current (Ampere)
AC - Alternating Current (Ampere)
CFM - Cubit Per Minutes (ft3/min)
Q - Total Heat Flux (Btu/ hr)
Ti - Temperature Inside (oC)
To - Temperature Outside (oC)
As - Area of the window surface expose to sunlight, ft2
F - Film coefficient of heat transfer
It - Transmitted intensity

xiv
U - The average heat transfer coefficient through the window framed
α - Absorptivity
τ - Transmittivity
Cn - Whether brightness number
C - Radiation diffusion factor
A - Solar radiation
B - Atmospheric extinction coefficient,
β - Degrees declined
ε - Slope angle of the surface

xv
LIST OF APPENDICES
APPENDIX TITLE PAGE
A World Solar Energy Map # 7 Solarex. 70
B Coefficient of Solar Radiation Based on Average 71
Bright Day At The time of day 21 Per Month
C Senses Human Relations, Pisikologi And Health 72
Response To Long-term exposure. (Reprint from
ASHRAE Fundamentals 1993)
D Hardware Development Process 73
E Testing Area 74

CHAPTER 1
INTRODUCTION
1.1 Overview of the Project
Global warming of earth has faced many problems due to the high temperature that
can cause adverse effect including the car that we used every day. A car that's been
exposed to direct sunlight for an extended period will develop a temperature built up
inside it. The factors contributing to this is the temperature outside of the car, the
temperature inside of the car directly proportional with the temperature outside. It is
also depends on the inlet condition of a car, the place with more air circulation will
have the highest temperature rise.
Most of the vehicle nowadays has very efficient and reliable heating
ventilating, and air conditioning (HVAC) system. Ventilation was simple to arrange
by opening the window. However the air entering was as hot, cold, or dusty as the air
outside. Sheathing paper, weather windows and shading curtains can be used to
control an automobile’s temperature, but they are not very effective. When the
weather turned hot, most drivers simply put up with the discomfort. Moreover, the
instrumentation panel, leather seats and plastic accessories, among other items, age
rapidly if exposed to these temperatures for a long period. It also causes a rise in fuel
consumption due to higher power of air conditioning needed to cool down the car
cabin, the interior of the car such as the dashboard, leather seats and the plastic
accessories will age rapidly under the exposure to high temperature and there are also
minor cases of child death while trapped inside the vehicle. The ventilation system is
designed to provide comfort for the driver and passenger. It is intended to maintain

2
in-car temperature and humidity within a range that is comfortable for the people
inside and provide fresh, clean air for ventilation. This temperature range helps keep
the driver alert and attentive.
Figure 1.1 shows the type of accidents among children from 2006 until 2011
at United State. From this observation, the pie chart shows the number of accidents
involving children left in the car showed the highest percentage compared to other
accidents such as underage driver, car theft, backovers, frontovers, vehicle in motion
and etc. This caused the child left in a car in the hot condition inside the vehicle. This
causes them to drown and can cause occurrence Hyperthermia.
Figure 1.1: Type of accidents among children from 2006 until 2011
Studies indicate that, each year children die from hyperthermia as a result of
being left in parked vehicles. Hyperthermia is an acute condition that occurs when
the body absorbs more heat than it can dissipate. Hyperthermia can occur even on a
mild day. Studies have shown that the temperature inside a parked vehicle can
rapidly rise to a dangerous level for children, adults and pets. Figure 1.1 shows the
graph of number death among children that cause by hyperthermia due to suffocation
inside the vehicle.
6%
7%
6%
13%
13%
5%
50%
Underage Driver
Car Theft
Others
Backover Collision
Frontovers Collision
Vehicle In Motion
Left Alone

3
Figure 1.2:Graph the Number Death of Children in Vehicle cause by Hyperthermia
Therefore, this 'Climate Control Utilizing Solar Powered Ventilation System
For Parked Vehicle' was specifically designed to overcome heat problems occur in
while their vehicles parked. The objective of this system is to eliminate or mitigate
the effects of heat in the car while the car is parked. The project is intended for an
invention of an independent ventilation system to maintain the thermal comfort range
of a compartment car for pleasure of the passenger, for the safety precaution if there
a case of self-lock happen, and it is also financially positive for fuel consumption and
interior investment of the car.
This system will use the solar energy as a power source. Refers to the world
of solar energy map as shown in (Appendix A), Malaysia receives direct sunlight
during peak hours on average four to five hours a day. This makes Malaysia among
one of the countries that receive the longest high levels of sunlight in the world. For
saving electricity, the use of solar energy is very effective because duration sunlight
receives in Malaysia is sufficient to generate electric power to an optimum level.
Solar was used to generate the energy as a power to move a fan to blow the
fresh air inside the car that will make good air ventilation in the vehicles. The use of
solar system thus can save the use of electricity and fuel consumption as fuel price is
0
5
10
15
20
25
30
35
40
45
50
Hyperthermia (Heart Stroke) Deaths Of Children In Vehicle

4
going higher nowadays. Thus it would be a great way for vehicle to reduce air
conditioning uses, thus increasing fuel economy.
Therefore, the study of the use of solar energy as a power source for
ventilation systems for passenger cars is very important. Solar energy is used to
ensure that the ventilation system is always working when the car engine is turned
off thereby saving energy and costs as solely derived power from the sun is always
available.
1.2 Problem Statement
The temperature inside the car cabin is easily controlled while the engine if the car is
running. This can be achieved by using the air conditioning system. However, what
happens if the passenger is waiting inside the car while the engine is not operating, is
the passenger managing to be comfortable inside the car while the car is parked
directly under sunlight and the heats inside the car cabin is increasing.
The main question that leads to this research is ‘how to employ an effective
system by managing the flow inside the car compartment. This is because the heat
built inside car compartment can cause a lot of problems such as reducing comfort
when entering the blazing hot compartment. Besides that, it also can increase the
safety preventing case such child asphyxiated and dehydrated in the car.
Furthermore, it is prohibited to use a window tinted film in Malaysia as its state of
the governing law. With this, we cannot put a protection layer at the vehicle windows
to prevent direct UV heat from the outside as it will be very more dangerous to
babies and pregnant woman that enter the car. However, if the person intend to stay
in the car with the air-conditioning on, they can prevent their vehicle to get overheat
by the cool air produce but this is consider as wastage because high power use by the
air-conditioning to produce cool air consume high petrol usage. Another effect due to
the increased heat in the car will reduce the lifespan of the car interior due to
exposure to high temperatures. It also causes the inner surfaces of the car, cushions
and steering wheel become hot. So we had to wear glove on occasion just to hold the
steering wheel.

5
1.2 Objectives
The purposes of this project are;
(i) To determine the temperature increment inside the compartment car under
direct sunlight.
(ii) To design a solar powered ventilation system that can eliminate and mitigate
the effects of heat and suffocating inside car compartment.
(iii) To develop the heat analysis by determining the total heat flux produced in
the static car compartment.
1.4 Scope of Work
This project is primarily concerned with theclimate control utilizing solar powered
ventilation system for parked car.Scopes of this project are:
(i) Search, review and gather information about literatures reviews of car cabin
ventilation from the journal and references book.
(ii) Run the experiment to determine the temperature distribution and its
increment inside car cabin.
(iii) Modelling the intelligent actual climate control utilizing solar panel system
by using Proteusand MPLAB software.
(iv) Design and implementation of the heat control algorithm with solar panel.
1.5 Thesis Structure
This thesis is divided into five main chapters, which in the first chapter is the
introduction of the study. It covers topics such as sub-objectives and scope of the
study.
Whereas in Chapter 2, involves the theories that relate to the study. In
addition, the literature review also infused at this chapter as a reference for the
development of this project and comparison of the results obtained from the research.
For this study to be organized, structured work plan had placed in Chapter 3.
Methodology and procedures work such as experimental steps carefully arranged.
Selection of components and equipment also explained in this chapter. In addition,

6
the design of this project is also shown to explain more clearly how the experiment
was conducted.
After statistical work is done, the process of retrieval of information or data
attached in Chapter 4. Data were recorded in the form of tables and graphs to analyze
the process. In this part, the analysis and discussion were critically described.
Then all the results obtained will be summarized into a simple and compact
conclusion in Chapter 5 and provided suggestions for improving the study to be
undertaken in the future

CHAPTER 2
LITERATURE REVIEW
2.1 Overview
According to research Wan Mohd kamil Bin Yacob from Universiti Malaysia Pahang
conducted in late 2009 on Waja Car, the maximum temperature inside the car that
fully closed under direct of sunlight can be increased up to 72.7 °C. At temperature
with that high it can cause of our car tax tag damaged when it frequently expose to
the sun and the materials are made of plastic release Nox (Nitrogen monoxide mixing
and nitrogen dioxide) that affect our health and damage cell membranes, proteins and
acute inflammation of the respiratory tract in lung and cause asthma.
How many years ago there Vint brand car accessories install in the car which
allows the car to breathe. It will draw cold air from the outside and remove the hot
air in the car to lower the heat in the car. However it is not practical due to the fan
using a car battery power. This is because, when the car is not moving for a period of
two days (Saturday and Sunday) cause’s users burdened when they have work on
Monday. Car battery is not capable of giving power to turn on the car engine.
Leno sales companies have introduced a small fan placed in the window to
remove the hot air. But it has various drawbacks which is just with small open
window and only covered by rubber. Rubber can be pulled out with this it allows
easy car stolen or invaded. Solar cell placed vertically on the window. When the sun
is positioned in the middle of the sky, sunlight will not exposed the solar panel
because protected by the door visor. This will cause the system can not function as
8
expected. Moreover, there were no air holes for blowing hot air out of the car. How
could little fan will be able to create a vacuum in the car.
Therefore, the planning studies take a leading role in the definitions of an
issue. In this project, this system is designed to overcome these weaknesses. Due to
several variables involved in the method and process, the planning activities had
been before the actual product can be implemented.
2.2 Previous Study
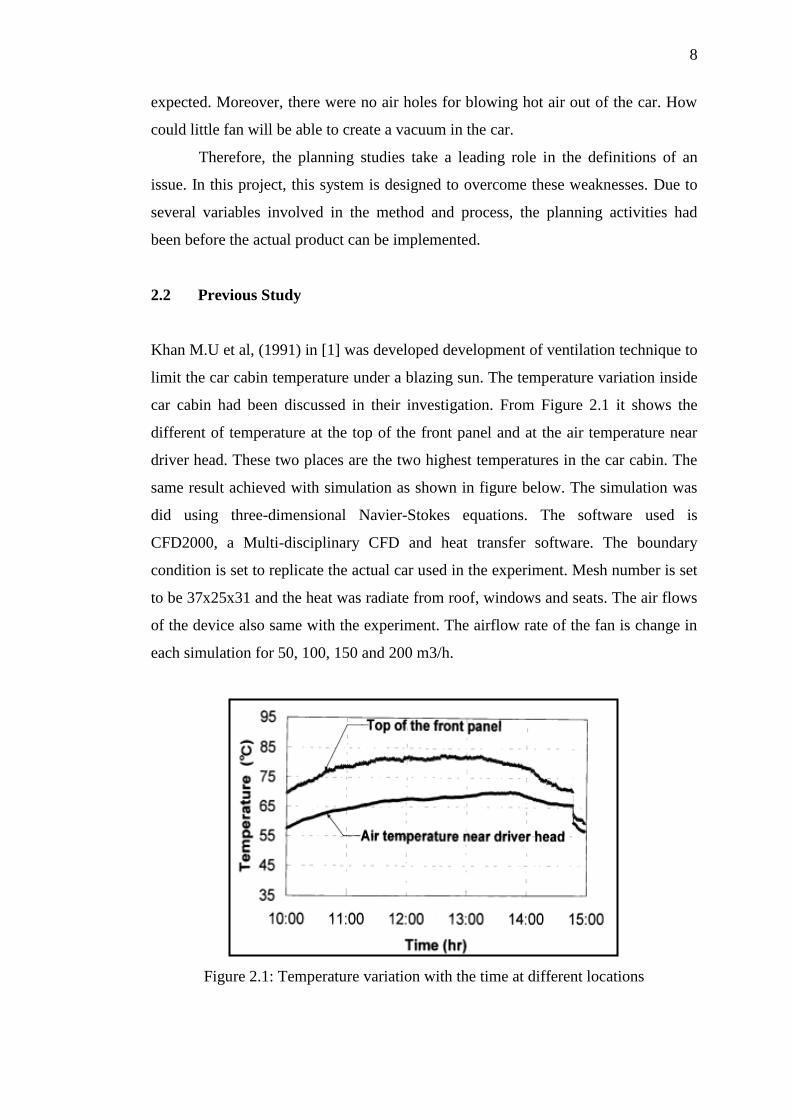
Khan M.U et al, (1991) in [1] was developed development of ventilation technique to
limit the car cabin temperature under a blazing sun. The temperature variation inside
car cabin had been discussed in their investigation. From Figure 2.1 it shows the
different of temperature at the top of the front panel and at the air temperature near
driver head. These two places are the two highest temperatures in the car cabin. The
same result achieved with simulation as shown in figure below. The simulation was
did using three-dimensional Navier-Stokes equations. The software used is
CFD2000, a Multi-disciplinary CFD and heat transfer software. The boundary
condition is set to replicate the actual car used in the experiment. Mesh number is set
to be 37x25x31 and the heat was radiate from roof, windows and seats. The air flows
of the device also same with the experiment. The airflow rate of the fan is change in
each simulation for 50, 100, 150 and 200 m3/h.
Figure 2.1: Temperature variation with the time at different locations

9
The results from the simulation showed in Figure 2.2 and 2.3 shows almost
the same pattern as experimental data. The maximum temperature taken is at the
front dashboard that is 81°C and followed by the air space near the driver head,
66°C[1].
Figure 2.2: Part of the simulation model
Figure 2.3: Temperature distribution in the car without ventilation rear view
Beside that, Bjorn Jenssen Wachenfldt et al, (2006) in [2] was investigated
about air flow rate ane energy saving potential in school with demand controlled
displacement ventilation. Figure 2.4 shown the heating temperature against volume
flow rate, the efficiency is dropping with the flow rate of ventilation is increasing.
The heat in a room is continuous replace by fresh air from outside so the energy loss
because of the heat is being transfer out during the ventilation blower is running.
From this concept, the ventilation process could reduce the temperature inside the
compartment of a car when parking under the sun as a heating source. The main
reason is the reduce heat recovery efficiency for the higher airflow rate. The graph
taken from Bjorn Jenssse Wachenfeldt [2] is strongly to back up my research that the

10
temperature will fall to certain temperature with is lower than the temperature before
ventilation.
Figure 2.4: The Diagram of Percentage Temperatures Efficiency versus Flow Rate Q
BJORN JENSSEN WACHENFELDT
Maurizio, C and Centro, R.F, (1999) in [3], was investigated the thermal in
cab and measurement problems. Results from this study showed the dashboard
temperature changes in space vehicles is dependent on ambient temperature, which
affects the environment temperature rise of internal temperature rise, as shown in
Figure 2.5. In this study, found that the criteria and limits for existing thermal
comfort for the application environment is not suitable structures applied to the car
cabin environment. This is because the thermal condition of the vehicle is a complex
of relations to a normal condition. Furthermore, the building environment, it is easy
to determine the quantity and the environmental differences are difficult to measure
for the vehicle because it is a body that can change position.

11
Figure 2.5 : Typical trend of dashboard surface temperature during parking
conditions in summer
Another study case was about automatic Ceiling fan using PIR sensor by
Mohd Rasidi Md Radzi, (2009/2010) in [4]. His project is to make the ceiling fan
become ‘smart’ where it can sense the human present in the specific area and can
turn on or off automatically. The main component that must be used to make sure the
ceiling fan controller can switch the interested speed itself is by using
microcontroller PIC16F877A. The way it working is as follow, when a user waves
their hand, the PIC16F877A will analyse the signal given. After that, the output
motor will receive the analog signal so that the motor driver can make the fan blow
to reduce, increase and turn off based on the signal given by the user.
2.3 Studies on Preliminary Design of Ventilation System inThe Car Using
Solar Energy
This study was conducted to produce a preliminary design of the ventilation system
in the car using solar energy. In this study, an analysis was done to determine the air
flow rate, CFM in the car through the method of calculation. This value is then
applied to the selection of ventilation fan. Experiments were also conducted to
temperature changes in the car before the ventilation system is installed where

12
comparisons have been made between these experiments with temperature changes
after experimental ventilation system installed.
2.3.1 Studies on Solar Energy
Now, many people use solar energy or photovoltaic energy as an alternative power
because it’s vastly available and renewable. In solar photovoltaic, sunlight is actually
converted into electricity. Solar panels are made of silicon which will produce an
electric charge when receiving direct sunlight or light.
Electrical charge from the solar panel is routed to the output terminals to
produce low-voltage alternating current or direct current, generally between six to 24
volts. Normally the value of nominal output is 12 volts while the effective output
value will increase up to 17 volts. Nominal output voltage of 12 volts is the reference
voltage but operating voltage can be up to 17 volts or more as a system of charging a
car battery Charger battery voltage of 12 volts above 12 volts. This shows that there
is a difference between the reference voltages with the actual operating voltage [5].
Sun radiation intensity change by the hour every day and weather conditions.
To make the analysis of a solar system, the amount of solar radiation is shown in the
full sun hours per m² or peak sun hours. Term peak sun hours mean an average
enrolment of sunlight per day in the year.
2.3.2 Solar Panel
The solar panels were made from silicon which is will produce an electric charge
when receiving direct sunlight or light. An electric charge from the solar panel is
routed to the output terminals to produce low-voltage alternating current or direct
current, generally between 6 to 24 volts. Normally the nominal output is 12 volts.
This is the nominal output voltage as the reference voltage but operating voltage can
be up to 17 volts or more as a system battery charger capable of charging the battery
voltage exceeds 12 volts. This shows that there is a difference between the reference
voltages with the actual operating voltage.
The output of a solar panel is usually stated in watts, and the wattage is
determined by multiplying the rated voltage by the rated ampere.So for example, a
12 volt 60 watt solar panel measuring about 20 X 44 inches has a rated voltage of

13
17.1 and rated current 3.5 ampere.If an average of 6 hours of peak sun per day is
available in an area, then the above solar panel can produce an average 360 watt
hours of power per day; 60w times 6hrs. = 360 watt-hours. Since the intensity of
sunlight contacting the solar panel varies throughout the day, we use the term "peak
sun hours" as a method to smooth out the variations into a daily average. Early
morning and late-in-the-day, sunlight produces less power than the mid-day sun.
Naturally, cloudy days will produce less power than bright sunny days as well.
Electricity produced by a panel calculated using the equation [5]:
Dosp = II x Dix 12v (2.1)
Where :
Dosp =Daily output of solar panel ( W h per day at 12V)
II = Current at load or other current specification of solar panel (A)
Di = Daily Insolation (peak-hour per day)
To determine the number solar panel require, the power loses when charging
the batteries must be consider. This is the efficiency of the battery charger. The
suitable value is 80 per cent for leaded acid batteries and 70 percent for nickel-
cadmium batteries. The sizing formula for the minimum number of solar panels
require is shown in equation (2.2)[5] :
Nsp = 𝑅𝑒 𝑥 100 %
Do sp
ŋ𝑏𝑐 (2.2)
Where :
Nsp = Minimum number of solar panel
Re = Daily equipment of appliances (W h per day)
Dosp = Daily output of one module( W h per day at 12V)
Ŋbc =Charging effiency of battery (%)

14
2.3.3 Battery
Internal cycle batteries are designed to be re-charged and charge thousands of times.
The battery is measured in Ampere-hours and usually at 20 hours and 100 hours. In
summary, the ampere-hour is the amount of current in amperes at which they can be
supplied by a battery in a long time. For example, a 350 amp hour battery can supply
17.5 Amp continuous current for 20 hours or 35 Amp continuous current for 10
hours. To quickly identify the total wattage supplied in battery 6 volt 360 amp-hour,
360 Amp-hours multiplied by 6 volt equal to 2160 watts or 2.16 kWh (kilowatt-
hour).
The usable capacity required is calculated from the daily electrical
requirement and period of usage as follows equation (2.3) [5] :
V
SRC de
t12
(2.3)
where;
Ct = Total usable capacity needed (A h at 12V)
Re = Daily requirement of appliances (W h per day)
Sd = Period of storage required (days)
Therefore, the number of batteries that are needed is calculated from the
usable capacity and cycle depth as follows [5]:
maks
b
t
bR
C
C
N
%100
(2.4)
where;
Nb = Minimum number of 12V batteries needed
Ct = Total usable capacity needed (A h at 12V)
Cb = Full capacity specified for one 12V battery (A h)
Rmaks = maximum depth of cycle (%)

15
2.4 Car Air Ventilation
Ventilation is a removing process that allows clean air accessing the car cabin and
removing stale air. The process begins when the clean air, is allows entering the car
cabin whether by it is force by mechanical system available or flowing naturally
inside to the car. This ventilation system is important to keep the passenger
compartment at a comfortable temperature. For health and comfort, some fresh air
must pass through the passenger compartment. This replaces the stale and sometimes
smoke-filled air inside the vehicle. The process is called ventilation. Most of people
use to closed compartment car as a solution on preventing dusty air from entering the
car. Then people start to use ducting system to allow air enter their car. Figure
2.6show the earliest closed cabin ventilation was the cowl air intake. When air
coming over the hood scooped into the car interior through the space provided when
the ventilator raise. However when the vehicles stopped or move slowly, just a little
fresh air enters. This is one reason most vehicles have a power ventilating system
which actually used a fan or blower and the fan is located in the dashboard. A blower
assembly is attached to the motor shaft and the entire unit is placed inside the blower
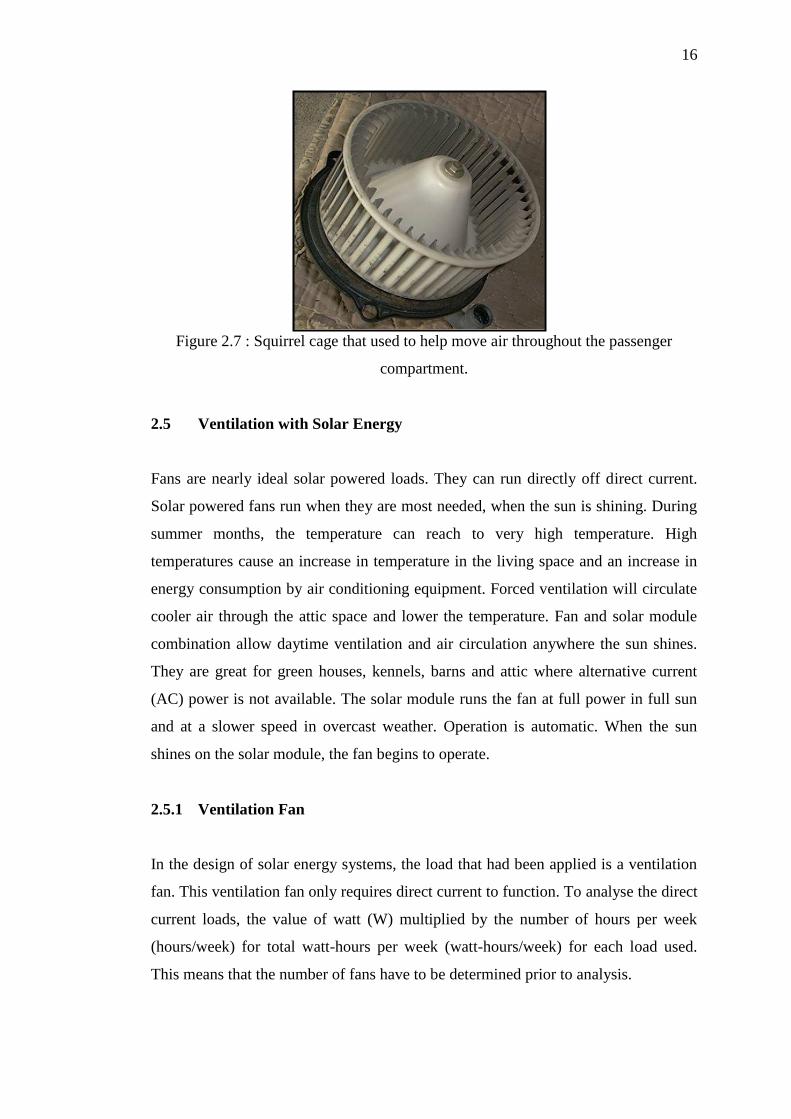
housing. As the squirrel cage blowers as shown in Figure 2.7 rotates, its produces a
strong suction in the intake. A pressure is also created on the output. When the fan
motor is energized by using the temperature control on the dashboard, air is moved
through the passenger compartment [6].
Figure 2.6 : Flow of air when the vehicle moves forward
16
Figure 2.7 : Squirrel cage that used to help move air throughout the passenger
compartment.
2.5 Ventilation with Solar Energy
Fans are nearly ideal solar powered loads. They can run directly off direct current.
Solar powered fans run when they are most needed, when the sun is shining. During
summer months, the temperature can reach to very high temperature. High
temperatures cause an increase in temperature in the living space and an increase in
energy consumption by air conditioning equipment. Forced ventilation will circulate
cooler air through the attic space and lower the temperature. Fan and solar module
combination allow daytime ventilation and air circulation anywhere the sun shines.
They are great for green houses, kennels, barns and attic where alternative current
(AC) power is not available. The solar module runs the fan at full power in full sun
and at a slower speed in overcast weather. Operation is automatic. When the sun
shines on the solar module, the fan begins to operate.
2.5.1 Ventilation Fan
In the design of solar energy systems, the load that had been applied is a ventilation
fan. This ventilation fan only requires direct current to function. To analyse the direct
current loads, the value of watt (W) multiplied by the number of hours per week
(hours/week) for total watt-hours per week (watt-hours/week) for each load used.
This means that the number of fans have to be determined prior to analysis.

17
Besides that, for the requirement of ventilation system, fan selection is
determined by calculating the fan flow rate, CFM. Flow rate, CFM of the fan is
determined using the method of heat removal (Heat-Removal Method) [3] as in
equation (2.5) [7]:
CFM = )(085.1 oi TT
Q
(2.5)
where;
CFM = Fan flow rate (ft3/min)
Q = Total heat increase (Btu/ hr)
Ti = Maximum tolarance inside temperature (˚C)
To = Average outside temperature (˚C)
To calculate the daily requirement in W h per day for a solar system, as
system designer, must first list all the appliances that are expected to be used in the
system. For each appliance, find its power and decide the amount of time in hours
that it will be used each day. The calculation of daily requirement for each appliance
is as follows [5]:
dee TPR (2.6)
dimana;
Re = Daily requirement of one appliance (W h per day)
Pe = Power of appliance (W)
Td = Expected daily use of appliance (hours per day)

18
2.6 Theory of Heat analysis in Cars Based Solar Radiation
Analysis of the increase of heat in the car is based on the average estimate model
sunny days, ASHRAE. General equation for heat increase is [8] :
Qw = As [FIt + U (T0 – Ti)] (2.8)
Where ;
As = Area of the window surface expose to sunlight, ft2
F = Film coefficient of heat transfer
It = Transmitted intensity
U = The average heat transfer coefficient through the window framed
= 1.11 Btu/hr.ft2.0F
T0 = Outside temperature, 0F
Ti = Inside temperature, 0F
Equation for area of the window surface expose to sunlight is [8]:
As = ( X-x )( Y-y ) = ( X- Dx tan α )
cos
tanyDY (2.9)
Equation for Film coefficient of heat transfer [8];
F = τ + h
u (2.10)
Where ;
h0 = Heat transfer coefficient for the outer surface of the glass
= 1.11 Btu/hr.ft2.0F
α = Absorptivity
τ = Transmittivity

19
Light Intensity can be determined by multiply within direct intensity, ID and
diffusse intensity, Id as shown in equation (2.11) [8]:
I = ID + Id (2.11)
ID =
sinexp
B
ACn (2.12)
Where ;
Cn = Whether brightness number = 0.9
C = Radiation diffusion factor = 0.122
A = Solar radiation is significant when the air mass equal to zero
= 351 Btu/hr.ft2
B = Atmospheric extinction coefficient, which depends on the amount of
vapor content in the atmosphere
= 0.201
β = Degrees declined
Id = 2
N
SSD
C
FCI (2.13)
Fss = 2
cos0.1 (2.14)
Where ;
ε = Slope angle of the surface
Figure 2.8 shows the radiation of light through glass or glass that will be
taken into the analysis to be carried out. In theory, the formula involved is as in
equation (2.13) [8].

20
I = τIt
It = Icos θ
It = αIcos θ (2.15)
Figure 2.8: Schematic diagram of light radiation through the glass.

CHAPTER 3
METHODOLOGY
3.1 Introduction
START
PHASE A
(PROJECT
STUDY)
PHASE B (DESIGN &
DEVELOPMENT)
LITERATURE
REVIEW
DEVICE
SELECTION
CONTROLLER
(PIC)
-SOLAR
-MOTOR
-TEMPERATURE
SENSOR
DESIGNING
HARDWARE
CIRCUIT
WRITE
ASSEMBLY
LANGUAGE
INSTALL
HARDWARE
COMPONENT
DOWNLOAD
HEX FILE TO
PIC
TEST
HARDWARE
TEST AND
SIMULATE
COMBINE
HARDWARE
AND
SOFTWARE
TEST AND
TROUBLESHOOT
ATTACH
SYSTEM TO
TEST OBJECT
SET THE
OPTIMIZE
PLACEMENT
MAXIMUM
READING?
ENDRESULT AND
ANALYSIS
THESIS
WRITING
YES
NO
NO
YES
NO
NO
YES
YES
Figure 3.1:General Flow Chart of The Project

22
Figure 3.1 shows the flow chart of the methodology flow for this project. This
project is divided into two parts which is phase A and phase B. For project study
phase A is where determines the objective, scope and do the literature review.
Research and studies of all information from the specific sources are being filtered
and simplified in this chapter. It also included the steps of planning and several
phases to ensure the project can be working successfully. Further, the selection of
appropriate device for this project and is available such as solar panel, blower motor,
and temperature sensor. The third part is the system controller. Here, the PIC
microcontroller has taken over this task. Further, proceed with designing hardware
circuit using Proteus.
This project continued in the Master Project 2, starting with phase 2. Phase 2
is the designing and development. Firstly install the hardware to PCB board and then
test the hardware to make sure the output normal. Next, create the assembly language
and downloads to the PIC. After this stage, hardware and software will be combined
and test. If success, the system will be attached to the test object. The result will be
analysis to obtain the system effectiveness of working. Finally the thesis writing
process implemented.

23
3.2 Project Planning Flowchart
Figure 3.2:Flow Chart of Project Planning
START
SUNLIGHT COMPOSE SOLAR ENERGY AND GENERATE
ELECTRICITY TO THE SYSTEM
MICROCONTROLLER READ THE INPUT DATA FROM
TEMPEREATURE SENSOR
MICROCONTROLLER PROCESS THE DATA AND DECIDE DESIRE
OUTPUT DATA
DC MOTOR MOVE THE FAN TO BLOWS HOT AIR FROM INSIDE
OF THE CAR
LCD DISPLAY SHOWING THE TEMPERATURE, SOLAR
VOLTAGE, BATTERY VOLTAGE AND MOTOR STAGE
DO ANALYSIS, PLOTTING GRAPH AND COMPARING THE DATA
END

24
Figure 3.2above shows the flow of the project planning for this system. Since the
solar panel as the main part of this system, the sun must emit the light so this system
can be operated. This solar panel is connected directly to the voltage regulator to
obtain an output of 5 volts as require by the microcontroller PIC16F877A.This
system cannot be operating at night and during raining day. The battery charge was
used as a backup power supply in this project to ensure the project keep running in
circumstances where there is no sunlight. This project works in two systems which
are in the Manual mode and Automatic mode.
Manual mode is, when LM 35 temperature sensor detects the temperature
rise, it will send the data to the microcontroller. Microcontroller will process the data
and send digital signals to the ventilation motor circuit. The speed of motor has been
programmed by the microcontroller to function according to the stage-set
temperature levels in the program. There are five levels of motor speed which is the
first level is set to a temperature of 30°C, the second level temperature was set to
35°C, the third level temperature was set to 40°C, the fourth temperature set to 50°C
and the fifth temperature set to 60°C. Motor speed is controlled by using Pulse Width
Modulation (PWM). Then the Liquid Crystal Display will display the outputs of
temperature readings, the motor speed level, solar voltage and battery voltage. After
that, the data has been recorded for the purposes of analysis.
In automatic mode, it is set for a motion detector purpose. If there is any
movement, it will be detected by PIR sensor and data will be sent to the
microcontroller. Subsequently microcontroller will process the data and send the
digital signal to the ventilation motor circuit. This automatic mode, when motion is
detected by the PIR sensor, the ventilation motor that control by PWM will rotate
based on speed of the level 5 only. It has been programmed on the microcontroller
with the intention of giving more comfort and better ventilation in the car. This is an
automated system for the case where if there are children, pregnant women or animal
residue in the car. Besides that it also can be applied for purpose item or foods which
are sensitive to high temperatures when it is left in a car. Then LCD will displays
temperature readings, the motor speed level, solar voltage and battery voltage. After
that, the data are taken for the analysis.

67
REFERENCES
[1] Khan M.U, "Development of Ventilation Technique To Limit The Car Cabin
Temperature Under a Blazing Sun," Universitoy f Toyama, Jepun, 1999.
[2] Bjorn jenssen wachenfeldt, Mads Mysen, Peter G. Schild., "Air Flow Rate
and Energy saving potential in schools with Demand Controlled
Displacement Ventilation," , New York, United Stated Of Amarica, 2006, pp.
1073-1079.
[3] Maurizio, C. and Centro, R. F, ”Thermal Climate In Cab And Measurement
Problems”. (1999).
[4] Mohd Rasidi Md Radzi, "Automatic Ceiling Fan Using PIR Sensor,"
Universiti Tun Hussein Onn Malysia, Batu Pahat, 2009/2010.
[5] Simon Roberts, Solar Electricity : A Practical Guide to Designing and
Installing small Photovoltaic System, 1st ed. Prentice Hall International (UK)
Ltd, United Kindom: Printed in Great Britain at the Universiti Press,
Cambridge, 1991.
[6] John L. Alden And John M. KAne, Design Industrial Ventilation System.
New York, United States of America: Industrial Press, 1982.
[7] Frank P.Bleier, Fan Handbook : Selection, Application and Design. United
States of Amarica, 1998.
[8] S P Sukhatme, Solar Energy : Principle of Thermal Collection And Storage,
2nd ed. Mumbai, India, 1996.
[9] Ryan Mayfield, Photovoltaic Design & Installation For Dummies. Canada,
2010
[10] McKay, B. J. R. "Use Of Solar Photovoltaic Powered Fans To Reduce Peak
Temperatures In Outdoor Cabinets," Morristown, New Jersey: IEEE.
[11] Xiaoli Xu Q. L., Yunbo Zuo, "A Study on All-Weather Flexible Auto-
Tracking Control Strategy of High-Efficiency Solar Concentrating
Photovoltaic Power Generation System," in 2010 Second WRI Global
Congress on Intelligent Systems: 2010 IEEE, 2010.

68
[12] M. Amir Abas, M Hilmi Fadzil S, Et al, Control, "Improved Structure of
Solar Tracker with Microcontroller based Control," in 2010 Second
International Conference on Advances in Computing, Control, and
Telecommunication Technologies: 2010 IEEE, 2010.
[13] Ph.D.,Wahab Almuhtadi, P.h.D. Abdul Al-Azzawi, "Energy Saving by Using
Newly Designed Automated Solar," in 2009 IEEE Electrical Power &
Energy Conference, Ottawa, Ontario, Canada, 2009, pp. 1- 4.
[14] Bor-Jang Tsai, "Active building envelope system (ABE): Wind and solar-
driven ventilation, electricity and heat pump," in Energy and Sustainable
Development: Issues and Strategies (ESD), 2010 Proceedings of the
International Conference on, Hsinchu, Taiwan, 2-4 June 2010, pp. 1- 10.
[15] Nurhani Kasuan, Mohd Hezri Fazalul Rahiman, Mohd Nasir Taib. Nurul
Nadia Mohammad, "Steam Temperature Control Using Fuzzy Logic," in
Control and System Graduate Research Colloquium (ICSGRC), 2011 IEEE,
Univ. Teknol. MARA, Shah Alam, Malaysia, 2011, pp. 53 - 58.
[16] Tzu-Ming Wang, "Energy Saving of Air Condition using Fuzzy Control," in
Advanced Information Networking and Applications Workshops (WAINA),
2010 IEEE 24th International Conference on, TamKang Univ., Tamsui,
Taiwan, 2010, pp. 1005 - 1010,
[17] LM34/LM35 Precision Monolithic Temperature Sensors. [Online]. http://www.ti.com/general/docs/lit/getliterature.tsp?literatureNumber=snoa748b &fileType=pdf
[18] Ammar Hashim, Ariffuddin Joret Asmarashid Ponniran, "A Design Of Low
Power Single Axis Solar Traking System Regardless Off Motor Speed,"
International Journal of Integrated Engineering, vol. 3 No 2, pp. 5-9, 1
March 2011.
[19] H.P. Garg and J. Prakash (1997), “Solar Energy Fundamentals and
Application.”, 1st Edition, New Delhi, The McGraw-Hill Companies, Inc.
[20] D.H.W. Li, T.N.T Lam, V.W.C Chu. (2008). relationship between tha total
solar on titled surfaces and the sunshine hours in Hong Kong. 1221-1227.
[21] C.J Coffey, G.R Hunt. (2006). Ventilation effectiveness measures based on
heat removal. 2249-2262
[22] ASHRAE. (1993). Physiological Principles, Comfort and Health. Handbook
of Fundamentals, (ASHRAE, Atlanta).
[23] Laman Web: http:// www.solar4power.com: katalog komponen.
[24] Farnell Components (M) Sdn. Bhd. (2002). “The Farnell Catalogue.” Petaling
Jaya, Selangor Darul Ehsan: Katalog komponen
[25] A.Cengel, Y. (2006). Heat and Mass Transfer. New York: McGraw Hill.
[26] Gopal. (1998). Control System Principles And Design. Delhi India: Tata
McGraw-Hill.M.

69
[27] L.michalski, K. J. (2001). Temperature Measurement 2nd edition. London:
Wiley.
[28] D.McGee, T. (1988). Principles And Methods Of Temperature Measurement.
Canada: Wiley Interscience Publication.
[29] D.H.W. Li, T.N.T Lam, V.W.C Chu. (2008). relationship between tha total
solar on titled surfaces and the sunshine hours in Hong Kong. 1221-1227.
[30] C.J Coffey, G.R Hunt. (2006). Ventilation effectiveness measures based on
heat removal. 2249-2262