Embed Size (px)
Citation preview

Climate Change/Extreme Weather Vulnerability and Risk Assessment for
Transportation Infrastructure in Dallas and Tarrant Counties
Report
Prepared by the University of Texas at Arlington (UTA) for submittal to
North Central Texas Council of Governments (NCTCOG)
The Metropolitan Planning Organization (MPO)
for the Dallas-Fort Worth Metropolitan Region
In fulfillment of the partnership grant between NCTCOG and UTA as obligated by the
FHWA Climate Change/Extreme Weather Vulnerability Assessment Pilot Study.
Dr. Arne Winguth, Dr. Jun Hak Lee, Dr. Yekang Ko, UTA, and the North Central Texas
Vulnerability Assessment Team

Climate Change/Extreme Weather Vulnerability of Dallas/Tarrant County Infrastructure
___________________________________________________________________________
ii
Foreword
This document has been developed by the North Central Texas Council of
Governments (NCTCOG) and project partners in accordance with a grant from the
Federal Highway Administration (FHWA). It presents the results of a comprehensive
investigation of infrastructure vulnerability to extreme weather and climate change in the
Dallas-Fort Worth (DFW) Metropolitan Area. The existing and future infrastructure
assets within Dallas and Tarrant Counties, including road, rail, and aviation
transportation facilities, has been aggregated together with Federal Emergency
Management Agency (FEMA) flood maps. A vulnerability assessment matrix for the
local transportation network has been developed to quantify the likelihood of hazards
and the magnitude of adverse consequences.
Notice
This document is disseminated under the sponsorship of the U.S. Department of
Transportation in the interest of information exchange. The U.S. Government assumes
no liability for the use of the information contained in this document.
The U.S. Government does not endorse products or manufacturers. Trademarks or
manufacturers' names appear in this report only because they are considered essential
to the objective of the document.
Quality Assurance Statement
The Federal Highway Administration (FHWA) provides high-quality information to serve
government, industry, and the public in a manner that promotes public understanding.
Standards and policies are used to ensure and maximize the quality, objectivity, utility,
and integrity of its information. FHWA periodically reviews quality issues and adjusts its
programs and processes to ensure continuous quality improvement.

Climate Change/Extreme Weather Vulnerability of Dallas/Tarrant County Infrastructure
___________________________________________________________________________
iii
Americans with Disabilities Act (ADA) The University of Texas at Arlington is committed to the full and total inclusion of all
individuals and to the principle of individual empowerment. To this end, policies and
procedures must ensure that any person with a disability will not, on the basis of that
disability, be denied full and equal access or otherwise be subjected to discrimination
under programs or activities offered by the University. The University of Texas at
Arlington is also committed to the principle of Equal Employment Opportunity in the
employment of individuals with disabilities.
ADA Coordinator at UTA Eunice Currie - ADA Coordinator Assistant Vice President Human Resources Management and Development Phone: (817) 272-7091 E-mail: [email protected]
Equal Opportunity Policy
The University of Texas at Arlington complies with the Equal Pay Act of 1963, Titles VI
and VII of the Civil Rights Act of 1964, Executive Order 11246, the Age Discrimination in
Employment Act of 1967, Title IX of the Educational Amendments of 1972, Sections 503
and 504 of the Rehabilitation Act of 1973, the Americans with Disabilities Act, 1990, the
Vietnam Era Veterans Readjustment Act of 1974, the Texas Commission on Human
Rights Act and the Rules and Regulations of the Board of Regents of The University of
Texas System. It is the policy of The University of Texas at Arlington that to the extent
provided by these applicable laws no person shall, on the basis of race, color, national
origin, religion, age, sex, disabilities or veteran status, be denied employment or
admission, be excluded from participation in, be denied the benefits of or subject to
discrimination under, any program or activity that it sponsors or conducts. It is also the
University's policy to maintain an environment free from discrimination on the basis of
sexual orientation.
Inquiries concerning the application of this policy and complaints of discrimination
should be directed to the Office of Equal Opportunity and Affirmative Action, 710 S.
Davis Drive, Office and Classroom Building (OCB), Room 103, 817.272.2106. E-mail:
[email protected]. Web site: www.uta.edu/eoaa.
Title page photo courtesy: TRE, Trainweb, Dallas Morning News, Michael Fitzgerald, Texas Forest Service
Climate Change/Extreme Weather Vulnerability of Dallas/Tarrant County Infrastructure
___________________________________________________________________________
iv
What is NCTCOG?
The North Central Texas Council of Governments (NCTCOG) is a voluntary association
of cities, counties, school districts, and special districts which was established in
January 1966 to assist local governments in planning for common needs, cooperating
for mutual benefit, and coordinating for sound regional development.
It serves a 16-county metropolitan region centered around the two urban centers of
Dallas and Fort Worth. Currently the Council has 242 members, including 16 counties,
169 cities, 22 independent school districts, and 31 special districts. The area of the
region is approximately 12,800 square miles, which is larger than nine states, and the
population of the region is over 6.5 million, which is larger than 38 states.
NCTCOG’s structure is relatively simple; each member government appoints a voting
representative from the governing body. These voting representatives make the
General Assembly which annually elects a 15-member Executive Board. The Executive
Board is supported by policy development, technical advisory, and study committees, as
well as a professional staff of 311 persons.
NCTCOG’s offices are located in Arlington in the Centerpoint Two Building at 616 Six
Flags Drive (approximately one-half mile south of the main entrance to Six Flags Over
Texas).
P. O. Box 5888
Arlington, Texas 76005-5888 (817) 640-3300
NCTCOG’s Department of Transportation
Since 1974, NCTCOG has served as the Metropolitan Planning Organization (MPO) for
transportation for the Dallas-Fort Worth area. NCTCOG’s Department of Transportation
is responsible for the regional planning process for all modes of transportation. The
department provides technical support and staff assistance to the Regional
Transportation Council and its technical committees, which compose the MPO policy-
making structure. In addition, the department provides technical assistance to the local
governments of North Central Texas in planning, coordinating, and implementing
transportation decisions.

Climate Change/Extreme Weather Vulnerability of Dallas/Tarrant County Infrastructure
___________________________________________________________________________
v
EXECUTIVE SUMMARY
This report is an initial assessment of the vulnerability of North Central Texas (NCT)
transportation infrastructure as part of the FHWA Climate Change/Extreme Weather
Vulnerability Assessment Pilot Study. It summarizes the results from a sequence of
meetings organized by the North Central Texas Council of Governments (NCTCOG),
attended by local experts, and supported by several local government agency
stakeholders to create a qualitative assessment of extreme weather and climate change
impacts on infrastructure assets with a focus on Dallas and Tarrant Counties (which
includes the primary cities of Dallas and Fort Worth).
The three major elements of the climate impact vulnerability assessment are the
following:
1. A compilation of historical climate data and projected future climate information for
the Dallas-Fort Worth (DFW) Metropolitan Area.
The UTA climate group (A. Winguth) gathered climate and weather data from
1900 to 2010 to interpret the historic trends in extremes and variability of
temperature and precipitation suggesting an increase in temperature, particularly
in the summer season, and an increase in rainfall and rainfall intensity, primarily
during the spring season.
Historic weather-related disruption of transportation is mainly related to extreme
events like snow and ice storms as well as damages by severe supercell-type
thunderstorms.
Future climate prediction suggests extreme temperatures of up to 125 °F by the
end of 21st century, exceeding historic heat waves by 12 °F.
By 2050, soil moisture is reduced by 10-15% in all seasons compared to historic
values due to increase in temperatures. This suggests a higher risk of
infrastructure damage by cracking and, together with elevated temperatures, a
higher-than-present risk of fires, particularly in wooded neighborhoods.
Higher likelihood of drought will also amplify the urban heat island, particularly
during summer months, that can result in up to 10 °F temperature difference
between downtown Dallas and adjacent rural locations.
An increase in mean rainfall by up to 10% and severe thunderstorms by up to
40% in the spring season will likely lead to a higher risk of flooding affecting the
infrastructure.
Extreme flooding events exceeding historic floods are expected as a result of
more tropical storm systems occurring in the fall season.
2. The NCT criticality assessment team developed an asset inventory of existing and
future transportation infrastructure in Dallas and Tarrant Counties including roads,
passenger rail, and aviation facilities.

Climate Change/Extreme Weather Vulnerability of Dallas/Tarrant County Infrastructure
___________________________________________________________________________
vi
A comprehensive geographic information system (GIS) data inventory was
compiled linking together Federal Emergency Management Agency (FEMA) flood
maps, temperature maps produced by the UTA climate group, and location maps
for current/future transportation assets.
Projection of infrastructure expansion based on the NCTCOG long-range
transportation plan (Mobility 2035: The Metropolitan Transportation Plan for
North Central Texas – 2013 Amendment) was identified.
Criticality of the current and future transportation infrastructure was determined
based on the average annual daily traffic (AADT) and passenger rail ridership
data.
3. The vulnerability of transportation infrastructure in Dallas and Tarrant Counties to
risks from extreme weather and climate change was evaluated.
Transportation infrastructure assets located within the FEMA 100-year floodplain
were identified.
A risk assessment matrix for transportation infrastructure was developed as a
function of the criticality of the assets and high likelihood of extreme weather
impacts (flooding and high temperatures).
Assessing future weather-related infrastructure disruption is important for developing
adaptation strategies and prioritizing transportation planning efforts. The results of this
Study provide ground evidence for developing adaptation strategies that ensure safe,
effective, and efficient access and mobility into the future while also considering
economic, social, and environmental needs. These goals are also part of the Texas
Department of Transportation’s (TxDOT’s) strategic plan, as well as those of other
transportation providers and local governments. Future work is required for a more
accurate and comprehensive assessment of the potential vulnerability of all North
Central Texas transportation assets. Such expanded efforts could be accomplished
through greater incorporation of more precise forecasts of extreme precipitation and
temperature (e.g. Collaborative Adaptive Sensing of Atmosphere or CASA Project),
accommodation of spatially explicate analysis using three-dimensional models (e.g.
Light Detention and Ranging or LiDAR) to determine runoff risks, increased
monitoring/tracking of weather-related stresses and associated damage to
infrastructure, and enhanced testing and application of various engineering methods
and construction materials designed to improve resiliency.

Climate Change/Extreme Weather Vulnerability of Dallas/Tarrant County Infrastructure
___________________________________________________________________________
vii
List of Acronyms, Abbreviation, and Resources
CASA Collaborative Adaptive Sensing of Atmosphere
CESM Community Earth System Model
CIKR Critical Infrastructure and Key Resources
CMIP Coupled Model Intercomparison Project
DART Dallas Area Rapid Transit
DFW Dallas Forth Worth Metropolitan Area
DFWIA Dallas-Fort Worth International Airport
DOT Department of Transportation
EPA Environmental Protection Agency
FWTA Fort Worth Transportation Authority
FHWA Federal Highway Administration
GIS Graphical Information System
LiDAR Light Detection and Ranging
IPCC Intergovernmental Panel on Climate Change
MODIS Moderate Resolution Imaging Spectroradiometer
NWS National Weather Service
NOAA National Oceanic and Atmospheric Administration
NCAR National Center for Atmospheric Research
NCTCOG North Central Texas Council of Governments
SST Sea Surface Temperature
RCP Representative Concentration Pathways
TRE Trinity Railway Express
TxDOT Texas Department of Transportation
UHI Urban Heat Island
UTA University of Texas at Arlington
WMO World Meteorological Organization

Climate Change/Extreme Weather Vulnerability of Dallas/Tarrant County Infrastructure
___________________________________________________________________________
viii
NCT Vulnerability Assessment Team
Name Expertise Affiliation
Natalie Bettger Senior Program Manager,
Congestion Management and
Innovative Project Delivery Program
Area
North Central Texas
Council of Governments,
Department of
Transportation
John C. Brunk Assistant Director, Transportation
Planning
City of Dallas, Public Works
Dept.
Jory Dille Senior Transportation Planner,
Congestion Management and
Innovative Project Delivery Program
Area
North Central Texas
Council of Governments,
Department of
Transportation
Curvie Hawkins Assistant Vice President, Planning Fort Worth Transportation
Authority
Yekang Ko Assistant Professor in City and
Regional Planning
School of Urban and Public
Affairs, University of Texas
at Arlington
Jun Hak Lee Adjunct Research Professor, GIS
and Remote Sensing Specialist
Dept. Earth and
Environmental Sci.,
University of Texas at
Arlington
Jeffrey Neal Program Manager, Congestion
Management and Innovative Project
Delivery Program Area
North Central Texas
Council of Governments,
Department of
Transportation
Sandip Sen Transit Planning Fort Worth Transportation
Authority
Arne Winguth Associate Professor in Climate
Dynamics and Oceanography
Dept. Earth and
Environmental Sci.,
University of Texas at
Arlington

Climate Change/Extreme Weather Vulnerability of Dallas/Tarrant County Infrastructure
___________________________________________________________________________
ix
Table of Contents
Foreword ..........................................................................................................................ii
Notice ...............................................................................................................................ii
Equal Opportunity Policy ................................................................................................. iii
What is NCTCOG? ..........................................................................................................iv
EXECUTIVE SUMMARY ................................................................................................. v
NCT Vulnerability Assessment Team ............................................................................ viii
List of Tables ...................................................................................................................xi
List of Figures ..................................................................................................................xi
Metric Conversions........................................................................................................ xiii
1. INTRODUCTION ......................................................................................................... 1
2. HISTORICAL AND PROJECTED CLIMATE AND EXTREMES IN WEATHER OF
NORTH-CENTRAL TEXAS ............................................................................................. 3
2.1. Historical Climate and Extremes in Weather .................................................................... 3
2.2 Urban Heat Island of Dallas-Fort Worth ............................................................................ 7
2.3. Projected Climatic Changes and Extremes in Weather ................................................... 9
3. EXISTING AND PROJECTED INFRASTRUCTURE OF DALLAS AND TARRANT
COUNTIES .................................................................................................................... 15
3.1. Introduction ....................................................................................................................15
3.2. Asset Inventory and Data Collection ...............................................................................15
3.3. Criticality Assessment ....................................................................................................19
Roadways .........................................................................................................................19
Passenger Rail ..................................................................................................................21
Airports .................................................................................................................................23
4. VULNERABILITY OF DALLAS AND TARRANT COUNTY TRANSPORTATION
INFRASTRUCTURE TO EXTREME WEATHER AND CLIMATE CHANGE ................. 24
4.1. Introduction ....................................................................................................................24
4.2. Critical Infrastructure in the 100-Year Floodplain ............................................................25
Roadways .........................................................................................................................25
Railroads ...........................................................................................................................27
Airports ..............................................................................................................................28
4.3. Critical Infrastructure Vulnerable to Heat Risks ..............................................................29
Risk assessment matrix for extreme heat ..........................................................................30
Roadways .........................................................................................................................30
Railroads ...........................................................................................................................32
Airports ..............................................................................................................................34

Climate Change/Extreme Weather Vulnerability of Dallas/Tarrant County Infrastructure
___________________________________________________________________________
x
5. CONCLUSIONS ........................................................................................................ 37
6. REFERENCES .......................................................................................................... 39
APPENDIX A ................................................................................................................. 43
A.1. Street Maintenance Plan and Pavement Deterioration from the City Of Dallas ..............43
A.2. References ....................................................................................................................49
APPENDIX B. ................................................................................................................ 50
B.1. Dallas Area Rapid Transit (DART) Severe Weather Action Plan ....................................50
B.2. References ....................................................................................................................53

Climate Change/Extreme Weather Vulnerability of Dallas/Tarrant County Infrastructure
___________________________________________________________________________
xi
List of Tables
Table 3.1. Projected growth of the DFW region from 2013 to 2035 .............................. 15
Table 3.2. Asset inventory and data collection .............................................................. 16
Table 4.1. Airports vulnerable to severe flooding in Tarrant and Dallas Counties (Year:
2035) ...................................................................................................................... 29
Table 4.2. Critical airports vulnerable to heat risk in Tarrant and Dallas Counties ........ 35
List of Figures
Figure 1.1. The climate change risk assessment methodology for DFW infrastructure .. 2
Figure 2.1. Monthly mean temperature (a) and precipitation (b) ..................................... 3
Figure 2.2. Dallas/Fort Worth annual consecutive 100° F days ....................................... 4
Figure 2.3. Annual average surface temperature (a) and rainfall (b) anomalies .............. 5
Figure 2.4. Severe 2011 drought in Texas ...................................................................... 5
Figure 2.5. Annual total precipitation and rain-related crashes (a) and annual snow
accumulation and snow-related crashes (b) ............................................................. 6
Figure 2.6. Annual cumulative snowfall (a) and service disruption (b) ............................ 7
Figure 2.7. Surface pressure and annual number of tornado watches ............................ 7
Figure 2.8. Urban heat island of DFW in 2011 ................................................................ 8
Figure 2.9. Projected summer surface air temperature until 2100 ................................... 9
Figure 2.10. August mean and maximum temperature for Dallas and Tarrant Counties
............................................................................................................................... 10
Figure 2.11. Projected change of soil moisture until 2050 ............................................. 11
Figure 2.12. Projected change of rainfall until 2050 ...................................................... 12
Figure 2.13. Change severe thunderstorm environments ............................................. 13
Figure 2.14. Correlation between the Palmer Drought Severity Index (PDSI) and the
maximum urban heat island (UHI) .......................................................................... 14
Figure 3.1. Current roadway networks of Dallas and Tarrant Counties (2014) ............. 17
Figure 3.2. Current (2008) rail networks of Dallas and Tarrant Counties ...................... 17
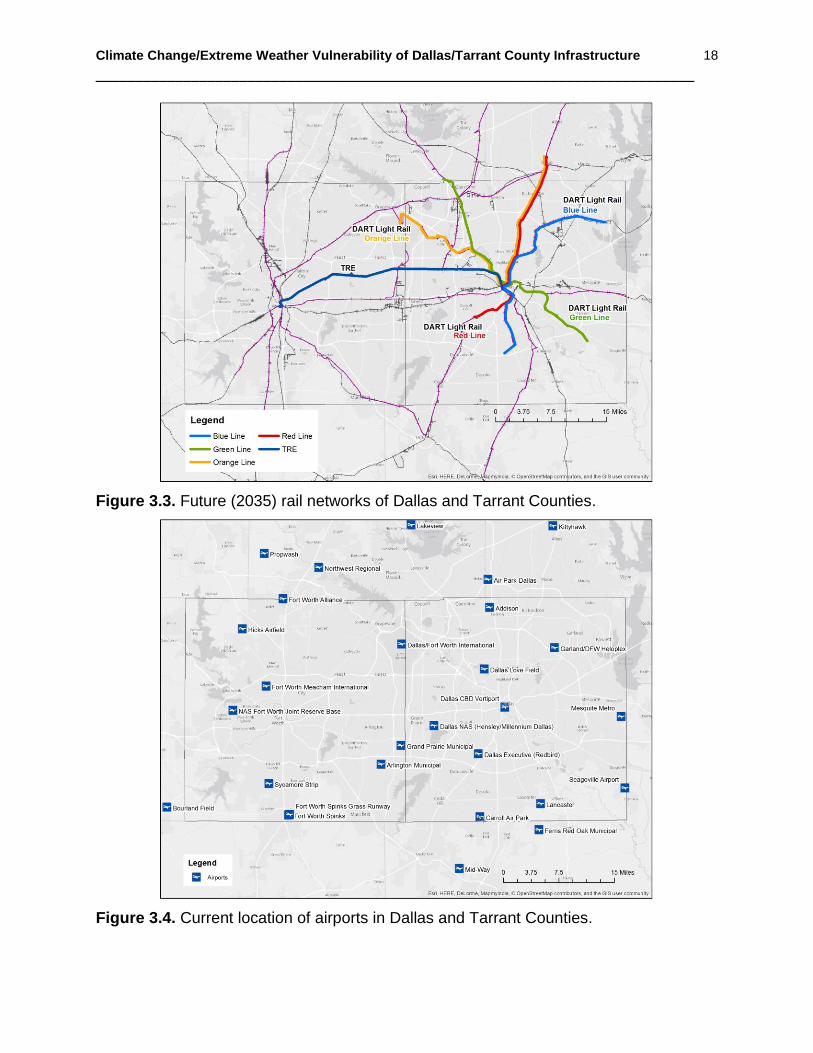
Figure 3.3. Future (2035) rail networks of Dallas and Tarrant Counties ........................ 18
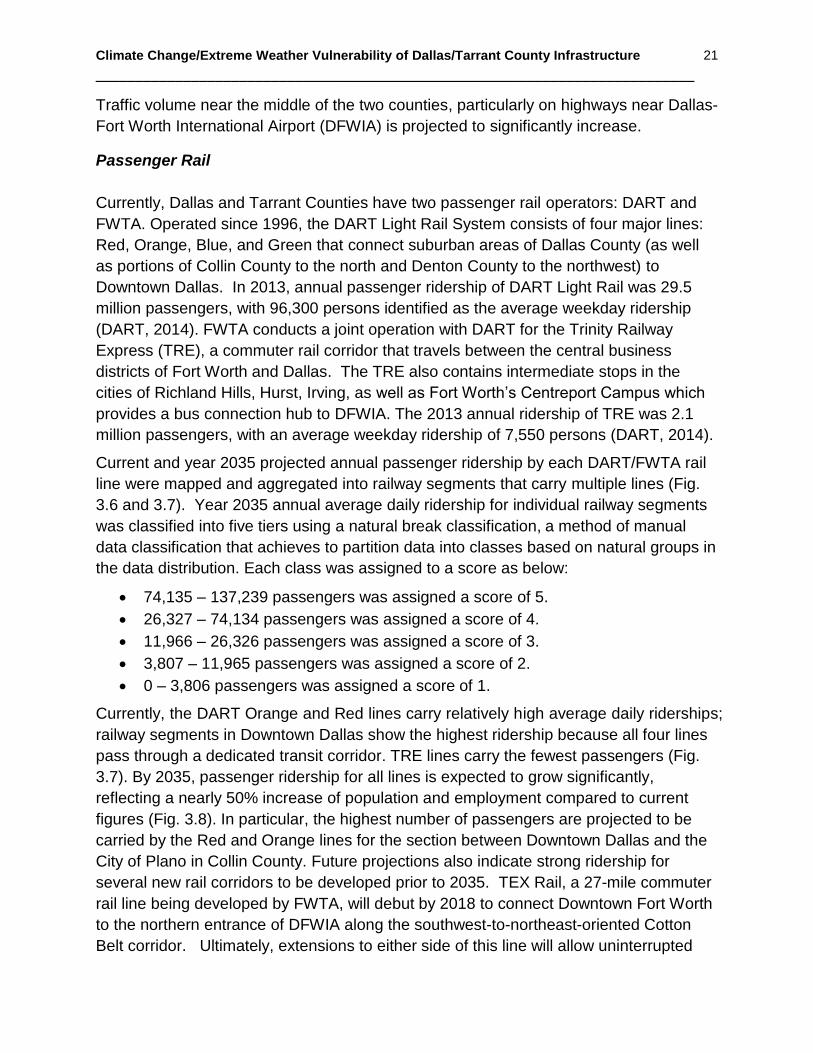
Figure 3.4. Current airports in Dallas and Tarrant Counties .......................................... 18

Climate Change/Extreme Weather Vulnerability of Dallas/Tarrant County Infrastructure
___________________________________________________________________________
xii
Figure 3.5. Current roadways traffic volume in Dallas and Tarrant Counties based on
AADT and normalized by number of lanes ............................................................. 20
Figure 3.6. 2035 roadways traffic volume in Dallas and Tarrant Counties based on
AADT and normalized by number of lanes ............................................................. 20
Figure 3.7. Current annual ridership of passenger rails ................................................. 22
Figure 3.8. Annual ridership of passenger rails in 2035 ................................................ 22
Figure 3.9. Current (2013) passenger boarding of major airports ................................. 23
Figure 4.1. Critical roadways in the 100-year floodplain: (a) Tarrant County (b) Dallas
County (Year: 2035) ............................................................................................... 26
Figure 4.2. Length of road segments (miles) in Dallas and Tarrant Counties within the
100-year floodplain ................................................................................................. 27
Figure 4.3. Railways within the 100-year floodplain in Tarrant and Dallas Counties
(Year: 2035) ........................................................................................................... 28
Figure 4.4. Risk assessment matrix .............................................................................. 30
Figure 4.5. Critical roadways vulnerable to heat risks in Tarrant and Dallas Counties for
the period 2041-2050 ............................................................................................ 31
Figure 4.6. Critical roadways vulnerable to heat risks in Tarrant and Dallas Counties for
the period 2091-2100 ............................................................................................. 32
Figure 4.7. Critical railways vulnerable to heat risk in Tarrant and Dallas Counties for the
period 2041-2050 ................................................................................................... 33
Figure 4.8. Critical railways vulnerable to heat risk in Tarrant and Dallas Counties for the
period 2091-2000 ................................................................................................... 33
Figure 4.9. The length of railways at heat risk in Tarrant and Dallas Counties .............. 34
Figure 4.10. Critical airports vulnerable to heat risk in Tarrant and Dallas Counties ..... 35
Figure A.1. Trends and projections of the City of Dallas street condition ...................... 45
Figure A.2. Comparison of street deterioration for concrete and asphalt streets between
the City of Dallas and national surveys .................................................................. 46
Figure A.3. Soil plasticity map for Tarrant and Dallas Counties .................................... 48
Figure B.1. Total accumulations of sleet and freezing rain during the winter storm of
December 5-6 in 2013 ............................................................................................ 51
Figure B.2. Map of DART light-rail network operating under Operating Scenario One
conditions ............................................................................................................... 52
Climate Change/Extreme Weather Vulnerability of Dallas/Tarrant County Infrastructure
___________________________________________________________________________
xiii
Metric Conversions
Temperature 1°C = 274.15 K -273.15 1°C = (33.8°F -32)*5/9 Precipitation 1 mm = 0.03937 in Length 1 km = 0.62137 miles Pressure 1000 hPa = 29.5334 in Mercury

Climate Change/Extreme Weather Vulnerability of Dallas/Tarrant County Infrastructure
___________________________________________________________________________
1
1. INTRODUCTION
This Study has been developed in collaboration between the University of Texas at
Arlington (UTA) and the North Central Texas Council of Government (NCTCOG) in
partnership with the Public Works Department of the City of Dallas and the Fort Worth
Transportation Authority (FWTA), to assess how future extremes in weather events
through the end of the 21st century can affect the transportation infrastructure in Dallas
and Tarrant Counties. This assessment (Fig. 1.1) will not only allow transportation
planners to adapt future infrastructure demands and improvement needs to changes in
extreme weather, but hereby will also enhance and protect taxpayer investments.
Extreme weather events have frequently disrupted mobility and levels of services on
highway and rail networks in the Dallas-Fort Worth (DFW) Metropolitan Area, and
current climate projections suggest that such disruptions may occur more often in the
future. Extreme precipitation events and vulnerable infrastructure create transportation
delays, particularly in locations of high traffic volume, and they also can endanger public
safety across the region.
Past extreme weather events like severe thunderstorms, flooding, or ice have severely
impacted the transportation infrastructure of the DFW area. Examples in the recent past
include the Fort Worth tornado of March 28, 2000; the tornado outbreak of April 3, 2012;
the heavy precipitation event of September 7 - 8, 2010; the heavy ice and snowfall
event of February 11 - 12, 2010; the Groundhog Day Blizzard of January 31 to February
2, 2011; and the ice storms of November 22-24, 2013 and December 5-7, 2013.
NCTCOG, the region’s Metropolitan Planning Organization (MPO), has been awarded
funding by the Federal Highway Administration (FHWA) to conduct a Type I:
Vulnerability Assessment Pilot in order to analyze the vulnerability of transportation
infrastructure to climate change effects and extreme weather events in the North
Central Texas (NCT) region.
In this technical study the three major tasks listed below have been addressed:
Task 1. A compilation of historical climate data and projected future climate
information for the Dallas-Fort Worth Metropolitan area has been provided,
including surface air temperature, precipitation, evaporation, and soil
moisture/water content, in order to assess the impact of climate change.
Task 2. The existing infrastructure of the DFW area including road and rail has
been aggregated together with flood maps. The importance of infrastructure
assets has been ranked for the Dallas and Tarrant Counties using
normalized traffic density maps from the Federal Highway Administration,
flood plains, and other regional sources. The future expansion of the
transportation infrastructure is based on the NCTCOG’s Long Range

Climate Change/Extreme Weather Vulnerability of Dallas/Tarrant County Infrastructure
___________________________________________________________________________
2
Transportation Plan, Mobility 2035: The Metropolitan Transportation Plan for
North Central Texas - 2013 Amendment.
Task 3. The vulnerability of Dallas and Tarrant Counties’ transportation
infrastructure to extreme weather and climate change has been evaluated. A
vulnerability assessment matrix for transportation has been used to estimate
the likelihood of hazards and the magnitude of adverse consequences. The
criticality of transportation assets is categorized into low, medium, and high
vulnerability for future heat waves; low and high risk of fires; and low,
medium, and high vulnerability for future floods.
Figure 1.1. The climate change risk assessment methodology for DFW area infrastructure

Climate Change/Extreme Weather Vulnerability of Dallas/Tarrant County Infrastructure
___________________________________________________________________________
3
2. HISTORICAL AND PROJECTED CLIMATE AND EXTREMES IN WEATHER OF
NORTH-CENTRAL TEXAS
2.1. Historical Climate and Extremes in Weather
The climate of North Central Texas is classified as humid subtropical, with 8 months
above 68 °F (20 °C) and dry winters (Fig. 2.1; Köppen-Geiger classification Cfa;
Köppen, 1936; Peel et al., 2007). Summer temperatures are generally high with daytime
extremes of up to 113 °F (Fig. 2.1a). The longest heat wave on record for North Central
Texas occurred during the summer season of 2011, with 71 consecutive days
exceeding 100°F or 37.8 °C (Fig. 2.2). The precipitation gradient of North Central Texas
is remarkable, with a difference of about 12 in (304 mm) year-1 between Palo Pinto
County in the west and Rockwall County in the east (Nielsen-Gammon, 2011). The
largest portion of the annual precipitation results from thunderstorm activity, which
occurs most frequently in the spring (Fig. 2.1b), and is characterized by occasional
heavy rainfall over brief periods of time.
The annual temperature anomaly of North Central Texas with respect to the 1900-2011
average, shown in Fig. 2.3, reflects the long-term warming trend of 0.09 F/decade. The
overall warming amounts to 1.04 F over this period, with the strongest increase of 0.25
F from 2001 to 2011. The seasonal trends are particularly strong during the last
Figure 2.1. Monthly mean temperature (a) and precipitation (b) for Dallas-Fort Worth averaged from 1980 to 2010 (Source: National Weather Service, Fort Worth, 2012). Annual mean temperature is 65.4 °F (18.8°C) and annual precipitation is 33.1 in (839.91 mm) year-1 averaged over the period 1900 to 2010.

Climate Change/Extreme Weather Vulnerability of Dallas/Tarrant County Infrastructure
___________________________________________________________________________
4
decade, with an increase in temperature of 0.61 F during summer months and 0.11 F
during winter months over this time period (Fig. 2.3 a).
Precipitation anomalies relative to the period between 1900 and 2010 (Fig. 2.3b)
indicate higher amounts of rainfall the decade of the 1990’s. Severe droughts of the
early 1950’s and in 2006 are represented in this graph by anomalously low rainfall. The
long-term precipitation trend for the DFW area indicates an increase in rainfall of 4.8 in
(or 15 %) over the period from 1900 to 2010. This increase occurred particularly during
winter months, whereas summer season precipitation slightly declined. Increases in
rainfall and snowfall is highly correlated with an increase in regional crash rates (Fig 2.5
a).
Several studies have supported the hypothesis that droughts over the Great Plains are
linked to cold sea surface temperature (SST) anomalies linked to La Niña in the tropical
Pacific (Trenberth et al., 1988; Trenberth and Branstator, 1992; Palmer and Brankovic,
1989; Ortegren, 2008; Seager et al., 2009). The 2010-2011 drought in Texas (Fig. 2.4)
was likely amplified by strong La Niña conditions, together with a positive phase of the
Atlantic Multidecadal Oscillation (McCabe et al., 2004; Mo et al., 2009; Nielsen-
Gammon, 2012). Low rural soil moisture during the previous winter, also noted as a
factor during the 2003 heat wave in Paris (Cassou et al., 2005; Dousset et al., 2007),
may have enhanced the drought in North Central Texas (Hong and Kalnay, 2002).
Anthropogenic land use changes could have further intensified the drought conditions
(Cook et al., 2009). Historical trends (Fig. 2.2) suggest that droughts associated with
prolonged heat waves have been more frequent in the last two decades. The risk of
Figure 2.2. Dallas-Fort Worth annual consecutive 100° F days (NWS Dallas-Fort Worth).
71 69
56 52 48 46 44 43 40 38 36
0
10
20
30
40
50
60
70
80
2011 1980 1998 1954 1956 2000 1952 2006 1951 1963 1978

Climate Change/Extreme Weather Vulnerability of Dallas/Tarrant County Infrastructure
___________________________________________________________________________
5
wildfires is significantly higher under drought conditions (Texas AM Forest Service,
2015a).
Figure 2.3. Annual average surface temperature (a) and rainfall (b) anomalies as compared to the average between 1900 and 2010, in °C from NWS COOP station 412242 (Dallas-Fort Worth International Airport).
Figure 2.4. Severe 2011 drought in Texas as inferred from the U.S. Drought Monitor Texas (http://droughtmonitor.unl.edu).
Climate Change/Extreme Weather Vulnerability of Dallas/Tarrant County Infrastructure
___________________________________________________________________________
6
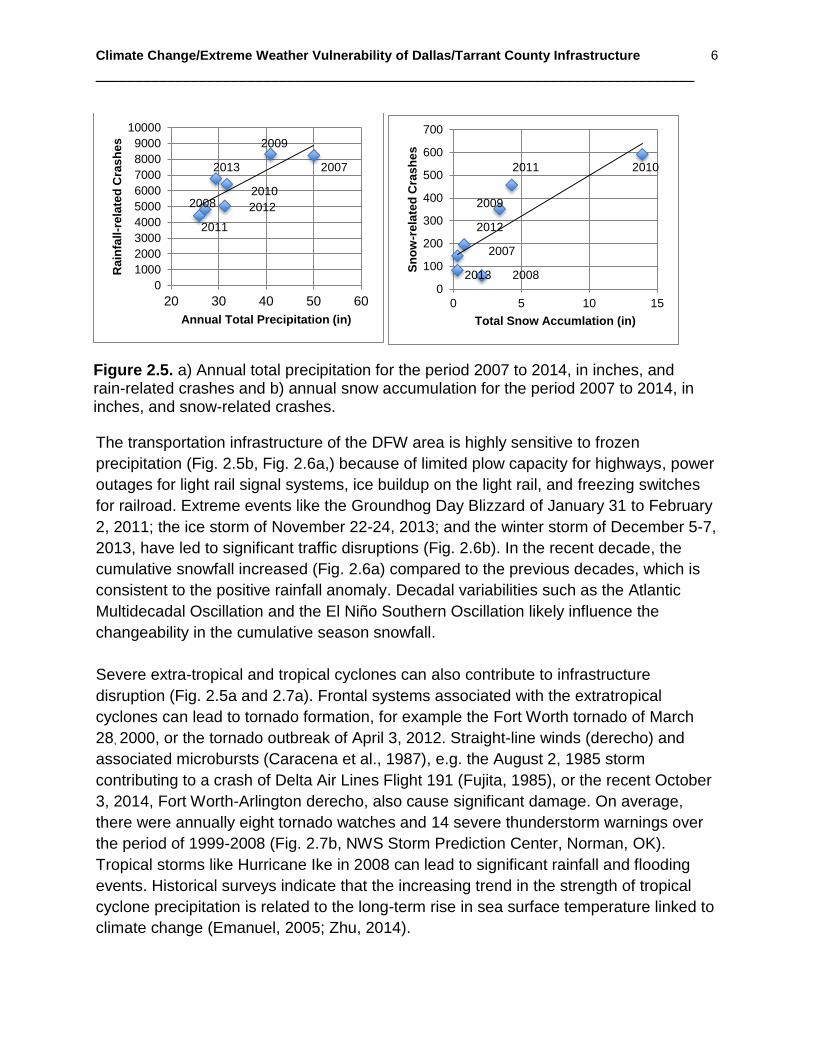
The transportation infrastructure of the DFW area is highly sensitive to frozen
precipitation (Fig. 2.5b, Fig. 2.6a,) because of limited plow capacity for highways, power
outages for light rail signal systems, ice buildup on the light rail, and freezing switches
for railroad. Extreme events like the Groundhog Day Blizzard of January 31 to February
2, 2011; the ice storm of November 22-24, 2013; and the winter storm of December 5-7,
2013, have led to significant traffic disruptions (Fig. 2.6b). In the recent decade, the
cumulative snowfall increased (Fig. 2.6a) compared to the previous decades, which is
consistent to the positive rainfall anomaly. Decadal variabilities such as the Atlantic
Multidecadal Oscillation and the El Niño Southern Oscillation likely influence the
changeability in the cumulative season snowfall.
Severe extra-tropical and tropical cyclones can also contribute to infrastructure
disruption (Fig. 2.5a and 2.7a). Frontal systems associated with the extratropical
cyclones can lead to tornado formation, for example the Fort Worth tornado of March
28, 2000, or the tornado outbreak of April 3, 2012. Straight-line winds (derecho) and
associated microbursts (Caracena et al., 1987), e.g. the August 2, 1985 storm
contributing to a crash of Delta Air Lines Flight 191 (Fujita, 1985), or the recent October
3, 2014, Fort Worth-Arlington derecho, also cause significant damage. On average,
there were annually eight tornado watches and 14 severe thunderstorm warnings over
the period of 1999-2008 (Fig. 2.7b, NWS Storm Prediction Center, Norman, OK).
Tropical storms like Hurricane Ike in 2008 can lead to significant rainfall and flooding
events. Historical surveys indicate that the increasing trend in the strength of tropical
cyclone precipitation is related to the long-term rise in sea surface temperature linked to
climate change (Emanuel, 2005; Zhu, 2014).
Figure 2.5. a) Annual total precipitation for the period 2007 to 2014, in inches, and rain-related crashes and b) annual snow accumulation for the period 2007 to 2014, in inches, and snow-related crashes.
0
1000
2000
3000
4000
5000
6000
7000
8000
9000
10000
20 30 40 50 60
Ra
infa
ll-r
ela
ted
Cra
sh
es
Annual Total Precipitation (in)
0
100
200
300
400
500
600
700
0 5 10 15
Sn
ow
-re
late
d C
ras
he
s
Total Snow Accumlation (in)
2010 2011
2009
2012
2007
2008 2013
2007
2009
2013
2010
2012
2011
2008

Climate Change/Extreme Weather Vulnerability of Dallas/Tarrant County Infrastructure
___________________________________________________________________________
7
2.2 Urban Heat Island of Dallas-Fort Worth
Urban areas are generally warmer than rural locations (Howard, 1833), a phenomenon
known as the urban heat island (UHI) effect (Oke, 1973). The UHI is commonly
estimated by the difference in temperature measurements between weather stations in
urbanized areas and rural areas. In this context, rural areas are defined as landscapes
that are predominantly natural and not covered with buildings, parking areas, roads, or
other man-made urban surfaces (Stewart, 2011). The hourly surface temperature
a) b)
Figure 2.7. a) Surface pressure of significant storm systems (in hPa) passing the Dallas-Fort Worth area and b) average annual number of tornado watches over the period 1999-2008. Note that the Dallas-Fort Worth Metropolitan area has about 8 tornado watches per year.
960.0
965.0
970.0
975.0
980.0
985.0
990.0
995.0
1000.0
20
10
20
06
19
96
19
84
19
74
19
73
19
71
19
61
19
60
19
53
19
26
19
15
Pressure (hPa)
a) b)
Figure 2.6. a) Annual cumulative snowfall for the period 2003 to 2014, in inches and b) service disruption in minutes of the commuter railway TRE. Note that no service data are available for 2010.
0
2
4
6
8
10
12
14
16
20
03
20
04
20
05
20
06
20
07
20
08
20
09
20
10
20
11
20
12
20
13
20
14
Annual Cumulative Snowfall (in)
1201229
215
1093
139342
0
2114
736
475
65
0
500
1000
1500
2000
2500
20
03
20
04
20
05
20
06
20
07
20
08
20
09
20
10
20
11
20
12
20
13
20
14
Annual Total Delays (min)

Climate Change/Extreme Weather Vulnerability of Dallas/Tarrant County Infrastructure
___________________________________________________________________________
8
differences between DFW area urban and rural sites have been used to calculate the
urban heat island from 2001 to 2011 (Winguth and Kelp, 2013). The UHI effect peaked
after sunset, and was particularly strong during the drought and heat wave in July 2011,
reaching a single-day instantaneous maximum value of 9.7 F° (5.4°C) and a monthly
mean maximum of 6.1°F (3.4°C), compared to the 2001 to 2011 July average of 4.3 F°
(2.4°C) (Fig. 2.8). The ground-based assessment of canopy air temperature at
screening level has been supported by a remote-sensed surface estimate from the
MODIS/Terra satellite, highlighting a dual-peak maximum heat island in the major city
centers of Dallas and Fort Worth. Both ground-based and remote-sensed spatial
analyses of the maximum heat island indicate a northwest shift, the result of southeast
winds in July 2011 of ~4.5 mph (2 m s-1) on average (Fig. 2.8). There was an overall
positive trend in the UHI of 0.2 °F/decade in the DFW area from 2001-2011, due to
rapid urbanization. Superimposed on this trend are significant inter-annual and decadal
variations that influence the urban climate.
Figure 2.8. Maps of the average air temperatures (°C) at screen level at (a) 21:00, reported by TCEQ stations listed in Table II in Winguth et al. (2013). Wind barbs are in knots. Each short barb represents 5 knots and each long barb 10 knots. Contour lines show the magnitude of the urban heat island relative to the Kaufman station (CAMS 71). Contour line interval is 0.5°C. b) Daily maximum urban heat island in July 2011.
Climate Change/Extreme Weather Vulnerability of Dallas/Tarrant County Infrastructure
___________________________________________________________________________
9
2.3. Projected Climatic Changes and Extremes in Weather
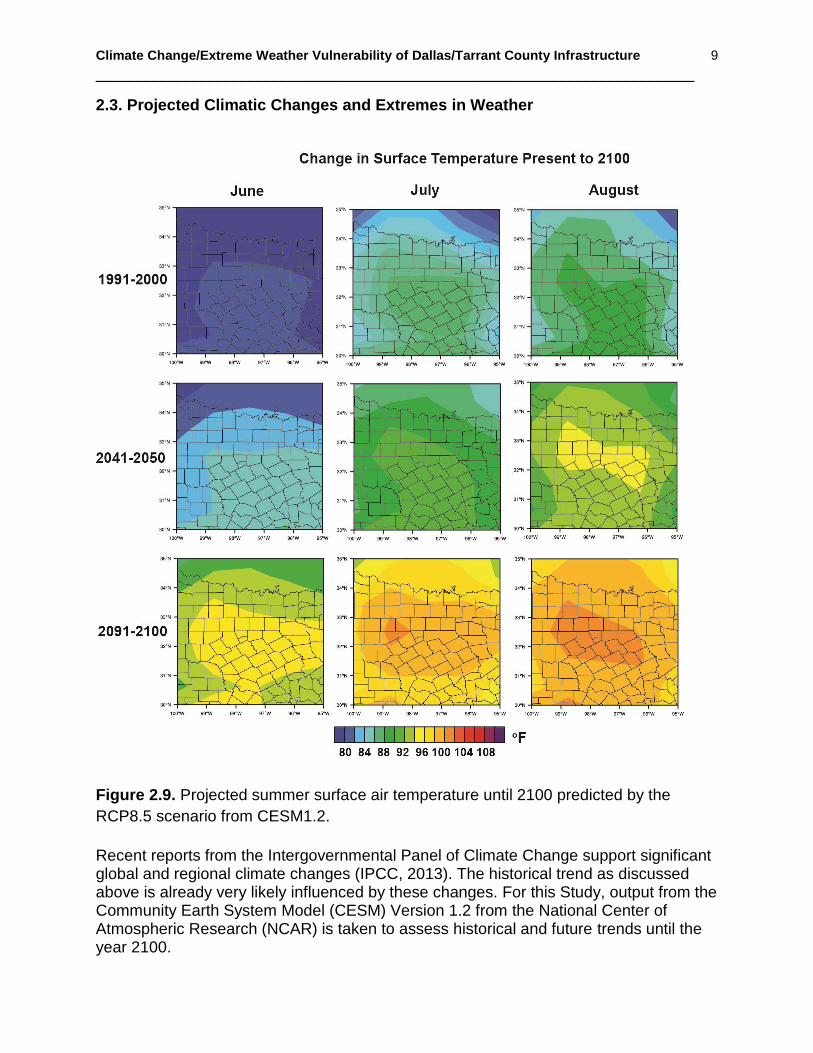
Figure 2.9. Projected summer surface air temperature until 2100 predicted by the
RCP8.5 scenario from CESM1.2.
Recent reports from the Intergovernmental Panel of Climate Change support significant global and regional climate changes (IPCC, 2013). The historical trend as discussed above is already very likely influenced by these changes. For this Study, output from the Community Earth System Model (CESM) Version 1.2 from the National Center of Atmospheric Research (NCAR) is taken to assess historical and future trends until the year 2100.

Climate Change/Extreme Weather Vulnerability of Dallas/Tarrant County Infrastructure
___________________________________________________________________________
10
The future climate scenario used is the RCP8.5 scenario, a “business as usual”
scenario with the assumption that the anthropogenic radiative forcing will be 8.5 W m-2
by the year 2100. Radiative forcing is used to compare and assess anthropogenic and
natural drivers of climate change such as solar variability, greenhouse gas
concentrations, and atmospheric dust composition. The predicted changes of surface
air temperature for North Central Texas under this scenario are significant with an 8.1
F (4.5 C) increase in summer temperature by the period 2091-2100 relative to the
recent historical period of 1986 – 2005 (Fig. 2.9, IPCC, 2013).
Figure 2.10. August mean temperature in F (blue bar) and August maximum
temperature (red bar) for Dallas and Tarrant Counties predicted by CESM1 and CMIP5
simulations (see text).
The analysis of the climate simulation suggests an increase in mean July temperature
to ~90 F for 2041-2050 in Dallas and Tarrant Counties compared to 85 F for 1991-
2000 (Fig. 2.9). Mean August temperatures in theses counties would reach 94 F by
2041-2050, thus daily extremes could likely exceed 120 F (IPCC, 2013), comparable to
historical extreme temperatures of cities such as Phoenix, AZ (Western Regional
Climate Center; http://www.wrcc.dri.edu). For the end of this century, the RCP8.5
simulation with CESM1.2 predicts at least 2 months of mean surface air temperatures
above 100 F, and 3 months of mean temperatures above 95 F, with extreme
temperatures exceeding 13 F above historical extremes (Figure 12.13c in IPCC, 2013),
or 126 F (Fig. 2.10), and comparable to extreme temperatures in Furnace Creek,
Death Valley, CA (WMO, http://wmo.asu.edu). The likely impacts of such predicted
extreme heat waves are an increase in wildfires along paved highways, heat-induced
stress on bridges and railroads, air conditioning problems in public transport vehicles,
and heat-related accidents by failure of individual vehicles and heat-related stress.
These impacts can be translated into substantial mobility and economic loss.
86
92
100
113
120
126
70
80
90
100
110
120
130
1991-2000 2041-2050 2091-2100
Climate Change/Extreme Weather Vulnerability of Dallas/Tarrant County Infrastructure
___________________________________________________________________________
11
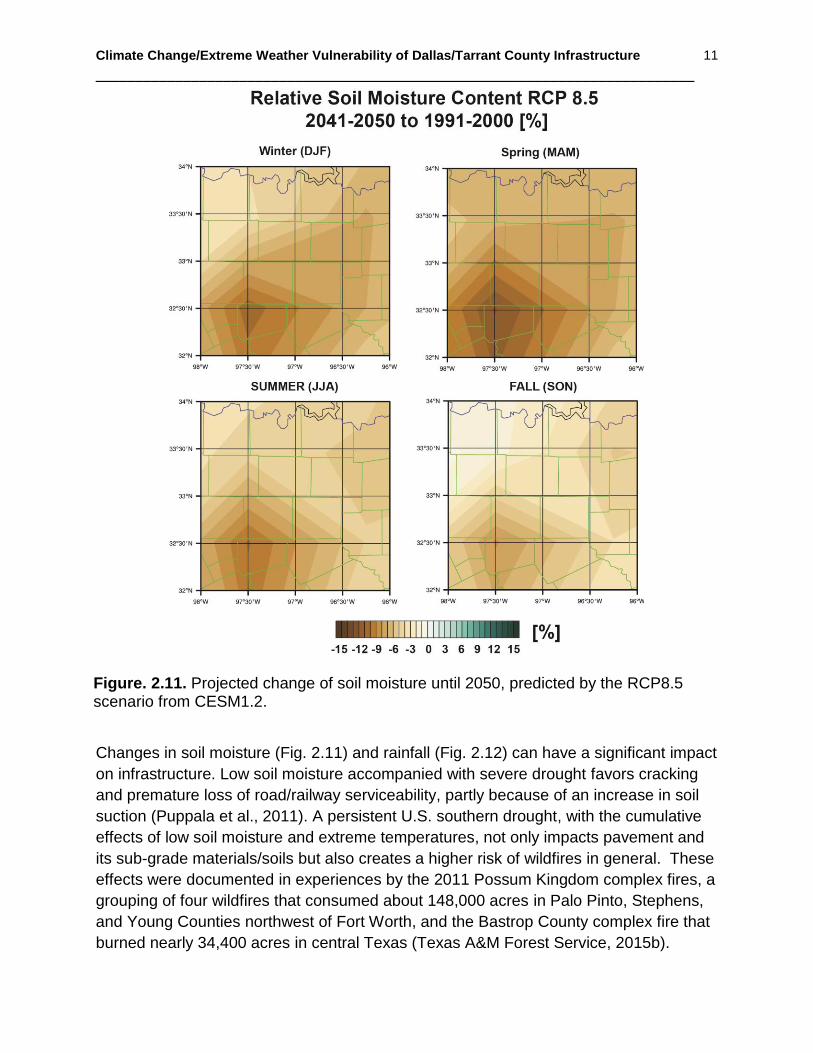
Changes in soil moisture (Fig. 2.11) and rainfall (Fig. 2.12) can have a significant impact
on infrastructure. Low soil moisture accompanied with severe drought favors cracking
and premature loss of road/railway serviceability, partly because of an increase in soil
suction (Puppala et al., 2011). A persistent U.S. southern drought, with the cumulative
effects of low soil moisture and extreme temperatures, not only impacts pavement and
its sub-grade materials/soils but also creates a higher risk of wildfires in general. These
effects were documented in experiences by the 2011 Possum Kingdom complex fires, a
grouping of four wildfires that consumed about 148,000 acres in Palo Pinto, Stephens,
and Young Counties northwest of Fort Worth, and the Bastrop County complex fire that
burned nearly 34,400 acres in central Texas (Texas A&M Forest Service, 2015b).
Figure. 2.11. Projected change of soil moisture until 2050, predicted by the RCP8.5 scenario from CESM1.2.
Climate Change/Extreme Weather Vulnerability of Dallas/Tarrant County Infrastructure
___________________________________________________________________________
12
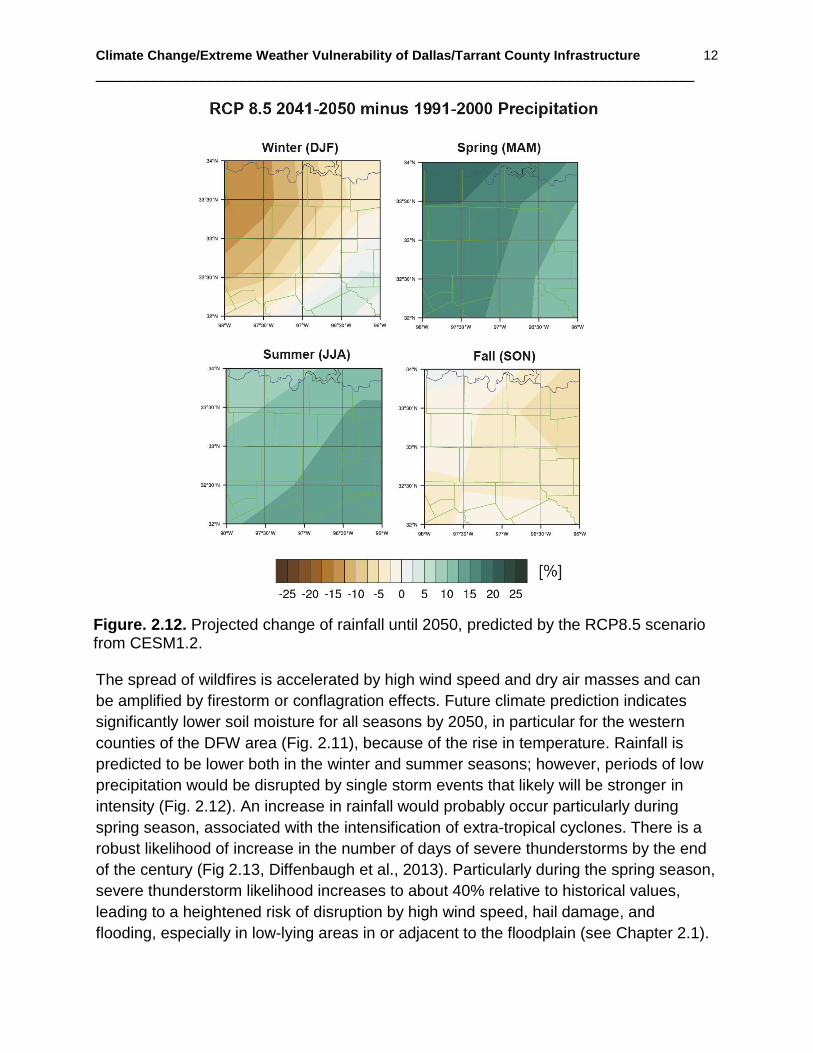
The spread of wildfires is accelerated by high wind speed and dry air masses and can
be amplified by firestorm or conflagration effects. Future climate prediction indicates
significantly lower soil moisture for all seasons by 2050, in particular for the western
counties of the DFW area (Fig. 2.11), because of the rise in temperature. Rainfall is
predicted to be lower both in the winter and summer seasons; however, periods of low
precipitation would be disrupted by single storm events that likely will be stronger in
intensity (Fig. 2.12). An increase in rainfall would probably occur particularly during
spring season, associated with the intensification of extra-tropical cyclones. There is a
robust likelihood of increase in the number of days of severe thunderstorms by the end
of the century (Fig 2.13, Diffenbaugh et al., 2013). Particularly during the spring season,
severe thunderstorm likelihood increases to about 40% relative to historical values,
leading to a heightened risk of disruption by high wind speed, hail damage, and
flooding, especially in low-lying areas in or adjacent to the floodplain (see Chapter 2.1).
Figure. 2.12. Projected change of rainfall until 2050, predicted by the RCP8.5 scenario from CESM1.2.

Climate Change/Extreme Weather Vulnerability of Dallas/Tarrant County Infrastructure
___________________________________________________________________________
13
Figure. 2.13. Left column (A–D): Change in severe thunderstorm environments
(NDSEV) for the last 3 decades of 21st century, predicted by CMIP RCP8.5 relative to
the three last decades of the 20th century for winter (DJF), spring (MAM), summer (JJA),
and autumn (SON) seasons. Black (gray) dots indicate areas where the signal from the
ensemble simulations exceeds one (two) Standard deviation(s) of the ensemble noise,
referred to as robust (highly robust). Right column (E–H): Anomaly of NDSEV for each
year in the 21st century expressed as a percentage value relative to the 1970-1999
baseline for each individual CMIP model simulation (thin line) and ensemble mean
(thick line) over the eastern United States (Figure from Diffenbaugh et al., 2013).

Climate Change/Extreme Weather Vulnerability of Dallas/Tarrant County Infrastructure
___________________________________________________________________________
14
Enhanced rainfall by more intense tropical cyclones is likely for the summer-to-fall
season (Knutson et al., 2001; Pielke et al., 2005 Emanuel, 2011). Predicted enhanced
convection by more intense tropical storms will likely cause an increase in severe
flooding. The flooding would exacerbate erosion and runoff characteristics in areas
impacted by increased urbanization and/or drainage channelization, and put
infrastructure both within and immediately adjacent to 100-year flood zones at greater
risk for damage or incapacitation.
A change in the hydrological cycle also affects the strength of the UHI. Figure 2.14
illustrates the correlation between the Palmer Drought Severity Index and the maximum
UHI. The calculated Pearson’s linear correlation coefficient is -0.734 and the ρ value is
0.01, indicating that there is a significant correlation between the drought and maximum
heat island (Winguth and Kelp, 2013). Two remarkable droughts with different
characteristics occurred between 2001 and 2011, the 2005-2006 drought (Dong et al.,
2011) and the 2010-2011 severe drought (Nielsen-Gammon, 2012). Predicted reduction
in the soil moisture (Fig. 2.11) will lead to significant increase in the urban-to-rural
temperature gradient, thus amplifying the heat stress on the infrastructure as discussed
above.
Figure 2.14. Correlation between the Palmer Drought Severity Index (PDSI) and the maximum urban heat island (UHI) with a Pearson’s linear correlation coefficient of -0.734 and ρ value of 0.01 for North Central Texas for July between 2001 and 2011. Note that negative PDSI denotes drought conditions, for example, -2 is moderate drought, -3 is severe drought, -4 is extreme drought. The UHI is computed between the Dallas Hinton station (CAMS 60) and the Kaufman station (CAMS 71) (from Winguth and Kelp, 2013).

Climate Change/Extreme Weather Vulnerability of Dallas/Tarrant County Infrastructure
___________________________________________________________________________
15
3. EXISTING AND PROJECTED INFRASTRUCTURE OF DALLAS AND TARRANT
COUNTIES
3.1. Introduction
In order to complete Task 2, the Study team compiled an inventory of existing and
future transportation infrastructure in Dallas and Tarrant Counties and ranked the
importance of certain assets based on their capacity-based criticality. According to
Mobility 2035: The Metropolitan Transportation Plan for North Central Texas – 2013
Amendment, the Dallas-Fort Worth (DFW) region is projected to grow rapidly:
approximately 45% increase in population, 44% in employment, and 55% in vehicle-
miles traveled from 2013 to 2035. Given this projected growth, the annual cost of
congestion is expected to more than double from $4.7 billion to $10.1 billion (Table 3.1).
The existing transportation infrastructure would require significant maintenance for
aging and damaged structures and improvements in potential capacity to provide an
adequate level of mobility/accessibility, maintain environmental quality, and prepare
and/or adapt for more severe and frequent extreme weather events.
Table 3.1. Projected growth of the North Central Texas region from 2013 to 2035
Source: Mobility 2035 Plan – 2013 Amendment (NCTCOG, 2013)
3.2. Asset Inventory and Data Collection
An inventory of current and future transportation assets was compiled focusing on
roads, passenger rail facilities, and critical bridges in Dallas and Tarrant Counties
primarily using NCTCOG’s existing inventories compiled from the region’s various
transportation providers (Table 3.2; Fig. 3.1-3.4). Future projections of transportation
infrastructure location and capacity was based on the Mobility 2035 Plan – 2013
Amendment. Geospatial data for roadway arterials, collectors, and local roads with
attributes of functional classification, number of lanes, and annual average daily traffic
(AADT) were assembled. Rail networks include both passenger and freight rail facilities.
Regional Performance Measures 2013 2035 % Change
Population 6,778,201 9,833,378 45%
Employment 4,292,516 6,177,016 44%
Vehicle Miles of Travel 181,516,746 281,580,581 55%
Hourly Capacity (Miles) 42,593,607 51,288,092 20%
Vehicle Hours Spent in Delay (Daily) 1,165,512 2,489,440 114%
Increase in Travel Time Due to Congestion 32.1% 44.9% 40%
Annual Cost of Congestion (Billions) $4.7 $10.1 114%
Climate Change/Extreme Weather Vulnerability of Dallas/Tarrant County Infrastructure
___________________________________________________________________________
16
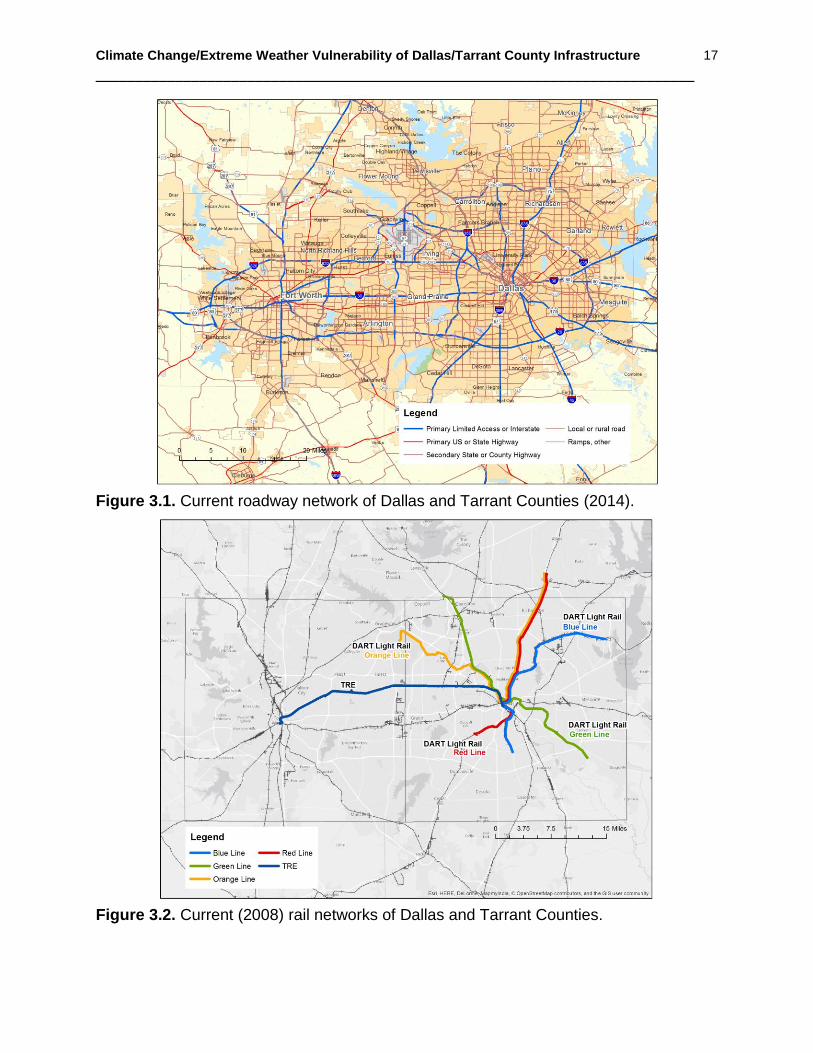
Geospatial data for annual passenger railridership were joined to rail lines operated by
Dallas Area Rapid Transit (DART) and the Fort Worth Transportation Authority (FWTA).
Lastly, locations of airports were mapped and joined with 2013 passenger boarding
data.
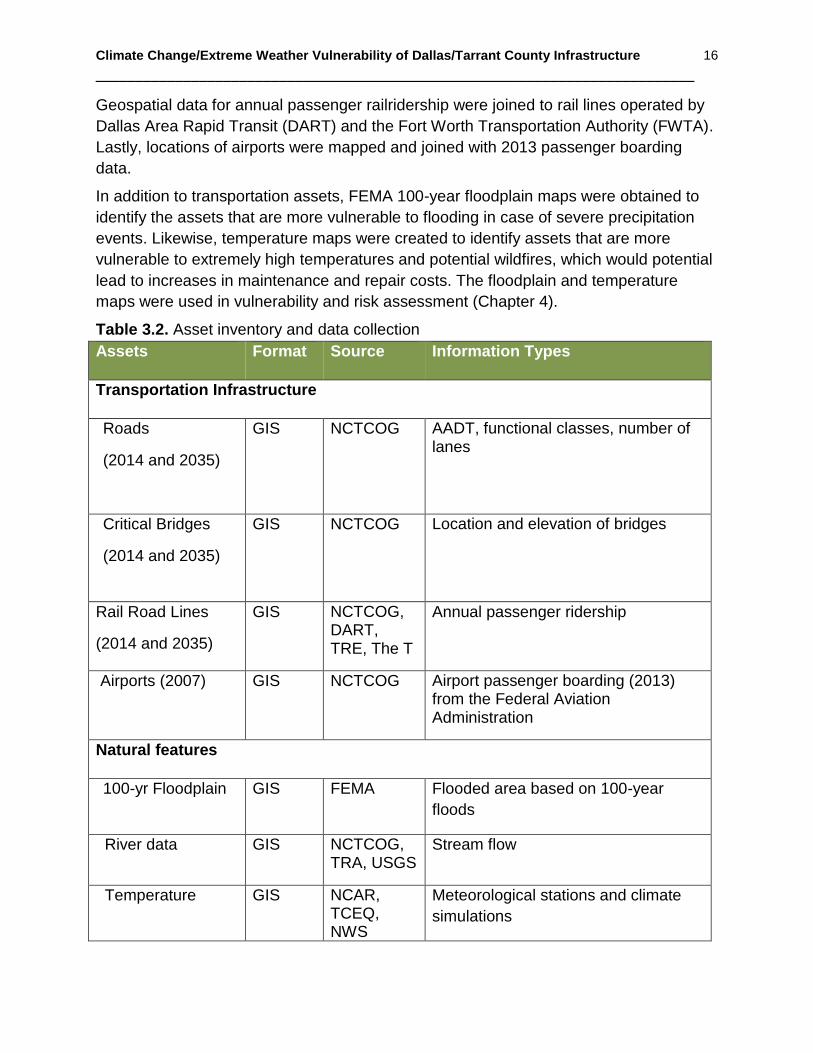
In addition to transportation assets, FEMA 100-year floodplain maps were obtained to
identify the assets that are more vulnerable to flooding in case of severe precipitation
events. Likewise, temperature maps were created to identify assets that are more
vulnerable to extremely high temperatures and potential wildfires, which would potential
lead to increases in maintenance and repair costs. The floodplain and temperature
maps were used in vulnerability and risk assessment (Chapter 4).
Table 3.2. Asset inventory and data collection
Assets Format Source Information Types
Transportation Infrastructure
Roads
(2014 and 2035)
GIS NCTCOG
AADT, functional classes, number of lanes
Critical Bridges
(2014 and 2035)
GIS NCTCOG Location and elevation of bridges
Rail Road Lines
(2014 and 2035)
GIS NCTCOG, DART, TRE, The T
Annual passenger ridership
Airports (2007)
GIS
NCTCOG
Airport passenger boarding (2013) from the Federal Aviation Administration
Natural features
100-yr Floodplain
GIS FEMA Flooded area based on 100-year
floods
River data GIS NCTCOG, TRA, USGS
Stream flow
Temperature GIS NCAR, TCEQ, NWS
Meteorological stations and climate
simulations
Climate Change/Extreme Weather Vulnerability of Dallas/Tarrant County Infrastructure
___________________________________________________________________________
17
Figure 3.1. Current roadway network of Dallas and Tarrant Counties (2014).
Figure 3.2. Current (2008) rail networks of Dallas and Tarrant Counties.
Climate Change/Extreme Weather Vulnerability of Dallas/Tarrant County Infrastructure
___________________________________________________________________________
18
Figure 3.3. Future (2035) rail networks of Dallas and Tarrant Counties.
Figure 3.4. Current location of airports in Dallas and Tarrant Counties.

Climate Change/Extreme Weather Vulnerability of Dallas/Tarrant County Infrastructure
___________________________________________________________________________
19
3.3. Criticality Assessment
Criticality was defined and assessed to prioritize each asset based on its relative
importance for emergency preparedness, recovery, and maintenance. FHWA (2012)
reports two major approaches used by the DHS National Critical Infrastructure
Prioritization Program (NCIPP) in identifying the importance of assets: (1) consequence-
based criteria including: loss of life, economic costs, ability to re-route and length of
detour, and time to rebuild if damaged; and (2) capacity-based criteria, which focus on
the level of usage (e.g. AADT). Several previous pilot studies conducted by the Gulf
Coast, North Jersey, and the State of Washington defined and determined criticality
using qualitative (e.g. opinions from the workshop participants) and/or quantitative
methods (e.g. assessing multiple criteria such as socioeconomic data, level of use, and
health and safety) based on their regional characteristics and data availability. In this
study, the capacity-based approach using AADT for roadways, annual ridership for
passenger rails, and annual passenger boarding for airports is primarily used to
determine the criticality of assets.
Roadways
AADT was normalized by number of lanes to better represent the functionality of
roadways (Fig. 3.5) based on consultation among the project partners assembled for
this Study. Compared to using absolute values of AADT, this method captures the
importance of isolated lower-capacity roadways with greater delay over time. At many
locations throughout the DFW area, many of these roadways with greater traffic delays
are associated with fewer alternative routes and greater need for capacity
improvements. For classifying AADT per travel lane, percentile ranks were used to rank
each segment based on its current traffic volume and to highlight the relative standing of
each critical segment compared to all roadways. Figures 3.5 and 3.6 show the roadway
segments with top 1%, 5%, 10%, 20% of total roadways, and each class was assigned
to a score as below:
27,201- 36,350 vehicles (top 1%) was assigned a score of 5.
20,968 – 27,200 vehicles (top 1 – 5%) was assigned a score of 4.
16,034 – 20,967 vehicles (top 5 – 10%) was assigned a score of 3.
7,751 – 16,033 vehicles (top 10 – 20%) was assigned a score of 2.
0 – 7,750 vehicles (top 20 – 100%) was assigned a score of 1.
Currently, highways in the north and northeast areas of Tarrant County and broad areas
throughout the northern half of Dallas County carry higher traffic volumes and
experience frequent congestion throughout the day (Figure3.5). By applying the traffic
classification as defined above, the 2035 projection (Figure 3.6) shows that congested
roadways with high traffic volume largely expand over the entirety of both counties.

Climate Change/Extreme Weather Vulnerability of Dallas/Tarrant County Infrastructure
___________________________________________________________________________
20
Figure 3.5. Current roadway traffic volume in Dallas and Tarrant Counties based on
AADT and normalized by number of lanes.
Figure 3.6. 2035 roadway traffic volume in Dallas and Tarrant Counties based on AADT
and normalized by number of lanes.
Climate Change/Extreme Weather Vulnerability of Dallas/Tarrant County Infrastructure
___________________________________________________________________________
21
Traffic volume near the middle of the two counties, particularly on highways near Dallas-
Fort Worth International Airport (DFWIA) is projected to significantly increase.
Passenger Rail
Currently, Dallas and Tarrant Counties have two passenger rail operators: DART and
FWTA. Operated since 1996, the DART Light Rail System consists of four major lines:
Red, Orange, Blue, and Green that connect suburban areas of Dallas County (as well
as portions of Collin County to the north and Denton County to the northwest) to
Downtown Dallas. In 2013, annual passenger ridership of DART Light Rail was 29.5
million passengers, with 96,300 persons identified as the average weekday ridership
(DART, 2014). FWTA conducts a joint operation with DART for the Trinity Railway
Express (TRE), a commuter rail corridor that travels between the central business
districts of Fort Worth and Dallas. The TRE also contains intermediate stops in the
cities of Richland Hills, Hurst, Irving, as well as Fort Worth’s Centreport Campus which
provides a bus connection hub to DFWIA. The 2013 annual ridership of TRE was 2.1
million passengers, with an average weekday ridership of 7,550 persons (DART, 2014).
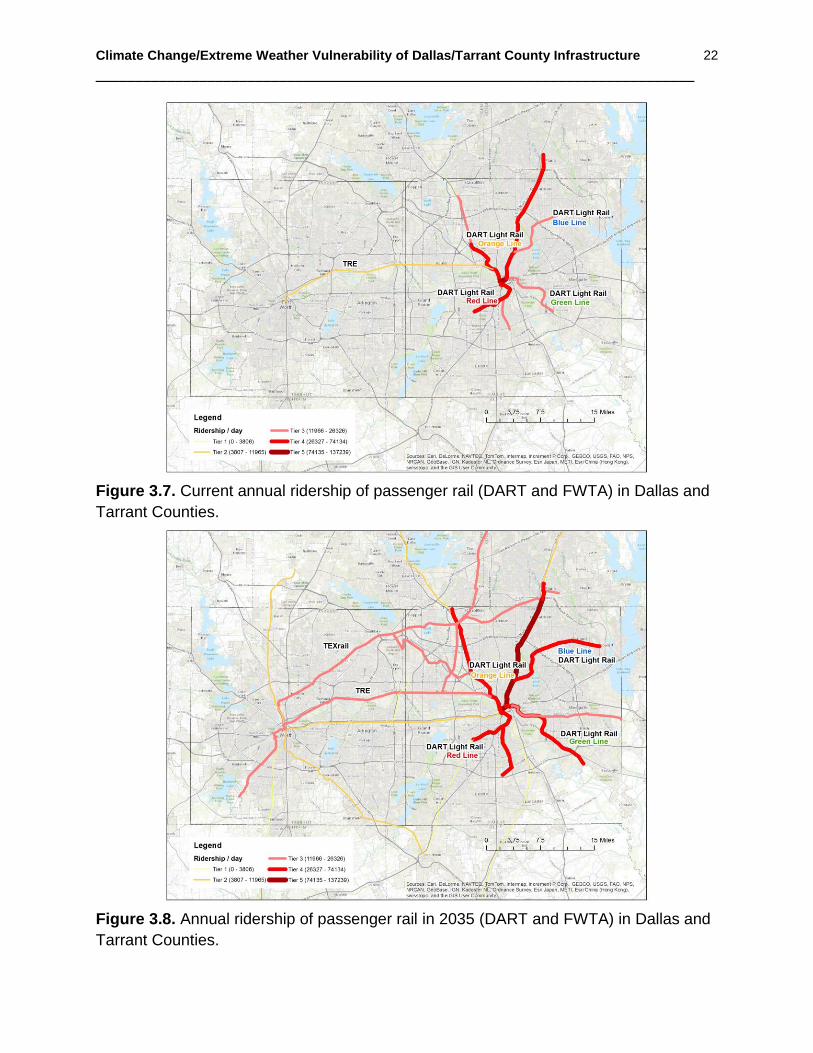
Current and year 2035 projected annual passenger ridership by each DART/FWTA rail
line were mapped and aggregated into railway segments that carry multiple lines (Fig.
3.6 and 3.7). Year 2035 annual average daily ridership for individual railway segments
was classified into five tiers using a natural break classification, a method of manual
data classification that achieves to partition data into classes based on natural groups in
the data distribution. Each class was assigned to a score as below:
74,135 – 137,239 passengers was assigned a score of 5.
26,327 – 74,134 passengers was assigned a score of 4.
11,966 – 26,326 passengers was assigned a score of 3.
3,807 – 11,965 passengers was assigned a score of 2.
0 – 3,806 passengers was assigned a score of 1.
Currently, the DART Orange and Red lines carry relatively high average daily riderships;
railway segments in Downtown Dallas show the highest ridership because all four lines
pass through a dedicated transit corridor. TRE lines carry the fewest passengers (Fig.
3.7). By 2035, passenger ridership for all lines is expected to grow significantly,
reflecting a nearly 50% increase of population and employment compared to current
figures (Fig. 3.8). In particular, the highest number of passengers are projected to be
carried by the Red and Orange lines for the section between Downtown Dallas and the
City of Plano in Collin County. Future projections also indicate strong ridership for
several new rail corridors to be developed prior to 2035. TEX Rail, a 27-mile commuter
rail line being developed by FWTA, will debut by 2018 to connect Downtown Fort Worth
to the northern entrance of DFWIA along the southwest-to-northeast-oriented Cotton
Belt corridor. Ultimately, extensions to either side of this line will allow uninterrupted
Climate Change/Extreme Weather Vulnerability of Dallas/Tarrant County Infrastructure
___________________________________________________________________________
22
Figure 3.7. Current annual ridership of passenger rail (DART and FWTA) in Dallas and
Tarrant Counties.
Figure 3.8. Annual ridership of passenger rail in 2035 (DART and FWTA) in Dallas and
Tarrant Counties.

Climate Change/Extreme Weather Vulnerability of Dallas/Tarrant County Infrastructure
___________________________________________________________________________
23
travel between southwest Fort Worth and the DART Red/Orange Line in the City of
Plano. Another highly-traveled commuter rail service is also anticipated for
development along the Burlington Northern Santa Fe (BNSF) corridor between the TRE
South Irving Station and the City of Frisco in Collin County. This interconnectivity
enables ridership to increase across many railway segments throughout the North
Central Texas region.
Airports
Airports are important transportation assets in the DFW area that connect passengers
and cargo to various domestic and international regions. Dallas and Tarrant Counties
contain 19 airports, including DFWIA and Dallas Love Field Airport. According to the
Federal Aviation Administration (2014), DFWIA is ranked 4th for passenger boarding
(annual enplanement of 29,038,128 persons) and 10th for landed weights of cargo
(3,062,528,160 lb.) among the U.S. airports in 2013. Dallas Love Field was ranked 44th
for passenger boarding (annual enplanement of 4,023,779 persons). Criticality of the
airports was determined based on their passenger boarding figures for 2013 (Fig. 3.9).
Airports are major sources of heat island formation because of their extensive
impervious coverage (Houston Advanced Research Center, 2009) and extreme heat
significantly air density, which impacts the minimum runway length for planes to take off
(FAA, 2014). Extreme weather events such as storms with severe wind speeds, flooding,
as well as snow and ice events, can also lead to significant flight delays.
Figure 3.9. Current (2013) major airport passenger boarding (DFWIA and Love Field) in
Dallas and Tarrant Counties (Source: US DOT Federal Aviation Administration, 2014).

Climate Change/Extreme Weather Vulnerability of Dallas/Tarrant County Infrastructure
___________________________________________________________________________
24
4. VULNERABILITY OF DALLAS AND TARRANT COUNTY TRANSPORTATION
INFRASTRUCTURE TO EXTREME WEATHER AND CLIMATE CHANGE
4.1. Introduction
The definition of vulnerability and risk varies for different applications (Biging et al.
2012). Climate change vulnerability is defined as the degree to which a system is
susceptible to, or unable to cope with, adverse effects of climate change, including
climate variability and extremes (IPCC, 2013). In the FHWA framework, climate change
vulnerability is a composite of three factors: the exposure to climate effects, sensitivity
to climate effects, and adaptive capacity to climate change (FHWA, 2012).
Vulnerability = f (exposure, sensitivity, adaptive capacity).
Exposure is determined by whether or not assets in question are situated in an area that
is directly affected by climate change and extreme weather events such as severe
precipitation and heat waves. Sensitivity refers to the direct and indirect costs of
potential impacts caused by climate change and extreme weather. Adaptive capacity is
estimated by whether or not there are sufficient local and regional resources (physical
capacity, capital/materials for construction/maintenance, etc.) and policies (emergency
management, operating procedures, etc.) that allow immediate and short-term
responses to climate stressors.
In assessing vulnerability to severe flooding, this Study focuses on identifying critical
infrastructure located within the spatial extents of the 100-year floodplain. It should be
noted that some of the critical infrastructure located within the floodplain area may not
be directly exposed or sensitive to flooding as a result of elevation, local drainage/runoff
characteristics, engineering factors, or other conditions. Information to verify such
conditions for each facility could not be assessed for this Study due to time constraints
and limited data availability from potential sources. However, it is clear that large
quantities of critical infrastructure in Dallas and Tarrant Counties are present in flood-
prone areas. Therefore, vulnerability due to potential exposure is likely and substantial
portions of the roadway network would be sensitive to potential impacts should they
occur. Criticality measures outlined in the previous chapter are incorporated into the
vulnerability calculation as well. Adaptive capacity is assumed constant in this
assessment due to the lack of sufficient information and complexities in quantification
directly pertinent to the North Central Texas region. The presence of numerous
transportation providers, local governments, and a wide range of interactions and
linkages that support construction, maintenance, operations, and emergency
management in the DFW area make it difficult to accurately determine adaptive capacity
alternatives, as well as defining the comprehensive array of potential applications in
various weather-related circumstances.

Climate Change/Extreme Weather Vulnerability of Dallas/Tarrant County Infrastructure
___________________________________________________________________________
25
Risk assessment is defined in this study by the magnitude of impacts (consequence)
and the probability (likelihood) of occurrence:
Risk = f (magnitude of impact, the probability of occurrence).
Vulnerability and risk to extreme heat is assessed by the following procedure: Surface
air temperature maps generated from the climate simulations are overlaid upon maps of
critical assets to identify infrastructure vulnerability to heat exposure. Gradients in
surface air temperature are used to classify the likelihood of heat-related damage into
low, medium and high classes.
It should be noted that there is a lag in the time horizon between the projected criticality
of transportation assets and the climate change projections identified in this study. Most
long-range metropolitan transportation plans, such as the Mobility 2035 Plan – 2013
Amendment, have a time horizon ranging from 20 to 30 years whereas climate
projections cover much longer time frames of about 30 to 100 years. In this study, the
year 2035 projection from the Mobility 2035 Plan – 2013 Amendment provides the
longest infrastructure projection available for vehicle volumes and rail ridership. Climate
projections for the horizon years 2050 and 2100 were used to determine the likelihood
of extreme weather events and climate change.
4.2. Critical Infrastructure in the 100-Year Floodplain
Roadways
Critical roadways within the 100-year floodplain were identified by overlaying 100-year
floodplain coverage maps over the location of facilities with high annual average daily
traffic (AADT) per travel lane based on the Mobility 2035 Plan – 2013 Amendment (Fig.
4.1). The results show that 635.7 center-line miles of roads, dependent on elevation and
other physical/location characteristics, will have a higher potential for flooding and
associated damage and/or disruption due to extreme precipitation events with runoff
comparable to a 100-year flood. Critical roadways located within the 100-year floodplain
are classified as follows based on future traffic projections:
The roadways that have a criticality score of 4 or 5 are classified as “High”
criticality segments;
The roadways that have a criticality score of 2 or 3 are classified as “Medium”
criticality segments; and
The roadways that have a criticality score of 1 are classified as “Low” criticality
segments.

Climate Change/Extreme Weather Vulnerability of Dallas/Tarrant County Infrastructure
___________________________________________________________________________
26
(a)
(b)
Figure 4.1. Critical roadway segments in the 100-year floodplain: (a) Tarrant County (b) Dallas County (Year: 2035)
Climate Change/Extreme Weather Vulnerability of Dallas/Tarrant County Infrastructure
___________________________________________________________________________
27
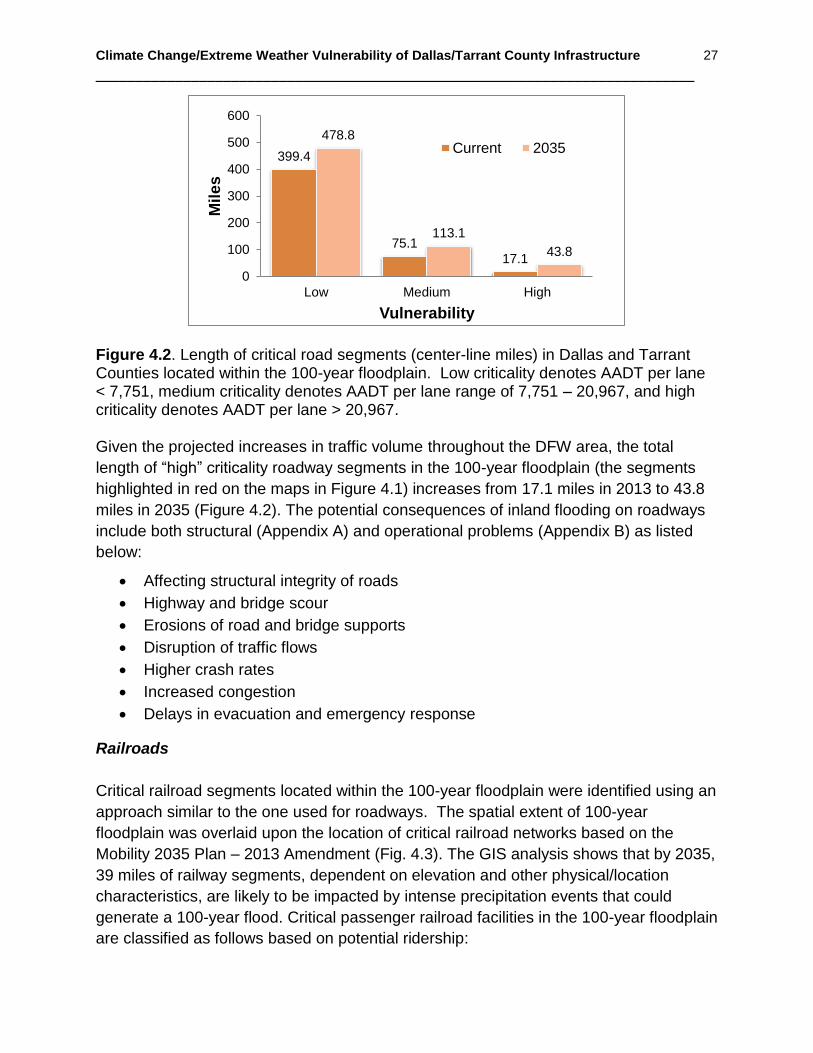
Figure 4.2. Length of critical road segments (center-line miles) in Dallas and Tarrant Counties located within the 100-year floodplain. Low criticality denotes AADT per lane < 7,751, medium criticality denotes AADT per lane range of 7,751 – 20,967, and high criticality denotes AADT per lane > 20,967. Given the projected increases in traffic volume throughout the DFW area, the total
length of “high” criticality roadway segments in the 100-year floodplain (the segments
highlighted in red on the maps in Figure 4.1) increases from 17.1 miles in 2013 to 43.8
miles in 2035 (Figure 4.2). The potential consequences of inland flooding on roadways
include both structural (Appendix A) and operational problems (Appendix B) as listed
below:
Affecting structural integrity of roads
Highway and bridge scour
Erosions of road and bridge supports
Disruption of traffic flows
Higher crash rates
Increased congestion
Delays in evacuation and emergency response
Railroads
Critical railroad segments located within the 100-year floodplain were identified using an
approach similar to the one used for roadways. The spatial extent of 100-year
floodplain was overlaid upon the location of critical railroad networks based on the
Mobility 2035 Plan – 2013 Amendment (Fig. 4.3). The GIS analysis shows that by 2035,
39 miles of railway segments, dependent on elevation and other physical/location
characteristics, are likely to be impacted by intense precipitation events that could
generate a 100-year flood. Critical passenger railroad facilities in the 100-year floodplain
are classified as follows based on potential ridership:
399.4
75.1
17.1
478.8
113.1
43.8
0
100
200
300
400
500
600
Low Medium High
Mil
es
Vulnerability
Current 2035

Climate Change/Extreme Weather Vulnerability of Dallas/Tarrant County Infrastructure
___________________________________________________________________________
28
The passenger railroads that have a criticality score of 4 or 5 are classified as
“High” criticality facilities;
The passenger railroads that have a criticality score of 2 or 3 are classified as
“Medium” criticality facilities; and
The passenger railroads that have a criticality score of 1 are classified as “Low”
criticality facilities.
The potential impacts of inland flooding on railroads include the following;
Flooding over railroads
Disruption of traffic, delay, increased risk of hazardous material spill
Damage to railways and track bed due to landslides and mudslides
Increased malfunction of track or signal sensors
Complete or partial loss of service
Drowning of passengers by accidents
Figure 4.3. Critical railways located within the 100-year floodplain in Dallas and Tarrant
Counties (Year: 2035).
Airports
A similar overlay-analysis was conducted to determine airport infrastructure located
within the 100-year floodplain. The results show that the majority of the existing airports
are unlikely to be inundated by extreme precipitation events that would result in a 100-

Climate Change/Extreme Weather Vulnerability of Dallas/Tarrant County Infrastructure
___________________________________________________________________________
29
year flood. For example, DFWIA shows a very small portion (0.1%) of overlapping area
within the 100-year floodplain. Service roads and terminals could be affected by flooding,
but the runways are typically higher than the surrounding ground and thus are not likely
to be affected by an increase in precipitation. Higher precipitation associated climate
change, as predicted for spring months in the future, will lead to an increase in delays
and higher risk of aviation accidents.
Although the results show that the impact of flooding on the runways would be
inconsiderable, extreme precipitation and severe storms may impact airport operations
such as airport closure, delays in passenger and cargo loading, and disruptions to other
service-related operations. In addition, accessibility to the airports via the regional
roadway and passenger rail network are also more likely to be impacted, thus
influencing airport operations.
Table 4.1. Airports vulnerable to severe flooding in Dallas and Tarrant Counties (Year 2035)
Airport Enplanement Impacted Area (ft2)
Airport Area (ft2)
Impacted / total area
DFW International Airport 29,038,128 119,776 96,664,968 0.1%
Dallas Love Field 4,023,779 0 25,443,514 0.0%
Fort Worth Alliance 1,348 115,264 12,706,103 0.9%
NAS Fort Worth Joint Reserve Base
1,072 1,547,774 19,286,536 8.0%
4.3. Critical Infrastructure Vulnerable to Heat Risks
Climate simulations project a significant increase in the mean and daily extreme
temperatures during the summer season (see Chapter 2.3). While changes in mean
temperatures would have long-term impacts on transportation infrastructure and
services, the short-term impacts would be related to temperature extremes, based on
both magnitude and frequency. Temperature extremes cause severe problems on both
transportation infrastructure itself (as discussed in Chapter 2.3 and Appendix A) and
associated operations (Appendix B; Savonis et al., 2008).
In general, global climate simulations have a spatial resolution of 100 - 300 km; their
original spatial resolution is too coarse to assess the specific climate impacts on
regional/local transportation systems. In order to acquire finer resolution for mean
temperature maps (e.g. 1 km), the pattern-scaling method was employed by assuming
that the spatial pattern of change in climate variables would be consistent in time
(Mitchell, 2003). The maps of mean summer surface air temperature for the period
1991-2010 over the NCT region was generated using the NWS COOP weather station
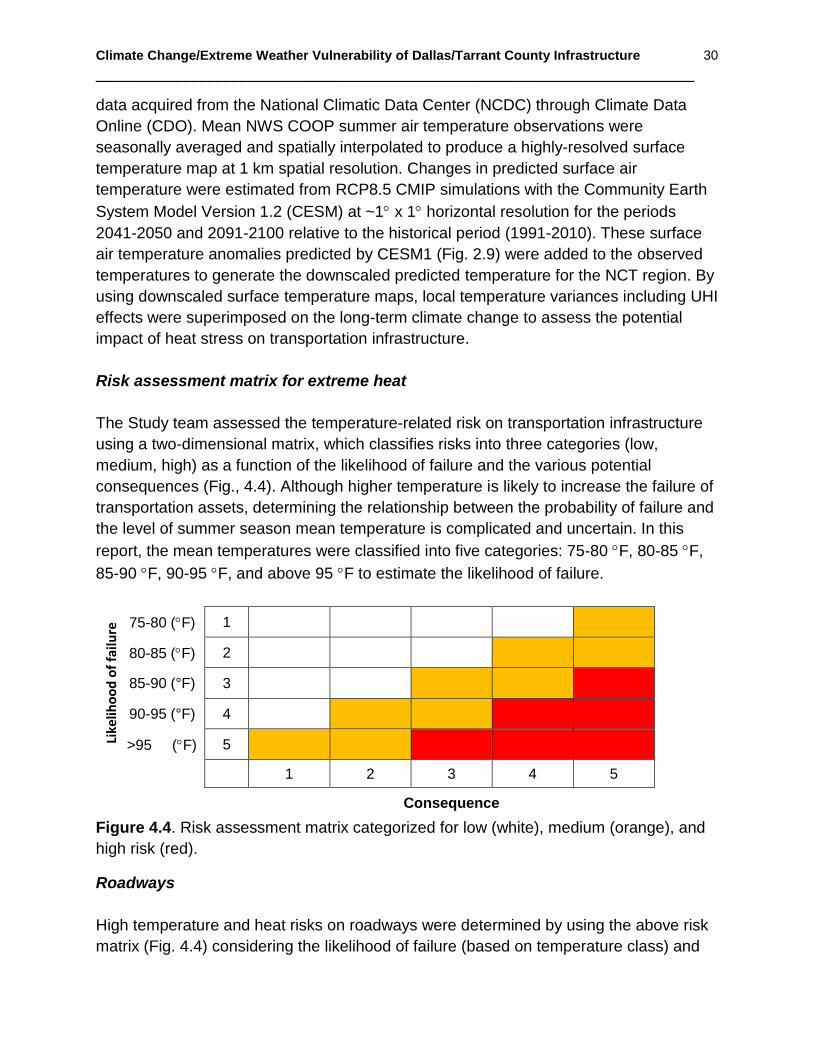
Climate Change/Extreme Weather Vulnerability of Dallas/Tarrant County Infrastructure
___________________________________________________________________________
30
data acquired from the National Climatic Data Center (NCDC) through Climate Data
Online (CDO). Mean NWS COOP summer air temperature observations were
seasonally averaged and spatially interpolated to produce a highly-resolved surface
temperature map at 1 km spatial resolution. Changes in predicted surface air
temperature were estimated from RCP8.5 CMIP simulations with the Community Earth
System Model Version 1.2 (CESM) at ~1 x 1 horizontal resolution for the periods
2041-2050 and 2091-2100 relative to the historical period (1991-2010). These surface
air temperature anomalies predicted by CESM1 (Fig. 2.9) were added to the observed
temperatures to generate the downscaled predicted temperature for the NCT region. By
using downscaled surface temperature maps, local temperature variances including UHI
effects were superimposed on the long-term climate change to assess the potential
impact of heat stress on transportation infrastructure.
Risk assessment matrix for extreme heat
The Study team assessed the temperature-related risk on transportation infrastructure
using a two-dimensional matrix, which classifies risks into three categories (low,
medium, high) as a function of the likelihood of failure and the various potential
consequences (Fig., 4.4). Although higher temperature is likely to increase the failure of
transportation assets, determining the relationship between the probability of failure and
the level of summer season mean temperature is complicated and uncertain. In this
report, the mean temperatures were classified into five categories: 75-80 F, 80-85 F,
85-90 F, 90-95 F, and above 95 F to estimate the likelihood of failure.
Like
liho
od
of
failu
re 75-80 (F) 1
80-85 (F) 2
85-90 (°F) 3
90-95 (°F) 4
>95 (F) 5
1 2 3 4 5
Consequence
Figure 4.4. Risk assessment matrix categorized for low (white), medium (orange), and
high risk (red).
Roadways
High temperature and heat risks on roadways were determined by using the above risk
matrix (Fig. 4.4) considering the likelihood of failure (based on temperature class) and
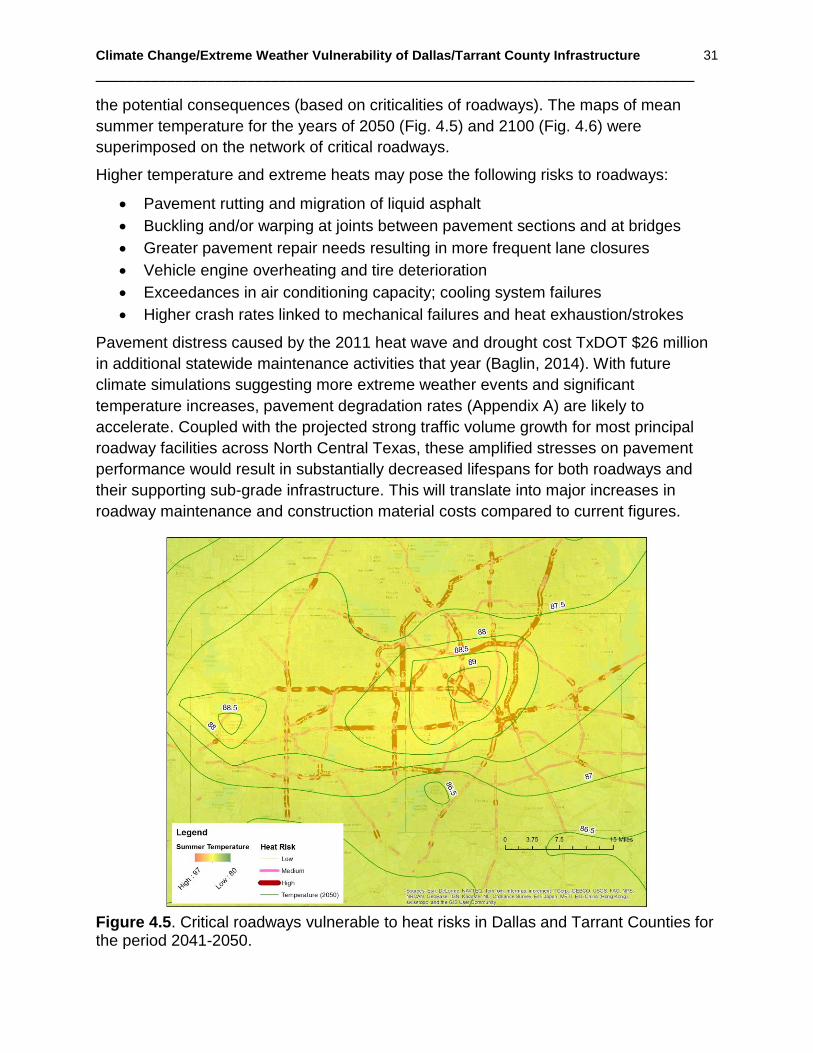
Climate Change/Extreme Weather Vulnerability of Dallas/Tarrant County Infrastructure
___________________________________________________________________________
31
the potential consequences (based on criticalities of roadways). The maps of mean
summer temperature for the years of 2050 (Fig. 4.5) and 2100 (Fig. 4.6) were
superimposed on the network of critical roadways.
Higher temperature and extreme heats may pose the following risks to roadways:
Pavement rutting and migration of liquid asphalt
Buckling and/or warping at joints between pavement sections and at bridges
Greater pavement repair needs resulting in more frequent lane closures
Vehicle engine overheating and tire deterioration
Exceedances in air conditioning capacity; cooling system failures
Higher crash rates linked to mechanical failures and heat exhaustion/strokes
Pavement distress caused by the 2011 heat wave and drought cost TxDOT $26 million
in additional statewide maintenance activities that year (Baglin, 2014). With future
climate simulations suggesting more extreme weather events and significant
temperature increases, pavement degradation rates (Appendix A) are likely to
accelerate. Coupled with the projected strong traffic volume growth for most principal
roadway facilities across North Central Texas, these amplified stresses on pavement
performance would result in substantially decreased lifespans for both roadways and
their supporting sub-grade infrastructure. This will translate into major increases in
roadway maintenance and construction material costs compared to current figures.
Figure 4.5. Critical roadways vulnerable to heat risks in Dallas and Tarrant Counties for the period 2041-2050.

Climate Change/Extreme Weather Vulnerability of Dallas/Tarrant County Infrastructure
___________________________________________________________________________
32
Figure 4.6. Critical roadways vulnerable to heat risks in Dallas and Tarrant Counties for the period 2091-2100.
Railroads
Passenger rail lines with higher ridership numbers are likely to experience more
consequences from infrastructure failure or service disruptions by extreme heat. High
temperatures and extreme heat can cause various impacts on rail tracks and rail-related
transportation assets:
Rail bucking
Operational delay due to speed restriction
Catenary sagging and pulley failures
Switches and signal failures
Exceedances in air conditioning capacity; cooling system failures
Higher fire risk, particularly near wooded areas
These weather-related impacts are high, particularly during summer season heat waves
with frequent extreme temperatures (Fig. 2.9). However, accumulated stress may cause
a reduced lifespan of rail infrastructure assets; maintenance and repair costs may
increase accordingly.
In 2050, the DART Red/Orange line between Downtown Dallas and the City of Plano
(Collin County) is expected to be at a greater risk for impacts because of its high

Climate Change/Extreme Weather Vulnerability of Dallas/Tarrant County Infrastructure
___________________________________________________________________________
33
Figure 4.7. Critical railways vulnerable to heat risk in Dallas and Tarrant Counties for the period 2041-2050.
Figure 4.8. Critical railways vulnerable to heat risk in Dallas and Tarrant Counties for the period 2091-2000.
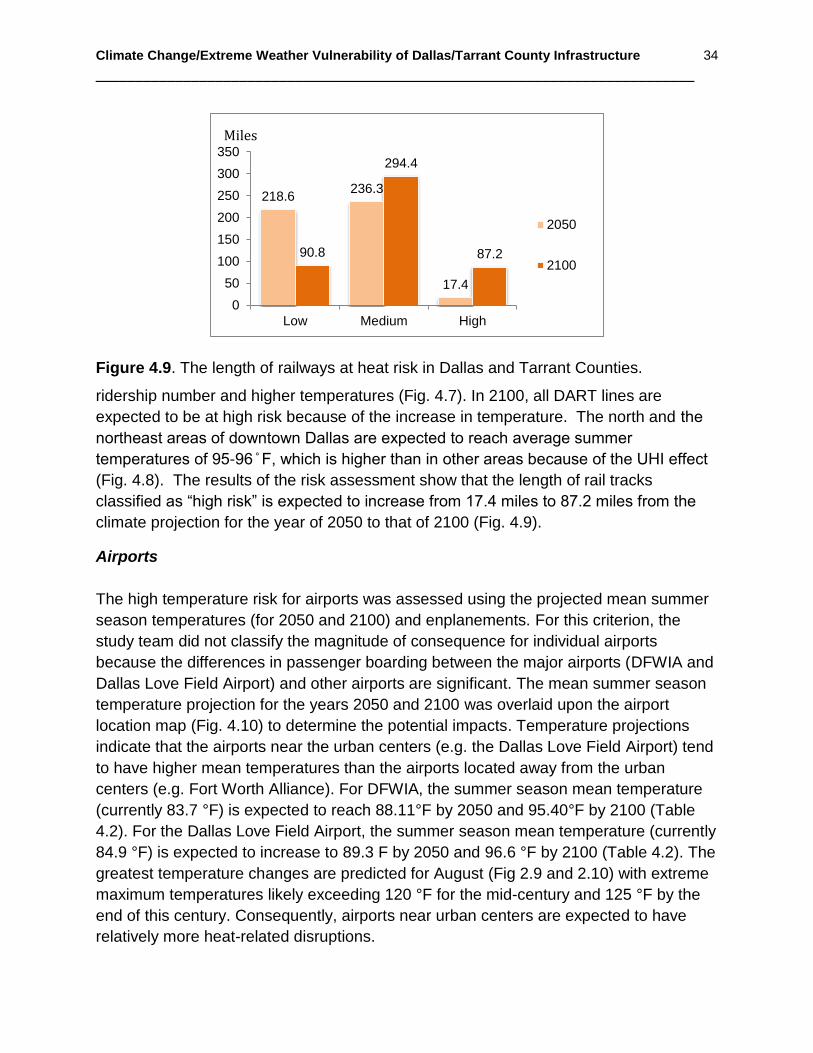
Climate Change/Extreme Weather Vulnerability of Dallas/Tarrant County Infrastructure
___________________________________________________________________________
34
Figure 4.9. The length of railways at heat risk in Dallas and Tarrant Counties.
ridership number and higher temperatures (Fig. 4.7). In 2100, all DART lines are
expected to be at high risk because of the increase in temperature. The north and the
northeast areas of downtown Dallas are expected to reach average summer
temperatures of 95-96 ̊F, which is higher than in other areas because of the UHI effect
(Fig. 4.8). The results of the risk assessment show that the length of rail tracks
classified as “high risk” is expected to increase from 17.4 miles to 87.2 miles from the
climate projection for the year of 2050 to that of 2100 (Fig. 4.9).
Airports
The high temperature risk for airports was assessed using the projected mean summer
season temperatures (for 2050 and 2100) and enplanements. For this criterion, the
study team did not classify the magnitude of consequence for individual airports
because the differences in passenger boarding between the major airports (DFWIA and
Dallas Love Field Airport) and other airports are significant. The mean summer season
temperature projection for the years 2050 and 2100 was overlaid upon the airport
location map (Fig. 4.10) to determine the potential impacts. Temperature projections
indicate that the airports near the urban centers (e.g. the Dallas Love Field Airport) tend
to have higher mean temperatures than the airports located away from the urban
centers (e.g. Fort Worth Alliance). For DFWIA, the summer season mean temperature
(currently 83.7 °F) is expected to reach 88.11°F by 2050 and 95.40°F by 2100 (Table
4.2). For the Dallas Love Field Airport, the summer season mean temperature (currently
84.9 °F) is expected to increase to 89.3 F by 2050 and 96.6 °F by 2100 (Table 4.2). The
greatest temperature changes are predicted for August (Fig 2.9 and 2.10) with extreme
maximum temperatures likely exceeding 120 °F for the mid-century and 125 °F by the
end of this century. Consequently, airports near urban centers are expected to have
relatively more heat-related disruptions.
218.6236.3
17.4
90.8
294.4
87.2
0
50
100
150
200
250
300
350
Low Medium High
2050
2100
Miles

Climate Change/Extreme Weather Vulnerability of Dallas/Tarrant County Infrastructure
___________________________________________________________________________
35
Figure 4.10. Critical airports vulnerable to heat risk in Dallas and Tarrant Counties (Year: 2100) with passenger boarding of major airports (DFWIA and Love Field; see Figure 3.9). Table 4.2. Critical airports vulnerable to heat risk in Dallas and Tarrant Counties
Airport Enplanement Summer Average Temperature (°F)
Current 2050 2100
Dallas Love Field Airport 4,023,779 84.92 89.30 96.59
NAS Fort Worth Joint Reserve Base
1072 84.35 88.69 96.05
DFW International Airport 29,038,128 83.71 88.11 95.40
Fort Worth Meacham International 2894 83.57 87.93 95.27
Fort Worth Alliance 1,348 83.41 87.84 95.09
Addison 616 83.17 87.62 94.87
Arlington Municipal 189 83.01 87.31 94.72
Higher temperatures and extreme heat waves may pose the following risks to airports:
Heat buckling of runways
Effect on aircraft lift potential (by changing the surface air density)

Climate Change/Extreme Weather Vulnerability of Dallas/Tarrant County Infrastructure
___________________________________________________________________________
36
Payload restrictions, flight cancellations, and service disruptions
Exceedances in air conditioning capacity; cooling system failures
Increased pavement burdens due to longer runway take-off distances
Because airports connect a wide range of locations (on a national and global scale), the
impact of climate change and weather events on aviation transportation is not restricted
to local weather extremes. It should be noted that extreme weather events or climate
stressors in other areas (other states or other countries) could also cause delays on
airports throughout the North Central Texas region as well.

Climate Change/Extreme Weather Vulnerability of Dallas/Tarrant County Infrastructure
___________________________________________________________________________
37
5. CONCLUSIONS
This Study provided a comprehensive assessment on the potential effects of extreme
weather and climate change on transportation infrastructure in Dallas and Tarrant
Counties. The vulnerability and risk of critical infrastructure assets (road, rail, and
aviation) was evaluated using a risk assessment matrix. Based on the analysis
conducted, it can be concluded that by the end of the 21st century:
There is a robust likelihood of level of service disruption and damage to
infrastructure assets by more extreme storms and higher precipitation leading to
an increase in flooding, particularly during the spring season. Due to the
projected increases in traffic volumes and passenger rail ridership, more critical
roadways and railroads are expected to be in the 100-year floodplain and may be
potentially vulnerable to future impacts.
There is a high likelihood of greater heat-related risks for multiple infrastructure
assets, particularly during the summer season. Due to the projected increases in
both temperature and mobility needs, more critical roadways and railroads are
expected to be at risk to heat-related damage and/or disruption.
To be proactive in both the preparation for and adaptation to increased weather-related
effects, it is imperative to link the findings of this Study to various engineering guidelines
for transportation infrastructure (range of normal operations or threshold of endurance)
and incorporate potential implications into future long-range transportation plans.
Based on the information provided there is a need to improve the monitoring of weather-
related stresses of the infrastructure (see Appendix A), enhance existing infrastructure
maintenance, and protect future infrastructure construction projects so that extreme
weather events cause less impacts to safe, effective, and efficient access and mobility.
As transportation network performance measures continue to be integrated into long-
range transportation planning efforts, additional points of data and analysis regarding
potential climate change effects/impacts will be of vital future importance to decision-
makers, particularly in a fast-growing region like North Central Texas where investment
choices and quality of life implications between increased maintenance and additional
capacity will need to be weighed considerably. With continuing uncertainties in the
availability of dedicated revenue sources for infrastructure over time, the ability for
NCTCOG to assist the region in developing and implementing such an all-inclusive
analysis provides greater transparency and accountability to help justify where, when,
and why those choices must be made.
Future investigations are required for a more accurate assessment of asset vulnerability
that can fully incorporate regionally relevant exposure, sensitivity, and adaptive capacity
measures. This will be necessary to determine exclusive risks/impacts for individual
Climate Change/Extreme Weather Vulnerability of Dallas/Tarrant County Infrastructure
___________________________________________________________________________
38
facilities, identify potential mitigation strategies, and set action priorities through
comparison of features with other needed projects. For example, employing the use of
temperature extremes and heat wave magnitudes could improve reasonability testing to
assess the vulnerability to heat risks. Precipitation can be more accurately projected by
using high-resolution radar precipitation data from the CASA project. Frequent data-
intensive monitoring of weather-related stresses and damages to infrastructure, and a
refined highly-downscaled weather prediction system could lead to a better regional
forecasting apparatus for extreme events. Proliferation in the use of three-dimensional
models, e.g. LiDAR, would significantly improve the vulnerability assessment of critical
infrastructure to severe flooding and make the results more spatially explicit and
reliable. These actions can help ensure that asset management and comprehensive
long-range transportation planning may strategically and effectively incorporate
weather-related risks/impacts into decision-making (see Appendix B), enable expanded
development of adaptation strategies based on priorities, and help prolong the
functionality and demand accommodations of the complex and continually evolving
transportation network for North Central Texas.

Climate Change/Extreme Weather Vulnerability of Dallas/Tarrant County Infrastructure
___________________________________________________________________________
39
6. REFERENCES
Baglin, C. NCHRP Synthesis 454: Response to Extreme Weather Impacts on
Transportation Systems: A Synthesis of Highway Practice. Transportation
Research Board of the National Academies, Washington, D.C., 2014, 52-58
Biging, S. G., J. D. Radke, and J. Lee, 2012: Impacts of Predicted Sea-Level Rise and
Extreme Storm Events on the Transportation Infrastructure in the San Francisco
Bay Region. [Available online http://www.energy.ca.gov/2012publications/CEC-
500-2012-040/CEC-500-2012-040.pdf]
Caracena, F., and M. W. Maier, 1987: Analysis of a microburst in the FACE
mesonetwork in southern Florida. Mon. Wea. Rev., 115, 969-985.
Cassou, C., L. Terray, and A. S. Phillips, 2005: Tropical Atlantic influence on European
heat waves. J. Climate, 18, 2805-2811.
Cook, B. I., R. L. Miller, and R. Seager, 2009: Amplification of the North American "Dust
Bowl" drought through human induced land degradation. Proc. Natl. Acad. Sci.,
106, 4997-5001, doi:10.1073/pnas.0810200106.
Dallas Area Rapid Transit (DART), 2014: DART Reference Book, version 5.1. May 2014
[Available Online https://www.dart.org/about/dartreferencebookmay14.pdf ]
Dong, X., B. Xi, A. Kennedy, Z. Feng, J. K. Entin, P. R. Houser, R. A. Schiffer, T.
L'Ecuyer, W. S. Olson, K.-L. Hsu, W. T. Liu, B. Lin, Y. Deng, and T. Jiang,
2011: Investigation of the 2006 drought and 2007 flood extremes at the
Southern Great Plains through an integrative analysis of observations. J.
Geophys. Res., 116, D03204, doi:10.1029/2010JD014776.
Dousset, B., F. Gourmelon, and E. Mauri, 2007: Application of satellite remote sensing
for urban risk analysis: a case study of the 2003 extreme heat wave in Paris.
Urban Remote Sensing Joint Event 2007, 11-13 April 2007, pp.1-5,
doi:10.1109/URS.2007.371849.
Emanuel, K. A., 2005: Increasing destructiveness of tropical cyclones over the past 30
years. Nature, 436, 686-688.
Emanuel, K. A., 2011: Global warming effects on U.S. hurricane. Wea. Clim. Soc., 3,
261-268.
Federal Highway Administration (FHWA), 2012: Climate Change & Extreme Weather
Vulnerability Assessment Framework [Available online:
http://www.fhwa.dot.gov/environment/climate_change/adaptation/publications_an
d_tools/vulnerability_assessment_framework/fhwahep13005.pdf ]
Federal Highway Administration (FHWA), 2014: Assessing Vulnerability and Risk of
Climate Change Effects on Transportation Infrastructure: Pilot of the Conceptual

Climate Change/Extreme Weather Vulnerability of Dallas/Tarrant County Infrastructure
___________________________________________________________________________
40
[available online
http://www.fhwa.dot.gov/environment/climate_change/adaptation/ongoing_and_c
urrent_research/vulnerability_assessment_pilots/conceptual_model62410.cfm ]
Federal Aviation Administration (FAA), 2014: Passenger Boarding (Enplanement) and
All-Cargo Data for U.S. Airports [Available online
http://www.faa.gov/airports/planning_capacity/passenger_allcargo_stats/passeng
er/]
Federal Aviation Administration (FAA), 2014: Runway length requirements for airport
design,Advisory Circular AC No: 150/5325-4B [Available online, 2014:
http://www.faa.gov/documentlibrary/media/advisory_circular/150-5325-
4b/150_5325_4b.pdf]
Fujita, T. T., 1985: DFW Microburst, The University of Chicago Press, 155 pp.
Hong, S.-Y., and E. Kalnay, 2002: The 1998 Oklahoma–Texas Drought: Mechanistic
Experiments with NCEP Global and Regional Models. J. Climate, 15, 945-963.
Howard, L., 1833: The Climate of London. Vols. 1-3. Harvey and Dorton, 1002 pp.
Houston Advanced Research Center, 2009: Dallas Urban Heat Island. Submitted to U.S.
EPA, March 2009 [Available online
http://www.harc.edu/sites/default/files/documents/projects/FinalReport.Summary.
pdf ]
IPCC, 2013: Climate Change 2013: The Physical Science Basis. Contribution of
Working Group I to the Fifth Assessment Report of the Intergovern- mental Panel
on Climate Change [Stocker, T.F., D. Qin, G.-K. Plattner, M. Tignor, S.K. Allen, J.
Boschung, A. Nauels, Y. Xia, V. Bex and P.M. Midgley (eds.)]. Cambridge
University Press, Cambridge, United Kingdom and New York, NY, USA, 1535 pp.
Knutson, T. R., and R. E. Tuleya, 2004: Impact of CO2- induced warming on simulated
hurricane intensity and precipitation: Sensitivity to the choice of climate model
and convective parameterization. J. Climate, 17, 3477–3495.
Köppen, W., 1936: Das geographische System der Klimate. Handbuch der Klimatologie.
Band 1, Teil C., W. Köppen, and R. Geiger, Eds., Gebr. Borntraeger, 1–44.
McCabe, G. J., M. A. Palecki, and J. L. Betancourt, 2004: Pacific and Atlantic ocean
influences on multidecadal drought frequency in the United States. Proc. of the
National Academy of Sciences, 101, 4137–4141.
Mitchell, T.D. 2004: Pattern Scaling: An Examination of the Accuracy of the Technique
for Describing Future Climates. Climatic Change, 60, 217–242
Mo, K. C., J. E. Schemm, and S. H. Yoo, 2009: Influence of ENSO and the Atlantic
multidecadal oscillation on drought over the United States. J. Climate, 22, 5962-
5982.

Climate Change/Extreme Weather Vulnerability of Dallas/Tarrant County Infrastructure
___________________________________________________________________________
41
Nielsen-Gammon, J. W., 2011: The changing climate of Texas. The impact of global
warming on Texas. G. R. North, J. Schmandt, J. Clarkson, Eds., University of
Texas Press, Austin, 39 -86.
Nielsen-Gammon, J. W., cited 2012: The 2011 Texas Drought: A Briefing Packet for the
Texas Legislature October 31, 2011. [Available on line:
http://climatexas.tamu.edu/files/2011_drought.pdf]
North Central Texas Council of Government (NCTCOG), 2013: Mobility 2035 – 2013
Update [Available online http://www.nctcog.org/trans/mtp/2035/index.asp ]
NWS Weather Forecast Office Dallas/Fort Worth, cited 2012: Dallas/Fort Worth -
Monthly and Annual Average Temperatures. [Available online
http://www.srh.noaa.gov/fwd/?n=dmotemp]
NWS Weather Forecast Office Dallas/Fort Worth, cited 2012: Dallas/Fort Worth -
Normals (1981-2010), Means, and Extremes [Available online
http://www.srh.noaa.gov/fwd/?n=dfwann]
Ortegren, J. T., 2008: Tree-ring based reconstruction of multi-year summer droughts in
Piedmont and Coastal Plain climate divisions of the southeastern U.S., PhD.
Thesis, 1690-2006, The University of North Carolina at Greensboro, 3316409,
112 pp.
Palmer, T. N., and C. Brankovic, 1989: The 1988 United States drought linked to
anomalous sea surface temperature. Nature, 338, 54–57.
Pielke, R. A. Jr., C. Landsea, M. Mayfield, J. Laver, and R. Pasch, 2005: Hurricanes
and Global Warming. Bull. Amer. Meteor. Soc., 86, 1571–1575.
Peel, M. C., B. L. Finlayson, and T. A. McMahon, 2007: Updated world map of the
Köppen-Geiger climate classification. Hydrol. Earth Syst. Sci., 11, 1633-1644.
Puppala, A. J. T. Manosuthkij, S. Nazarian, and L.R. Hoyos 2011:Threshold moisture
content and matric suction potentials in expansive clays prior to initiation of
cracking in pavements. Can. Geotech. J., 48, 519–531.
Savonis, M., V. Burkett, and J. Potter, 2008: Impacts of climate change and variability
on transportation systems and infrastructure: Gulf Coast study, Phase I.,
Washington, DC: U.S. Climate Change Science Program. Synthesis and
Assessment Product 4.7 [Available online
http://downloads.globalchange.gov/sap/sap4-7/sap4-7-final-all.pdf]
Seager, R., and G. Vecchi, 2010: Greenhouse warming and the 21st century
hydroclimate of southwestern North America. PNAS, 107, 21277-21282.
Stewart, I.D., 2011: A systematic review and scientific critique of methodology in
modern urban heat island literature. Int. J. Climatol. 31, 200-217, DOI:
10.1002/joc.2141.
Climate Change/Extreme Weather Vulnerability of Dallas/Tarrant County Infrastructure
___________________________________________________________________________
42
Texas AM Forest Service, cited 2015a: Preliminary estimates show hundreds of millions
of trees killed by 2011 drought. [Available online
http://texasforestservice.tamu.edu/main/default.aspx?dept=news&news_coll=arc
hive&year]
Texas AM Forest Service, cited 2015b: The Bastrop County Complex Fire (September
2011) [Available online
http://texasforestservice.tamu.edu/main/article.aspx?id=14740
http://ticc.tamu.edu]
Trenberth, K. E., G. W. Branstator, and P. A. Arkin, 1988: Origins of the 1988 North
American drought. Science, 242, 1640–1645.
Trenberth, K. E., and G. W. Branstator, 1992: Issues in establishing causes of the 1988
drought over North America. J. Climate, 5, 159–172.
Western Regional Climate Center; cited 2014: Phoenix, Arizona, normals, means, and
extremes. [Available online http:// http://www.wrcc.dri.edu]
World Meteorological Organization, cited 2012: World weather/climate extremes
[Available online http://wmo.asu.edu]
Winguth and Kelp,2013: The Urban Heat Island of the North-Central Texas Region and
Its Relation to the 2011 Severe Texas Drought. J. of Applied Meterology and
Climatology, 52, 2418-2433.
U.S. Drought Monitor Texas, cited 2012: [Available onlinehttp://droughtmonitor.unl.edu]
Zhu, L., S. M. Quiring, and K. A. Emanuel, 2013: Estimating tropical cyclone
precipitation risk in Texas. Geophys. Res. Lett., 40, 6225–6230,
doi:10.1002/2013GL058284.
Climate Change/Extreme Weather Vulnerability of Dallas/Tarrant County Infrastructure
___________________________________________________________________________
43
APPENDIX A
A.1. Street Maintenance Plan and Pavement Deterioration from the City Of Dallas
In assessing the vulnerability of transportation infrastructure to climate change and
extreme weather events, it is important to also discuss the linkages between
environmental impacts and the asset management process. While comprehensive
maintenance programs have long been a major component in the planning and
budgetary processes for government operations from the local to the federal level, it is
primarily in recent years where asset management has highlighted the significance of
lifecycle maximization, particularly in the face of increasing financial constraints that
have limited the scope and scale of needed infrastructure improvements (AASHTO,
2011). The City of Dallas, a primary partner in this Pilot Study, is just one of numerous
local governments in the North Central Texas region, Texas, and the country,
performing data collection and evaluation on a regular basis to extend and/or improve
the quality and lifespan of its major capital assets. Their experience illustrates that
climate change/extreme weather is just one variable of many that affects roadway
system performance, and like many other management systems, the focus is centered
primarily upon the data that is most readily available, calculable, and easiest to
communicate in terms of where and by how much desired performance levels are or are
not being maintained. This helps to address direct objectives for safety, level-of-
service, and state-of-good-repair, but it does not entirely address questions regarding
what impacts are most likely to affect performance levels, what severity are those
potential impacts, and why they are occurring. It underscores the importance from an
asset management standpoint of also attempting to achieve transportation system
resiliency simultaneously with other factors, and this process in itself can affect an
entity’s vulnerability and responsiveness to environmental factors such as climate
change.
The City of Dallas is the largest local jurisdiction by area and population of the more
than 230 member governments comprising the 16-county North Central Texas Council
of Governments’ (NCTCOG) region. With a total area of 385.8 square miles and a 2013
population estimate of 1,257,616 (U.S. Census Bureau, 2015), the City of Dallas
maintains a mature and complex roadway system to support the economic, mobility,
and accessibility needs of its large size and continually growing number of inhabitants
and visitors. In addition to the substantial amount of state and federally-maintained
roadways that pass into and/or across the City of Dallas, the local government is
responsible for approximately 11,700 lane-miles of streets (City of Dallas, 2014),
including 444 lane-miles of arterials (high-capacity roads), 4,507 lane-miles of collectors
(low- to moderate-capacity roads), and 5,327 lane-miles of local facilities (streets for
direct residential or business access). These figures are similar in quantity to other U.S.

Climate Change/Extreme Weather Vulnerability of Dallas/Tarrant County Infrastructure
___________________________________________________________________________
44
cities such as San Jose, Phoenix, Detroit, Indianapolis, and Miami/Dade County (City of
Dallas, 2014).
Like many major cities throughout the country, the City of Dallas has built and
maintained its streets to support a typical life-expectancy ranging from twenty to fifty
years. Variables that can influence this range of functionality include pavement design,
traffic loads, soil conditions, weather/precipitation patterns, and maintenance schedules.
High travel demands and a large extent of responsibility has required the City of Dallas
to make extensive investments over time in maintaining the quality and functionality of
its roadway system. Beginning in 1975, the city relied primarily on routine visual
inspections by trained staff to evaluate street conditions (City of Dallas, 2014). Through
the years, daily ratings of streets were found to be typically subjective in nature, and by
2008 a more robust and objective system of inspections was implemented. This
involved the development of a 24-month review cycle utilizing city-owned vehicles called
Data Collection Vans (City of Dallas, 2014). With equipment such as recording
cameras, lasers for crack detection, laser profilers for roughness detection, ground-
penetrating radar to determine subsurface conditions, and use of visual surveys by a
two-person team to confirm and supplement the mechanical readings, the vehicles
enabled the city to record repeatable ratings for its streets consistent with the American
Society for Testing and Materials (ASTM) International standards for Pavement
Condition Index (PCI).
PCI ratings for streets are based on the extent and severity of pavement distress. This
may consist of a variety of features such as roughness and low ride quality; longitudinal
or transverse cracking within pavement blocks and/or edges, joint reflections; swelling
and/or sagging which can cause rutting and/or potholes; and, patching discontinuities
from actions such as utility cuts (Pierce et al., 2013). The City of Dallas uses assigned
letter grades based on ranges of PCI from A (best) to E (worst) to identify the level of
distress for each evaluated street section (approximately 200,000 points of direct
measurement), and the data is recorded into a database system for supplementary
storage and analysis (City of Dallas, 2014). The database system is then applied as a
measurement tool to establish baseline settings for current street conditions, determine
the effectiveness of regular maintenance operations over time, examine changes in
roadway deterioration rates, and identify potential activities and quantities needed to
achieve specific performance goals across defined geographic areas. This process
enables elected officials and their constituents to readily evaluate constraints that can
impact performance limits for street conditions and better regulate budget
considerations for maintenance investments which can have a direct influence on the
city’s economic vitality and quality of life.
In 2006, the Dallas City Council adopted street condition goals to set a lane-mile
satisfactory rating of 87% citywide, and a minimum satisfactory rating of 80% across
each of the fourteen City Council Districts (McDaniel, 2014). This goal was set as the

Climate Change/Extreme Weather Vulnerability of Dallas/Tarrant County Infrastructure
___________________________________________________________________________
45
result of completion of the city’s 2006 bond program in conjunction with a recently
enhanced operations and maintenance program. Information from the database system
had shown the city had made significant strides throughout the 1990’s and early 2000’s
to attain the 87% performance goal after many years below previous standards (Fig.
A.1). However, several factors contributed together to create a reversal of the trend
shortly after the 2006 goal was set (City of Dallas, 2014):
The worldwide economic recession that occurred between 2008 and 2012
caused substantial budget changes for various departments throughout the city,
and it led to increased amounts of deferred maintenance projects.
Development and implementation of a more precise condition rating system
beginning in 2010 identified that the overall number of street sections meeting
the satisfactory rating was actually lower than previous measured.
Despite the economic recession, the Dallas-Fort Worth Metropolitan Area
(including the City of Dallas) continued to grow at faster rate than all
metropolitan regions nationwide contributing to increased traffic and vehicle-
miles of travel on the thoroughfare system.
In addition to observations indicating the difficulty for the City of Dallas to maintain the
87% satisfactory rating goal, comparisons with deterioration rates of various roadway
Figure A.1. Trends and projections of the City of Dallas street condition (McDaniel, 2014). Future projections are based on currently budgeted operation and maintenance budget.

Climate Change/Extreme Weather Vulnerability of Dallas/Tarrant County Infrastructure
___________________________________________________________________________
46
a) Deterioration of Concrete Streets of the City of Dallas
b) Deterioration of Asphalt Streets of the City of Dallas
Figure A.2. Comparison of street deterioration for a) concrete and b) asphalt streets
between the City of Dallas and national surveys (City of Dallas, 2014)
types from national data illustrated that the city’s streets were deteriorating at a faster
pace than other localities. City of Dallas PCI ratings for both concrete and asphalt-
Climate Change/Extreme Weather Vulnerability of Dallas/Tarrant County Infrastructure
___________________________________________________________________________
47
based streets diverged substantially lower than similar facilities from other cities,
particularly beyond a horizon span of between fifteen to twenty-five years of age (Fig.
A.2). This translated to functional lifespan for various streets ranging from five to ten
years less than those of other locations. According to a presentation given to the 15th
Annual S.A.M.E. Infrastructure Forum in December 2014, officials from the City of
Dallas postulated that the reasons for the faster deterioration rate resulted from the
following (City of Dallas, 2014):
Decreased city spending on non-essential services, including street
maintenance.
National data that averages multi-city PCI ratings is updated on a five-year cycle,
and the information may not have fully absorbed the widespread effects of the
economic recession and impacts to government spending.
Specific pavement measures and emphasis on factors that vary to some degree
from city to city.
Unique factors such as construction or maintenance practices, environmental
issues, and street usage that may not be fully quantified and/or normalized for
equal comparisons.
For the previous fiscal year (FY 2014), the City of Dallas determined the overall
pavement rating stood at just under 80%, with projections that the rate would fall to as
low as 73.5% within four years (City of Dallas, 2014). The city estimated that
approximately $900 million in dedicated funds would be required over the next four
years to return ratings to the 87% goal, however, the City Council only managed to
approve $36 million in maintenance funds for FY 2015 (it should be noted that other City
departments also allocate funds toward public works and street maintenance, but the
combined resources still fall short of estimated needs). Yet, the available funds were
increased by 13% over the previous year to include major maintenance for high-traffic
streets, judged to be a cost-effective strategy that would defer even greater capital costs
in the future for potential reconstruction (McDaniel, 2014). This situation reflects an
often-repeated pattern for many municipalities nationwide who, according to the
American Society for Civil Engineers’ 2013 Infrastructure Report Card, are seeing
increased visual and functional examples of deteriorating transportation facilities but are
more greatly constrained in the financial resources necessary to make substantial
improvements (ASCE, 2013).
It is plausible to conclude that a partial cause for increased street deterioration in the
City of Dallas is due to some of the recent impacts of climate change, extreme weather,
and urban heat island effects outlined within this report. Major events like the ongoing
drought from 2010 and the extreme heat during the summer of 2011, combined with
widespread extent of high-plasticity soils within the city and their enhanced effects on
shifting due to changing soil moisture conditions (Fig. A.3), can certainly contribute
additional stresses to roadway performance and maintenance effectiveness (USDA,

Climate Change/Extreme Weather Vulnerability of Dallas/Tarrant County Infrastructure
___________________________________________________________________________
48
2014). Unfortunately, despite the robustness of the database system and its
capabilities for the cataloging and manipulation of numerous points of data, it is
currently not configured in such a way to indicate that extreme weather effects are a
direct cause to specific street section degradation or failures (Jordan, 2014).
Also, some weather events can be highly localized in nature, and for a jurisdiction as
large as the City of Dallas, the timely and detailed recording of explicit impacts may be
difficult to achieve on a regular basis. More data collection and analysis is needed to
identify particular impacts resulting from special events, examine if/when/how design
and performance thresholds were exceeded based on the type of event in question, set
benchmark conditions in order to validate and compare data with other municipalities,
and determine measurable quantities in materials and time expended solely for
weather-related maintenance compared to other work types. These are important
considerations for the future to ensure that ongoing capital development and
maintenance programs, both locally in the City of Dallas and nationwide among other
typical government entities, can bring more resources to bear in combating all potential
variables that simultaneously impact effective asset management and affect
vulnerability to climate change factors.
Figure A.3. Soil plasticity map for Tarrant and Dallas Counties (USDA, 2014).
1
ExamplesofUsefulDataSetsDrought-andHeat-SensitiveSoils(USDASoilTypes)
Climate Change/Extreme Weather Vulnerability of Dallas/Tarrant County Infrastructure
___________________________________________________________________________
49
A.2. References
American Association of State Highway and Transportation Officials, 2011: AASHTO
Transportation Asset Management Guide – A Focus on Implementation
(Executive Summary). Publication No, FHWA-HIF-13-047, 7.
American Society of Civil Engineers (ASCE), 2013: 2013 Report Card for America’s
Infrastructure. [Available online:
http://www.infrastructurereportcard.org/a/documents/2013-Report-Card.pdf]
City of Dallas2014: City of Dallas: Use of Street Assessment Tolls to Select Capital
Project. December 4, 2014. 15th Annual S.A.M.E. Infrastructure Forum. Arlington,
TX.
Jordan, J., 2014: Status of Street Condition and Repair Work. April 2, 2014. Dallas City
Council, Dallas, TX.
McDaniel, M., 2014: Current Year Street Maintenance Plan. December 3, 2014. Dallas
City Council, Dallas, TX.
Pierce, L. M., McGovern, G., and Zimmerman, K. A., 2013: Practical Guide for Quality
Management of Pavement Condition Data Collection, Contract No, DTFH61-07-
D-00028, 12.
United States Census Bureau, 2015: American Factfinder. Geographic Identifiers: 2010
Demographic Profile Data (G001): Dallas (city), Texas. Retrieved January 23,
2015.
United States Department of Agriculture (USDA), 2015: Natural Resources
Conservation Service Geospatial Data Gateway. Hydric Soils – North Central
Texas Council of Governments Metropolitan Planning Area Map. Retrieved
January 22, 2014.
Climate Change/Extreme Weather Vulnerability of Dallas/Tarrant County Infrastructure
___________________________________________________________________________
50
APPENDIX B.
B.1. Dallas Area Rapid Transit (DART) Severe Weather Action Plan
This Pilot Study has highlighted recent occurrences where extreme weather events
have impacted transportation infrastructure and provider services throughout North
Central Texas, and it suggests that the region will become more vulnerable to potential
damage and/or disruptions under projected climate change patterns up through the end
of the 21st century. The frequency and intensity of various extreme weather occurrences
have prompted some local governments and transportation providers to develop
dedicated mitigation and/or contingency plans to outline how appropriate operations and
maintenance processes should proceed. As one of the Dallas-Fort Worth (DFW)
Metropolitan Area’s primary transit providers, Dallas Area Rapid Transit (DART)
developed a Severe Weather Action Plan (SWAP) in February 2008 to define roles,
responsibilities, equipment, and supply requirements for the agency’s operating
divisions essential for personnel to respond and allocate resources in the most effective
manner (DART, 2015). The SWAP endured its most significant test to date during the
major winter storm event of December 5-7, 2013.
This extreme weather event was unusual in that after a combination of freezing rain,
sleet, and snow fell with accumulations of up to five inches in some locations during the
first 24 hours, daily maximum temperatures remained continuously below the freezing
point for just over 60 hours (National Weather Service, 2014). Even for five days after
the onset of the storm, when daily maximum temperatures were slightly above the
freezing point, daily minimum temperatures at night were still below the freezing point,
so that many locations in the northern portion of the DFW area had lingering icy
conditions (Fig. B.1). Some of the major regional impacts from this storm on Tarrant and
Dallas County infrastructure included the following (National Weather Service, 2014):
As many as 275,000 customers were without electricity at the peak of the storm
Most schools, particularly in the most severe impacted areas, were closed for
several days
Thousands of local businesses were forced to close for up to two days
Hundreds of flights were cancelled at Dallas-Fort Worth International Airport
(DFWIA) and Dallas Love Field Airport leaving thousands of flyers stranded at
these airports
Seven fatalities, including four in vehicles, two from exposure, and one from a fall
on the ice
Hundreds of injuries were reported due to falls on the ice
Over $30 million in residential insured losses according to the Insurance Council
of Texas
Recurring combination of vehicle compaction, melting/re-freezing, and various
treatment applications resulted in the development of “cobblestone ice” causing
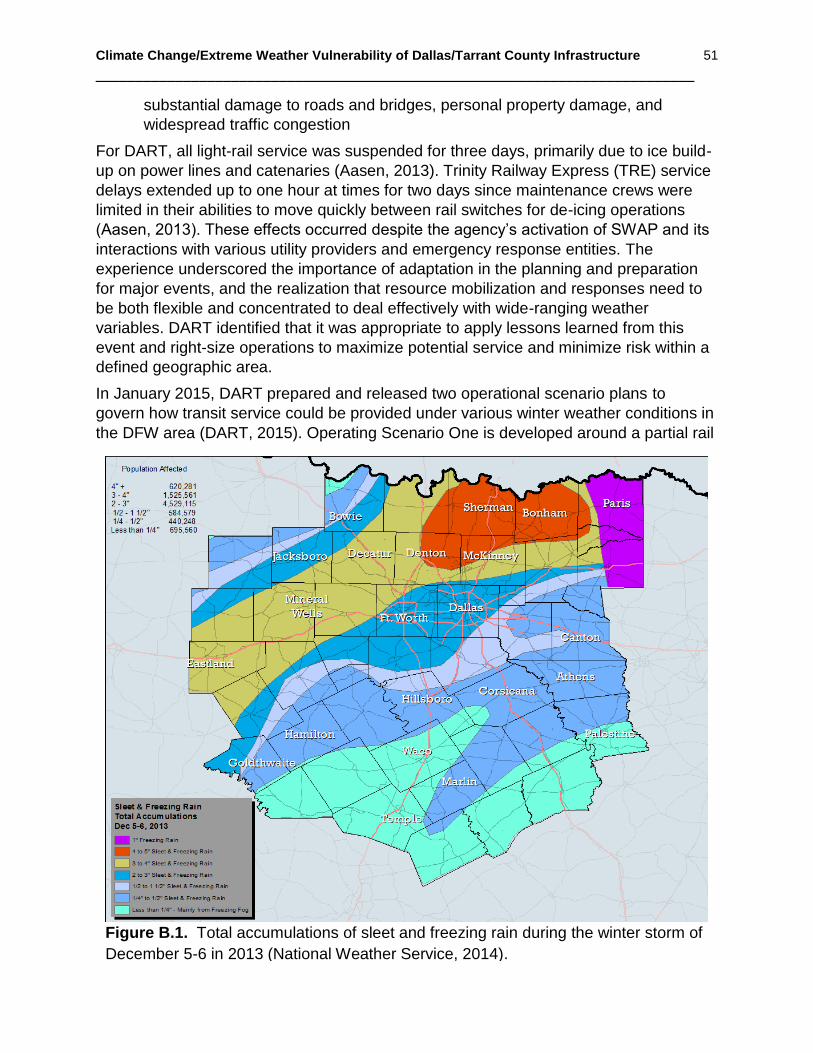
Climate Change/Extreme Weather Vulnerability of Dallas/Tarrant County Infrastructure
___________________________________________________________________________
51
substantial damage to roads and bridges, personal property damage, and
widespread traffic congestion
For DART, all light-rail service was suspended for three days, primarily due to ice build-
up on power lines and catenaries (Aasen, 2013). Trinity Railway Express (TRE) service
delays extended up to one hour at times for two days since maintenance crews were
limited in their abilities to move quickly between rail switches for de-icing operations
(Aasen, 2013). These effects occurred despite the agency’s activation of SWAP and its
interactions with various utility providers and emergency response entities. The
experience underscored the importance of adaptation in the planning and preparation
for major events, and the realization that resource mobilization and responses need to
be both flexible and concentrated to deal effectively with wide-ranging weather
variables. DART identified that it was appropriate to apply lessons learned from this
event and right-size operations to maximize potential service and minimize risk within a
defined geographic area.
In January 2015, DART prepared and released two operational scenario plans to
govern how transit service could be provided under various winter weather conditions in
the DFW area (DART, 2015). Operating Scenario One is developed around a partial rail
Figure B.1. Total accumulations of sleet and freezing rain during the winter storm of
December 5-6 in 2013 (National Weather Service, 2014).

Climate Change/Extreme Weather Vulnerability of Dallas/Tarrant County Infrastructure
___________________________________________________________________________
52
shutdown (Fig. B.2) allowing limited operations between rail stations inside the
Interstate Highway (I.H.) 635 loop. Shuttle bus routes would operate to connect
travelers between rail stations outside the loop. Operating Scenario Two describes a full
rail shutdown. In that case, only bus service would be available for travel to/from all
light-rail stations and park-and-ride facilities. DART has indicated that internet, social
media, and conventional media outlets can be sent implementation notices of either
plan as much as six to eight hours prior to the start of service for each day of potential
disruption, allowing for both sufficient public awareness and a more efficient deployment
of staff and resources to help simultaneously maintain service and combat potential
infrastructure impacts.
Extreme weather events will continue to provide significant challenges toward
infrastructure maintenance and service optimization. DART’s severe weather alert plan
with alternate operational scenarios in the activation of its SWAP illustrates how
vulnerability and risk can be mitigated through the continuous evaluation of current
extreme weather condition, thus allocating necessary resources for these events. This
is a critical consideration in determining the overall level of asset exposure and
sensitivity to potential extreme weather and climate change. It highlights the need to
ensure that infrastructure monitoring and action planning are comprehensively linked
and implemented together.
Figure B.2. Map of DART light-rail network operating under Operating Scenario One
conditions (DART, 2015)
Climate Change/Extreme Weather Vulnerability of Dallas/Tarrant County Infrastructure
___________________________________________________________________________
53
B.2. References
Aasen, E., 2013. Ice Blog Recap: As North Texas Warms Up, Costs of Storm Pile Up;
Another Blast of Arctic Air Coming? KERA News. December 12, 2013.
Ball, M.A. and Lyons, M., 2015. DART Sets Plans for Severe Winter Weather. Dallas
Area Rapid Transit. January 13, 2015 [Available online
http://www.dart.org/riding/winterweather.asp]
National Weather Service, 2014. North Texas Winter Storm – December 5-7, 2013
Special Report, Dallas/Fort Worth Weather Forecast Office.