Embed Size (px)
Citation preview
Climate Change Workshop – BAESI – 5th Nov. 2011© Chevron 2011 1
Sea ice extent
1979-2000 mean20072008
Julienne Stroeve, National Snow and Ice Data Center, 2010
Climate Change Workshop – BAESI – 5th Nov. 2011© Chevron 2011 2
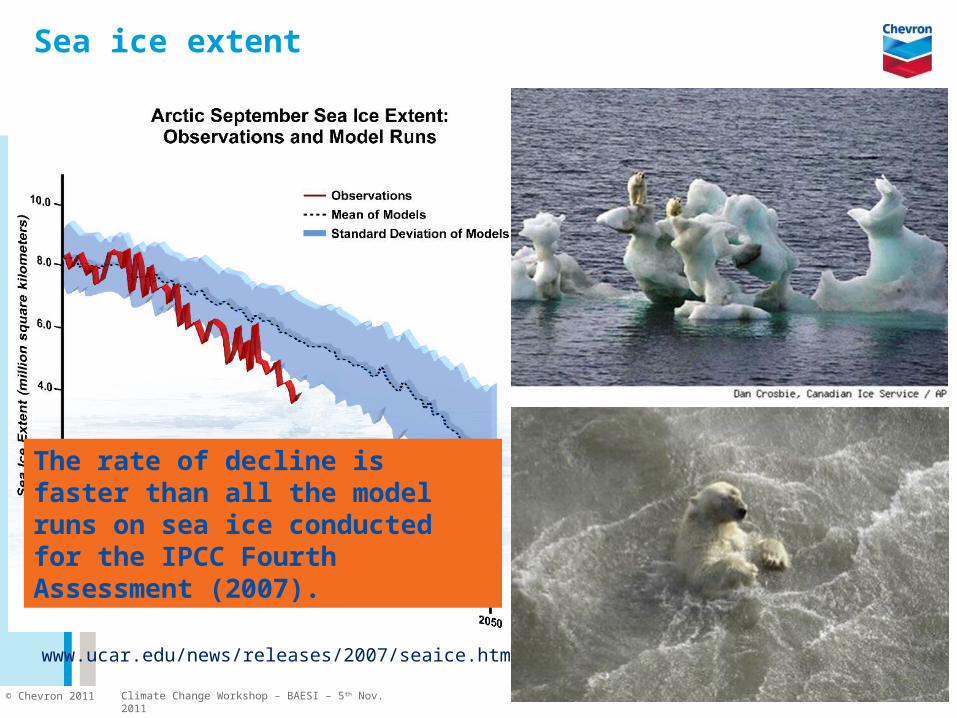
Sea ice extent
This figure illustrates the extent to which Arctic sea ice is melting faster than projected by computer models. The dotted line represents the average rate of melting indicated by computer models, with the blue area indicating the spread among the different models (shown as plus/minus one standard deviation). The red line shows the actual rate of Arctic ice loss based on observations. The observations have been particularly accurate since 1979 because of new satellite technology. (Illustration by Steve Deyo, ©UCAR, based on research by NSIDC and NCAR
www.ucar.edu/news/releases/2007/seaice.html
The rate of decline is faster than all the model runs on sea ice conducted for the IPCC Fourth Assessment (2007).
Climate Change Workshop – BAESI – 5th Nov. 2011© Chevron 2011 3
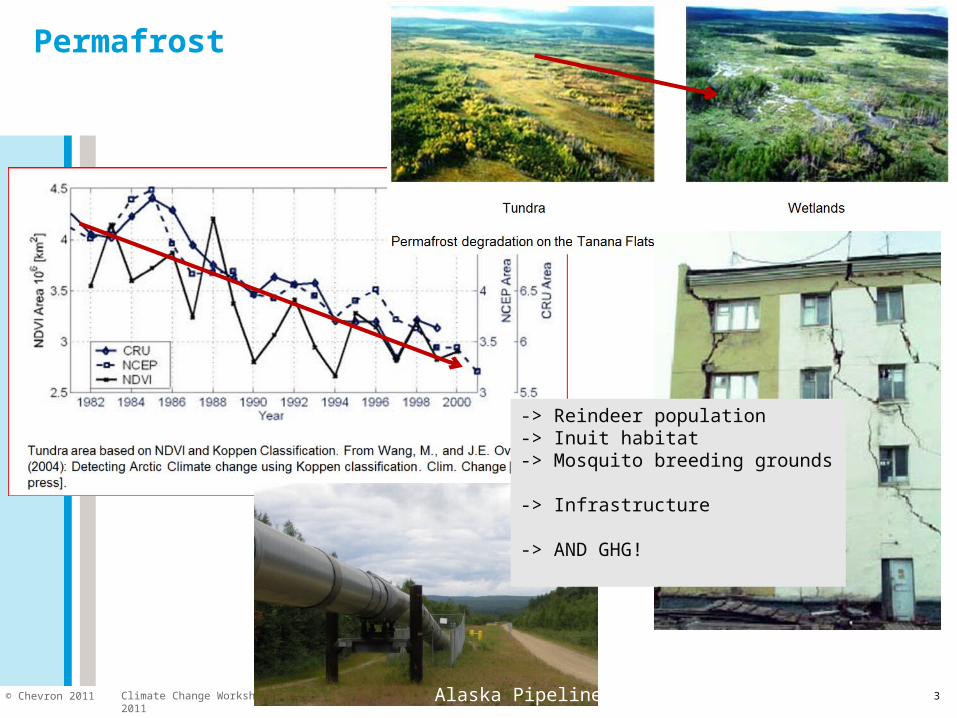
Permafrost
Alaska Pipeline
-> Reindeer population-> Inuit habitat-> Mosquito breeding grounds
-> Infrastructure
-> AND GHG!
Climate Change Workshop – BAESI – 5th Nov. 2011© Chevron 2011 4
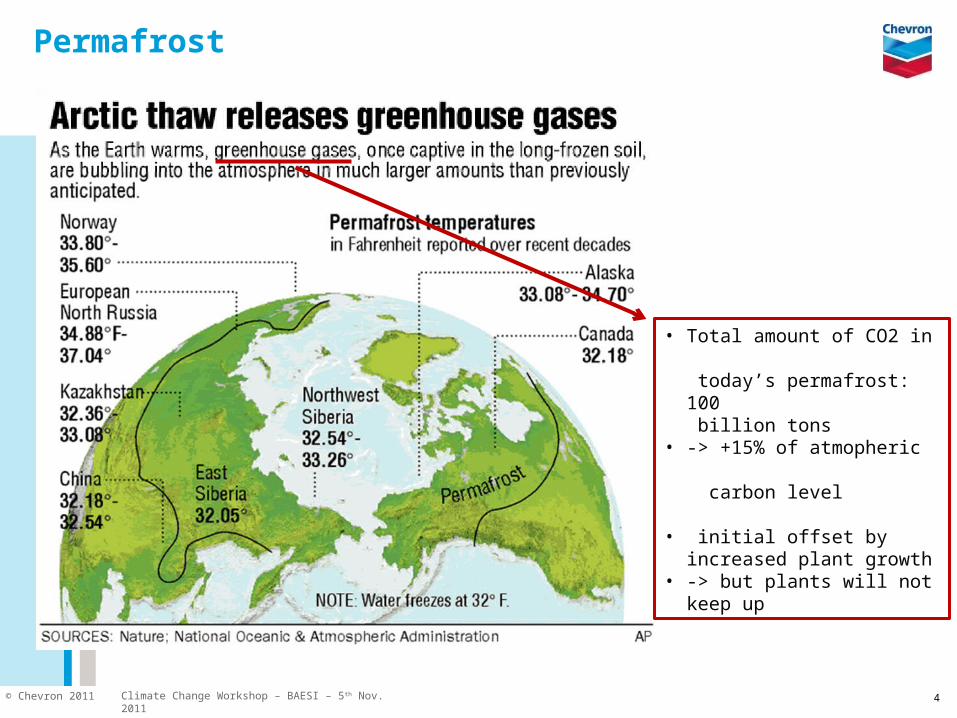
Permafrost
• Total amount of CO2 in today’s permafrost: 100 billion tons
• -> +15% of atmopheric carbon level
• initial offset by increased plant growth
• -> but plants will not keep up
Climate Change Workshop – BAESI – 5th Nov. 2011© Chevron 2011
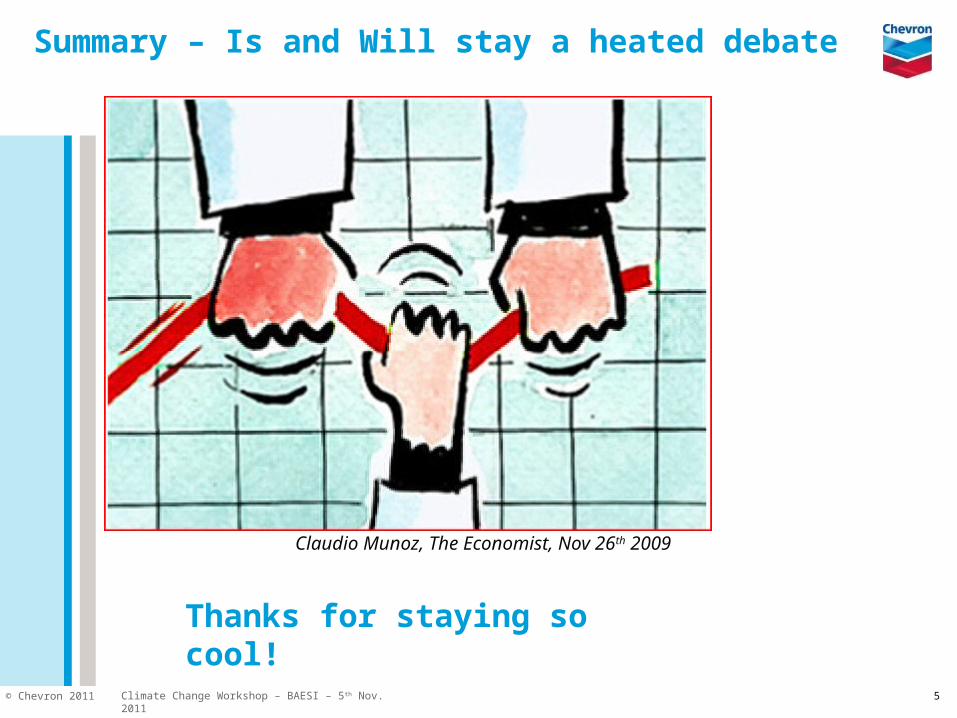
Summary – Is and Will stay a heated debate
5
Claudio Munoz, The Economist, Nov 26th 2009
Thanks for staying so cool!