Embed Size (px)
Citation preview
Puerto RicoDepartment of Natural and Environmental Resources
Climate Change Vulnerability Assessment and Adaptation Strategies
Ernesto L. Díaz, M.S., EEMMarine Scientist - Director
2012
OVERVIEW
1. Puerto Rico Coastal Zone Management Program.2. Climate variability and change in Puerto Rico.3. Puerto Rico Climate Change Council.4. Vulnerability Assessment5. Future Scenarios and Adaptation Strategies.6. Challenges (Planning, Design, Coastal
Development and Biodiversity Conservation).
Ernesto L. Díaz 2012
PRCZMP
The Puerto Rico Coastal Zone Management Program1
is a partnership led by the Department of Natural and Environmental Resources to promote the protection, conservation and sustainable development of coastal and marine areas and resources.
1. Adopted by Government of Puerto Rico and NOAA in 1978
Ernesto L. Díaz 2012
Goals and objectives:
Guide public and private development in the coastal zone Conduct active management of coastal and marine
resources. Foster scientific research, environmental education and public participation as key elements of sustainable development.
Ernesto L. Díaz 2012

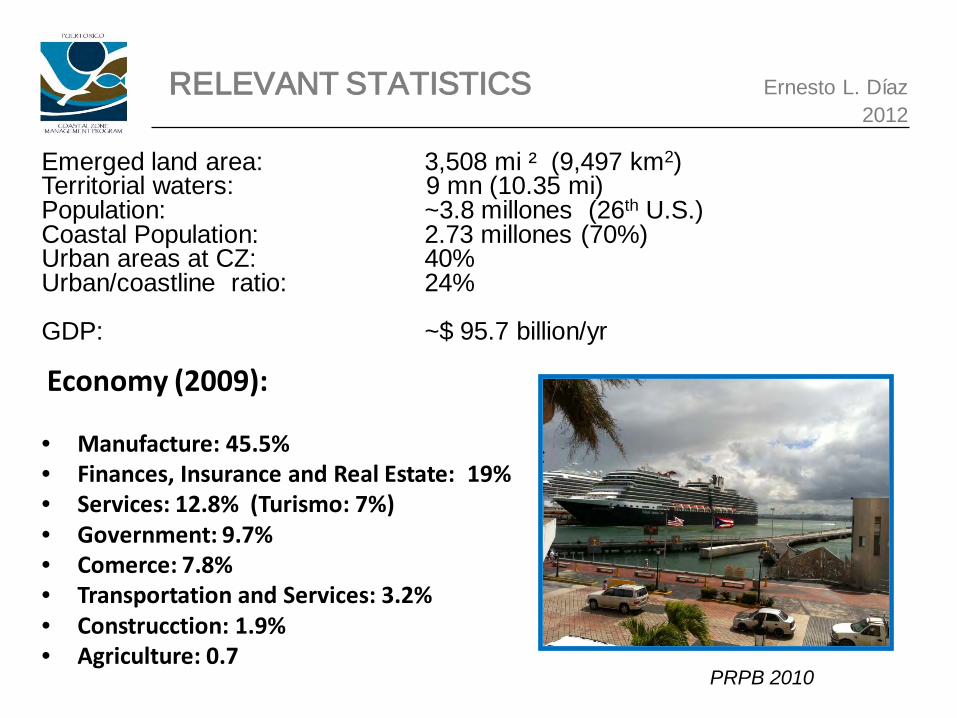
RELEVANT STATISTICS Ernesto L. Díaz2012
Emerged land area: 3,508 mi ² (9,497 km2) Territorial waters: 9 mn (10.35 mi)Population: ~3.8 millones (26th U.S.) Coastal Population: 2.73 millones (70%)Urban areas at CZ: 40% Urban/coastline ratio: 24%
GDP: ~$ 95.7 billion/yr
Economy (2009):
• Manufacture: 45.5%• Finances, Insurance and Real Estate: 19%• Services: 12.8% (Turismo: 7%)• Government: 9.7%• Comerce: 7.8%• Transportation and Services: 3.2%• Construcction: 1.9%• Agriculture: 0.7
PRPB 2010
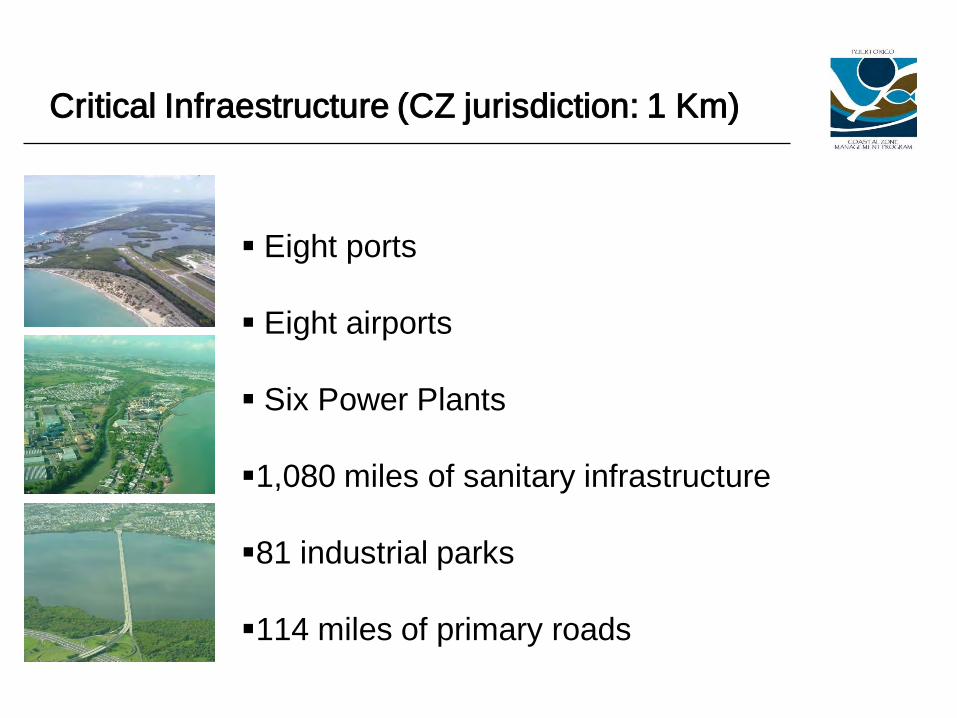
Eight ports
Eight airports
Six Power Plants
1,080 miles of sanitary infrastructure
81 industrial parks
114 miles of primary roads
Critical Infraestructure (CZ jurisdiction: 1 Km)
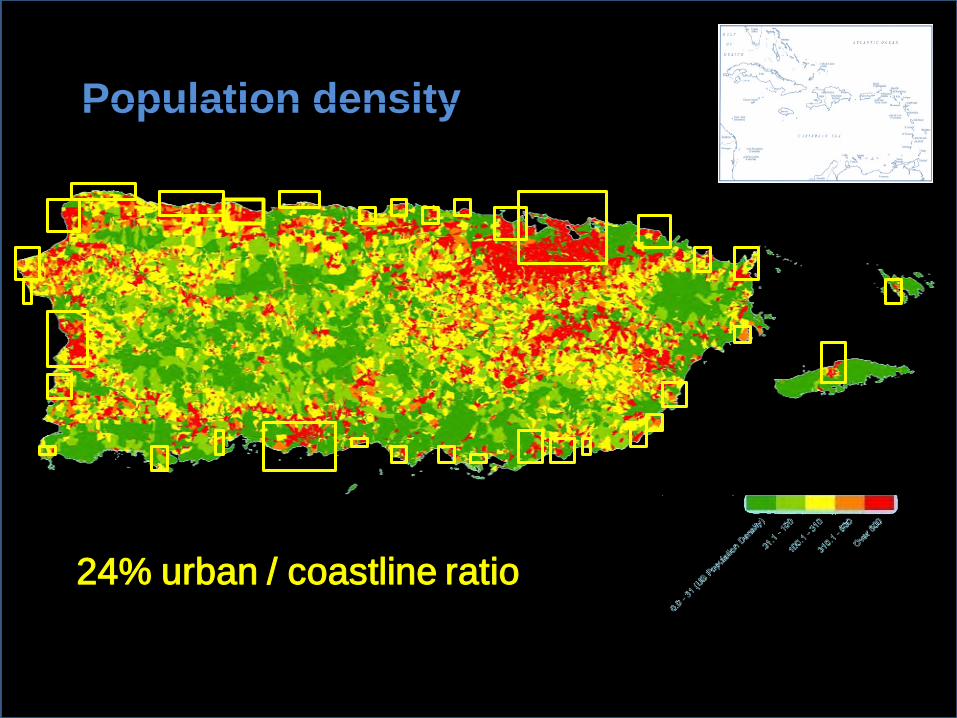
Population density~3.9 millones
24% urban / coastline ratio
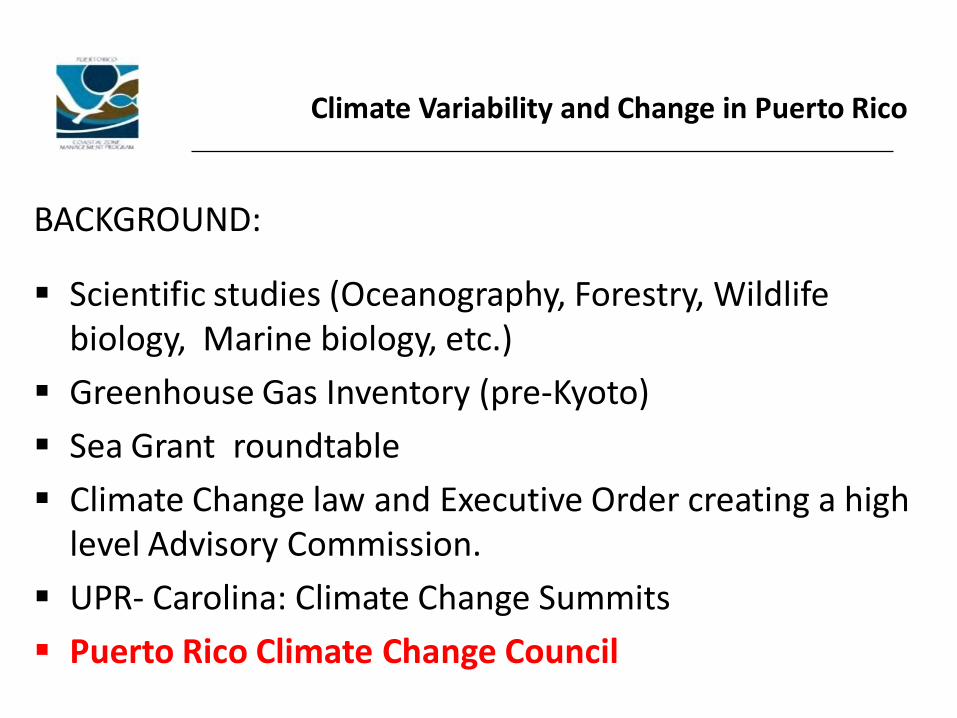
Climate Variability and Change in Puerto Rico
BACKGROUND:
Scientific studies (Oceanography, Forestry, Wildlife biology, Marine biology, etc.)
Greenhouse Gas Inventory (pre-Kyoto)
Sea Grant roundtable
Climate Change law and Executive Order creating a high level Advisory Commission.
UPR- Carolina: Climate Change Summits
Puerto Rico Climate Change Council
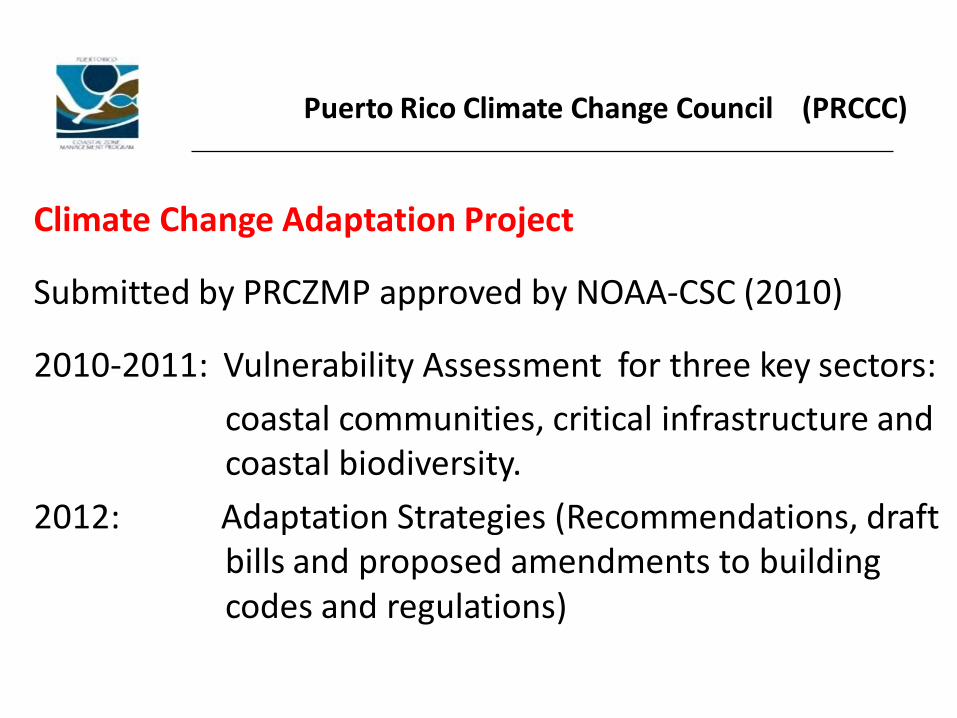
Puerto Rico Climate Change Council (PRCCC)
Climate Change Adaptation Project
Submitted by PRCZMP approved by NOAA-CSC (2010)
2010-2011: Vulnerability Assessment for three key sectors:
coastal communities, critical infrastructure and coastal biodiversity.
2012: Adaptation Strategies (Recommendations, draft bills and proposed amendments to building codes and regulations)
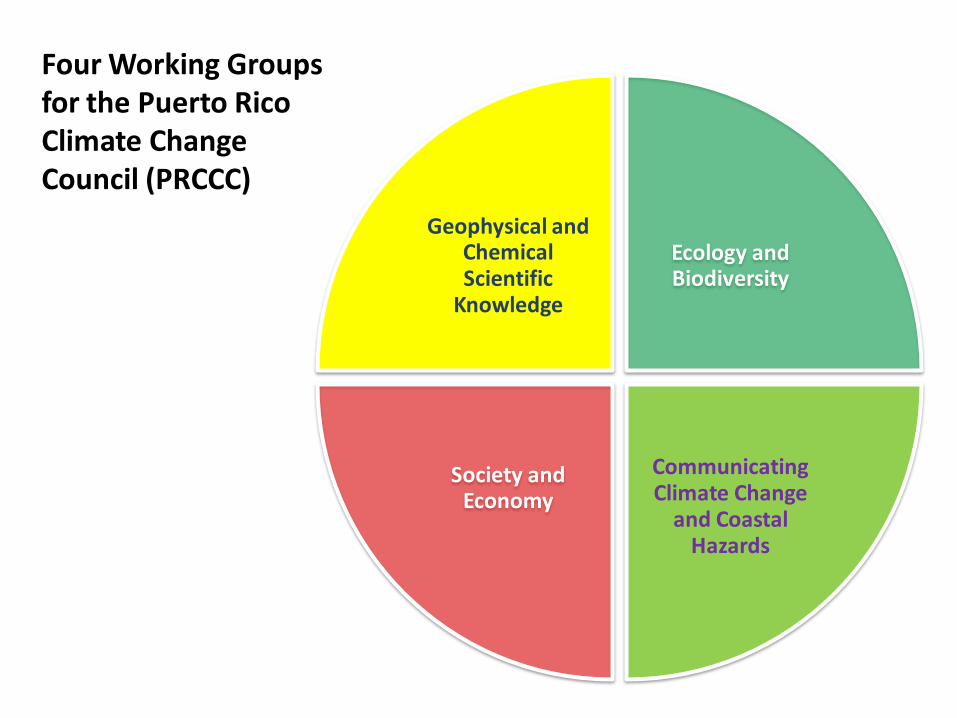
Geophysical and Chemical Scientific
Knowledge
Ecology and Biodiversity
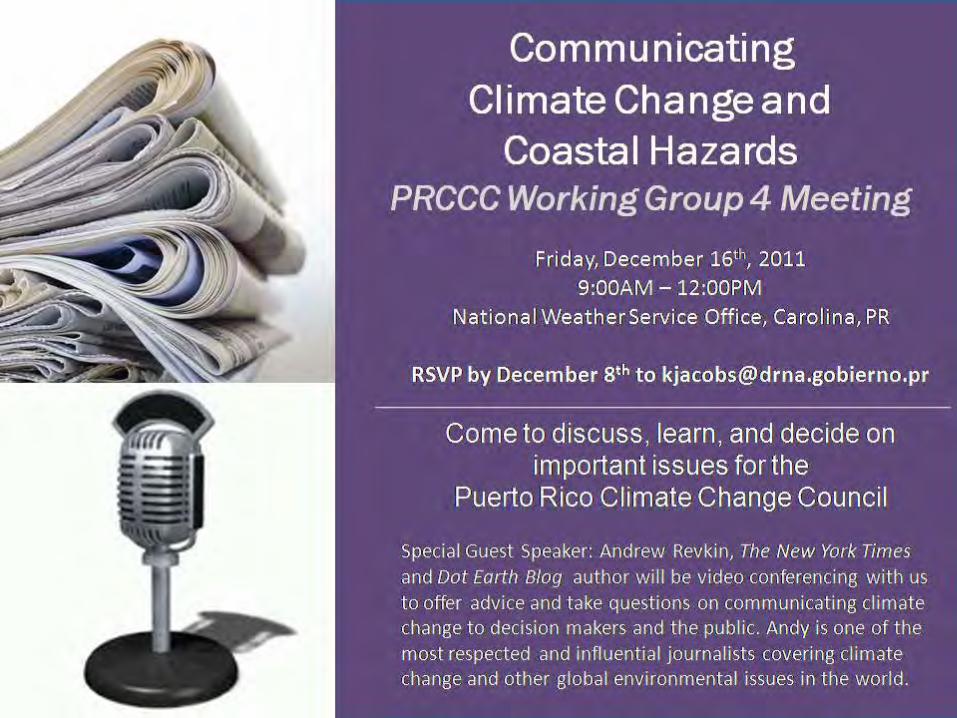
Communicating Climate Change
and Coastal Hazards
Society and Economy
Four Working Groups for the Puerto Rico Climate Change Council (PRCCC)
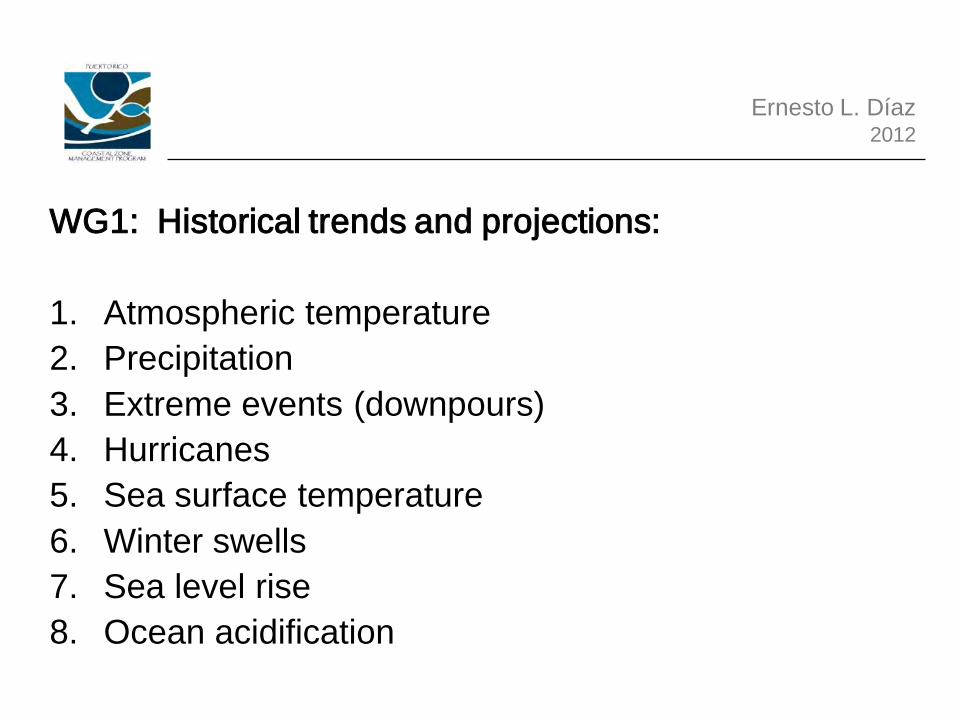
WG1: Historical trends and projections:
1. Atmospheric temperature2. Precipitation3. Extreme events (downpours)4. Hurricanes 5. Sea surface temperature6. Winter swells7. Sea level rise8. Ocean acidification
Ernesto L. Díaz 2012
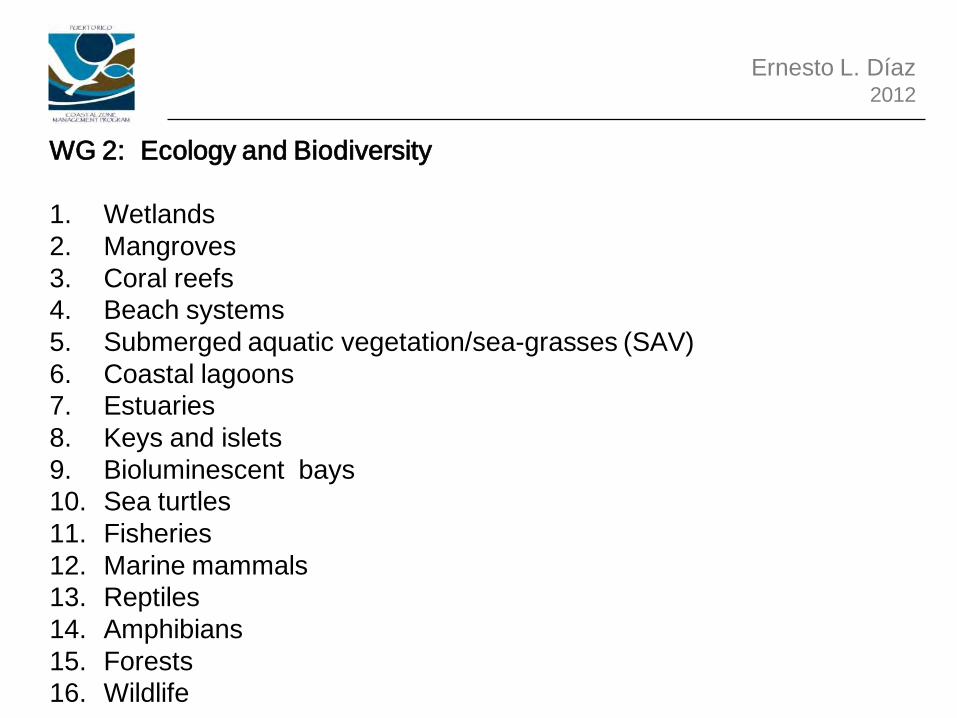
WG 2: Ecology and Biodiversity
1. Wetlands2. Mangroves3. Coral reefs4. Beach systems5. Submerged aquatic vegetation/sea-grasses (SAV)6. Coastal lagoons7. Estuaries8. Keys and islets9. Bioluminescent bays10. Sea turtles11. Fisheries12. Marine mammals13. Reptiles14. Amphibians15. Forests16. Wildlife
Ernesto L. Díaz 2012

WG 3: Economy and Society
1. Economic development2. Energy3. Tourism4. Industry5. Agriculture 6. Infraestructure7. Coastal communities resiliency8. Water resources9. Historical and cultural resources10. Emergency management11. Health
Ernesto L. Díaz 2012
2/2/2012 16
WG 4
Communicating climate change and coastal hazards
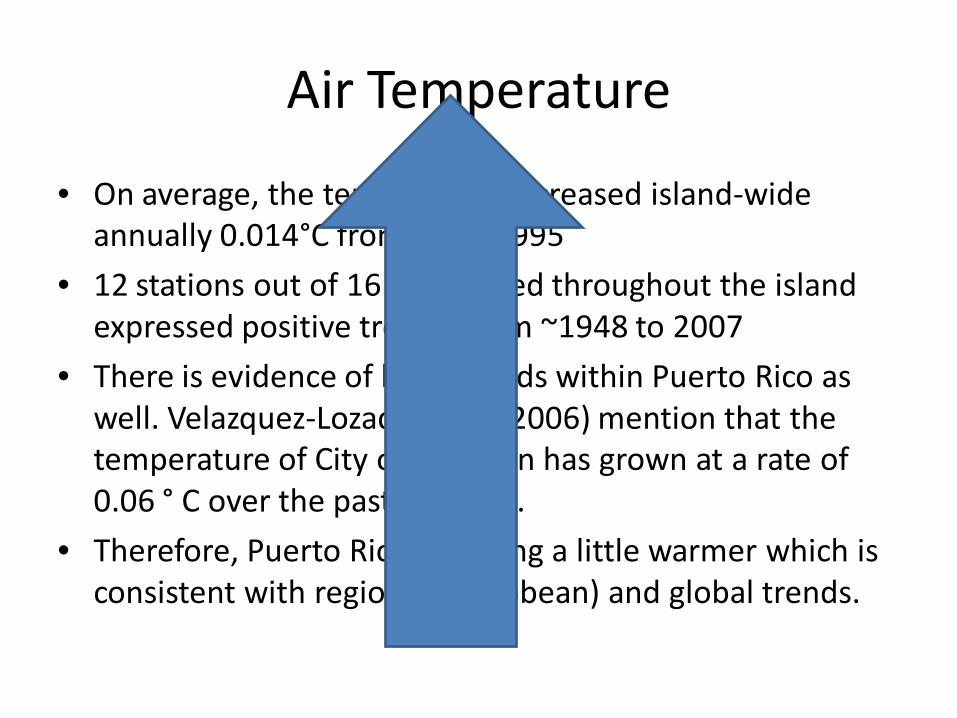
Air Temperature
• On average, the temperature increased island-wide annually 0.014°C from 1970-1995
• 12 stations out of 16 (75%) used throughout the island expressed positive trends from ~1948 to 2007
• There is evidence of heat islands within Puerto Rico as well. Velazquez-Lozada et al. (2006) mention that the temperature of City of San Juan has grown at a rate of 0.06 ° C over the past 40 years.
• Therefore, Puerto Rico is getting a little warmer which is consistent with regional (Caribbean) and global trends.

Precipitation
• Analysis dates (roughly 1948 to 2007): • Results of trend analysis show no clear trends can be established
concerning the total annual rainfall at the island, since many stations show increased (14 stations), others show a decrease (12 stations) and some do not reflect trends.
• Even though a single standard for the whole island cannot be determined, slight changes in spatial distribution of rainfall can.
• Southern region expressed positive trends in annual rainfall. • Western region expressed negative trends in annual rainfall• North-central regions and east of the island – no clear pattern.• There are observed seasonal trends. Summer rainfall has expressed
negative trends in almost 25 out of 36 stations (70%) with no significant changes in autumn and spring.
Sout
hern
Reg
ion
of P
R
Wes
tern
Reg
ion
of P
R
Nor
thea
st a
nd E
aste
rn
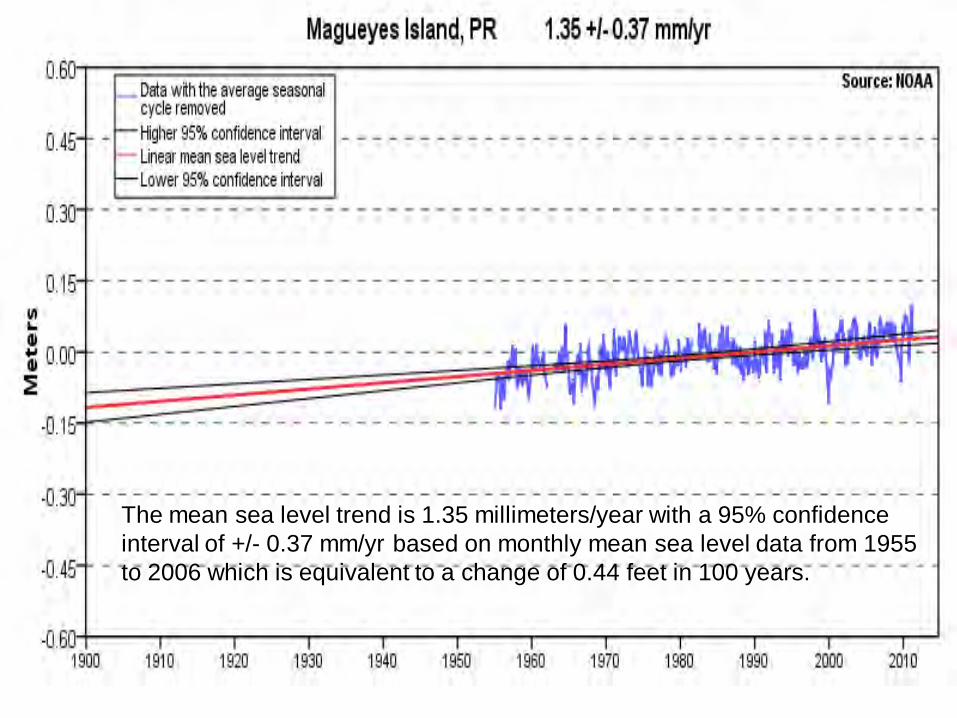
The mean sea level trend is 1.35 millimeters/year with a 95% confidence interval of +/- 0.37 mm/yr based on monthly mean sea level data from 1955 to 2006 which is equivalent to a change of 0.44 feet in 100 years.
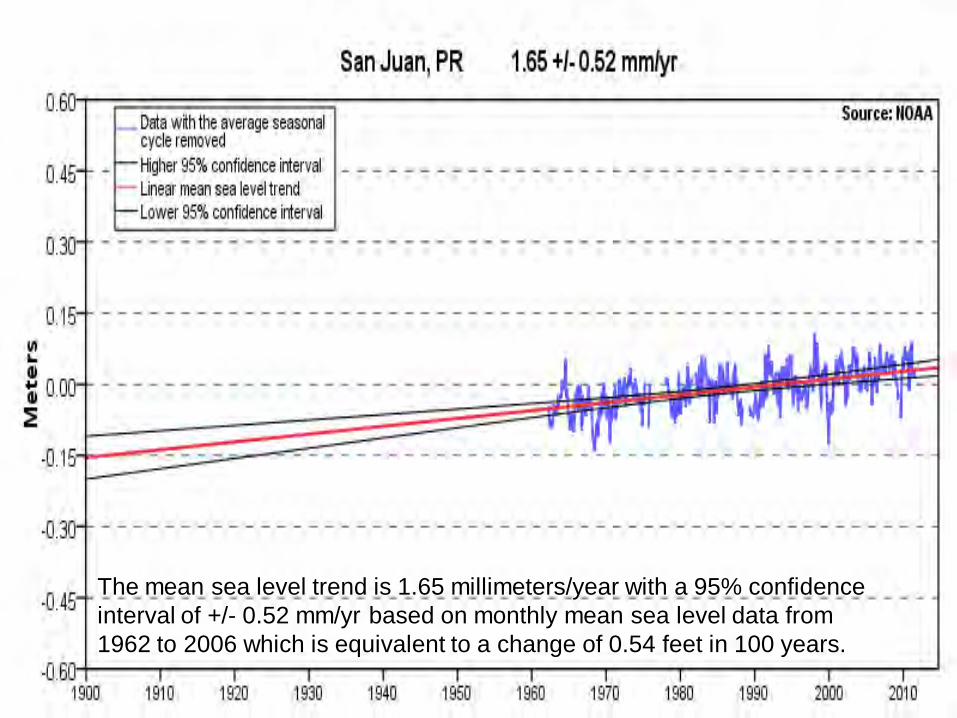
The mean sea level trend is 1.65 millimeters/year with a 95% confidenceinterval of +/- 0.52 mm/yr based on monthly mean sea level data from 1962 to 2006 which is equivalent to a change of 0.54 feet in 100 years.

y = 0.001x - 3.156
0.000
0.050
0.100
0.150
0.200
0.250
0.300
0.350
0.400
1960 1970 1980 1990 2000 2010
MSL
(m)
Date
San Juan Monthly Mean Sea Level 1962-2010
Series1 Linear (Series1)
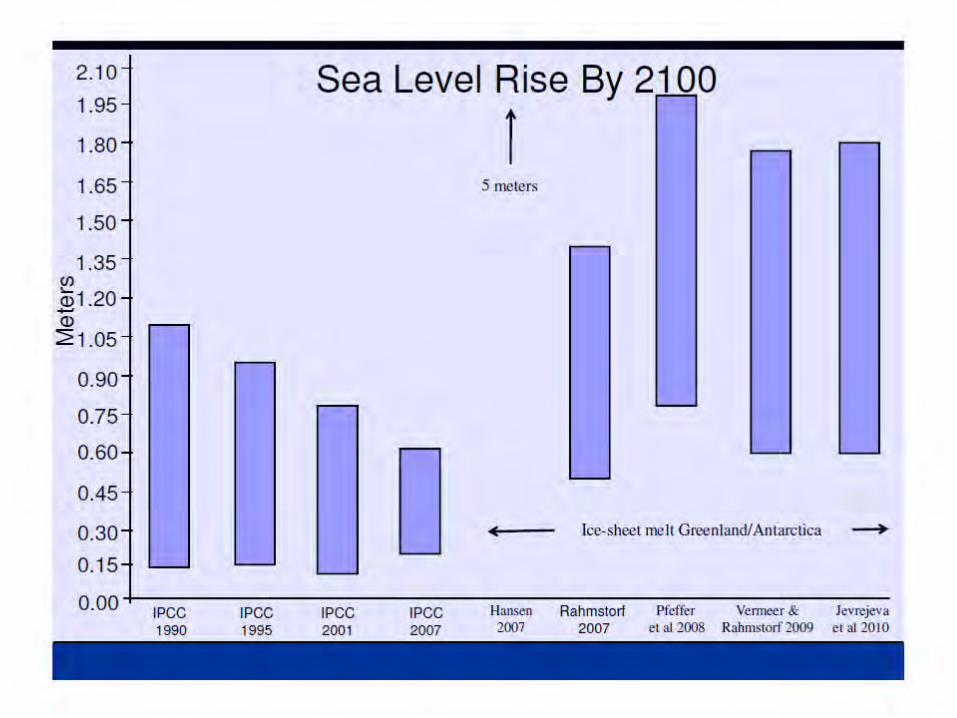
0.414 m (2100)

y = 0.001x - 2.706
-0.100
-0.050
0.000
0.050
0.100
0.150
0.200
0.250
0.300
1951 1961 1971 1981 1991 2001 2011
MSL
(m)
Date
Magueyes - Monthly Mean Sea Level 1955-2008
Series1 lineal
0.256 m (2100)
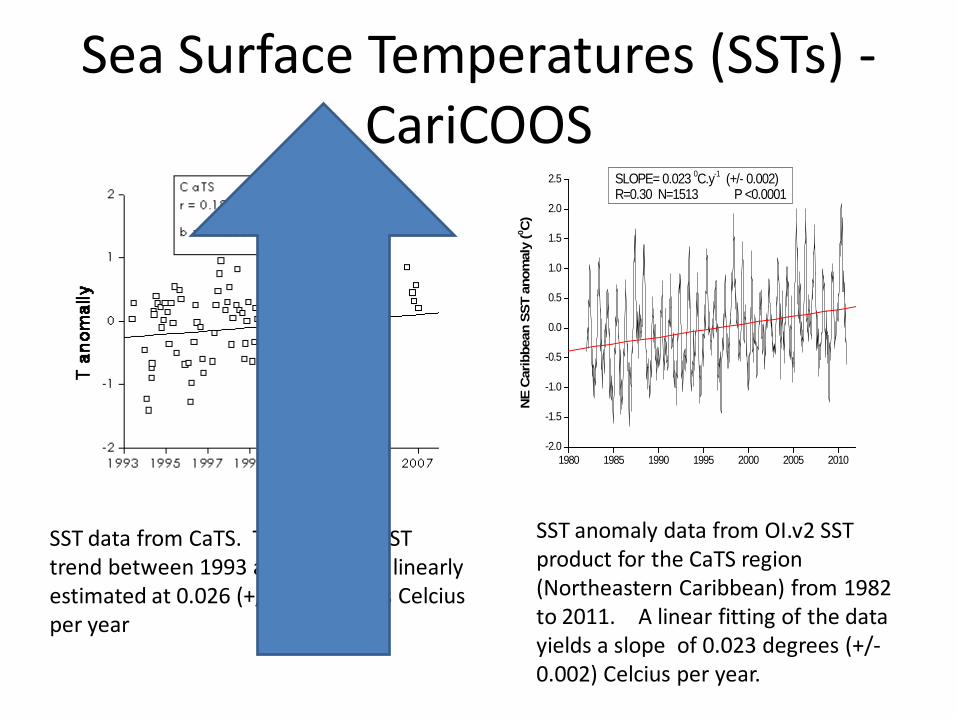
Sea Surface Temperatures (SSTs) -CariCOOS
1980 1985 1990 1995 2000 2005 2010-2.0
-1.5
-1.0
-0.5
0.0
0.5
1.0
1.5
2.0
2.5 SLOPE= 0.023 0C.y-1 (+/- 0.002)R=0.30 N=1513 P <0.0001
NE
Car
ibbe
an S
ST a
nom
aly
(0 C)
SST data from CaTS. The slope or SST trend between 1993 and 2007 was linearly estimated at 0.026 (+/-.01) degrees Celcius per year
SST anomaly data from OI.v2 SST product for the CaTS region (Northeastern Caribbean) from 1982 to 2011. A linear fitting of the data yields a slope of 0.023 degrees (+/-0.002) Celcius per year.
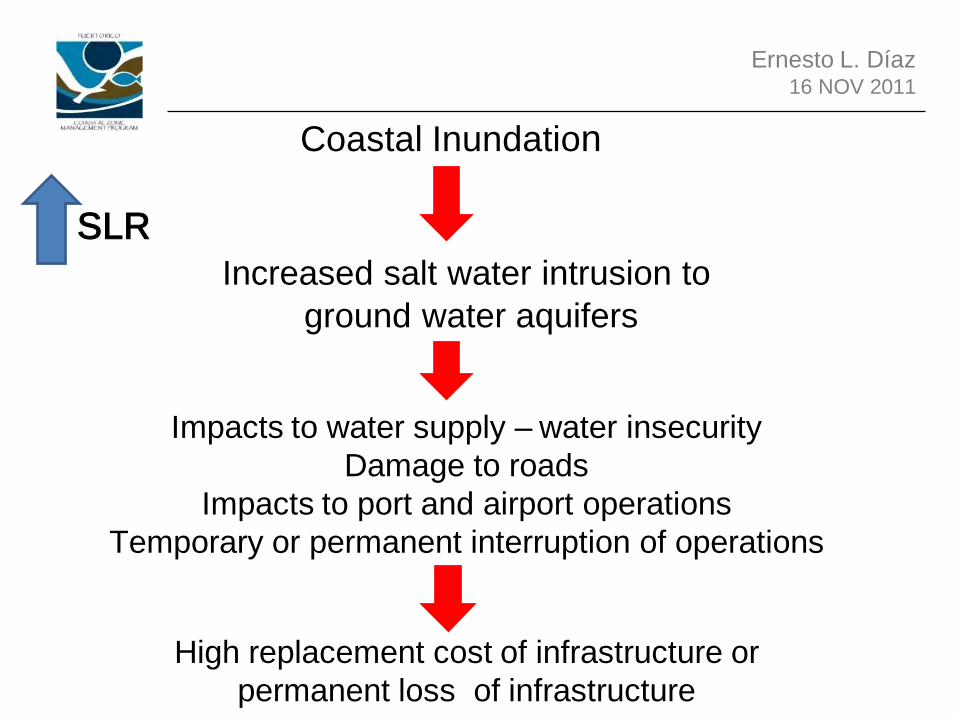
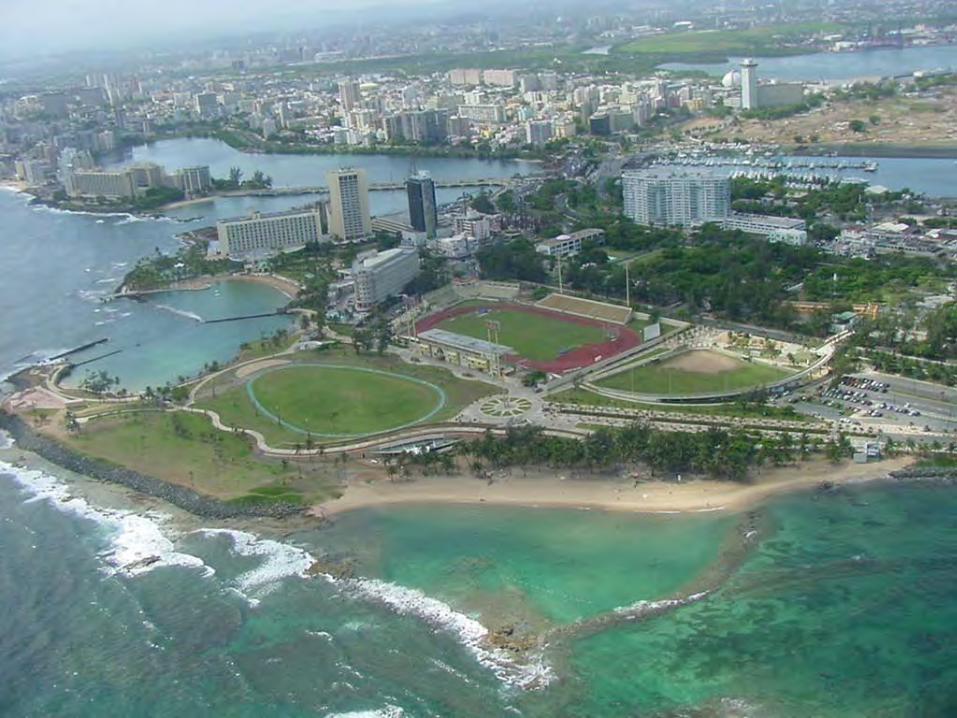
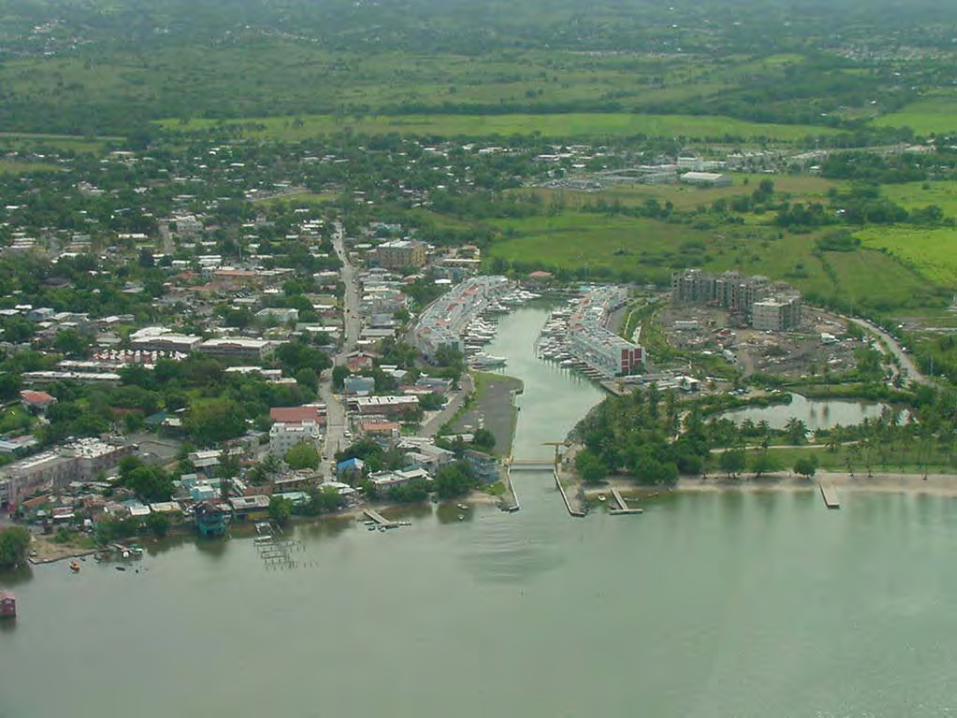
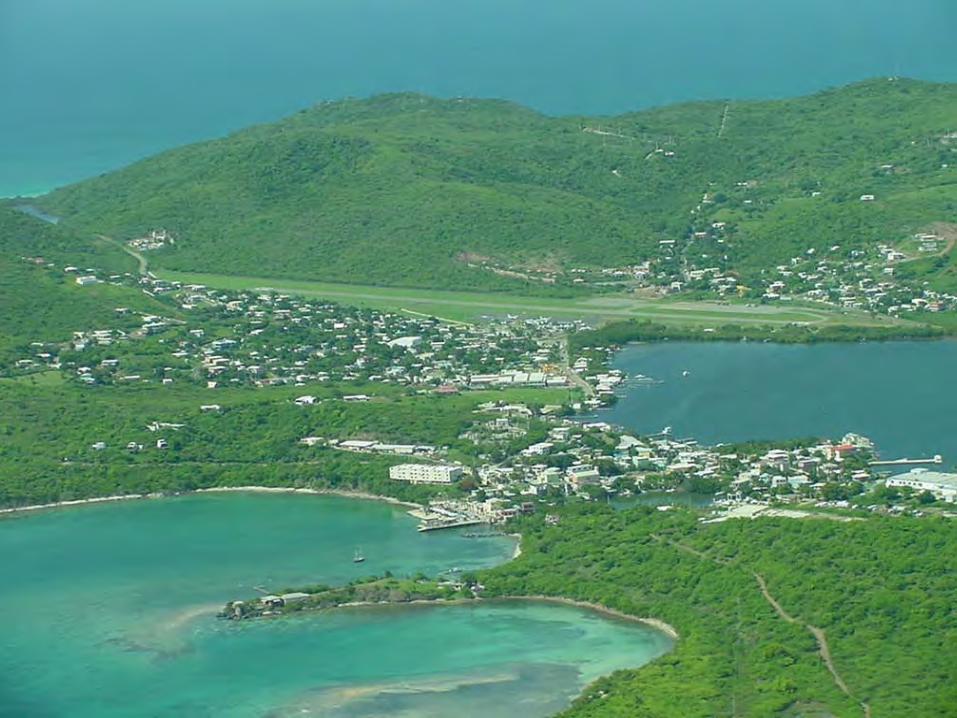
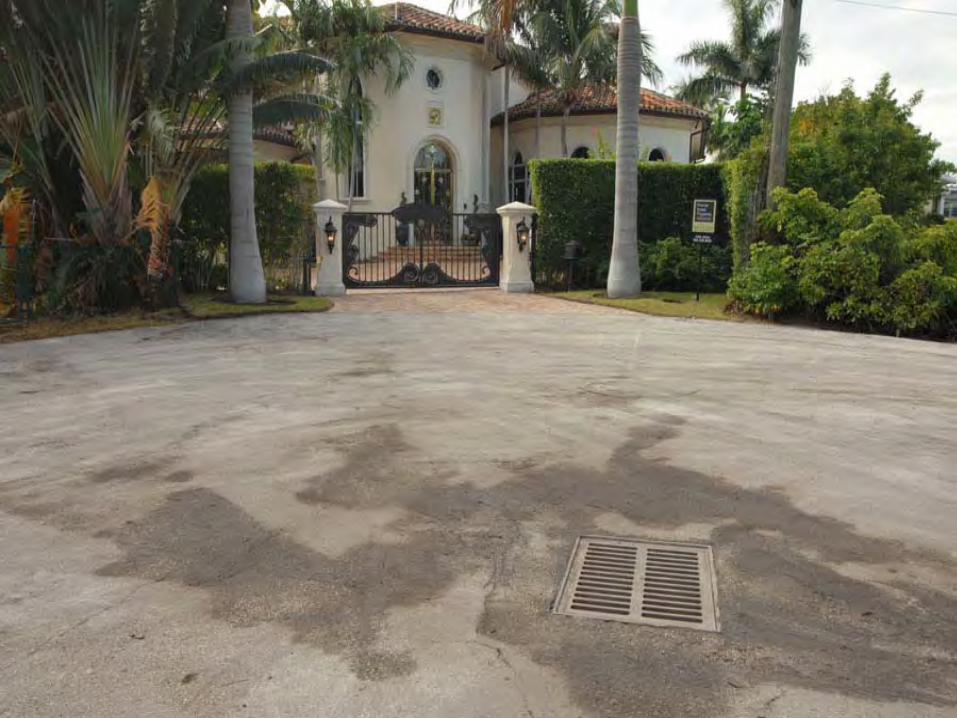
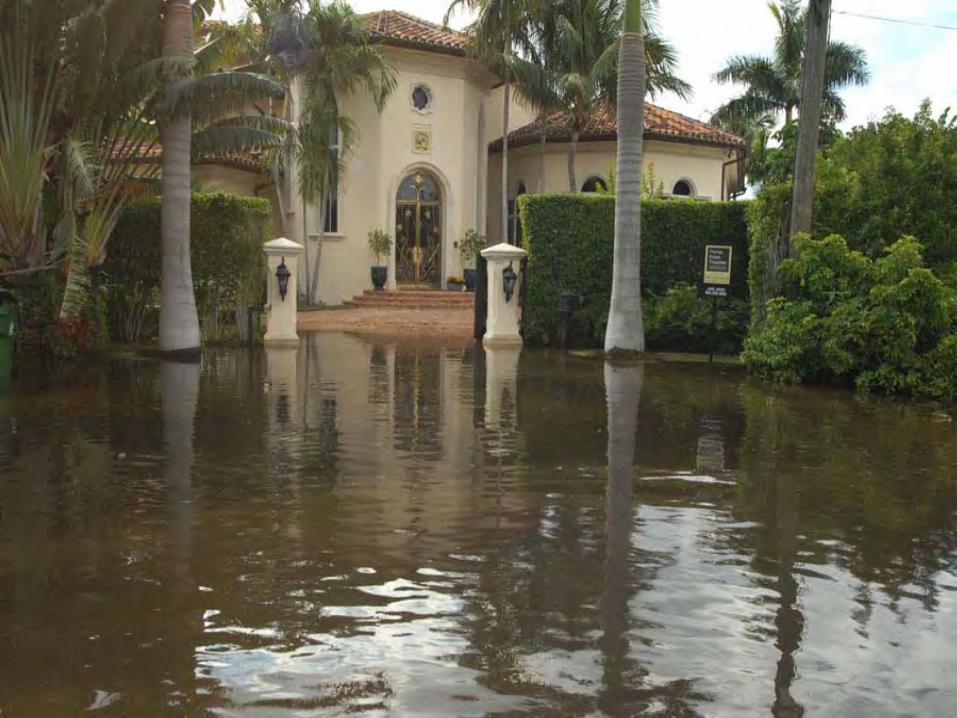
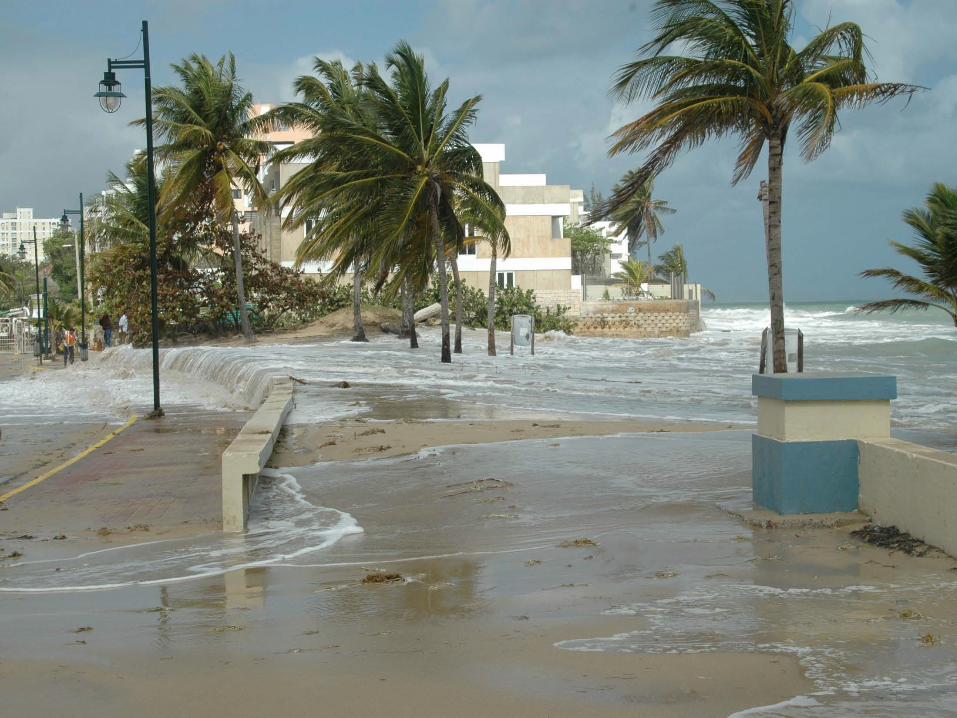
Coastal Inundation
SLR Increased salt water intrusion to
ground water aquifers
Impacts to water supply – water insecurity Damage to roads
Impacts to port and airport operationsTemporary or permanent interruption of operations
High replacement cost of infrastructure or permanent loss of infrastructure
Ernesto L. Díaz 16 NOV 2011
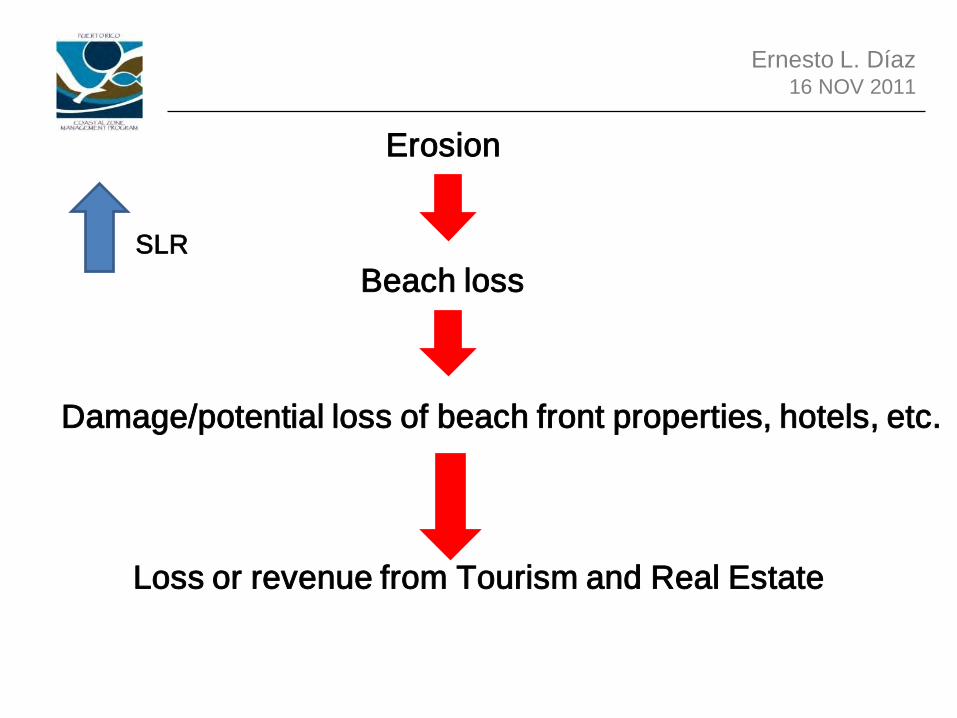
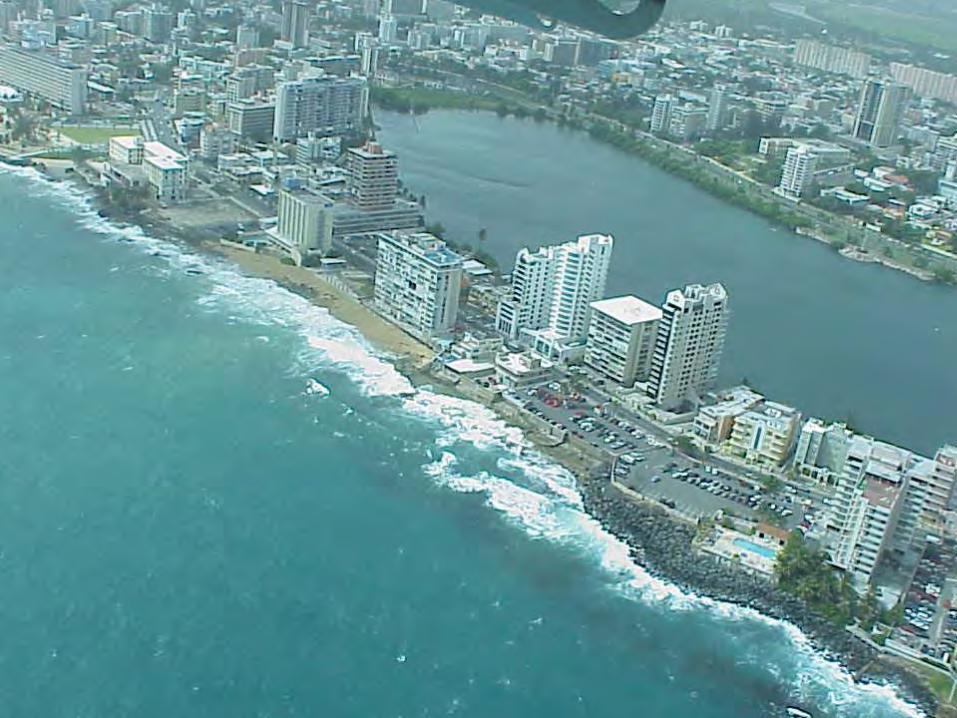
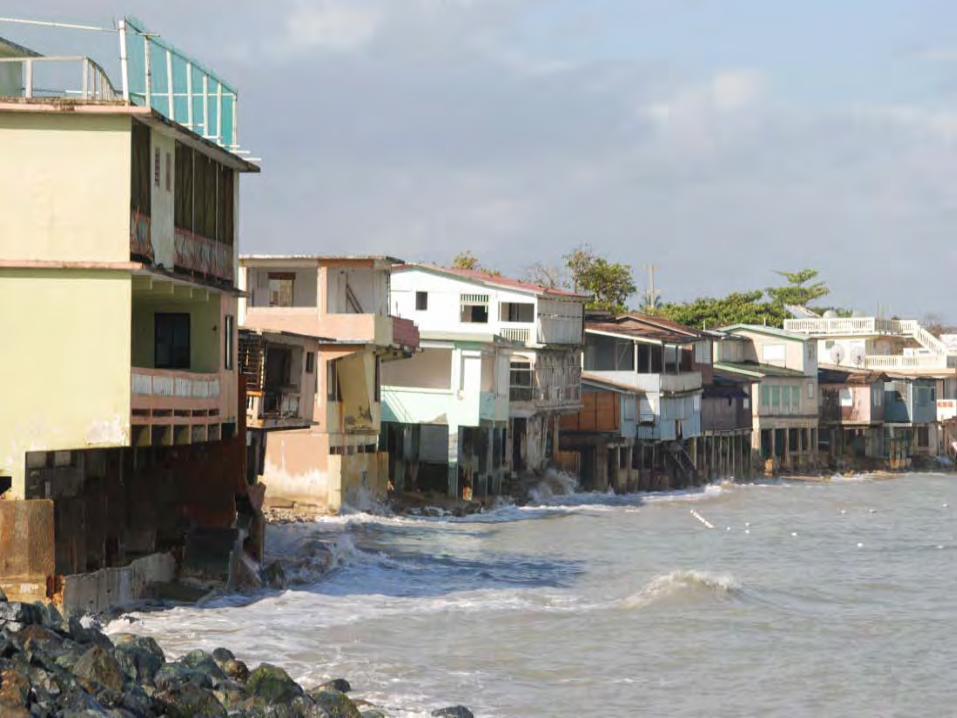
Erosion
SLR Beach loss
Damage/potential loss of beach front properties, hotels, etc.
Loss or revenue from Tourism and Real Estate
Ernesto L. Díaz 16 NOV 2011
Ernesto L. Díaz 2012
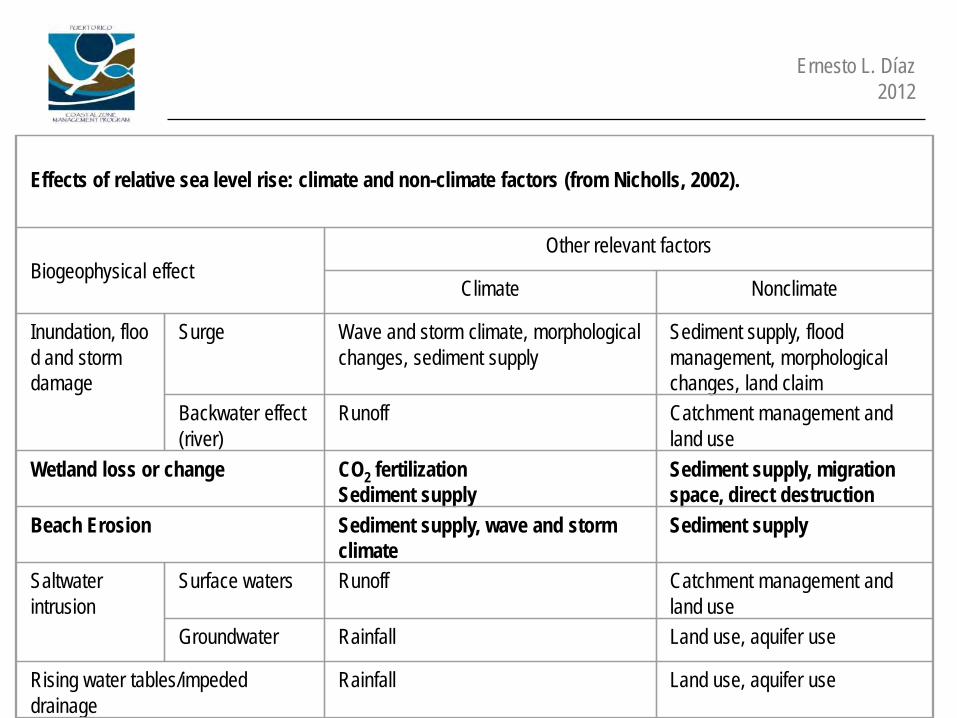
Effects of relative sea level rise: climate and non-climate factors (from Nicholls, 2002).
Biogeophysical effectOther relevant factors
Climate Nonclimate
Inundation, flood and storm damage
Surge Wave and storm climate, morphological changes, sediment supply
Sediment supply, flood management, morphological changes, land claim
Backwater effect (river)
Runoff Catchment management and land use
Wetland loss or change CO2 fertilizationSediment supply
Sediment supply, migration space, direct destruction
Beach Erosion Sediment supply, wave and storm climate
Sediment supply
Saltwater intrusion
Surface waters Runoff Catchment management and land use
Groundwater Rainfall Land use, aquifer use
Rising water tables/impeded drainage
Rainfall Land use, aquifer use

Ernesto L. Díaz 2012
Coastal Features and Ecosystems Update
Ecotone Identification Sampling Points
Lidar Coastal Profiling
National Wetland Inventory Review


16 U.S.C. § 1541 Coastal Zone Management Act, 1972 : Section 302 (L)
Currently, not enough is being done to manage and protect our coastal resources.
"(7) Global warming results from the accumulation of man-made gases, released into the atmosphere from such activities as the burning of fossil fuels, deforestation, and the production of chlorofluorocarbons, which trap solar heat in the atmosphere and raise temperatures worldwide.
Global warming could result in significant global sea level rise by 2050 resulting from ocean expansion, the melting of snow and ice, and the gradual melting of the polar ice cap.
Sea level rise will result in the loss of natural resources such as beaches, dunes, estuaries, and wetlands, and will contribute to the salinization of drinking water supplies.
Sea level rise will also result in damage to properties, infrastructures, and public works.
Ernesto L. Díaz 11 NOV 2011

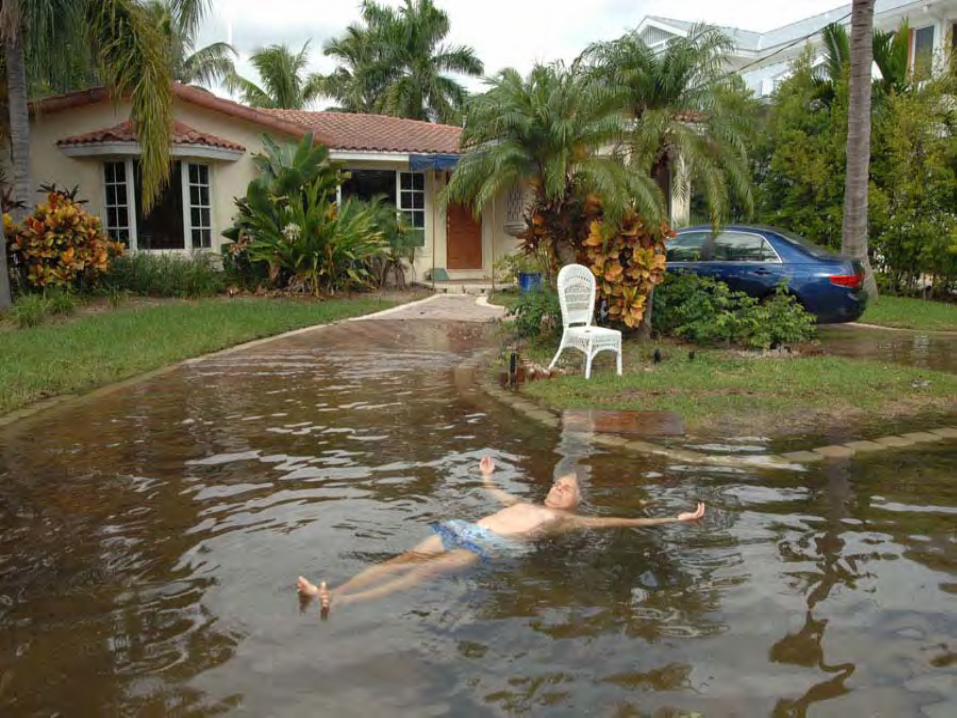
Percepción pública:
• Krosnick: 1997,1998, 2008
• UMET: 1997
• PMZC: 2009 (8 municipios)
• Caribbean Business-WOSO-Gaither: 2011
• Yale-G.Mason: 2011
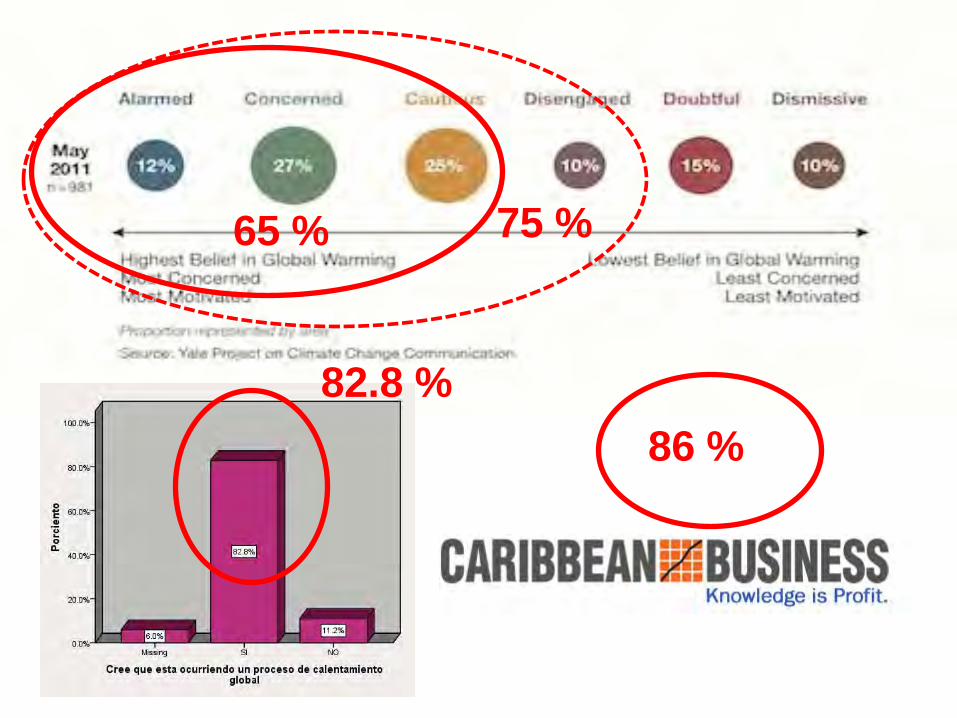
65 %
82.8 %86 %
75 %
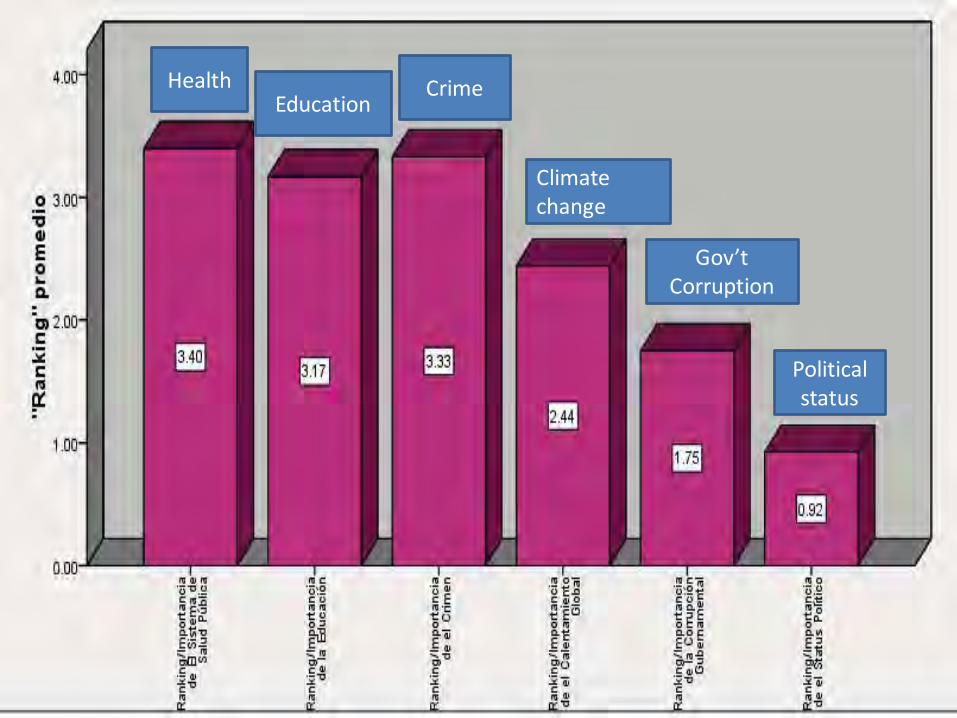
HealthEducation
Crime
Climate change
Gov’tCorruption
Political status
Puerto Rico is at risk from:
• Continuing development in high hazard areas
• Elimination of dunes, reefs, mangroves and other naturally protective features
• Poor maintenance of existing shoreline stabilization structures
• Poor maintenance and dredging of rivers, canals, and reservoirs
• Poor maintenance of storm-water management systems
• Poor soil management practices on land and coastal watersheds.
Ernesto L. Díaz 2012
Ernesto L. Díaz 2012
Natural ecosystems at risk from sea ‐level rise are undervalued or ignored in traditional economic analyses (i.e., wetlands, dune loss or beach changes) ‐ Improved methods for future studies are needed.
Local governments should conduct detailed studies to better understand the potential impacts of sea‐level rise in their communities.
Future development should be limited in areas that are at risk from rising seas.
Current efforts to build, maintain, or modify structures in coastal areas at risk of sea‐level rise should be based on estimates of SLR.
Climate change knowledge and projections must be integrated into the design of all coastal structures.
Recommendations and challenges
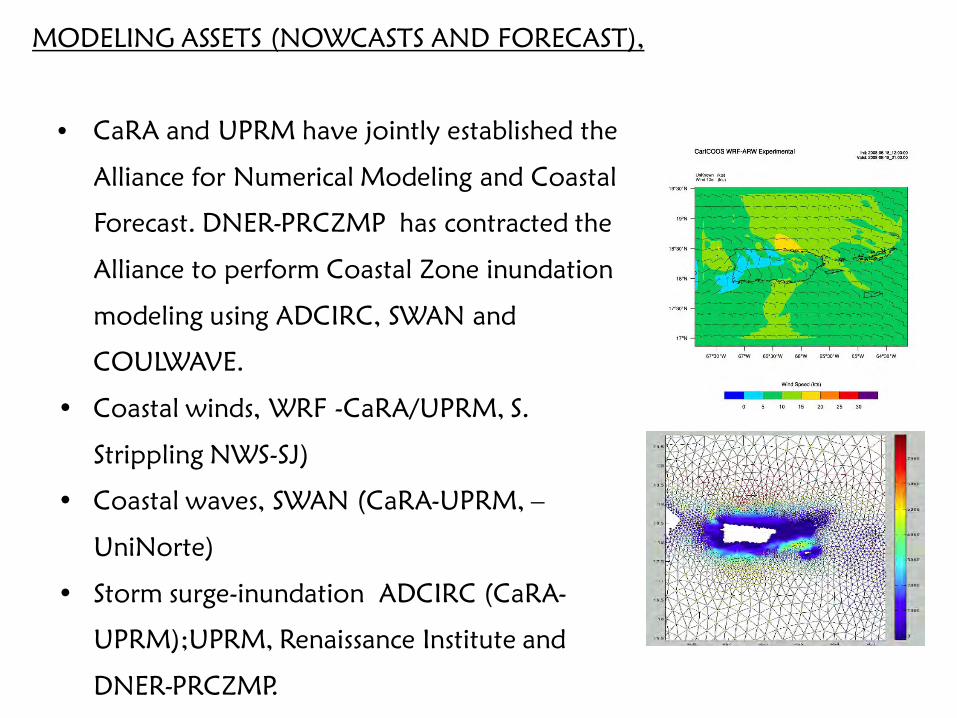
MODELING ASSETS (NOWCASTS AND FORECAST),
• CaRA and UPRM have jointly established the
Alliance for Numerical Modeling and Coastal
Forecast. DNER-PRCZMP has contracted the
Alliance to perform Coastal Zone inundation
modeling using ADCIRC, SWAN and
COULWAVE.
• Coastal winds, WRF -CaRA/UPRM, S.
Strippling NWS-SJ)
• Coastal waves, SWAN (CaRA-UPRM, –
UniNorte)
• Storm surge-inundation ADCIRC (CaRA-
UPRM);UPRM, Renaissance Institute and
DNER-PRCZMP.
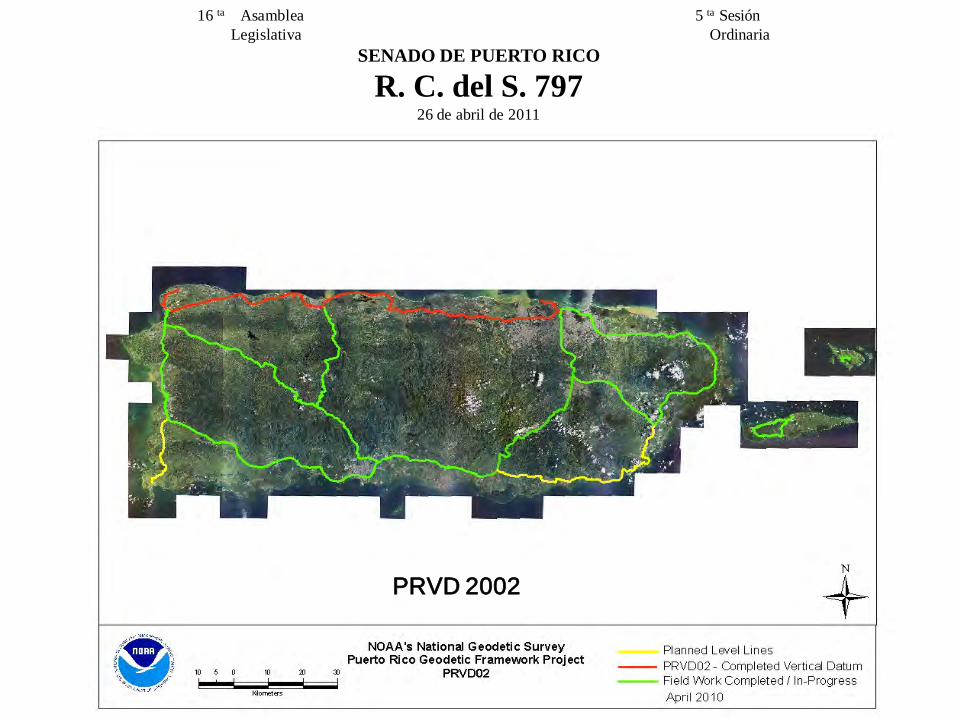
16 ta Asamblea 5 ta SesiónLegislativa Ordinaria
SENADO DE PUERTO RICO
R. C. del S. 79726 de abril de 2011
PRVD 2002
PUERTO RICODepartment of Natural and Environmental Resources
How have we gotten here?…and next steps!
Ernesto L. Díaz, M.S., EEMMarine Scientist - Director
2012
Coordination Techniques of the Puerto Rico Climate Change Council
Kasey R. Jacobs
NOAA Coastal Management Fellow
Department of Natural and Environmental Resources
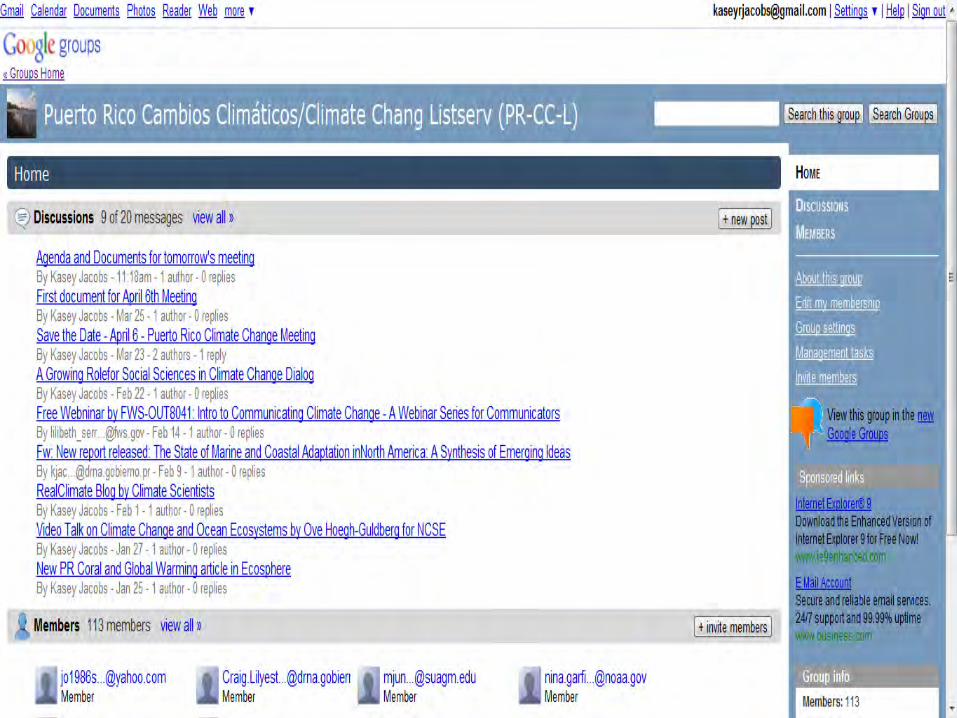
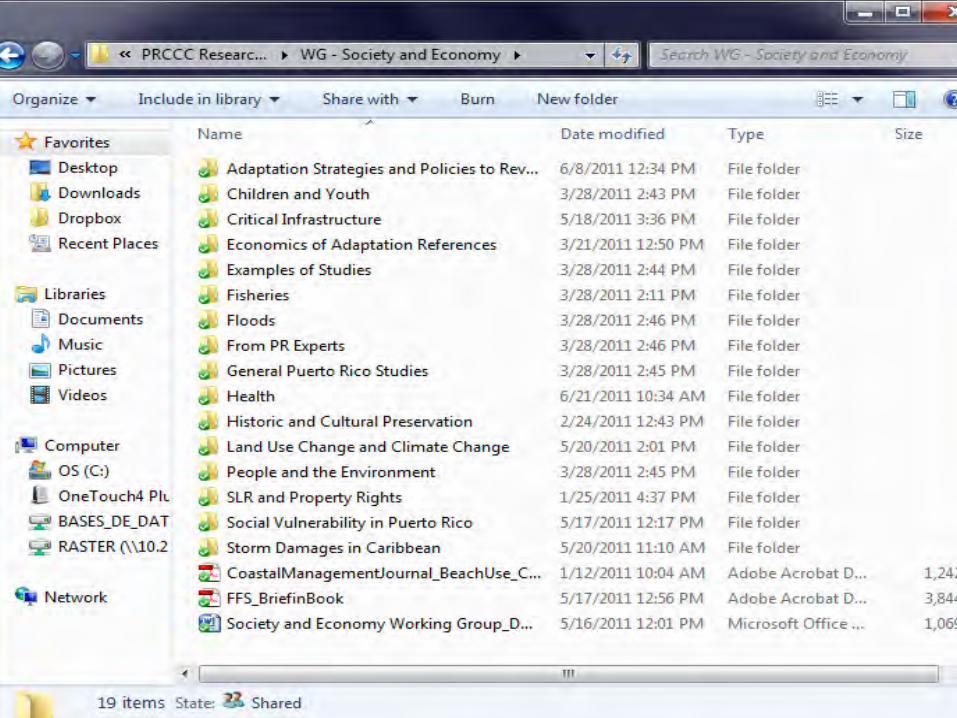
Puerto Rico Climate Research Library
Dropbox
Launched April 6, 2011


WG 2 Coral Meeting

WG 2 Coral Meeting
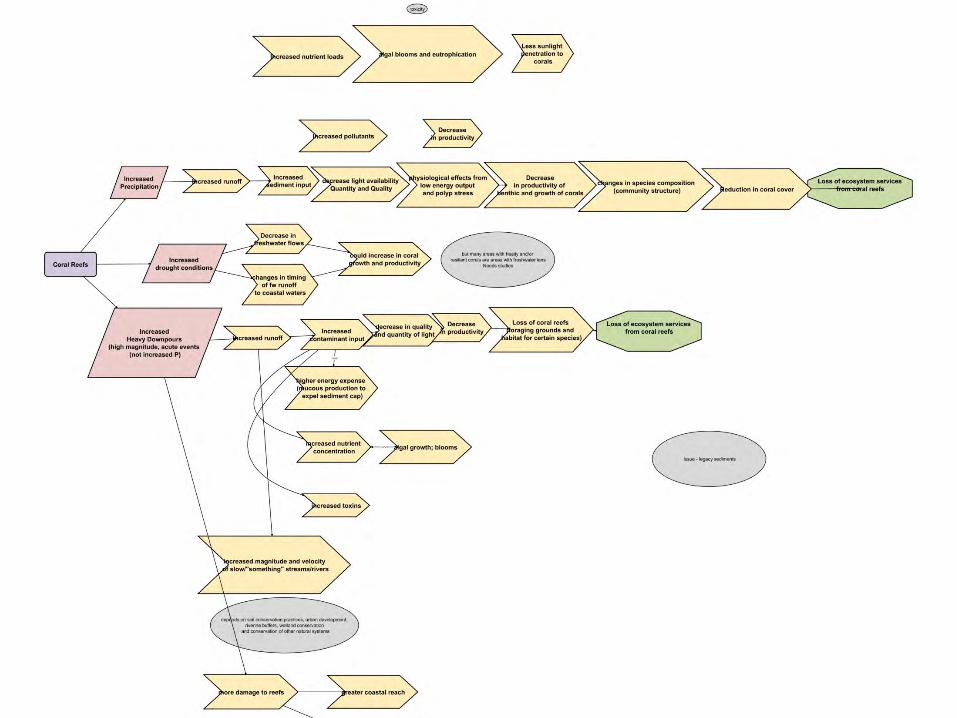


Examples of Outputs from Stakeholder/Expert Workshops
2/2/2012 64

2/2/2012 65

Pre-Workshop Survey

Purpose:
To develop the communication’s plan for Puerto Rico’s climate change vulnerability assessment and decide
on the next steps of Working Group 4

Desired Outcomes: By the end of this meeting, we will have:
• Agreed upon main message, audience, and frame of a communication’s plan
• A collective understanding of where Puerto Rico needs to go in terms of communicating climate change and hazards
• Agreed upon types of information and graphics to be included in the final reports of the PRCCC
• Next steps of Working Group 4 to be conducted in 2012

Andrew Revkin