Embed Size (px)
Citation preview
E c o n o m i c &S
oc
ia
l
Af
fa
ir
s
CDP Background Paper No. 15 ST/ESA/2012/CDP/15
June 2012
Climate change vulnerability and the identification of least developed countries
Background report by Matthias Bruckner*
* Matthias Bruckner is Economic Affairs Officer at the Committee for Development Policy Secretariat, Development Policy and Analysis Division, Department of Economic and Social Affairs, United Nations. The views and opinions expressed herein are those of the author and do not neces-sarily reflect those of the United Nations Secretariat. The designations and terminology employed may not conform to United Nations practice and do not imply the expression of any opinion whatsoever on the part of the Organization.
Comments should be addressed by e-mail to the author: [email protected].
Abstract
This paper reviews the role of climate change vulnerability in identifying least developed countries (LDCs). Taking a sustainable development perspective, it argues that climate change should be seen as an aggravating factor of existing handicaps and many indicators used to identify LDCs already capture relevant structural vulnerabilities to climate change. However, the paper proposes some refinements in the LDC criteria to better capture vulnerabilities from natural disasters and in coastal areas. These refinements affected the vulnerability ranking in the recent triennial review, but had no impact the eligibility of countries for inclusion in and graduation from the LDC category.
JEL Classification: F5 (International relations and international political economy); O1 (Economic development); O19 (International Linkages to Development; Role of International Organizations); Q54 (Climate; natural disasters; global warming)
Keywords: economic vulnerability, least developed countries, climate change
Contents
I. Introduction . . . . . . . . . . . . . . . . . . . . . . . . . . . . . . . . . . . . . . . . . . . . . . . . . . . . . . . . . . . . . . . . . . . . 1
II. Conceptual issues for addressing climate change vulnerability in the LDC indicators . . . . . . . . .2
A. Climate change as structural handicap to development . . . . . . . . . . . . . . . . . . . . . . . . . . . . . . . .2
B. Understanding vulnerability . . . . . . . . . . . . . . . . . . . . . . . . . . . . . . . . . . . . . . . . . . . . . . . . . . . .3
III. Impacts of climate change on development . . . . . . . . . . . . . . . . . . . . . . . . . . . . . . . . . . . . . . . . . . . . . 5
A. Natural disasters . . . . . . . . . . . . . . . . . . . . . . . . . . . . . . . . . . . . . . . . . . . . . . . . . . . . . . . . . . . . .5
B. Agriculture . . . . . . . . . . . . . . . . . . . . . . . . . . . . . . . . . . . . . . . . . . . . . . . . . . . . . . . . . . . . . . . . .7
C. Health . . . . . . . . . . . . . . . . . . . . . . . . . . . . . . . . . . . . . . . . . . . . . . . . . . . . . . . . . . . . . . . . . . . . .8
D. Water availability . . . . . . . . . . . . . . . . . . . . . . . . . . . . . . . . . . . . . . . . . . . . . . . . . . . . . . . . . . . . .8
E. Coastal and marine zones . . . . . . . . . . . . . . . . . . . . . . . . . . . . . . . . . . . . . . . . . . . . . . . . . . . . . .9
F. Terrestrial ecosystems and biodiversity . . . . . . . . . . . . . . . . . . . . . . . . . . . . . . . . . . . . . . . . . . . . .9
IV. Coverage of climate change vulnerability in the LDC criteria . . . . . . . . . . . . . . . . . . . . . . . . . . . . . . 10
V. Improved coverage of climate change vulnerability in the LDC indicators . . . . . . . . . . . . . . . . . . . . 13
A. Options for addressing climate change in the LDC indicators . . . . . . . . . . . . . . . . . . . . . . . . . .13
B. Measurements versus projections in analyzing climate change vulnerability . . . . . . . . . . . . . . . .13
C. Candidate indicators for capturing climate change vulnerability in the EVI . . . . . . . . . . . . . . .14
1. Natural disasters . . . . . . . . . . . . . . . . . . . . . . . . . . . . . . . . . . . . . . . . . . . . . . . . . . . . . . . .15
2. Water . . . . . . . . . . . . . . . . . . . . . . . . . . . . . . . . . . . . . . . . . . . . . . . . . . . . . . . . . . . . . . . .17
3. Coastal zones . . . . . . . . . . . . . . . . . . . . . . . . . . . . . . . . . . . . . . . . . . . . . . . . . . . . . . . . . .18
4. Terrestrial ecosystems and biodiversity . . . . . . . . . . . . . . . . . . . . . . . . . . . . . . . . . . . . . . .19
VI. Impact of improved coverage of climate change vulnerability in the EVI . . . . . . . . . . . . . . . . . . . . . 20
VII. Conclusions . . . . . . . . . . . . . . . . . . . . . . . . . . . . . . . . . . . . . . . . . . . . . . . . . . . . . . . . . . . . . . . . . . . 24
CDP Background Papers are preliminary documents circulated in a limited number of copies and posted on the DPAD website at http://www.un.org/en/development/desa/policy/cdp/cdp_bg_papers.shtml to stimulate discussion and critical comment on the broad range of economic, social and environmental issues associated with the issues dealt with by the Committee for Development Policy. The views and opinions expressed herein are those of the author and do not necessarily reflect those of the United Nations Secretariat. The designations and terminology employed may not conform to United Nations practice and do not imply the expression of any opinion whatsoever on the part of the Organization.
United NationsDevelopment Policy and Analysis DivisionDepartment of Economic and Social Affairs2 United Nations Plaza, Room DC2-2020New York, New York 10017, USATel.: +1 212 963 5497Fax: +1 212 963 1061email: [email protected]://www.un.org/en/development/desa/policy/cdp/cdp_bg_papers.shtml
1
Climate change vulnerability and the identification of least developed countries
Matthias Bruckner1
I. Introduction
The vulnerability of least-developed countries (LDCs) to climate change has been noted both by researchers and the United Nations. Many LDCs are located in parts of the world that are expected to be badly affected by temperature and precipitation changes. Moreover, climate-sensitive economic sectors, such as agriculture, are more important for the generation of output and income in LDCs than in other countries. Due to their low level of development, LDCs are also less resilient to negative external events and have lower capacity to adapt than other developing countries. This increased vulnerability is seen as unfair, as LDCs have contribut-ed to climate change, by emitting greenhouse gases or by changing their land-use patterns, only marginally.
Heightened climate change vulnerability therefore could be a factor in the determining LDC status. The Committee for Development Policy (CDP), a subsidiary body of the United Nations Economic and Social Council (ECOSOC), is responsible for with reviewing, on a triennial basis, the list of LDCs and to recommend countries for inclusion into or graduation from the list.2 The CDP defines LDCs as low income countries suffering from the most severe structural impediments to sustainable development (CDP, 2011). The CDP uses three criteria to classify countries as LDCs: per capita gross national income (GNI), Human Asset Index (HAI) and the Economic Vulnerability Index (EVI). Both HAI and EVI are composed of several indicators.3 In 2011 the Committee decided to assess whether climate change constituted a structural devel-opment impediment and to evaluate the suitability of existing indicators in capturing the constraints.
In this context, this paper explores the role climate change vulnerability has in identifying LDCs. As climate change is expected to impact on countries differently, depending on their location, their develop-ment level and trajectory, climate change vulnerability could in principle play a role in defining LDCs. In this regard, it should be stressed that vulnerabilities to climate change are relevant for identifying LDCs only if they constitute (potentially) significant structural barriers to development and if these barriers are largely beyond the control of affected countries. An earlier version of this paper served as an input to the discussions of the CDP on vulnerability to climate change as a factor in the identification of LDCs which led to the introduction of refinements in the LDC criteria by the Committee.
1 An earlier version of the paper was circulated as background paper to an expert group meeting of the Committee for Development Policy on climate change, conflict and other issues related to the review of the criteria for the identification of LDCs, held on 3 February 2011, document number CDP2011/EGM/13. The author would like to thank Ana Cortez for very valuable discussions and suggestions. He would also like to acknowledge the comments by Olav Bjerkholt, Patrick Guillaumont and Hans Opschoor.
2 More generally, the CDP provides inputs and independent advice to ECOSOC on medium- and long-term development issues and on international cooperation for development.
3 Inclusion requires meeting inclusion thresholds of the three criteria. Eligibility to graduation requires a country to pass graduation thresholds for two of the three criteria in two consecutive reviews. In addition, vulnerability profiles and graduation impact assessments are prepared and considered for graduation candidates before a recommendation is made. See CDP and United Nations Department of Economic and Social Affairs (UN DESA), 2008, and Guillaumont (2009) for in-depth discussion.

2 CDP Background Paper No. 15
The remainder of the paper is organized as follows. The next section will discuss conceptual issues related to climate change vulnerability and the identification of LDCs. It will argue that climate change is best seen as an aggravating factor of existing handicaps to development, rather than a new and separate handicap. Moreover, this section will consider how vulnerability is understood by the Intergovernmental Panel on Climate Change (IPCC) and by the CDP in the economic vulnerability index (EVI).
Section III will consider different socio-economic impacts of climate change with respect to the following issues: natural disasters; agriculture; health; freshwater; coastal and marine zones; and terrestrial ecosystems and biodiversity. For each area, the main impacts will be briefly described. The selection of impacts is based on the IPCC Fourth Assessment Report (IPCC, 2007) and related recent work on climate change impacts and vulnerability.
Section IV will analyze how and to which extent these vulnerabilities are captured in the LDC crite-ria used by the CDP prior to the 2012 triennial review and identify gaps in the coverage of relevant aspects of climate change vulnerability in the LDC criteria. Then, section V will discuss various options for refining the LDC criteria for capturing vulnerability to climate change further. The section will also consider a wide range of indicators for potential inclusion in the criteria. Section VI examines the impact of the refinement of the LDC criteria on the 2012 triennial review of the LDC list, and section VII concludes.
II. Conceptual issues for addressing climate change vulnerability in the LDC indicators
A. Climate change as structural handicap to development
Climate change has many manifestations. It affects, among others, the mean as well as the temporal and spatial distribution of temperature and precipitation, the intensity and frequency of storms as well as the sea levels. Obviously, dependency of economic activities such as agriculture and transport on climatic conditions is not a new phenomenon. However, climate change will alter the existing climate vulnerability. Although climate change impacts are already felt today, future changes in climate patterns are expected to have impli-cations for which countries, particularly developing countries, are ill prepared.
Climate change is not an isolated phenomenon. Rather, it is its interaction with development process-es that determines whether climate change is a handicap to development. Climate change vulnerability is not easily separable from vulnerability to other events and could be characterized as a vulnerability amplifier.4,5 In addition, shocks can interact, as the combined energy, food and economic crises in 2007/2008 have demon-strated. Development, the building of resilient societies, transfer of technologies and resources as well as global mitigation efforts, could enable low-income countries to address the consequences of climate change.
A broader view on vulnerability, focusing on consequences rather than sources, is commensurate with the sustainable development perspective on climate change. As climate change has a negative impact on
4 Climate change is often characterized as threat multiplier, rather than as separate threat, see United Nations (2009) or Munasinghe (2010). Amplifier may better describe the non-linear and possible devastating impacts of climate change than the term multiplier.
5 It should be noted, though, that sea level rise is an exception to some extent, as it leads to the submersion of land and could thus be seen as additional handicap. However, many impacts of expected sea level rise occur through the interaction with other processes such as storm surges. The notion of vulnerability amplifier may be inappropriate, though, to reflect impacts of low-probability catastrophic events such as rapid deglaciation of ice shields in Greenland and West-Antarctica or a breakdown of the thermohaline circulation.
Climate change vulnerability and the identification of least developed countries 3
people’s livelihoods, weakening their resource base and limiting their options and capabilities6, it needs to be addressed within the overall sustainable development framework and not in isolation. Thus, taking a sus-tainable development perspective in addressing climate change within the LDC criteria seems to be a more promising alternative than taking a narrow environmental perspective.
As the identification of LDCs also follows a broader sustainable development perspective, the LDC criteria can be expected to capture vulnerability to climate change to some extent. However, there may be a need to revise the criteria as climate change has the potential to give a higher profile to vulnerabilities that are currently of marginal interest for the designation of least developed countries. Reflecting climate change vulnerability in the LDC criteria more extensively may also influence the selection of indicators as additional or alternative indicators could better reflect climate change impacts on development than the indicators cur-rently used. For capturing climate change vulnerability, it is useful to combine a retrospective view, focusing on vulnerabilities that were revealed through impacts in the past, as well as a prospective view, anticipating vulnerabilities that will become more relevant in the future.7
B. Understanding vulnerabilityThere are different perceptions of what “vulnerability” means, which in turn affect how vulnerability can be measured. Hence, it is helpful to briefly compare the definition of vulnerability as used by the CDP for the EVI and by the IPCC on climate change vulnerability.
The CDP understands vulnerability as the risk of being harmed by exogenous shocks which, in the case of LDCs, can imply a marked reduction of long-term average growth rates and impact on development prospects. The vulnerabilities considered by the CDP in the identification of LDCs, proxied and measured by EVI, refer only to those resulting from structural factors, that is to say, that are durably independent from the political will of countries, thereby excluding vulnerabilities that result from economic policy choices made in the recent past and which are of a conjectural nature (CDP, 2009). This restriction is in line with the characterization of LDCs as structurally handicapped low-income countries, even though, in some instances, it can be difficult to distinguish structural from non-structural vulnerability. Accordingly, the Committee has recognized two main classes of shocks that affect structural economic vulnerability: 1. environmental or natural shocks; and 2. external shocks related to trade and exchange (Guillaumont, 2009, p. 175).
Vulnerability is a function of the magnitude and frequency of shocks, the exposure to such shocks and the resilience (i.e., the capacity to react to shocks). The EVI has two main components, an exposure index and a shock index. The exposure index contains indicators of population size, remoteness from world markets, merchandise export concentration and the share of agriculture, forestry and fisheries in the gross domestic product (GDP). The shock index utilizes indicators of the instability of exports of goods and services, homelessness from natural disaster and variability of agricultural production.8
The International Panel on Climate Change (IPCC) defines climate change vulnerability as “the degree to which a system is susceptible to, and unable to cope with, adverse effects of climate change, including cli-mate variability and extremes. Vulnerability is a function of the character, magnitude, and rate of climate change and variation to which a system is exposed, its sensitivity, and its adaptive capacity.’’(IPCC, 2007)
6 See, among others, CDP and UN DESA (2009).7 See Opschoor (2007) and CDP (2008).8 The set of indicators used for the EVI has evolved over time. These seven indicators were used for the 2006 and 2009
triennial reviews of the LDC list. The refinement of the indicators for the 2012 review will be briefly discussed in section VI of this paper.
4 CDP Background Paper No. 15
Both CDP and IPCC definitions include the concept of exposure and take into account the mag-nitude and frequency of change of the phenomenon. Moreover, adaptive capacity in the IPCC definition broadly corresponds to the idea of resilience in the CDP’s conceptualization of vulnerability.
One obvious difference is that the IPCC refers exclusively to vulnerability to climate change, whereas the EVI definition covers a broader range of vulnerability sources determined by structural factors.9 At the same time, the CDP only considers vulnerabilities that lead to significant negative effects on growth and development. A second difference between the definitions is the concept of sensitivity which is not explicitly acknowledged in the EVI. Sensitivity is the degree to which a system is affected by climate vari-ability or change (IPCC, 2007, appendix 1).10 This difference is because climate change vulnerability analysis typically starts at the level of the changes taking place in the climatic variables (e.g., changes in temperature; in precipitation patterns) or at their direct bio-physical impacts (e.g., flooding) and only then it considers whether or not developmental variables of interest are impacted. The EVI (shock component), however, starts directly at the level of development impacts, and does not explicitly consider the various climatic and non-climatic factors triggering these impacts. Moreover, impacts on the bio-physical environment are outside the scope of the vulnerability analysis in EVI.11
An important feature of the CDP framework is that development impacts are not attributed to specific external factors such as climate change or climate variability. In fact, such attribution is extremely difficult as climatic and non-climatic factors interact. Hence, the broader sustainable development frame-work is likely to lead to less controversial vulnerability metrics than narrower frameworks focusing only on climate impacts. This is a critical feature in the context of LDC identification, because the inclusion of con-troversial indicators could compromise the acceptance of the overall LDC category. Another implication of the impact-focused approach is that detection of trends in external factors is not of major relevance. Thereby, vulnerability can be discussed without having to delve into controversies on the role of climate change in natural disasters. These controversies are often routed in different views whether statistically significant trends in hazard occurrence can be detected. However, trend detection for disasters is a very difficult task due to the low frequency of major events, the presence of natural cycles and changes in data coverage and quality over time.
A third and important difference is the extent to which resilience in included in the vulnerability framework. Whereas climate change vulnerability covers a broad range of resilience or adaptive capacity factors, the CDP framework excludes resilience that is dependent on recent policy choices and, hence, non-structural.12 However, it can be argued that information on resilience is not only contained in the EVI, but
9 By considering vulnerability resulting from a wide range and interdependent drivers, the EVI concept is more a line with the concept of contextual vulnerability than with the concept of outcome vulnerability associated with the IPCC. See Füssel (2007) for a discussion on different approaches to climate change vulnerability.
10 For example, agriculture is typically very sensitive to climate change, whereas most manufacturing is less sensitive. It should be noted that the exposure component of the EVI implicitly covers sensitivity to some extent, for example through the indicator on the share of agriculture.
11 It should be noted that separating bio-physical from socio-economic impacts is often difficult, as the distinction between produced and purely natural goods and assets is not always clear. E.g., changes in the quantity of agricultural products could be seen as economic impact as in the EVI (because it measures part of economic production) or as physical impact (because it measures a change in natural food or fiber).
12 It is generally acknowledged that structural vulnerability is negatively correlated with the quality of economic policy (Guillaumont, 2009, p. 186).
Climate change vulnerability and the identification of least developed countries 5
to a large extent in the other two criteria, GNI and HAI.13 14 Income and human capital are typically regarded as key factors for adaptive capacity or resilience to shocks. However, as income is used as basic criterion for overall economic development and low human capacity is a handicap to development in itself, GNI and HAI are separate indicators rather than elements within the EVI. A review of the treatment of climate change vulnerability in the LDC criteria requires, thus, considering not only the EVI, but also GNI and HAI.
III. Impacts of climate change on development
This section reviews major expected developmental impacts of climate change. The selection of impacts mainly follows IPCC (2007), but takes into account updated information from UN DESA (2009), National Research Council (2010) and other sources.
This section focuses on the role of climate change in increasing vulnerability in the following areas: natural disasters; agriculture and food security; health; fresh water; coastal and marine zones; and terrestrial ecosystems and biodiversity. These areas are identified as main areas impacted by climate change in the IPCC and related work as well as by the CDP (CDP and UN DESA, 2009). It should be noted that climate change has been linked to a series of other development impacts such as labour productivity, international migration, conflict and poverty. However, these areas are outside the scope of the current paper. Moreover, this paper focuses on selected direct developmental impacts of and exposure to climate change, leaving out indirect effects.
The issues or areas selected above may overlap to a significant extent. For example, changes in water availability and changes in agricultural production are among the main impacts of climate change. However, water availability itself is a main factor for agricultural production. Still, reduced water availability can lead to other important impacts for household and industrial consumption. Moreover, agricultural production depends on many other factors as well, such as temperature, soil nutrients, seeds, fertilizer and agricultural management methods.
A. Natural disasters
The impact of climate change on natural disaster is the most widely discussed consequence of climate change. In fact, it is often the only area addressed in several climate change vulnerability studies (e.g., Brooks, Adger and Kelly, 2005, Yusuf and Francisco 2009, Harmeling 2010). Typically, four main catego-ries of natural disaster are distinguished: geophysical (such as earthquakes and volcanoes), meteorological (storms), hydrological (such as floods) and climatological (such as drought, heat waves and cold waves). Climate change is expected to increase the frequency, the geographic distribution and the intensity of some weather events and extremes (IPCC, 2007, Summary for policymakers), and all weather-related disasters (i.e., meteorological, hydrological and climatological) are potentially impacted by climate change. Geophysical disasters are not expected to be impacted by climate change.15
13 The Human Asset Index (HAI) contains four indicators, all weighted equally: Percentage of population undernourished, rate of mortality for children aged five years and under, gross secondary enrollment rate, and adult literacy rate.
14 Guillaumont notes that low human capital can be source of reduced resilience, but does not treat it as vulnerability factor (Guillaumont, 2009, p. 176). He also notes that GDP per capita (which is highly correlated with GNI per capita) is a common proxy for resilience (Guillaumont, 2009, p. 228, note 24).
15 See also Neumayer and Barthel (2010).

6 CDP Background Paper No. 15
Natural disasters are a function of the hazard itself, exposure and resilience.16 Hence, if climate change increases the frequency and magnitude of certain natural hazards, it may lead to more frequent and more severe disasters, depending on direction and magnitude of changes in exposure and resilience. For in-stance, it has been argued that the increase in natural disaster occurrence and intensity observed over the past decades was driven primarily by an increase in exposure (UNISDR, 2009). Low and lower-middle income developing countries are among the countries facing the highest risk of human and economic losses due to disasters. Population growth and unplanned economic development in these countries are main drivers for the increase in exposure. Hence, further increases in exposure are very probable, even if policy instruments such as land zoning and planning can play a large role in reducing exposure. The increase in exposure has been found to have outweighed improvements in resilience(UNISDR, 2009).
It should be noted that destruction of economic assets does not only reduce the wealth of impacted countries, but can also lead to long lasting economic development consequences through the impact on human capital.17 Even if growth rates are able to rebound relatively quickly, development can be delayed for long periods.
The link between climate change and climatological disasters is relatively straightforward. Most studies project an increase in frequency and spell of heat waves and a decrease in cold waves, in line with common perceptions of consequences of higher average temperatures.18 The main direct impacts of changes in extreme temperatures are on human health, livestock and agricultural production.
Increased frequency in extreme precipitation and overall higher precipitation intensity are very likely consequences of climate change.19 This can lead to increased and more severe flooding, depending on timing of snow and rain fall, river basin conditions and flood prevention infrastructure (IPCC, 2007, Summary for policymakers). Floods are the most frequent natural disaster, leading to a loss of life, destruction of physi-cal capital, reduced agricultural production and other effects such as increase in water borne diseases and reduced water quality. Increased glacier melting can also lead to increased flooding, including through the outburst of glacial lakes. Moreover, intense and extreme precipitation is also the main cause for the high vulnerability of the transport sector found in some developing country studies, in particular if roads are unpaved (World Bank, 2009).
Even though total precipitation is expected to increase as a result of climate change, many studies also project in increase in meteorological drought conditions, i.e. prolonged period of below-normal precipi-tation.20 Many dry areas are expected to become drier and even areas where annual precipitation increases, intra-annual dry spells can increase as precipitation is expected to be more intense but less frequent. It should be noted that the extent to which meteorological drought leads to hydrological drought (low water levels in rivers, aquifers, lakes and reservoirs) or agricultural drought (reduced crop production and plant growth) also depends on many developmental factors such as changes in water use, practices in upstream areas, availability of irrigation infrastructure, and the use of drought resistant crops. Overall, increased drought can lead to
16 See 2010 earthquakes in Haiti and Chile are useful examples in this regard. Hazards were similar, exposure probably higher in Haiti, but the main difference in impacts can be explained by the far lower resilience of Haiti.
17 For the impact of natural disaster on long-term income transmitted through reduced educational attainment, see e.g. Kim (2010).
18 IPCC (2007, Summary for policymakers) assigns more than 90 -99 per cent probability to an increase in heat waves.19 IPCC (2007, Summary for policymakers).20 IPCC (2007, Summary for policymakers) assigns 66-90 per cent probability to an increase in drought affected areas.
Dai (2010) provides a recent comprehensive study on climate change and drought.
Climate change vulnerability and the identification of least developed countries 7
reduced agricultural production and thereby, reduced food security. It may also induce indirect effects such as migration to urban areas. Furthermore, longer dry spells are a key factor for wild fires, even though forest management and other approaches have an important role to play. Wild fires can lead to a massive destruc-tion in natural capital and have severe health implications.
The influence of climate change on meteorological disasters, in particular hurricanes, is among the most debated possible climate change impacts. Most controversies are about the detection of trends in hurricanes and the attribution of such trends to climate change. Both questions, however, are not vital for identifying LDCs. A recent report commissioned by the World Meteorological Organization (Knutsen and others, 2010) concluded that the intensity of hurricanes at the end of the century is expected to increase while the overall frequency of hurricanes will decrease in the North Atlantic area. No conclusive assessment was available for other cyclone areas. The intensity of extratropical storms is also often expected to increase. Due to the complexity of storms, there is a large degree of uncertainty on future impacts. Depending on exposure and resilience, cyclones and other storms can lead to loss of life and severe economic damages, in particular as cyclones often hit areas where economic activities are concentrated. The impact of cyclones will be further impacted by sea level rise, as it will increase the area affected from storm surges.
B. Agriculture
There are various channels through which climate change impacts agricultural production, in addition to natural disasters discussed above. Higher temperature generally increases growing seasons in colder regions, but decreases them in warmer zones. Precipitation increases soil moisture and freshwater availability, general-ly boosting production. Both level and distribution of precipitation play an important role. Increased rainfall variability and intensity can have negative impacts for both rain fed and, to a lesser extent, irrigated agri-culture. Moreover, a higher atmospheric concentration of carbon dioxide enhances plant growth and water use efficiency for various crops. However, such positive effect of carbon dioxide does not materialize in areas where nutrient availability, in particular nitrogen availability, is the dominant constraint to plant growth.
Generally, it is expected that agricultural production will decrease in lower latitude countries and increase in higher and mid-latitudes as long as global warming remains below 3⁰C degree (IPCC, 2007). If average global temperatures increase even more, agricultural production could decline in higher latitudes as well. As LDCs and other low-income countries are located in lower latitudes, the impact on agricultural production from climate change is likely to be negative, thereby affecting food security.21
Against this background, existing studies indicate a wide range of the magnitude and even the direction of the climate change impacts on agriculture, in particular at the country level. Such discrepancies are due to differences across models on precipitation changes at the regional level as well as uncertainty with regard to the extent to which theoretical carbon fertilization effects will materialize in agricultural practice (IPCC, 2007, chap. 5). Moreover, many studies concentrate on mean temperature and precipitation chang-es, thereby excluding negative effects from extreme events. Lastly, agricultural adaptation responses such as changing crop varieties are often excluded.22
21 It should be noted that food security is a far broader issue than agricultural production. However, linkages between climate change and other aspects of food availability, food accessibility, food stability and food utilization are beyond the scope of the present paper; see Ziervogen and Ericksen (2010) for a recent survey.
22 For a recent example providing a relatively comprehensive view on agriculture in the economy using a multi-region computable general equilibrium models, see Calzadilla and others (2010). That paper finds climate change is expected to reduce agricultural growth rates, even for low temperature increases and relative short timeframes of ten years.
8 CDP Background Paper No. 15
C. Health
There are various channels through which climate change is expected to affect human health. As discussed above, climate change could increase climatic hazards such as heat waves, droughts and floods. Reduced fresh water availability, increased ground-level ozone and increased spread of bacterial contaminants caused by climate change could lead to increase in mortality and diseases due to unsafe water, sanitation and hygiene, which constitutes one of the biggest health risk factors in developing countries (World Health Organization (WHO), 2008). Climate change is also expected to increase the size of areas where vector-borne diseases such as malaria and dengue fever are endemic, which again could lead to increased health burden in the absence of countervailing measures. Finally, rising high temperatures, even outside of heat waves, are expected to increase cardiovascular and respiratory diseases, whereas rising low temperatures would decrease the burden of disease.
Overall, negative health impacts are expected to dominate, not only in developing countries but also in developed countries such as the United States (National Research Council, 2010). The magnitude of fu-ture negative effects, however, remains quite uncertain. Estimates for the current situation find only a modest role for global climate change as risk factor for mortality and morbidity. A recent report by the WHO on global health risks attributes 141,000 deaths (equivalent to 0.2 per cent of world deaths) to climate change in 200423, predominantly in poor countries. However, not all possible health impacts are included in the report. Africa is found to be the most affected region in relative terms. Country level data, however, are not available. Because any mortality and morbidity increase leads to a decline of human capital, it exacerbates structural development handicaps of countries.
D. Water availability
Both current observations and climate projections indicate that freshwater resources are very strongly impacted by climate change, which would have important development implications. First, average water availability and its distribution over time critically affect agriculture, as discussed in subsection B above. However, changes in water availability can have a wide range of further development impacts.
The supply of safe drinking water can be affected. Depending on water infrastructure and manage-ment techniques, both reduction in water availability and increase in water variability caused by changes in precipitation, runoff and river flows can have detrimental effects. Moreover, increases in temperature can have negative effects on water quality. Heavy precipitation events and flooding can also lead to increased water pollution, in particular if environmentally unsafe agricultural and mining practices are employed and waste water treatment facilities are insufficient. In particular for many small island developing states, saltwa-ter intrusion due to sea level rise and storm surges can further diminish already scarce water resources.
Changes in river flows and runoff can affect electricity production from hydropower plants. This has been identified as major impact of climate change in countries such as Mozambique or Ghana (World Bank, 2010). Impacts, however, could be very diverse at the regional level. For example, in Europe, it is expected that hydropower production in Scandinavia will increase, whereas it will be reduced in South and South-East Europe (Bates and others, 2008). Reduced hydropower production can lead to lower economic activity depending on the overall electricity production capacity, the mix in electricity sources and the availability of regional power pools.
Moreover, climate change can not only affect the supply of freshwater, but also the demand, typi-cally moving in opposite direction. Higher temperatures may increase the water demand for cooling and for
23 WHO (2009). The study attributes to climate change a slightly higher share, 0.4 per cent, of a broader health impact measure, disability-adjusted loss of years (DALY).
Climate change vulnerability and the identification of least developed countries 9
domestic use. Irrigation may be chosen as adaptation measure in response to decreased water availability and increased rainfall variability for rain fed agriculture.
E. Coastal and marine zones
Coastal and marine zones will be impacted by climate change in multiple ways, in particular by sea-level rise, ocean acidification, ocean warming and possible impacts on cyclones and extra-tropical storms. Sea-level rise may permanently inundate low-lying coastal area, destroying or damaging land used for productive activi-ties. In many countries, coastal areas host a large share of population, infrastructure and economic activity. Moreover, sea-level rise amplifies the effect of storm surges discussed in subsection A, which may happen with increased intensity if sea surface temperatures rise. It may also lead to saltwater intrusion, damaging freshwater supply as discussed in subsection D. Seal level rise also contributes to coastal erosion and the decline of critical ecosystems such as mangroves, which are already threatened through economic develop-ment in coastal zones.
Due to ocean warming and ocean acidification24, coral bleaching is becoming a widespread phe-nomenon. Live cover of coral reefs continues to decline and corals are increasingly threatened by extinction (Butchart and others, 2010, and Secretariat of the Convention on Biological Diversity, 2010). This has important development implications. First, corals are an important factor for tourism in many island and coastal countries. Second, damages to coral reefs negatively affect the habitat of certain fish species with negative implications for local communities and for food security. Moreover, the warming of the oceans is expected to lead to a migration of fish from lower to higher latitude waters, negatively affecting fishery sec-tors in most low income countries (Food and Agriculture Organization of the United Nations (FAO), 2009, and Cheung and other, 2009). These local and regional fishery impacts of climate change are in addition to threats to fishery industry and food security induced by global overfishing.
F. Terrestrial ecosystems and biodiversity
Vulnerability of ecosystems is not included in the EVI, as the CDP makes a distinction between economic vulnerability and ecological fragility. However, climate change impacts on a range of ecosystem services that are essential for economic development in many developing countries. Recently, there have been increased efforts to better integrate ecosystem services into more mainstream development thinking. The Economics of Ecosystems and Biodiversity (TEEB) study led by UNEP recently provided an attempt to calculate eco-nomic benefits (see www.teebweb.org). At the methodological statistical level, the System of Environmental Economic Accounts will provide – in its volume 2 – a detailed treatment and classification of ecosystems linked to standard economic and environmental accounts.25The complementary work on the revision of the Framework for the Development of Environmental Statistics could also be instrumental.26
An important result of the TEEB study is that ecosystems are economically more important for developing countries than for developed countries. Similarly, within countries, the poor are more ecosystem-dependent than the rich. Even though this result is hardly surprising given the lower human and physical capital stocks in poorer countries and within poorer segments of societies, it can nevertheless have important implications for the measurement of structural handicaps of low income developing countries.
24 Ocean acidification is a lesser known climate change impact, caused by the transmission of increased CO2 levels in the atmosphere to changes in the hydrosphere.
25 For more information on the SEEA see United Nations Committee of Export on Environmental Economic Accounting at http://unstats.un.org/unsd/envaccounting/ceea/default.asp.
26 See http://unstats.un.org/unsd/environment/fdes/fdes_egm.htm.

10 CDP Background Paper No. 15
Climate change can contribute to land degradation, together with other important drivers such as land use changes and inappropriate agricultural production methods. An important consequence of land degradation is a reduced potential for agriculture. It can also increase water run-off and, thus, increase the risk of flooding. Whereas the climate change- agriculture nexus as well flood risks have been discussed above, information on land degradation could in principle provide additional information on long-lasting handicaps that are clearly structural. Mountainous ecosystems are threatened by climate change as well. As discussed in sub-section D above, glacier retreat as well as changed precipitation and snow melt pattern are expected to change the hydrological cycle in mountainous regions.
Among terrestrial ecosystems, forests play a prominent role in the climate change discourse, as they have not only major impacts on climate change, but they are also impacted by it. Increased temperatures, changes in precipitation patterns, higher carbon dioxide levels, increased extreme climatic events and in-creased occurrence of native and invasive forest pests affect forests substantially (FAO, 2010). Consequently, climate change induced forest degradation can destroy timber resources, harm other natural resources, severely impact livelihoods and lead to further exacerbations of climate change.
Climate change has been identified as major risk factor for species survival and species abundance, in addition to factors such as land use changes, agricultural practices, pollution and invasive species. Generally, biodiversity is declining over the past four decades and pressures are increasing (Butchart and others, 2010). This would not only negatively impact people whose livelihoods depend on these species, it would also diminish a possible future use of species in productive economic activities.
IV. Coverage of climate change vulnerability in the LDC criteria
This section considers which of the indicators used for the identification of LDCs in 2006 and 2009 are able to capture the vulnerabilities to climate change discussed in the previous section. It identifies indicators that contain information on the impact of and exposure to climate change. It should be noted, though, that the indicators may also contain information on vulnerability factors that are not related to climate change. Therefore, changes in indicator values over time (as well as divergences across countries) cannot be attributed to climate change vulnerability alone. However, as noted above, for the question of identifying LDCs it is not necessary to disentangle different drivers of vulnerability.
Table 1 below summarizes the coverage of climate change vulnerability in the LDC indicators in the six areas analyzed in the previous section. As discussed, these areas are interdependent as, e.g., water avail-ability affects agriculture. In the table, “main indicators” are those that cover vulnerability to a relatively large extent. “Other indicators”, however, are relevant only for very specific vulnerabilities. The table also contains an overall assessment on the coverage of climate change vulnerability areas by the LDC indicators, thereby helping to identify gaps in coverage. The table does not contain indicators measuring the resilience to climate change, because there is no indicator in the LDC framework that measure resilience in the six specific areas discussed earlier. However, as noted in section II, national income and the level of human assets increase the general resilience of economies to shocks. Therefore, GNI per capita and all four HAI indicators provide rel-evant information on climate change vulnerability of countries. To the extent that export concentration can be seen as a proxy measure for overall economic diversification, it could also be seen as a general resilience indicator. Hence, general resilience of economies to external shocks, including climate change, appears to be well covered in the current LDC indicators.

Climate change vulnerability and the identification of least developed countries 11
In countries where agricultural products are major exports, increased agricultural instability would also result in increased export instability. Hence, export instability could also be seen as indicator capturing climate change vulnerability, which is excluded here, though, because the effect would only be indirect. In case of tourism, which is of high importance for many coastal as well as for mountainous countries, an enhanced export concentration index covering both merchandise and services exports could also provide information on exposure to climate change. However, currently information on export concentration is available for goods exports only.
Overall, coverage is best for agriculture and health, followed by natural disasters. Only limited coverage is provided in the areas water availability, coastal and marine zones, and terrestrial ecosystems and biodiversity. Moreover, the coverage in these areas is restricted to the health and agricultural impacts of reduced water availability and the impacts of storm surges in coastal areas. All these impacts are already accounted for in the indicators covering the first three areas. Exposure of countries to negative consequences of climate change on fisheries and forests are reflected in the indicator on the share of primary activities in GDP. However, in case of forestry it should be noted the indicator reflects mainly timber production and, therefore, underestimates the true economic value of forest ecosystem services.
The exposure of economies to climate change-induced impacts on agricultural production is well covered through the share of agriculture, fisheries and forestry in GDP. Obviously, alternative measures for the exposure of agriculture to external shocks could also be used, for example the share of agriculture in em-ployment or the share of population depending on agricultural activities, both reported by FAO. However, it is not clear that employment based indicators would better capture climate change vulnerability than
Table 1: Coverage of climate change vulnerability in the LDC indicators
Natural disaster Agriculture Health
Water availability
Coastal and marine zones
Terrestrial ecosystems and
biodiversity
Main indicators-exposure
Share of agriculture, fisheries and forestry in GDP
Main indicators- impact
Homelessness Agricultural instability
Under five mortality rate
Other indicators-exposure
Population
Share of agriculture, fisheries and forestry in GDP
Share of agriculture, fisheries and forestry in GDP
Share of agriculture, fisheries and forestry in GDP
Other indicators- impact
Agricultural instability
Undernourishment
Export instability
Under five mortality rate
Agricultural instability
Homelessness Homelessness
Coverage Partial Comprehensive Comprehensive Minimal Minimal Minimal
Source: Author assessment.
12 CDP Background Paper No. 15
GDP based measures. Agricultural instability reflects to a large extent climate variability, which indeed is expected to increase in many areas of the world due to climate change. Moreover, if climate change induces a permanent change in agricultural yields, the indicator on agricultural instability would be increased in the transition period. Hence, the current EVI captures not only impacts of climate change on agricultural output variability, but to some extent also impacts on production levels.
Climate change impacts on global food supply and prices would be partially accounted for through the denominator of the export instability indicator, because exports are deflated by an index of import prices. The consequence of impacts on food security would be reflected in HAI indicators such as in the undernour-ishment indicator.
The child mortality indicator (U5MR) comprehensively captures the impact of external risk factors, including climate change, as well as the effectiveness of health systems. It should be noted that in relative terms, climate change related health impacts have been found to be more important for children than for adults (WHO, 2009). This is because mortality rates caused by diseases such as malaria or cholera are higher for children than for adults. Moreover, behavioural and occupational risk factors play a relatively large role for adults. Hence, the current health indicator U5MR gives implicitly a higher weight to climate change as risk factor for the destruction of human capital.
The main LDC indicator capturing impacts of climate change related disasters is homelessness due to natural disasters. In addition, agricultural instability captures some disaster impacts on agricultural pro-duction, whereas the share of agriculture in GDP provides information on exposure of agriculture to external shocks, including disasters. As disasters are typically localized events, they often affect a larger proportion of the population or the economy in smaller than in larger countries. Hence, population size can be seen as proxy for the overall exposure of countries to disaster.
The homelessness indicator measures the share of the population that required assistance in from of shelter as result of a natural disaster. The CDP chose homelessness as component in EVI instead of more commonly used disaster variables because it viewed it as more comprehensive than people killed and more easily understood than people affected, which are defined as persons requiring immediate assistance in form of food, water, shelter, sanitation or medical treatment (Guillaumont, 2009, p. 189). Yet, climatological disasters hardly cause homelessness, but often require medical and food assistance. Therefore, the impact of the class of natural disaster that is closely linked to climate change is only partially covered in the EVI used in 2006 and 2009.
Consequently, coverage of climate change vulnerability could be improved by identifying new suitable indicators in the areas water availability; coastal and marine zones; and terrestrial ecosystems and biodiversity. Moreover, introducing an alternative to the indicator homelessness to natural disasters could be beneficial. However, new or alternative indicators in the areas of agriculture and health appear not to be warranted.

Climate change vulnerability and the identification of least developed countries 13
V. Improved coverage of climate change vulnerability in the LDC indicators
A. Options for addressing climate change in the LDC indicators
There are two main options for improving the coverage of climate change vulnerability in the LDC indica-tors. One option is to construct a specific climate vulnerability index and add it to the existing criteria, either as sub-index to the EVI or as a separate criterion. The second option is to modify existing EVI indicators by revising or adding climate change related components. We pursue the second option, as it best fits the view of climate change as an aggravating factor rather than a separate structural handicap. Moreover, as shown in the previous section, some areas of climate change vulnerability are already comprehensively covered by the existing LDC indicators. Hence, the creation of a climate change vulnerability index, without corresponding changes in EVI and HAI, would lead to double counting of vulnerabilities. At the same time, because the climate-related indicators identified in the previous section also provide information on non-climate related vulnerabilities and the availability of human capital, moving those indicators to a separate climate change vulnerability index would lead to incomplete measures for economic vulnerability and human assets.
Candidate indicators to be explored are drawn from a wide range of sources, from climate change vulnerability studies over individual components of climate change vulnerability indices27 to issue-specific indicator sets. In line with the current vulnerability framework used for the identification of LDCs, indica-tors measuring exposure as well as indicators relevant for measuring development impacts will be explored. Consequently, indicators measuring climatic changes per se or their bio-physical impacts will be excluded. Like in any indicator selection exercise, it is important to vet indicators against predefined requirements. In this regard, the CDP considers data quality, methodological soundness and availability of data with regard to frequency, coverage and robustness (CDP and UN DESA, 2008).
B. Measurements versus projections in analyzing climate change vulnerability
The current indicators used in the LDC criteria are based on actual observations, often using — where appli-cable — averages of past values to exclude transitory variations. Hence, it is implicitly assumed that current economic vulnerability expressed by the EVI is also a relevant indicator of vulnerability in the future. More specifically, the indicators contained in the exposure index, in particular population size and remoteness, are only moving relatively slowly over time and are well suited to be used as proxies in vulnerability analysis for past, current and future shocks. The shock index, however, is retrospective in nature, containing information on magnitudes of impacts observed up to now.
Because the most critical climate change impacts are expected to happen in the future, the use of model-based projections could in principle be of interest for measuring climate change vulnerability in the LDC context. An alternative method to capture anticipated future changes is to select indicators captur-ing impacts that are expected to be become more important in the future, even if the current impacts are too small to justify the inclusion of such indicators. The literature on climate change vulnerability is not uniform with regard to the treatment of projections. Some contributions use the approach employed by the EVI and restrict themselves to indicators based on past and current observations, see for example Brooks and others (2005), Expert Group to the Subcommittee of the Pilot Program for Climate Resilience (2009), Yusuf and Francisco (2009), Busby and others (2010), Guillaumont and Simonet (2011). Other studies,
27 For recent reviews of climate change vulnerability indices, see Eriksen and Kelly (2007) and Füssel (2009). The reviews highlight methodological concerns as well as wide disparity in vulnerability rankings.
14 CDP Background Paper No. 15
though, include projections on future climate changes and their impacts, see, among others, Füssel (2010), Diffenbaugh and others (2007), Yohe and others (2006), World Bank (2009, 2010), Wheeler (2011). For example, the World Bank (2010) uses projections for impacts in the areas of health, agriculture and sea-level rise, but uses past data for disaster impacts. Similarly, Füssel (2010) uses projections in the areas of water, food security and coastal zones, but observations for health impacts. Both studies use latest available data for indicators of exposure and resilience, rather than projections for future exposure and capacity.
Whereas projections can potentially help in assessing the extent of vulnerability to future climate change, they may not be suitable for identifying LDCs. Many of the existing projections on developmental impacts of climate change are one-time studies, which renders them not suitable for the LDC triennial reviews. A further problem is the geographic scale and coverage of available models. Typically, multi-country models of climate change impacts do not include country-level information for most LDCs and smaller de-veloping countries. Even though single-country models become more popular, coverage is far from universal. Moreover, results may not be comparable across countries due to different models and hypothesis used.
Besides issues of data coverage, frequency and comparability, there are other factors that make the use of projections not recommendable. Model-generated indicators are more difficult to understand than indicators based on observed measurements only. The complexity of many scenarios and climate models may also reduce the transparency of the EVI, thereby further compromising acceptance of the information it tries to convey. Moreover, studies on projected climate change impacts often use the mean or median of various runs of climate models. To reduce uncertainty, studies usually take the average of various models. However, given the variability of model projections, in particular with regard to future precipitation patterns, there remains a significant amount of uncertainty. This uncertainty is not only about the size, but in some cases even the direction of future impacts. E.g., for high latitudes, small temperature increases are expected to lead to higher agricultural yields, whereas higher increases would lead to a decline.
There are also questions about the internal consistency when vulnerability analysis combines indica-tors on projected impacts with indicators on current or past exposure and resilience. Prospective vulnerability depends not only on the magnitude and frequency of future climatic changes but also on future exposure, re-silience and adaptive capacity, which are also quite complex to be modelled with some degree of confidence. Combining projected events with current exposure and resilience would imply using different timescales in vulnerability analysis and could, therefore, be problematic.
Lastly, the value-added of projections in terms of better predicting future vulnerability may be more limited in the case of identifying LDCs than in other contexts. First, as discussed above, climate change is expected to amplify existing vulnerabilities, which in principle could be identified by observations.28 Second, the EVI measures vulnerability of countries in relation to others rather than in an absolute manner. Hence, climate change-induced increases in vulnerability that affect all developing countries uniformly have only a minor impact in designating countries as LDCs.
C. Candidate indicators for capturing climate change vulnerability in the EVI
This section explores possible indicators to cover climate change vulnerability in the areas where current coverage in the EVI has been found to be only partial or minimal, i.e. in the areas natural disasters, water availability, coastal zones and terrestrial biodiversity and ecosystems.
28 See also IPCC (2007), chapt. 19.
Climate change vulnerability and the identification of least developed countries 15
1. Natural disasters
As noted above, natural disasters are only partially covered in the LDC indicators used for the 2006 and 2009 reviews, as climatological disasters such as drought or extreme temperatures are not covered by the indicator on homelessness, which is based on disaster data from the EM-DAT database29 and United Nations population data. Whereas there are also other international disaster databases such as NatCat30 and Sigma31, the EM-DAT database is very comprehensive and publicly accessible, thereby contributing to increased transparency. Data coverage and quality have improved over time. However, there can still be significant discrepancies between EM-DAT and other sources of information. For example, the national adaptation plan of action (NAPA) from Lao PDR mentions a number of droughts not included in EM-DAT.
Beyond the data provided by EM-DAT, the risk estimates for loss of life and economic damage from the Global Assessment Reports of the United Nations International Strategy for Disaster Reduction (UNISDR, 2009, and UNISDR, 2011), could also provide alternative indicators.32 While these risk estimates avoid the use of projections, they are based on various disaster-specific models. Hence, they are probably less transparent than the averages of past disaster impacts that can be obtained from EM-DAT. The report also provides estimates of human and economic exposure to natural disasters, which could in principle be of interest for the EVI exposure index. However, as exposure is a component of risk, the inclusion of such indicators in the EVI could lead to double-counting. The SOPAC-UNEP Environmental Vulnerability Index contains a sub-index on exposure to natural disasters. However, most of its indicators are based on observed climatic patterns or natural hazards. Hence, and in line with the discussion in section II above, they can be regarded as purely bio-physical indictors that are outside the scope of the EVI. Moreover, current data is not readily available.
Besides statistics on homelessness, the EM-DAT database has information on the number of people killed, number of injured, number of affected persons (i.e., persons requiring immediate assistance in form of food, water, shelter, sanitation or medical treatment), and on economic loss. Moreover, the annual disaster statistical review uses the term “victims”, defined as the sum of people killed, affected, homeless or injures, as main indicator for the human impact of natural disasters (Vos and others, 2010).
Table 2 presents information on the coverage of the four main disaster types by the different indica-tors. However, directly calculating the share of disasters for which information is available is difficult. First, zero impacts of a disaster could indicate that the specific impact did not occur or that information is missing. Second, information on homelessness and injuries in EM-DAT is only available on an annual basis, but not included in the detailed disaster lists. Hence, the table is using the number of country-year pairs in which the EMDAT database includes at least one disaster or disaster impact of the main types. The time period considered is 1991-2010, covering all 130 developing countries included by the CDP in the calculation of the LDC indicators. In addition, table 2 contains as memo item the total number of disasters and impacts over the 20-year period.
29 The data base, also known as the OFDA/CRED International Disaster Database, is available at www.emdat.be.30 Natcat is maintained by the reinsurance company Munich RE, see www.munichre.com.31 Sigma is maintained by reinsurance company Swiss Re, see www.swissre.com.32 See www.preventionweb.net for more information and data for the 2009 and 2011 reports.

16 CDP Background Paper No. 15
Table 2: Coverage of disaster types by indicator, 1991-2010; number of country-year pairs and percentages
Disaster type Occurrence KilledTotal
affected Victims Homeless InjuredEconomic damage
(number) (%) (%) (%) (%) (%) (%)
Climatological 404 36.14 63.86 79.21 5.69 9.69 23.51
Hydrological 1,052 82 94 98.95 41.16 32.28 35.65
Meteorological 529 80.53 86.39 96.22 40.45 44.01 49.34
Geophysical 290 72.76 91.72 95.52 45.86 71.12 37.93
All disaster 2,275 72 87 94.37 35.5 36.7 36.97
Memo item: 4,381 1,288 4,288,479 4,289,768 102,054 4,829 662,832,763
Total (number of events, number of thousand people, US$ million)
Source: Author calculations, based on data from EM-DAT: The OFDA/CRED International Disaster Database, accessed on 10 December 2010
The table shows that in terms of overall disaster coverage victims is the most comprehensive indicator, followed by its two components, total affected and people killed. Coverage is rather low for the three other indicators, homeless, injured and economic damage. The lower coverage of killed compared to total affected can certainly be explained by the fact a sizeable number of disaster does not cause fatalities. Actually, the difference between coverage of victims and total affected probably signals an underreporting of non-fatal human impacts for a significant number of disaster events, as it appears unlikely that disaster causing deaths do not lead to people requiring assistance or injuries. On the other hand, the very low coverage of home-less, injured and economic damage probably indicates that underreporting is a serious problem for these indicators.
Climatological disasters, including drought and extreme temperatures that hardly cause homelessness or injuries, would be much better covered by the victims indicator. That indicator also has the best country coverage. Of the total 130 countries, 122 reported victims in any disaster over the 20 year period. This is the same as for people affected, slightly more than for people killed (119 countries) and significantly more than for homeless (110 countries), injured (102 countries) and economic damage (100 countries). Generally, cov-erage for climatological disasters is more limited, ranging from 80 in case of victims to 14 for homelessness.
Based on coverage, the victims indicator appears to be a promising alternative to the homelessness indicator. Its coverage is superior to the one of total affected. Moreover, according to an earlier assess-ment by the CDP the indicator on people affected from natural disaster might be difficult to understand (Guillaumont, 2009). Due to its widespread use and presumed better accuracy, people killed could also be an alternative. However, it provides an incomplete view of disaster impacts. Moreover, it is driven by few extreme disasters and may, hence, be a rather inaccurate measure for risk even if hazards do not change. On the other hand, injured people and economic damage are not viable alternatives due to their low coverage, even though the latter would be a good indicator to reflect infrastructure damage and loss caused by natural disasters. Moreover, despite the widespread use of economic damage figures in international disaster risk publications, there is no standard definition for “economic damages”.

Climate change vulnerability and the identification of least developed countries 17
Looking at the data for the share of victims, people killed and homeless in the total population in more detail reveals that the three are positively, but not very strongly correlated.33 The rank correlations between share of people killed and share of victims is 0.49, even though deaths are included under victims. The rank correlation between share of people killed and share of homeless is 0.5, whereas the rank cor-relation between share of victims and share of homeless is 0.48. Hence, the combination of differences in disaster impacts and data coverage indeed matters for assessing vulnerability in the context of LDC identi-fication. All three indicators provide information that is complementary to the other EVI components. The rank correlation between the disaster indicators and the other EVI components is not very strong, ranging from 0.38 (victims and share of agriculture in GDP) to -0.31 (homeless and agricultural instability). Victims is also much stronger correlated with the human asset index and the GNI per capita than homelessness and especially people killed. Hence, victims best reflects the common notion than natural disasters have a disproportional negative impact on poorer and less developed countries.34
Overall, thus, the replacement of the homelessness by victims would considerably improve the reflec-tion of climate change vulnerability in the EVI, both for conceptual reasons and for better data coverage.
2. Water
Climate change is expected to negatively affect water availability in countries that face already water short-ages. Hence, inclusion of a water scarcity indicator into the EVI exposure index could provide important information. The best indicator available indicator would probably be “Percentage of total water resources used”, which is also an MDG indicator. The indicator is defined as the total ground water and surface water withdrawn for human use divided by total renewable water resources. It is provided regularly by FAO, even though frequency of updating is relatively low, approximately five years on average. It should be noted that the updating involves new measurements and estimates of water withdrawal, because long term averages are used for determining total freshwater resources. Whereas country coverage is generally good, data for most small island developing states is not available, even though water scarcity in these countries is often well documented.
Other water related indicators included in climate change vulnerability studies include proportion of population using an improved drinking water source and the Climate Vulnerability Index (See for example Füssel, 2010, and Expert Group the Subcommittee of the PCPR, 2009). The latter, however, is not updated and contains information already captured in the natural disaster indicators.35 The former, while regularly available through the MDG monitoring, is to a large extent dependent on policy choices and water resource management, as evidenced by the progress made in achieving the corresponding MDG target. Döll (2009) provides data of the vulnerability to climate change impacts on groundwater resources. The data is based on the global water resources and use model WaterGAP, which is also used for the water use indicator included
33 Following the methodology used for the 2012 triennial review of the LDCs, the share of victims, people killed and homeless of a country is computed as the average over the 1991 to 2010 period of the annual ratios of the disaster impacts (victims, people killed and homeless) recorded in EM-DAT and the population figures for the year from the United Nations Population Division’s World Population Prospect’s database. All data are as of 20 September 2011.
34 In fact, the positive correlation between victims and the share of agriculture can probably be explained with the strong negative correlation between the share of agriculture in GDP with GNI per capita, i.e. with the fact that predominantly agricultural economies generally generate only limited overall income.
35 This comprehensive index focuses on vulnerability to climate change associated with water availability (include floods and droughts), quality and access; see Sullivan and Meigh (2005).

18 CDP Background Paper No. 15
in the most recent Environmental Performance Index (Emerson and others, 2012). Whereas the WaterGAP data could overcome data quality concerns associated with the FAO data and allow addressing the spatial heterogeneity of water scarcity within countries, the indicators are not available in time series format and, thus, not suited for the identification of LDCs.
For further exploring the suitability of the available data, the incompleteness of the indicator has to be addressed. For all 13 countries with missing values, the relevant regional averages from the most recent World Water Assessment were used. Indicator values range between 0.01 per cent (Congo) and 2032 per cent (United Arab Emirates). The reason for values close to and far beyond 100 per cent is that the denominator only includes renewable freshwater resources, whereas the nominator includes also the use of non-renewable freshwater (fossil water), desalinated sea water and treated waste water. In order to avoid an extremely skewed distribution caused by a few countries that have to rely on non-conventional types of water, it would be necessary to introduce an upper boundary. This boundary is preliminary set at 90 for the purpose of this assessment.
A critical question is whether the indicator provides information that is complementary existing indicators. The indicator is only weakly correlated with the current EVI components, with rank correla-tion coefficients ranging from 0.13 (agricultural instability) to -0.5 (remoteness). With the exception of agricultural instability and population, all coefficients are negative. This is not surprising in case of the indicator on the share of agriculture in GDP (rank correlation -.376), as water is obviously a main input to agriculture. In this regard, the indicator could indeed capture a relevant vulnerability currently not captured by the LDC indicators. The negative correlation between remoteness and water use could be explained by the water scarcity of countries in the Middle East, which exhibit low remoteness values due to their proxim-ity to European markets. However, the water indicator is also correlated with export concentration (-0.22), per capita income (0.26), under five mortality rate (-0.4) and the other human asset index components. It is plausible to assume that countries with lower development status are facing handicaps such as lack of water infrastructure and appropriate water management systems. Therefore, the water indicator may not be able to adequately reflect water related vulnerabilities that are more of an economic than physical nature.36 Hence, it may be unsuitable for the identification of LDCs.
3. Coastal zones
With regard to capture exposure to climate change related impacts such as sea level rise, increased storm surges, coastal erosion and salt water intrusion, it could be possible to include an indicator on the share of population living in low elevated coastal zones (LECZ). Compared to a possible indicator on the share of land in LECZ, the share of population better reflects the exposure of population and economic assets. LECZ are defined as areas of less than 10 m elevation that are contiguous to coasts. The indicator is freely avail-able from the Center for International Earth Science Information Network (CIESIN, 2012) and has been discussed in McGranahan, Balk and Anderson (2007). It has almost full geographic coverage, and includes information for each country for three years (1990, 1995 and 2000).37
36 World Water Assessment Programme (2009) also shows that many African countries are characterized by economic rather than physical water scarcity.
37 Kiribati is the only country without data. However, given the fact that atolls of Kiribati have a maximum elevation of 3 to 4 meter, the share of population living on LECZ can be set at 100 per cent.
Climate change vulnerability and the identification of least developed countries 19
It should be noted that even though impacts of sea level rise go far beyond areas threatened by in-undation, it is unlikely that the whole LECZ will be affected. CIESIN is currently constructing a dataset on proportion of people in coastal zones for various elevation thresholds between 1 m and 12 m. However, that dataset, which is expected to be updated in the future, is not yet available. An alternative dataset has been developed by Dasgupta and others (2009), which provide different estimates for impacts from sea level rise and storm surges from 1 to 5 meter. However, this dataset has insufficient geographic coverage, as it includes only 85 developing countries and excludes most island states. Moreover, it is not known whether the dataset would be updated.
In order to see whether this indicator provides information not already covered in the present indicators, it is again useful to consider the rank correlation of the LECZ with the current EVI and relevant components, using the data from the 2009 review. The indicator is only weakly correlated with the other EVI components. The highest rank correlations are with remoteness (-0.3) and population (-0.28), as many coastal and island states are small and/or relatively close to major markets. For all other components, rank correlation is small, either positive or negative. Overall, the indicator seems to capture vulnerabilities that are not reflected in the current EVI.
In order to capture long term impacts of climate change on fisheries, indicators on trends in fish landing could be possible candidates. Data on fish landing in FAO Fishstat database is readily available with good coverage. However, trends in fish landing are not only influenced by climate change and multi-decadal natural climate variability, but also by the impact of global overfishing and by global and national responses to it, making such indicator less reliable for measuring structural vulnerability. Recently, country level data has become available for the indicator on the proportion of fish stocks within safe biological limits that is part of the MDG indicator framework.38 The indicator uses catch data to assess how many fish stocks in the exclusive economic zones of coastal countries fall in the categories recovering, developing, exploited, over exploited and collapsed. Countries with high shares of over exploited and collapsed fish stocks (and perhaps to a lesser degree also of recovering and exploited stocks) could be seen as particularly vulnerable to climate change impacts on fisheries. Due to the spatial heterogeneity of expected climate change impacts on fish stocks, such assessment may be problematic on a global scale, but it could still be meaningful in the context of LDC identification where most countries of interest are in zones where impacts are expected to be negative (Cheung and others, 2009). However, for many countries too few data is available for meaningful analysis, so further work and experiences may be necessary before assessing this fishery indicator in more detail.
4. Terrestrial ecosystems and biodiversity
The emerging area of economics of ecosystems and ecosystem services has not yet led to (economic) develop-ment indicators that could be considered for inclusion in the LDC criteria and further advancements of this work could be perhaps considered in future reviews of the LDC indicators. Because ecosystem degradation leads in many cases to a permanent reduction in ecosystem services, indicators on status or characteristics of ecosystems could in principle be useful proxies for the services they provide, even though they would normally fall outside the vulnerability framework of the LDC indicators.
38 Data is available from the Sea Around Us Project (http://seaaroundus.org); see Kleisner and Pauly (2010) for the methodology.

20 CDP Background Paper No. 15
The recently published beta version of the global land degradation information system GLADIS (Nachtergaele and others, 2011), produced within the framework of the Land Degradation Assessment in Drylands project led by FAO, contains a comprehensive land degradation index consisting of indicators for various dimensions of land degradation. In principle, the index or its components could provide interesting information on permanent shocks on ecosystems that are essential for economic activities in many develop-ing countries. However, the work is still under review and it is not clear how frequently the index or its components will be monitored; the previous global land degradation assessment was conducted in 1991. Moreover, for utilizing land degradation information for identifying LDCs, degradation caused by planned land use changes should probably not be taken into account. The ongoing process under the United Nations Convention to Combat Desertification (UNCCD) on indicators on the impact of desertification and land degradation may lead in the future to indicators and datasets that could play a role in identifying LDCs.
The impacts from storms and wild fires on forests could be captured if economic damages would be included in the natural shock index, even though this would only include the loss in timber. However, as shown above, data coverage of economic damages from disaster remains low. Information on changes in forest cover and forest types is readily available and could in principle be incorporated in the shock index. However, negative changes in these variables are to a large extent driven by planned land-use changes and would, thus, not qualify as structural handicaps. Coverage and quality of data on forest pests are regarded as poor, so that they are presently not suited for LDC identification.
The increased interest in the economic value of biodiversity should lead to improved biodiversity indicators in the future. Currently, the impacts of species extinction and abundance on economic develop-ment cannot easily be determined. Moreover, indicators such as the red list index (measuring extinction risk of species) or the living planet index (measuring population trends), which could be of some interest for the shock index, are not available for most countries.
VI. Impact of improved coverage of climate change vulnerability in the EVI
As mention in the introduction, the CDP refined the LDC criteria in 2011 (CDP, 2011). In the refinement, the Committee took into account several of the recommendations made in an earlier version of this paper. It decided to replace the homelessness indicator with the one on victims due to the better coverage of various disasters, in particular to those related to climate change, as discussed above. It also decided to include an indicator on the share of population living in LECZ to capture the vulnerability coastal impacts associated with climate change. Whereas the CDP viewed an indicator with an elevation threshold of 3 m as prefer-able, it decided to use the indicator with a threshold of 10 m until reliable data for lower thresholds becomes available. The CDP also shared concerns on the possible water scarcity indicator and did not identify any other suitable indicator for further enhancing the EVI either. It also did not recommend changes to the human asset index or the GNI per capita indicator. As the LECZ indicator is an additional indicator in the exposure index, the weights had to be modified. The CDP decided to reduce the weight of the size index from 1/8 to ¼, noting that disadvantages from a small population size are also captured by trade related EVI components such as export concentration and instability. As noted above, the new LECZ indicator is also correlated with population, as many coastal and island states are small.
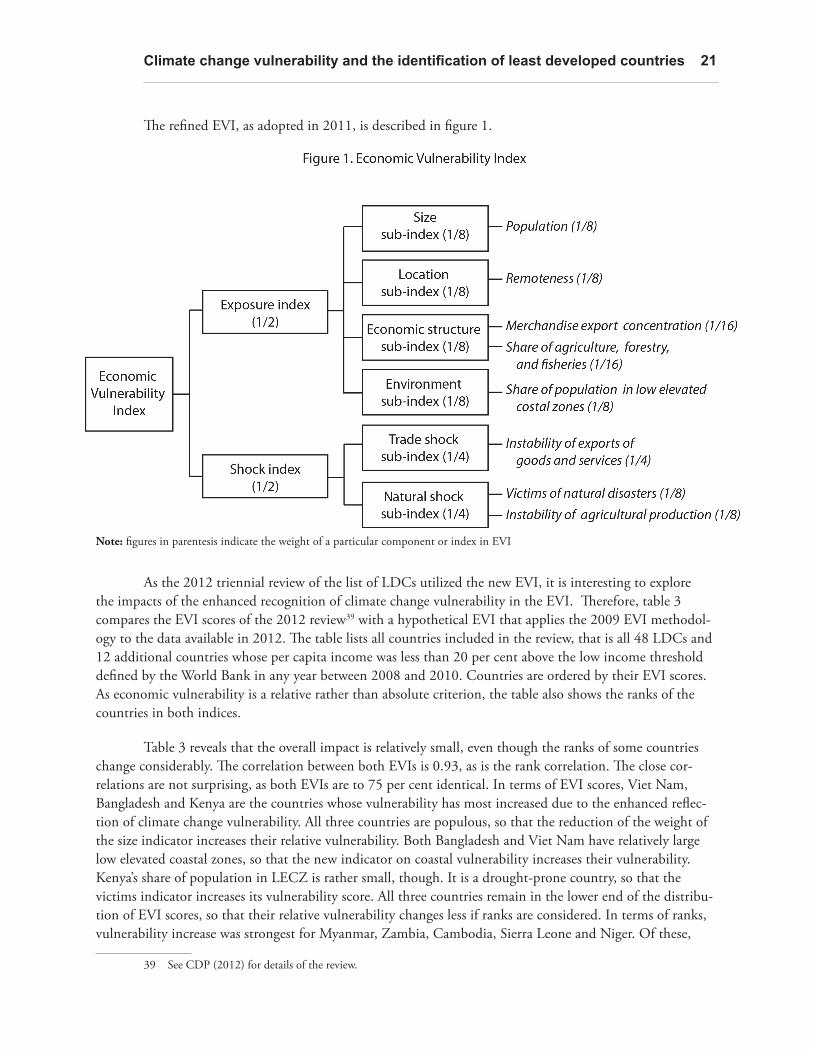
Climate change vulnerability and the identification of least developed countries 21
The refined EVI, as adopted in 2011, is described in figure 1.
Note: figures in parentesis indicate the weight of a particular component or index in EVI
As the 2012 triennial review of the list of LDCs utilized the new EVI, it is interesting to explore the impacts of the enhanced recognition of climate change vulnerability in the EVI. Therefore, table 3 compares the EVI scores of the 2012 review39 with a hypothetical EVI that applies the 2009 EVI methodol-ogy to the data available in 2012. The table lists all countries included in the review, that is all 48 LDCs and 12 additional countries whose per capita income was less than 20 per cent above the low income threshold defined by the World Bank in any year between 2008 and 2010. Countries are ordered by their EVI scores. As economic vulnerability is a relative rather than absolute criterion, the table also shows the ranks of the countries in both indices.
Table 3 reveals that the overall impact is relatively small, even though the ranks of some countries change considerably. The correlation between both EVIs is 0.93, as is the rank correlation. The close cor-relations are not surprising, as both EVIs are to 75 per cent identical. In terms of EVI scores, Viet Nam, Bangladesh and Kenya are the countries whose vulnerability has most increased due to the enhanced reflec-tion of climate change vulnerability. All three countries are populous, so that the reduction of the weight of the size indicator increases their relative vulnerability. Both Bangladesh and Viet Nam have relatively large low elevated coastal zones, so that the new indicator on coastal vulnerability increases their vulnerability. Kenya’s share of population in LECZ is rather small, though. It is a drought-prone country, so that the victims indicator increases its vulnerability score. All three countries remain in the lower end of the distribu-tion of EVI scores, so that their relative vulnerability changes less if ranks are considered. In terms of ranks, vulnerability increase was strongest for Myanmar, Zambia, Cambodia, Sierra Leone and Niger. Of these,
39 See CDP (2012) for details of the review.
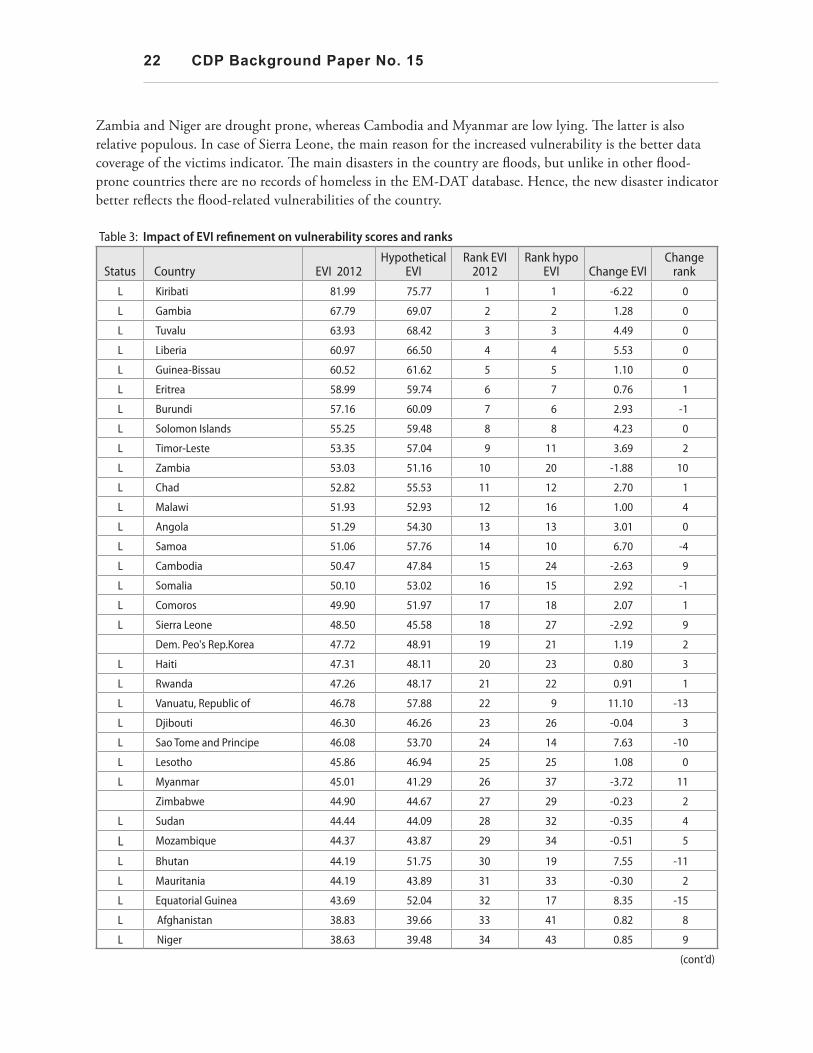
22 CDP Background Paper No. 15
Zambia and Niger are drought prone, whereas Cambodia and Myanmar are low lying. The latter is also relative populous. In case of Sierra Leone, the main reason for the increased vulnerability is the better data coverage of the victims indicator. The main disasters in the country are floods, but unlike in other flood-prone countries there are no records of homeless in the EM-DAT database. Hence, the new disaster indicator better reflects the flood-related vulnerabilities of the country.
Table 3: Impact of EVI refinement on vulnerability scores and ranks
Status Country EVI 2012Hypothetical
EVIRank EVI
2012Rank hypo
EVI Change EVIChange
rank
L Kiribati 81.99 75.77 1 1 -6.22 0
L Gambia 67.79 69.07 2 2 1.28 0
L Tuvalu 63.93 68.42 3 3 4.49 0
L Liberia 60.97 66.50 4 4 5.53 0
L Guinea-Bissau 60.52 61.62 5 5 1.10 0
L Eritrea 58.99 59.74 6 7 0.76 1
L Burundi 57.16 60.09 7 6 2.93 -1
L Solomon Islands 55.25 59.48 8 8 4.23 0
L Timor-Leste 53.35 57.04 9 11 3.69 2
L Zambia 53.03 51.16 10 20 -1.88 10
L Chad 52.82 55.53 11 12 2.70 1
L Malawi 51.93 52.93 12 16 1.00 4
L Angola 51.29 54.30 13 13 3.01 0
L Samoa 51.06 57.76 14 10 6.70 -4
L Cambodia 50.47 47.84 15 24 -2.63 9
L Somalia 50.10 53.02 16 15 2.92 -1
L Comoros 49.90 51.97 17 18 2.07 1
L Sierra Leone 48.50 45.58 18 27 -2.92 9
Dem. Peo's Rep.Korea 47.72 48.91 19 21 1.19 2
L Haiti 47.31 48.11 20 23 0.80 3
L Rwanda 47.26 48.17 21 22 0.91 1
L Vanuatu, Republic of 46.78 57.88 22 9 11.10 -13
L Djibouti 46.30 46.26 23 26 -0.04 3
L Sao Tome and Principe 46.08 53.70 24 14 7.63 -10
L Lesotho 45.86 46.94 25 25 1.08 0
L Myanmar 45.01 41.29 26 37 -3.72 11
Zimbabwe 44.90 44.67 27 29 -0.23 2
L Sudan 44.44 44.09 28 32 -0.35 4
L Mozambique 44.37 43.87 29 34 -0.51 5
L Bhutan 44.19 51.75 30 19 7.55 -11
L Mauritania 44.19 43.89 31 33 -0.30 2
L Equatorial Guinea 43.69 52.04 32 17 8.35 -15
L Afghanistan 38.83 39.66 33 41 0.82 8
L Niger 38.63 39.48 34 43 0.85 9
(cont’d)

Climate change vulnerability and the identification of least developed countries 23
Table 3 (cont’d)
Status Country EVI 2012Hypothetical
EVIRank EVI
2012Rank hypo
EVI Change EVIChange
rank
Nigeria 38.56 40.02 35 40 1.46 5
L Yemen 38.47 44.32 36 30 5.85 -6
Papua New Guinea 38.29 44.11 37 31 5.83 -6
L Madagascar 38.04 40.58 38 38 2.54 0
L Burkina Faso 37.55 41.86 39 36 4.31 -3
L Lao PDR 37.06 43.77 40 35 6.71 -5
L Mali 36.78 39.42 41 44 2.64 3
L Uganda 36.23 38.52 42 45 2.29 3
L Benin 36.16 37.60 43 46 1.44 3
L Senegal 36.14 34.23 44 47 -1.91 3
L Central African Republic 35.65 45.22 45 28 9.57 -17
L Dem. Rep. of the Congo 35.39 39.55 46 42 4.16 -4
L Togo 35.36 40.14 47 39 4.78 -8
L Ethiopia 33.48 30.18 48 50 -3.30 2
L Bangladesh 32.41 22.24 49 57 -10.17 8
Nicaragua 31.95 34.07 50 48 2.11 -2
Viet Nam 30.90 20.59 51 58 -10.31 7
L Tanzania, United Rep. of 28.69 26.58 52 55 -2.12 3
Ghana 28.65 30.63 53 49 1.98 -4
L Guinea 28.60 27.63 54 53 -0.97 -1
L Nepal 27.77 30.12 55 51 2.35 -4
Kenya 26.57 17.29 56 60 -9.28 4
Cameroon 23.35 29.76 57 52 6.40 -5
Pakistan 21.98 22.40 58 56 0.42 -2
India 21.39 17.76 59 59 -3.63 0
Côte d'Ivoire 20.90 27.31 60 54 6.40 -6
Memo: Simple average 42.8 44.4 1.6
Note: L: least developed country (LDC)The hypothetical EVI uses the indicators and weights applied in the 2009 review, with raw data from the 2012 review. Change EVI and Change rank are the differences between the values and rank of the hypothetical EVI and the actual 2012 EVI.A negative value in change EVI and a positive value in change rank signify that a country would be less vulnerable without the EVI refinement.Source: CDP (2012), Author calculations
On the other hand, Vanuatu, Central African Republic and Equatorial Guinea saw the strongest decline in vulnerability due to the EVI refinement both in terms of scores and ranks. Both Vanuatu and Equatorial Guinea are small countries, but the largest part of their population live at higher elevations or away form the coasts. Central African Republic is land locked, but not drought prone. In addition, the main reason for its high vulnerability under the hypothetical EVI is related to the disaster impacts recorded in EM-DAT. As in many countries, floods are the most frequent disaster in the Central African Republic, but the country has an exceptional high share of people requiring shelter under its victims. Therefore, in relative terms its vulnerability to disasters is considerably higher if other disaster impacts are excluded.
24 CDP Background Paper No. 15
The impact on eligibility for inclusion into and graduation from the LDC list is also very small. The same four non-LDCs (Democratic Republic of Korea, Zimbabwe, Nigeria and Papua New Guinea) meet the inclusion threshold of 36. Two more LDCs, Bangladesh and Ethiopia, would meet the graduation threshold of 32 under the hypothetical EVI. In case of more stringent, but still plausible, thresholds, Senegal could have also been eligible for graduation under the EVI criterion without the EVI refinement.40 However, as all three countries failed to meet the GNI per capita and human asset index criteria, the change in eligibility under the EVI would have been inconsequential for the recommendations, because a country must meet two of the three criteria before the CDP might consider it for graduation.
VII. Conclusions
This paper explored the role of climate change in the identification of LDCs. It confirmed that climate change vulnerability can be regarded as a structural impediment to development, in particular as it may drastically aggravate existing handicaps. As climate change vulnerability is embedded in the overall sustain-able development path of countries, it is not surprising that most elements of the current indicators used for identifying LDCs capture relevant aspects of climate change vulnerability.
In particular, vulnerabilities in agriculture and health are comprehensively covered. Moreover, general resilience of countries to external shocks is well covered through the three LDC criteria on income, human assets and economic vulnerability. However, climate change related vulnerability related to natural disasters were only partially taken into account in the identification of LDCs in 2006 and 2009, as climata-logical disasters such as drought and extreme temperatures are only very marginally covered by the indicator on homelessness due to natural disasters. By replacing this indicator with an indicator on victims of natural disasters for the 2012 triennial review, the coverage of vulnerability in the area of natural disaster has been considerably improved.
The new indicator on the share of population living on low elevated coastal zones leads to a better coverage of exposure to current and future climate changes in coastal areas, whose vulnerabilities to climate change were only marginally covered in the old EVI. However, in the areas of water availability and terrestrial ecosystems and biodiversity no indicator could be identified that would capture structural vulnerabilities in these areas and that are based on observable, reliable and updated data covering almost all developing countries.
The impact of the modification of the EVI on the identification of LDCs in the 2012 triennial review was modest. Whereas the vulnerability scores and ranks of some countries changed significantly due to the enhanced recognition of climate change related vulnerabilities, these changes did not affect the overall classification of countries. The limited impact is not surprising because many climate change-related vulnera-bilities were already captured in the former EVI. However, the improved reflection of climate change vulner-ability in the refined EVI could well influence future reviews as climate changes become more pronounced. It should be noted, though, that the EVI is a relative criterion. Hence, increased climate change vulnerability will impact on the identification of LDCs only if LDCs’ vulnerability to climate change differs (in intensity) from climate change vulnerability by other developing countries.
40 As a general rule, the inclusion threshold is set at the third quartile of the distribution of the EVI scores, but adjusted in case the distribution is very close at that point. The graduation threshold is 10 per cent below the inclusion threshold; see also CDP and UN DESA (2009) for details. In accordance with this rule, the CDP set the thresholds in 2012 at 36 and 32. These thresholds remain plausible also for the hypothetical EVI, but could have also been set as high as 39 and 35.
Climate change vulnerability and the identification of least developed countries 25
References
Bates, B.C., Z.W. Kundzewicz, S. Wu, and J.P. Palutikof, eds. (2008). Climate Change and Water. Technical Paper of the Intergovernmental Panel on Climate Change. Geneva: IPCC Secretariat.
Brooks, N., Adger, W.N., and Kelly, P.M. (2005). The determinants of vulnerability and adaptive capacity at the national level and the implications for adaptation. Global Environmental Change 15, pp. 151–163.
Busby, J.W., T.G. Smith, K.L. White and S.M. Strange (2010), Locating Climate Insecurity: Where are the Most Vulnerable Places in Africa. Austin: The Robert S. Strauss Center for International Security and Law.
Butchart, S.H., M. Walpole, B. Collen, A. van Strien, J.P. Scharlemann and others (2010). Global Diversity: Indicators of Recent Declines. Science 328 (28 May 2010), pp. 1164-1168.
Calzadilla, A., K. Rehdanz, R. Betts, P. Falloon, A. Wiltshire, and R. Tol (2010). Climate Change Impacts on Global Agriculture. Working Paper FNU-185, Hamburg University, Research Unit Sustainability and Global Change.
Center for International Earth Science Information Network (CIESIN), ColumbiaUniversity (2012). Low Elevation Coastal Zone (LECZ) Urban-Rural Estimates, Global Rural-Urban Mapping Project (GRUMP), Alpha Version. Palisades, NY: Socioeconomic Data and Applications Center (SEDAC), Columbia University. Available at http://sedac.ciesin.columbia.edu/gpw/lecz. (8.5.2012).
Cheung, W.W.L., V.W.Y. Lam, J.L. Sarmiento, K. Kearney, R. Watson, D. Zeller, and D. Pauly (2009). Large-scale redistribution of maximum fisheries catch potential in the global ocean under climate change. Global Change Biology 16 (1), pp. 24-35.
Committee for Development Policy (2008). Report on the tenth session. Official Records of the Economic and Social Council, 2008, Supplement No. 13 (E/2008/33).
Committee for Development Policy (2009). Report on the eleventh session. Official Records of the Economic and Social Council, 2009, Supplement No. 13 (E/2009/33).
Committee for Development Policy (2011). Report on the thirteenth session. Official Records of the Economic and Social Council, 2011, Supplement No. 13 (E/2011/33).
Committee for Development Policy (2012). Report on the fourteenth session. Official Records of the Economic and Social Council, 2012, Supplement No. 13 (E/2012/33).
Committee for Development Policy and United Nations Department of Economic and Social Affairs (2008). Handbook on the Least Developed Country Category: Inclusion, Graduation and Special Support Measures. New York: United Nations.
Committee for Development Policy and United Nations Department of Economic and Social Affairs (2009). Achieving Sustainable Development in an Age of Climate Change. New York: United Nations.
Dai, A. (2010). Drought under global warming: a review. Wiley Interdisciplinary Review: Climate Change. doi: 10.1002/wcc.81.
Dasgupta, S., B. Laponte, C. Meisner, D. Wheeler and J. Yan (2009). The Impact of Sea Level Rise on Developing Countries: A Comparative Analysis. World Bank Policy Research Working Paper 4136.
Diffenbaugh, N., F. Giorgi, L. Raymond, and X. Bi (2007). Indicators of 21st century socioclimatic exposure. Proceedings of the National Academy of Sciences 104 (51), pp. 20195-20198.
Döll, P. (2009). Vulnerability to the impact of climate change on renewable groundwater resources: a global-scale assessment. Environmental Research Letters 4 (2009). doi:10.1088/1748-9326/4/3/035006.
Emerson, J., A. Hsu, M.A. Levy, A. de Sherbinin, V. Mara, D. C. Esty and M. Jaiteh (2012). 2012 Environmental Performance Index. New Haven: Yale Center for Environmental Law and Policy.
Eriksen, S., and P. Kelly(2007). Developing credible vulnerability indicators for climate adaptation policy assessment. Mitigation and Adaptation Strategies for Global Change 12 (4), 495–524.
Expert Group to the Subcommittee of the PPCR (2009). The Selection of Countries to Participate in the Pilot Program for Climate Resilience (PPCR). Available at http://www.climateinvestmentfunds.org/cif/node/1095.
Food and Agriculture Organization of the United Nations (FAO) (2009). The State of World Fisheries and Aquaculture 2008. Rome: FAO.
FAO (2010). Global Forest Resources Assessment 2010. Rome: FAO.
Füssel, H.-M. (2007). Vulnerability: A generally applicable conceptual framework for climate change research.Global Environmental Change 17 (2), pp. 155-167. doi:10.1016/j.gloenvcha.2006.05.002
Füssel, H.-M. (2009).Review and Quantitative Analysis of Indices of Climate Change Exposure, Adaptive Capacity, Sensitivity, and Impacts. Background note to the World Development Report 2010. Washington, DC : World Bank.

26 CDP Background Paper No. 15
Füssel, H.-M. (2010). How inequitable is the global distribution of responsibility, capability, and vulnerability to climate change: A comprehensive indicator-based assessment. Global Environmental Change 20 (4), pp. 597-611.doi:10.1016/j.gloenvcha.2010.07.009
Guillaumont, P. (2009). Caught in a trap: Identifying the least developed countries. Paris: Economica.
Guillaumont, P. and C. Simonet (2011). Designing an index of structural vulnerability to climate change. FERDI Working Paper I 08. Clermont-Ferrand, France: Fondation pour les Etudes et Recherchessur le Développement International.
Harmeling, S. (2010). Global Climate Risk Index 2011. Bonn: Germanwatch.
Harvard University et al. (2009). Global Burden of Disease Study Operations Manual.
Intergovernmental Panel on Climate Change (IPCC) (2007). Climate Change 2007: Impacts, Adaptation and Vulnerability. Contribution of Working Group II to the Fourth Assessment Report of the Intergovernmental Panel on Climate Change, M.L. Parry, O.F. Canziani, J.P. Palutikof, P.J. van der Linden and C.E. Hansen (eds.). Cambridge, United Kingdom: CambridgeUniversity Press.
Kim, N. (2010). Impact of Extreme Climate Events on Educational Attainment. In: Fuentes-Nieva, R. and P.A. Seck (eds.). Risk, Shocks and Human Development, pp. 185-206. New York: Palgrave MacMillan.
Kleisner, K. and D. Pauly, (2010). Stock-catch status plots of fisheries for Regional Seas. In: Christensen, V., Lai, S., Valls, A., Palomares, M.L.D., Zeller, D., Pauly, D. (eds.)The State of Biodiversity and Fisheries in Regional Seas, pp. 37-40. Fisheries Centre Research Reports 18(n). Fisheries Centre, University of British Columbia.
Knutsen, T., J. McBride, J. Chan, K. Emanuel, G. Holland, C. Landsea, I. Held, J. Kossin, A.K. Srivastava and M. Sugi (2010). Tropical cyclones and climate change. Nature Geoscience 3 (March 2010) pp. 157-163.
McGranahan, G., D. Balk and B. Anderson. 2007. The rising tide: assessing the risks of climate change and human settlements in low elevated coastal zones. Environment & Urbanization 19(1) pp. 17-37.
Munasinghe, M. (2010). Addressing sustainable development and climate change together using sustainomics. Wiley Interdisciplinary Review: Climate Change. doi: 10.1002/wcc.86.
Nachtergaele, F., M. Petri, R. Biancalani, G. van Lynden, H. van Velthuizen and M. Bloise (2011). Global Land Degradation Information System (GLADIS). Version 1.0. LADA Technical Report No. 17. Rome: FAO.
National Research Council (NRC) of the National Academies (2010). Climate Stabilization Targets: Emissions, Concentrations, and Impacts over Decades and Millennia. Washington, DC: National Academies Press.
Neumayer, E. and F. Barthel (2010). Normalizing economic loss from natural disasters: A global analysis. Global Environmental Change (2010). doi:10.1016/j.gloenvcha.2010.10.004
Opschoor, H. (2007). Vulnerability and Climate Change: substantive links and possible indicators. CDP Background Note CDP/08/2010/10.
Secretariat of the Convention for Biological Diversity (CBD) (2010). Global Biodiversity Outlook 3. Montreal: Secretariat of the CBD.
Sullivan, C. and J. Meigh (2005). Targeting attention on local vulnerabilities using an integrated index approach: the example of the climate vulnerability index. Water Science & Technology 51, pp. 69–78.
United Nations (2009). Climate change and its possible security implications. Report of the Secretary-General. (A.64/350)
United Nations Department of Economic and Social Affairs (2009). World Economic and Social Survey 2009. Promoting Development, Saving the Planet. New York: United Nations.
United Nations International Strategy for Disaster Reduction Secretariat (2009). Global Assessment Report on Disaster Risk Reduction.Geneva: United Nations.
United Nations International Strategy for Disaster Reduction Secretariat (2011). Global Assessment Report on Disaster Risk Reduction.Geneva: United Nations.
Wheeler, D. (2011). Quantifying Vulnerability to Climate Change: Implications for Adaptation Assistance. CGDEV Working Paper 240. Washington, DC: Center for Global Development.
World Bank (2009). The Economics of Adaptation to Climate Change. A Synthesis Report.Washington, DC : World Bank.
World Bank (2010). World Development Report 2010. Development and Climate Change. Washington, DC : World Bank.
World Health Organization (2008). Protecting Health from Climate Change World Health Day 2008. Geneva: World Health Organization.
World Health Organization (2009). Global Health Risks: Mortality and burden of disease attributable to selected major risks. Geneva: World Health Organization.
Climate change vulnerability and the identification of least developed countries 27
World Water Assessment Programme (2009). The United Nations World Water Development Report 3: Water in a Changing World. Paris: UNESCO, and London: Earthscan.
Yohe, G., E. Malone, A. Brenkert, M. Schlesinger, H. Meij and X. Xing (2006). Global Distributions of Vulnerability to Climate Change. The Integrated Assessment Journal 6 (3), pp. 35-44.
Yusuf, A.A., and H. Francisco (2009). Climate Change Vulnerability Mapping for Southeast Asia. Singapore: Economy and Environment Program for Southeast Asia.
Vos, F., J. Rodriguez, R. Below, and D. Guha-Sapir (2010). Annual Disaster Statistical Review 2009: The Numbers and Trends. Brussels: CRED.
Ziervogel, G., and P. Ericksen (2010). Adapting to climate change to sustain food security. Wiley Interdisciplinary Review: Climate Change 1, pp.525-540.