Embed Size (px)
Citation preview
1
Drs. Marilyn Brown and Emanuele Massetti
School of Public Policy
Georgia Institute of Technology
Climate Change:
Science, Impacts, Technologies and policy
Seminar 1: Synthesis Report: Key Concepts and Findings
2
Agenda
Introduction to the Intergovernmental Panel on
Climate Change (IPCC) and the seminar series
Marilyn Brown
Key concepts and findings from the Synthesis Report
Emanuele Massetti
Marilyn Brown
Next Steps
Emanuele Massetti
IPCC, 2014, Climate Change 2014: Synthesis Report,
R.K. Pachauri and L.A. Meyer (eds.). IPCC, Geneva,
Switzerland, 151 pp.
3
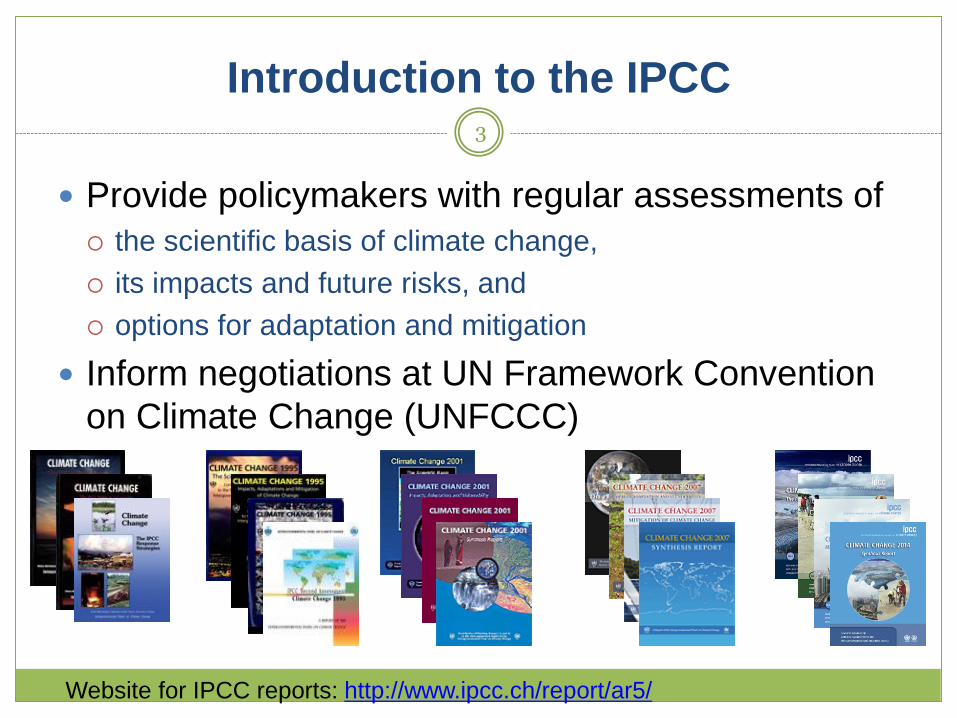
Introduction to the IPCC
Provide policymakers with regular assessments of
the scientific basis of climate change,
its impacts and future risks, and
options for adaptation and mitigation
Inform negotiations at UN Framework Convention
on Climate Change (UNFCCC)
Website for IPCC reports: http://www.ipcc.ch/report/ar5/
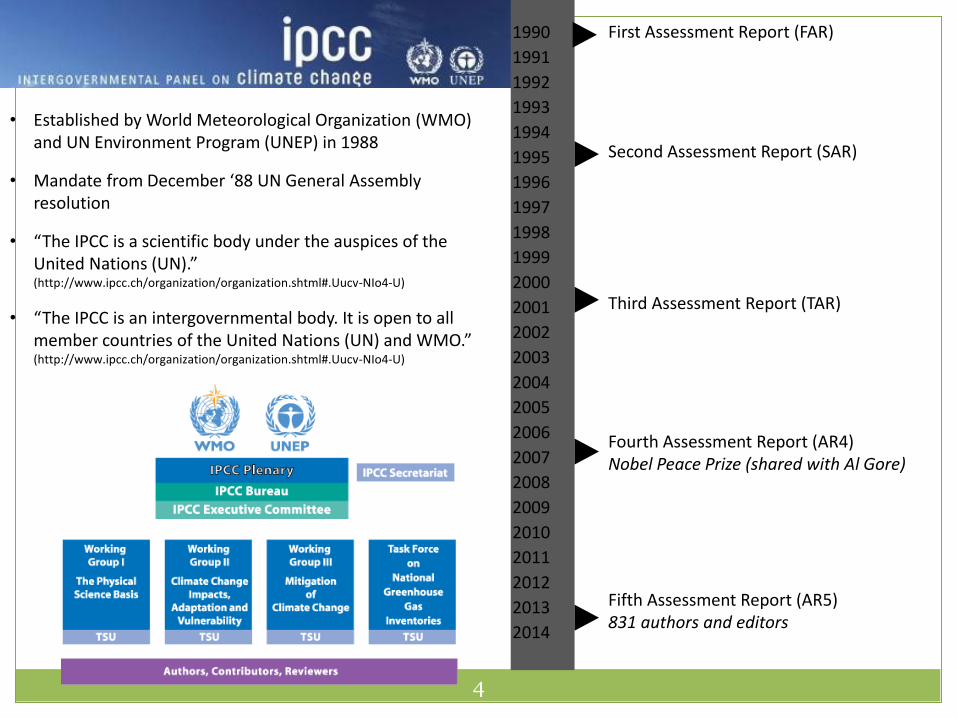
• Established by World Meteorological Organization (WMO) and UN Environment Program (UNEP) in 1988
• Mandate from December ‘88 UN General Assembly resolution
• “The IPCC is a scientific body under the auspices of the United Nations (UN).” (http://www.ipcc.ch/organization/organization.shtml#.Uucv-NIo4-U)
• “The IPCC is an intergovernmental body. It is open to all member countries of the United Nations (UN) and WMO.”(http://www.ipcc.ch/organization/organization.shtml#.Uucv-NIo4-U)
4
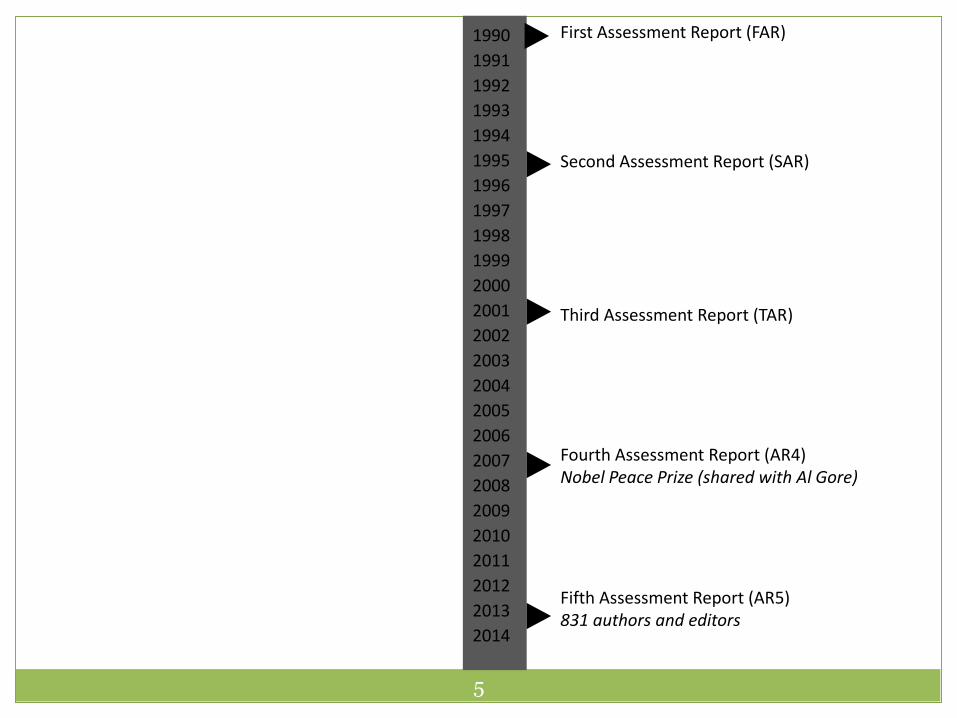
1990
1991
1992
1993
1994
1995
1996
1997
1998
1999
2000
2001
2002
2003
2004
2005
2006
2007
2008
2009
2010
2011
2012
2013
2014
First Assessment Report (FAR)
Second Assessment Report (SAR)
Third Assessment Report (TAR)
Fourth Assessment Report (AR4)Nobel Peace Prize (shared with Al Gore)
Fifth Assessment Report (AR5)831 authors and editors
1990
1991
1992
1993
1994
1995
1996
1997
1998
1999
2000
2001
2002
2003
2004
2005
2006
2007
2008
2009
2010
2011
2012
2013
2014
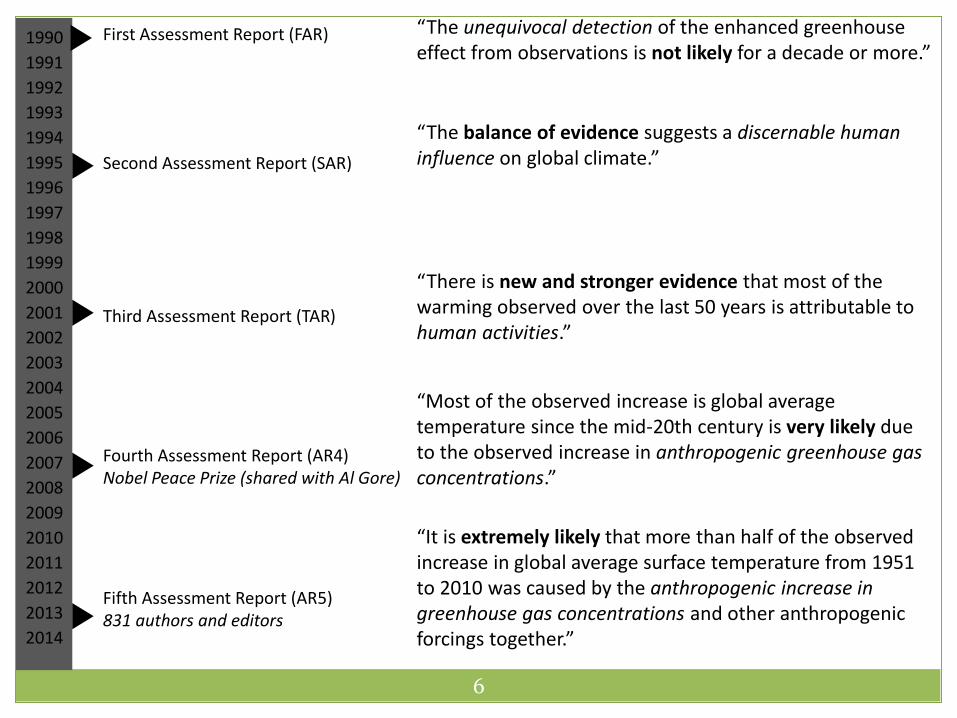
First Assessment Report (FAR)
Second Assessment Report (SAR)
Third Assessment Report (TAR)
Fourth Assessment Report (AR4)Nobel Peace Prize (shared with Al Gore)
Fifth Assessment Report (AR5)831 authors and editors
5
6
“The unequivocal detection of the enhanced greenhouse effect from observations is not likely for a decade or more.”
1990
1991
1992
1993
1994
1995
1996
1997
1998
1999
2000
2001
2002
2003
2004
2005
2006
2007
2008
2009
2010
2011
2012
2013
2014
First Assessment Report (FAR)
Second Assessment Report (SAR)
Third Assessment Report (TAR)
Fourth Assessment Report (AR4)Nobel Peace Prize (shared with Al Gore)
Fifth Assessment Report (AR5)831 authors and editors
“The balance of evidence suggests a discernable human influence on global climate.”
“There is new and stronger evidence that most of the warming observed over the last 50 years is attributable to human activities.”
“Most of the observed increase is global average temperature since the mid-20th century is very likely due to the observed increase in anthropogenic greenhouse gas concentrations.”
“It is extremely likely that more than half of the observed increase in global average surface temperature from 1951 to 2010 was caused by the anthropogenic increase in greenhouse gas concentrations and other anthropogenic forcings together.”
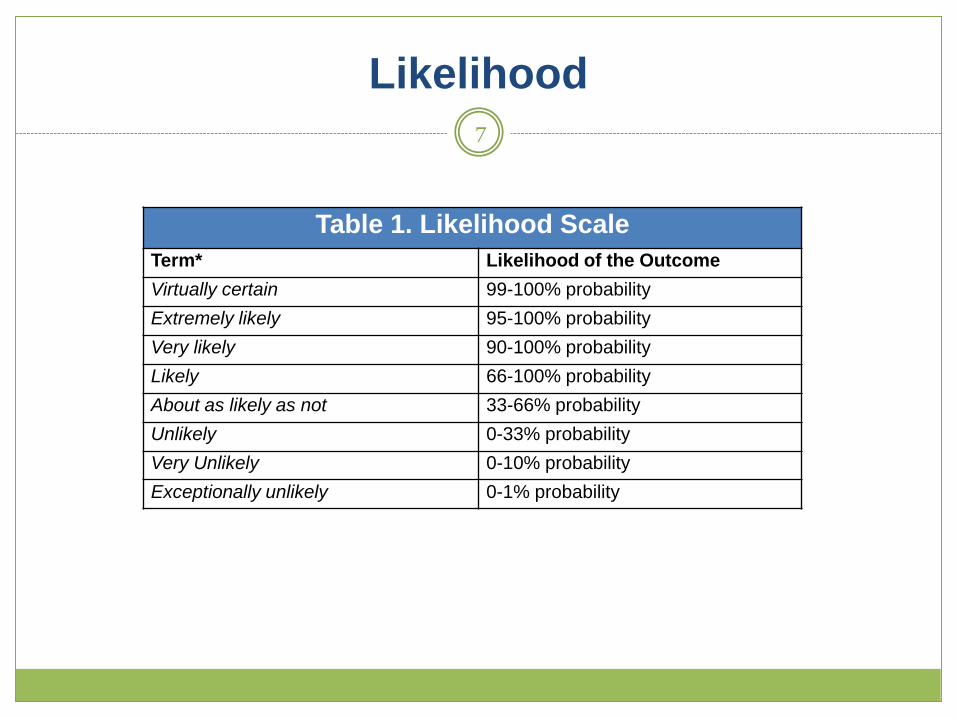
Likelihood7
Table 1. Likelihood Scale
Term* Likelihood of the Outcome
Virtually certain 99-100% probability
Extremely likely 95-100% probability
Very likely 90-100% probability
Likely 66-100% probability
About as likely as not 33-66% probability
Unlikely 0-33% probability
Very Unlikely 0-10% probability
Exceptionally unlikely 0-1% probability
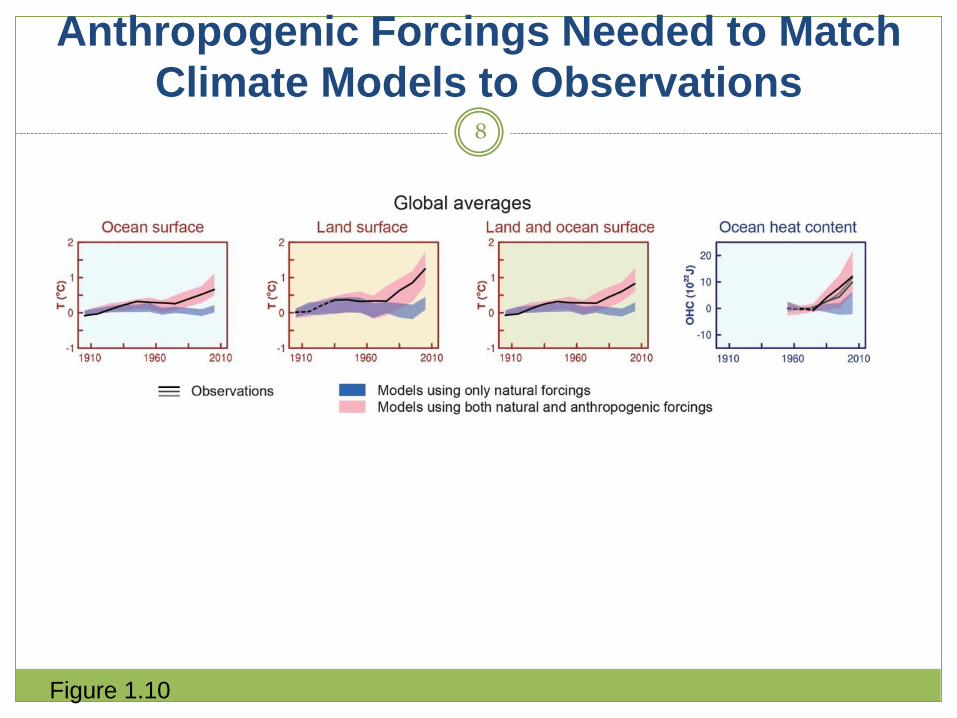
Anthropogenic Forcings Needed to Match
Climate Models to Observations8
Figure 1.10
9
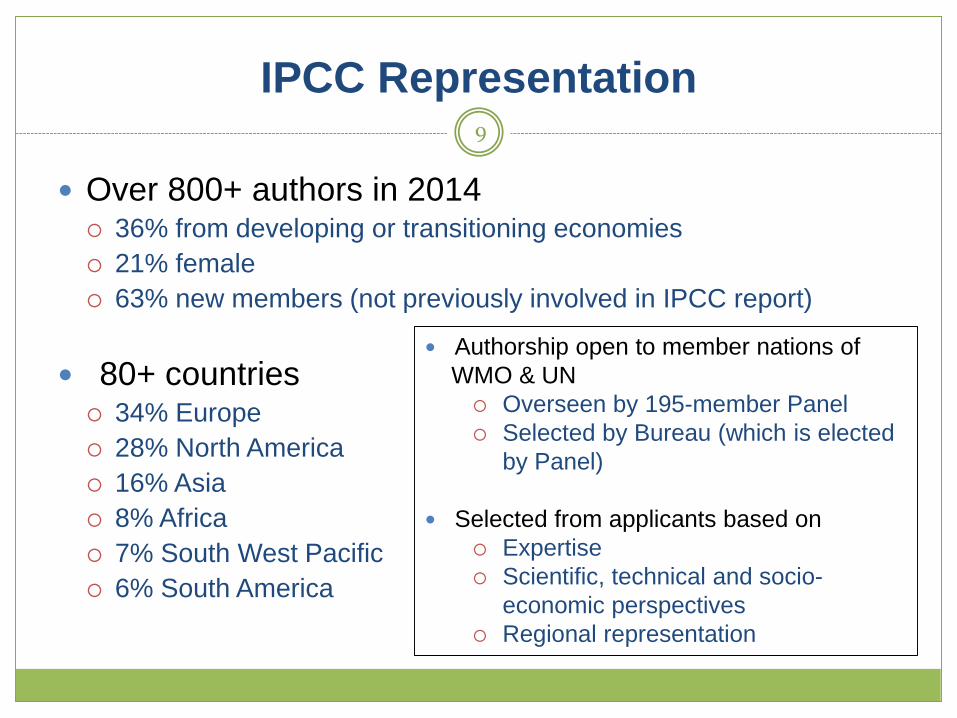
IPCC Representation
Over 800+ authors in 2014 36% from developing or transitioning economies
21% female
63% new members (not previously involved in IPCC report)
80+ countries 34% Europe
28% North America
16% Asia
8% Africa
7% South West Pacific
6% South America
Authorship open to member nations of
WMO & UN
Overseen by 195-member Panel
Selected by Bureau (which is elected
by Panel)
Selected from applicants based on
Expertise
Scientific, technical and socio-
economic perspectives
Regional representation
10
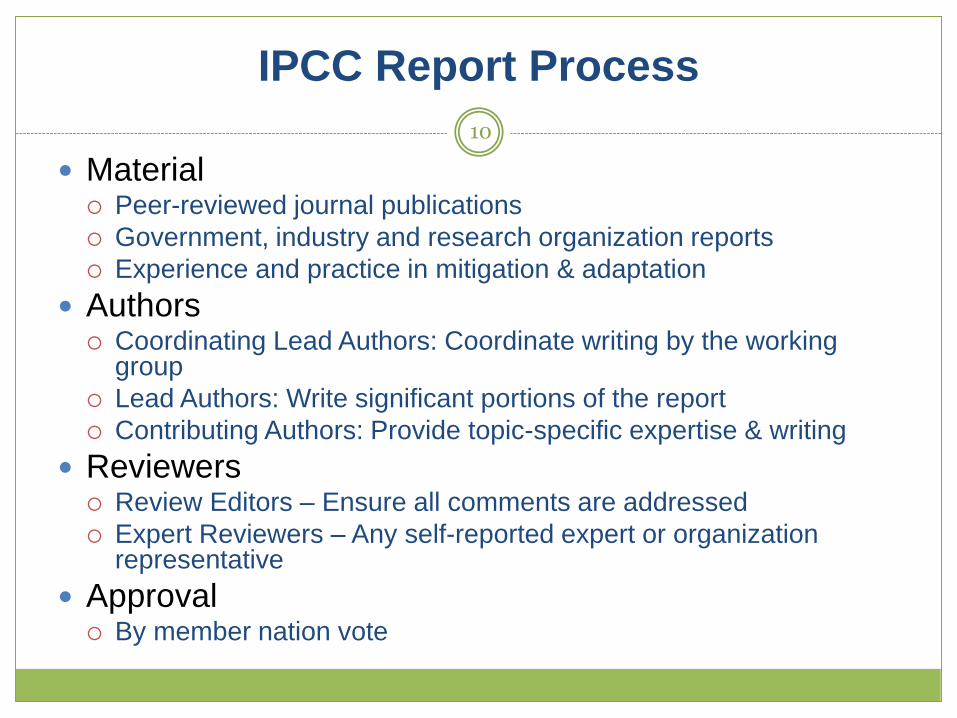
IPCC Report Process
Material Peer-reviewed journal publications
Government, industry and research organization reports
Experience and practice in mitigation & adaptation
Authors Coordinating Lead Authors: Coordinate writing by the working
group
Lead Authors: Write significant portions of the report
Contributing Authors: Provide topic-specific expertise & writing
Reviewers Review Editors – Ensure all comments are addressed
Expert Reviewers – Any self-reported expert or organization representative
Approval By member nation vote
11
Synthesis Report: Climate Change
Selected findings
Global temperature and global GHG concentrations
Dissecting global warming
Observed climate change
Projected climate change
Some evolving IPCC cross-cutting concepts:
Treatment of uncertainty
Scenarios of emissions
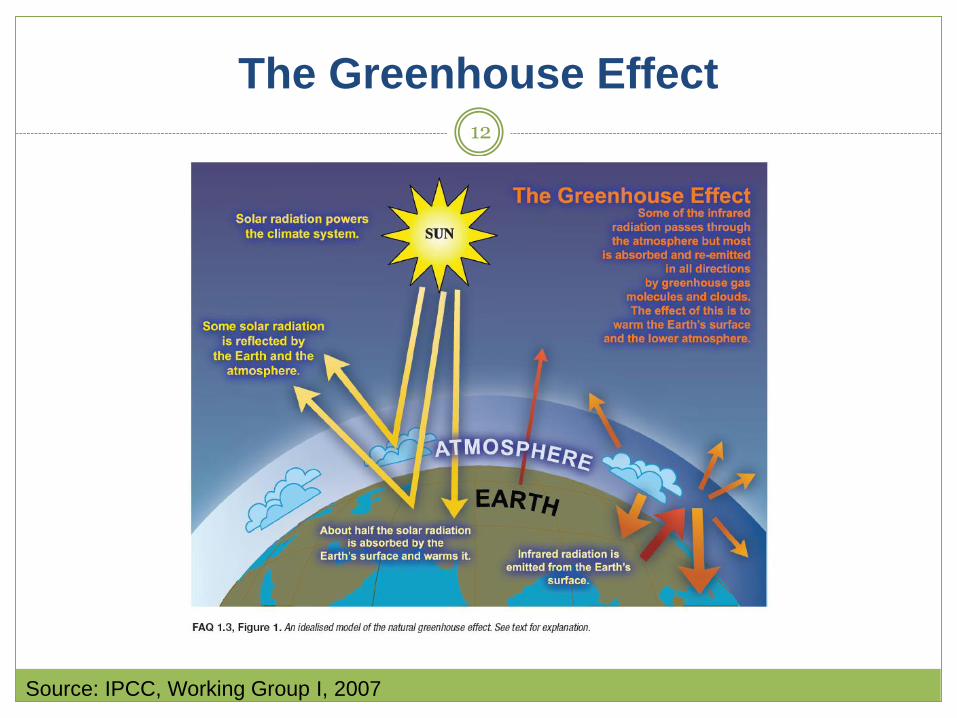
The Greenhouse Effect
Source: IPCC, Working Group I, 2007
12
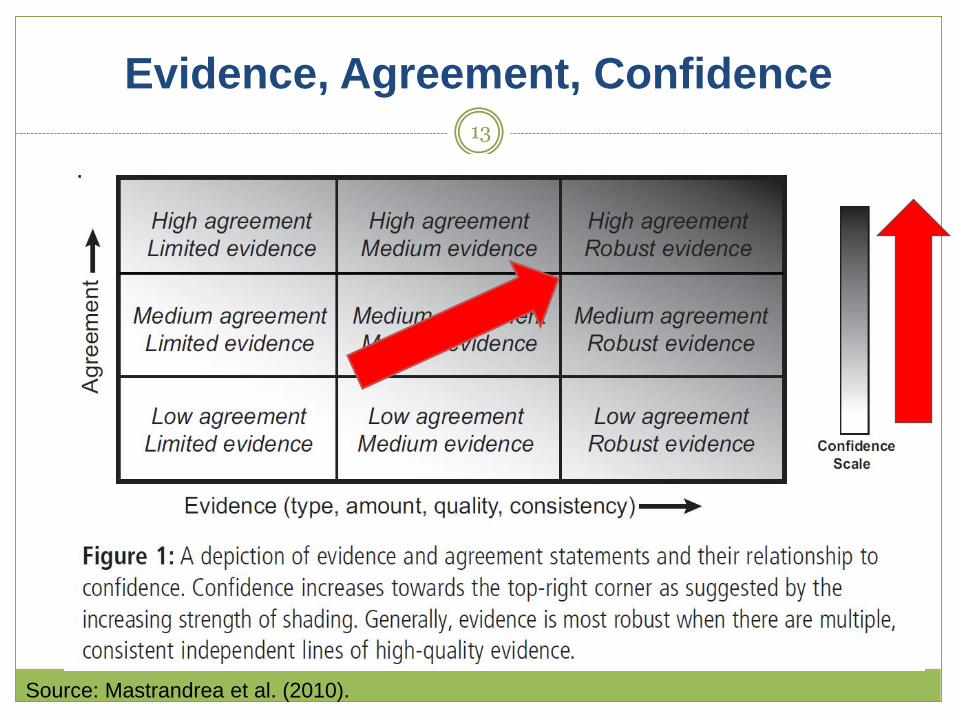
Evidence, Agreement, Confidence13
Source: Mastrandrea et al. (2010).
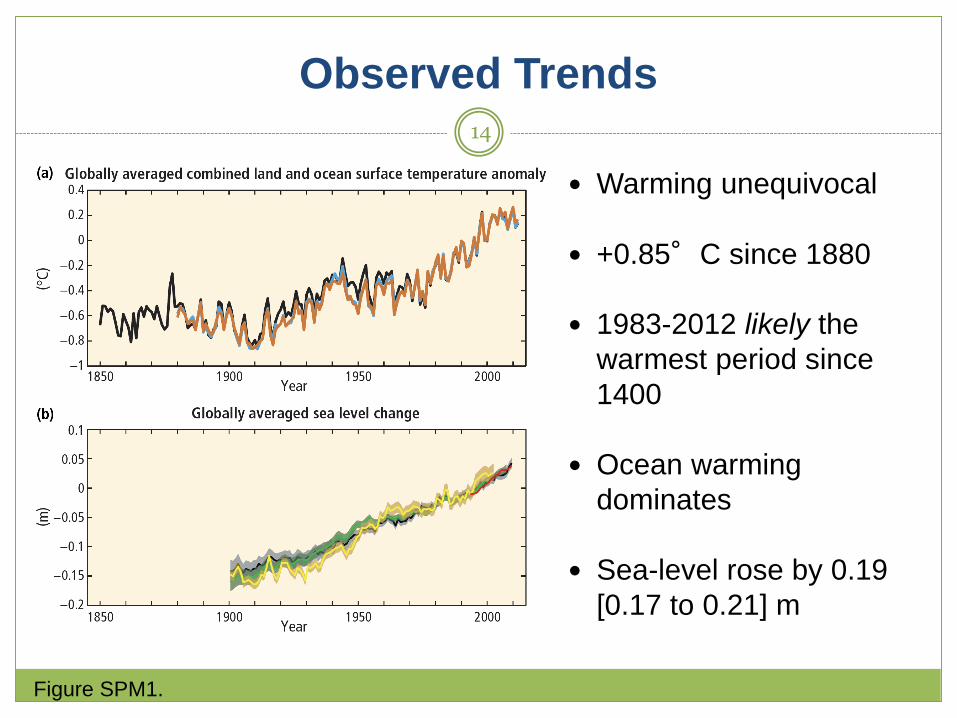
Observed Trends
Warming unequivocal
+0.85°C since 1880
1983-2012 likely the
warmest period since
1400
Ocean warming
dominates
Sea-level rose by 0.19
[0.17 to 0.21] m
14
Figure SPM1.
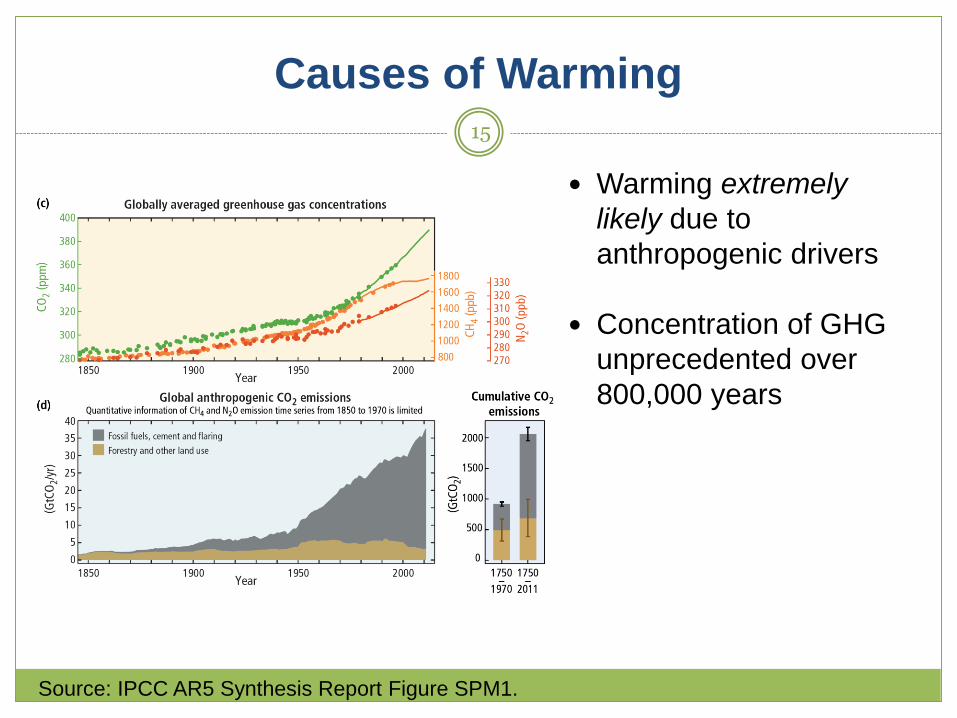
Causes of Warming
Warming extremely
likely due to
anthropogenic drivers
Concentration of GHG
unprecedented over
800,000 years
15
Source: IPCC AR5 Synthesis Report Figure SPM1.
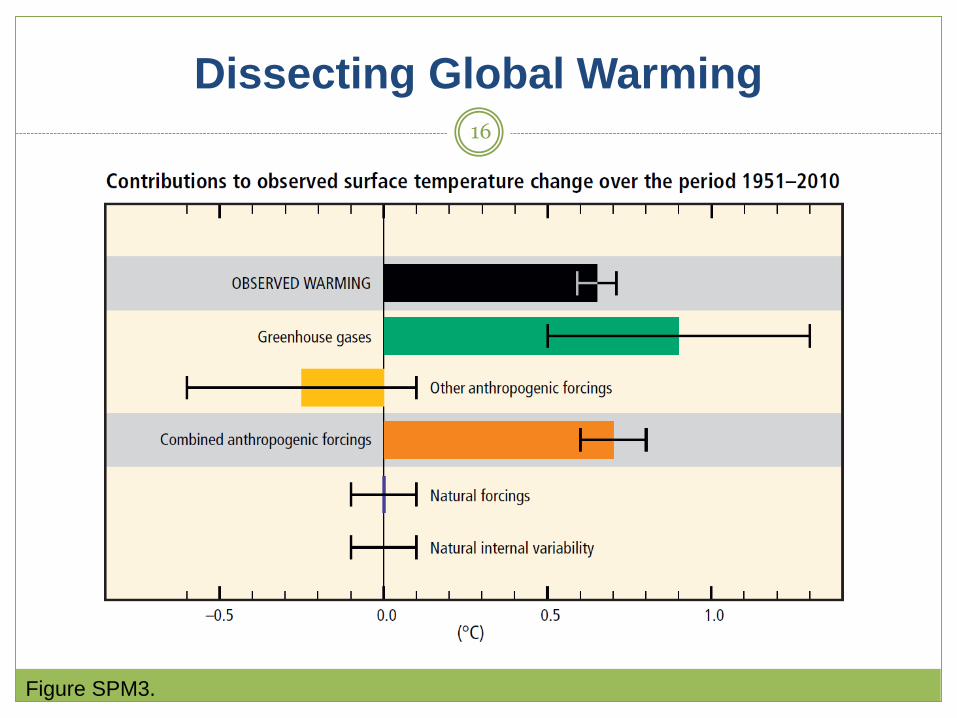
Dissecting Global Warming16
Figure SPM3.
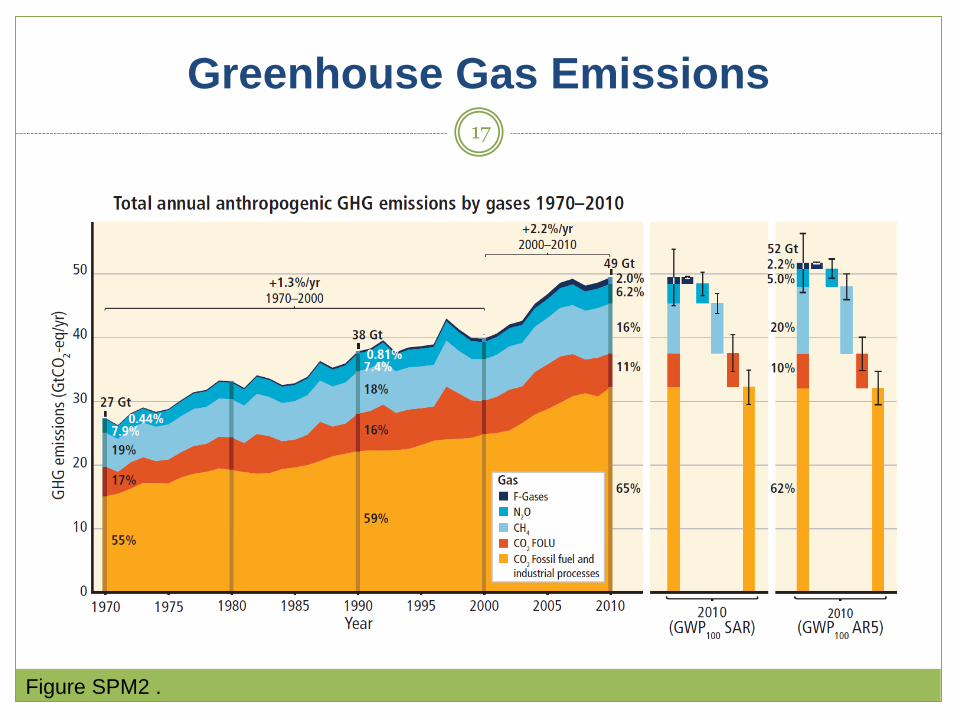
Greenhouse Gas Emissions17
Figure SPM2 .
Observed Impacts
Extremely likely
Increase of global temperature from 1951 to 2010
Very likely
Reduction of Arctic sea-ice sheet since 1979
Increase of global upper ocean heat content
Sea-level rise
Likely
Increase of continental temperature
Global water cycle from 1960
Retreat of glaciers from 1960s
18
Observed Impacts – Extreme Events
Very likely: Number of cold days and nights has decreased and the number of
warm days and nights has increased
Likely: Heavy precipitations events increased in North American and Europe
Extreme sea levels have increased since 1970
Medium evidence: Increased heat-related human mortality and decreased cold-related
human mortality in some regions is due to observed warming
19
Observed Impacts – Extreme Events
Very high confidence
Large vulnerabilities from climate-related extremes
Direct and insured losses from weather-related disasters have
increased substantially in recent decades
Low confidence:
Anthropogenic climate change has affected frequency and
magnitude of fluvial floods on a global scale
Existence of any trend in droughts at global level
Existence of any trend in tropical cyclone activity
Attribution of observed droughts and tropical cyclones
20
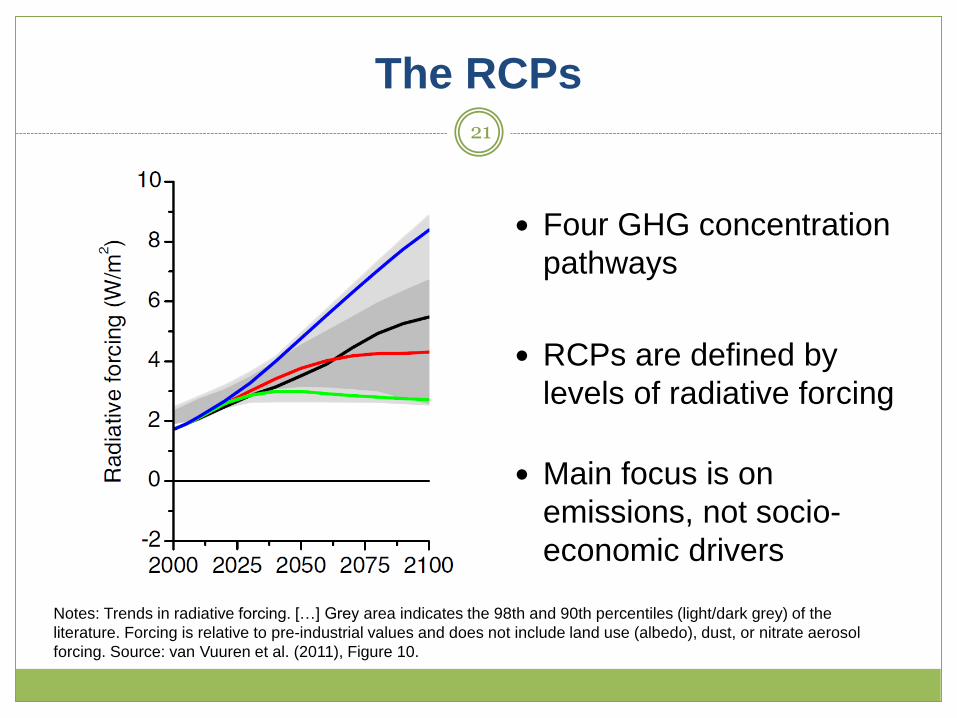
The RCPs
Four GHG concentration
pathways
RCPs are defined by
levels of radiative forcing
Main focus is on
emissions, not socio-
economic drivers
21
Notes: Trends in radiative forcing. […] Grey area indicates the 98th and 90th percentiles (light/dark grey) of the
literature. Forcing is relative to pre-industrial values and does not include land use (albedo), dust, or nitrate aerosol
forcing. Source: van Vuuren et al. (2011), Figure 10.
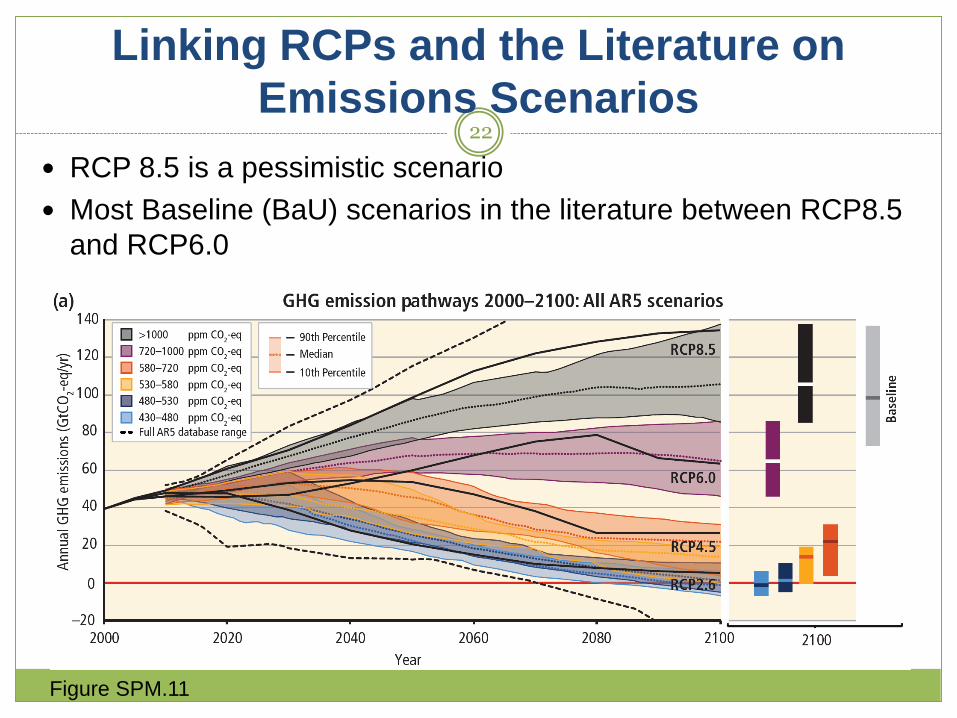
Linking RCPs and the Literature on
Emissions Scenarios22
RCP 8.5 is a pessimistic scenario
Most Baseline (BaU) scenarios in the literature between RCP8.5
and RCP6.0
Figure SPM.11
From RCPs to Climate Change Scenarios
General Circulation Models
Weather forecasts up to 2100 and beyond
Internal noise due to chaotic dynamics
Signal-to-noise ratio
Fundamental uncertainty
Ensemble means provide more robust information
Ensemble means, not expected values
23
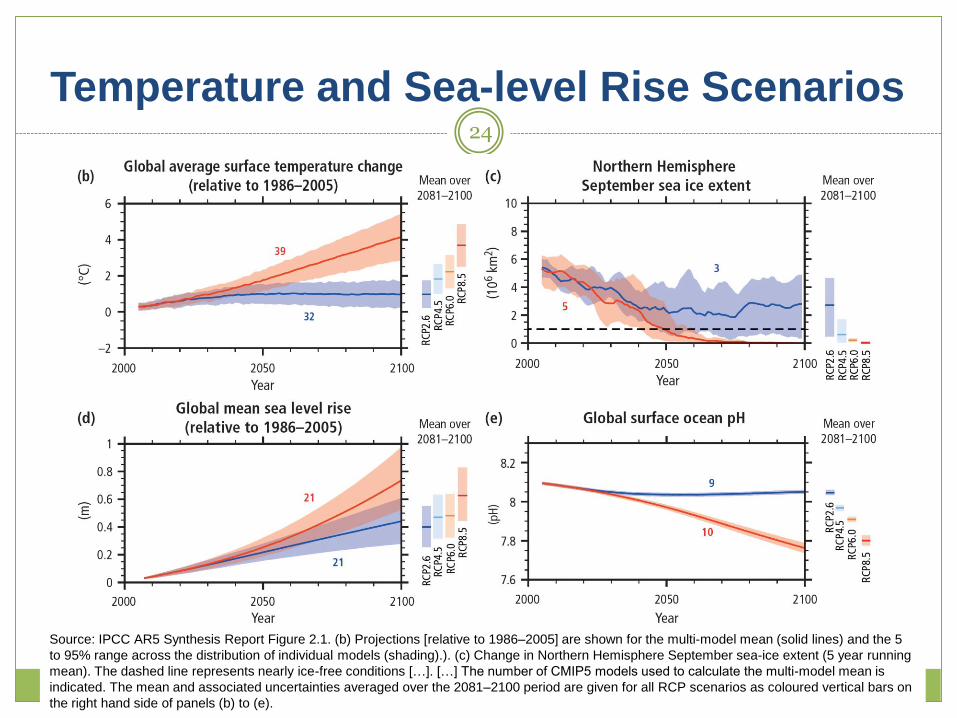
Temperature and Sea-level Rise Scenarios24
Source: IPCC AR5 Synthesis Report Figure 2.1. (b) Projections [relative to 1986–2005] are shown for the multi-model mean (solid lines) and the 5
to 95% range across the distribution of individual models (shading).). (c) Change in Northern Hemisphere September sea-ice extent (5 year running
mean). The dashed line represents nearly ice-free conditions […]. […] The number of CMIP5 models used to calculate the multi-model mean is
indicated. The mean and associated uncertainties averaged over the 2081–2100 period are given for all RCP scenarios as coloured vertical bars on
the right hand side of panels (b) to (e).
25
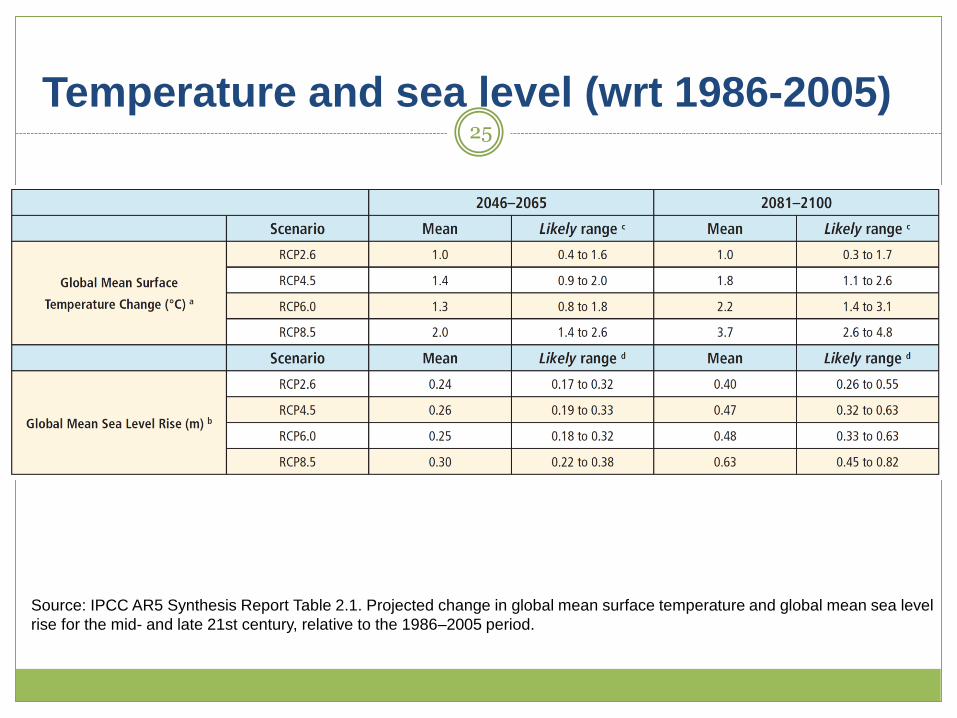
Temperature and sea level (wrt 1986-2005)
Source: IPCC AR5 Synthesis Report Table 2.1. Projected change in global mean surface temperature and global mean sea level
rise for the mid- and late 21st century, relative to the 1986–2005 period.
26
Synthesis Report: Adaptation & Mitigation
Some evolving cross-cutting concepts:
Complementarity of adaptation and mitigation
Economic assessment of climate change risk
Constraints and barriers to policy
Metrics
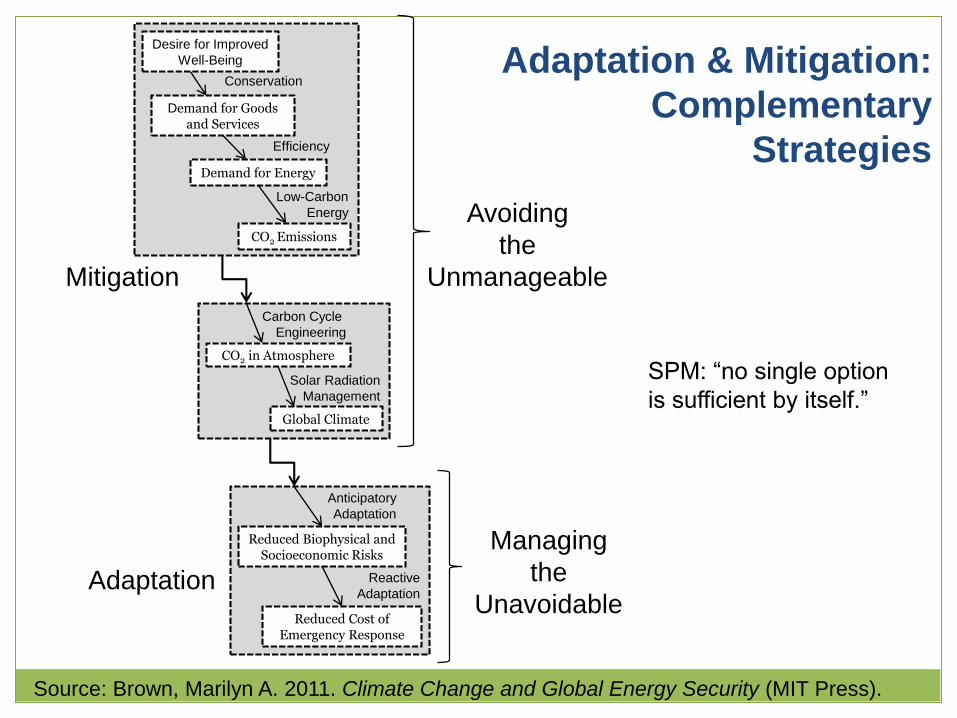
Mitigation
Adaptation
Desire for Improved
Well-Being
Demand for Goods and Services
Demand for Energy
CO2 in Atmosphere
Global Climate
Reduced Biophysical and Socioeconomic Risks
Reduced Cost of Emergency Response
CO2 Emissions
Conservation
Efficiency
Low-Carbon
Energy
Carbon Cycle
Engineering
Solar Radiation
Management
Anticipatory
Adaptation
Reactive
Adaptation
Avoiding
the
Unmanageable
Managing
the
Unavoidable
Adaptation & Mitigation:
Complementary
Strategies
Source: Brown, Marilyn A. 2011. Climate Change and Global Energy Security (MIT Press).
SPM: “no single option
is sufficient by itself.”
28
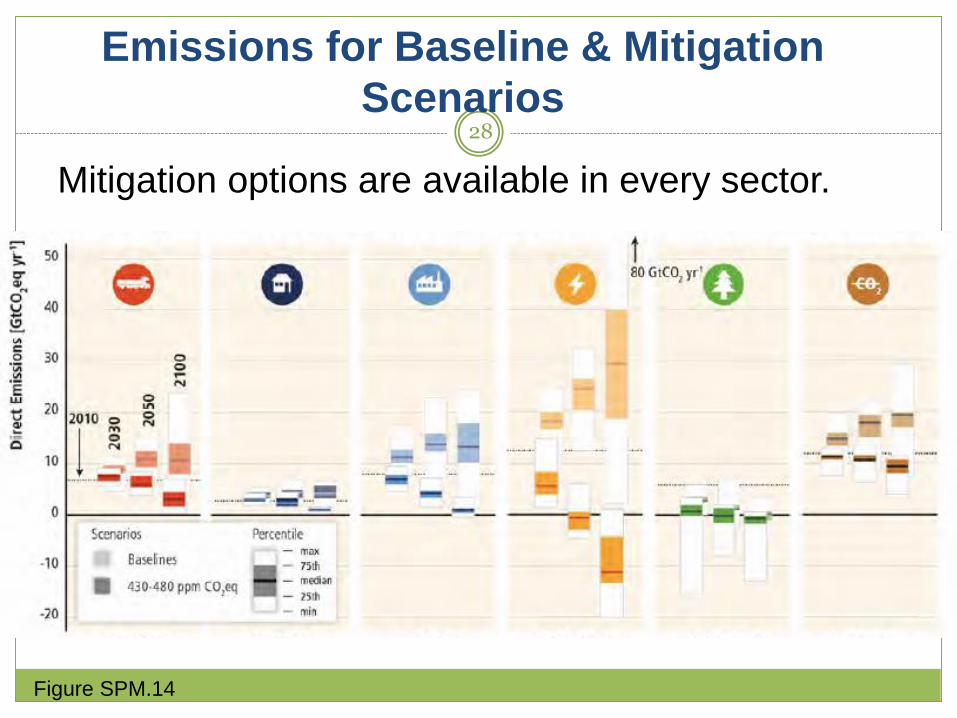
Emissions for Baseline & Mitigation
Scenarios
Figure SPM.14
Mitigation options are available in every sector.
29
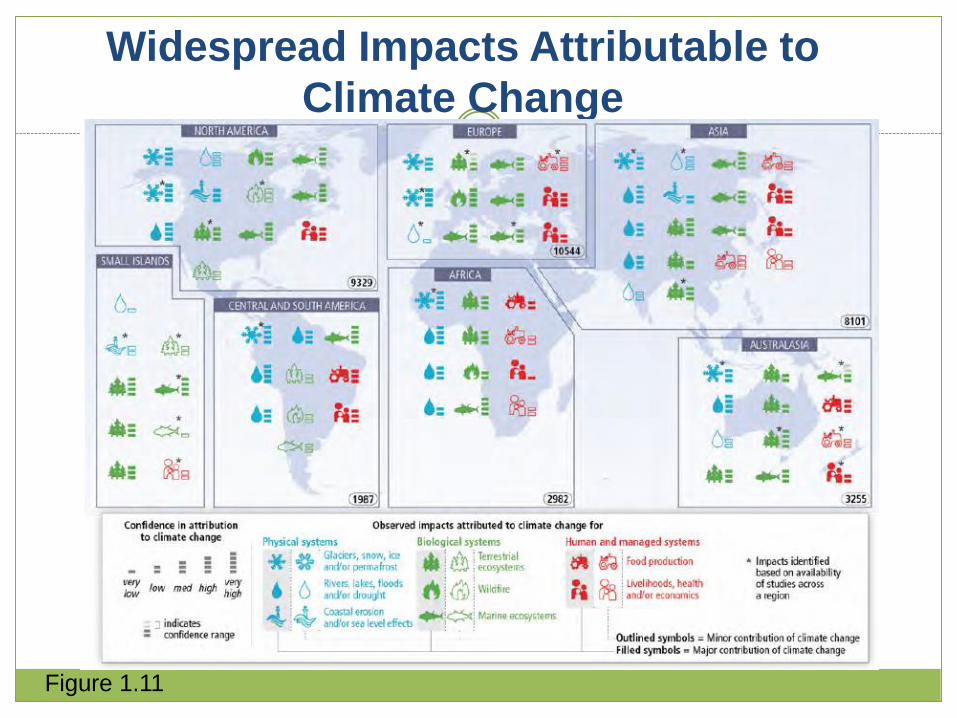
Widespread Impacts Attributable to
Climate Change
Figure 1.11
30
Economic Assessment of
Climate Change Risk
Box 3.1
• Economic losses for temperature increases of ~2.5°C
above pre-industrial levels are 0.2 – 2% of income.
• Availability of technology can reduce these costs (CCS,
nuclear, solar/wind, bioenergy).
• Estimates of the social cost of carbon lie between a few
dollars and several hundreds of dollars per tonne of carbon
in 2000-2015.
• Many estimates do not account for the possibility of large-
scale singular events and irreversible, tipping points.
31
Constraints and Barriers to Policy
Longer time-scale and broad human/earth impacts
Such as irreversible outcomes
Mitigating versus paying
Cheapest mitigators may not be the ones who should
pay
Carbon leakage
Change in relative price, relocation of industry,
nested regulation, & weak consumption leakage
Subsidies to conventional fuels
32
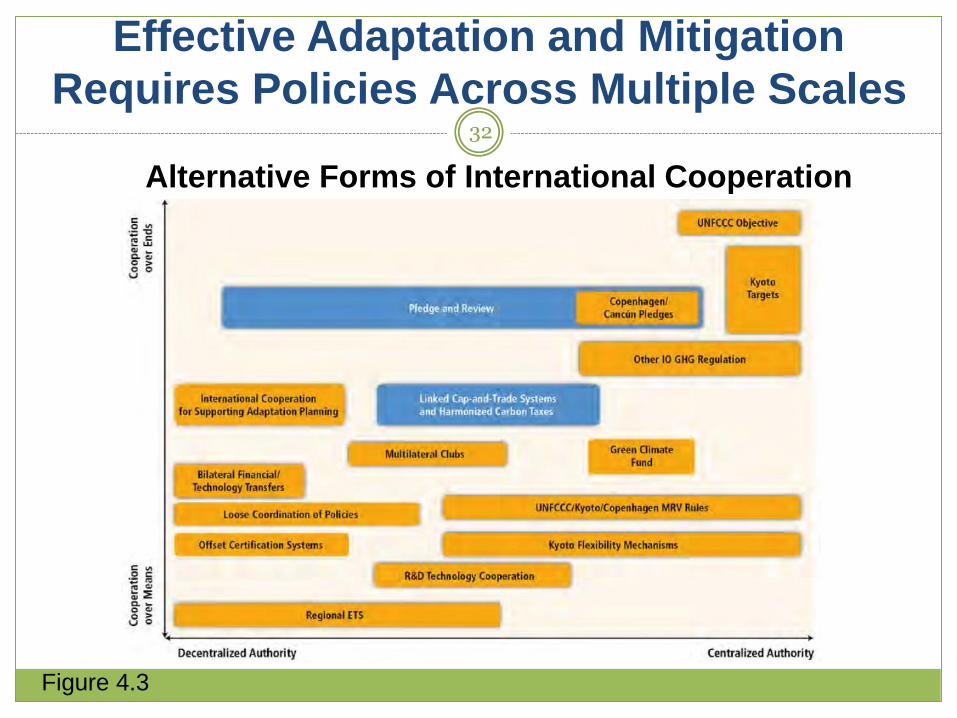
Effective Adaptation and Mitigation
Requires Policies Across Multiple Scales
Figure 4.3
Alternative Forms of International Cooperation
33
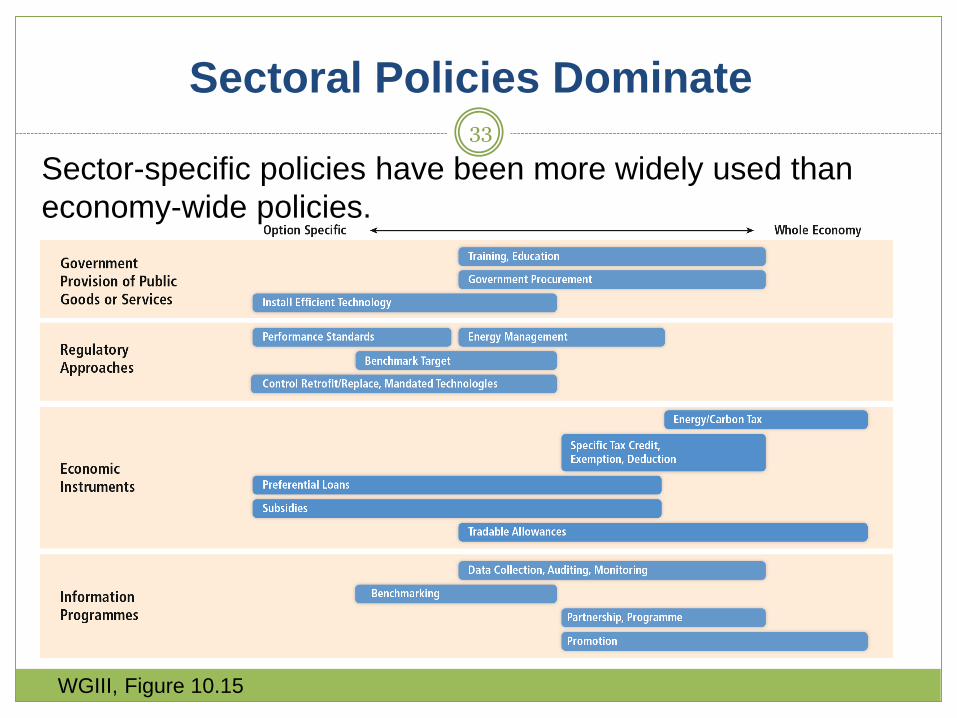
Sectoral Policies Dominate
WGIII, Figure 10.15
Sector-specific policies have been more widely used than
economy-wide policies.
34
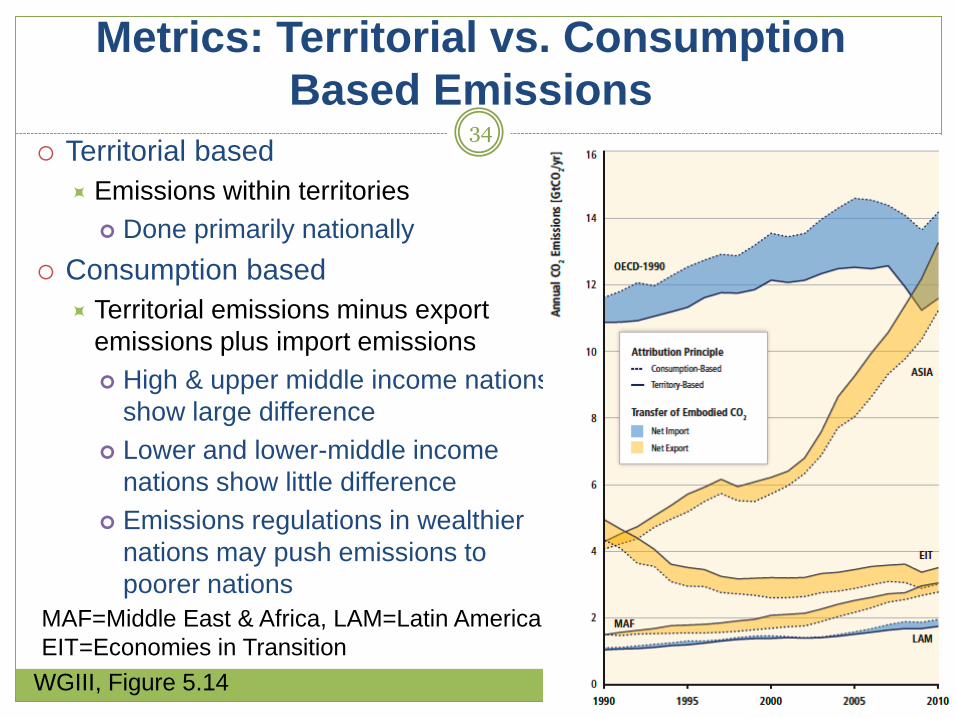
Metrics: Territorial vs. Consumption
Based Emissions
Territorial based
Emissions within territories
Done primarily nationally
Consumption based
Territorial emissions minus export
emissions plus import emissions
High & upper middle income nations
show large difference
Lower and lower-middle income
nations show little difference
Emissions regulations in wealthier
nations may push emissions to
poorer nations
WGIII, Figure 5.14
MAF=Middle East & Africa, LAM=Latin America
EIT=Economies in Transition
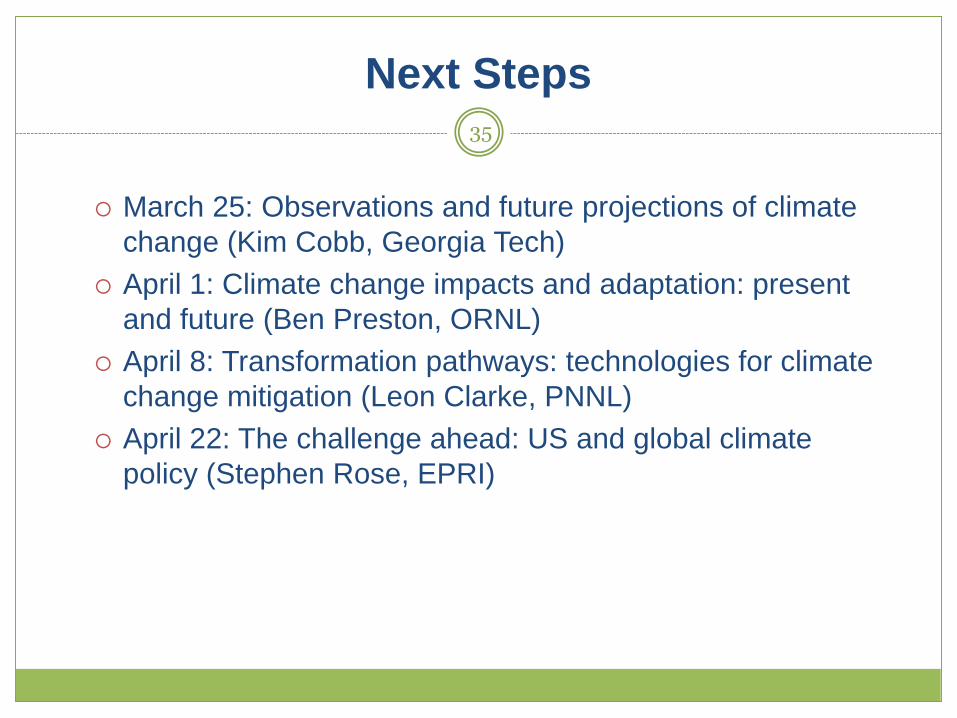
Next Steps
March 25: Observations and future projections of climate
change (Kim Cobb, Georgia Tech)
April 1: Climate change impacts and adaptation: present
and future (Ben Preston, ORNL)
April 8: Transformation pathways: technologies for climate
change mitigation (Leon Clarke, PNNL)
April 22: The challenge ahead: US and global climate
policy (Stephen Rose, EPRI)
35
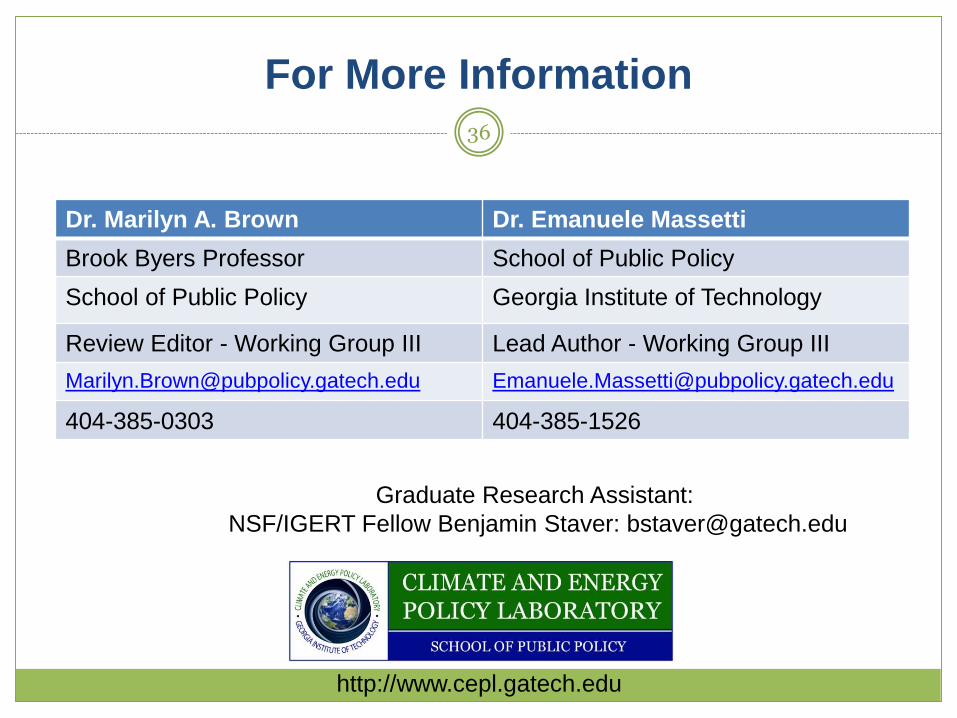
For More Information
Dr. Marilyn A. Brown Dr. Emanuele Massetti
Brook Byers Professor School of Public Policy
School of Public Policy Georgia Institute of Technology
Review Editor - Working Group III Lead Author - Working Group III
[email protected] [email protected]
404-385-0303 404-385-1526
http://www.cepl.gatech.edu
Graduate Research Assistant:
NSF/IGERT Fellow Benjamin Staver: [email protected]
36