Embed Size (px)
Citation preview
Climate change projections for the
Adelaide Hills, Fleurieu Peninsula and
Kangaroo Island region

Climate change projections for
the Adelaide Hills, Fleurieu Peninsula and
Kangaroo Island A report prepared for the Resilient Hills and Coasts project
Prepared by
Seed Consulting Services
106 Gilles Street, Adelaide, South Australia 5000
www.seedcs.com.au
Prepared for Resilient Hills and Coasts
Report should be cited as:
Resilient Hills and Coasts (2015) Climate change projections for the Adelaide Hills, Fleurieu Peninsula
and Kangaroo Island. A report prepared for Alexandrina Council on behalf of project partners by Seed
Consulting Services.
Document Control
Document Information
Information
Document Owner Alexandrina Council
Project ID 600_RHC
Issue Date 18 August 2015
Last Saved Date 18 August 2015
File Name FINAL Resilient Hills and Coasts climate projections report 12102015
Document History
Version Issue Date Changes
V1 Draft 10 July 2015
V2 Draft 18 August 2015
V3 Draft 2 September 2015
FINAL 10 October 2015
Document Approvals
Role Name Signature Date
Project Director Mark Siebentritt
02/09/2015
Written By Mark Siebentritt, Paul Hughes
02/09/2015
Checked Jenni Garden
02/09/2015
Disclaimer
The information contained in this Seed Consulting Services (Seed) report is given in good faith and has been
derived from sources believed to be reliable and accurate. Seed accepts no legal liability for the accuracy of field
data, analytical results or mapping data provided as part of this report or for any associated loss in productivity,
business or such like through third part use of this data.
Seed accepts no legal liability for failure of third parties to obtain any necessary government or other agency
permits or approvals with respect to any issue raised in this report where approvals may be required. The
material and opinions in this report may include the views or recommendations of third parties, which may not
necessarily reflect the views of Seed, or indicate Seed’s recommendation regarding a particular course of action.
Seed does not provide advice of an investment or commercial valuation nature. Seed does not accept any liability
for investment decisions made on the basis of environmental or other information provided in this report.
Contents
Executive summary ....................................................................................................... 1
1 Introduction ............................................................................................................. 2 1.1 Resilient Hills and Coasts overview .................................................................................................. 2 1.2 Study region ...................................................................................................................................... 2 1.3 Purpose of this report ........................................................................................................................ 3
2 Climate change projections overview ................................................................... 5 2.1 What is climate change? ................................................................................................................... 5 2.2 Climate change modelling ................................................................................................................. 5 2.3 Projections data available for South Australia .................................................................................. 8
2.3.1 SA Climate Ready ........................................................................................................................................ 8 2.3.2 Climate Change in Australia ......................................................................................................................... 9
3 How will climate change affect the region? ....................................................... 10 3.1 Climate projections for the Adelaide Hills and Fleurieu Peninsula ................................................. 11
3.1.1 Rainfall ........................................................................................................................................................ 11 3.1.2 Rainfall intensity ......................................................................................................................................... 13 3.1.3 Maximum temperature ................................................................................................................................ 13 3.1.4 Minimum temperature ................................................................................................................................. 15 3.1.5 Heat extremes ............................................................................................................................................ 17 3.1.6 Fire weather ................................................................................................................................................ 19
3.2 Climate projections for Kangaroo Island ......................................................................................... 20 3.2.1 Rainfall ........................................................................................................................................................ 20 3.2.2 Rainfall intensity ......................................................................................................................................... 20 3.2.3 Maximum temperature ................................................................................................................................ 22 3.2.4 Minimum temperature ................................................................................................................................. 24 3.2.5 Heat extremes and fire weather .................................................................................................................. 26
3.3 Projections for Ocean and Gulf waters ........................................................................................... 26 3.3.1 Sea level rise .............................................................................................................................................. 26 3.3.2 Sea surface temperatures .......................................................................................................................... 26 3.3.3 Ocean acidity .............................................................................................................................................. 27
3.4 Climate analogues .......................................................................................................................... 27
4 References ............................................................................................................ 29
5 Glossary ................................................................................................................ 31

Tables Table 1. Climate variables discussed herein and their availability or not from the SACR and
CCIA projects ............................................................................................................................10 Table 2. Adelaide Hills and Fleurieu Peninsula projected median rainfall changes for 2030,
2050, 2070 and 2090 ................................................................................................................12 Table 3. Adelaide Hills and Fleurieu Peninsula projected median maximum temperature
changes for 2030, 2050, 2070, and 2090 ..................................................................................14 Table 4. Adelaide Hills and Fleurieu Peninsula projected median minimum temperature
changes for 2030, 2050, 2070, and 2090 ..................................................................................16 Table 5. Adelaide and Victor Harbor projected changes in the number of extreme heat days
over 35ºC and 40ºC by 2050 and 2070 under intermediate and high emissions pathways ........18 Table 6. Summary of CCIA’s Forest Fire Danger Index calculations for the Adelaide weather
station .......................................................................................................................................19 Table 7. Kangaroo Island projected median rainfall changes for 2030, 2050, 2070, and 2090 ..21 Table 8. Kangaroo Island projected median maximum temperature changes for 2030, 2050,
2070, and 2090 .........................................................................................................................23 Table 9. Annual and seasonal median minimum temperature rise for Kangaroo Island above
the baseline period for 2030 to 2090 for the intermediate and high concentration pathways .....25 Table 10. Victor Harbor projected global median sea level rises and their ranges, relative to
a 1986-2005 baseline, under all emissions pathways for 2030, 2050, 2070, and 2090 .............26 Table 11. Climate analogue analysis results for Victor Harbor and Kingscote using maximum
consensus outputs for average annual temperature increases of 0.5 ºC and annual median
rainfall declines of 10% .............................................................................................................28
Figures
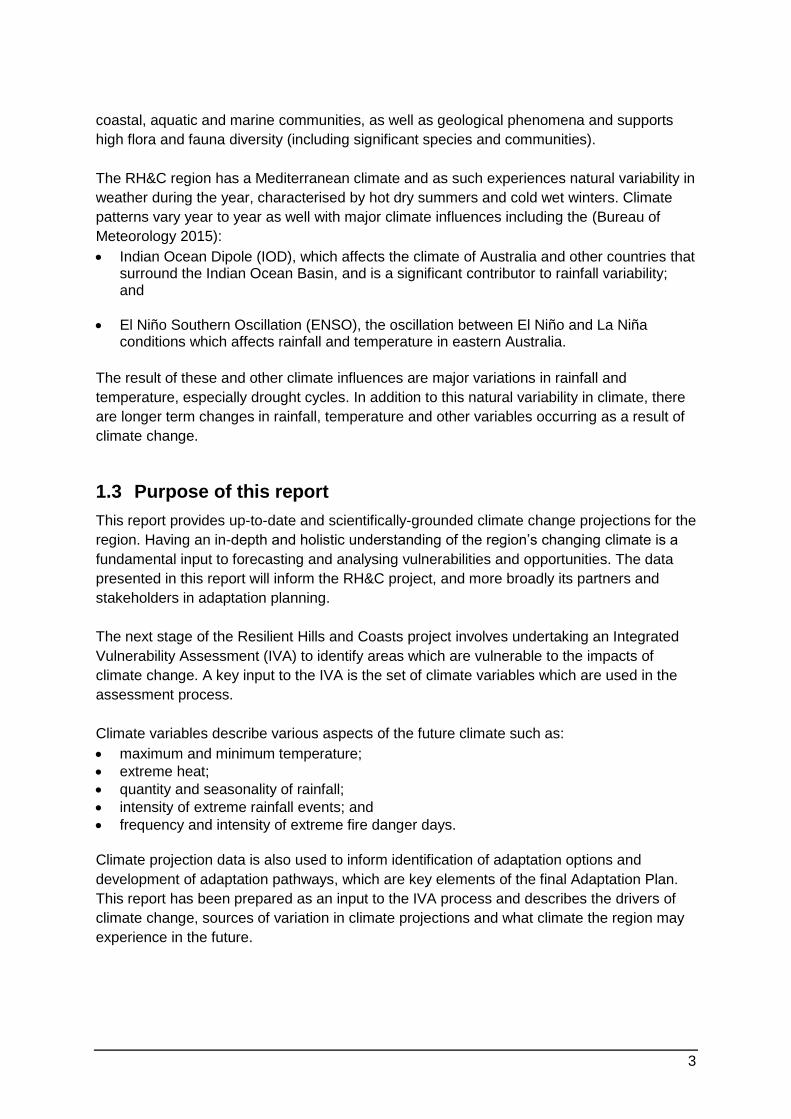
Figure 1. Location of Local Government Areas that comprise the Adelaide Hills, Fleurieu
and Kangaroo Island RDA region. Source: RDA Adelaide Hills, Fleurieu and Kangaroo
Island ......................................................................................................................................... 4 Figure 2. Example of difference in projected global air temperatures over time under
alternative RCPs ........................................................................................................................ 8

Acronyms
AMLR NRM region - Adelaide and Mount Lofty Ranges Natural Resources Management
region
AR5 - Fifth Assessment Report
BoM – Bureau of Meteorology
CCIA - Climate Change in Australia
CSIRO - Commonwealth Scientific and Industrial Research Organisation
ENSO - El Niño Southern Oscillation
FFDI - Forest Fire Danger Index
GCM - Global Climate Models
IIASA - International Institute for Applied Systems Analysis
IOD - Indian Ocean Dipole
IPCC - Intergovernmental Panel on Climate Change
IVA - Integrated Vulnerability Assessment
NRM - Natural Resource Management
PCTL - percentile
RCP - Representative Concentration Pathways
RH&C - Resilient Hills and Coasts
SACR - SA Climate Ready
SRES - Special Report on Emissions Scenarios
1
Executive summary While there is natural variability in the climate of the Adelaide Hills, Fleurieu Peninsula
and Kangaroo Island region, climate change will create a different future climate with warmer and drier conditions and higher sea levels.
Climate change planning uses climate projection data to assist with undertaking risk and vulnerability assessments and to assist with selecting adaptation options. Projections data has been summarised for the Adelaide Hills, Fleurieu Peninsula and Kangaroo Island using the results of the recent SA Climate Ready (SACR) and Climate Change in Australia projects (CCIA)1.
Under an intermediate emissions pathway (RCP4.5) by 2070 for the Adelaide Hills and Fleurieu Peninsula: o rainfall is projected to decline by about 6% (SACR, refer Table 2, p12); o rainfall intensity could increase by 11% (CCIA/Westra et al, refer p13); o maximum temperatures are projected to increase by 1.5ºC (SACR, refer Table 3, p14); o minimum temperatures could increase by 1.2ºC (SACR, refer Table 4, p16); and o extreme heat in Victor Harbor could increase by 30% to 11 days per year over 35ºC
(CCIA, refer Table 5, p18).
The increase in fire weather for the Adelaide Hills and Fleurieu Peninsula based on projections for Adelaide is an increase from 1.7 severe fire danger days per year under current conditions to 2.6 per year by 2090 under an intermediate emissions pathway (CCIA, refer Table 6, p19).
Under an intermediate emissions pathway by 2070 for Kangaroo Island: o rainfall is projected to decline by about 7.9%(SACR, refer Table 7, p21); o rainfall intensity could increase by 8% (CCIA/Westra et al, refer p20); o maximum temperatures are projected to increase by 1.2ºC (SACR, refer Table 8, p23);
and o minimum temperatures could increase by 1.0ºC (SACR, refer Table 9, p25).
Separate projections for extreme heat and fire weather are not currently available for Kangaroo Island.
For Ocean and Gulf waters, projections suggest: o a rise in sea levels of 33cm by 2070 under an intermediate emissions pathway
(CSIRO/BOM, refer Table 10, p26); o a rise in sea surface temperatures of 1.2ºC by 2090 under an intermediate
emissions pathway (Hope et al, refer p26); and o a decline of 0.15 pH units by 2090 under an intermediate emissions pathway (Hope
et al, refer p26).
1 Where available, SACR and CCIA projections are both provided in the body of the report, though where overlaps in
projections for the same variable occur, SACR projections have been discussed in text as this provides the best
representation of local climate drivers for South Australia. Any significant differences between SACR and CCIA projections
are discussed in the relevant climate variable sections. Median figures are presented in the Executive Summary using a
baseline period 1986 to 2005, unless otherwise stated.
2
1 Introduction
1.1 Resilient Hills and Coasts overview
Resilient Hills and Coasts (RH&C) is a climate change adaptation planning project covering
the Adelaide Hills, Fleurieu and Kangaroo Island Regional Development Australia (AHFKI
RDA) region (Figure 1). The RH&C name is also used to refer to the region covered.
Project partners are:
Adelaide Hills Council;
Alexandrina Council;
City of Victor Harbor;
District Council of Mount Barker;
District Council of Yankalilla;
Kangaroo Island Council;
Department of Environment, Water & Natural Resources;
Natural Resources Adelaide and Mount Lofty Ranges;
Natural Resources Kangaroo Island;
Regional Development Australia Adelaide Hills, Fleurieu and Kangaroo Island; and
the Southern and Hills Local Government Association.
As a collective, project partners, with input from community, business, government, industry
and academia, undertook the initial phase of the RH&C project in 2014, completing:
a Knowledge Audit describing the regional profile;
community workshops summarised in a report that describes stakeholder issues and values; and
an Integrated Vulnerability Assessment for Kangaroo Island.
The second stage will build on the work completed in 2014 and consider social, economic,
environmental, and cultural constructs to present a holistic set of adaptation actions and
recommendations. In particular, it will focus on regional priorities that would benefit from
multi-organisation cohesion and cooperation, and provide a strong evidence-base for
localised planning and action.
During the second stage, Resilient Hills & Coasts, with stakeholder input, will produce and
share:
up-to-date climate change projections for the region;
a vulnerability assessment describing the key sectors and/ or impact areas; and
a regional Climate Change Adaptation Plan.
1.2 Study region
The region is home to a population of approximately 120,000 people and covers a land area
of 8,752km2 (Resilient Hills and Coasts 2014). It is characterised by a highly variable
topography and geology, from coastal dunes and rocky escarpments to inland fertile hills
and pasturelands. The RH&C region supports a range of natural assets, including terrestrial,
3
coastal, aquatic and marine communities, as well as geological phenomena and supports
high flora and fauna diversity (including significant species and communities).
The RH&C region has a Mediterranean climate and as such experiences natural variability in
weather during the year, characterised by hot dry summers and cold wet winters. Climate
patterns vary year to year as well with major climate influences including the (Bureau of
Meteorology 2015):
Indian Ocean Dipole (IOD), which affects the climate of Australia and other countries that surround the Indian Ocean Basin, and is a significant contributor to rainfall variability; and
El Niño Southern Oscillation (ENSO), the oscillation between El Niño and La Niña conditions which affects rainfall and temperature in eastern Australia.
The result of these and other climate influences are major variations in rainfall and
temperature, especially drought cycles. In addition to this natural variability in climate, there
are longer term changes in rainfall, temperature and other variables occurring as a result of
climate change.
1.3 Purpose of this report
This report provides up-to-date and scientifically-grounded climate change projections for the
region. Having an in-depth and holistic understanding of the region’s changing climate is a
fundamental input to forecasting and analysing vulnerabilities and opportunities. The data
presented in this report will inform the RH&C project, and more broadly its partners and
stakeholders in adaptation planning.
The next stage of the Resilient Hills and Coasts project involves undertaking an Integrated
Vulnerability Assessment (IVA) to identify areas which are vulnerable to the impacts of
climate change. A key input to the IVA is the set of climate variables which are used in the
assessment process.
Climate variables describe various aspects of the future climate such as:
maximum and minimum temperature;
extreme heat;
quantity and seasonality of rainfall;
intensity of extreme rainfall events; and
frequency and intensity of extreme fire danger days.
Climate projection data is also used to inform identification of adaptation options and
development of adaptation pathways, which are key elements of the final Adaptation Plan.
This report has been prepared as an input to the IVA process and describes the drivers of
climate change, sources of variation in climate projections and what climate the region may
experience in the future.
4
Figure 1. Location of Local Government Areas that comprise the Adelaide Hills, Fleurieu and Kangaroo Island RDA region. Source: RDA Adelaide Hills, Fleurieu and Kangaroo Island.

5
2 Climate change projections overview
2.1 What is climate change?
Climate refers to the average weather conditions over long periods of time (IPCC 2013a).
The World Meteorological Organization defines the climate as the average weather over a
30 year period. Climate change refers to altered climate trends (e.g. increasing
temperatures, decreasing rainfall) as averaged over decades or longer. It differs from climate
variability which refers to short-term weather fluctuations (1-10 years) (e.g. drought and non-
drought cycles) which may occur despite the underlying climate trend. For example, the
climate trend of increasing temperature can be occurring even if extreme cold weather
periods occur in certain years.
Climate change is a consequence of the release of greenhouse gases like carbon dioxide,
methane and nitrous oxide into the Earth’s atmosphere (CSIRO and Bureau of Meteorology
2015). These gases are produced from a range of natural sources as well as from human
activities like energy production, transport, industrial processing, waste management,
agriculture, and land management. Greenhouse gases trap the sun’s energy in the Earth’s
atmosphere leading to changes in the global climate. These changes include: increasing air
temperatures, changes to rainfall patterns, rising sea levels, and increasing sea surface
temperatures.
2.2 Climate change modelling
The most authoritative source of information on climate change is provided by the
Intergovernmental Panel on Climate Change (IPCC). Every 5-6 years the IPCC produces an
Assessment Report which presents the most up-to-date scientific knowledge regarding
climate change. The most recent of these reports is the Fifth Assessment Report (AR5),
released in 2013. The Assessment Report is a compilation of expert working groups reports
which focus on different elements of climate change knowledge: the physical science basis
(working group I); impacts, adaptation and vulnerability (working group II); and mitigation
(working group III). Climate change modelling results contained in the physical science basis
report are used globally to underpin climate change action, including adaptation planning.
Some of the main conclusions presented in the AR5’s physical sciences basis report are
provided in Box 1.

6
Box 1. What is the evidence that the Earth’s climate is changing? (IPCC 2013b)
The Intergovernmental Panel on Climate Change (IPCC) is the world’s leading international
body for the assessment of climate change. The IPCC is a scientific body under the
auspices of the United Nations. Working Group I of the IPCC made the following conclusions
that are relevant to adaptation planning across the world:
Warming of the climate system is unequivocal, and since the 1950s, many of the
observed changes are unprecedented over decades to millennia. The atmosphere and
ocean have warmed, the sea level has risen, and the concentrations of greenhouse
gases have increased;
Each of the last three decades has been successively warmer at the Earth’s surface than any preceding decade since 1850 when detailed temperature records began;
Ocean warming dominates the increase in energy stored in the climate system, accounting for more than 90% of the energy accumulated between 1971 and 2010;
The rate of sea level rise since the mid-19th century has been larger than the mean rate during the previous two millennia. Over the period 1901 to 2010, global mean sea level rose by 0.19 m;
The atmospheric concentrations of carbon dioxide, methane, and nitrous oxide have increased to levels unprecedented in at least the last 800,000 years;
Continued emissions of greenhouse gases will cause further warming and changes in all components of the climate system; and
Limiting climate change will require substantial and sustained reductions of greenhouse gas emissions.
Further information on the IPCC Assessment Report 5 can be found at:
https://www.ipcc.ch/report/ar5/
It is not possible to “predict” or “forecast” what the future climate might be. Instead, climate
models use emissions and land-use scenarios to develop a range of “projections” that can
be used to explore what future climate conditions may occur. These projections contain
inherent variability, which are important to understand when determining how best to use
climate data in adaptation planning.
Two of the main sources of variability in climate projections derive from the choice of global
climate model/s (GCMs) and representative concentration pathway (RCP), as described
below (see also CSIRO and Bureau of Meteorology 2015).
Global Climate Models are numerical models that explore how processes in the
atmosphere, ocean, cryosphere and land surface respond to increasing greenhouse gas
concentrations. GCMs are used to generate projections for climate variables like
temperature and rainfall.
Over 40 GCMs have been developed for different regions, variables, and spatial resolutions.
When combined, the models can produce global average climate projections. However,
when conducting climate modelling at a given location (i.e. not a global focus), the subset of
models which best represent the location, resolution and variables of interest are selected in
order to minimise variation in the model outputs.
7
Given the variability that exists across the projections outputs of climate modelling,
communication of the outputs often use the median or 50th percentile model output
(sometimes described as the “best estimate”), or the 10th and 90th percentile outputs.
Representative Concentration Pathways refer to four main scenarios presented in IPCC
AR5 which consider time series of alternative emissions together with concentrations of the
full suite of greenhouse gases, aerosols and chemically active gases, as well as varying
land-use/land cover to produce alternative future climate conditions (Figure 2) (IPCC 2013a).
RCPs replace the previously used Special Report on Emissions Scenarios (SRES). The end
of century climate change projections are relatively similar among certain counterpart RCPs
and SRESs (e.g. the high emissions scenarios), however, the rate of change over the
century varies. Accordingly, projections from modelling conducted for certain future
timeframes using SRESs may vary from those conducted using RCPs.
The four main RCPs (Figure 2) outlined in AR5 as the basis for the climate projections
(IIASA 2015) are:
RCP2.5 “Peak and decline scenario” – an emissions pathway leading to very low greenhouse gas concentration levels; a so-called "peak" scenario (radiative forcing peaks at approximately 3 W m–2 before 2100 and then declines);
RCP4.5 “Intermediate, stabilisation scenario”: an emissions pathway where the impact of climate change on the atmosphere is stabilised before 2100 by using a range of technologies and strategies for reducing greenhouse gas emissions (radiative forcing stabilises at approximately 4.5 W m–2 after 2100);
RCP6.0 “Intermediate, stabilisation scenario”: an emissions pathway where the impact of climate change on the atmosphere is stabilised after 2100 by using a range of technologies and strategies for reducing greenhouse gas emissions (radiative forcing is stabilised at approximately 6.0 W m–2 after 2100); and
RCP8.5 “High emissions scenario” – An emissions pathway characterized by increasing greenhouse gas emissions over time leading to high greenhouse gas concentration levels.

8
Figure 2. Example of difference in projected global air temperatures over time under alternative RCPs. Bold lines represent the median projection across GCMs, with paler lines indicating the range of variability. Current emissions are tracking along RCP8.5 (Global Carbon Project 2014).
2.3 Projections data available for South Australia
There are two major climate change projection projects relevant to South Australia: SA
Climate Ready (SACR) and Climate Change in Australia (CCIA). Both projects use RCPs
and GCMs presented in the IPCC’s AR5.
2.3.1 SA Climate Ready
The Goyder Institute’s “Agreed downscaled climate projections for South Australia” project,
called SA Climate Ready, was released in February 2015. The project provides regional
scale projected climate trends for the State for four future timeframes (2030, 2050, 2070 and
2090), under two RCPs (RCP4.5 and RCP8.5), and for five climate variables:
areal evapotranspiration; temperature; and
rainfall; vapour pressure deficit.
solar radiation;
SACR climate modelling was refined to the “best” six GCMs based on their ability to
reproduce the effects of local climate drivers such as the Indian Ocean Dipole and the El
Niño Southern Oscillation.
9
SACR provides detailed downscaled weather station data for Natural Resource
Management (NRM) regions in the State. Three of these NRM regions fall entirely or partially
within the RH&C region: Adelaide Mt Lofty Ranges, Kangaroo Island, and the South
Australian Murray-Darling Basin.
Further information and regional scale summaries generated from SACR can be found at:
www.goyderinstitute.org or https://data.environment.sa.gov.au for access to the detailed
datasets.
2.3.2 Climate Change in Australia
Comparatively, the national-focused Climate Change in Australia (CSIRO and Bureau of
Meteorology 2015) project used up to 40 GCMs, with the number of models varying
depending on the climate variable and RCP of interest, at the resolution of the particular host
GCM (~67km to ~333km). ‘Application-ready’ future climate data is provided to intermediate
users (after undergoing on-line training) for eight GCMs.
The CSIRO and Bureau of Meteorology project “Climate Change in Australia: Projections for
Australia’s NRM regions”, referred to as Climate Change in Australia, was released in
February 2015. The project provides projected climate trends for cluster regions in Australia.
The spatial resolution, future timeframe/s, variables, GCMs, and RCPs modelled varies
among the clusters. Information for the following climate variables is available:
fire weather days; sea surface temperature;
mean and extreme sea-level rise; sea surface salinity;
ocean acidification; solar radiation;
point potential evapotranspiration; temperature;
rainfall; wet areal evapotranspiration; and
relative humidity; wind speed.
The vast majority of the RH&C region forms part of the Southern and South Western
Flatlands East sub-cluster, which covers the Eyre Peninsula, Northern and Yorke, Adelaide
and Mount Lofty Ranges, and Kangaroo Island NRM regions. Alexandrina Council also
forms part of the Murray Basin cluster, which extends east into Victoria and New South
Wales.
Further information on the modelling for each cluster (e.g. GCMs selected) is provided in
the Technical Report produced for the project (CSIRO and Bureau of Meteorology 2015).
Additional information on the project and access to projection data can be found at
www.climatechangeinaustralia.gov.au.
10
3 How will climate change affect the
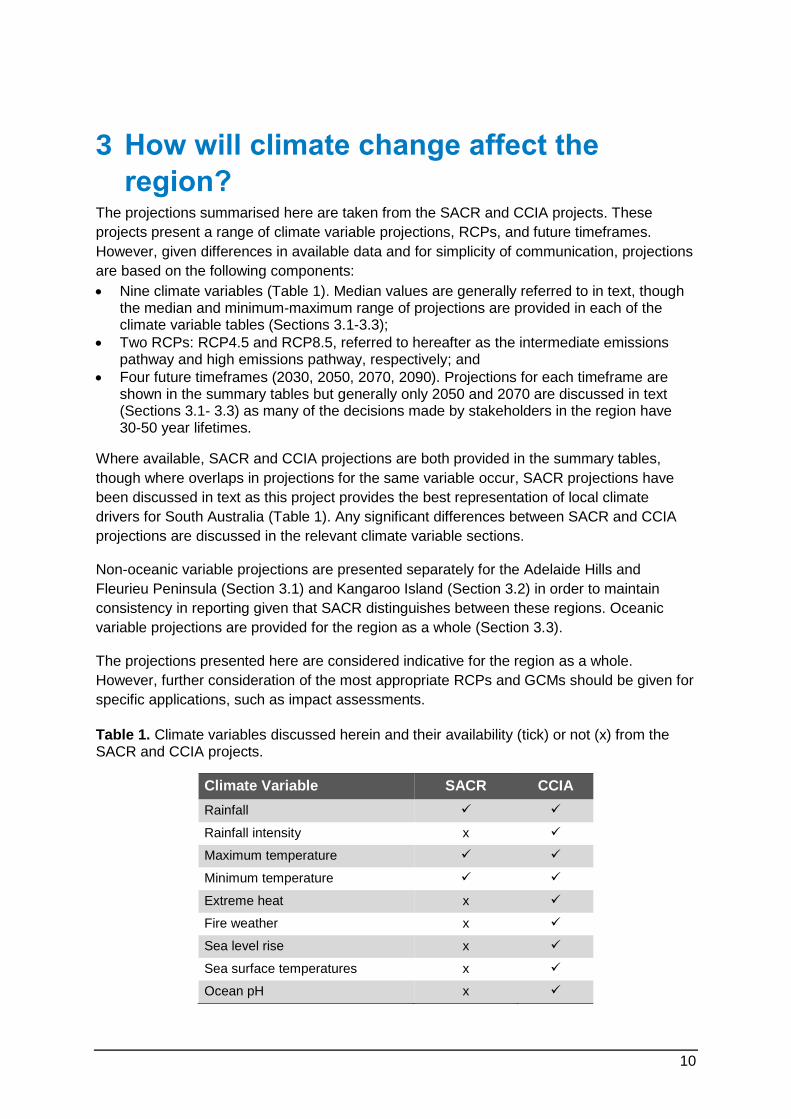
region? The projections summarised here are taken from the SACR and CCIA projects. These
projects present a range of climate variable projections, RCPs, and future timeframes.
However, given differences in available data and for simplicity of communication, projections
are based on the following components:
Nine climate variables (Table 1). Median values are generally referred to in text, though the median and minimum-maximum range of projections are provided in each of the climate variable tables (Sections 3.1-3.3);
Two RCPs: RCP4.5 and RCP8.5, referred to hereafter as the intermediate emissions pathway and high emissions pathway, respectively; and
Four future timeframes (2030, 2050, 2070, 2090). Projections for each timeframe are shown in the summary tables but generally only 2050 and 2070 are discussed in text (Sections 3.1- 3.3) as many of the decisions made by stakeholders in the region have 30-50 year lifetimes.
Where available, SACR and CCIA projections are both provided in the summary tables,
though where overlaps in projections for the same variable occur, SACR projections have
been discussed in text as this project provides the best representation of local climate
drivers for South Australia (Table 1). Any significant differences between SACR and CCIA
projections are discussed in the relevant climate variable sections.
Non-oceanic variable projections are presented separately for the Adelaide Hills and
Fleurieu Peninsula (Section 3.1) and Kangaroo Island (Section 3.2) in order to maintain
consistency in reporting given that SACR distinguishes between these regions. Oceanic
variable projections are provided for the region as a whole (Section 3.3).
The projections presented here are considered indicative for the region as a whole.
However, further consideration of the most appropriate RCPs and GCMs should be given for
specific applications, such as impact assessments.
Table 1. Climate variables discussed herein and their availability (tick) or not (x) from the SACR and CCIA projects.
Climate Variable SACR CCIA
Rainfall
Rainfall intensity x
Maximum temperature
Minimum temperature
Extreme heat x
Fire weather x
Sea level rise x
Sea surface temperatures x
Ocean pH x
11
3.1 Climate projections for the Adelaide Hills and Fleurieu
Peninsula
3.1.1 Rainfall
By 2050, the annual median rainfall is projected to decline by 6.8% and 7.4% compared with
the baseline2 under the intermediate and high emissions pathways, respectively (Table 2)3.
By 2070, projected rainfall decline under the intermediate emissions pathway is 6%,
compared to 11% under the high emissions pathway.
Under 2070 projections, for example, Mt Barker’s current annual average rainfall of 733mm
would decline to 689mm under the intermediate emissions pathway and 652mm under the
high emissions pathway. Under the same timeframe and pathways, Port Elliot’s current
485mm annual average rainfall would decline to 456mm and 432mm.
Seasonal differences in average rainfall are also projected for the region. By 2050, median
spring average rainfalls are projected to decline by 11.9% under the intermediate emissions
pathway compared to 4.3% and 4.4% in autumn and winter, respectively. Under the high
emissions pathway, the spring decline is 21% compared to 3.5% and 4.9% in autumn and
winter.
By 2070, the projected decline in median spring rainfall under an intermediate emissions
pathway is 16.4%, compared with 3.2-9.6% for other seasons. For the high emissions
pathway, the spring decline is 20.6% compared to 7.5-11.6% for other seasons.
The differences between the SACR and CCIA rainfall projections are substantial for some
combinations of emissions pathway and timeframe. In general, SACR projects greater
declines in rainfall than CCIA. This is most notable for seasonal projections, with SACR
projecting notably greater reductions in rainfall for summer, autumn and spring by 2070
under the high emissions pathway.
2 The baseline is the period 1986 to 2005. 3 Figures from SACR projections have been included in the text to provide the best representation of local climate
drivers for South Australia. However, both the CCIA and SACR projections are provided in Table 2.

12
Table 2. Adelaide Hills and Fleurieu Peninsula projected median rainfall changes (%) for 2030, 2050, 2070 and 2090. Projections shown are annual and seasonal changes, compared to the baseline, under intermediate (RCP4.5) and high (RCP8.5) emissions pathways.
RCP SOURCE 2030 2050 2070 2090
ANNUAL
RCP4.5 SACR -4.7 (-8.9 to -1.0) -6.8 (-8.8 to -3.5) -5.7 (-12.9 to -4.7) -7.7 (-10.7 to -5.0)
CCIA -3.7 (-12.9 to 4.5) -4.2 (-16.8 to 2.4) -6.3 (-18.0 to 5.4) -6.7 (-18.3 to 2.6)
RCP8.5 SACR -4.8 (-7.9 to -3.4) -7.4 (-14.0 to -4.0) -11.0 (-21.0 to -8.7) -15.6 (-25.3 to -11.2)
CCIA -1.9 (-12.7 to 4.7) -5.9 (-17.8 to 4.4) -8.2 (-28.8 to 3.1) -9.3 (-36.9 to 5.8)
SUMMER
RCP4.5 SACR -1.6 (-20.7 to 7.7) -3.0 (-10.4 to 4.6) -9.6 (-13.8 to 14.3) -0.8 (-10.9 to 5.5)
CCIA 0 (-24 to 30.2) -2 (-18.7 to 16) -1.3 (-25 to 21.1) -2.7 (-19.6 to 13.3)
RCP8.5 SACR 2.9 (-5.1 to 10.4) -9.6 (-17.6 to 7.8) -7.5 (-19.2 to 1.7) -17.4 (-26.1 to 2.8)
CCIA 2.1 (-13.8 to 18.6) -5.8 (-22.8 to 16.6) 0.8 (-28.3 to 21.8) -3.3 (-26 to 22.3)
AUTUMN
RCP4.5 SACR -2.2 (-10.4 to 2.7) -4.4 (-10.5 to 6.0) -3.2 (-16.3 to 0.9) -9.3 (-11.7 to 1.4)
CCIA -1.2 (-22 to 17.7) -1.4 (-20 to 23) -2.5 (-23.5 to 23.6) -1.8 (-26.4 to 16.5)
RCP8.5 SACR -4.2 (-10.9 to 2.3) -3.5 (-13.1 to 4.9) -11.6 (-19.2 to -4.9) -11.8 (-25.8 to -5.0)
CCIA -2.7 (-22.2 to 23.3) 0.3 (-22.7 to 18.1) -3.9 (-28.8 to 17.3) 1.7 (-33.3 to 33.1)
WINTER
RCP4.5 SACR 0.5 (-7.0 to 4.1) -4.3 (-9.6 to -0.9) -6.0 (-9.1 to 1.0) -5.2 (-9.2 to 1.7)
CCIA -5.6 (-16 to 6.4) -9.4 (-18.9 to 3.4) -8.2 (-21.3 to 1) -9.4 (-24 to 2.2)
RCP8.5 SACR -4.4 (-9.2 to -1.6) -4.9 (-9.4 to -0.6) -7.6 (-15.5 to -4.6) -11.9 (-18.5 to -4.9)
CCIA -5.3 (-15.5 to 4.8) -9.2 (-19.3 to 4.3) -14.9 (-30.4 to -4) -19.1 (-42.8 to -2.6)
SPRING
RCP4.5 SACR -12.2 (-18.8 to -9.3) -11.9 (-20.4 to -8.5) -16.4 (-26.0 to -8.6) -15.3 (-25.1 to -12.6)
CCIA -5.4 (-20 to 9.8) -6.4 (-23.1 to 4.9) -8.9 (-30.9 to 9.4) -13.6 (-26.3 to 2.9)
RCP8.5 SACR -10.8 (-17.1 to -4.2) -21.0 (-29.3 to -8.6) -20.6 (-39.7 to -15.4) -27.4 (-44.9 to -23.3)
CCIA -6.7 (-23 to 10.3) -7.6 (-34.9 to 14.2) -12.9 (-41.9 to 9.6) -18.9 (-49.9 to 8.5)

13
3.1.2 Rainfall intensity
According to the CCIA project, there is high confidence that the intensity of heavy rainfall
events (maximum 1-day rainfall) will increase in the RH&C region, despite projected
decreases in mean rainfall. The CCIA does not provide quantitative modelling for rainfall
intensity. However, for the purposes of obtaining regional projections, other recent analyses
outside of SACR and CCIA has been drawn upon. Westra et al (2012) report that for each
degree of global warming, extreme daily rainfall may increase by 7%. Applying this multiplier
to the projected changes in the Adelaide Hills and Fleurieu Peninsula region, rainfall intensity
could increase by 9% and 11% by 2050 under an intermediate and high emissions pathway,
respectively, and at least 11% and 16% by 2070.
3.1.3 Maximum temperature
Since national records began in 1910 until 2013, surface air temperatures in the region have
warmed by approximately 0.7°C (Hope et al. 2015) and are projected to continue to rise
under both SACR and CCIA projections.
Compared to baseline temperatures, SACR projects that under an intermediate emissions
pathway, annual median maximum temperatures will increase by 1.3ºC and 1.5 ºC by 2050
and 2070, respectively (Table 2). Comparatively, under a high emissions pathway,
temperature increases are projected to be 1.6 ºC and 2.3ºC by 2050 and 2070, respectively
(Table 3).
To give a regional example, this means that the annual median maximum temperatures at
Mt Barker by 2070 could increase from the current 20.3ºC to 21.8ºC or 22.6ºC under an
intermediate or high emissions pathway, respectively. Under the same future timeframe and
emissions pathways, Parawa annual median maximum temperatures could increase from
17.8ºC to 19.3ºC or 20.1ºC.
Maximum temperatures vary across seasons, particularly for spring. For example, by 2050
under an intermediate emissions pathway, the increase in spring median maximum
temperatures is 1.6ºC compared to 1.2ºC for all other seasons; and 2.0ºC compared to 1.5-
1.6ºC for all other seasons under a high emissions pathway.
A similar trend continues in 2070, where summer, autumn, and winter median maximum
temperatures are projected to increase by 1.3-1.5ºC under an intermediate emissions
pathway compared with 1.9ºC in spring. Under a high emissions pathway summer, autumn,
and winter increase by 2.1-2.3ºC, and spring by 2.9ºC.
There is little difference in the SACR and CCIA annual projections across RCPs and
timeframes, with most projections varying only by 0.1ºC. However, there are more notable
differences in projections between seasons, although this is not consistently greater for one
project’s projections over another.

14
Table 3. Adelaide Hills and Fleurieu Peninsula projected median maximum temperature changes (ºC) for 2030, 2050, 2070, and 2090. Projections shown are annual and seasonal changes, compared to the baseline (1986 – 2005), under intermediate (RCP4.5) and high (RCP8.5) emissions pathways.
RCP SOURCE 2030 2050 2070 2090
ANNUAL
RCP4.5 SACR 0.9 (0.7 to 1.1) 1.3 (1.1 to 1.5) 1.5 (1.3 to 1.8) 1.8 (1.5 to 2.2)
CCIA 0.7 (0.5 to 1.0) 1.2 (0.8 to 1.5) 1.5 (1.1 to 2.0) 1.7 (1.1 to 2.2)
RCP8.5 SACR 1.0 (0.9 to 1.4) 1.6 (1.5 to 2.3) 2.3 (2.2 to 3.3) 3.2 (2.8 to 4.3)
CCIA 0.8 (0.6 to 1.2) 1.5 (1.2 to 2.0) 2.4 (1.9 to 3.1) 3.3 (2.6 to 4.1)
SUMMER
RCP4.5 SACR 0.9 (0.6 to 1.2) 1.2 (1.0 to 1.7) 1.5 (1.2 to 2.0) 1.7 (1.3 to 2.2)
CCIA 0.7 (0.4 to 1.3) 1.2 (0.9 to 1.8) 1.6 (0.9 to 2.2) 1.7 (1.0 to 2.4)
RCP8.5 SACR 0.9 (0.6 to 1.5) 1.5 (1.3 to 2.3) 2.1 (2.0 to 3.3) 2.8 (2.6 to 4.3)
CCIA 0.9 (0.6 to 1.3) 1.5 (1.1 to 2.2) 2.3 (1.8 to 3.4) 3.3 (2.4 to 4.4)
AUTUMN
RCP4.5 SACR 0.8 (0.8 to 0.9) 1.2 (1.0 to 1.3) 1.5 (1.3 to 1.8) 1.8 (1.5 to 2.2)
CCIA 0.7 (0.3 to 1.1) 1.1 (0.7 to 1.5) 1.4 (1.0 to 1.9) 1.5 (1.0 to 2.1)
RCP8.5 SACR 1.0 (0.8 to 1.3) 1.6 (1.3 to 2.2) 2.3 (2.1 to 3.2) 3.1 (2.8 to 4.3)
CCIA 0.7 (0.4 to 1.3) 1.4 (1.0 to 2.1) 2.4 (1.7 to 3.0) 3.1 (2.3 to 3.9)
WINTER
RCP4.5 SACR 0.8 (0.5 to 0.9) 1.2 (0.9 to 1.3) 1.3 (1.1 to 1.6) 1.5 (1.3 to 1.8)
CCIA 0.7 (0.4 to 1.0) 1.1 (0.8 to 1.4) 1.4 (1.0 to 1.8) 1.5 (1.1 to 2.1)
RCP8.5 SACR 0.9 (0.7 to 1.2) 1.5 (1.3 to 2.0) 2.2 (1.9 to 2.9) 3.0 (2.6 to 3.9)
CCIA 0.8 (0.6 to 1.2) 1.4 (1.1 to 1.9) 2.3 (1.8 to 3.0) 3.2 (2.6 to 4.1)
SPRING
RCP4.5 SACR 1.2 (1.0 to 1.3) 1.6 (1.4 to 1.7) 1.9 (1.6 to 2.1) 2.1 (1.8 to 2.5)
CCIA 0.9 (0.5 to 1.1) 1.3 (0.8 to 1.8) 1.7 (1.1 to 2.2) 1.9 (1.2 to 2.4)
RCP8.5 SACR 1.2 (1.0 to 1.7) 2.0 (1.8 to 2.7) 2.9 (2.5 to 3.7) 3.9 (3.2 to 4.9)
CCIA 0.9 (0.6 to 1.3) 1.7 (1.2 to 2.1) 2.8 (1.9 to 3.2) 3.9 (2.7 to 4.6)

15
3.1.4 Minimum temperature
Annual median minimum temperatures show a similar trend to maximums, suggesting an
increase by 2050 of 1.0ºC and 1.3 ºC under the intermediate and high emissions pathways,
respectively (Table 4). By 2070, the SACR projected increase in minimum temperatures
under an intermediate emissions pathway is 1.2ºC compared with 2.0ºC under a high
emissions pathway.
The difference in projected median minimum temperatures across seasons is generally
minimal. By 2050, the SACR projected increases under the intermediate emissions pathway
are between 0.8-1.1ºC across seasons, and for the high emissions pathway, 1.2-1.5ºC. By
2070, the range of change increases slightly under the intermediate emissions pathway to
1.0-1.2ºC. It is only under the high emissions pathway for 2070 that the seasonal difference
is more pronounced, with summer and winter increases of 1.8-1.9ºC compared with 2.2-
2.3ºC for autumn and spring.
As for maximum temperature, there is little difference between the SACR and CCIA
projected changes in annual median minimum temperature across RCPs and timeframes.
This is also the case for the majority of seasonal projections.

16
Table 4. Adelaide Hills and Fleurieu Peninsula projected median minimum temperature changes (ºC) for 2030, 2050, 2070, and 2090. Projections shown are annual and seasonal changes, compared to the baseline, under intermediate (RCP4.5) and high (RCP8.5) emissions pathways.
RCP SOURCE 2030 2050 2070 2090
ANNUAL
RCP4.5 SACR 0.7 (0.5 to 0.8) 1.0 (0.7 to 1.2) 1.2 (0.9 to 1.6) 1.3 (1.0 to 1.9)
CCIA 0.6 (0.5 to 0.8) 1.0 (0.7 to 1.3) 1.3 (0.9 to 1.6) 1.4 (1.0 to 1.9)
RCP8.5 SACR 0.8 (0.6 to 1.1) 1.3 (1.2 to 1.8) 2.0 (1.8 to 2.6) 2.8 (2.3 to 3.5)
CCIA 0.7 (0.5 to 1.1) 1.3 (1.0 to 1.7) 2.1 (1.7 to 2.8) 2.9 (2.3 to 3.7)
SUMMER
RCP4.5 SACR 0.7 (0.4 to 1.0) 0.9 (0.7 to 1.4) 1.1 (0.9 to 1.9) 1.2 (0.9 to 2.2)
CCIA 0.7 (0.3 to 1.1) 1.1 (0.7 to 1.5) 1.4 (0.8 to 1.9) 1.4 (0.9 to 2.1)
RCP8.5 SACR 0.7 (0.5 to 1.3) 1.3 (1.0 to 2.1) 1.9 (1.7 to 3.0) 2.7 (2.2 to 4.0)
CCIA 0.8 (0.5 to 1.3) 1.4 (0.9 to 2.1) 2.2 (1.6 to 3.2) 3.1 (2.2 to 4.2)
AUTUMN
RCP4.5 SACR 0.8 (0.5 to 0.9) 1.1 (0.8 to 1.3) 1.2 (1.0 to 1.7) 1.4 (1.1 to 2.1)
CCIA 0.6 (0.4 to 0.9) 1.0 (0.6 to 1.3) 1.3 (0.9 to 1.7) 1.4 (1.0 to 1.9)
RCP8.5 SACR 1.0 (0.7 to 1.2) 1.5 (1.2 to 2.1) 2.3 (1.7 to 3.1) 3.1 (2.5 to 4.2)
CCIA 0.7 (0.3 to 1.1) 1.4 (1.0 to 1.8) 2.1 (1.6 to 2.8) 3.0 (2.4 to 3.8)
WINTER
RCP4.5 SACR 0.6 (0.4 to 0.7) 0.8 (0.6 to 0.9) 1.0 (0.7 to 1.2) 1.3 (0.9 to 1.5)
CCIA 0.6 (0.3 to 0.8) 0.9 (0.6 to 1.2) 1.1 (0.8 to 1.5) 1.3 (0.8 to 1.7)
RCP8.5 SACR 0.7 (0.5 to 0.9) 1.2 (1.0 to 1.4) 1.8 (1.5 to 2.1) 2.5 (2.2 to 2.7)
CCIA 0.6 (0.5 to 0.9) 1.2 (0.9 to 1.6) 1.9 (1.5 to 2.5) 2.6 (2.3 to 3.3)
SPRING
RCP4.5 SACR 0.7 (0.5 to 0.8) 1.0 (0.8 to 1.2) 1.2 (1.0 to 1.5) 1.5 (1.2 to 1.7)
CCIA 0.6 (0.4 to 0.9) 1.0 (0.6 to 1.5) 1.3 (0.8 to 1.7) 1.5 (1.0 to 1.9)
RCP8.5 SACR 0.9 (0.7 to 1.0) 1.5 (1.2 to 1.7) 2.2 (1.8 to 2.4) 2.9 (2.4 to 3.2)
CCIA 0.8 (0.4 to 1.0) 1.3 (0.9 to 1.8) 2.1 (1.7 to 2.7) 3.0 (2.4 to 3.7)
17
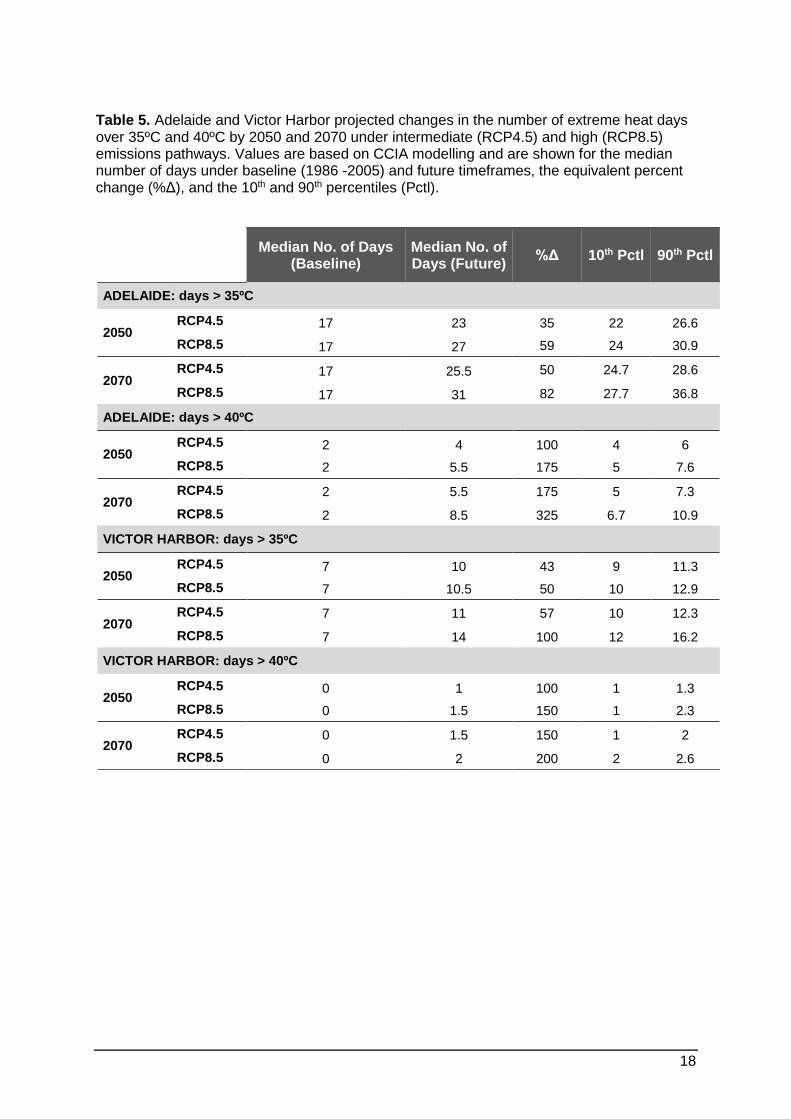
3.1.5 Heat extremes
The whole of the Adelaide Hills and Fleurieu Peninsula region is likely to experience an
increase in extreme heat (i.e. number of days over 35ºC or 40ºC) in the future4. However,
specific projections of changes in extreme heat using CCIA results are available only for
Adelaide and Victor Harbor.
In Adelaide, by 2050 the number of days over 35ºC is projected to increase from 17 per year
to 23 or 27 per year under intermediate or high emissions pathways, respectively (Table 5).
By 2070, under the same emissions pathways, the number of days over 35 ºC is projected to
increase to 25.5 or 31 per year (Table 5). A greater increase occurs for the number of days
over 40ºC, with at least a doubling by 2050 under intermediate and high emissions, and an
increase from 2 days per year to 5.5 or 8.5 by 2070.
In Victor Harbor, by 2050 the number of days over 35ºC will increase from 7 to 10 or 10.5
under the intermediate or high emissions pathways, and by 2070 will increase to 11 or 14
(Table 5). Under baseline conditions (1986 – 2005), Victor Harbor had not recorded any
days over 40ºC. However, by 2050, it is projected to experience 1 or 1.5 days per year
above 40ºC under the intermediate or high emissions pathways, and 1.5 or 2 days by 2070.
4 Extreme heat measures differ from heatwave conditions, with extreme heat being based on total number of
days above a thermal threshold, whereas heatwave conditions have more specific definitions, such as “three or more consecutive days with the average of the daily maximum and minimum exceeding 32ºC”.
18
Table 5. Adelaide and Victor Harbor projected changes in the number of extreme heat days over 35ºC and 40ºC by 2050 and 2070 under intermediate (RCP4.5) and high (RCP8.5) emissions pathways. Values are based on CCIA modelling and are shown for the median number of days under baseline (1986 -2005) and future timeframes, the equivalent percent change (%Δ), and the 10th and 90th percentiles (Pctl).
Median No. of Days
(Baseline) Median No. of Days (Future)
%Δ 10th Pctl 90th Pctl
ADELAIDE: days > 35ºC
2050 RCP4.5 17 23 35 22 26.6
RCP8.5 17 27 59 24 30.9
2070 RCP4.5 17 25.5 50 24.7 28.6
RCP8.5 17 31 82 27.7 36.8
ADELAIDE: days > 40ºC
2050 RCP4.5 2 4 100 4 6
RCP8.5 2 5.5 175 5 7.6
2070 RCP4.5 2 5.5 175 5 7.3
RCP8.5 2 8.5 325 6.7 10.9
VICTOR HARBOR: days > 35ºC
2050 RCP4.5 7 10 43 9 11.3
RCP8.5 7 10.5 50 10 12.9
2070 RCP4.5 7 11 57 10 12.3
RCP8.5 7 14 100 12 16.2
VICTOR HARBOR: days > 40ºC
2050 RCP4.5 0 1 100 1 1.3
RCP8.5 0 1.5 150 1 2.3
2070 RCP4.5 0 1.5 150 1 2
RCP8.5 0 2 200 2 2.6

19
3.1.6 Fire weather
Fire weather projections were estimated in the CCIA project using the McArthur Forest Fire
Danger Index (FFDI), which is a widely used measure to forecast the influence of weather on
fire behaviour (Hope et al. 2015).
Fire weather is considered ‘severe’ when FFDI exceeds 50 and ‘extreme’ when FFDI
exceeds 75. The CCIA project generated FFDI projections for four weather stations in
South Australia, of which Adelaide is the most relevant to the RH&C region. The other
locations in the State are Ceduna, Woomera, and Mt Gambier. FFDI was calculated at
Adelaide by Hope et al. (2015) for only two future timeframes (2030 and 2090).
The FFDI projections indicate increased fire weather in the future for Adelaide. General fire
weather danger is projected to increase by 2030 by 6% or 13% under intermediate or high
emissions pathways, and by 12% or 29% by 2090 (Table 6).
The number of days per year with a ‘severe’ fire danger rating is projected to increase by
2030 from 1.7 under baseline conditions to 2.6 or 2.1 under the intermediate and high
emissions pathways, respectively. By 2090, this will increase to 2.6 and 4 days per year
(Table 6) (Hope et al. 2015).
Table 6. Summary of CCIA’s Forest Fire Danger Index (FFDI) calculations for the Adelaide weather station. The baseline period 1981-1995 is used here to calculate change to 2030 or 2090 under intermediate or high emissions pathways (RCP4.5 or RCP8.5, respectively). For both the number of severe fire days per year and the FFDI, absolute projected values as well as projected percent change (%Δ) from baseline are shown.
Severe Fire Danger Days (per year)
%Δ Forest Fire Danger
Index (FFDI) %Δ
1995 Baseline 1.7 0 2942 0
2030 RCP4.5 2.6 (1.9 to 3.5) 90 3336 (3033 to 3885) 13
RCP8.5 2.1 (1.9 to 2.3) 73 3129 (2985 to 3334) 6
2090 RCP4.5 2.6 (2.2 to 2.9) 90 3298 (3126 to 3395) 12
RCP8.5 4 (2.3 to 5.4) 138 3795 (3085 to 4464) 29
20
3.2 Climate projections for Kangaroo Island
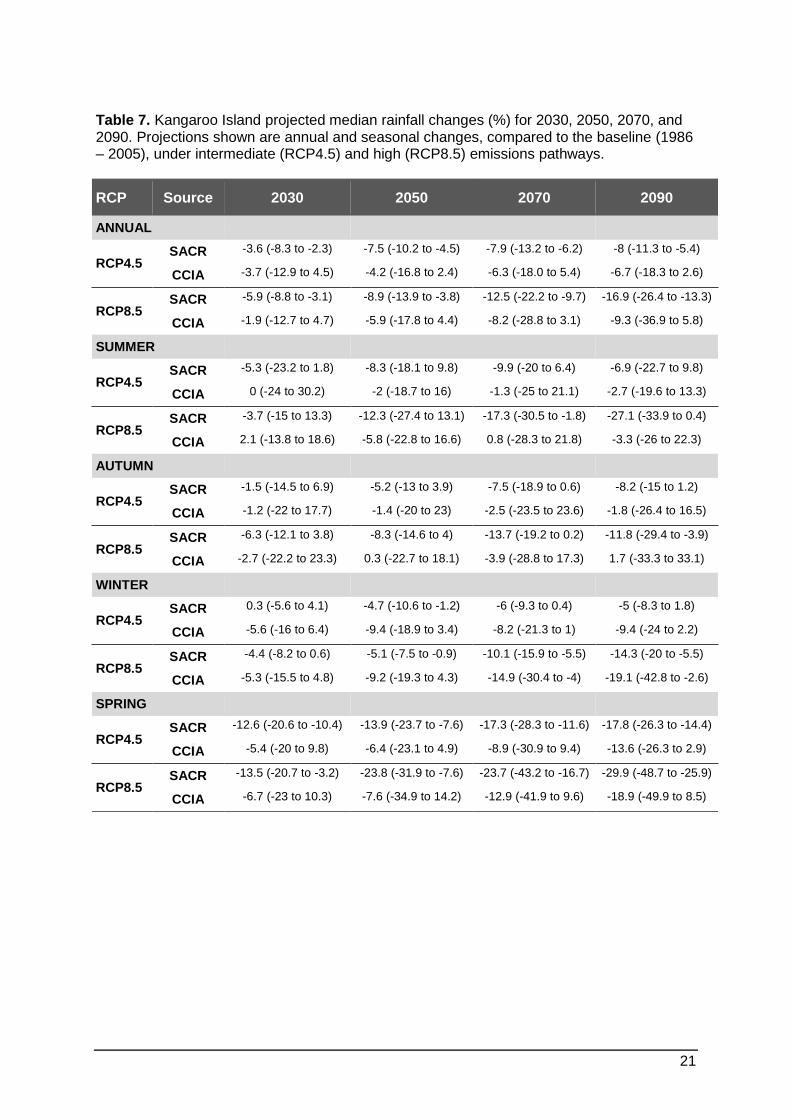
3.2.1 Rainfall
By 2050, annual median rainfall is projected to decline by 7.5% or 8.9% under intermediate
or high emissions pathways, respectively (Table 7)5. By 2070, rainfall is projected to decline
by 7.9% under an intermediate emissions pathway, compared with 12.5% under a high
emissions pathway.
For Kingscote, this would result in a decline in rainfall from the current annual average of
489mm to 450mm or 428mm under an intermediate or high emissions pathway, respectively.
Seasonal differences are apparent by 2050, with spring projected to experience a 13.9%
decline in median rainfall under an intermediate emissions pathway, compared to 5.2% and
4.7% decline in autumn and winter, respectively. Under the high emissions pathway the
spring decline is 23.8% compared to 5.1% and 8.3% during winter and autumn.
By 2070, the spring decline in median rainfall under the intermediate emissions pathway is
projected to be 17.3%, compared to 6.0-9.9% for summer, autumn, and winter. For the high
emissions pathway, the decline in spring rainfall is 23.7% compared to 10.1-17.3% for the
other seasons.
The difference between the SACR and CCIA rainfall projections is substantial for some
combinations of emissions pathway and timeframes. In general, the SACR data projects
greater declines in median rainfall than the CCIA dataset. This is most notable for seasonal
projections, with SACR projecting greater reductions in 2070 median rainfalls for summer,
autumn, and spring under a high emissions pathway.
3.2.2 Rainfall intensity
The CCIA project states that there is high confidence that the intensity of heavy rainfall
events (maximum 1-day rainfall) will increase in the RH&C region (Hope et al. 2015). This
holds despite projected decreases in mean rainfall.
The CCIA does not provide quantitative modelling for rainfall intensity. However, for the
purposes of obtaining regional projections, other recent analyses outside of SACR and CCIA
has drawn upon. Westra et al (2012) report that for each degree of global warming, extreme
daily rainfall may increase by 7%. Applying this multiplier to the projected changes on
Kangaroo Island, rainfall intensity could increase by 2050 by nearly 8% and 9%,
respectively, under an intermediate ad high emissions pathway/ By 2070, this could increase
to 8% and 13%.
5 Figures from SACR projections have been included in the text to provide the best representation of local
climate drivers for South Australia. However, both the CCIA and SACR projections are provided in Table 7.
21
Table 7. Kangaroo Island projected median rainfall changes (%) for 2030, 2050, 2070, and 2090. Projections shown are annual and seasonal changes, compared to the baseline (1986 – 2005), under intermediate (RCP4.5) and high (RCP8.5) emissions pathways.
RCP Source 2030 2050 2070 2090
ANNUAL
RCP4.5 SACR -3.6 (-8.3 to -2.3) -7.5 (-10.2 to -4.5) -7.9 (-13.2 to -6.2) -8 (-11.3 to -5.4)
CCIA -3.7 (-12.9 to 4.5) -4.2 (-16.8 to 2.4) -6.3 (-18.0 to 5.4) -6.7 (-18.3 to 2.6)
RCP8.5 SACR -5.9 (-8.8 to -3.1) -8.9 (-13.9 to -3.8) -12.5 (-22.2 to -9.7) -16.9 (-26.4 to -13.3)
CCIA -1.9 (-12.7 to 4.7) -5.9 (-17.8 to 4.4) -8.2 (-28.8 to 3.1) -9.3 (-36.9 to 5.8)
SUMMER
RCP4.5 SACR -5.3 (-23.2 to 1.8) -8.3 (-18.1 to 9.8) -9.9 (-20 to 6.4) -6.9 (-22.7 to 9.8)
CCIA 0 (-24 to 30.2) -2 (-18.7 to 16) -1.3 (-25 to 21.1) -2.7 (-19.6 to 13.3)
RCP8.5 SACR -3.7 (-15 to 13.3) -12.3 (-27.4 to 13.1) -17.3 (-30.5 to -1.8) -27.1 (-33.9 to 0.4)
CCIA 2.1 (-13.8 to 18.6) -5.8 (-22.8 to 16.6) 0.8 (-28.3 to 21.8) -3.3 (-26 to 22.3)
AUTUMN
RCP4.5 SACR -1.5 (-14.5 to 6.9) -5.2 (-13 to 3.9) -7.5 (-18.9 to 0.6) -8.2 (-15 to 1.2)
CCIA -1.2 (-22 to 17.7) -1.4 (-20 to 23) -2.5 (-23.5 to 23.6) -1.8 (-26.4 to 16.5)
RCP8.5 SACR -6.3 (-12.1 to 3.8) -8.3 (-14.6 to 4) -13.7 (-19.2 to 0.2) -11.8 (-29.4 to -3.9)
CCIA -2.7 (-22.2 to 23.3) 0.3 (-22.7 to 18.1) -3.9 (-28.8 to 17.3) 1.7 (-33.3 to 33.1)
WINTER
RCP4.5 SACR 0.3 (-5.6 to 4.1) -4.7 (-10.6 to -1.2) -6 (-9.3 to 0.4) -5 (-8.3 to 1.8)
CCIA -5.6 (-16 to 6.4) -9.4 (-18.9 to 3.4) -8.2 (-21.3 to 1) -9.4 (-24 to 2.2)
RCP8.5 SACR -4.4 (-8.2 to 0.6) -5.1 (-7.5 to -0.9) -10.1 (-15.9 to -5.5) -14.3 (-20 to -5.5)
CCIA -5.3 (-15.5 to 4.8) -9.2 (-19.3 to 4.3) -14.9 (-30.4 to -4) -19.1 (-42.8 to -2.6)
SPRING
RCP4.5 SACR -12.6 (-20.6 to -10.4) -13.9 (-23.7 to -7.6) -17.3 (-28.3 to -11.6) -17.8 (-26.3 to -14.4)
CCIA -5.4 (-20 to 9.8) -6.4 (-23.1 to 4.9) -8.9 (-30.9 to 9.4) -13.6 (-26.3 to 2.9)
RCP8.5 SACR -13.5 (-20.7 to -3.2) -23.8 (-31.9 to -7.6) -23.7 (-43.2 to -16.7) -29.9 (-48.7 to -25.9)
CCIA -6.7 (-23 to 10.3) -7.6 (-34.9 to 14.2) -12.9 (-41.9 to 9.6) -18.9 (-49.9 to 8.5)

22
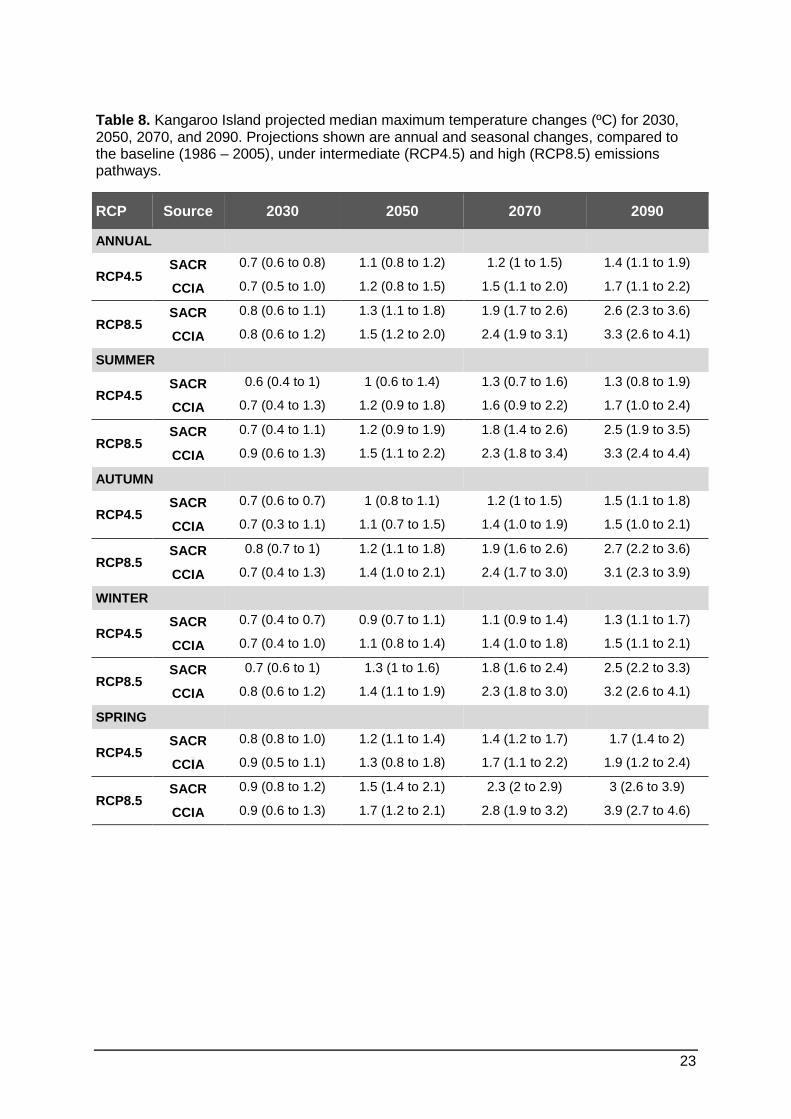
3.2.3 Maximum temperature
Since national records began in 1910 (Hope et al. 2015) until 2013, surface air temperatures
in the region have warmed by approximately 0.7°C (according to CCIA projections) and are
projected to continue to rise under both SACR and CCIA projections.
Compared to baseline6 temperatures, SACR projects that under an intermediate emissions
pathways, annual median maximum temperatures will increase by 1.1ºC and 1.2ºC by 2050
and 2070, respectively (Table 8). Comparatively, under a high emissions pathway,
temperatures are projected to increase by 1.3ºC and 1.9 ºC by 2050 and 2070, respectively
(Table 8).
An increase in annual median maximum temperatures of this magnitude would see the
average maximum temperature at Kingscote increase from the current 19.6ºC to 20.8ºC or
21.5ºC under an intermediate or high emissions pathway, respectively.
Seasonal differences by 2050 are minimal, ranging from 0.9-1.2 ºC under the intermediate
emissions pathway and 1.2-1.5 ºC for the high emissions pathway. The difference between
seasons for median maximum temperatures by 2070 under an intermediate emissions
pathway is limited, with winter temperatures projected to increase by 1.1ºC and spring only
slighter higher at 1.4ºC. Under a high emissions pathway summer, autumn and winter are
projected to increase by 1.8-1.9 ºC and spring by 2.3ºC.
There is little difference in the SACR and CCIA projections across RCPs early in the coming
century. However, by the end of the century the CCIA projected annual median maximum
temperatures are notably higher than those generated for the SACR project. This
pronounced difference is also evident across seasons, especially for RCP8.5.
6 Baseline is the period 1986 to 2005.
23
Table 8. Kangaroo Island projected median maximum temperature changes (ºC) for 2030, 2050, 2070, and 2090. Projections shown are annual and seasonal changes, compared to the baseline (1986 – 2005), under intermediate (RCP4.5) and high (RCP8.5) emissions pathways.
RCP Source 2030 2050 2070 2090
ANNUAL
RCP4.5 SACR 0.7 (0.6 to 0.8) 1.1 (0.8 to 1.2) 1.2 (1 to 1.5) 1.4 (1.1 to 1.9)
CCIA 0.7 (0.5 to 1.0) 1.2 (0.8 to 1.5) 1.5 (1.1 to 2.0) 1.7 (1.1 to 2.2)
RCP8.5 SACR 0.8 (0.6 to 1.1) 1.3 (1.1 to 1.8) 1.9 (1.7 to 2.6) 2.6 (2.3 to 3.6)
CCIA 0.8 (0.6 to 1.2) 1.5 (1.2 to 2.0) 2.4 (1.9 to 3.1) 3.3 (2.6 to 4.1)
SUMMER
RCP4.5 SACR 0.6 (0.4 to 1) 1 (0.6 to 1.4) 1.3 (0.7 to 1.6) 1.3 (0.8 to 1.9)
CCIA 0.7 (0.4 to 1.3) 1.2 (0.9 to 1.8) 1.6 (0.9 to 2.2) 1.7 (1.0 to 2.4)
RCP8.5 SACR 0.7 (0.4 to 1.1) 1.2 (0.9 to 1.9) 1.8 (1.4 to 2.6) 2.5 (1.9 to 3.5)
CCIA 0.9 (0.6 to 1.3) 1.5 (1.1 to 2.2) 2.3 (1.8 to 3.4) 3.3 (2.4 to 4.4)
AUTUMN
RCP4.5 SACR 0.7 (0.6 to 0.7) 1 (0.8 to 1.1) 1.2 (1 to 1.5) 1.5 (1.1 to 1.8)
CCIA 0.7 (0.3 to 1.1) 1.1 (0.7 to 1.5) 1.4 (1.0 to 1.9) 1.5 (1.0 to 2.1)
RCP8.5 SACR 0.8 (0.7 to 1) 1.2 (1.1 to 1.8) 1.9 (1.6 to 2.6) 2.7 (2.2 to 3.6)
CCIA 0.7 (0.4 to 1.3) 1.4 (1.0 to 2.1) 2.4 (1.7 to 3.0) 3.1 (2.3 to 3.9)
WINTER
RCP4.5 SACR 0.7 (0.4 to 0.7) 0.9 (0.7 to 1.1) 1.1 (0.9 to 1.4) 1.3 (1.1 to 1.7)
CCIA 0.7 (0.4 to 1.0) 1.1 (0.8 to 1.4) 1.4 (1.0 to 1.8) 1.5 (1.1 to 2.1)
RCP8.5 SACR 0.7 (0.6 to 1) 1.3 (1 to 1.6) 1.8 (1.6 to 2.4) 2.5 (2.2 to 3.3)
CCIA 0.8 (0.6 to 1.2) 1.4 (1.1 to 1.9) 2.3 (1.8 to 3.0) 3.2 (2.6 to 4.1)
SPRING
RCP4.5 SACR 0.8 (0.8 to 1.0) 1.2 (1.1 to 1.4) 1.4 (1.2 to 1.7) 1.7 (1.4 to 2)
CCIA 0.9 (0.5 to 1.1) 1.3 (0.8 to 1.8) 1.7 (1.1 to 2.2) 1.9 (1.2 to 2.4)
RCP8.5 SACR 0.9 (0.8 to 1.2) 1.5 (1.4 to 2.1) 2.3 (2 to 2.9) 3 (2.6 to 3.9)
CCIA 0.9 (0.6 to 1.3) 1.7 (1.2 to 2.1) 2.8 (1.9 to 3.2) 3.9 (2.7 to 4.6)
24
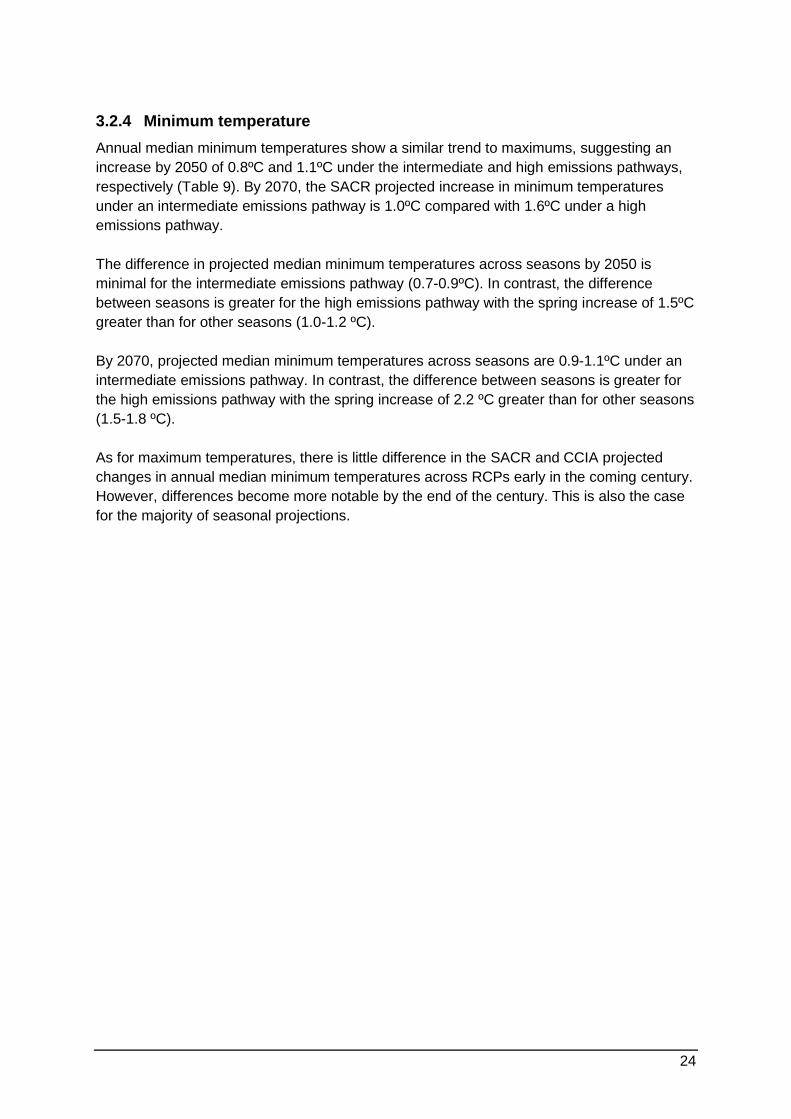
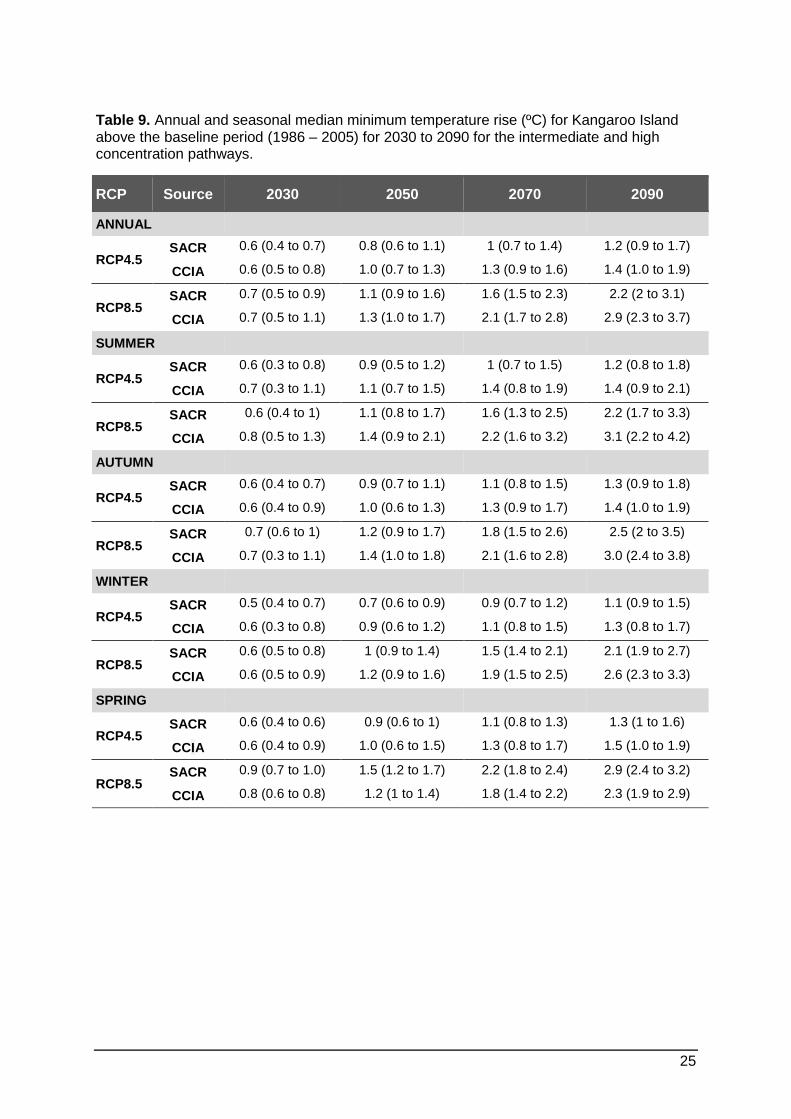
3.2.4 Minimum temperature
Annual median minimum temperatures show a similar trend to maximums, suggesting an
increase by 2050 of 0.8ºC and 1.1ºC under the intermediate and high emissions pathways,
respectively (Table 9). By 2070, the SACR projected increase in minimum temperatures
under an intermediate emissions pathway is 1.0ºC compared with 1.6ºC under a high
emissions pathway.
The difference in projected median minimum temperatures across seasons by 2050 is
minimal for the intermediate emissions pathway (0.7-0.9ºC). In contrast, the difference
between seasons is greater for the high emissions pathway with the spring increase of 1.5ºC
greater than for other seasons (1.0-1.2 ºC).
By 2070, projected median minimum temperatures across seasons are 0.9-1.1ºC under an
intermediate emissions pathway. In contrast, the difference between seasons is greater for
the high emissions pathway with the spring increase of 2.2 ºC greater than for other seasons
(1.5-1.8 ºC).
As for maximum temperatures, there is little difference in the SACR and CCIA projected
changes in annual median minimum temperatures across RCPs early in the coming century.
However, differences become more notable by the end of the century. This is also the case
for the majority of seasonal projections.
25
Table 9. Annual and seasonal median minimum temperature rise (ºC) for Kangaroo Island above the baseline period (1986 – 2005) for 2030 to 2090 for the intermediate and high concentration pathways.
RCP Source 2030 2050 2070 2090
ANNUAL
RCP4.5 SACR 0.6 (0.4 to 0.7) 0.8 (0.6 to 1.1) 1 (0.7 to 1.4) 1.2 (0.9 to 1.7)
CCIA 0.6 (0.5 to 0.8) 1.0 (0.7 to 1.3) 1.3 (0.9 to 1.6) 1.4 (1.0 to 1.9)
RCP8.5 SACR 0.7 (0.5 to 0.9) 1.1 (0.9 to 1.6) 1.6 (1.5 to 2.3) 2.2 (2 to 3.1)
CCIA 0.7 (0.5 to 1.1) 1.3 (1.0 to 1.7) 2.1 (1.7 to 2.8) 2.9 (2.3 to 3.7)
SUMMER
RCP4.5 SACR 0.6 (0.3 to 0.8) 0.9 (0.5 to 1.2) 1 (0.7 to 1.5) 1.2 (0.8 to 1.8)
CCIA 0.7 (0.3 to 1.1) 1.1 (0.7 to 1.5) 1.4 (0.8 to 1.9) 1.4 (0.9 to 2.1)
RCP8.5 SACR 0.6 (0.4 to 1) 1.1 (0.8 to 1.7) 1.6 (1.3 to 2.5) 2.2 (1.7 to 3.3)
CCIA 0.8 (0.5 to 1.3) 1.4 (0.9 to 2.1) 2.2 (1.6 to 3.2) 3.1 (2.2 to 4.2)
AUTUMN
RCP4.5 SACR 0.6 (0.4 to 0.7) 0.9 (0.7 to 1.1) 1.1 (0.8 to 1.5) 1.3 (0.9 to 1.8)
CCIA 0.6 (0.4 to 0.9) 1.0 (0.6 to 1.3) 1.3 (0.9 to 1.7) 1.4 (1.0 to 1.9)
RCP8.5 SACR 0.7 (0.6 to 1) 1.2 (0.9 to 1.7) 1.8 (1.5 to 2.6) 2.5 (2 to 3.5)
CCIA 0.7 (0.3 to 1.1) 1.4 (1.0 to 1.8) 2.1 (1.6 to 2.8) 3.0 (2.4 to 3.8)
WINTER
RCP4.5 SACR 0.5 (0.4 to 0.7) 0.7 (0.6 to 0.9) 0.9 (0.7 to 1.2) 1.1 (0.9 to 1.5)
CCIA 0.6 (0.3 to 0.8) 0.9 (0.6 to 1.2) 1.1 (0.8 to 1.5) 1.3 (0.8 to 1.7)
RCP8.5 SACR 0.6 (0.5 to 0.8) 1 (0.9 to 1.4) 1.5 (1.4 to 2.1) 2.1 (1.9 to 2.7)
CCIA 0.6 (0.5 to 0.9) 1.2 (0.9 to 1.6) 1.9 (1.5 to 2.5) 2.6 (2.3 to 3.3)
SPRING
RCP4.5 SACR 0.6 (0.4 to 0.6) 0.9 (0.6 to 1) 1.1 (0.8 to 1.3) 1.3 (1 to 1.6)
CCIA 0.6 (0.4 to 0.9) 1.0 (0.6 to 1.5) 1.3 (0.8 to 1.7) 1.5 (1.0 to 1.9)
RCP8.5 SACR 0.9 (0.7 to 1.0) 1.5 (1.2 to 1.7) 2.2 (1.8 to 2.4) 2.9 (2.4 to 3.2)
CCIA 0.8 (0.6 to 0.8) 1.2 (1 to 1.4) 1.8 (1.4 to 2.2) 2.3 (1.9 to 2.9)
26
3.2.5 Heat extremes and fire weather
Heat extremes and fire weather projections have not been specifically calculated for
Kangaroo Island by the CCIA project. Instead, projections used for the Adelaide Hills and
Fleurieu Peninsula region (Sections 3.1.5 and 3.1.6) are also applied to Kangaroo Island.
3.3 Projections for Ocean and Gulf waters
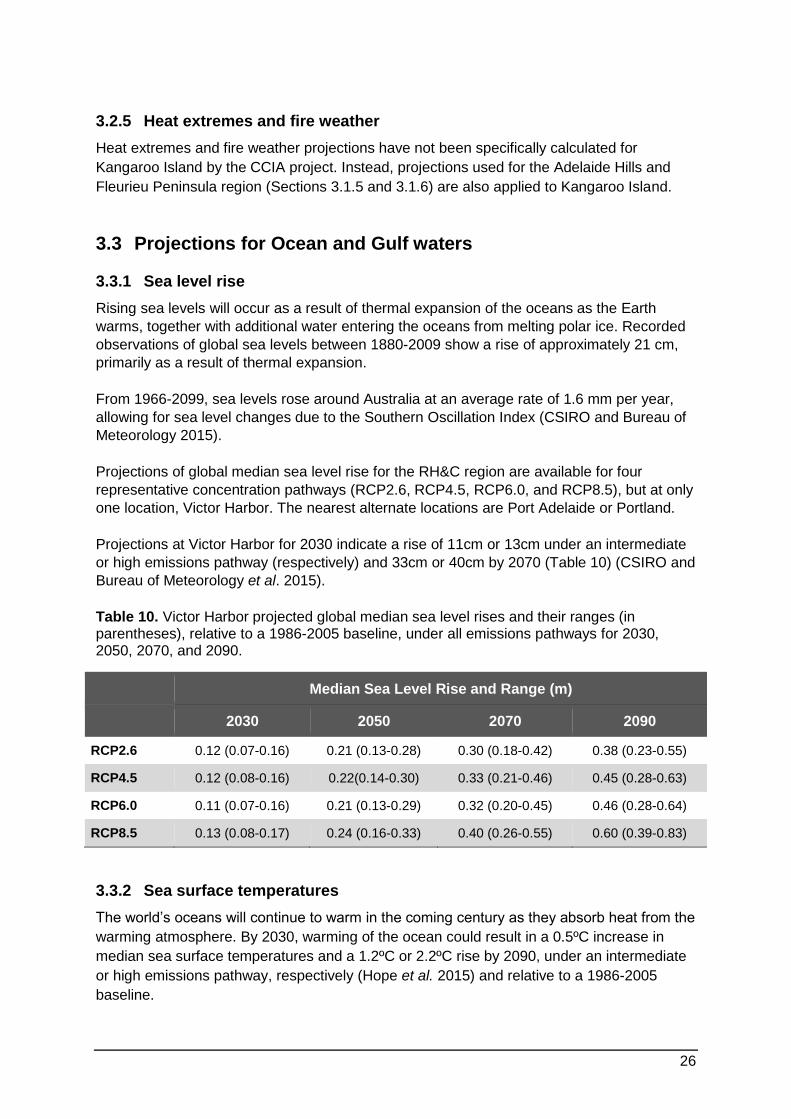
3.3.1 Sea level rise
Rising sea levels will occur as a result of thermal expansion of the oceans as the Earth
warms, together with additional water entering the oceans from melting polar ice. Recorded
observations of global sea levels between 1880-2009 show a rise of approximately 21 cm,
primarily as a result of thermal expansion.
From 1966-2099, sea levels rose around Australia at an average rate of 1.6 mm per year,
allowing for sea level changes due to the Southern Oscillation Index (CSIRO and Bureau of
Meteorology 2015).
Projections of global median sea level rise for the RH&C region are available for four
representative concentration pathways (RCP2.6, RCP4.5, RCP6.0, and RCP8.5), but at only
one location, Victor Harbor. The nearest alternate locations are Port Adelaide or Portland.
Projections at Victor Harbor for 2030 indicate a rise of 11cm or 13cm under an intermediate
or high emissions pathway (respectively) and 33cm or 40cm by 2070 (Table 10) (CSIRO and
Bureau of Meteorology et al. 2015).
Table 10. Victor Harbor projected global median sea level rises and their ranges (in parentheses), relative to a 1986-2005 baseline, under all emissions pathways for 2030, 2050, 2070, and 2090.
Median Sea Level Rise and Range (m)
2030 2050 2070 2090
RCP2.6 0.12 (0.07-0.16) 0.21 (0.13-0.28) 0.30 (0.18-0.42) 0.38 (0.23-0.55)
RCP4.5 0.12 (0.08-0.16) 0.22(0.14-0.30) 0.33 (0.21-0.46) 0.45 (0.28-0.63)
RCP6.0 0.11 (0.07-0.16) 0.21 (0.13-0.29) 0.32 (0.20-0.45) 0.46 (0.28-0.64)
RCP8.5 0.13 (0.08-0.17) 0.24 (0.16-0.33) 0.40 (0.26-0.55) 0.60 (0.39-0.83)
3.3.2 Sea surface temperatures
The world’s oceans will continue to warm in the coming century as they absorb heat from the
warming atmosphere. By 2030, warming of the ocean could result in a 0.5ºC increase in
median sea surface temperatures and a 1.2ºC or 2.2ºC rise by 2090, under an intermediate
or high emissions pathway, respectively (Hope et al. 2015) and relative to a 1986-2005
baseline.
27
3.3.3 Ocean acidity
The IPCC’s AR5 suggests that the Earth’s oceans will become more acidic (pH units
decrease from the usual slightly alkaline values of 7.5 to 8.0, towards more neutral levels at
pH 7.0) under all future scenarios assessed (relative to a 1986-2005 baseline). Specific
projections of changes in pH levels at Victor Harbor indicate a decline of 0.07 or 0.08 units
by 2030 under an intermediate or high emissions pathway (respectively), and 0.15 or 0.32 by
2090. This compares with a 0.1pH unit decrease that has already been experienced since
the beginning of the industrial era about 250 years ago (Hope et al. 2015).
3.4 Climate analogues
The Climate Analogues tool7 available on the CCIA website allows users to match the
projected future climate of a location to other locations currently experiencing similar climate
conditions. The matching is based on annual average rainfall and maximum temperature
data. This function allows users to better comprehend the implications of future climate
change in their location of interest by considering the current conditions in another location.
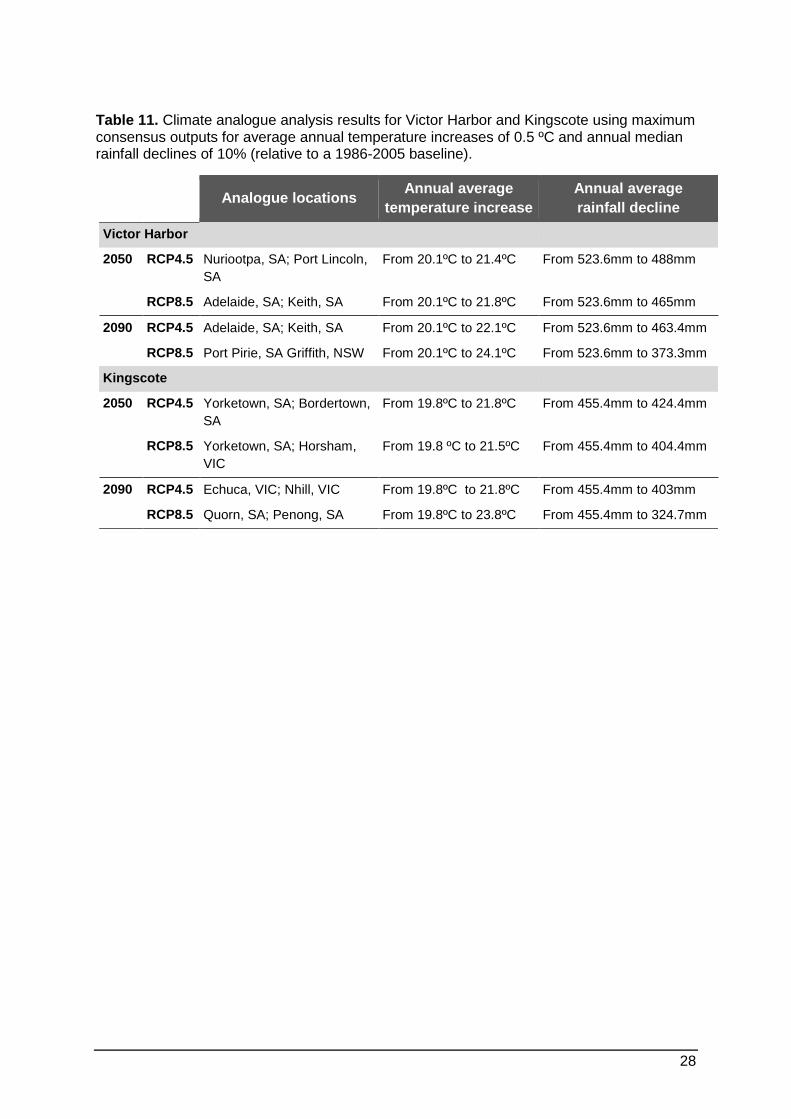
For example, the tool was applied to the RH&C region (Table 11) using the maximum
consensus8 model outputs for annual median temperature increases of up to 0.5 ºC and
annual median rainfall declines of up to 10%. This narrow range of temperature and rainfall
enables a more concise identification of analogue locations. Within the RH&C region,
analogues were only available for Victor Harbor and Kingscote for the timeframes of 2050
and 2090.
In 2050, Victor Harbor’s climate is predicted to be similar to the current climate of Nuriootpa
and Port Lincoln (under an intermediate emissions pathway), whereas Kingscote will be
more similar to Yorketown’s current conditions. By 2090, Victor Harbor’s climate will be
closer to Adelaide and Keith currently, and Kingscote will be more similar to current climate
conditions in Nhill in the Wimmera region of Victoria.
7 Some potentially important aspects of local climate are not considered with this approach, such as frost days, solar radiation, and soil types. As such, the analogues should not be used directly for adaptation planning. 8 Maximum consensus is based on the degree of agreement among global climate models.
28
Table 11. Climate analogue analysis results for Victor Harbor and Kingscote using maximum consensus outputs for average annual temperature increases of 0.5 ºC and annual median rainfall declines of 10% (relative to a 1986-2005 baseline).
Analogue locations Annual average
temperature increase
Annual average
rainfall decline
Victor Harbor
2050
RCP4.5 Nuriootpa, SA; Port Lincoln,
SA
From 20.1ºC to 21.4ºC From 523.6mm to 488mm
RCP8.5 Adelaide, SA; Keith, SA From 20.1ºC to 21.8ºC From 523.6mm to 465mm
2090
RCP4.5 Adelaide, SA; Keith, SA From 20.1ºC to 22.1ºC From 523.6mm to 463.4mm
RCP8.5 Port Pirie, SA Griffith, NSW From 20.1ºC to 24.1ºC From 523.6mm to 373.3mm
Kingscote
2050
RCP4.5 Yorketown, SA; Bordertown,
SA
From 19.8ºC to 21.8ºC From 455.4mm to 424.4mm
RCP8.5 Yorketown, SA; Horsham,
VIC
From 19.8 ºC to 21.5ºC From 455.4mm to 404.4mm
2090
RCP4.5 Echuca, VIC; Nhill, VIC From 19.8ºC to 21.8ºC From 455.4mm to 403mm
RCP8.5 Quorn, SA; Penong, SA From 19.8ºC to 23.8ºC From 455.4mm to 324.7mm
29
4 References Bureau of Meteorology (2015). Available from:
<http://www.bom.gov.au/climate/enso/history/ln-2010-12/ENSO-what.shtml>. [11 July 2015].
Charles, S.P. and Fu G. (2014). Statistically Downscaled Projections for South Australia –
Task 3 CSIRO Final Report, Goyder Institute for Water Research Technical Report Series,
Adelaide, South Australia.
CSIRO (2015). Available from:
<http://www.cmar.csiro.au/sealevel/sl_impacts_sea_level.html>. [1 September 2014].
CSIRO and Bureau of Meteorology (2015). Climate Change in Australia Information for
Australia’s Natural Resource Management Regions: Technical Report, CSIRO and Bureau
of Meteorology, Australia
Department of Environment and Heritage (2005). Adelaide’s Living Beaches: A Strategy for
2005-2025. Department of Environment and Heritage, South Australia.
Dowdy, A.J., Mills, G.A., Finkele, K. and de Groot, W. (2009). Australian fire weather as
represented by the McArthur Forest Fire Danger Index and the Canadian Forest Fire
Weather Index. Centre for Australian Weather and Climate Research, the Bushfire
Cooperative Research Centre and the Canadian Forest Service. CAWCR Technical Report
No. 10 June 2009.
Global Carbon Project (2014). Global Carbon Budget 2014. Available from:
<http://www.globalcarbonproject.org/carbonbudget/index.htm>. [3 February 2015].
Goyder Institute (2015) Development of an agreed set of climate change projections for
South Australia. Available from: <http://goyderinstitute.org/index.php?id=31>. [2 September
2015].
Hope, P., Abbs, D., Bhend, J., Chiew, F., Church, J., Ekstrom, M., Kirono, D., Lenton, A.,
Lucas, C., McInnes, K., Moise, A., Monselesan, D., Mpelasoka, F., Timbal, B., Webb, L. and
Whetton, P. (2015). Southern and South-Western Flatlands Cluster Report, Climate Change
in Australia Projections for Australia’s Natural Resource Management Regions: Cluster
Reports, eds. Ekstrom, M., Whetton, P., Gerbing, C., Grose, M., Webb, L. and Risbey, J. et
al., CSIRO and Bureau of Meteorology, Australia.
IIASA (2015). RCP Database. Available from:
<http://tntcat.iiasa.ac.at:8787/RcpDb/dsd?Action =htmlpage&page=welcome>. [11 July
2015].
IPCC (2000). IPCC Special Report Emissions Scenarios - Summary for Policymakers. A
Special Report of IPCC Working Group III.
IPCC (2013a). Annex III: Glossary [Planton, S. (ed.)]. In: Climate Change 2013: The
Physical Science Basis. Contribution of Working Group I to the Fifth Assessment Report of

30
the Intergovernmental Panel on Climate Change [Stocker, T.F., D. Qin, G.-K. Plattner, M.
Tignor, S.K. Allen, J. Boschung, A. Nauels, Y. Xia, V. Bex and P.M. Midgley (eds.)].
Cambridge University Press, Cambridge, United Kingdom and New York, NY, USA.
IPCC (2013b). Summary for Policymakers. In: Climate Change 2013: The Physical Science
Basis. Contribution of Working Group I to the Fifth Assessment Report of the
Intergovernmental Panel on Climate Change [Stocker, T.F., D. Qin, G.-K. Plattner, M.
Tignor, S. K. Allen, J. Boschung, A. Nauels, Y. Xia, V. Bex and P.M. Midgley (eds.)].
Cambridge University Press, Cambridge, United Kingdom and New York, NY, USA.
Local Government of South Australia (2015). Climate Adaptation Planning Guidelines. Department of Environment, Water and Natural Resources, South Australia. Resilient Hills and Coasts (2014). Knowledge audit for the Adelaide Hills, Fleurieu and Kangaroo Island RDA Climate Change Adaptation Plan, prepared by Seed Consulting Services and URPS as part of the Resilient Hills and Coasts consultancy led by Seed Consulting Services for Regional Development Australia Adelaide Hills, Fleurieu and Kangaroo Island. September 2014.
Stafford Smith, M., Horrocks, L., Harvey, A. and Hamilton, C. (2010). Rethinking adaptation
for a 4°C world. Philosophical Transactions of the Royal Society A. Volume 369 (1934): 196-
216.
Westra, S., Alexander, L. V., and Zwiers, F. W. (2012). Global increasing trends in annual
maximum daily precipitation. Journal of Climate Change, 26, 3904-3918.
31
5 Glossary Unless stated otherwise, all definitions are from IPCC (2013a).
Aerosol - A suspension of airborne solid or liquid particles, with a typical size between a few
nanometres and 10 μm that reside in the atmosphere for at least several hours. Aerosols
may influence climate in several ways: directly through scattering and absorbing radiation
and indirectly by acting as cloud condensation nuclei or ice nuclei, modifying the optical
properties and lifetime of clouds.
Atmosphere - The gaseous envelope surrounding the Earth.
Baseline/reference - The baseline (or reference) is the state against which change is
measured.
Climate - Usually defined as the average weather, or more rigorously, as the statistical
description in terms of the mean and variability of relevant quantities over a period of time
ranging from months to thousands or millions of years.
Climate change - Climate change refers to a change in the state of the climate that can be
identified (e.g., by using statistical tests) by changes in the mean and/or the variability of its
properties, and that persists for an extended period, typically decades or longer.
Climate change in Australia (CCIA) – a national-focused climate change project released
in February 2015 and led by the CSIRO and Bureau of Meteorology (CSIRO and Bureau of
Meteorology 2015).
Climate model (spectrum or hierarchy) - A numerical representation of the climate system
based on the physical, chemical and biological properties of its components, their
interactions and feedback processes, and accounting for some of its known properties.
Climate variability - Climate variability refers to variations in the mean state and other
statistics (such as standard deviations, the occurrence of extremes, etc.) of the climate on all
spatial and temporal scales beyond that of individual weather events.
Emission scenario - A plausible representation of the future development of emissions of
substances that are potentially radiatively active (e.g., greenhouse gases, aerosols) based
on a coherent and internally consistent set of assumptions about driving forces (such as
demographic and socioeconomic development, technological change) and their key
relationships.
Greenhouse gas - Greenhouse gases are those gaseous constituents of the atmosphere,
both natural and anthropogenic, that absorb and emit radiation at specific wavelengths within
the spectrum of terrestrial radiation emitted by the Earth’s surface, the atmosphere itself, and
by clouds.

32
Global climate model (GCM) – also called general circulation models are mathematical
representations of the climate system which explicitly represent large-scale synoptic features
of the atmosphere (CSIRO and Bureau of Meteorology 2015).
Integrated vulnerability assessment (IVA) – a process used to assess the likelihood (or
exposure) and consequence (or sensitivity) of climate change impacts on key issues, as well
as assessing the adaptive capacity of issues in order to ensure a full understanding of
vulnerabilities (Local Government Association of South Australia 2015).
McArthur Forest Fire Danger Index (FFDI) - The McArthur Forest Fire Danger Index
(FFDI) is widely used to forecast the influence of weather on fire behavior. FFDI is based on
the temperature (˚C), T, wind speed (km h-1), v, relative humidity (%), RH, and a component
representing fuel availability called the Drought Factor (Dowdy et al. 2009).
Projection - A projection is a potential future evolution of a quantity or set of quantities, often
computed with the aid of a model. Unlike predictions, projections are conditional on
assumptions concerning, for example, future socioeconomic and technological
developments that may or may not be realized
Radiative forcing - Radiative forcing is the change in the net, downward minus upward,
radiative flux (expressed in W m–2) at the tropopause or top of atmosphere due to a change
in an external driver of climate change.
Regional climate model (RCM) - A climate model at higher resolution over a limited area.
Such models are used in downscaling global climate results over specific regional domains
Representative concentration pathways (RCP) - Scenarios that include time series of
emissions and concentrations of the full suite of greenhouse gases and aerosols and
chemically active gases, as well as land use/land cover.
South Australia Climate Ready (SACR) – A Goyder Institute research project to develop
an agreed set of downscaled climate change projections for South Australia to support
proactive responses to climate change in water resource planning and management at a
State and regional scale (Goyder Institute 2015).