Embed Size (px)
Citation preview

D15/815 Page 1 of 28
City of Kwinana
Climate Change Mitigation and Adaptation Plan 2015-2020
Solar panels and solar water pre-heat system on the Zone and Recquatic centre

D15/815 Page 2 of 28
1. Introduction and Context
The Intergovernmental Panel on Climate Change released its latest report on climate change in November 2014. The report was a synthesis of 30,000 research papers, had 830 authors and took 5 years to complete. The report stated that; “Human influence on the climate system is clear, and recent anthropogenic emissions of greenhouse gases are the highest in history. Recent climate changes have had widespread impacts on human and natural systems.” “In most scenarios without additional mitigation efforts warming is more likely than not to exceed 4°C above pre-industrial levels by 2100. The risks associated with temperatures at or above 4°C include substantial species extinction, global and regional food insecurity, consequential constraints on common human activities, and limited potential for adaptation in some cases.” (IPCC, 2014) The need to act on climate change is now very clear and local governments have an important role to play in the global response to this problem. The City of Kwinana has a responsibility to reduce the amount of carbon emissions it generates as part of its operations. This includes electricity use in local facilities and streetlights, indirect emissions from waste, embedded emissions in goods purchased and fuel consumption in the City’s fleet vehicles. The City must also address climate change as it would any other risk and put in place measures to adapt and become more resilient to the impacts of extreme weather events, water scarcity and sea level rise. The City has recognised its responsibility to mitigate and adapt to climate change in Objective 3.4 and 3.5 of the Strategic Community Plan. Objective 3.4 - Promote the use of renewable energy within the City of Kwinana and reduce energy use where possible. Objective 3.5 Understand the impacts of climate change and take a risk management approach to addressing these effects in future planning. The City adopted a Climate Change Policy on 23rd January 2013. This policy is available to view on the City’s website. This strategy will therefore have dual objectives. Mitigation – to continue to reduce greenhouse gas emissions to minimise the severity of climate change; and Adaptation – to implement strategies to ensure the City is prepared and able to adapt to current and future impacts of climate change.
2. Climate change impacts in the City of Kwinana
When considering mitigation and adaptation actions it is important to first consider the potential risks posed by climate change in the region. This information was collated in 2009 by GHD and the Southern Metropolitan Regional Council for the Southern Metropolitan

D15/815 Page 3 of 28
Councils (including Kwinana) as part of the Local Adaptation Pathways program (GHD & SMRC 2009). The major risks and their relevance to the City’s operations are described below.
a. Temperature change The average annual global temperature has already risen by 0.8 degree Celsius over the past century and it is predicted to rise by 0.6 to 1 degree Celsius by 2030 (Climate Commission, 2011; GHD & SMRC, 2009). This increase in temperature has, and will, result in an increase in the number and severity of heat waves. This, in turn, has increased heat stress related deaths through heart attack, stroke and heat exhaustion. Heat wave deaths are less prominent than some of the other effects of climate change but are currently the most deadly of the natural disasters in Australia (Climate Council, 2014). The impact of temperature change has direct relevance to the City’s business operations with respect to the approval of new subdivisions, as heat islands can be significantly reduced by retaining vegetation; the operation of the City’s two residential aged care facilities; the continuity of the City’s business if power cuts on hot days increase; and heat stress and lost productivity amongst outdoor employees. The other major result of an increase in temperature is an increase in higher fire risk days and therefore severe bush fires. The City has responsibility for preventing and responding to bushfire. It also has considerable natural and constructed assets which could be affected by bushfire.
b. Reduced Rainfall The southwest corner of the State has become markedly drier, with a 15% reduction in rainfall since the mid-1970s. There is strong evidence in southwest Western Australia that climate change is making a significant contribution to the drying trend. (Climate Commission, 2011; GHD & SMRC, 2009). The drying climate impacts the City in a number of ways including water use in the City’s buildings, parks and gardens. The City will need to become more efficient in its use of water if parks and gardens are to be maintained to the current standards. The City has developed a Sustainable Water Management Plan (City of Kwinana, 2013) to specifically address these challenges. The combination of increasing temperatures and reduced rainfall is also likely to have a significant impact on the City’s biodiversity. Drought deaths of trees has already been observed in many reserves and parks. Changing climatic conditions may mean that the ecological communities that currently exist, which are already under pressure from land clearing, will be unable to adapt and survive.
c. Rising sea level Sea levels along the west coast of Australia have been rising between 7.1 and 7.4mm per year since the early 90’s, approximately double the global average. Global sea levels are predicted to rise a further 0.5 to 1 metre this century. A sea level rise of 50cm will lead to very large increases in the frequency of coastal flooding, flooding that is currently considered to be a 1 in 100 year event would occur every year (Climate Commission, 2011). The City of Kwinana manages a relatively small area of coastline but the financial impact of rising sea level to the City will be significant. Sea level rise has the potential to damage
D15/815 Page 4 of 28
millions of dollars worth of infrastructure at Kwinana Beach and Challenger Beach including sea walls, boat ramp, offshore breakwaters, roads, toilet blocks and car parking. The City is participating in the Cockburn Sound Coastal Vulnerability Study to more accurately assess where the greatest impacts of sea level rise are likely to be.
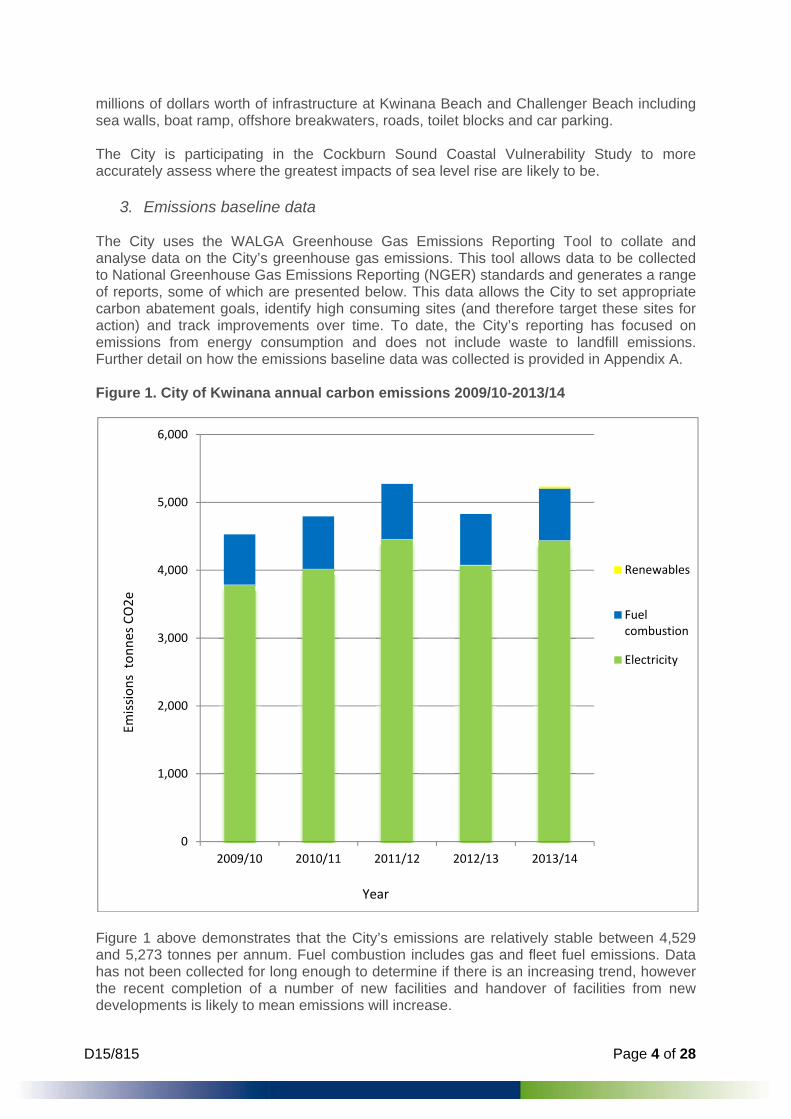
3. Emissions baseline data The City uses the WALGA Greenhouse Gas Emissions Reporting Tool to collate and analyse data on the City’s greenhouse gas emissions. This tool allows data to be collected to National Greenhouse Gas Emissions Reporting (NGER) standards and generates a range of reports, some of which are presented below. This data allows the City to set appropriate carbon abatement goals, identify high consuming sites (and therefore target these sites for action) and track improvements over time. To date, the City’s reporting has focused on emissions from energy consumption and does not include waste to landfill emissions. Further detail on how the emissions baseline data was collected is provided in Appendix A. Figure 1. City of Kwinana annual carbon emissions 2009/10-2013/14
Figure 1 above demonstrates that the City’s emissions are relatively stable between 4,529 and 5,273 tonnes per annum. Fuel combustion includes gas and fleet fuel emissions. Data has not been collected for long enough to determine if there is an increasing trend, however the recent completion of a number of new facilities and handover of facilities from new developments is likely to mean emissions will increase.
0
1,000
2,000
3,000
4,000
5,000
6,000
2009/10 2010/11 2011/12 2012/13 2013/14
Renewables
Fuel combustion
Electricity
Emis
sion
sto
nnes
CO
2e
Year

D15/815 Page 5 of 28
Even though greenhouse gas emissions have remained relatively stable, there has been a significant increase in energy cost, mainly due to tariff increases from utilities. The City’s energy cost (excluding transport fuel) has increased by 43% over 4 years from $1,001,697 in FY2010/11 to $1,771,457 in FY2013/14 (Figure 2). Figure 2. Energy cost 2010/11-2013/14
Reducing the City’s emissions will therefore not just reduce the City’s contribution to climate change, it also has the potential to save the City a significant amount of money. Increasing electricity prices and decreasing cost of energy efficient technologies now means many actions are very financially attractive.
$0
$200,000
$400,000
$600,000
$800,000
$1,000,000
$1,200,000
$1,400,000
$1,600,000
$1,800,000
$2,000,000
2010/11 2011/12 2012/13 2013/14
gas
electricity
Ener
gy c
ost $
Year

D15/815 Page 6 of 28
Figure 3. Extract from WALGA Greenhouse Gas Emissions Reporting Tool - Emissions breakdown by facility type
Figure 3 above demonstrates that community services facilities are the source of the most emissions at 41%, followed by street lighting and administration buildings. The majority of electricity consumption in the community services facility type is from the Recquatic Centre and the Darius Wells Library and Resource Centre. These are represented in the top 5 facilities in terms of carbon emissions in Figure 4 below. Figure 4. Extract from WALGA Greenhouse Gas Emissions Reporting Tool - Top 5 facilities by emissions
The City’s Street Vision Agreement is the second highest emitter. This is the City’s power consumption for streetlights. The City has limited ability to reduce the energy consumption of these lights as Western Power owns them. Changing the lighting type incurs significant cost and the City would need to assume responsibility for the maintenance of these lights in order to achieve this. The Western Australian Local Government Association (WALGA) has recently released a discussion paper and advocacy strategy to address some of the barriers to retrofitting streetlighting with energy efficient options (WALGA, 2014). The City has lodged a submission in response to this document and will support WALGA in its advocacy efforts in this area.

D15/815 Page 7 of 28
4. Climate change mitigation goals The City of Kwinana will reduce carbon dioxide equivalent emissions by 10% below 2009/10 levels by 2020. This is an ambitious but achievable goal and is crucial if the worst impacts of climate change are to be avoided. The IPCC estimates that we need to reduce global anthropogenic greenhouse gas emissions by 40% to 70% by 2050 compared to 2010 (IPCC, 2014). Street lighting emissions from Western Power owned streetlights have been removed from measuring achievement of the goal as the City’s ability to influence these emissions is minimal. The major initiatives contributing to achieving this goal will be;
Installation of solar panels on Council buildings; Retrofitting Council buildings with LED lighting; An expanded tree planting program in degraded Council reserves.
The calculations used to estimate achievement of the goal are explained further in Appendix B. Further details on actions are listed in Section 6 Implementation Plan below.
5. Climate change adaptation goals
Climate change impacts are wide ranging and our ability to adapt to the impacts is difficult to quantify. Setting an overall goal to adapt to climate change is therefore very difficult. The three major threats from climate change that the City should respond to are;
1. Temperature change (heat waves and bushfire risk) 2. Reduced water availability 3. Rising sea levels
Rising sea levels are being addressed through the City’s participation in the Cockburn Sound Coastal Vulnerability project. This project is currently assessing the magnitude of risk that sea level rise poses to the City’s assets and will provide potential responses. Reduced water availability is being addressed through the City’s Sustainable Water Management Plan. The City has already adopted the following water use reduction goals and progress towards these will be reported as part of this climate change adaptation plan.
To reduce scheme water consumption by 5% on 2011/12 levels by 2016/2017. To reduce groundwater consumption by 10% on 2011/12 levels by 2016/2017
Bushfire risk is addressed through the City’s Rangers, Security and Emergency Services section. The remaining impact which has not been substantially addressed by the City is heat waves. The major action a local government can take to reduce the impact of heat waves is to increase trees in urban areas. Trees can provide a cooling effect of up to 8 degrees in urban areas as well as providing many other benefits (Moore, 2009). The major proposed climate change adaptation action in this strategy therefore relates to an accelerated street tree planting program, particularly in areas which currently have a very low street tree canopy

D15/815 Page 8 of 28
coverage, such as Bertram. This strategy proposes that the City pursue the development of a street tree planting goal along the lines of;
The City of Kwinana will establish a street tree in front of every house. Where this is not possible the tree will instead be planted in another public area.
The feasibility of achieving this goal will depend on the results of a full street tree survey of the City which is proposed to be conducted as part of a Landscape Strategy currently being developed. This will determine how many street trees are required to meet this goal and therefore what the costs of the initiative will be. The timeframe, costs and strategy for doing this will be further explored through the Landscape Strategy.

D15/815 Page 9 of 28
6. Implementation Plan
Below is a list of proposed actions to mitigate against or adapt to climate change. The actions and priorities in this list may vary as circumstances and technologies change, and funding becomes available. No. Mitigation
(M) or Adaptation (A)
Action Responsibility
Timeframe Budget and source
Measure of success.
Projected tonnes CO2e abated and cost savings per annum
1 M Progressively install solar panels (or wind power if financially preferable) on council buildings including (but not limited to);
Darius Wells Library and Resource Centre (100kw)
Business Incubator (approx 15kw) John Wellard Community Centre
(approx 30kw) Bertram Community Centre (5kw) Fiona Harris Pavilion (5kw) Family Day Care (5kw) Medina Hall (5kw) Thomas Kelly Pavilion (26 kw) Feilman Centre (20kw) (when
renovated and tenanted) Koorliny Arts Centre (20kw) (when re-
wired) Administration Building (5kw) Depot (30kw) (when the use of the
Environment
2015/16-2019/20
$697,3321 Revolving Energy Fund and loans.
Renewable energy generated
295 tonnes of CO2 and $100,000 cost savings per year
1 This figure is based on supplier quotes for a system installed at the Recquatic. It is likely to reduce over time as the technology improves. The first system proposed is the 100kw system on the Darius Wells Library and Resource Centre. This will be funded by $131,000 in accumulated funds from the Revolving Energy Fund and $30,000 from the 2015/16 budget contribution. The remainder will be funded by loans from Treasury.

D15/815 Page 10 of 28
No. Mitigation (M) or Adaptation (A)
Action Responsibility
Timeframe Budget and source
Measure of success.
Projected tonnes CO2e abated and cost savings per annum
building is known)
2 M&A Investigate green building options when planning new Council buildings.
Environment/ Building
2016/17 The costs of the measures to be taken will be quantified on a case by case basis.
New buildings achieve a reduced energy consumption compared to standard construction.
To be quantified when buildings designed
3 M&A Develop and adopt a Landscape Strategy which addresses the development and maintenance of an “urban forest”. This includes;
Surveying and valuing urban trees. Targeted projects to improve canopy
cover in certain areas with low canopy cover at the moment.
Replacing dead trees after removal Education of the public about the value
of tree assets. Using new plantings as carbon offsets.
Engineering/Environment
2015/16 Street trees are likely to cost approx $400 per tree (includes a 45L tree, planting and two
Number of new trees planted in the urban forest.
140kg of CO2 per tree. Street trees have been found to have a financial benefit of $260 per tree per year. See Section 7 Financial implications of the Climate Change Mitigation and Adaptation Plan below for further information.
D15/815 Page 11 of 28
No. Mitigation (M) or Adaptation (A)
Action Responsibility
Timeframe Budget and source
Measure of success.
Projected tonnes CO2e abated and cost savings per annum
years of watering)2
4 M Form a green office team as a working group to consider a range of office environmental initiatives including;
Composting of Council office building kitchen scraps.
Reducing the use of disposables. Rationalising under desk bins.
All staff 2015/16 Dependent on initiatives proposed by the group.
Tonnes of waste recycled.
Reduction in disposables used.
To be quantified.
5 M Investigate the use of recycled materials in road base.
Engineering/Environment
2016/17 To be determined if feasible.
Tonnes of waste recycled.
Changes to be quantified when exact site and volume of recycled material is known.
6 M Investigate working with sporting clubs to reduce their electricity use in the City’s sporting facilities.
Healthy Lifestyles/ Environment
2015/16 To be determined if feasible.
Reduction in electricity use
To be quantified
7 M Develop a triple bottom line planning policy which includes measures to reduce the carbon
Environment/Pla
2016/17 $0 Reduction in carbon
To be quantified.
2 Street tree costs were estimated by Engineering Services

D15/815 Page 12 of 28
No. Mitigation (M) or Adaptation (A)
Action Responsibility
Timeframe Budget and source
Measure of success.
Projected tonnes CO2e abated and cost savings per annum
emissions of new developments by supporting retention of vegetation, active transport and passive solar design.
nning/ Healthy Lifestyles
emissions of new developments.
8 M Investigate a public transport subsidy as an incentive for staff to take public transport to work.
Environment
2016/17 Cost will depend on the subsidy. Assuming a $100 per officer subsidy over 30 staff members = $3,000 per year. Council Budget
Reduction in staff commuter transport kms
To be quantified.
9 M&A Conduct a green wall demonstration project. Environment
2016/17 Approx $6,000 for 4 square metres3
Reduction in electricity use and improved
To be quantified.
3 Based on City of Subiaco’s experience in installing green walls.

D15/815 Page 13 of 28
No. Mitigation (M) or Adaptation (A)
Action Responsibility
Timeframe Budget and source
Measure of success.
Projected tonnes CO2e abated and cost savings per annum
External funding or Council Budget
comfort of staff.
10 M Conduct an energy audit at the Recquatic centre to determine any power savings from the pool plant refit, real time monitoring and air curtain as well as identify any further savings that can be made. Conduct energy audits at other high consuming sites and implement recommendations where cost effective.
Environment
2015/16 $3,000 X 5 audits = $15,0004 Revolving Energy Fund
N/A N/A
11 M Install LED lighting in 3 major facilities. For example, the Administration Building, Feilman Centre and the Koorliny Arts Centre. This can only be done at the Feilman Centre once it has been renovated and tenanted and the Koorliny Arts Centre once it is rewired.
Environment
2016/17 $226,8005
Revolving Energy Fund and loans
Reduction in electricity use.
90 tonnes of CO2 abatement – Approx $45,000 per year.
12 M Conduct a survey of timer use for air conditioning in buildings and install timers or adjust settings where necessary.
Building/Environment
2014/15 Officer time
Reduction in electricity use
To be quantified.
4 Based on cost to complete a previous energy audit at the Recquatic. 5 Based on an indicative quote provided by the City’s electrician for the Administration building, which is conservative. The cost of LED lighting is falling rapidly.

D15/815 Page 14 of 28
No. Mitigation (M) or Adaptation (A)
Action Responsibility
Timeframe Budget and source
Measure of success.
Projected tonnes CO2e abated and cost savings per annum
13 M Commence collecting key scope 3 data for the City’s carbon inventory.
Environment
2015/16 Officer time
N/A N/A
14 M&A Expand the City’s tree planting program in reserves to act as offsets for our emissions.
Environment
2015/16 $58,0006 per year external funding
Number of trees planted.
Current plantings (1,500 trees) offset approx 214 tonnes per year. Further plantings will need to offset 831 tonnes of CO2.
15 M Investigate the business cases for:
taking over maintenance of Western Power street lights in order to install efficient lighting types,
switching to CFL street lights under Western Power’s current rules,
Taking over LED street lighting in new developments.
Environment
2016/17 Costs will be established as part of the business case. Initiatives may be funded by the Revolving Energy Fund if
N/A N/A
6 This is based on a cost of $10 per tree and includes tree bag, labour and watering in degraded bushland reserves. Carbon emissions reductions are based on 6 trees per tonne of carbon dioxide.
D15/815 Page 15 of 28
No. Mitigation (M) or Adaptation (A)
Action Responsibility
Timeframe Budget and source
Measure of success.
Projected tonnes CO2e abated and cost savings per annum
cost competitive.
16 M&A Amend the Town Planning Scheme to allow zoning concessions for sustainable design.
Environment/Planning
2015/16 Officer time
Number of developments with sustainable design features.
To be quantified
17 M&A Investigate supporting the establishment of a sustainable building or development demonstration site within the City.
Environment/Planning/Building
2016/17 To be determined
N/A To be quantified
18 M&A Investigate trialing an off grid or hybrid power system at a Council facility (new building).
Environment/Building
2017/18 $22,000 (indicative cost for a 10kw hybrid solar system with 5kw of battery storage). A fully off-
Reduction in electricity use.
To be quantified
D15/815 Page 16 of 28
No. Mitigation (M) or Adaptation (A)
Action Responsibility
Timeframe Budget and source
Measure of success.
Projected tonnes CO2e abated and cost savings per annum
grid system would cost approx $40-$50,000. 7
Revolving Energy Fund
19 M Examine the City’s Business Continuity Plan to see if climate change impacts have been adequately considered.
Environment/Building
2017/18 Officer time
Reduced impacts on the City’s business continuity.
N/A
20 M&A Establish an Environmental Reference Group comprised of members of the public, to guide the environmental activities of the City.
Environment
2015/16 Officer time
A core group of interested members actively participating in the group.
N/A
7 Battery system costs are falling in price rapidly due to improvements in the technology.

D15/815 Page 17 of 28
No. Mitigation (M) or Adaptation (A)
Action Responsibility
Timeframe Budget and source
Measure of success.
Projected tonnes CO2e abated and cost savings per annum
21 M Progressively install power data loggers on Council buildings to quickly identify spikes in energy usage.
Environment
2015/16-2019/20
$1,000 per logger
Reduction in electricity use.
Savings depend on the spikes and how long they would have gone unnoticed .
22 M&A Deliver seminars and events with an environmental theme as part of the Darius Wells term program.
Environment/Darius Wells Library and Resource Centre
2014/15-2019/2020
$1,2008
Council budget
Participation rates, Feedback from participants.
Feedback from participants on changes they have made and the reductions in carbon emissions as a result of this.
23 M&A Deliver an annual 7 week “Living Smart” sustainable living course
Environment/Darius Wells Library and Resource Centre
2014/15-2019/2020
$7,0009
Council budget
Participation rates, Feedback from participants.
Feedback from participants on changes they have made and the reductions in carbon emissions as a result of this.
24 M Install real time electricity monitoring and an air curtain at the Recquatic Centre.
Environment
2014/15 $37,000 Revolving Energy
Reduction in electricity
21 tonnes of CO2 Savings - Approx
8 Based on $300 for speaker costs and catering for each seminar 9 Based on speaker costs for the Living Smart Course run in 2014/15

D15/815 Page 18 of 28
No. Mitigation (M) or Adaptation (A)
Action Responsibility
Timeframe Budget and source
Measure of success.
Projected tonnes CO2e abated and cost savings per annum
Fund and funding from the Community Energy Efficiency Program
use. $7,000 per year
25 A Continue implementation of the City’s Sustainable Water Management Plan.
Various 2014-2017 See Sustainable Water Management Plan
Reduction in water demand.
N/A
26 M Purchase fleet bikes for staff use. Healthy Lifestyles/ Environment
2014/15 $50010
Revolving Energy Fund and Healthy Lifestyles
Reduction in fuel use
Number of rides replacing car trips, to be tracked and fuel savings quantified.
27 A Continue to participate in the Cockburn Sound Coastal Vulnerability Project.
Environment
2014/15-2019/20
Approx $25,000 per annum (contributi
Protection of coastal assets
N/A
10 Quote from supplier. Costs shared with the City’s Healthy Lifestyles section.
D15/815 Page 19 of 28
No. Mitigation (M) or Adaptation (A)
Action Responsibility
Timeframe Budget and source
Measure of success.
Projected tonnes CO2e abated and cost savings per annum
on is dependent on the activities undertaken in that year) Council Budget
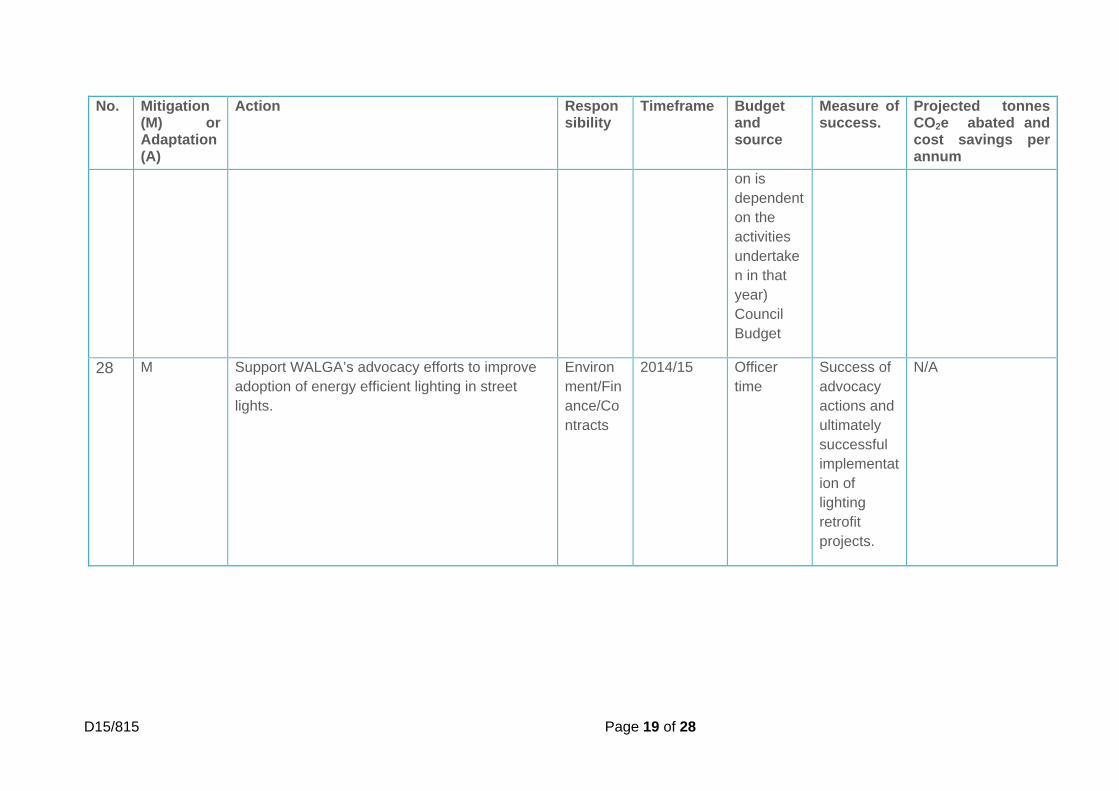
28 M Support WALGA’s advocacy efforts to improve adoption of energy efficient lighting in street lights.
Environment/Finance/Contracts
2014/15 Officer time
Success of advocacy actions and ultimately successful implementation of lighting retrofit projects.
N/A

D15/815 Page 20 of 28
7. Financial implications of the Climate Change Mitigation and Adaptation Plan
The implementation cost of achieving these goals (excluding the water consumption goals as these are addressed in the Sustainable Water Management Plan) has been estimated at $1.5 million over 5 years or an average $300,000 per year. However renewable energy and energy efficiency projects save the City electricity costs. The projects are anticipated to easily pay for themselves and in fact, return to the City $1.7 million (Net Present Value) in today’s dollars over their lifetime. A more detailed explanation of the calculations behind these figures is provided in Appendix B. The renewable energy and energy efficiency measures proposed in this strategy actually generate money per tonne of CO2 saved. The impressive financial returns on these technologies allow the City to access low interest loans to fund the implementation costs. In addition, $35,000 is currently budgeted per annum for energy efficiency and renewable energy technology, which is augmented by funds from the Revolving Energy Fund (REF), a fund that captures power cost savings resulting from energy efficiency projects and directs them back to further projects. These funds can be used as a deposit towards these low interest loans. This means that, provided the City is agreeable to access loans for this project, the costs associated with implementing these initiatives is minimal. An accelerated tree planting program in the City’s reserves is another way of offsetting a large amount of carbon emissions. The City is unable to access a loan for this so funding would be required at approximately $58,000 per annum. An additional street tree planting program as part of the Landscape Strategy would act as an offset and as an adaptation measure if the trees are used in areas that have minimal tree canopy, as they provide a cooling effect for residents (by up to 8 degrees Celcius) and reduce wind speeds in storms (by approximately 10%) (Moore, 2009). Urban trees provide a wide range of additional benefits which make them valuable assets including;
Reduced electricity costs for air conditioning (between 12-15% per annum). (Moore, 2009)
Reduced road maintenance costs. Shaded roads have been found to increase the useful life of asphalt by 30%. (Moore, 2009)
In some of the City’s eastern residential suburbs (eg Bertram) planting trees will assist with lowering the ground water table which is particularly high in this area.
Trees clean the air of pollution, provide habitat for wildlife and reduce flooding as they trap and use rainwater. (Moore, 2009)
Shaded streets encourage people to walk rather than drive, improving physical fitness and reducing carbon emissions further. (Moore, 2009)
Vandalism and crime have been found to be reduced in areas with a lot of trees. (Moore, 2009)
Trees have been found to reduce stress and blood pressure. (Moore, 2009) Planting more trees also reflects the community’s affection for the natural feel of
Kwinana. Some studies have looked at estimating a dollar value for the benefits provided by trees. Killicoat, P, Puzio, E, and Stringer, R (2002) in The Economic Value of Trees in Urban Areas: Estimating the Benefits of Adelaide’s Street Trees found that the above benefits equated to approximately $200 (or approx $260 in today’s dollars) per tree per annum and that it was a gross under-estimate of the real value (Killicoat et al, 2002). The study found that the cost of maintaining an Adelaide street tree was about $26 per annum.

D15/815 Page 21 of 28
Studies quantifying the benefits of trees have found that the benefits far outweigh the costs but careful attention does need to be paid to tree species selection to avoid problems like pavement lifting, limbs dropping and sap, nuts or leaves causing problems. Waterwise and local native species should also be chosen to avoid excessive water use and to maximize the habitat value of the tree. An education campaign will also need to be conducted to demonstrate the benefits of trees to residents. The aim of this campaign will be to encourage the community to look after their street tree and reduce requests for removal.
8. Monitoring and Review The City’s Climate Change Mitigation and Adaptation Plan is intended to be reviewed annually and adapted to ensure it remains current and relevant. The review process will be coordinated by the Environment Department with input from relevant staff. Ongoing reviews will ensure the plan keeps pace with changes in policy and new technology. This process will also help to review priority areas, monitor progress towards achievement of goals, and assess the effectiveness of implemented actions. It will also assist in the preparation of annual reports, budgets and the City’s Corporate Business Plan.

D15/815 Page 22 of 28
Appendix A Background information on baseline emissions data collection. The City of Kwinana’s CO2 emissions inventory is completed every year and meets the requirements of the National Greenhouse Gas Emissions Reporting Standards (NGER).The inventory is broken down in to six main sectors:
Administration: Emissions resulting from energy use (mainly electricity) of Council administration buildings.
Buildings: Emissions resulting from energy use (mainly electricity) of Council operated buildings.
Community Services: Emissions resulting from energy use (mainly electricity) of Community Services buildings.
Parks and Gardens: Emissions resulting from energy use (mainly electricity) for parks and gardens operation (mostly bore pumps).
Street Lighting11: Emissions resulting from the electricity use of streetlights. Vehicle Fleet: Emissions resulting from the energy use (unleaded petrol, LPG, &
diesel) of Council operated vehicles and machinery. All energy use is equated into a common measure of CO2-e. This is the measure of equivalent carbon dioxide produced from each energy source. For example, methane is 21 times more potent than carbon dioxide in terms of global warming potential. Therefore, 1 unit of methane is calculated to be the equivalent of 21 units of CO2. Greenhouse gas inventories can be divided into 3 operational boundaries, essentially based on how closely related the activity is to the operations of the City. These boundaries are standard definitions used by the National Greenhouse Gas Emissions Reporting (NGER) standards. These are;
Scope 1 – (Direct) Fuel combustion ie company owned vehicles Scope 2 – (Indirect) Purchased electricity for own use Scope3 – (Indirect) Production, use and disposal of purchased materials – eg
procurement, waste disposal, travel, outsourced activities, etc Currently the City only collects Scope 1 and 2 data. Should the City ever wish to complete Carbon Neutral certification, Scope 3 emission sources are required to be calculated. Carbon Neutral certification essentially certifies that the City has zero net emissions, which is achieved through significant energy consumption cuts and offsetting the remaining emissions. As a first step towards completing a Scope 3 inventory the City will begin collecting this data. The most readily available Scope 3 data includes:
Paper consumption Waste generated by council operations (not community waste)
Data is available for paper consumption. In 2013/14 the City used the equivalent of 1,326,800 sheets or 6.6 tonnes of A4 paper. This is equivalent to approximately 8 and a half tonnes of CO2 emissions.(EPA Victoria 2013). The majority of paper purchased by the City is certified carbon neutral so when this is deducted the City’s emissions from paper use is only 0.5 tonnes.
11 “Electricity used for street lighting is a large source of emissions and highly visible to the community. Councils have little control over street lighting performance, however it’s an environmental issue that local government has traditionally owned, largely because they pay the bills for the operation and maintenance of the street lighting assets and the electricity consumed.” Source: www.planetfootprint.com.au

D15/815 Page 23 of 28
Waste data from Council’s operations is currently not easily collected. Procedures will be put in place to collect this data in 2016. A lack of data in these areas does not prevent the City from acting to reduce the impact of its activities. Therefore the actions listed in the strategy include measures to reduce the City’s waste and reduce the impact of procurement decisions.
D15/815 Page 24 of 28
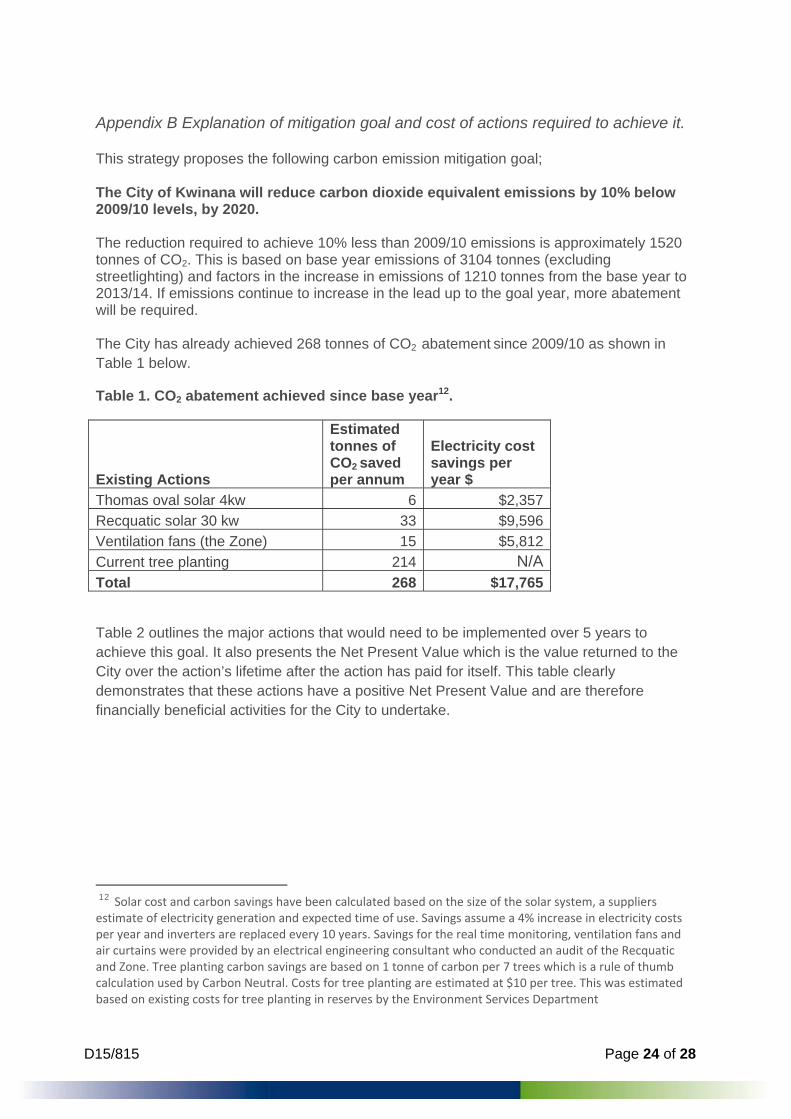
Appendix B Explanation of mitigation goal and cost of actions required to achieve it. This strategy proposes the following carbon emission mitigation goal; The City of Kwinana will reduce carbon dioxide equivalent emissions by 10% below 2009/10 levels, by 2020. The reduction required to achieve 10% less than 2009/10 emissions is approximately 1520 tonnes of CO2. This is based on base year emissions of 3104 tonnes (excluding streetlighting) and factors in the increase in emissions of 1210 tonnes from the base year to 2013/14. If emissions continue to increase in the lead up to the goal year, more abatement will be required. The City has already achieved 268 tonnes of CO2 abatement since 2009/10 as shown in Table 1 below.
Table 1. CO2 abatement achieved since base year12.
Existing Actions
Estimated tonnes of CO2 saved per annum
Electricity cost savings per year $
Thomas oval solar 4kw 6 $2,357
Recquatic solar 30 kw 33 $9,596
Ventilation fans (the Zone) 15 $5,812
Current tree planting 214 N/ATotal 268 $17,765
Table 2 outlines the major actions that would need to be implemented over 5 years to achieve this goal. It also presents the Net Present Value which is the value returned to the City over the action’s lifetime after the action has paid for itself. This table clearly demonstrates that these actions have a positive Net Present Value and are therefore financially beneficial activities for the City to undertake.
12 Solar cost and carbon savings have been calculated based on the size of the solar system, a suppliers estimate of electricity generation and expected time of use. Savings assume a 4% increase in electricity costs per year and inverters are replaced every 10 years. Savings for the real time monitoring, ventilation fans and air curtains were provided by an electrical engineering consultant who conducted an audit of the Recquatic and Zone. Tree planting carbon savings are based on 1 tonne of carbon per 7 trees which is a rule of thumb calculation used by Carbon Neutral. Costs for tree planting are estimated at $10 per tree. This was estimated based on existing costs for tree planting in reserves by the Environment Services Department

D15/815 Page 25 of 28
Table 2 Costs and returns of actions proposed to be implemented over the term of this strategy15
New Actions
Implementation Cost (over 5 years)
Net Present Value $
Estimated tonnes of CO2 saved per annum
Electricity savings per year $
260 kw of Solar power $697,332 $1,459,409 295 $100,075
3 X LED building retrofits $226,800 $237,199 90 $47,642Real time monitoring (Recquatic) $30,800 $55,923 25 $8,525
Air curtain (Recquatic) $6,200 $3,014 6 $1,209
Data Loggers (5 buildings) $5,000 $16,423 6 $2,308
Additional Tree planting $290,850 831 Other actions costed but proposed savings not able to be quantified at this stage. Staff public transport subsidy $15,000
Energy audits $12,000Green Wall demonstration project $6,000Off grid solar demonstration project $22,000Public Seminars, Workshops and Courses $41,000Contribution to Cockburn Sound Coastal Vulnerability project $125,000
Total $1,477,481 $1,771,968 1,252 $159,759Approximate implementation cost per year (from Revolving Energy Fund, Loans, Funding and Council Budget) $295,596
D15/815 Page 26 of 28
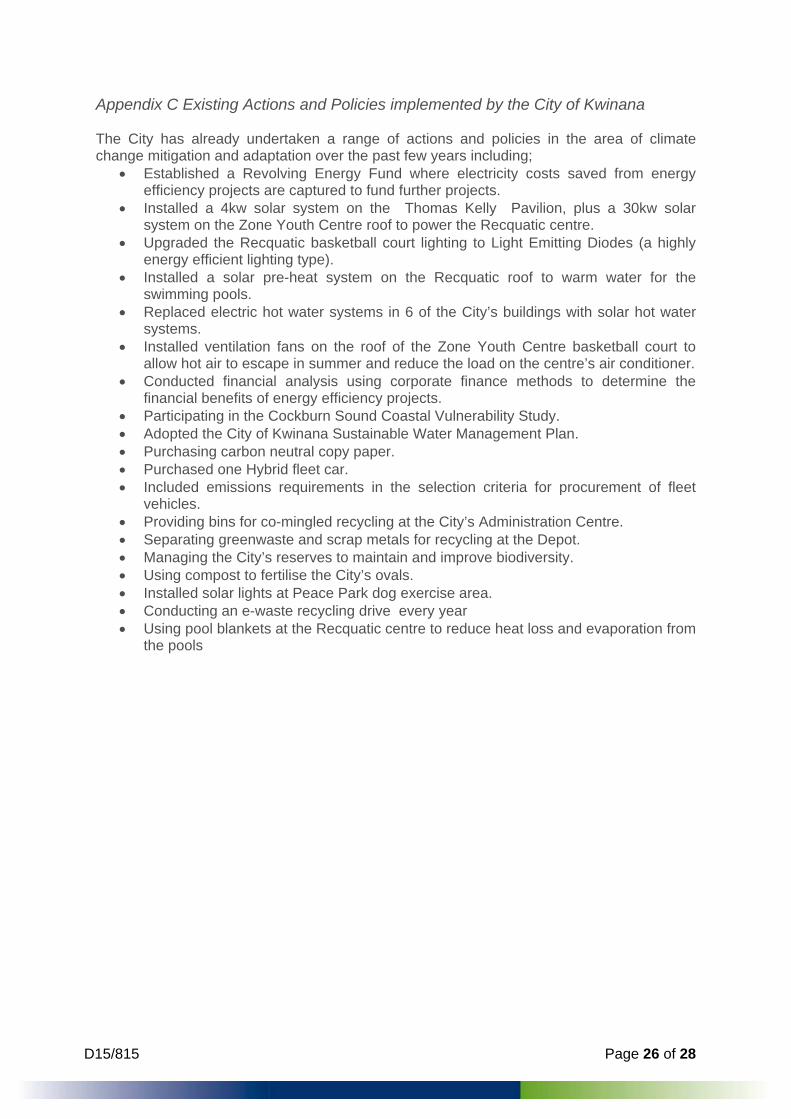
Appendix C Existing Actions and Policies implemented by the City of Kwinana The City has already undertaken a range of actions and policies in the area of climate change mitigation and adaptation over the past few years including;
Established a Revolving Energy Fund where electricity costs saved from energy efficiency projects are captured to fund further projects.
Installed a 4kw solar system on the Thomas Kelly Pavilion, plus a 30kw solar system on the Zone Youth Centre roof to power the Recquatic centre.
Upgraded the Recquatic basketball court lighting to Light Emitting Diodes (a highly energy efficient lighting type).
Installed a solar pre-heat system on the Recquatic roof to warm water for the swimming pools.
Replaced electric hot water systems in 6 of the City’s buildings with solar hot water systems.
Installed ventilation fans on the roof of the Zone Youth Centre basketball court to allow hot air to escape in summer and reduce the load on the centre’s air conditioner.
Conducted financial analysis using corporate finance methods to determine the financial benefits of energy efficiency projects.
Participating in the Cockburn Sound Coastal Vulnerability Study. Adopted the City of Kwinana Sustainable Water Management Plan. Purchasing carbon neutral copy paper. Purchased one Hybrid fleet car. Included emissions requirements in the selection criteria for procurement of fleet
vehicles. Providing bins for co-mingled recycling at the City’s Administration Centre. Separating greenwaste and scrap metals for recycling at the Depot. Managing the City’s reserves to maintain and improve biodiversity. Using compost to fertilise the City’s ovals. Installed solar lights at Peace Park dog exercise area. Conducting an e-waste recycling drive every year Using pool blankets at the Recquatic centre to reduce heat loss and evaporation from
the pools
D15/815 Page 27 of 28
References Climate Commission (2013) The Critical Decade 2013: Climate Change Science, Risks and Responses http://www.climatecouncil.org.au/uploads/b7e53b20a7d6573e1ab269d36bb9b07c.pdf Climate Commission (2011) The Critical Decade: Western Australian Climate Change Impacts. https://www.climatecouncil.org.au/uploads/e0d4e50478b96d1a50c821b7b2c022a4.pdf CSIRO (2012) State of the Climate http://www.csiro.au/Outcomes/Climate/Understanding/State-of-the-Climate-2012.aspx\ City of Joondalup (2014) Draft Climate Change Strategy 2014-2019 http://www.joondalup.wa.gov.au/Govern/CommunityConsultation/DraftClimateChangeStrategy.aspx GHD & Southern Metropolitan Regional Council (2009) Climate Change Risk Assessment and Adaptation Action Plan for the Southern Metropolitan Councils http://www.coastaladaptationresources.org/PDF-files/1387-FINAL-env_Climate-Change-Risk-Management-and-Adaptation-Action-Plan-Report_ps061009.pdf
Australian Government (2013) National Carbon Offset Standard Carbon Neutral Program Guidelines Version 3.0 http://www.climatechange.gov.au/sites/climatechange/files/documents/06_2013/NCOS-Guidelines-5-June-2013.pdf
Climate Council (2014) Heatwaves: Hotter, Longer, More Often http://www.climatecouncil.org.au/uploads/9901f6614a2cac7b2b888f55b4dff9cc.pdf City of Kwinana (2013) Sustainable Water Management Plan http://www.kwinana.wa.gov.au/Documents/Publications/D13-54830--Sustainable-Water-Management-Plan-FINAL Department of Environment (2013) National Carbon Offset Standard Carbon Neutral Guidelines http://www.environment.gov.au/climate-change/publications/carbon-neutral-program-guidelines#annex1
Dr Moore, Gregory (2009) People, Trees, Landscapes and Climate Change, Climate Change: On for Young and Old, Future Leaders. EPA Victoria (2013) Greenhouse Gas Emission Factors for Office Copy Paper http://www.epa.vic.gov.au/~/media/Publications/1374%201.pdf
IPCC (2014) Fifth Assessment Synthesis Report Approved Summary for Policymakers http://www.ipcc.ch/pdf/assessment-report/ar5/syr/SYR_AR5_SPM.pdf
Center for Urban Forest Research, Why Shade Streets? The Unexpected Benefit http://www.fs.fed.us/psw/programs/uesd/uep/products/cufr_673_WhyShadeStreets_10-06.pdf

D15/815 Page 28 of 28
Killicoat, P, Puzio, E, and Stringer, R (2002) The Economic Value of Trees in Urban Areas: Estimating the Benefits of Adelaide’s Street Trees. Proceedings Treenet Symposium, 94-106, University of Adelaide.
WALGA (2014) Energy Efficient Street Lighting Discussion Paper (draft for comment) http://www.walgaclimatechange.com.au/announcements/street-light-discussion-paper-released-for-comment