Embed Size (px)
Citation preview
Climate Change Leadership in Higher Education Institutions
By
Chinling Chen
Megan Denardo
John Ullman
Angela Vasconcellos
Dr. Jim Salzman, Advisor
May 2011
Master‘s project submitted in partial fulfillment of the requirements for the Master of
Environmental Management degree in the Nicholas School of the Environment of
Duke University
~ 2 ~
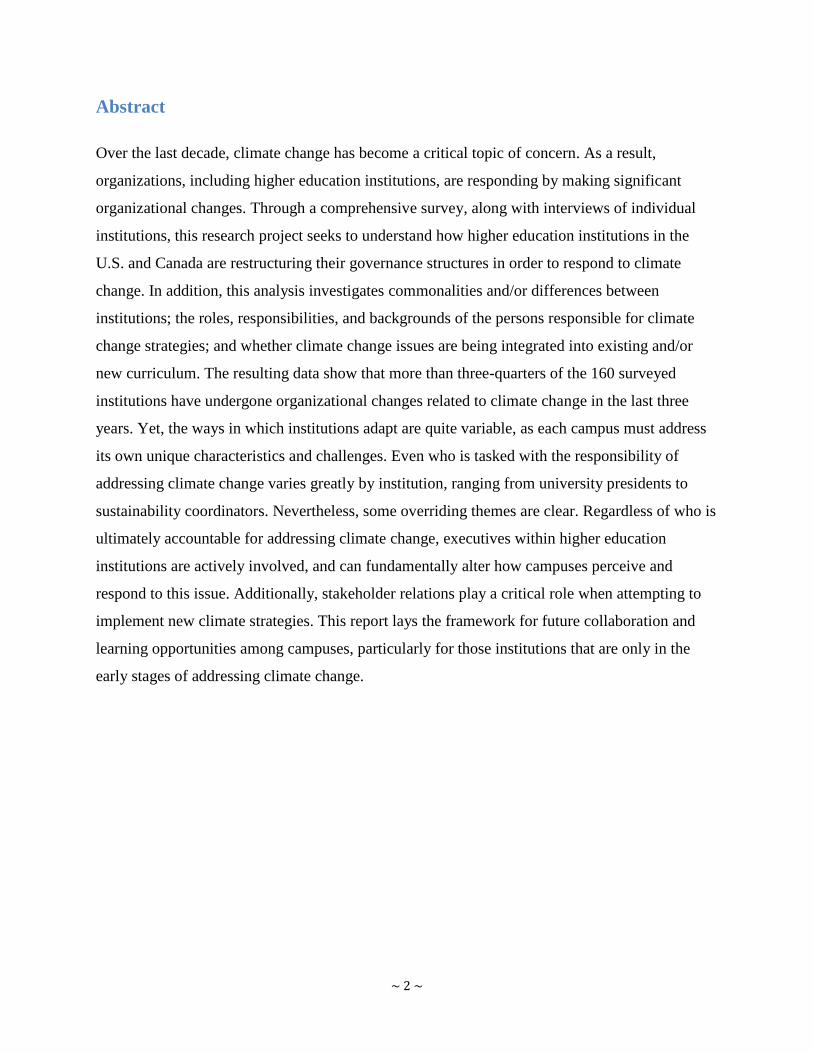
Abstract
Over the last decade, climate change has become a critical topic of concern. As a result,
organizations, including higher education institutions, are responding by making significant
organizational changes. Through a comprehensive survey, along with interviews of individual
institutions, this research project seeks to understand how higher education institutions in the
U.S. and Canada are restructuring their governance structures in order to respond to climate
change. In addition, this analysis investigates commonalities and/or differences between
institutions; the roles, responsibilities, and backgrounds of the persons responsible for climate
change strategies; and whether climate change issues are being integrated into existing and/or
new curriculum. The resulting data show that more than three-quarters of the 160 surveyed
institutions have undergone organizational changes related to climate change in the last three
years. Yet, the ways in which institutions adapt are quite variable, as each campus must address
its own unique characteristics and challenges. Even who is tasked with the responsibility of
addressing climate change varies greatly by institution, ranging from university presidents to
sustainability coordinators. Nevertheless, some overriding themes are clear. Regardless of who is
ultimately accountable for addressing climate change, executives within higher education
institutions are actively involved, and can fundamentally alter how campuses perceive and
respond to this issue. Additionally, stakeholder relations play a critical role when attempting to
implement new climate strategies. This report lays the framework for future collaboration and
learning opportunities among campuses, particularly for those institutions that are only in the
early stages of addressing climate change.
~ 3 ~
Acknowledgements:
This project was developed and conducted in close partnership with the Association of Climate
Change Officers (ACCO). The project team would like to thank Executive Director Daniel Kreeger
and the ACCO Board Members for their contributions and guidance. The project team would also
like to thank our Master‘s Project advisors, Dr. Jim Salzman and Charlotte Clark of Duke University;
Tavey Capps of Sustainable Duke; and the Duke Statistics Department.
About ACCO:
The Association of Climate Change Officers (ACCO) was founded in August 2008 and incorporated
in Washington, DC in January 2009 as a 501(c)(6) non-profit corporation. ACCO‘s mission is to
advance the knowledge and skills of those dedicated to developing and directing climate change
strategies in the public and private sectors, and to establish a flexible and robust forum for
collaboration between climate change officers
ACCO Board of Directors
Melissa Adams – Division Head of Sustainability and Business Development, WGL
Holdings
Fiji George – Director, Climate Change Strategies, El Paso Corporation
Peter Gillon – Partner, Pillsbury Winthrop Shaw Pittman LLP
Peter Gray – Partner, McKenna Long & Aldridge LLP
Mitch Jackson – Vice President of Environmental Affairs & Sustainability, FedEx
Kerry Kelly – Director, Federal Public Affairs, Waste Management
Daniel Kreeger – Executive Director, Association of Climate Change Officers
Fred Light – Director, Graduate Program in Environmental Sustainability and Professor of
Law, St. Thomas University School of Law
Michael Mondshine – Vice President of Climate Change Services, SAIC
Margery Moore – Director, Strategic EHS Alliances, BNA
Neal Oddes – Senior Director of Strategy, J.D. Power and Associates
Valerie Patrick – Sustainability Coordinator, Bayer Corporation
Katie Pavlovsky – Principal, Deloitte Financial Advisory Services
Jim Sullivan – Vice President, Sustainability, SAP
Peter Trick – Senior Vice President, Booz Allen Hamilton
~ 4 ~
Table of Contents
Glossary and List of Abbreviations ................................................................................................ 6
Executive Summary ........................................................................................................................ 8
Chapter 1: Introduction ................................................................................................................. 10
1.1 Research Questions ............................................................................................................. 10
1.2 Previous Research and Studies ........................................................................................... 10
Chapter 2: Methodology ............................................................................................................... 12
2.1 Survey Design and Distribution .......................................................................................... 12
2.2 Categorizing Institutions ..................................................................................................... 14
2.3 Respondent Interviews ........................................................................................................ 17
2.4 Note About Data Sampling and Analysis ........................................................................... 18
Chapter 3: Results ......................................................................................................................... 19
3.1 Trends in Higher Education Institutions: ............................................................................ 19
3.1.1 Who is Accountable? ................................................................................................................. 19 3.1.2 Organizational Changes ........................................................................................................... 23 3.1.3 Climate Action Plans ................................................................................................................. 28 3.1.4 Organizational Structures ......................................................................................................... 33 3.1.5 Length of Position ..................................................................................................................... 40 3.1.6 Professional Experience ............................................................................................................ 42 3.1.7 Job Responsibilities ................................................................................................................... 44 3.1.8 Training ..................................................................................................................................... 48 3.1.9 Integrating Climate into Curriculum ........................................................................................ 50 3.1.10 Challenges ............................................................................................................................... 53 3.1.11 Budgetary Authority ................................................................................................................ 60
3.3 Customized Climate Strategies ........................................................................................... 62
3.4 Influence of Executive Leadership ..................................................................................... 65
3.5 Impacts of Stakeholder Relations ....................................................................................... 68
Chapter 4: Conclusions and Next Steps ........................................................................................ 71
Appendices .................................................................................................................................... 72
Appendix A: Interview Summaries .......................................................................................... 72
Berea College ..................................................................................................................................... 73 Duke University .................................................................................................................................. 76 The Evergreen State College .............................................................................................................. 80 Middlebury College ............................................................................................................................ 83 Stanford University ............................................................................................................................ 86 Tulane University ............................................................................................................................... 89 University of Northern British Columbia ........................................................................................... 91 University of Washington – Seattle Campus ...................................................................................... 94
~ 5 ~
Appendix B: List of Responding Institutions ........................................................................... 97
Appendix C: Additional Demographic Comparisons in Higher Education............................ 101
Appendix D: Full Questionnaire ............................................................................................. 111
Works Cited ................................................................................................................................ 132
~ 6 ~
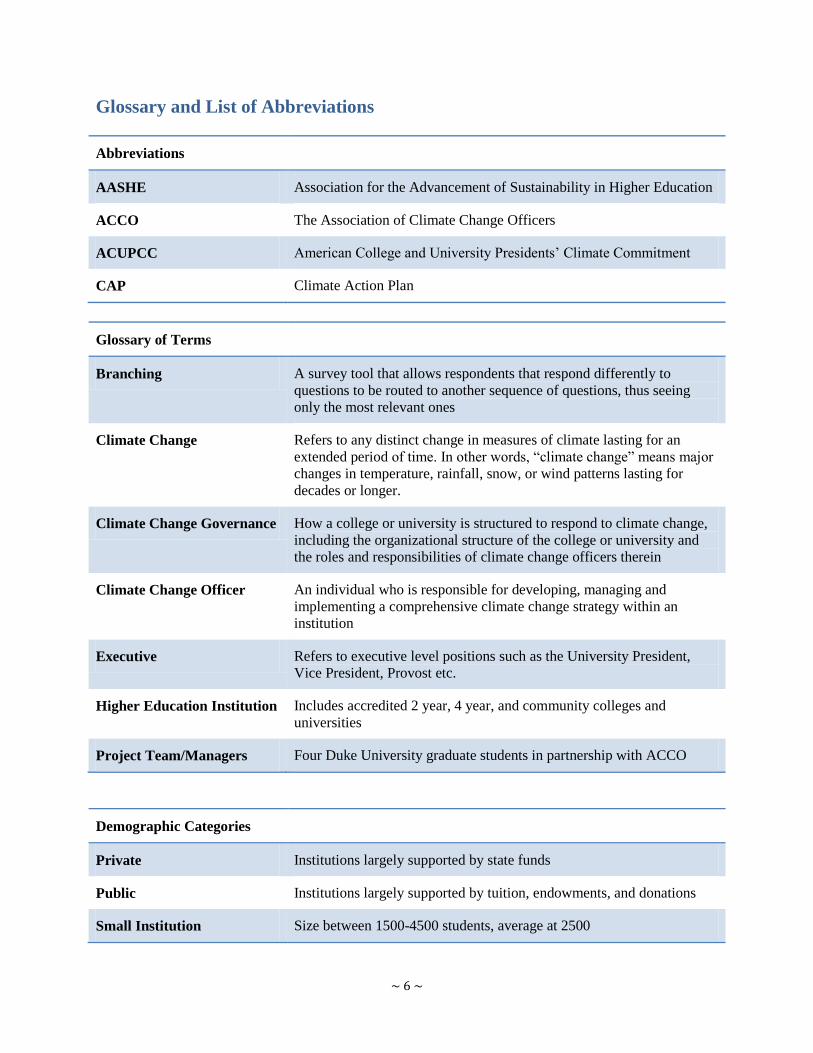
Glossary and List of Abbreviations
Abbreviations
AASHE Association for the Advancement of Sustainability in Higher Education
ACCO The Association of Climate Change Officers
ACUPCC American College and University Presidents‘ Climate Commitment
CAP Climate Action Plan
Glossary of Terms
Branching A survey tool that allows respondents that respond differently to
questions to be routed to another sequence of questions, thus seeing
only the most relevant ones
Climate Change Refers to any distinct change in measures of climate lasting for an
extended period of time. In other words, ―climate change‖ means major
changes in temperature, rainfall, snow, or wind patterns lasting for
decades or longer.
Climate Change Governance How a college or university is structured to respond to climate change,
including the organizational structure of the college or university and
the roles and responsibilities of climate change officers therein
Climate Change Officer An individual who is responsible for developing, managing and
implementing a comprehensive climate change strategy within an
institution
Executive Refers to executive level positions such as the University President,
Vice President, Provost etc.
Higher Education Institution Includes accredited 2 year, 4 year, and community colleges and
universities
Project Team/Managers Four Duke University graduate students in partnership with ACCO
Demographic Categories
Private Institutions largely supported by state funds
Public Institutions largely supported by tuition, endowments, and donations
Small Institution Size between 1500-4500 students, average at 2500
~ 7 ~
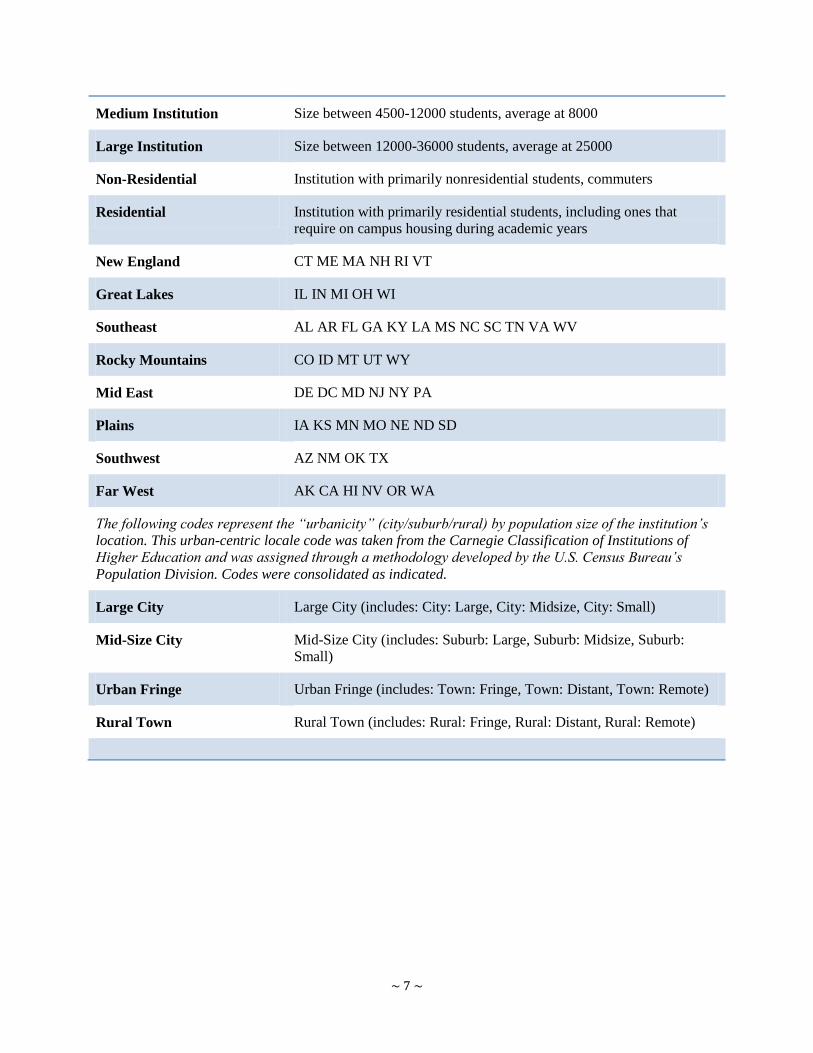
Medium Institution Size between 4500-12000 students, average at 8000
Large Institution Size between 12000-36000 students, average at 25000
Non-Residential Institution with primarily nonresidential students, commuters
Residential Institution with primarily residential students, including ones that
require on campus housing during academic years
New England CT ME MA NH RI VT
Great Lakes IL IN MI OH WI
Southeast AL AR FL GA KY LA MS NC SC TN VA WV
Rocky Mountains CO ID MT UT WY
Mid East DE DC MD NJ NY PA
Plains IA KS MN MO NE ND SD
Southwest AZ NM OK TX
Far West AK CA HI NV OR WA
The following codes represent the ―urbanicity‖ (city/suburb/rural) by population size of the institution’s
location. This urban-centric locale code was taken from the Carnegie Classification of Institutions of
Higher Education and was assigned through a methodology developed by the U.S. Census Bureau’s
Population Division. Codes were consolidated as indicated.
Large City Large City (includes: City: Large, City: Midsize, City: Small)
Mid-Size City Mid-Size City (includes: Suburb: Large, Suburb: Midsize, Suburb:
Small)
Urban Fringe Urban Fringe (includes: Town: Fringe, Town: Distant, Town: Remote)
Rural Town Rural Town (includes: Rural: Fringe, Rural: Distant, Rural: Remote)
~ 8 ~
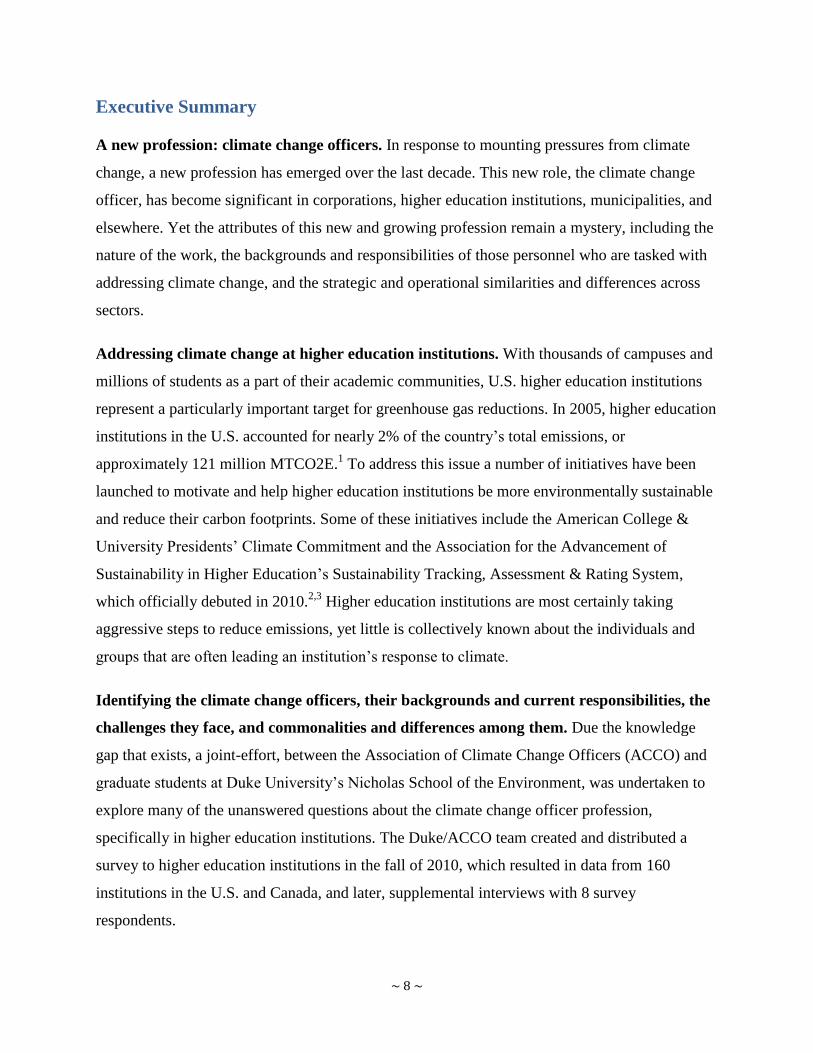
Executive Summary
A new profession: climate change officers. In response to mounting pressures from climate
change, a new profession has emerged over the last decade. This new role, the climate change
officer, has become significant in corporations, higher education institutions, municipalities, and
elsewhere. Yet the attributes of this new and growing profession remain a mystery, including the
nature of the work, the backgrounds and responsibilities of those personnel who are tasked with
addressing climate change, and the strategic and operational similarities and differences across
sectors.
Addressing climate change at higher education institutions. With thousands of campuses and
millions of students as a part of their academic communities, U.S. higher education institutions
represent a particularly important target for greenhouse gas reductions. In 2005, higher education
institutions in the U.S. accounted for nearly 2% of the country‘s total emissions, or
approximately 121 million MTCO2E.1 To address this issue a number of initiatives have been
launched to motivate and help higher education institutions be more environmentally sustainable
and reduce their carbon footprints. Some of these initiatives include the American College &
University Presidents‘ Climate Commitment and the Association for the Advancement of
Sustainability in Higher Education‘s Sustainability Tracking, Assessment & Rating System,
which officially debuted in 2010.2,3
Higher education institutions are most certainly taking
aggressive steps to reduce emissions, yet little is collectively known about the individuals and
groups that are often leading an institution‘s response to climate.
Identifying the climate change officers, their backgrounds and current responsibilities, the
challenges they face, and commonalities and differences among them. Due the knowledge
gap that exists, a joint-effort, between the Association of Climate Change Officers (ACCO) and
graduate students at Duke University‘s Nicholas School of the Environment, was undertaken to
explore many of the unanswered questions about the climate change officer profession,
specifically in higher education institutions. The Duke/ACCO team created and distributed a
survey to higher education institutions in the fall of 2010, which resulted in data from 160
institutions in the U.S. and Canada, and later, supplemental interviews with 8 survey
respondents.
~ 9 ~
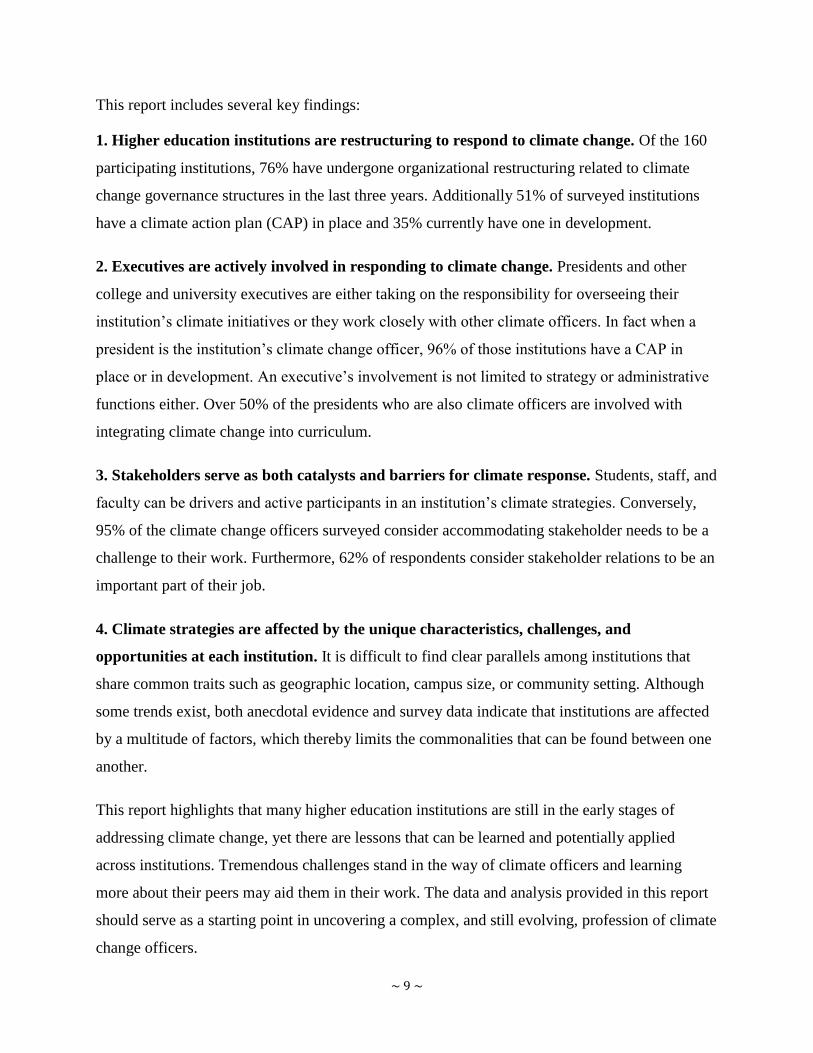
This report includes several key findings:
1. Higher education institutions are restructuring to respond to climate change. Of the 160
participating institutions, 76% have undergone organizational restructuring related to climate
change governance structures in the last three years. Additionally 51% of surveyed institutions
have a climate action plan (CAP) in place and 35% currently have one in development.
2. Executives are actively involved in responding to climate change. Presidents and other
college and university executives are either taking on the responsibility for overseeing their
institution‘s climate initiatives or they work closely with other climate officers. In fact when a
president is the institution‘s climate change officer, 96% of those institutions have a CAP in
place or in development. An executive‘s involvement is not limited to strategy or administrative
functions either. Over 50% of the presidents who are also climate officers are involved with
integrating climate change into curriculum.
3. Stakeholders serve as both catalysts and barriers for climate response. Students, staff, and
faculty can be drivers and active participants in an institution‘s climate strategies. Conversely,
95% of the climate change officers surveyed consider accommodating stakeholder needs to be a
challenge to their work. Furthermore, 62% of respondents consider stakeholder relations to be an
important part of their job.
4. Climate strategies are affected by the unique characteristics, challenges, and
opportunities at each institution. It is difficult to find clear parallels among institutions that
share common traits such as geographic location, campus size, or community setting. Although
some trends exist, both anecdotal evidence and survey data indicate that institutions are affected
by a multitude of factors, which thereby limits the commonalities that can be found between one
another.
This report highlights that many higher education institutions are still in the early stages of
addressing climate change, yet there are lessons that can be learned and potentially applied
across institutions. Tremendous challenges stand in the way of climate officers and learning
more about their peers may aid them in their work. The data and analysis provided in this report
should serve as a starting point in uncovering a complex, and still evolving, profession of climate
change officers.
~ 10 ~
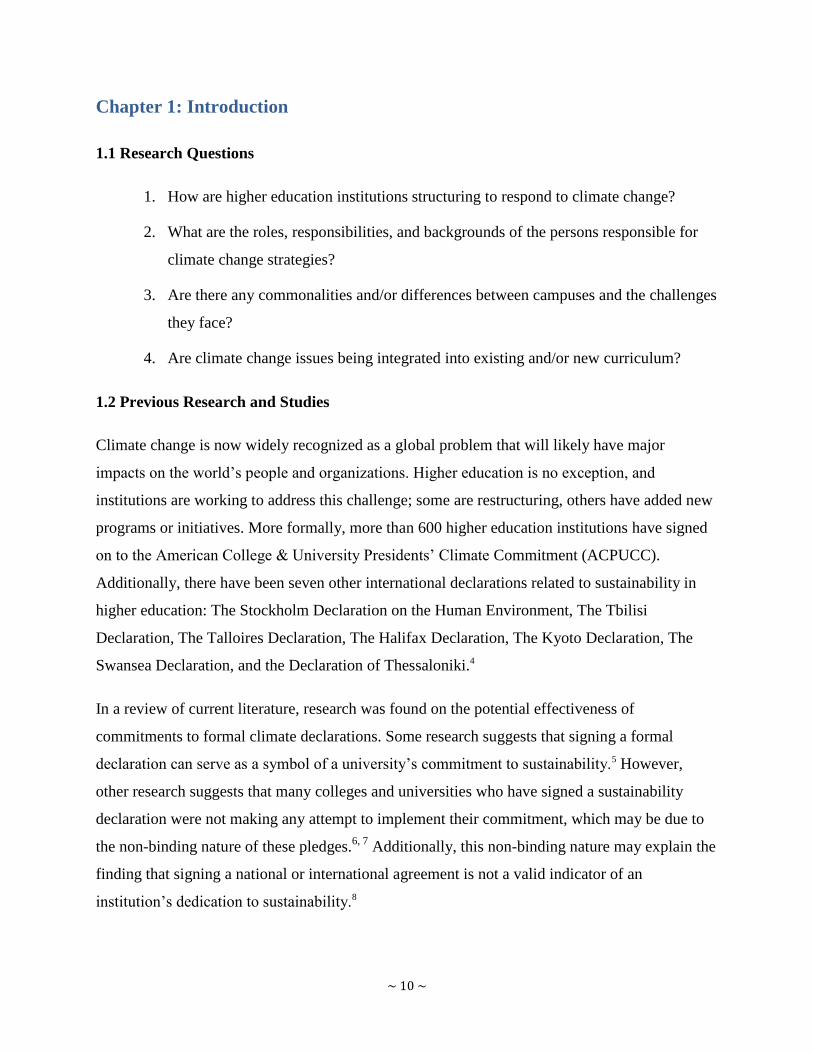
Chapter 1: Introduction
1.1 Research Questions
1. How are higher education institutions structuring to respond to climate change?
2. What are the roles, responsibilities, and backgrounds of the persons responsible for
climate change strategies?
3. Are there any commonalities and/or differences between campuses and the challenges
they face?
4. Are climate change issues being integrated into existing and/or new curriculum?
1.2 Previous Research and Studies
Climate change is now widely recognized as a global problem that will likely have major
impacts on the world‘s people and organizations. Higher education is no exception, and
institutions are working to address this challenge; some are restructuring, others have added new
programs or initiatives. More formally, more than 600 higher education institutions have signed
on to the American College & University Presidents‘ Climate Commitment (ACPUCC).
Additionally, there have been seven other international declarations related to sustainability in
higher education: The Stockholm Declaration on the Human Environment, The Tbilisi
Declaration, The Talloires Declaration, The Halifax Declaration, The Kyoto Declaration, The
Swansea Declaration, and the Declaration of Thessaloniki.4
In a review of current literature, research was found on the potential effectiveness of
commitments to formal climate declarations. Some research suggests that signing a formal
declaration can serve as a symbol of a university‘s commitment to sustainability.5 However,
other research suggests that many colleges and universities who have signed a sustainability
declaration were not making any attempt to implement their commitment, which may be due to
the non-binding nature of these pledges.6, 7
Additionally, this non-binding nature may explain the
finding that signing a national or international agreement is not a valid indicator of an
institution‘s dedication to sustainability.8
~ 11 ~
Currently, there is limited information regarding higher education institutions and their
organizational strategies to address climate change.9 Several studies have highlighted the current
knowledge gap that exists regarding effective strategy implementation, and understanding of
challenges and opportunities.10 The most often cited issue in the literature is the lack of
information surrounding challenges faced by colleges and universities when attempting to
implement sustainability or climate change policies.11
Taking a closer look at this issue, eighteen main barriers to climate change policy
implementation were identified. The three biggest challenges were lack of awareness, interest,
and/or involvement of the university community, the organizational structure of the institution,
and lack of funding and training, in that order.12
These findings are also supported by other studies which found that even though many
universities are signing declarations, strong administrative leadership is necessary to make those
signatures meaningful, and also concluded that sustainability strategies built from the bottom up
are not as effective as those built from the top down, due to the organizational structure of
colleges and universities13. Lastly, another study found that the most significant barriers to
effective implementation of sustainability policy were lack of support from a senior
administrative body, lack of centralized reporting, and lack of resources, both in terms of people
and money.14
Given that climate change is a rather new topic of concern, and that higher education institutions
are inherently unique organizations with unique structures and challenges, there is a lack of
understanding of general trends or best practices among universities working on these issues.
The identification of lessons learned and trends among universities could potentially lead to
identification of best practices or guidelines. Additionally, there is a lack of information
regarding the people who have recently been hired to specialize in climate change within these
institutions, as well as their training and roles. By conducting a comprehensive online survey,
along with interviews of individual institutions, this research project seeks to fill in this
knowledge gap with the hopes of advancing this developing field and profession.
~ 12 ~
Chapter 2: Methodology
2.1 Survey Design and Distribution
Beginning in fall, 2010, a web-based survey was created in partnership with ACCO, and
feedback on it was solicited from experts in climate change and sustainability at Duke
University15
. The Duke Statistics Department was also consulted regarding constructing
questions that would produce meaningful data. The survey was conducted from October 2010
through December 2010, and was distributed via email and direct mailings to approximately 950
four-year universities and two-year colleges in the United States and Canada. Prior to
distribution, an email was sent out to gauge interest and identify the appropriate contact at each
institution, from which 200 responses from interested participants were received.
By mid-December, 160 responses were received, including 153 four-year universities in the
U.S., two U.S. community colleges, and five Canadian universities. Three institutions entered the
survey multiple times. After sending emails to verify with the point of contact which response
was the correct one, multiple entries were removed and each institution was left with one final
response.
Besides questions regarding institution identification, point of contact, and basic governance
structure, all the other questions in this survey were not mandatory. Institutions had the option to
skip any question at any time, and skipping did not prevent them from proceeding to the next
question. For this reason, each question may have a different total number of responses.
~ 13 ~
To characterize the basic governance structure of each institution, the following question was
asked at the beginning of the survey:
Who directly oversees your institution's response to climate change and is accountable for
addressing the economic, operational and environmental implications of climate change,
potentially including directing strategies and/or overseeing budgetary considerations?
a. The President or chief executive;
b. A single individual;
c. A committee, panel or task force;
d. Multiple people;
e. Other type of organizational structure;
f. No person or persons accountable
Based on the response to this question, the questions presented to each participant varied in order
to customize the survey and receive relevant responses. Once responses were received, the data
were compiled and analyzed using Excel, STATA statistical tools, and NVivo, a qualitative data
analysis tool.
~ 14 ~
2.2 Categorizing Institutions
To further understand the demographics of our respondents, and more accurately categorize
institutions, the Carnegie Classification of Institutions of Higher Education downloaded from the
Carnegie Foundation website was used to assign demographic data.16
The Carnegie Foundation
for the Advancement of Teaching is an independent policy and research center that produces this
database.
The most recent classification database was published in 2005. These classifications provide
different lenses through which to view U.S. colleges and universities, offering researchers
greater analytic flexibility; collectively, they depict the most current landscape of U.S. colleges
and universities. The institutions that responded to the survey were selected and merged with
this demographic data into our spreadsheet. In several cases, the level of demographic specificity
provided by Carnegie Classification system was prohibitive for analyzing a sample of only 160
institutions. Therefore many several categories were condensed for simplification purposes. For
instance, the classification ―Rural Town‖ that is used in this analysis consists of three Carnegie
classifications: ―Rural: Fringe,‖ ―Rural: Distant,‖ and ―Rural: Remote‖ (see Glossary for specific
definitions). Also, due to having so few responses from community colleges and Canadian
institutions, some analysis was done separately.
Four different demographic categories were selected as the primary methods of comparison
among institutions, these include: 1) whether an institution is public or private, 2) the community
setting surrounding a campus, 3) whether or not the majority of students reside in campus
housing, and 4) the size of the student population. Geographical location was also considered in
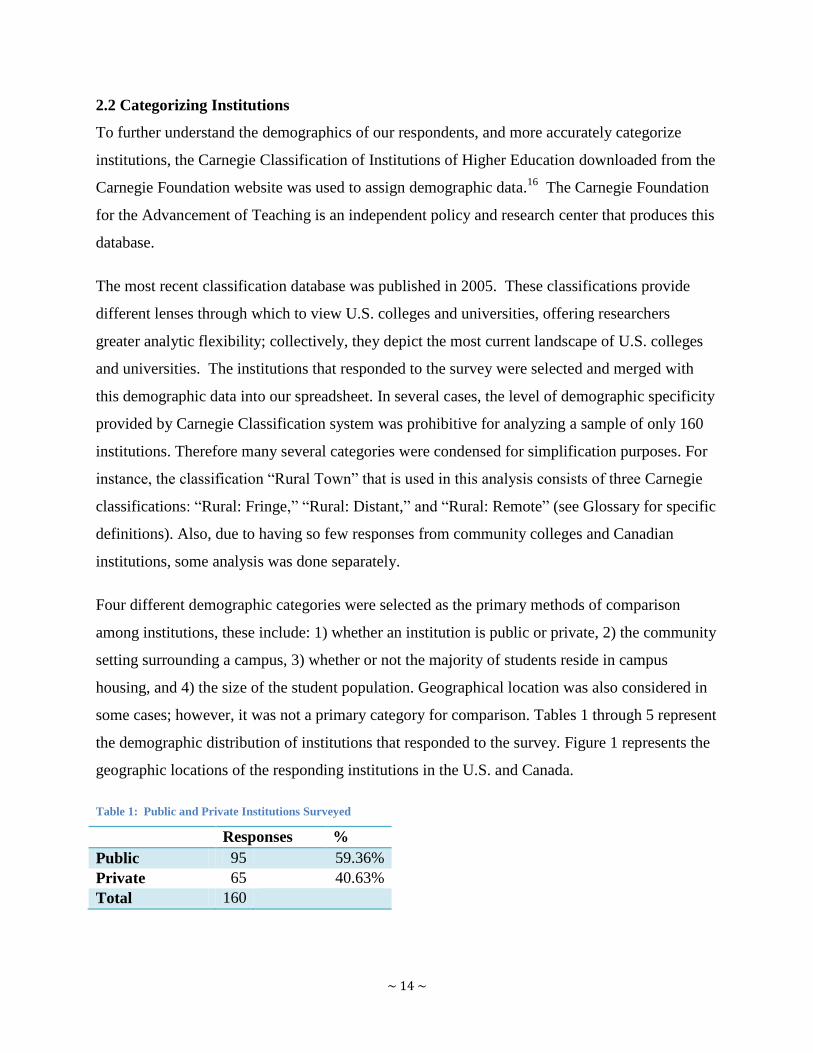
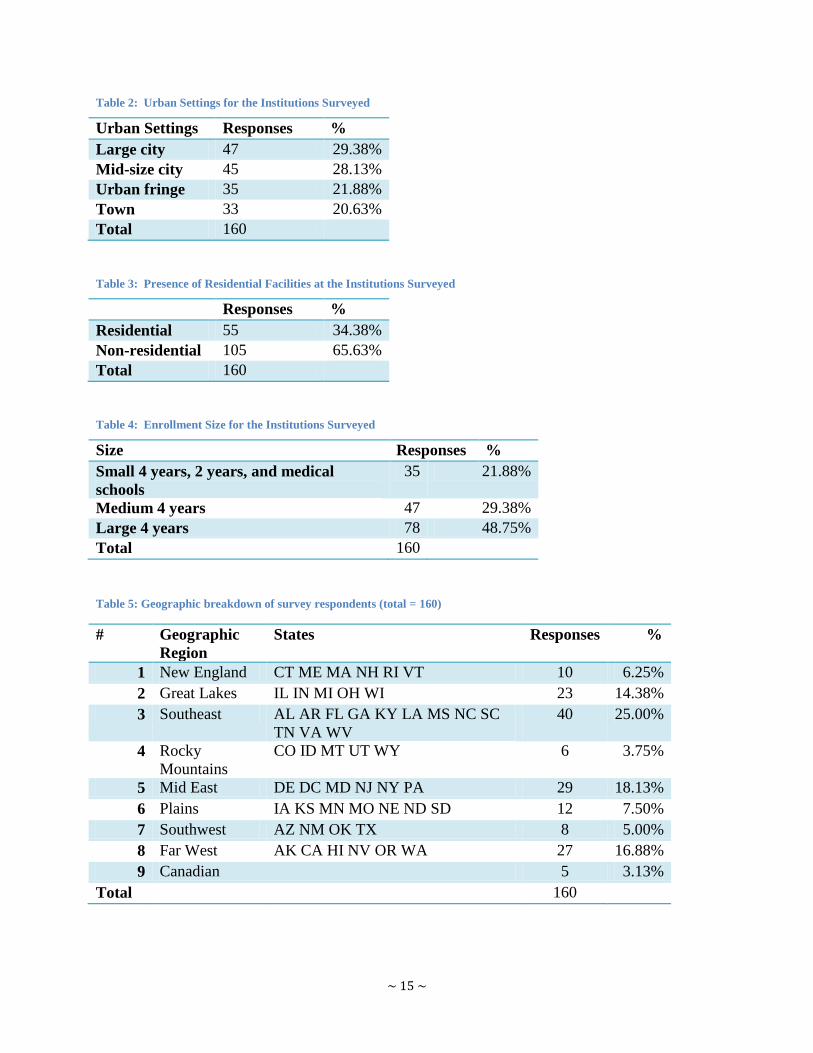
some cases; however, it was not a primary category for comparison. Tables 1 through 5 represent
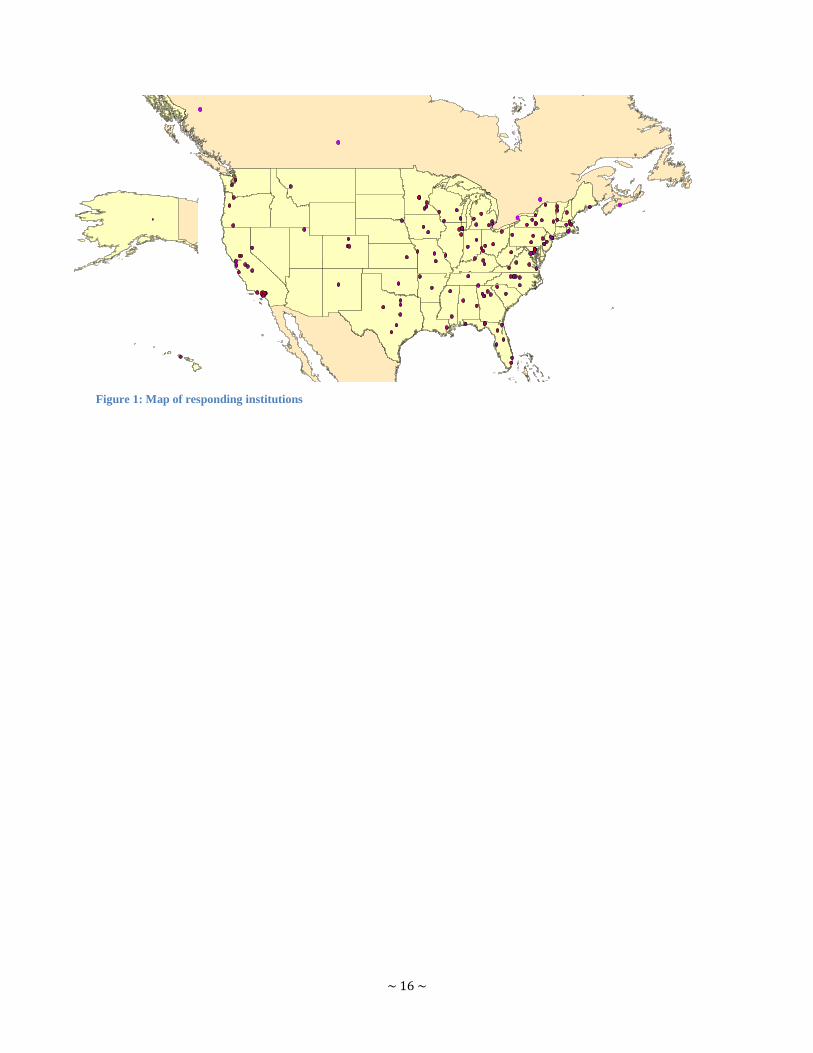
the demographic distribution of institutions that responded to the survey. Figure 1 represents the
geographic locations of the responding institutions in the U.S. and Canada.
Table 1: Public and Private Institutions Surveyed
Responses %
Public 95 59.36%
Private 65 40.63%
Total 160
~ 15 ~
Table 2: Urban Settings for the Institutions Surveyed
Urban Settings Responses %
Large city 47 29.38%
Mid-size city 45 28.13%
Urban fringe 35 21.88%
Town 33 20.63%
Total 160
Table 3: Presence of Residential Facilities at the Institutions Surveyed
Responses %
Residential 55 34.38%
Non-residential 105 65.63%
Total 160
Table 4: Enrollment Size for the Institutions Surveyed
Size Responses %
Small 4 years, 2 years, and medical
schools
35 21.88%
Medium 4 years 47 29.38%
Large 4 years 78 48.75%
Total 160
Table 5: Geographic breakdown of survey respondents (total = 160)
# Geographic
Region
States Responses %
1 New England CT ME MA NH RI VT 10 6.25%
2 Great Lakes IL IN MI OH WI 23 14.38%
3 Southeast AL AR FL GA KY LA MS NC SC
TN VA WV
40 25.00%
4 Rocky
Mountains
CO ID MT UT WY 6 3.75%
5 Mid East DE DC MD NJ NY PA 29 18.13%
6 Plains IA KS MN MO NE ND SD 12 7.50%
7 Southwest AZ NM OK TX 8 5.00%
8 Far West AK CA HI NV OR WA 27 16.88%
9 Canadian 5 3.13%
Total 160
~ 16 ~
Figure 1: Map of responding institutions
!!
!
!
!! !!
!
!!
!
!
!
! !
! !!
!
! !
!
!
!
!!!!
!
!!
!
!
!!
!
!
!!
!! !
!! !!
!! !!
!
!
!
!!!
!
!!!!
!!!!!
!
!
!
!!!!
!
!!
!
!
!
!!
!
!
!
!!
!
!!!
!
!!
!
!
!
!!
!
!!
!
!
!
!
!
!
!!
!!
!
!
!
!
!
! !!
!
!!
!
!
!
!
!
!
!
!
!
!!
!
!
! !
!!!!
!
!!
!!!
!
! !
!
!
!
!
!
!
!
!
!! !!
!
!!
!
!
!
! !
! !!
!
! !
!
!
!
!
!
!
!
!
!
!
!
!
!
!!!
!
!
!
!! !!
!
!!
!
!
!
! !
! !!
!
! !
!
!
!
!
!
!
!
!
!
!
!
!
!
!!!
!
!
~ 17 ~
2.3 Respondent Interviews
As part of the survey, respondents were asked if they would be willing to participate in a case
study. Approximately half of the institutions responded positively to this question. Out of the 160
responses, eight institutions were chosen primarily based upon survey responses that indicated
novel and/or successful organizational structures and initiatives for addressing climate change.
Demographics, such as geographic location and student body size, were also considered in order
to have a balanced representation of institutions. For each institution, a 45-minute to one-hour
interview was conducted with the individual who was listed as the point of contact on the survey.
Below are the eight institutions that were selected for interviews:
Berea College
Duke University
The Evergreen State College
Middlebury College
Stanford University
Tulane University
University of Northern British Columbia
University of Washington – Seattle Campus
~ 18 ~
2.4 Note About Data Sampling and Analysis
With the relatively small sample size of 160, as well as a non-random sampling method, the data
listed in this report are not assumed to be representative of the larger population of higher
education institutions in the U.S. and Canada. This survey was completely voluntary, and the
institutions that responded to it were self-selected into response. In other words, our sample was
not selected at random. Responding institutions were clearly more aware of environmental
issues, especially climate change. This group of institutions is more likely to recognize the
importance of campus climate change governance issues compared with institutions that are not
aware. Therefore, from the very beginning our respondents are self-selected to take action and
fill out the survey. The strong evidence of self-selection is from the "affiliation‖ question.
There are 124 institutions out of 160 responses are affiliated with AASHE. These results may
have the following implications: because the institutions were not selected at random, this data is
skewed toward more environmentally aware institutions, and therefore cannot represent the true
population, which are all higher education institutions in the U.S and Canada. Secondly, because
institutions recognized the fact that this survey was sponsored by the Association of Climate
Change Officers (ACCO), which is an organization that is proactive in climate change policy,
they might have written responses that they thought were expected in this context.
Additionally, there was a general lack of statistically significant trends (p-value < 0.05).
Therefore, all of the numerical observations described in this analysis can only be applied to the
sample population of responding institutions. However, given anecdotal evidence from
interviews with responding institutions, as well as the survey data, this report includes some
general themes the project team believes are applicable on a broader scale.
A p-value is determined by running the Pearson Chi square test in STATA statistical software.
Questions with categorical answers are compared to see if the difference among groups is
random. If a p-value is less than 0.05, then the difference is not random, and is therefore
significant. Note that the multiple choice questions with multiple answers are not used in
statistical analysis, and therefore no p-value is generated for them. In addition, small sub-groups
are not tested, either.
~ 19 ~
Chapter 3: Results
3.1 Trends in Higher Education Institutions:
3.1.1 Who is Accountable?
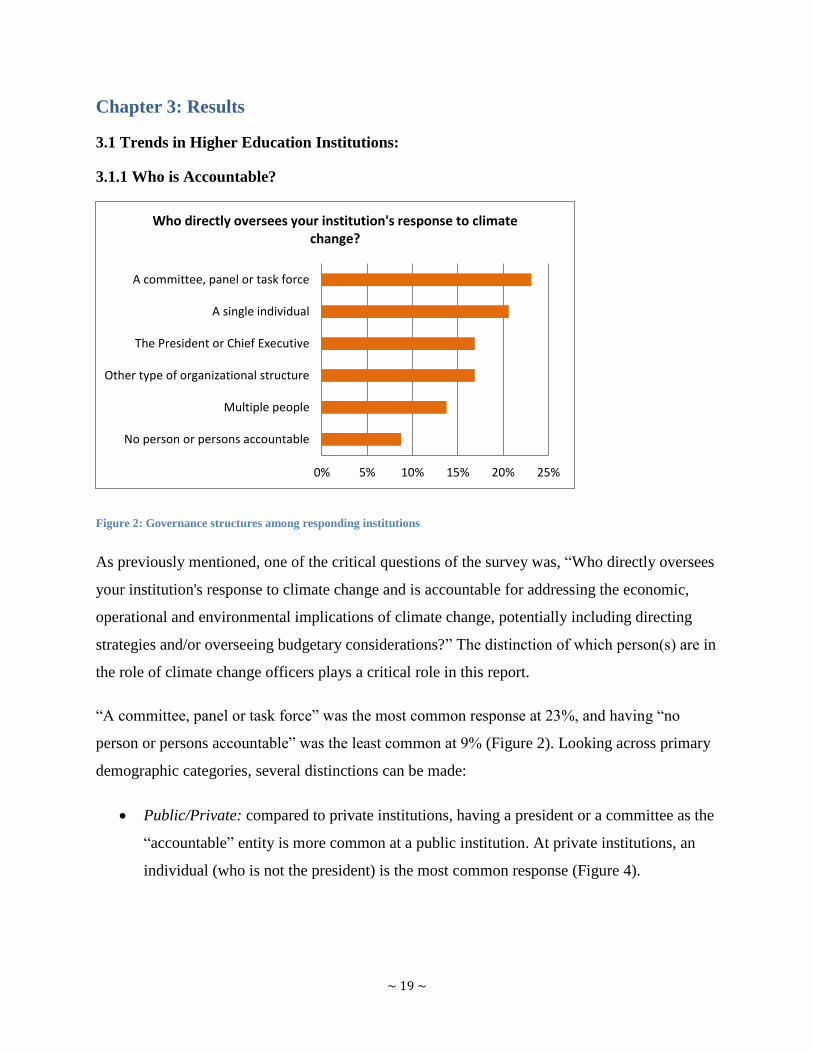
Figure 2: Governance structures among responding institutions
As previously mentioned, one of the critical questions of the survey was, ―Who directly oversees
your institution's response to climate change and is accountable for addressing the economic,
operational and environmental implications of climate change, potentially including directing
strategies and/or overseeing budgetary considerations?‖ The distinction of which person(s) are in
the role of climate change officers plays a critical role in this report.
―A committee, panel or task force‖ was the most common response at 23%, and having ―no
person or persons accountable‖ was the least common at 9% (Figure 2). Looking across primary
demographic categories, several distinctions can be made:
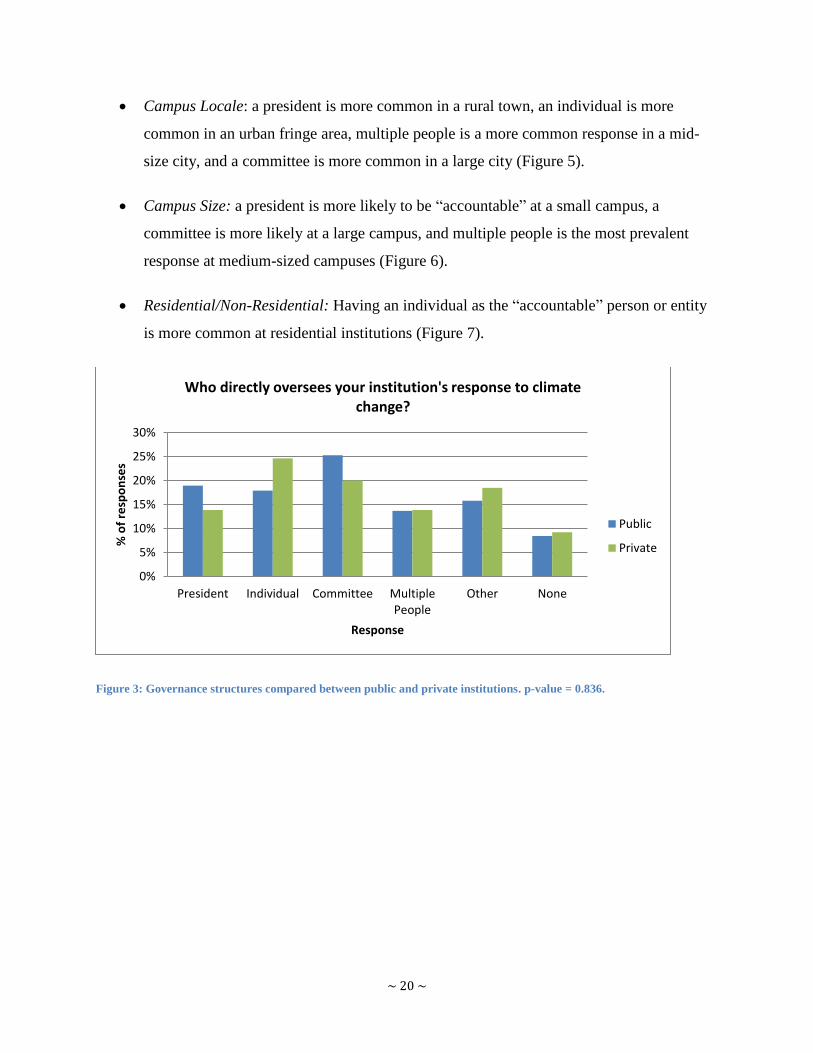
Public/Private: compared to private institutions, having a president or a committee as the
―accountable‖ entity is more common at a public institution. At private institutions, an
individual (who is not the president) is the most common response (Figure 4).
0% 5% 10% 15% 20% 25%
A committee, panel or task force
A single individual
The President or Chief Executive
Other type of organizational structure
Multiple people
No person or persons accountable
Who directly oversees your institution's response to climate change?
~ 20 ~
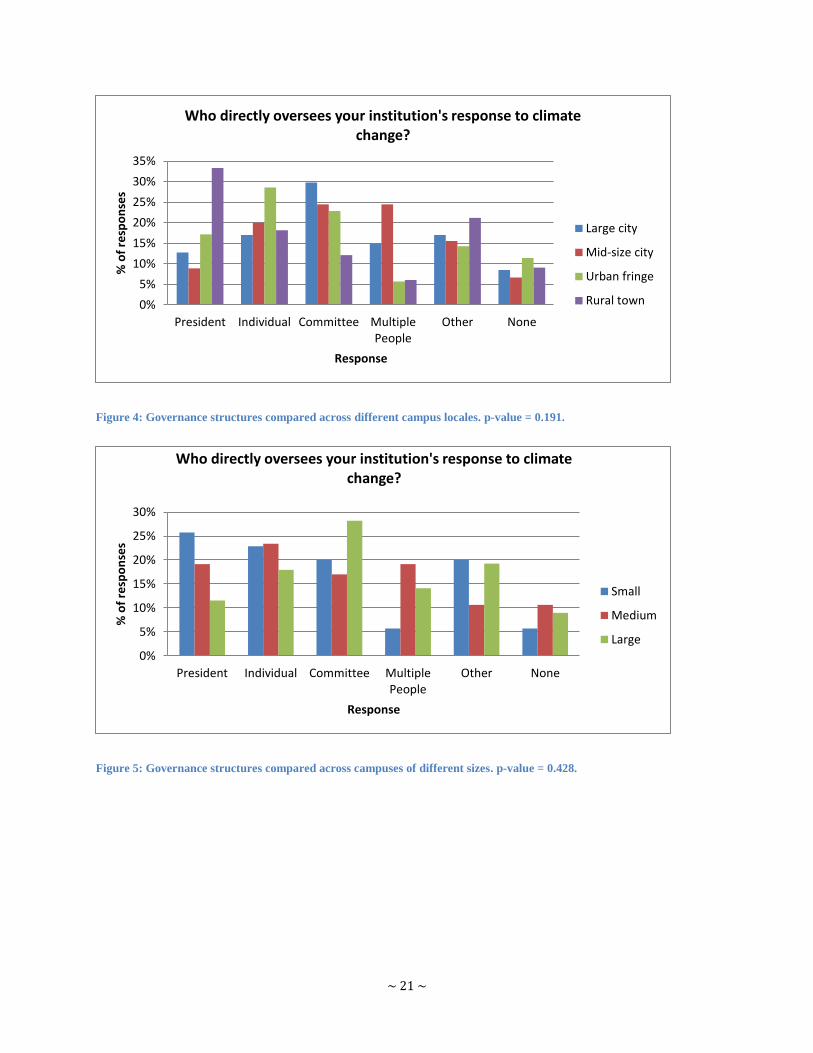
Campus Locale: a president is more common in a rural town, an individual is more
common in an urban fringe area, multiple people is a more common response in a mid-
size city, and a committee is more common in a large city (Figure 5).
Campus Size: a president is more likely to be ―accountable‖ at a small campus, a
committee is more likely at a large campus, and multiple people is the most prevalent
response at medium-sized campuses (Figure 6).
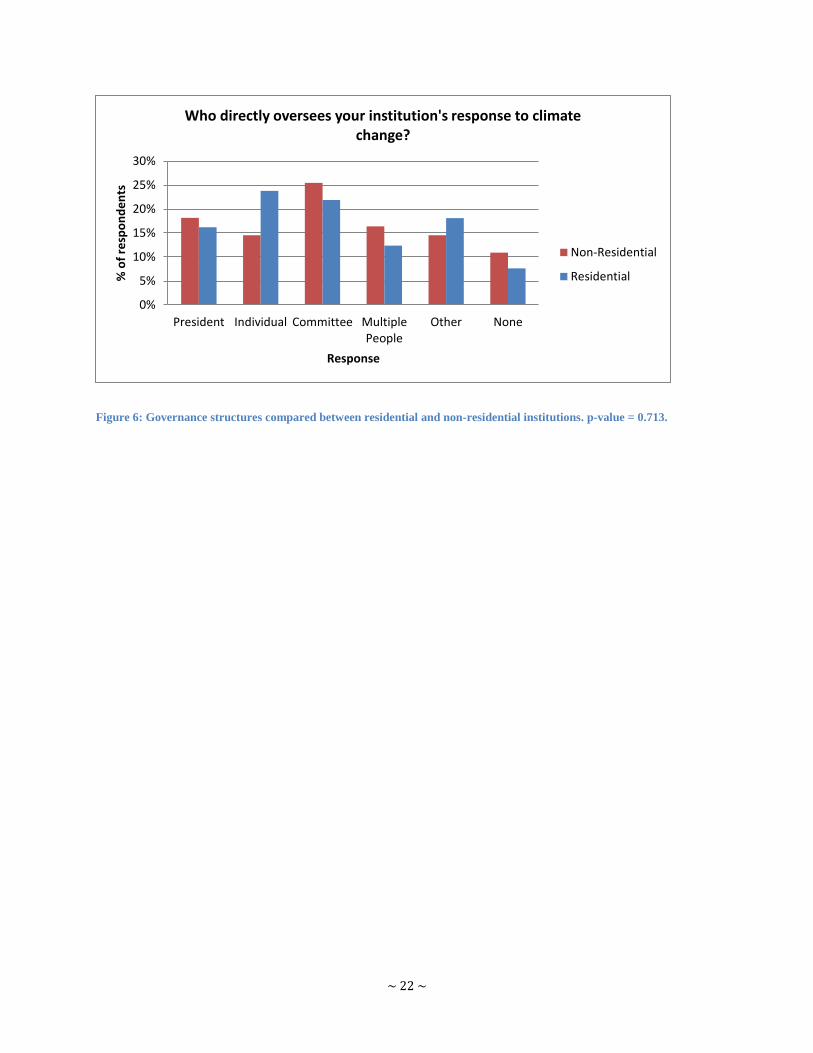
Residential/Non-Residential: Having an individual as the ―accountable‖ person or entity
is more common at residential institutions (Figure 7).
Figure 3: Governance structures compared between public and private institutions. p-value = 0.836.
0%
5%
10%
15%
20%
25%
30%
President Individual Committee MultiplePeople
Other None
% o
f re
spo
nse
s
Response
Who directly oversees your institution's response to climate change?
Public
Private
~ 21 ~
Figure 4: Governance structures compared across different campus locales. p-value = 0.191.
Figure 5: Governance structures compared across campuses of different sizes. p-value = 0.428.
0%
5%
10%
15%
20%
25%
30%
35%
President Individual Committee MultiplePeople
Other None
% o
f re
spo
nse
s
Response
Who directly oversees your institution's response to climate change?
Large city
Mid-size city
Urban fringe
Rural town
0%
5%
10%
15%
20%
25%
30%
President Individual Committee MultiplePeople
Other None
% o
f re
spo
nse
s
Response
Who directly oversees your institution's response to climate change?
Small
Medium
Large
~ 22 ~
Figure 6: Governance structures compared between residential and non-residential institutions. p-value = 0.713.
0%
5%
10%
15%
20%
25%
30%
President Individual Committee MultiplePeople
Other None
% o
f re
spo
nd
en
ts
Response
Who directly oversees your institution's response to climate change?
Non-Residential
Residential
~ 23 ~
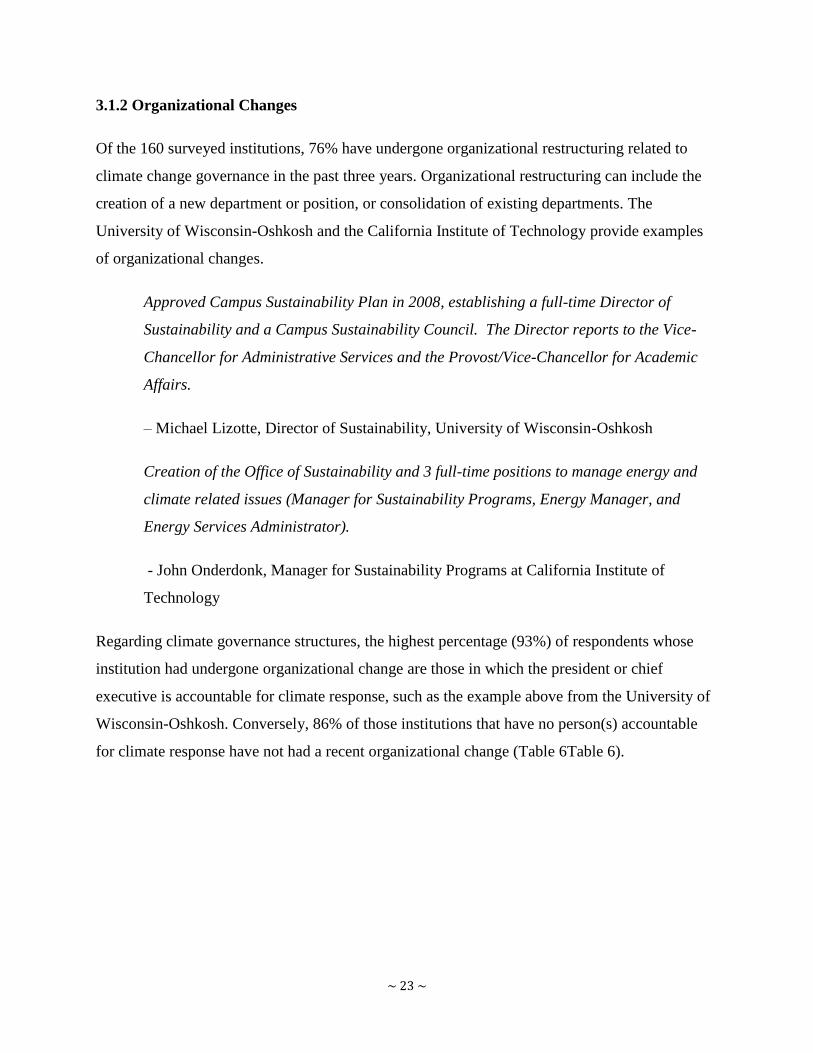
3.1.2 Organizational Changes
Of the 160 surveyed institutions, 76% have undergone organizational restructuring related to
climate change governance in the past three years. Organizational restructuring can include the
creation of a new department or position, or consolidation of existing departments. The
University of Wisconsin-Oshkosh and the California Institute of Technology provide examples
of organizational changes.
Approved Campus Sustainability Plan in 2008, establishing a full-time Director of
Sustainability and a Campus Sustainability Council. The Director reports to the Vice-
Chancellor for Administrative Services and the Provost/Vice-Chancellor for Academic
Affairs.
– Michael Lizotte, Director of Sustainability, University of Wisconsin-Oshkosh
Creation of the Office of Sustainability and 3 full-time positions to manage energy and
climate related issues (Manager for Sustainability Programs, Energy Manager, and
Energy Services Administrator).
- John Onderdonk, Manager for Sustainability Programs at California Institute of
Technology
Regarding climate governance structures, the highest percentage (93%) of respondents whose
institution had undergone organizational change are those in which the president or chief
executive is accountable for climate response, such as the example above from the University of
Wisconsin-Oshkosh. Conversely, 86% of those institutions that have no person(s) accountable
for climate response have not had a recent organizational change (Table 6Table 6).
~ 24 ~
Table 6: Organizational changes between institutions with different governance structures
Governance Structure No Change Org Change
1. The President or Chief Executive 7.41% 92.59%
2. A single individual 30.30% 69.70%
3. A committee, panel or task 18.92% 81.08%
4. Multiple people 22.73% 77.27%
5. Other type of organizational structure 11.11% 88.89%
6. There is currently no person or persons accountable 85.71% 14.29%
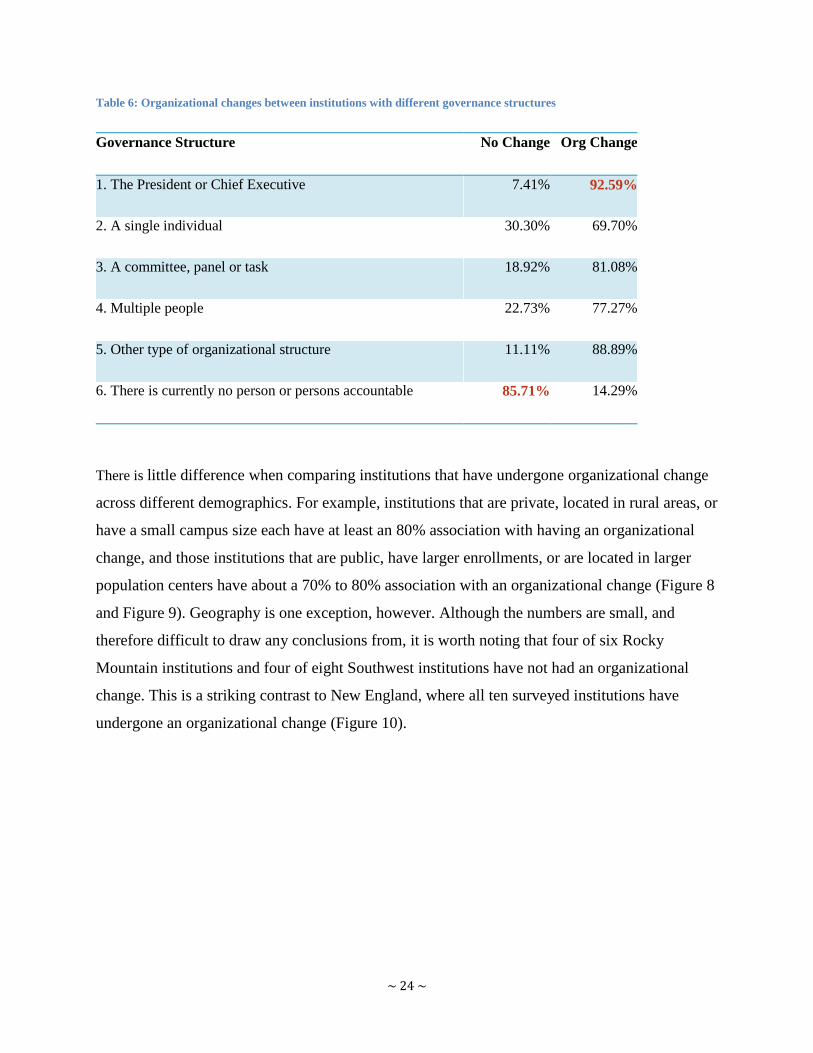
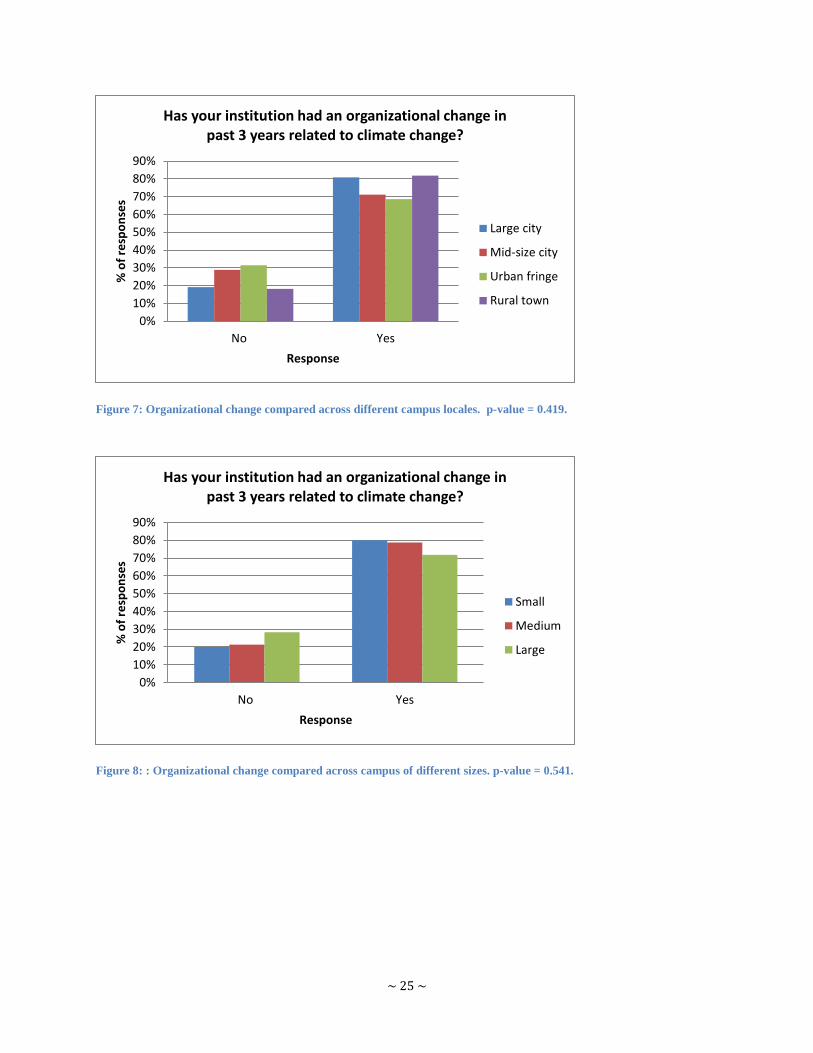
There is little difference when comparing institutions that have undergone organizational change
across different demographics. For example, institutions that are private, located in rural areas, or
have a small campus size each have at least an 80% association with having an organizational
change, and those institutions that are public, have larger enrollments, or are located in larger
population centers have about a 70% to 80% association with an organizational change (Figure 8
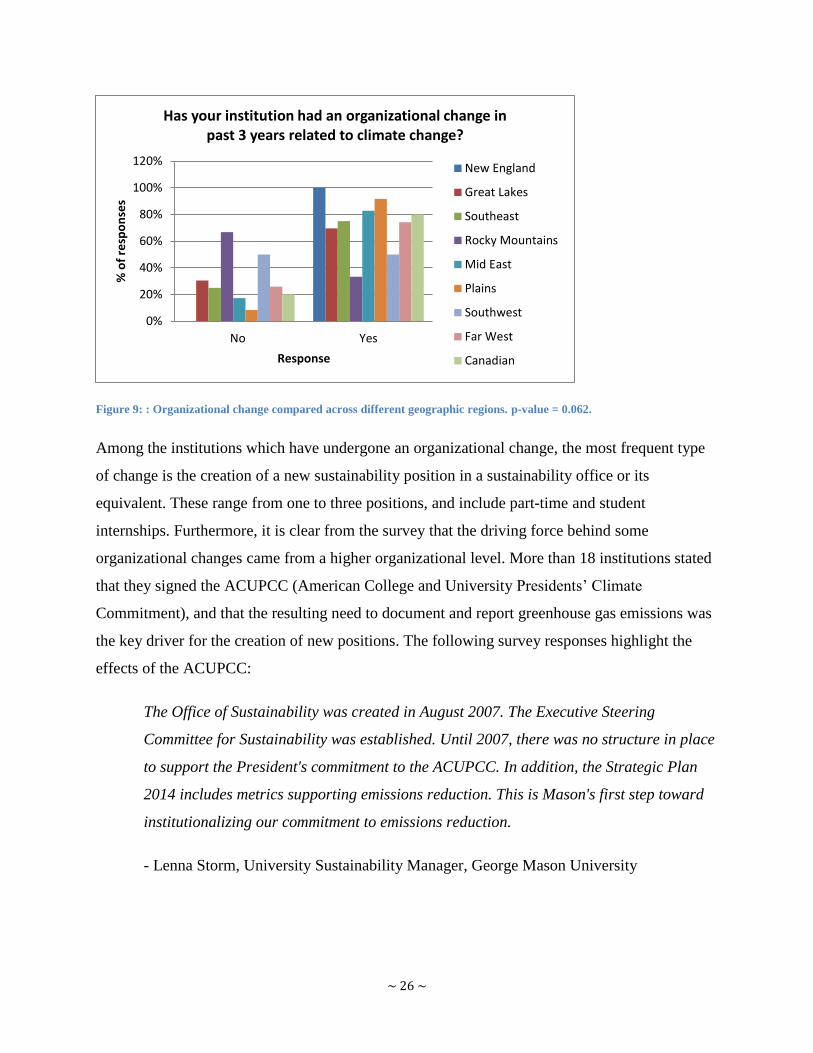
and Figure 9). Geography is one exception, however. Although the numbers are small, and
therefore difficult to draw any conclusions from, it is worth noting that four of six Rocky
Mountain institutions and four of eight Southwest institutions have not had an organizational
change. This is a striking contrast to New England, where all ten surveyed institutions have
undergone an organizational change (Figure 10).
~ 25 ~
Figure 7: Organizational change compared across different campus locales. p-value = 0.419.
Figure 8: : Organizational change compared across campus of different sizes. p-value = 0.541.
0%
10%
20%
30%
40%
50%
60%
70%
80%
90%
No Yes
% o
f re
spo
nse
s
Response
Has your institution had an organizational change in past 3 years related to climate change?
Large city
Mid-size city
Urban fringe
Rural town
0%
10%
20%
30%
40%
50%
60%
70%
80%
90%
No Yes
% o
f re
spo
nse
s
Response
Has your institution had an organizational change in past 3 years related to climate change?
Small
Medium
Large
~ 26 ~
Figure 9: : Organizational change compared across different geographic regions. p-value = 0.062.
Among the institutions which have undergone an organizational change, the most frequent type
of change is the creation of a new sustainability position in a sustainability office or its
equivalent. These range from one to three positions, and include part-time and student
internships. Furthermore, it is clear from the survey that the driving force behind some
organizational changes came from a higher organizational level. More than 18 institutions stated
that they signed the ACUPCC (American College and University Presidents‘ Climate
Commitment), and that the resulting need to document and report greenhouse gas emissions was
the key driver for the creation of new positions. The following survey responses highlight the
effects of the ACUPCC:
The Office of Sustainability was created in August 2007. The Executive Steering
Committee for Sustainability was established. Until 2007, there was no structure in place
to support the President's commitment to the ACUPCC. In addition, the Strategic Plan
2014 includes metrics supporting emissions reduction. This is Mason's first step toward
institutionalizing our commitment to emissions reduction.
- Lenna Storm, University Sustainability Manager, George Mason University
0%
20%
40%
60%
80%
100%
120%
No Yes
% o
f re
spo
nse
s
Response
Has your institution had an organizational change in past 3 years related to climate change?
New England
Great Lakes
Southeast
Rocky Mountains
Mid East
Plains
Southwest
Far West
Canadian
~ 27 ~
Since our President signed the ACUPCC in 2008, we have: incorporated sustainability
into our university’s strategic plan; convened a sustainability steering committee to
oversee our transition to becoming a ―greener‖ university; ... most recently, launched the
worlds’ first School of Global Sustainability.
-Christian Wells, Director, Office of Sustainability, University of South Florida
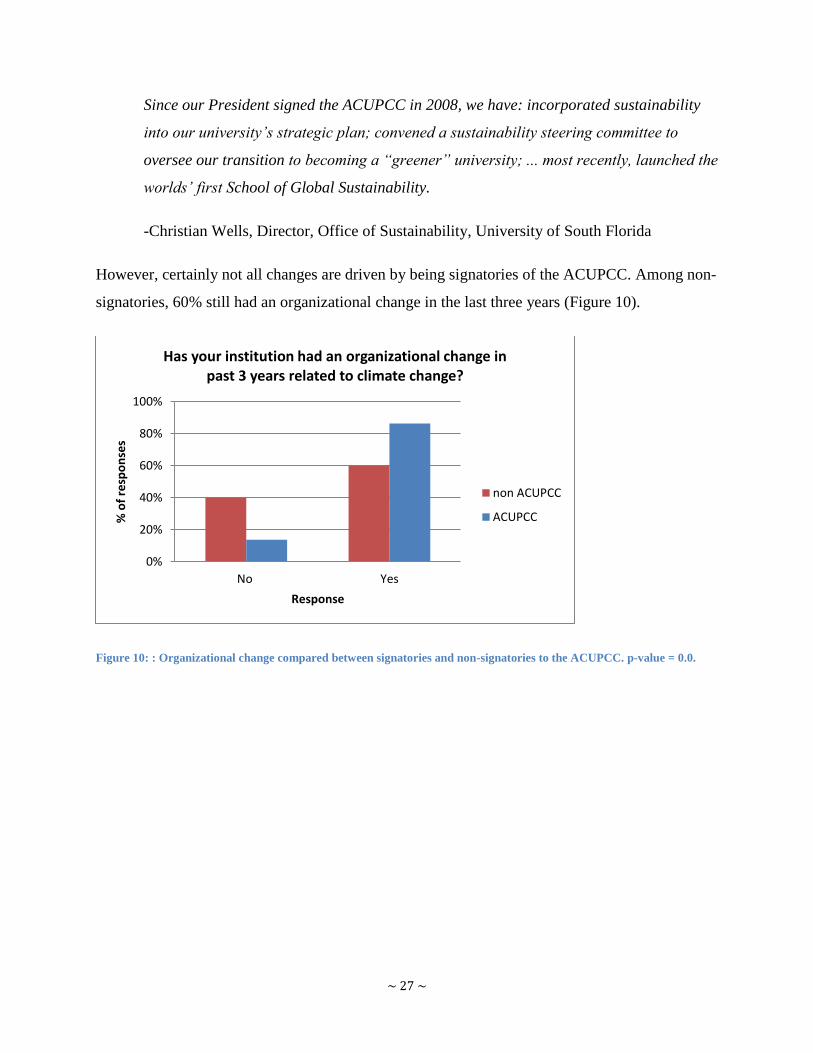
However, certainly not all changes are driven by being signatories of the ACUPCC. Among non-
signatories, 60% still had an organizational change in the last three years (Figure 10).
Figure 10: : Organizational change compared between signatories and non-signatories to the ACUPCC. p-value = 0.0.
0%
20%
40%
60%
80%
100%
No Yes
% o
f re
spo
nse
s
Response
Has your institution had an organizational change in past 3 years related to climate change?
non ACUPCC
ACUPCC
~ 28 ~
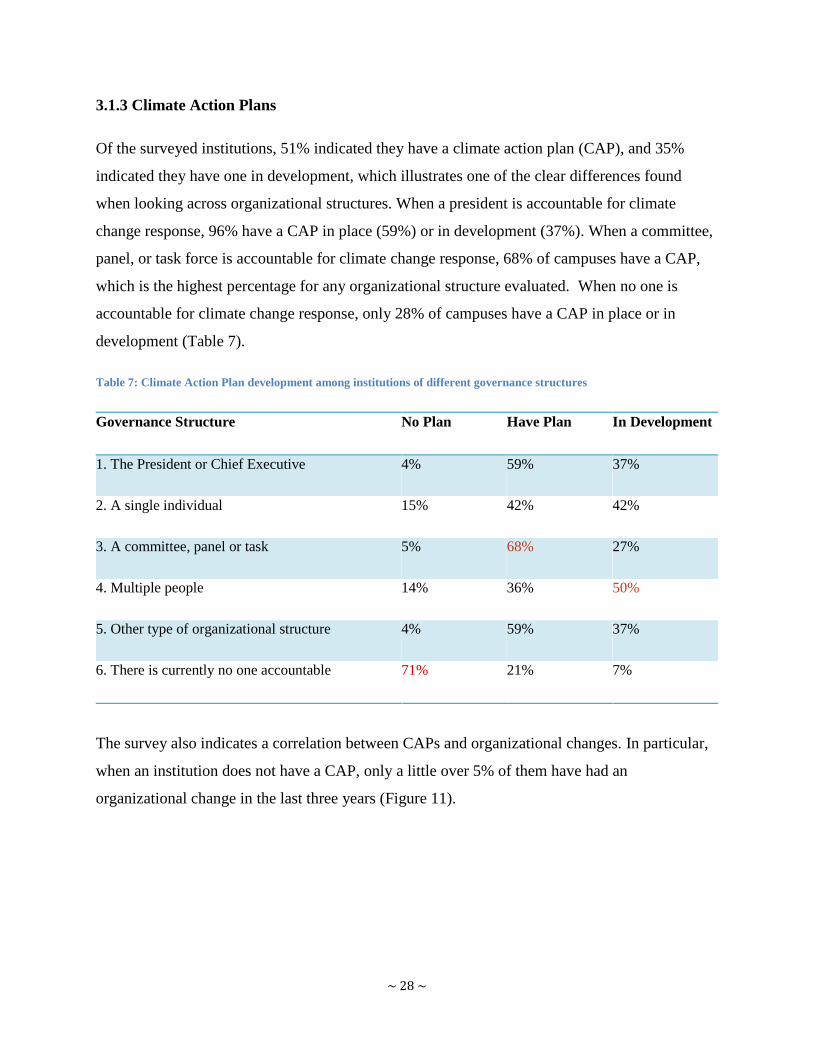
3.1.3 Climate Action Plans
Of the surveyed institutions, 51% indicated they have a climate action plan (CAP), and 35%
indicated they have one in development, which illustrates one of the clear differences found
when looking across organizational structures. When a president is accountable for climate
change response, 96% have a CAP in place (59%) or in development (37%). When a committee,
panel, or task force is accountable for climate change response, 68% of campuses have a CAP,
which is the highest percentage for any organizational structure evaluated. When no one is
accountable for climate change response, only 28% of campuses have a CAP in place or in
development (Table 7).
Table 7: Climate Action Plan development among institutions of different governance structures
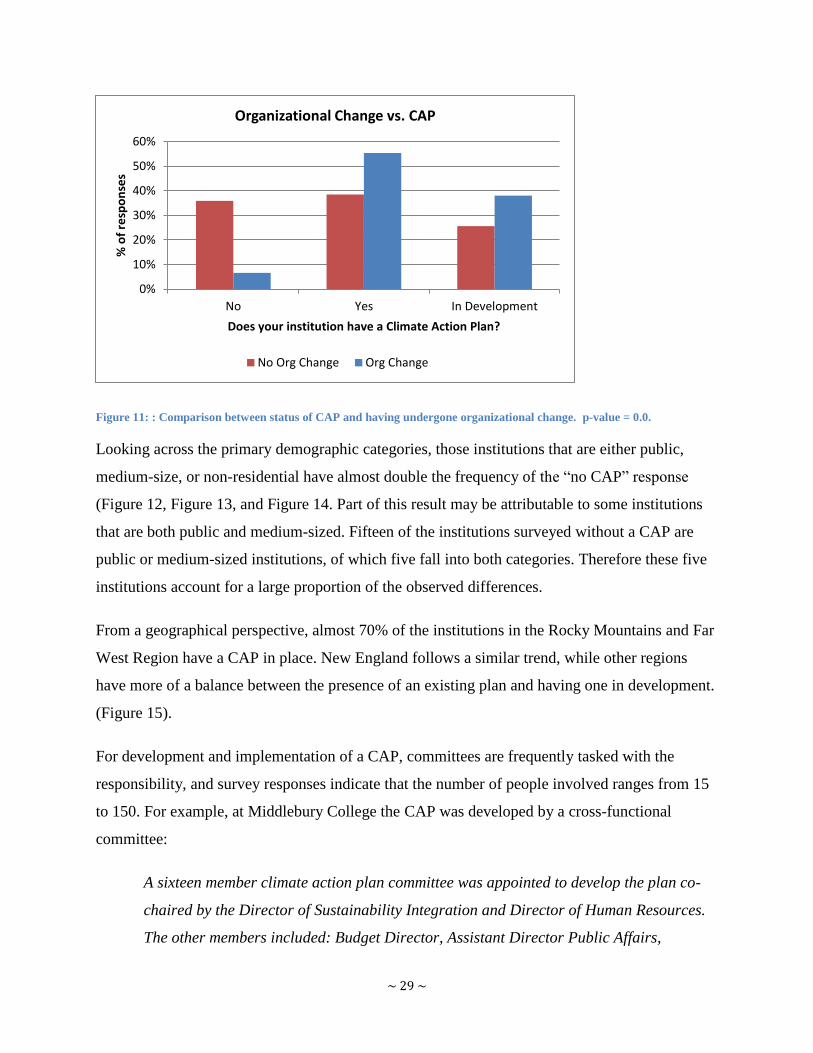
The survey also indicates a correlation between CAPs and organizational changes. In particular,
when an institution does not have a CAP, only a little over 5% of them have had an
organizational change in the last three years (Figure 11).
Governance Structure No Plan Have Plan In Development
1. The President or Chief Executive 4% 59% 37%
2. A single individual 15% 42% 42%
3. A committee, panel or task 5% 68% 27%
4. Multiple people 14% 36% 50%
5. Other type of organizational structure 4% 59% 37%
6. There is currently no one accountable 71% 21% 7%
~ 29 ~
Figure 11: : Comparison between status of CAP and having undergone organizational change. p-value = 0.0.
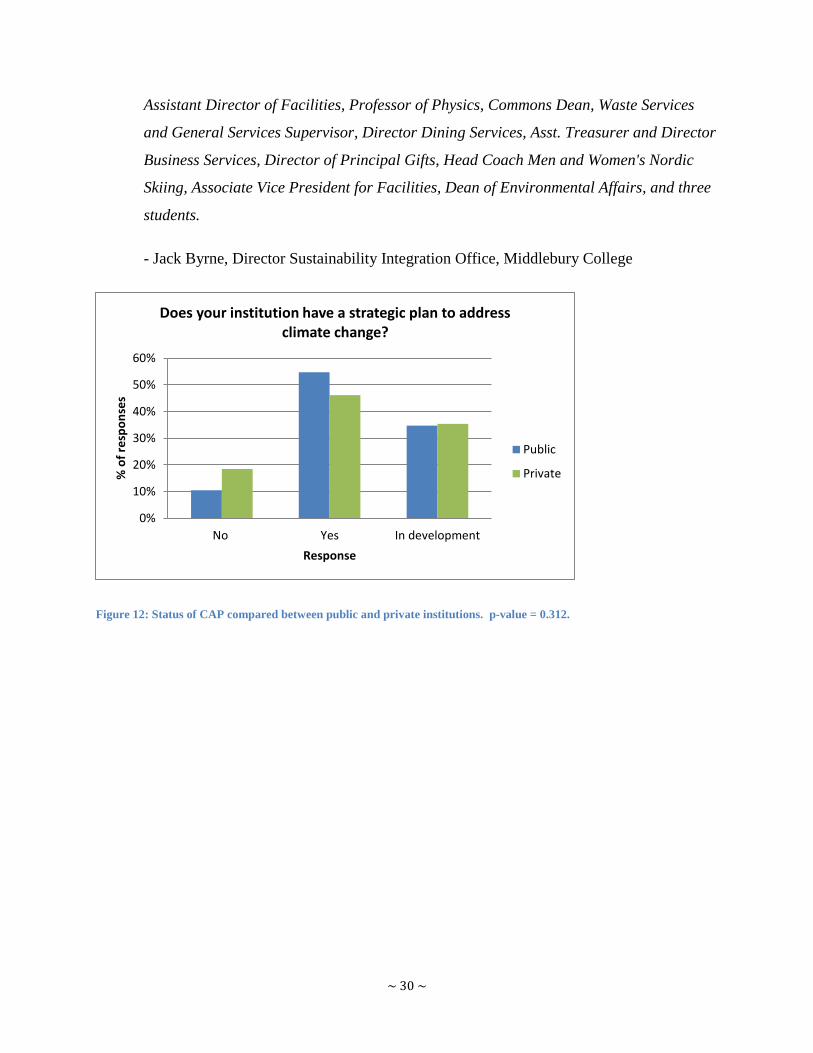
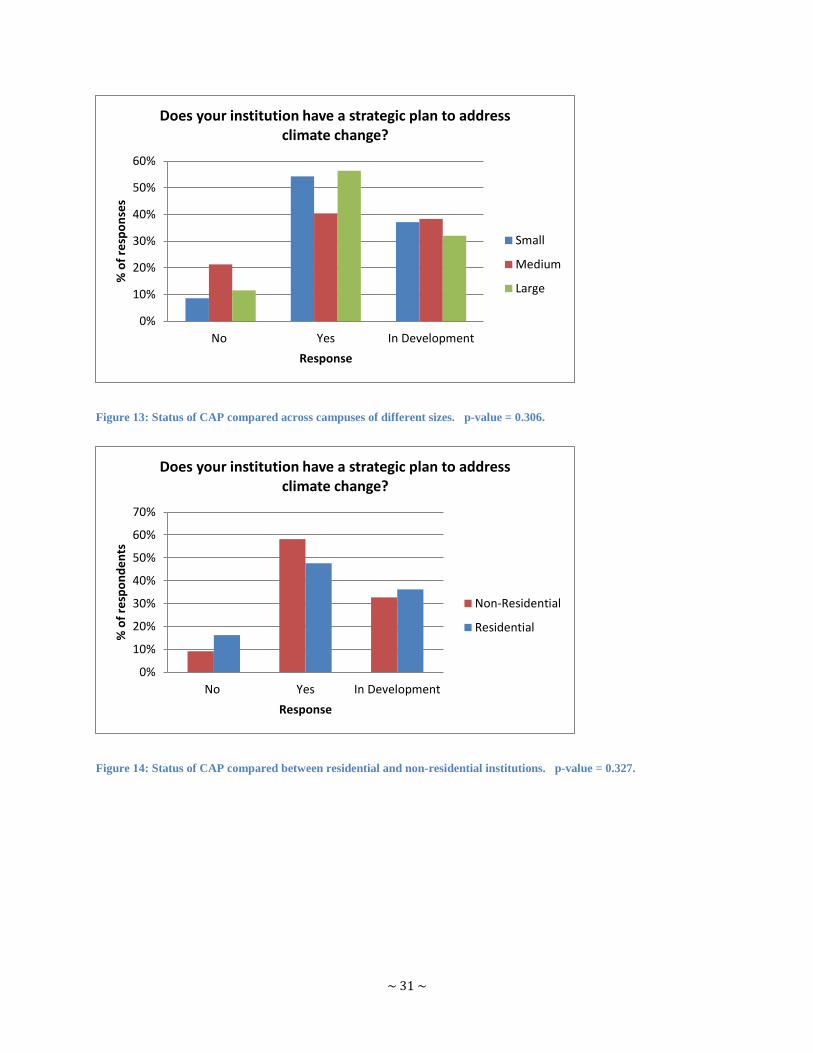
Looking across the primary demographic categories, those institutions that are either public,
medium-size, or non-residential have almost double the frequency of the ―no CAP‖ response
(Figure 12, Figure 13, and Figure 14. Part of this result may be attributable to some institutions
that are both public and medium-sized. Fifteen of the institutions surveyed without a CAP are
public or medium-sized institutions, of which five fall into both categories. Therefore these five
institutions account for a large proportion of the observed differences.
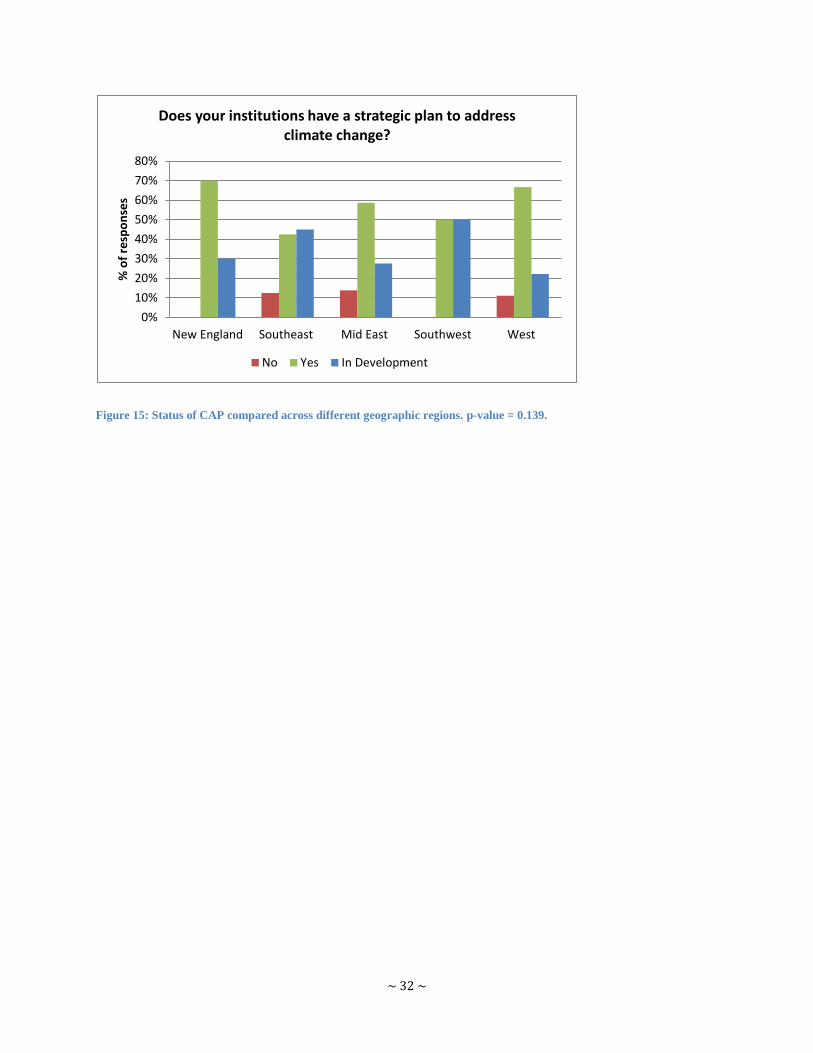
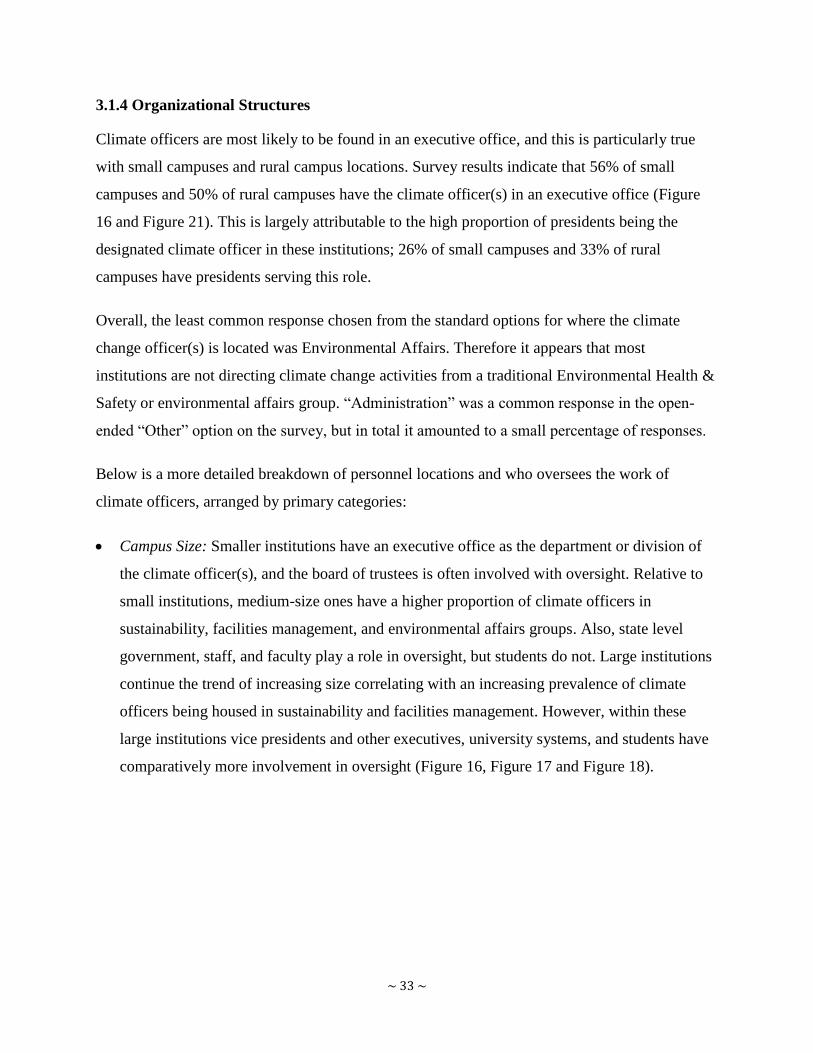
From a geographical perspective, almost 70% of the institutions in the Rocky Mountains and Far
West Region have a CAP in place. New England follows a similar trend, while other regions
have more of a balance between the presence of an existing plan and having one in development.
(Figure 15).
For development and implementation of a CAP, committees are frequently tasked with the
responsibility, and survey responses indicate that the number of people involved ranges from 15
to 150. For example, at Middlebury College the CAP was developed by a cross-functional
committee:
A sixteen member climate action plan committee was appointed to develop the plan co-
chaired by the Director of Sustainability Integration and Director of Human Resources.
The other members included: Budget Director, Assistant Director Public Affairs,
0%
10%
20%
30%
40%
50%
60%
No Yes In Development
% o
f re
spo
nse
s
Does your institution have a Climate Action Plan?
Organizational Change vs. CAP
No Org Change Org Change
~ 30 ~
Assistant Director of Facilities, Professor of Physics, Commons Dean, Waste Services
and General Services Supervisor, Director Dining Services, Asst. Treasurer and Director
Business Services, Director of Principal Gifts, Head Coach Men and Women's Nordic
Skiing, Associate Vice President for Facilities, Dean of Environmental Affairs, and three
students.
- Jack Byrne, Director Sustainability Integration Office, Middlebury College
Figure 12: Status of CAP compared between public and private institutions. p-value = 0.312.
0%
10%
20%
30%
40%
50%
60%
No Yes In development
% o
f re
spo
nse
s
Response
Does your institution have a strategic plan to address climate change?
Public
Private
~ 31 ~
Figure 13: Status of CAP compared across campuses of different sizes. p-value = 0.306.
Figure 14: Status of CAP compared between residential and non-residential institutions. p-value = 0.327.
0%
10%
20%
30%
40%
50%
60%
No Yes In Development
% o
f re
spo
nse
s
Response
Does your institution have a strategic plan to address climate change?
Small
Medium
Large
0%
10%
20%
30%
40%
50%
60%
70%
No Yes In Development
% o
f re
spo
nd
en
ts
Response
Does your institution have a strategic plan to address climate change?
Non-Residential
Residential
~ 32 ~
Figure 15: Status of CAP compared across different geographic regions. p-value = 0.139.
0%
10%
20%
30%
40%
50%
60%
70%
80%
New England Southeast Mid East Southwest West
% o
f re
spo
nse
s Does your institutions have a strategic plan to address
climate change?
No Yes In Development
~ 33 ~
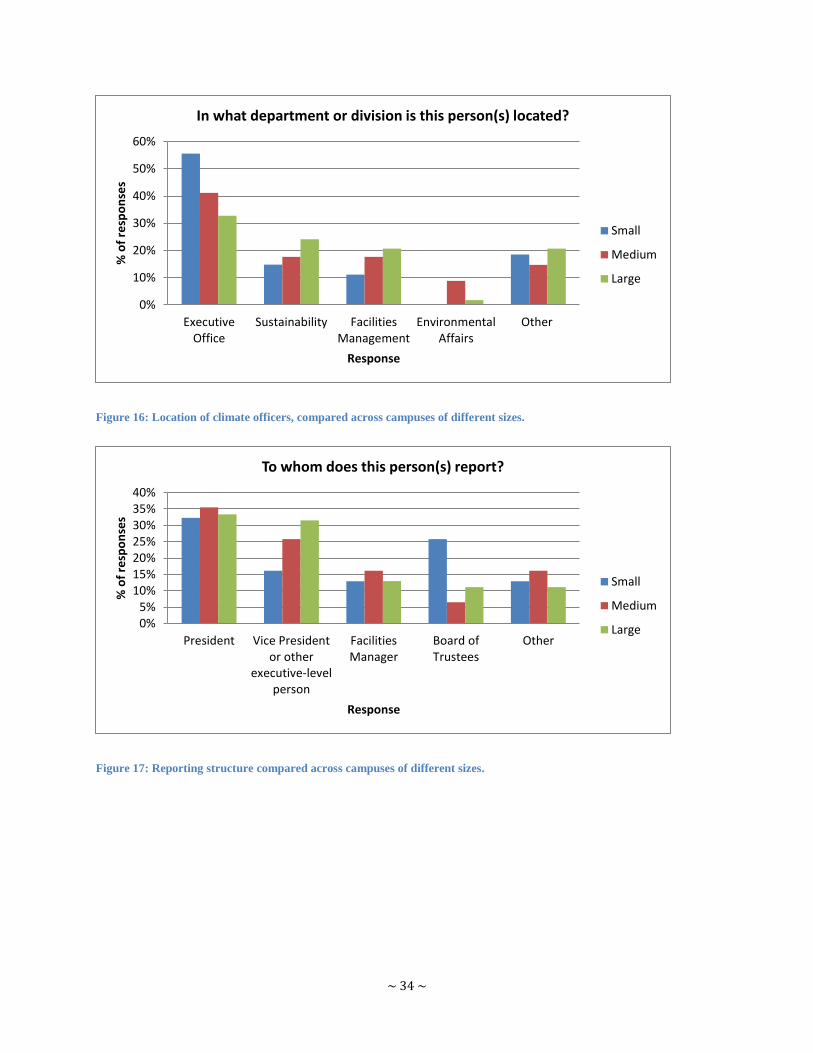
3.1.4 Organizational Structures
Climate officers are most likely to be found in an executive office, and this is particularly true
with small campuses and rural campus locations. Survey results indicate that 56% of small
campuses and 50% of rural campuses have the climate officer(s) in an executive office (Figure
16 and Figure 21). This is largely attributable to the high proportion of presidents being the
designated climate officer in these institutions; 26% of small campuses and 33% of rural
campuses have presidents serving this role.
Overall, the least common response chosen from the standard options for where the climate
change officer(s) is located was Environmental Affairs. Therefore it appears that most
institutions are not directing climate change activities from a traditional Environmental Health &
Safety or environmental affairs group. ―Administration‖ was a common response in the open-
ended ―Other‖ option on the survey, but in total it amounted to a small percentage of responses.
Below is a more detailed breakdown of personnel locations and who oversees the work of
climate officers, arranged by primary categories:
Campus Size: Smaller institutions have an executive office as the department or division of
the climate officer(s), and the board of trustees is often involved with oversight. Relative to
small institutions, medium-size ones have a higher proportion of climate officers in
sustainability, facilities management, and environmental affairs groups. Also, state level
government, staff, and faculty play a role in oversight, but students do not. Large institutions
continue the trend of increasing size correlating with an increasing prevalence of climate
officers being housed in sustainability and facilities management. However, within these
large institutions vice presidents and other executives, university systems, and students have
comparatively more involvement in oversight (Figure 16, Figure 17 and Figure 18).
~ 34 ~
Figure 16: Location of climate officers, compared across campuses of different sizes.
Figure 17: Reporting structure compared across campuses of different sizes.
0%
10%
20%
30%
40%
50%
60%
ExecutiveOffice
Sustainability FacilitiesManagement
EnvironmentalAffairs
Other
% o
f re
spo
nse
s
Response
In what department or division is this person(s) located?
Small
Medium
Large
0%5%
10%15%20%25%30%35%40%
President Vice Presidentor other
executive-levelperson
FacilitiesManager
Board ofTrustees
Other
% o
f re
spo
nse
s
Response
To whom does this person(s) report?
Small
Medium
Large
~ 35 ~
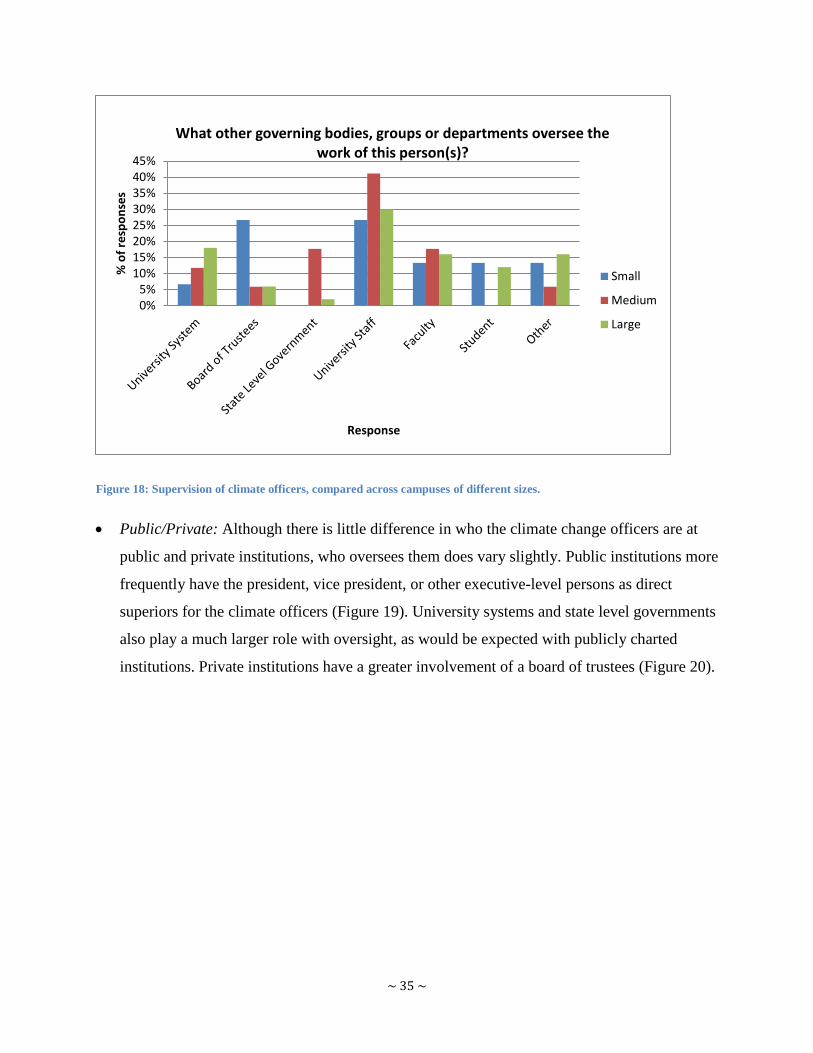
Figure 18: Supervision of climate officers, compared across campuses of different sizes.
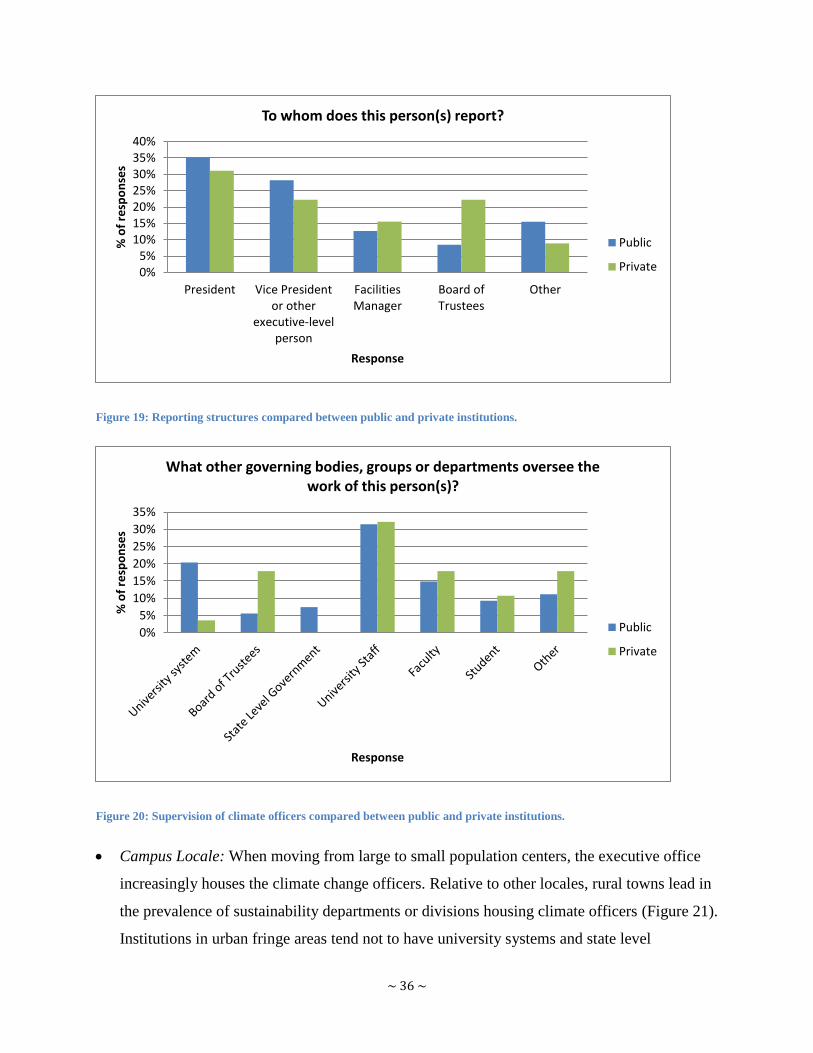
Public/Private: Although there is little difference in who the climate change officers are at
public and private institutions, who oversees them does vary slightly. Public institutions more
frequently have the president, vice president, or other executive-level persons as direct
superiors for the climate officers (Figure 19). University systems and state level governments
also play a much larger role with oversight, as would be expected with publicly charted
institutions. Private institutions have a greater involvement of a board of trustees (Figure 20).
0%5%
10%15%20%25%30%35%40%45%
% o
f re
spo
nse
s
Response
What other governing bodies, groups or departments oversee the work of this person(s)?
Small
Medium
Large
~ 36 ~
Figure 19: Reporting structures compared between public and private institutions.
Figure 20: Supervision of climate officers compared between public and private institutions.
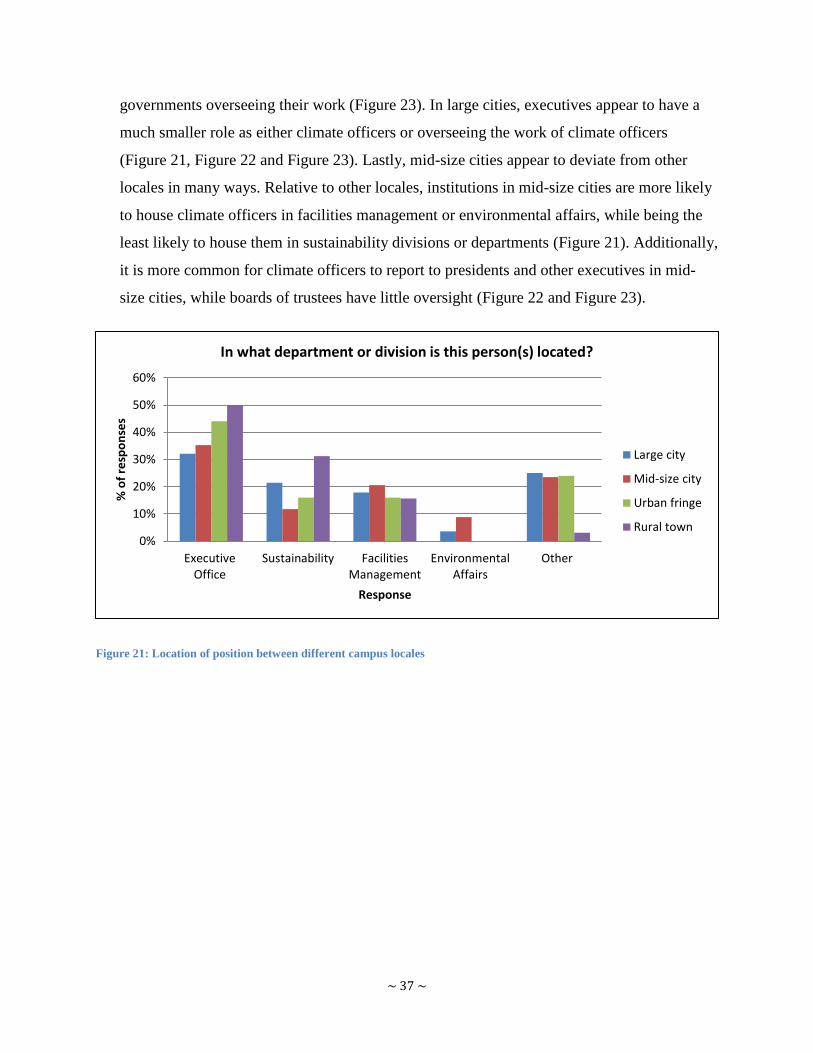
Campus Locale: When moving from large to small population centers, the executive office
increasingly houses the climate change officers. Relative to other locales, rural towns lead in
the prevalence of sustainability departments or divisions housing climate officers (Figure 21).
Institutions in urban fringe areas tend not to have university systems and state level
0%5%
10%15%20%25%30%35%40%
President Vice Presidentor other
executive-levelperson
FacilitiesManager
Board ofTrustees
Other
% o
f re
spo
nse
s
Response
To whom does this person(s) report?
Public
Private
0%
5%
10%
15%
20%
25%
30%
35%
% o
f re
spo
nse
s
Response
What other governing bodies, groups or departments oversee the work of this person(s)?
Public
Private
~ 37 ~
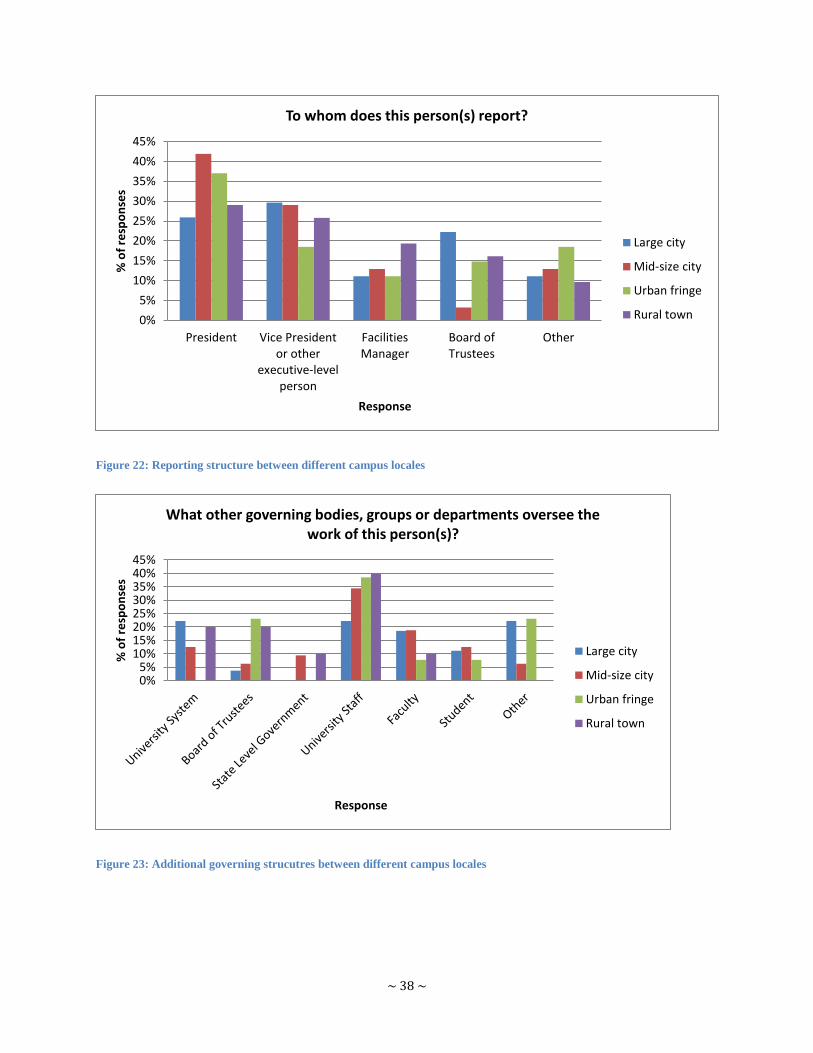
governments overseeing their work (Figure 23). In large cities, executives appear to have a
much smaller role as either climate officers or overseeing the work of climate officers
(Figure 21, Figure 22 and Figure 23). Lastly, mid-size cities appear to deviate from other
locales in many ways. Relative to other locales, institutions in mid-size cities are more likely
to house climate officers in facilities management or environmental affairs, while being the
least likely to house them in sustainability divisions or departments (Figure 21). Additionally,
it is more common for climate officers to report to presidents and other executives in mid-
size cities, while boards of trustees have little oversight (Figure 22 and Figure 23).
Figure 21: Location of position between different campus locales
0%
10%
20%
30%
40%
50%
60%
ExecutiveOffice
Sustainability FacilitiesManagement
EnvironmentalAffairs
Other
% o
f re
spo
nse
s
Response
In what department or division is this person(s) located?
Large city
Mid-size city
Urban fringe
Rural town
~ 38 ~
Figure 22: Reporting structure between different campus locales
Figure 23: Additional governing strucutres between different campus locales
0%
5%
10%
15%
20%
25%
30%
35%
40%
45%
President Vice Presidentor other
executive-levelperson
FacilitiesManager
Board ofTrustees
Other
% o
f re
spo
nse
s
Response
To whom does this person(s) report?
Large city
Mid-size city
Urban fringe
Rural town
0%5%
10%15%20%25%30%35%40%45%
% o
f re
spo
nse
s
Response
What other governing bodies, groups or departments oversee the work of this person(s)?
Large city
Mid-size city
Urban fringe
Rural town
~ 39 ~
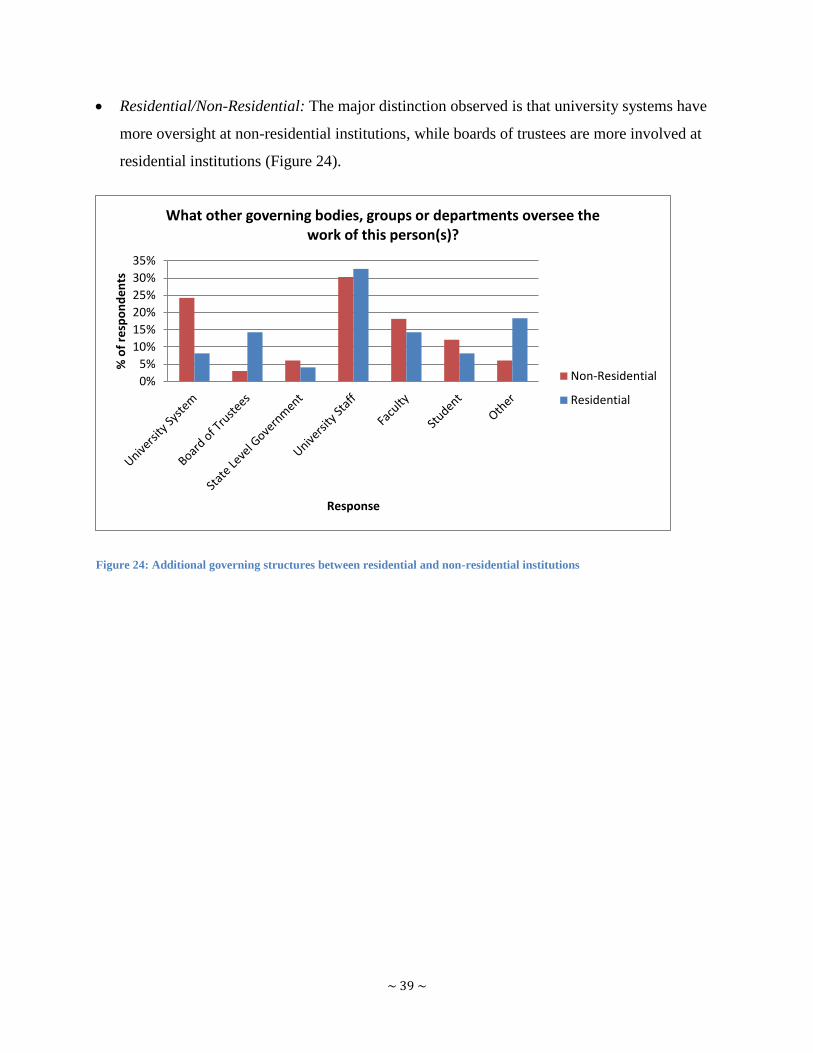
Residential/Non-Residential: The major distinction observed is that university systems have
more oversight at non-residential institutions, while boards of trustees are more involved at
residential institutions (Figure 24).
Figure 24: Additional governing structures between residential and non-residential institutions
0%
5%
10%
15%
20%
25%
30%
35%
% o
f re
spo
nd
en
ts
Response
What other governing bodies, groups or departments oversee the work of this person(s)?
Non-Residential
Residential
~ 40 ~
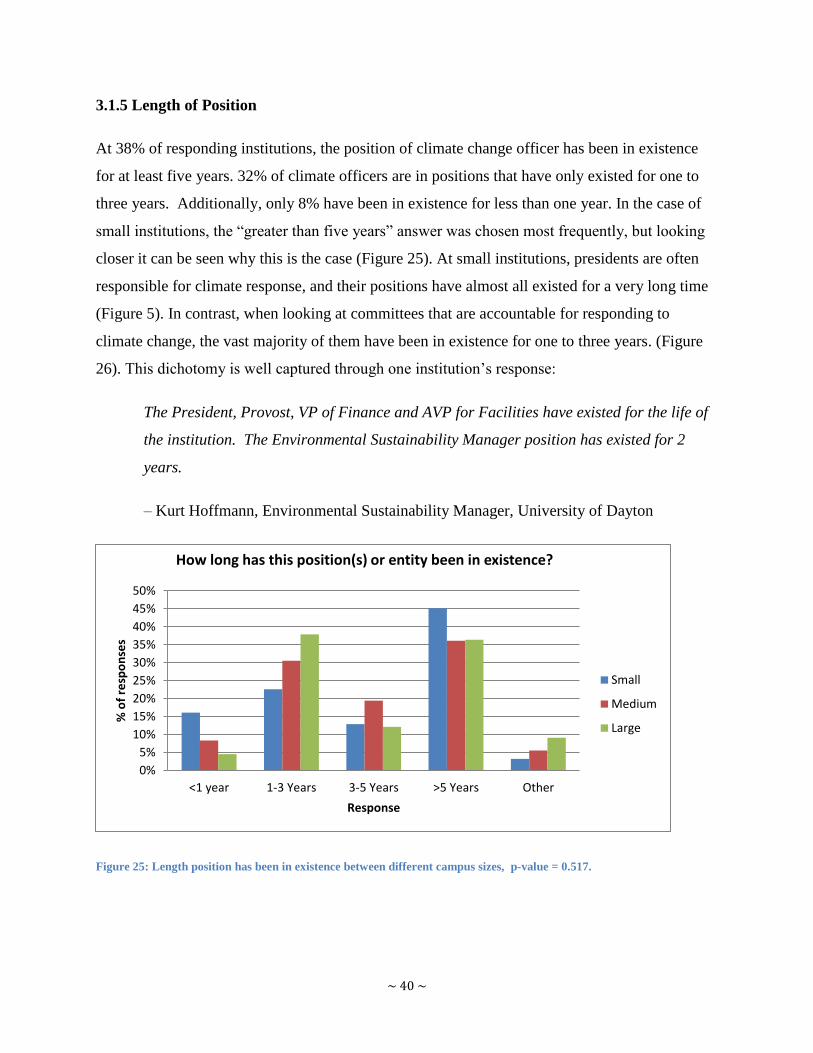
3.1.5 Length of Position
At 38% of responding institutions, the position of climate change officer has been in existence
for at least five years. 32% of climate officers are in positions that have only existed for one to
three years. Additionally, only 8% have been in existence for less than one year. In the case of
small institutions, the ―greater than five years‖ answer was chosen most frequently, but looking
closer it can be seen why this is the case (Figure 25). At small institutions, presidents are often
responsible for climate response, and their positions have almost all existed for a very long time
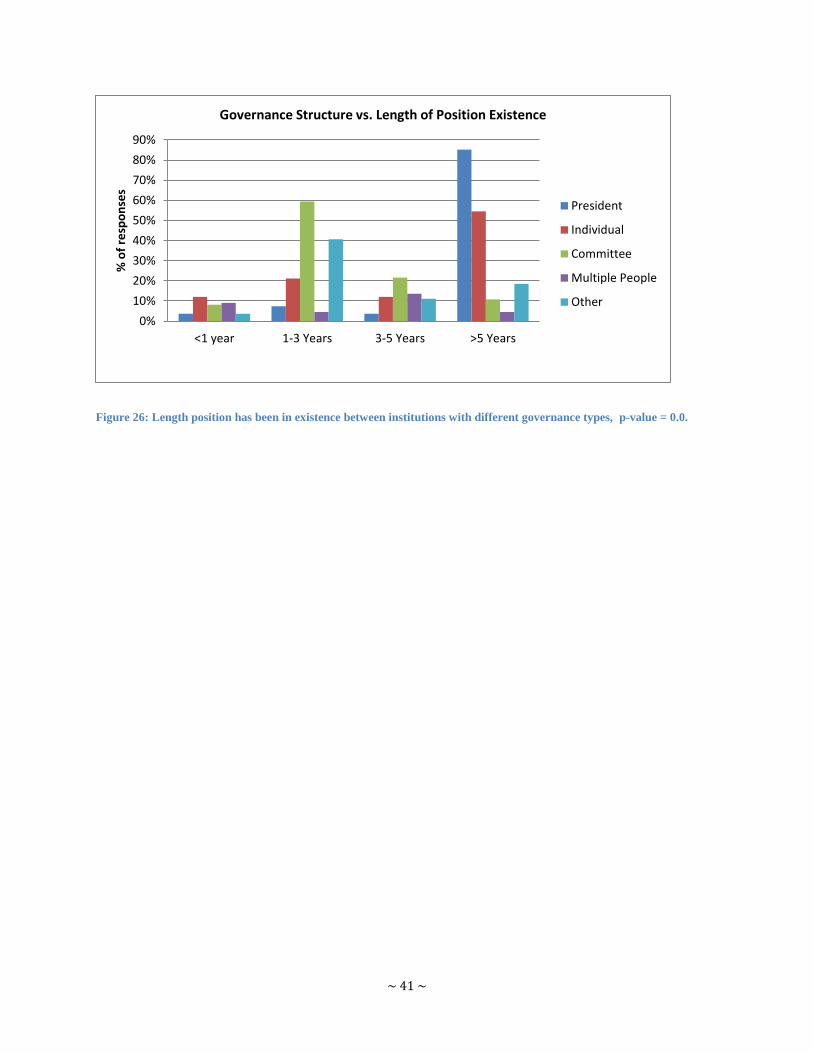
(Figure 5). In contrast, when looking at committees that are accountable for responding to
climate change, the vast majority of them have been in existence for one to three years. (Figure
26). This dichotomy is well captured through one institution‘s response:
The President, Provost, VP of Finance and AVP for Facilities have existed for the life of
the institution. The Environmental Sustainability Manager position has existed for 2
years.
– Kurt Hoffmann, Environmental Sustainability Manager, University of Dayton
Figure 25: Length position has been in existence between different campus sizes, p-value = 0.517.
0%
5%
10%
15%
20%
25%
30%
35%
40%
45%
50%
<1 year 1-3 Years 3-5 Years >5 Years Other
% o
f re
spo
nse
s
Response
How long has this position(s) or entity been in existence?
Small
Medium
Large
~ 41 ~
Figure 26: Length position has been in existence between institutions with different governance types, p-value = 0.0.
0%
10%
20%
30%
40%
50%
60%
70%
80%
90%
<1 year 1-3 Years 3-5 Years >5 Years
% o
f re
spo
nse
s Governance Structure vs. Length of Position Existence
President
Individual
Committee
Multiple People
Other
~ 42 ~
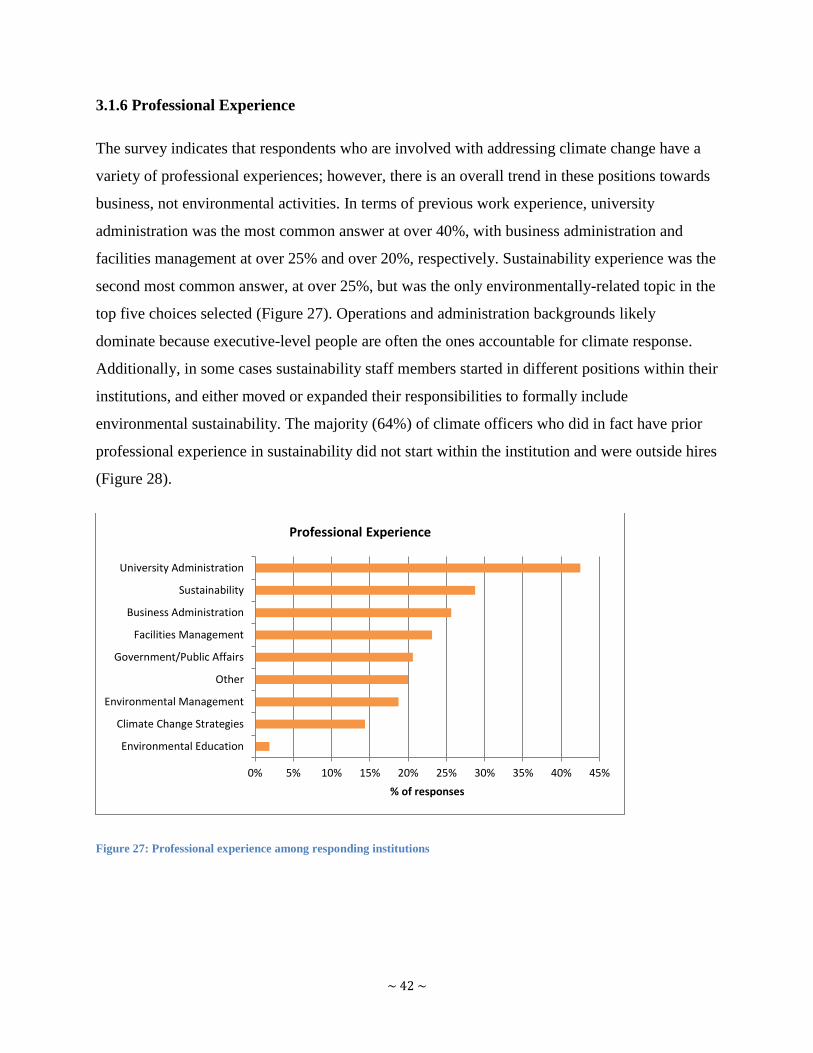
3.1.6 Professional Experience
The survey indicates that respondents who are involved with addressing climate change have a
variety of professional experiences; however, there is an overall trend in these positions towards
business, not environmental activities. In terms of previous work experience, university
administration was the most common answer at over 40%, with business administration and
facilities management at over 25% and over 20%, respectively. Sustainability experience was the
second most common answer, at over 25%, but was the only environmentally-related topic in the
top five choices selected (Figure 27). Operations and administration backgrounds likely
dominate because executive-level people are often the ones accountable for climate response.
Additionally, in some cases sustainability staff members started in different positions within their
institutions, and either moved or expanded their responsibilities to formally include
environmental sustainability. The majority (64%) of climate officers who did in fact have prior
professional experience in sustainability did not start within the institution and were outside hires
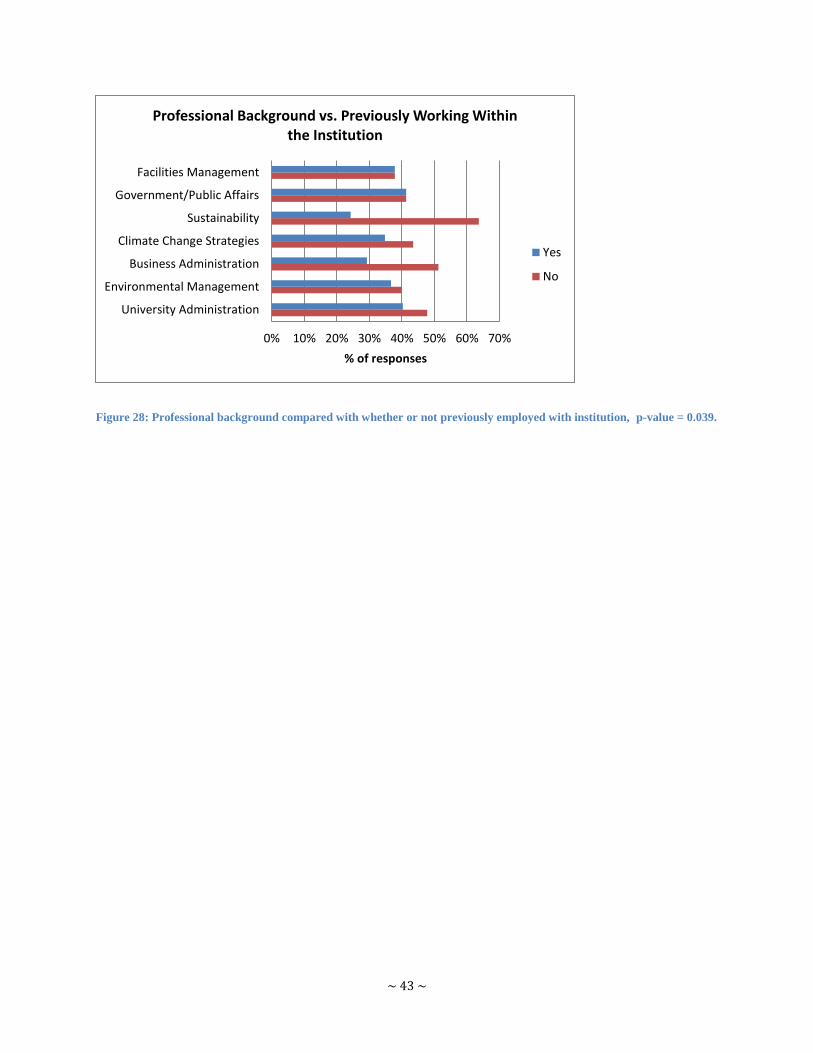
(Figure 28).
Figure 27: Professional experience among responding institutions
0% 5% 10% 15% 20% 25% 30% 35% 40% 45%
Environmental Education
Climate Change Strategies
Environmental Management
Other
Government/Public Affairs
Facilities Management
Business Administration
Sustainability
University Administration
% of responses
Professional Experience
~ 43 ~
Figure 28: Professional background compared with whether or not previously employed with institution, p-value = 0.039.
0% 10% 20% 30% 40% 50% 60% 70%
University Administration
Environmental Management
Business Administration
Climate Change Strategies
Sustainability
Government/Public Affairs
Facilities Management
% of responses
Professional Background vs. Previously Working Within the Institution
Yes
No
~ 44 ~
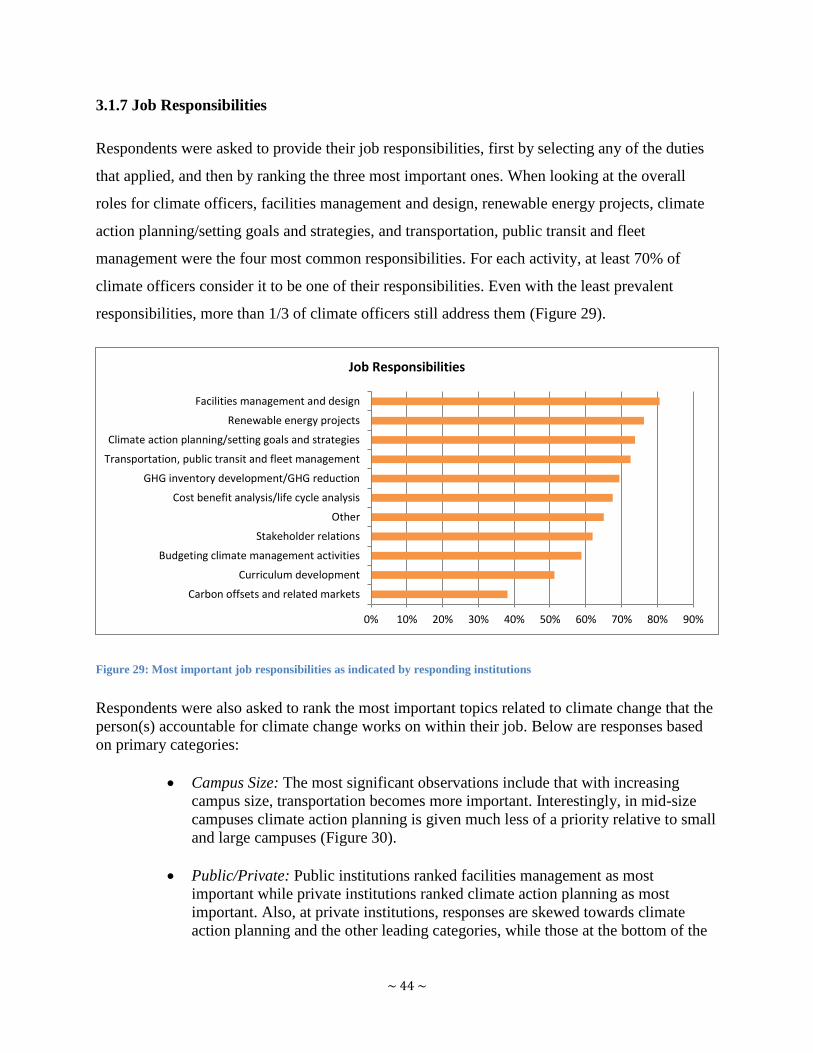
3.1.7 Job Responsibilities
Respondents were asked to provide their job responsibilities, first by selecting any of the duties
that applied, and then by ranking the three most important ones. When looking at the overall
roles for climate officers, facilities management and design, renewable energy projects, climate
action planning/setting goals and strategies, and transportation, public transit and fleet
management were the four most common responsibilities. For each activity, at least 70% of
climate officers consider it to be one of their responsibilities. Even with the least prevalent
responsibilities, more than 1/3 of climate officers still address them (Figure 29).
Figure 29: Most important job responsibilities as indicated by responding institutions
Respondents were also asked to rank the most important topics related to climate change that the
person(s) accountable for climate change works on within their job. Below are responses based
on primary categories:
Campus Size: The most significant observations include that with increasing
campus size, transportation becomes more important. Interestingly, in mid-size
campuses climate action planning is given much less of a priority relative to small
and large campuses (Figure 30).
Public/Private: Public institutions ranked facilities management as most
important while private institutions ranked climate action planning as most
important. Also, at private institutions, responses are skewed towards climate
action planning and the other leading categories, while those at the bottom of the
0% 10% 20% 30% 40% 50% 60% 70% 80% 90%
Carbon offsets and related markets
Curriculum development
Budgeting climate management activities
Stakeholder relations
Other
Cost benefit analysis/life cycle analysis
GHG inventory development/GHG reduction
Transportation, public transit and fleet management
Climate action planning/setting goals and strategies
Renewable energy projects
Facilities management and design
Job Responsibilities
~ 45 ~
list have very little prevalence in the top three rankings. Public institutions have a
more balanced distribution among categories (Figure 31 and Figure 32).
Locale: The rural town setting appears to vary the most from the other locales.
Rather than having climate action planning and facilities management design as
the top two responsibilities, these institutions have GHG inventory, budgeting
climate management activities, and stakeholder relations as the top three (Figure
33 and Figure 34).
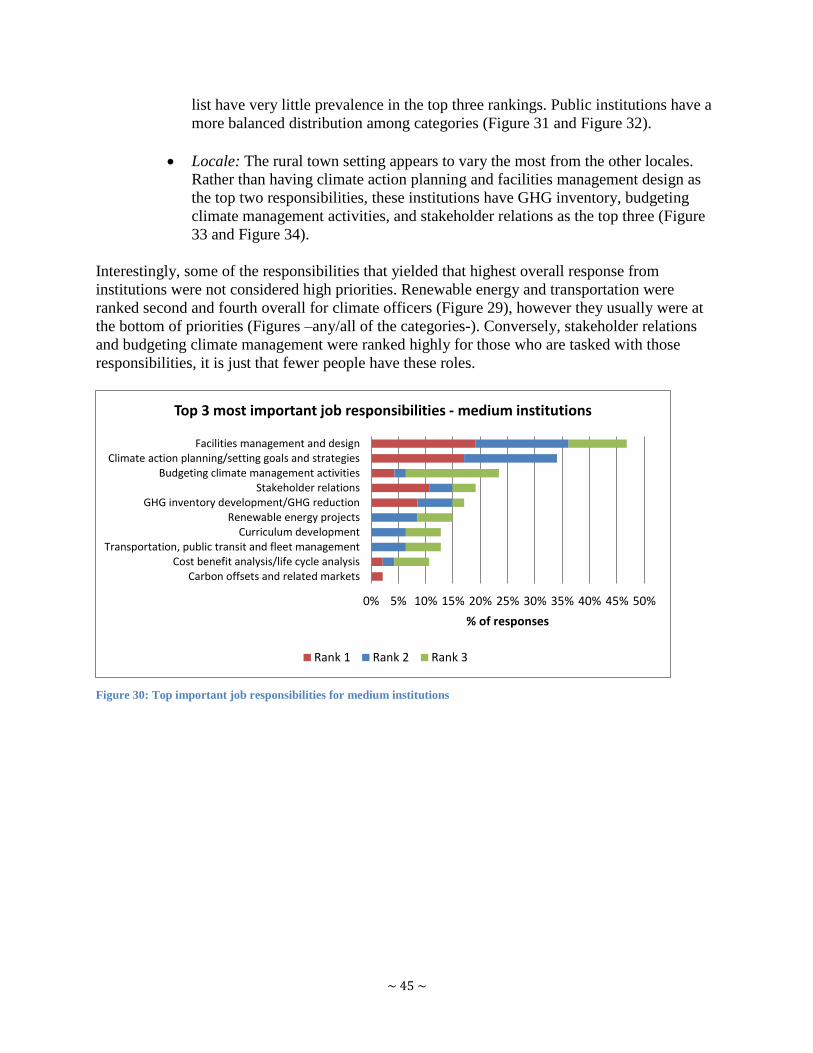
Interestingly, some of the responsibilities that yielded that highest overall response from
institutions were not considered high priorities. Renewable energy and transportation were
ranked second and fourth overall for climate officers (Figure 29), however they usually were at
the bottom of priorities (Figures –any/all of the categories-). Conversely, stakeholder relations
and budgeting climate management were ranked highly for those who are tasked with those
responsibilities, it is just that fewer people have these roles.
Figure 30: Top important job responsibilities for medium institutions
0% 5% 10% 15% 20% 25% 30% 35% 40% 45% 50%
Carbon offsets and related marketsCost benefit analysis/life cycle analysis
Transportation, public transit and fleet managementCurriculum development
Renewable energy projectsGHG inventory development/GHG reduction
Stakeholder relationsBudgeting climate management activities
Climate action planning/setting goals and strategiesFacilities management and design
% of responses
Top 3 most important job responsibilities - medium institutions
Rank 1 Rank 2 Rank 3

~ 46 ~
Figure 31: Top important job responsibilities for public institutions
Figure 32: Top important job responsibilities for private institutions
0% 10% 20% 30% 40% 50% 60%
Carbon offsets and related marketsTransportation, public transit and fleet management
Curriculum developmentCost benefit analysis/life cycle analysis
Stakeholder relationsRenewable energy projects
GHG inventory development/GHG reductionBudgeting climate management activities
Climate action planning/setting goals and strategiesFacilities management and design
% of responses
Top 3 most important job responsibilities - public institutions
Rank 1 Rank 2 Rank 3
0% 10% 20% 30% 40% 50% 60%
Carbon offsets and related marketsTransportation, public transit and fleet management
Curriculum developmentRenewable energy projects
Stakeholder relationsCost benefit analysis/life cycle analysis
Budgeting climate management activitiesGHG inventory development/GHG reduction
Facilities management and designClimate action planning/setting goals and strategies
% of responses
Top 3 most important job responsibilities - private institutions
Rank 1 Rank 2 Rank 3

~ 47 ~
Figure 33: Top important job responsibilities for rural institutions
Figure 34: Top important job responsibilities for large city institutions
0% 5% 10% 15% 20% 25% 30% 35% 40% 45%
Carbon offsets and related marketsTransportation, public transit and fleet management
Renewable energy projectsFacilities management and design
Climate action planning/setting goals and strategiesCost benefit analysis/life cycle analysis
Curriculum developmentStakeholder relations
Budgeting climate management activitiesGHG inventory development/GHG reduction
% of responses
Top 3 most important job responsibilities - rural town institutions
Rank 1 Rank 2 Rank 3
0% 10% 20% 30% 40% 50% 60%
Carbon offsets and related marketsRenewable energy projects
Transportation, public transit and fleet managementCurriculum development
Stakeholder relationsCost benefit analysis/life cycle analysis
Budgeting climate management activitiesGHG inventory development/GHG reduction
Facilities management and designClimate action planning/setting goals and strategies
% of responses
Top 3 most important job responsibilities - large city institutions
Rank 1 Rank 2 Rank 3
~ 48 ~
3.1.8 Training
Of the survey respondents, 90% indicated that there was no training requirement in their
position. Only one person wrote that CSA climate change inventory training was required for the
job. (CSA Standards is respected worldwide as a leader in standards development and has been
instrumental in developing international environmental and carbon management standards). It
appears part of this lack of required training comes from the belief that climate officers are
already well qualified, as illustrated by the quotes below.
The president of our college has been a national leader regarding climate action issues
and programs.
–Craig Ten Broeck, Consulting Advisor for Sustainability, College of the Atlantic
No, our institution does not require additional training. Our Chancellor is on the Board
of Directors of AASHE and the Steering Committee of ACUPCC. Our Vice Chancellor of
Finance and Facilities is on the Higher Education Committee of the American Council
on Renewable Energy. At Morris, our top administrative staff is helping create climate
change policy and action.
–Troy Goodnough, Sustainability Coordinator, University of Minnesota-Morris
Among respondents who said that training had been sought, but was not required, the main types
of training were: self-studying, attending conferences (ASHEE annual conference and local
conferences) and various workshops seminar, webinar and training opportunities funded by the
institution. One institution even wrote in the job description that additional training was an
employee benefit.
With regard to specific governance structures, presidents who are accountable for climate
response are not required to participate in training related to climate, but about 50% have sought
training on their own. Similarly, at least 50% of the individuals or groups within the other
governance classifications have also sought additional training despite it not being required
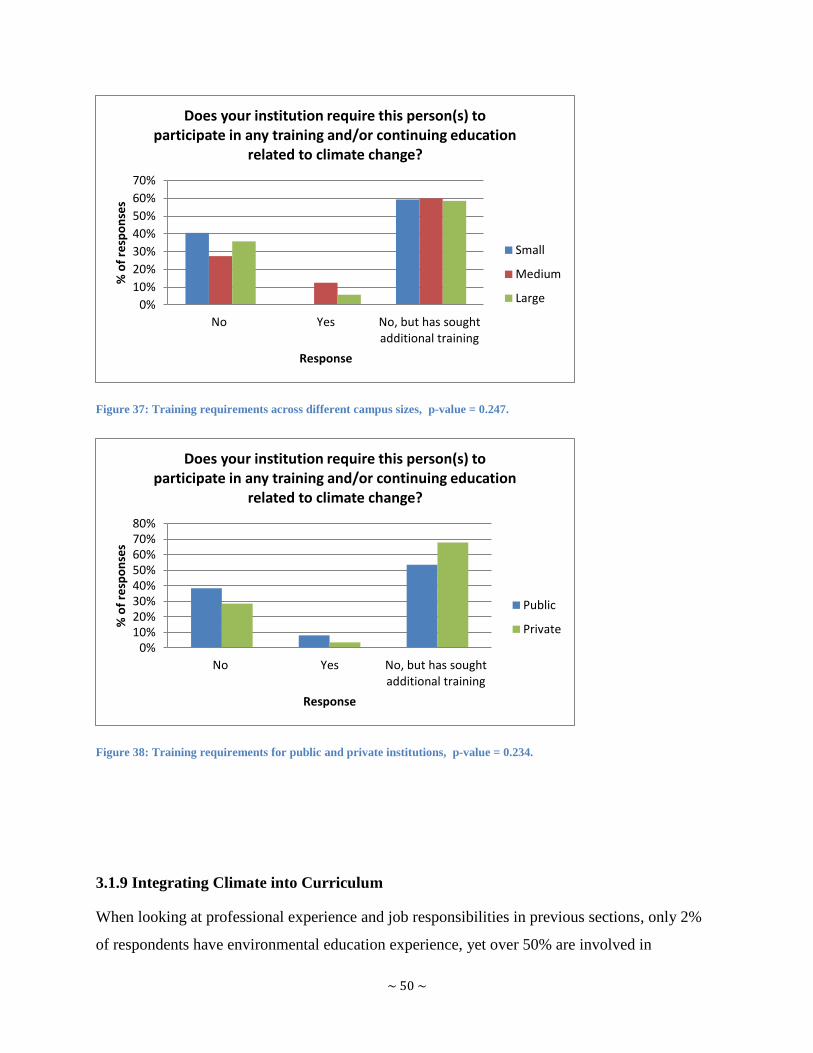
(Figure 35). Looking across the primary demographic categories, institutions that are either in an
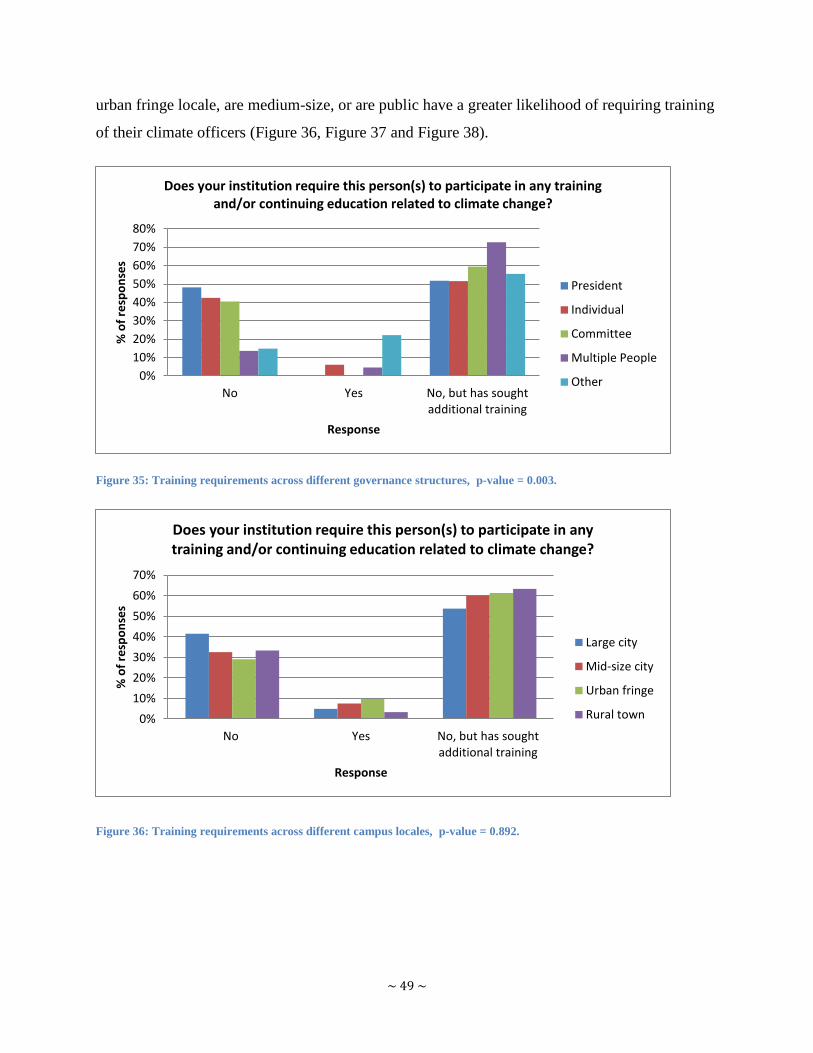
~ 49 ~
urban fringe locale, are medium-size, or are public have a greater likelihood of requiring training
of their climate officers (Figure 36, Figure 37 and Figure 38).
Figure 35: Training requirements across different governance structures, p-value = 0.003.
Figure 36: Training requirements across different campus locales, p-value = 0.892.
0%
10%
20%
30%
40%
50%
60%
70%
80%
No Yes No, but has soughtadditional training
% o
f re
spo
nse
s
Response
Does your institution require this person(s) to participate in any training and/or continuing education related to climate change?
President
Individual
Committee
Multiple People
Other
0%
10%
20%
30%
40%
50%
60%
70%
No Yes No, but has soughtadditional training
% o
f re
spo
nse
s
Response
Does your institution require this person(s) to participate in any training and/or continuing education related to climate change?
Large city
Mid-size city
Urban fringe
Rural town
~ 50 ~
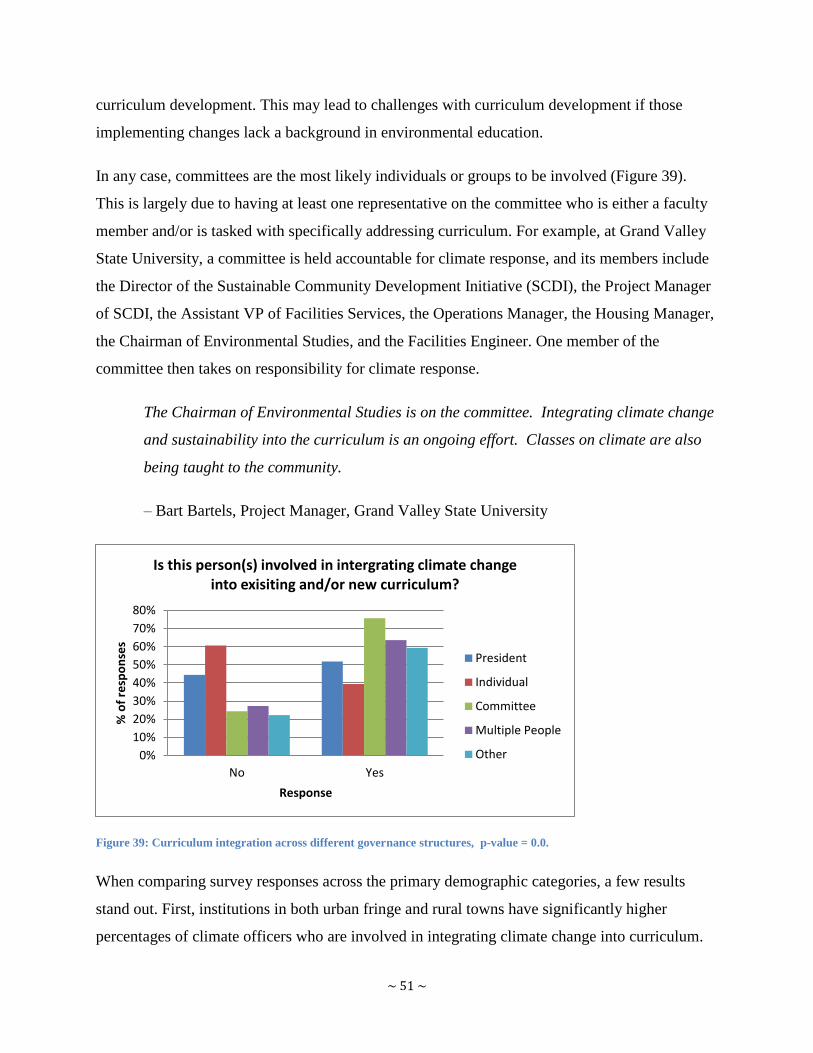
Figure 37: Training requirements across different campus sizes, p-value = 0.247.
Figure 38: Training requirements for public and private institutions, p-value = 0.234.
3.1.9 Integrating Climate into Curriculum
When looking at professional experience and job responsibilities in previous sections, only 2%
of respondents have environmental education experience, yet over 50% are involved in
0%
10%
20%
30%
40%
50%
60%
70%
No Yes No, but has soughtadditional training
% o
f re
spo
nse
s
Response
Does your institution require this person(s) to participate in any training and/or continuing education
related to climate change?
Small
Medium
Large
0%10%20%30%40%50%60%70%80%
No Yes No, but has soughtadditional training
% o
f re
spo
nse
s
Response
Does your institution require this person(s) to participate in any training and/or continuing education
related to climate change?
Public
Private
~ 51 ~
curriculum development. This may lead to challenges with curriculum development if those
implementing changes lack a background in environmental education.
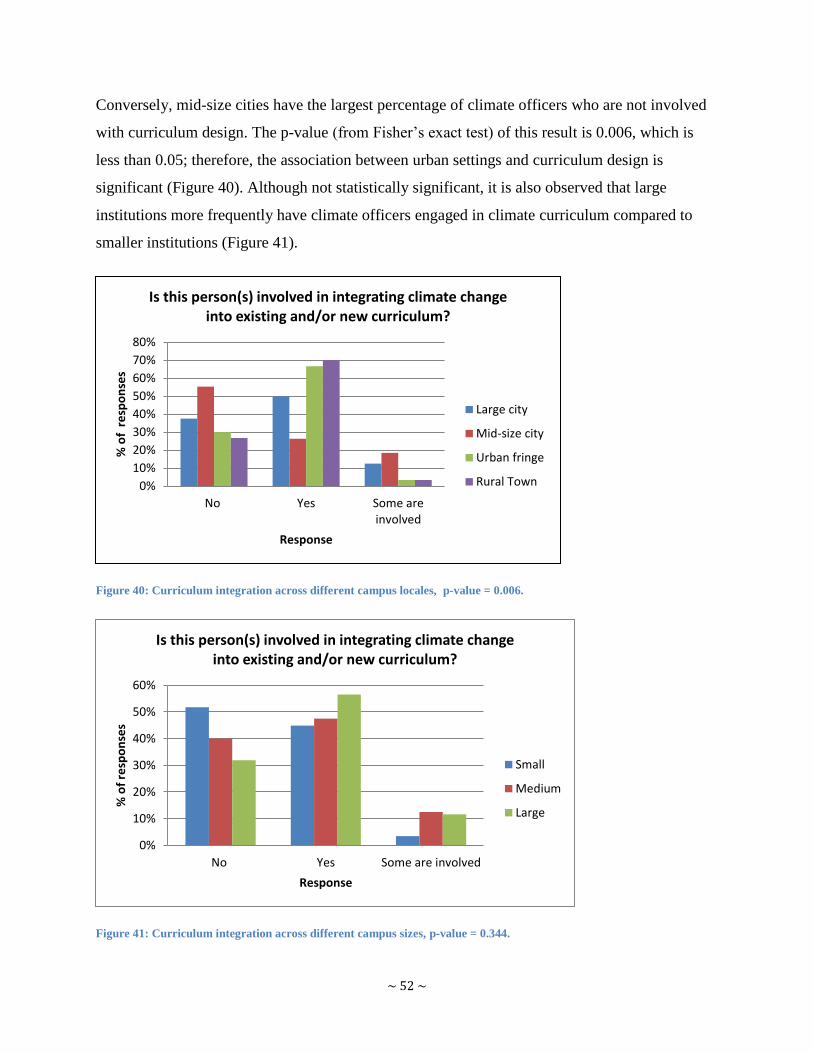
In any case, committees are the most likely individuals or groups to be involved (Figure 39).
This is largely due to having at least one representative on the committee who is either a faculty
member and/or is tasked with specifically addressing curriculum. For example, at Grand Valley
State University, a committee is held accountable for climate response, and its members include
the Director of the Sustainable Community Development Initiative (SCDI), the Project Manager
of SCDI, the Assistant VP of Facilities Services, the Operations Manager, the Housing Manager,
the Chairman of Environmental Studies, and the Facilities Engineer. One member of the
committee then takes on responsibility for climate response.
The Chairman of Environmental Studies is on the committee. Integrating climate change
and sustainability into the curriculum is an ongoing effort. Classes on climate are also
being taught to the community.
– Bart Bartels, Project Manager, Grand Valley State University
Figure 39: Curriculum integration across different governance structures, p-value = 0.0.
When comparing survey responses across the primary demographic categories, a few results
stand out. First, institutions in both urban fringe and rural towns have significantly higher
percentages of climate officers who are involved in integrating climate change into curriculum.
0%
10%
20%
30%
40%
50%
60%
70%
80%
No Yes
% o
f re
spo
nse
s
Response
Is this person(s) involved in intergrating climate change into exisiting and/or new curriculum?
President
Individual
Committee
Multiple People
Other
~ 52 ~
Conversely, mid-size cities have the largest percentage of climate officers who are not involved
with curriculum design. The p-value (from Fisher‘s exact test) of this result is 0.006, which is
less than 0.05; therefore, the association between urban settings and curriculum design is
significant (Figure 40). Although not statistically significant, it is also observed that large
institutions more frequently have climate officers engaged in climate curriculum compared to
smaller institutions (Figure 41).
Figure 40: Curriculum integration across different campus locales, p-value = 0.006.
Figure 41: Curriculum integration across different campus sizes, p-value = 0.344.
0%
10%
20%
30%
40%
50%
60%
70%
80%
No Yes Some areinvolved
% o
f r
esp
on
ses
Response
Is this person(s) involved in integrating climate change into existing and/or new curriculum?
Large city
Mid-size city
Urban fringe
Rural Town
0%
10%
20%
30%
40%
50%
60%
No Yes Some are involved
% o
f re
spo
nse
s
Response
Is this person(s) involved in integrating climate change into existing and/or new curriculum?
Small
Medium
Large
~ 53 ~
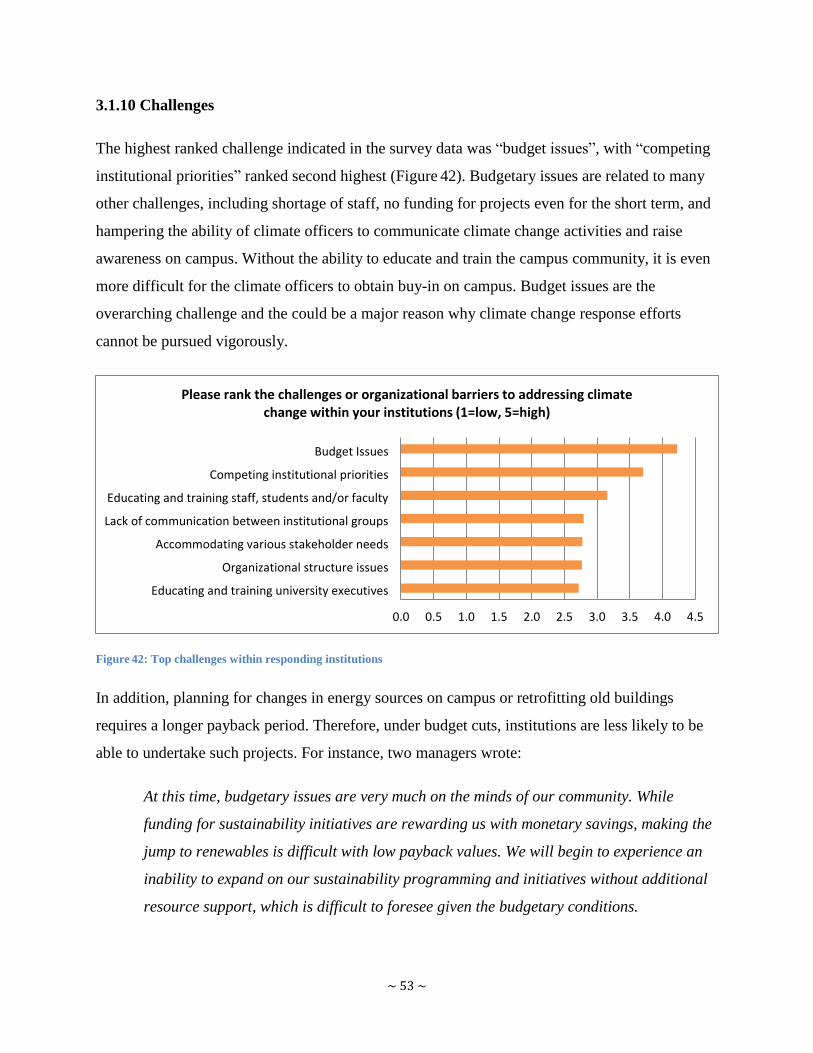
3.1.10 Challenges
The highest ranked challenge indicated in the survey data was ―budget issues‖, with ―competing
institutional priorities‖ ranked second highest (Figure 42). Budgetary issues are related to many
other challenges, including shortage of staff, no funding for projects even for the short term, and
hampering the ability of climate officers to communicate climate change activities and raise
awareness on campus. Without the ability to educate and train the campus community, it is even
more difficult for the climate officers to obtain buy-in on campus. Budget issues are the
overarching challenge and the could be a major reason why climate change response efforts
cannot be pursued vigorously.
Figure 42: Top challenges within responding institutions
In addition, planning for changes in energy sources on campus or retrofitting old buildings
requires a longer payback period. Therefore, under budget cuts, institutions are less likely to be
able to undertake such projects. For instance, two managers wrote:
At this time, budgetary issues are very much on the minds of our community. While
funding for sustainability initiatives are rewarding us with monetary savings, making the
jump to renewables is difficult with low payback values. We will begin to experience an
inability to expand on our sustainability programming and initiatives without additional
resource support, which is difficult to foresee given the budgetary conditions.
0.0 0.5 1.0 1.5 2.0 2.5 3.0 3.5 4.0 4.5
Educating and training university executives
Organizational structure issues
Accommodating various stakeholder needs
Lack of communication between institutional groups
Educating and training staff, students and/or faculty
Competing institutional priorities
Budget Issues
Please rank the challenges or organizational barriers to addressing climate change within your institutions (1=low, 5=high)
~ 54 ~
- Mary Ellen Mallia, Director of Environmental Sustainability, SUNY at Albany
Integrating sustainability into the day-to-day operational, educational and strategic
planning activities of the university is a major goal of our team, but is also a very
resource consuming task. Budget constraints are the biggest concern right now, given the
state budget cuts that continue to roll down to the university. Because there are so many
different organizations on campus, with very specific independent goals, it is a challenge
to get everyone to agree on one over-arching goal. We are getting closer to this as we
spend more time in front of the various offices and organizations on campus and the see
the positive results of the things we are trying to lead, including the positive response
from our student body.
- Angela Rolufs, Director, Institute for Environmental Excellence, Missouri University of
Science and Technology
Five institutions detailed their struggle with having limited power to decide where to purchase
electricity. These institutions have little control over the generation process for the electricity,
and little to no control over the extent of greenhouse gases produced during the generation.
A similar suite of issues is found in all kinds of procurement processes on campus. One
institution in particular mentioned that campus procurement traditionally favors lower priced
bids; therefore, to purchase green products, the green product must also have the lowest price,
which may not always be the case.
Besides budgetary issues, many institutions also mentioned lack of campus buy-in, especially
from the higher level decision makers, as a significant challenge. If sustainability is not the core
value of the campus, and climate change is not on the priority list of the decision makers,
sustainability staff and climate change officers will have much more work to do to move forward
to address climate change issues.
In addition, organizational structure can become a challenge if there are too many layers of
management between the campus sustainability manager and the decision maker. For many
institutions, the current approach, which is predominantly "bottom up‖, has inherent limitations.
Also of note is that the average institutional responses for ―organizational structure issues‖ and
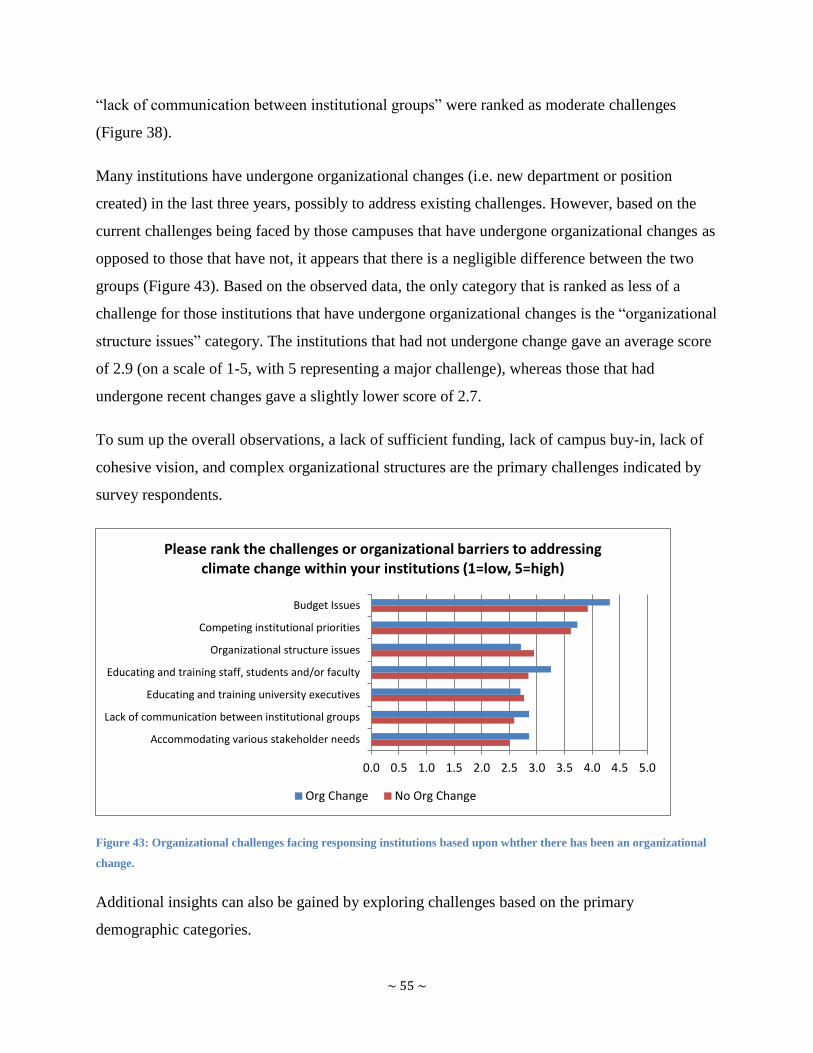
~ 55 ~
―lack of communication between institutional groups‖ were ranked as moderate challenges
(Figure 38).
Many institutions have undergone organizational changes (i.e. new department or position
created) in the last three years, possibly to address existing challenges. However, based on the
current challenges being faced by those campuses that have undergone organizational changes as
opposed to those that have not, it appears that there is a negligible difference between the two
groups (Figure 43). Based on the observed data, the only category that is ranked as less of a
challenge for those institutions that have undergone organizational changes is the ―organizational
structure issues‖ category. The institutions that had not undergone change gave an average score
of 2.9 (on a scale of 1-5, with 5 representing a major challenge), whereas those that had
undergone recent changes gave a slightly lower score of 2.7.
To sum up the overall observations, a lack of sufficient funding, lack of campus buy-in, lack of
cohesive vision, and complex organizational structures are the primary challenges indicated by
survey respondents.
Figure 43: Organizational challenges facing responsing institutions based upon whther there has been an organizational
change.
Additional insights can also be gained by exploring challenges based on the primary
demographic categories.
0.0 0.5 1.0 1.5 2.0 2.5 3.0 3.5 4.0 4.5 5.0
Accommodating various stakeholder needs
Lack of communication between institutional groups
Educating and training university executives
Educating and training staff, students and/or faculty
Organizational structure issues
Competing institutional priorities
Budget Issues
Please rank the challenges or organizational barriers to addressing climate change within your institutions (1=low, 5=high)
Org Change No Org Change
~ 56 ~
Campus Size: Medium-size campuses ranked each challenge (except ―other‖) as being a
greater obstacle compared to small and large campuses (Figure 44).
Public/Private: Budgetary issues, educating and training staff, students, and/or faculty, and
educating and training university executives are observed to be a greater challenge at public
institutions (Figure 45).
Residential/Non-Residential: For all challenges listed in the survey, residential institutions
considered them to be greater obstacles compared to non-residential institutions (Figure 46).
Campus Locale: Budgetary issues are, on average, a greater challenge for campuses in rural
areas. "Educating and training the campus population, including executives, staff, students,
and/or faculty", and "accommodating various stakeholder needs" is a more difficult challenge
at rural campuses as well. On the other hand, competing institutional priorities and
organizational structure issues are greater challenges at institutions in large cities (Figure 47).
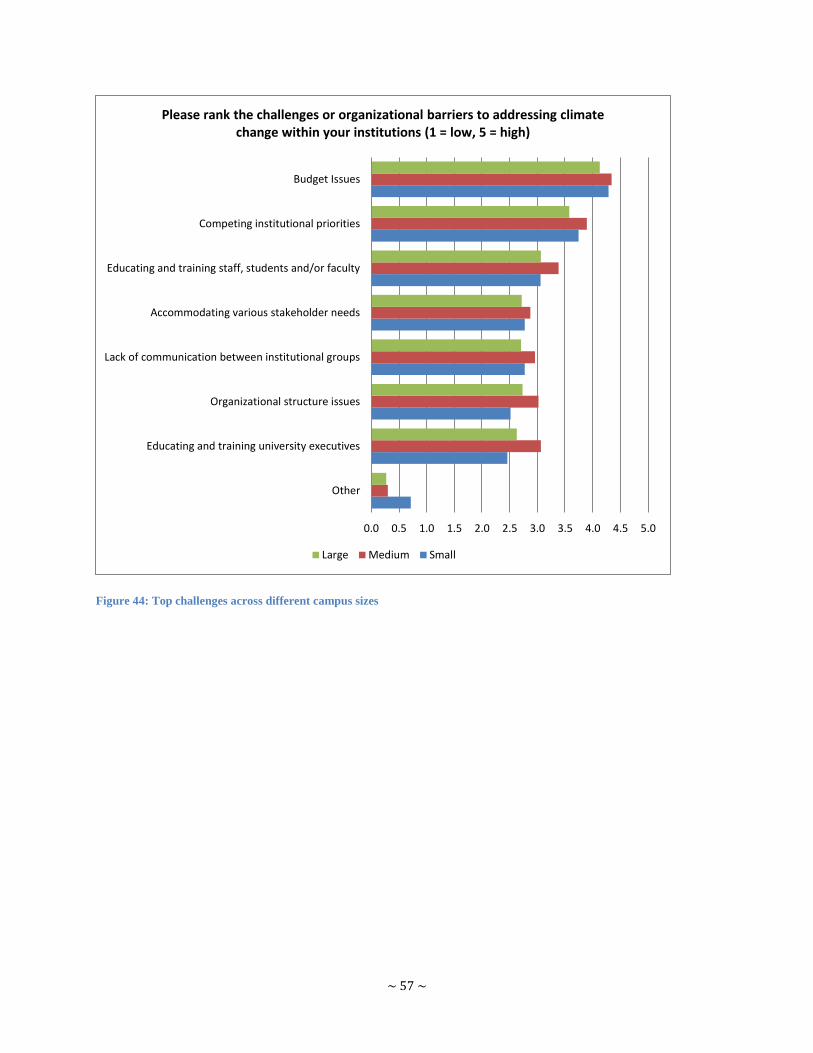
~ 57 ~
Figure 44: Top challenges across different campus sizes
0.0 0.5 1.0 1.5 2.0 2.5 3.0 3.5 4.0 4.5 5.0
Other
Educating and training university executives
Organizational structure issues
Lack of communication between institutional groups
Accommodating various stakeholder needs
Educating and training staff, students and/or faculty
Competing institutional priorities
Budget Issues
Please rank the challenges or organizational barriers to addressing climate change within your institutions (1 = low, 5 = high)
Large Medium Small
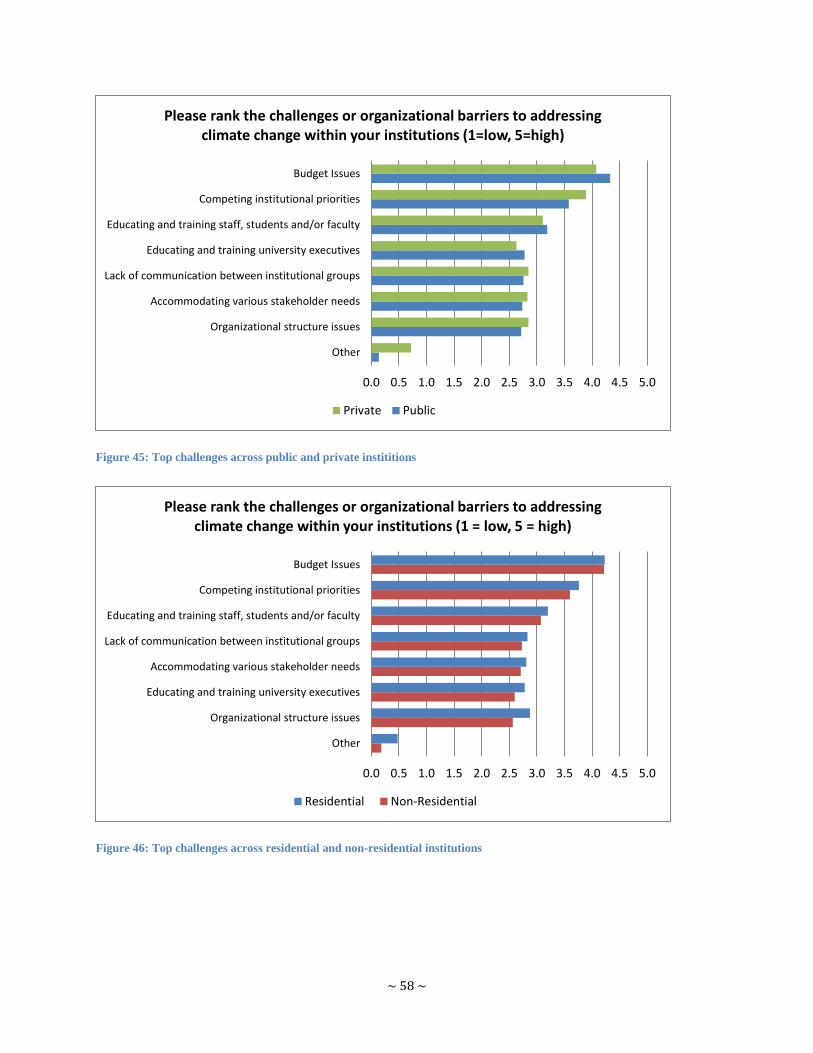
~ 58 ~
Figure 45: Top challenges across public and private instititions
Figure 46: Top challenges across residential and non-residential institutions
0.0 0.5 1.0 1.5 2.0 2.5 3.0 3.5 4.0 4.5 5.0
Other
Organizational structure issues
Accommodating various stakeholder needs
Lack of communication between institutional groups
Educating and training university executives
Educating and training staff, students and/or faculty
Competing institutional priorities
Budget Issues
Please rank the challenges or organizational barriers to addressing climate change within your institutions (1=low, 5=high)
Private Public
0.0 0.5 1.0 1.5 2.0 2.5 3.0 3.5 4.0 4.5 5.0
Other
Organizational structure issues
Educating and training university executives
Accommodating various stakeholder needs
Lack of communication between institutional groups
Educating and training staff, students and/or faculty
Competing institutional priorities
Budget Issues
Please rank the challenges or organizational barriers to addressing climate change within your institutions (1 = low, 5 = high)
Residential Non-Residential
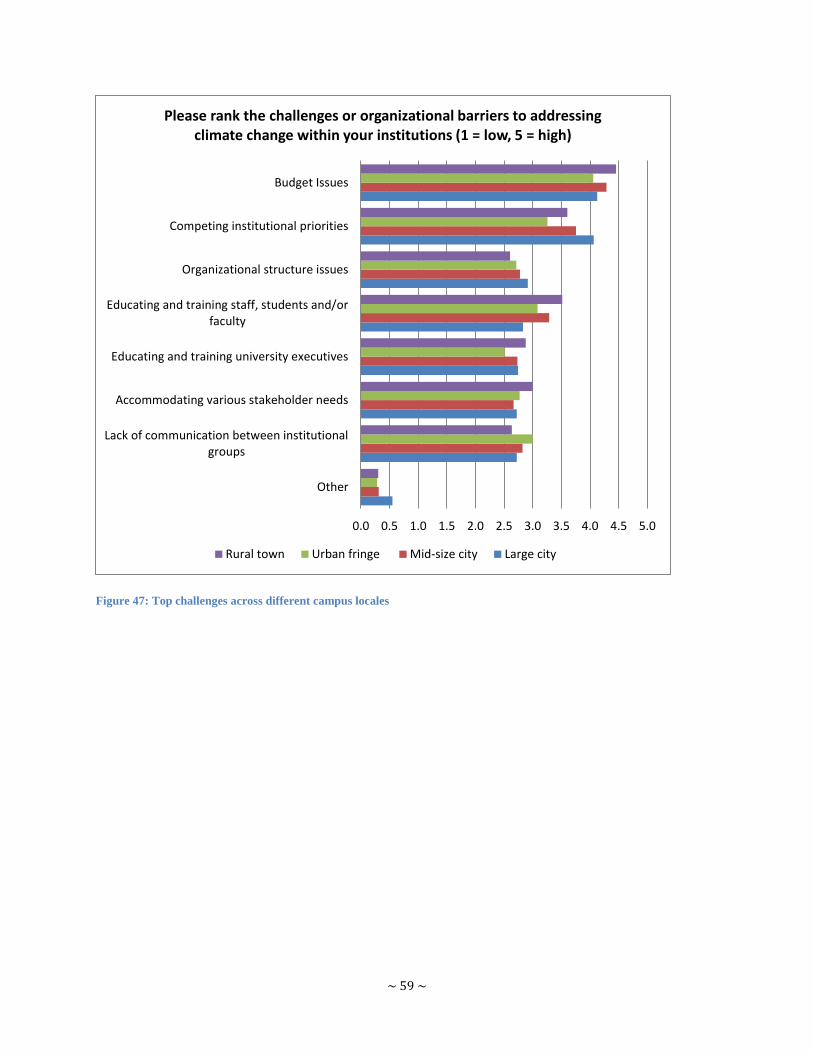
~ 59 ~
Figure 47: Top challenges across different campus locales
0.0 0.5 1.0 1.5 2.0 2.5 3.0 3.5 4.0 4.5 5.0
Other
Lack of communication between institutionalgroups
Accommodating various stakeholder needs
Educating and training university executives
Educating and training staff, students and/orfaculty
Organizational structure issues
Competing institutional priorities
Budget Issues
Please rank the challenges or organizational barriers to addressing climate change within your institutions (1 = low, 5 = high)
Rural town Urban fringe Mid-size city Large city

~ 60 ~
3.1.11 Budgetary Authority
Despite the fact that the greatest challenge identified was budget, more than half of all
respondents have budgetary authority. This was consistent across the primary demographic
categories, with the exception of institutions in large cities. These institutions appear to have less
budgetary authority on average. (Figure 48). Examining the data more closely, it appears that one
of the key differences is based on which people or groups are the climate officers. Based on the
survey responses, 93% of presidents have budgetary authority while 65% of committees do not.
(Figure 49).
Figure 48: Budgetary authority across different campus locales, p-value = 0.535.
0%10%20%30%40%50%60%70%80%
No Yes Some haveauthority, some
do not
% o
f re
spo
nse
s
Response
Does this person(s) have budgetary authority over implementation of climate strategies?
Large city
Mid-size city
Urban fringe
Rural town
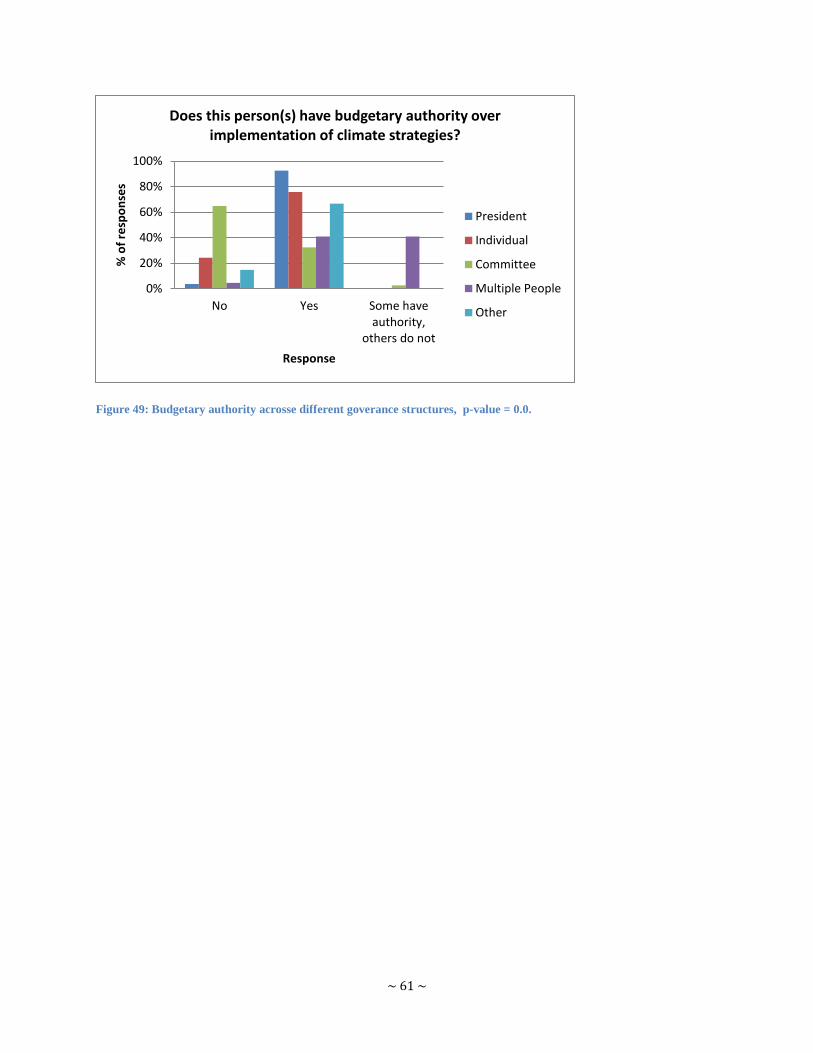
~ 61 ~
Figure 49: Budgetary authority acrosse different goverance structures, p-value = 0.0.
0%
20%
40%
60%
80%
100%
No Yes Some haveauthority,
others do not
% o
f re
spo
nse
s
Response
Does this person(s) have budgetary authority over implementation of climate strategies?
President
Individual
Committee
Multiple People
Other
~ 62 ~
3.3 Customized Climate Strategies
Many factors can drive how an institution addresses climate change, such as geographic location,
state or provincial policies, campus size, and/or facilities. The four primary categories used in
this report represent some of these major drivers.
The 160 survey respondents represent a broad spectrum of institutions within many of the
categories described. For example, institutions across the United States and Canada took part in
the survey, which brings into play the effects of different statewide and regional policies.
Additionally, the person(s) who are accountable for addressing the economic, operational and
environmental implications of climate change are distributed among executives, committees,
staff, and other entities. Although some individual attributes are shared, taken collectively and
with all of the different factors combined, very few, if any, institutions operate in the same way,
experience the exact same challenges, and have the same opportunities for addressing climate.
Previous sections have discussed apparent trends that exist across primary demographic
categories based on survey responses. However, even when these core dimensions are removed,
it still appears that campuses are very unique. For example, 5 of the 160 institutions are public,
non-residential, have a large campus size, and are located in an urban fringe area within the
Southeast. Yet, there are distinct differences between them, particularly the governance
structures for addressing climate change. The following examples include the institution name,
the individual or group who is accountable for climate change at each institution, and whether or
not the person(s) listed has budgetary authority for implementation of climate-related strategies.
George Mason University – Executive Steering Committee for Sustainability, does have
budgetary authority
Kennesaw State University – President, does not have budgetary authority
University of Central Florida – Director of Sustainability & Energy Management, does
have budgetary authority
University of Louisville – Sustainability Council, does not have budgetary authority
University of South Florida – Director of the Office of Sustainability, does have
budgetary authority
~ 63 ~
Interviews with survey respondents shed further light on how different factors drive strategies
and specific actions, and how unique each institution perceives itself to be. Common responses
obtained when interviewees were asked what other institutions they looked to as models or peers
when addressing climate change, included: ―so much of what we‘re doing is place based,‖ ―so
university specific,‖ and ―can't look to many other colleges for guidance.‖ Below are three
examples of how very distinct approaches are being taken at different campuses.
1. Consolidation – Stanford University
Stanford University provides an example of an institution that has undergone significant
organizational restructuring and has chosen a consolidation approach when it comes to
addressing climate change. Prior to 2005, the major emissions sources fell under different offices
and departments. As one example, demand-side energy was managed by three different
departments within a zone and maintenance program. This included buildings and zone
engineers managing energy retrofits and building operations, a maintenance group dealing with
HVAC systems and other physical systems on campus, and an energy efficiency group.
In 2005, Stanford decided that a centralized structure was the best approach, and thus put
greenhouse gas reduction strategies in one category and academic research in another category.
To address the campus‘s emissions, the Department of Sustainability and Energy Management
was created, which put energy procurement, energy use, and transportation in one place. This led
to a single department that included Parking & Transportation, Utilities, and a new Office of
Sustainability. As a result, the majority of all emissions and the ability to plan and control
emissions in the future are centrally located.
2. Decentralization with Collaboration – University of Washington-Seattle Campus
Unlike Stanford, the University of Washington-Seattle Campus (UW) is a public institution, and
as such must adhere to the minimum emissions reduction targets set by the state. In addition, it is
located in an urban area, and has almost four times as many enrolled students as Stanford. For
some or all of these reasons, it has pursued an organizational structure for addressing climate
change that favors decentralization. According to Ms. Claudia Frere, Manager of the
Environmental Stewardship and Sustainability Office, when it comes to climate change there is
~ 64 ~
not a fully vetted hierarchy for climate actions as is the case at other colleges. Yet, she believes
the system works well and is well suited to the conditions at UW.
Despite a decentralized structure, Frere describes the campus‘s climate response as consisting of
a large degree of collaboration among many independent operating units, based on function and
expertise. For instance, when the CAP was being developed, one hundred and fifty faculty,
administrative staff, and students provided input; and there was never a formalized committee.
The Environmental Stewardship and Sustainability Office, which was founded in 2008, has
primarily administrative duties as it serves as the ―glue‖ that connects and communicates with
the separate groups.
3. Effects of External Environment - University of Northern British Columbia
The University of Northern British Columbia (UNBC) presents several interesting examples of
how both the natural environment surrounding a campus as well as external players, such as
government, can greatly influence a university. As a public institution in British Columbia,
UNBC was forced to abide by the province‘s Greenhouse Gas Reduction Targets Act, which
required carbon neutrality by 2010. The university must also follow mandates from the Climate
Action Secretariat, who coordinates climate action activities across the government and with
stakeholders. In the past three years, UNBC has hired a Climate Change Site Coordinator, a
Sustainability Manager, and an Energy Manager. According to Mr. Kyle Aben, UNBC‘s Climate
Change Site Coordinator, these positions probably would not have been created so quickly if it
hadn‘t been for the government policies that were put in place.
When considering emission reduction strategies, a campus‘s geography can be very influential as
well. For UNBC, its location at a high latitude affects the amount of heating and lighting
required and its region has a specific mix of available electricity sources. UNBC is also located
in a forest, which presents the opportunity for bioenergy and biofuels. As a result, UNBC largely
relies on a combination of offsets and local bioenergy projects in order to attain carbon
neutrality. Going forward, UNBC hopes to expand the use of its forest resources as it continues
to reduce emissions, which may impact the skills and types of personnel needed to execute
climate projects.
~ 65 ~
3.4 Influence of Executive Leadership
Based upon interviews and survey data, it has been found that executives (including vice
presidents, provosts, other executive-level positions) within higher education institutions are
actively involved in addressing climate change. This involvement can come in many forms,
including managing the key decisions for mitigating greenhouse gas emissions, defining
environmental goals for an institution, or having direct involvement with the personnel who
serve as climate officers. In the latter case, individuals and groups who are accountable for
addressing climate change report directly to an executive-level person at 60% of the institutions
that were surveyed. So even when not directly responsible, executives are well connected to the
climate officers.
The President is Accountable for Climate Change Response
17% of respondents recognize the president or chief executive as the person who is ultimately
accountable for an institution‘s response to climate change. As climate officers, these executives
take on many different roles, which can vary considerably among institutions. When asked to
rank these presidents‘ top climate-related activities, 46% of institutions have ―climate action
planning and setting goals and strategies‖ within the presidents‘ top three responsibilities, of
which 31 percentage points are derived from a number one ranking. Almost as important is
―Facilities management and design,‖ which had the highest overall percentage for job
responsibilities (48%) when summing the top three rankings (Figure 50).
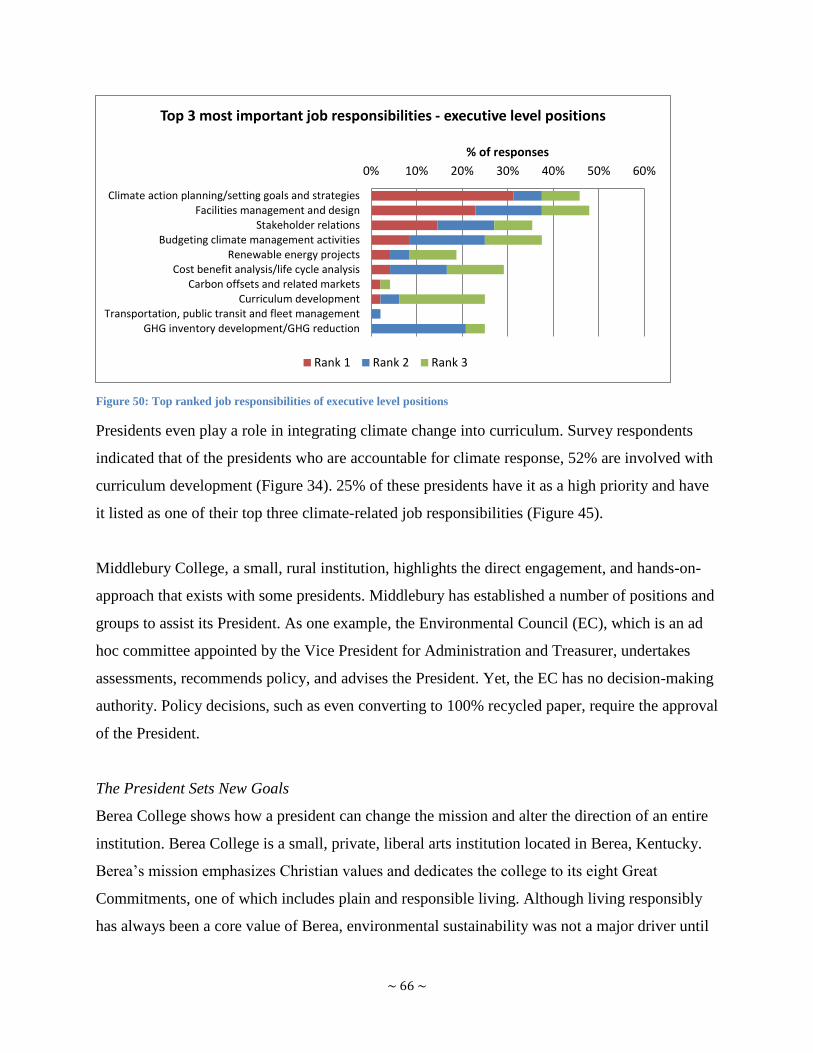
~ 66 ~
Figure 50: Top ranked job responsibilities of executive level positions
Presidents even play a role in integrating climate change into curriculum. Survey respondents
indicated that of the presidents who are accountable for climate response, 52% are involved with
curriculum development (Figure 34). 25% of these presidents have it as a high priority and have
it listed as one of their top three climate-related job responsibilities (Figure 45).
Middlebury College, a small, rural institution, highlights the direct engagement, and hands-on-
approach that exists with some presidents. Middlebury has established a number of positions and
groups to assist its President. As one example, the Environmental Council (EC), which is an ad
hoc committee appointed by the Vice President for Administration and Treasurer, undertakes
assessments, recommends policy, and advises the President. Yet, the EC has no decision-making
authority. Policy decisions, such as even converting to 100% recycled paper, require the approval
of the President.
The President Sets New Goals
Berea College shows how a president can change the mission and alter the direction of an entire
institution. Berea College is a small, private, liberal arts institution located in Berea, Kentucky.
Berea‘s mission emphasizes Christian values and dedicates the college to its eight Great
Commitments, one of which includes plain and responsible living. Although living responsibly
has always been a core value of Berea, environmental sustainability was not a major driver until
0% 10% 20% 30% 40% 50% 60%
Climate action planning/setting goals and strategiesFacilities management and design
Stakeholder relationsBudgeting climate management activities
Renewable energy projectsCost benefit analysis/life cycle analysis
Carbon offsets and related marketsCurriculum development
Transportation, public transit and fleet managementGHG inventory development/GHG reduction
% of responses
Top 3 most important job responsibilities - executive level positions
Rank 1 Rank 2 Rank 3
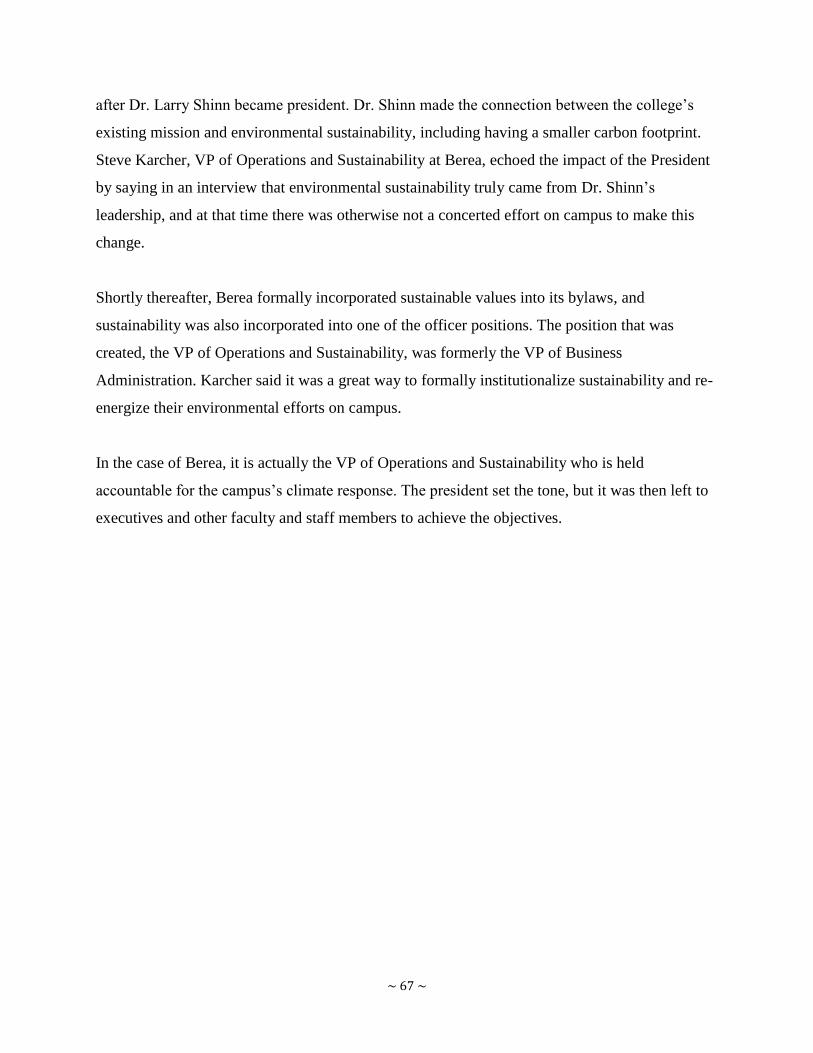
~ 67 ~
after Dr. Larry Shinn became president. Dr. Shinn made the connection between the college‘s
existing mission and environmental sustainability, including having a smaller carbon footprint.
Steve Karcher, VP of Operations and Sustainability at Berea, echoed the impact of the President
by saying in an interview that environmental sustainability truly came from Dr. Shinn‘s
leadership, and at that time there was otherwise not a concerted effort on campus to make this
change.
Shortly thereafter, Berea formally incorporated sustainable values into its bylaws, and
sustainability was also incorporated into one of the officer positions. The position that was
created, the VP of Operations and Sustainability, was formerly the VP of Business
Administration. Karcher said it was a great way to formally institutionalize sustainability and re-
energize their environmental efforts on campus.
In the case of Berea, it is actually the VP of Operations and Sustainability who is held
accountable for the campus‘s climate response. The president set the tone, but it was then left to
executives and other faculty and staff members to achieve the objectives.
~ 68 ~
3.5 Impacts of Stakeholder Relations
Stakeholders at the institutions can be very influential, whether as the drivers for new climate
activities or as obstacles to climate officers. When asked if accommodating stakeholder needs
was a challenge they were facing, an overwhelming 95% of respondents said that it was. When
asked if stakeholder relations in general were an important topic within their daily jobs, 62% of
respondents chose it as something that was an important part of their job. This indicates that
stakeholder engagement is a critical part of climate change strategies within institutions and is
something that respondents see as an important issue (Error! Reference source not found.).
Figure 51: Importance of stakeholder relations is evident within challenges and job responsibilities
Interviews with respondents from Duke University, Evergreen State College, and Tulane
University highlight the different impacts that stakeholders can have on an institution. At Duke
University, the Campus Sustainability Committee (CSC), a group involving 25-30 students,
faculty, and staff, is responsible for overseeing the university‘s response to climate change.
When speaking with Ms. Tavey Capps, Duke‘s Environmental Sustainability Director, she felt
when the committee was created, one important thing that its co-chairs did well was bring
virtually every major stakeholder to the same table at the very beginning. She believes this led to
more buy-in and credibility of the committee across the campus.
Chosen 95%
Not Chosen
5%
Is accommodating stakeholder needs a challenge?
Chosen 62%
Not Chosen
38%
Are stakeholder relations an important topic within your job?
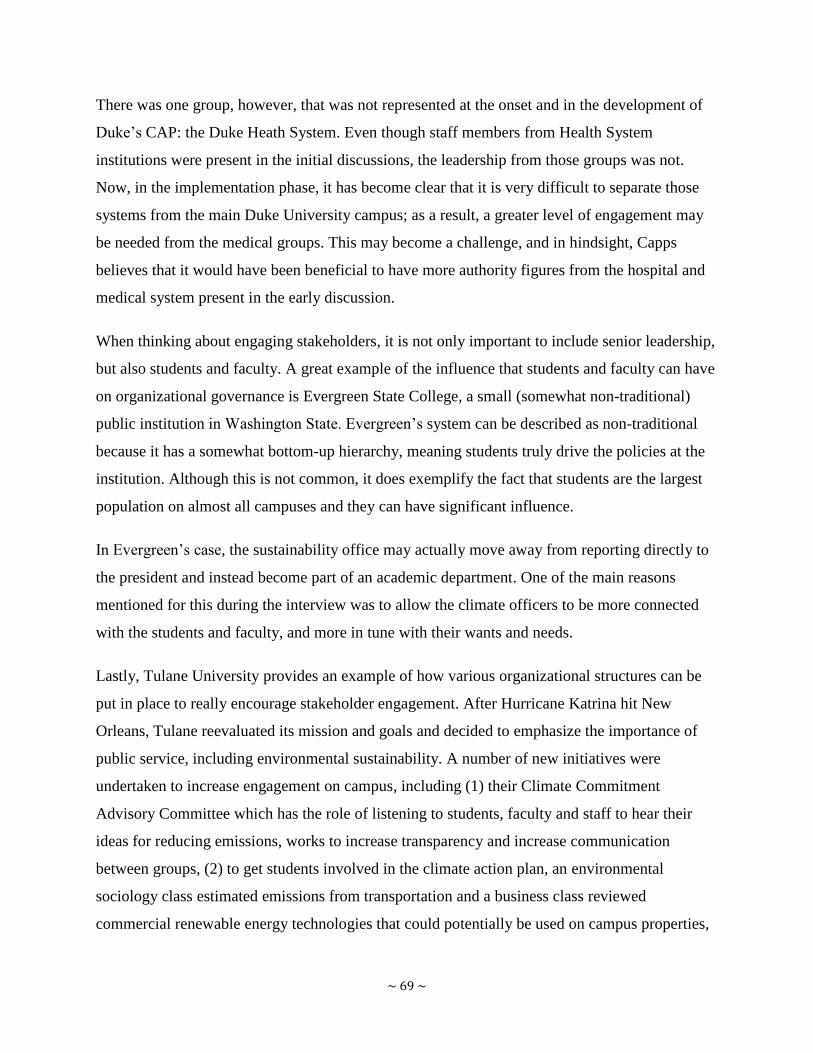
~ 69 ~
There was one group, however, that was not represented at the onset and in the development of
Duke‘s CAP: the Duke Heath System. Even though staff members from Health System
institutions were present in the initial discussions, the leadership from those groups was not.
Now, in the implementation phase, it has become clear that it is very difficult to separate those
systems from the main Duke University campus; as a result, a greater level of engagement may
be needed from the medical groups. This may become a challenge, and in hindsight, Capps
believes that it would have been beneficial to have more authority figures from the hospital and
medical system present in the early discussion.
When thinking about engaging stakeholders, it is not only important to include senior leadership,
but also students and faculty. A great example of the influence that students and faculty can have
on organizational governance is Evergreen State College, a small (somewhat non-traditional)
public institution in Washington State. Evergreen‘s system can be described as non-traditional
because it has a somewhat bottom-up hierarchy, meaning students truly drive the policies at the
institution. Although this is not common, it does exemplify the fact that students are the largest
population on almost all campuses and they can have significant influence.
In Evergreen‘s case, the sustainability office may actually move away from reporting directly to
the president and instead become part of an academic department. One of the main reasons
mentioned for this during the interview was to allow the climate officers to be more connected
with the students and faculty, and more in tune with their wants and needs.
Lastly, Tulane University provides an example of how various organizational structures can be
put in place to really encourage stakeholder engagement. After Hurricane Katrina hit New
Orleans, Tulane reevaluated its mission and goals and decided to emphasize the importance of
public service, including environmental sustainability. A number of new initiatives were
undertaken to increase engagement on campus, including (1) their Climate Commitment
Advisory Committee which has the role of listening to students, faculty and staff to hear their
ideas for reducing emissions, works to increase transparency and increase communication
between groups, (2) to get students involved in the climate action plan, an environmental
sociology class estimated emissions from transportation and a business class reviewed
commercial renewable energy technologies that could potentially be used on campus properties,

~ 70 ~
and lastly, (3) Tulane created the Center for Public Service to implement public service
requirements in the undergraduate curriculum.
~ 71 ~
Chapter 4: Conclusions and Next Steps
The pressures of climate change are driving higher education institutions to make major changes,
including modifications to the organizational structures, operations, and curriculum at their
institutions. The data and interviews contained in this report offer a first glimpse at the types of
changes that have been occurring. It was found that in just the last three years, 76% of surveyed
institutions have undergone organizational restructuring related to climate change governance.
Other observations indicate that there is tremendous diversity in the backgrounds of climate
change officers and their current job responsibilities. Additionally, it appears that executives are
very involved with their own institution‘s response to climate change; and stakeholders play a
critical role as both barriers to potential solutions while also at times being the catalyst for new
strategies. Deeper analysis indicates that when comparing characteristics, such as geography and
campus size, there are distinct differences in how institutions with certain qualities are
responding to climate change.
Yet, as the data set used in this analysis only encompasses approximately 3.5% of all 2- and 4-
year higher education institutions in the U.S. and Canada, this opens the door for future studies.17
Observations within this report highlight some potential trends between different classifications
of institutions and with further data collection, these findings could be strengthened. Additional
insight could also be gained through comprehensive case studies that investigate the underlying
mechanisms and drivers behind the organizational changes that are being witnessed. Rather than
doing an interview with a single individual, multiple climate and sustainability officers could be
included as well as institutions that are either just starting their climate change efforts or are
struggling with their current efforts. Overall, this report helps to increase knowledge surrounding
climate change governance within higher education institutions and will ultimately help to foster
collaboration and allow for increased learning opportunities.
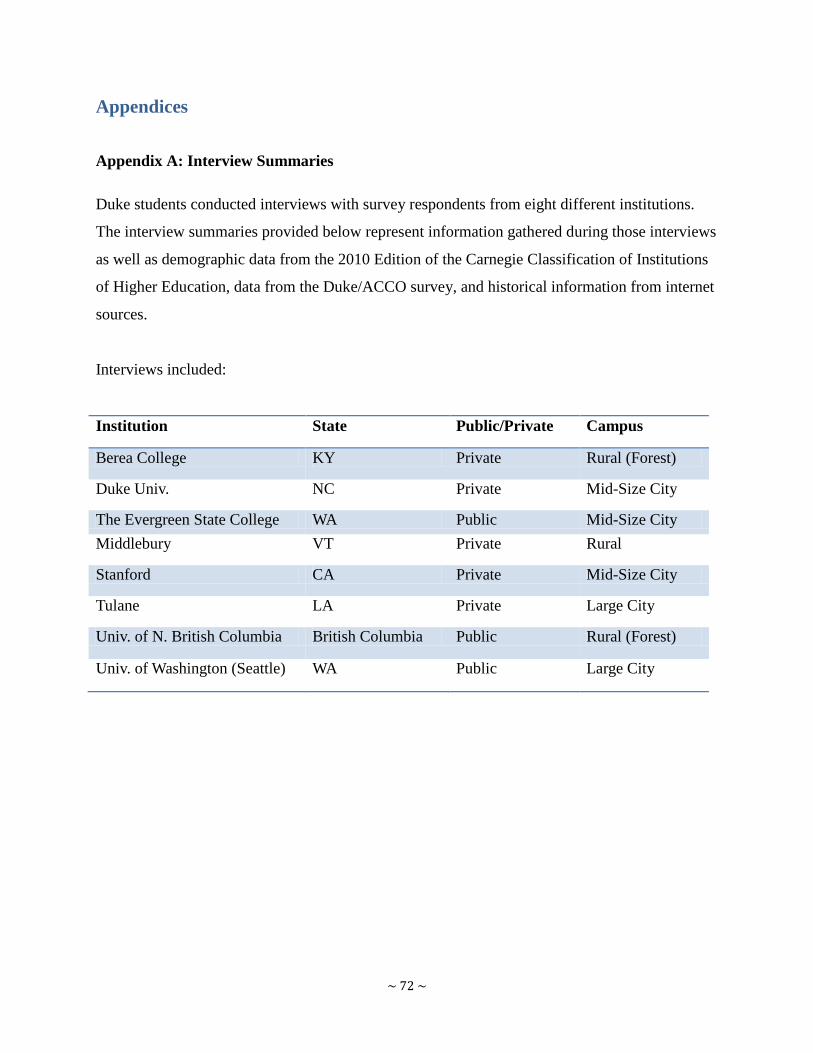
~ 72 ~
Appendices
Appendix A: Interview Summaries
Duke students conducted interviews with survey respondents from eight different institutions.
The interview summaries provided below represent information gathered during those interviews
as well as demographic data from the 2010 Edition of the Carnegie Classification of Institutions
of Higher Education, data from the Duke/ACCO survey, and historical information from internet
sources.
Interviews included:
Institution State Public/Private Campus
Berea College KY Private Rural (Forest)
Duke Univ. NC Private Mid-Size City
The Evergreen State College WA Public Mid-Size City
Middlebury VT Private Rural
Stanford CA Private Mid-Size City
Tulane LA Private Large City
Univ. of N. British Columbia British Columbia Public Rural (Forest)
Univ. of Washington (Seattle) WA Public Large City
~ 73 ~
Berea College
Based on an interview with Steve Karcher, VP of Operations and Sustainability, conducted on
February 7, 2011.
Institution Profile:
• Location: Berea, Kentucky
• Enrollment: 1,548
• Campus Locale: Rural
• Private
• Commitments/Affiliations: ACUPCC, AASHE
• Accountable Person(s) for Climate Response: Single Individual – VP of Operations and
Sustainability
Overview:
Berea College is a small, private, liberal arts college located in Berea, Kentucky. Berea‘s mission
emphasizes Christian values and dedicates the college to its eight Great Commitments, one of
which includes plain and responsible living. Berea is unique in that they provide low-cost
education to low-income families by charging no tuition and requiring students to work at least
10 hours per week. Approximately one in three students is of an ethnic minority.
According to the College Sustainability Report Card, Berea is the greenest college in Kentucky.
There are several factors that led to this recognition including:
• A commitment to reduce greenhouse gas emissions by 10% from 2008 levels by 2015
• Cutting building energy consumption in half since 2005
• Dining services‘ focuses on buying local products, including meat and vegetables from an
on-campus farm
• An Eco-village that provides housing for about 100 students
• Six hybrid and 12 electric vehicles added in the transportation fleet
• The Department of Sustainability and Environmental Studies, which aims to incorporate
sustainability into Berea's physical plant operations and curriculum.18
~ 74 ~
History of Climate Governance:
Although living responsibly has always been a core value of Berea, environmental sustainability
was not a major driver until after Dr. Larry Shinn became president. Dr. Shinn made the
connection between the college‘s existing mission and environmental sustainability, including
having a smaller carbon footprint. Mr. Steve Karcher, VP of Operations and Sustainability,
echoed the impact of the President, saying that environmental sustainability truly came from his
leadership and at that time there was not a concerted effort on campus to make this change. As a
result of Dr. Shinn‘s influence, numerous changes took place, including having energy policies
institutionalized and incorporated into construction and renovations.
After Dr. Shinn signed the American College & University Presidents‘ Climate Commitment
(ACUPCC) in 2007, the Subcommittee on Sustainability II (SOS-II) was formed as a
subcommittee of the Strategic Planning Council, and was charged with creating a strategic plan
for sustainability on campus. According to Karcher, the Council examined the successes of the
first sustainability initiatives on campus, if the approach was effective, and if there had been any
progress. Additionally, they examined happenings external to the college and what else had been
learned surrounding climate change and sustainability.
According to Karcher, a second inflection point came in 2008 when the economy crashed,
forcing Berea to reorganize. The economic downturn had a major impact on organizational
structure at Berea, including the elimination of various VP areas. However, despite being a
challenging time for Berea, the college took advantage of the opportunity. It formally
incorporated sustainable values into its bylaws and sustainability was also incorporated into one
of the officer positions. The position that was created, the VP of Operations and Sustainability,
was formerly the VP of Business Administration. Karcher said it was a unique opportunity to
formally institutionalize sustainability and re-energize their environmental efforts on campus.
When asked if efforts are more focused towards climate change specifically or sustainability in
general, Karcher said that climate change is not how the college goes about addressing the
issues. It tends to focus instead on natural resource consumption. Along the same lines, the
ACUPCC was not the driving factor for Berea‘s climate efforts, but the commitment did have a
significant impact on its campus strategies. Additionally, when asked if the changes to the

~ 75 ~
bylaws would have a significant impact on his job responsibilities, Karcher said that rather than
affect his job description, the change will add more organizational and institutional pressure to
get things done.
It is also worth noting that Karcher said that when initial sustainability initiatives were put in
place, there were still many on campus that were skeptical of climate science. The second time
around, this hesitation had largely disappeared, and there was more of a focus on practical
realities and the goal of balancing the educational mission with reaching carbon neutrality.
Integrating Sustainability in Operations:
When asked about the effectiveness of the current governance structure at Berea, Karcher
indicated that a key to their success was the integration of operations and sustainability. He said
that when he is working on energy planning it is hard to distinguish between operations or
sustainability; it is a mixture of both. Karcher said that it would not work if he was solely a
sustainability officer or climate change officer because operations need to be integrated into the
decisions to be efficient and effective.
When looking to the future, Karcher does not see available funding for a dedicated sustainability
or climate change position. Instead, he said that they are taking the opportunity to refocus current
positions. For example, the central plant management position is focused on energy management
as well as distribution systems. On the academic side, they have added an environmental and
natural resources minor. Overall, Karcher said that they are working to integrate sustainability
throughout many aspects of the college.
~ 76 ~
Duke University
Based on an interview with Tavey Capps, Environmental Sustainability Director, conducted on
February 11, 2011.
Institution Profile:
• Location: Durham, NC
• Enrollment: 14,350
• Campus Locale: Mid-size City
• Private
• Commitments: ACUPCC and AASHE
• Accountable Person(s) for Climate Response: Committee - Campus Sustainability
Committee
Overview:
For decades, Duke University has been promoting environmental conservation in the classroom.
In 1938, Duke founded the School of Forestry and Environmental Studies and the Duke
University Marine Lab (located in Beaufort, NC), which later merged, along with the
Department of Geology, to form the Nicholas School of the Environment.19 Today, the Nicholas
School of the Environment serves as a hub for environmental education, and its faculty members
often have dual appointments with other professional schools on campus, such as the Law
School and the Public Policy School. In addition to its long-time academic interests, Duke‘s
geographical location, network of facilities, and the Duke Forest have also affected the
university‘s approach to mitigating climate change.
Being in Durham, North Carolina presents Duke with many challenges and opportunities. To
start with, the vast majority of Duke‘s electricity is derived from utility-owned, coal-powered
plants. On the plus side, there is potential for offsets through the Duke Forest--7,060 acres of
forest that the university owns, and as North Carolina is a major hog producer, there are potential
agricultural offsets and partnership opportunities in the region as well.20
~ 77 ~
Duke also has significant research facilities, athletic facilities, residence halls, and a large
medical care system (the Duke University Medical Center and Duke University Health System).
Duke University has almost 33,000 employees, of which more than two-thirds are affiliated with
the Duke Medical system.21 For comparison, Duke has about 7,500 graduate students and 6,500
undergraduates.22
Duke‘s recently approved Climate Action Plan (CAP) particularly reflects how a customized
approach to emissions reductions is important. The CAP calls for climate neutrality by 2024, of
which 45% of reductions are achieved through on-campus initiatives and the other 55% from
local or regional ones. Interestingly, the CAP includes plans to only use offsets that have a
tangible connection to Duke and the Southeast region.
History of Climate Governance Structure:
Duke University President Richard Brodhead signed the American College & University
Presidents Climate Commitment and created the Campus Sustainability Committee (CSC) in
2007, which is the governing body that oversees the university‘s response to climate change.
Since its creation, Executive Vice President Tallman Trask and Dean Bill Chameides (Nicholas
School of the Environment) have served as co-chairs, and the committee involves 25-30
students, faculty, and staff.
Even though Duke had been conducting annual greenhouse gas inventories since 1990 and
implementing some carbon reduction measures, long-term, strategic planning for climate
neutrality had not occurred yet. Therefore, when the CSC was founded, it was originally charged
with conducting a carbon inventory that aligned with the ACUPCC‘s requirements and
developing a climate action plan. As the three major greenhouse gas sources were from the
campus steam plant, purchased electricity, and transportation, three subcommittees were created
for each focus area, in addition to a communications subcommittee and an education
subcommittee. It is worth noting that Duke‘s GHG inventories do not include ―leased space or
satellite health system buildings and hospitals,‖ as a result of the central administration having a
limited ability to control the actions of those facilities.23
~ 78 ~
According to Ms. Tavey Capps, Duke‘s Environmental Sustainability Director, one of the
strengths of the CSC is that those who would be most impacted by the climate and sustainability
plans were brought to the same table at the very beginning, including those who would might not
be directly involved in the implementation of climate strategies but were at high levels in the
university and had significant influence. Having the leaders from different departments, as well
as a presidentially-appointed committee, enabled the CSC to cross boundaries and have authority
to make some of its recommendations.
Having a large and diverse committee also meant that the different campus departments and
interests were represented at the start of the CSC‘s planning process, including setting the
boundaries for the GHG inventory, determining targets, and developing future programs. In
addition, those who had tremendous influence over a topic and who would also be involved with
overseeing the implementation of CAP activities were asked to lead specific subcommittees. For
instance, the Vice President for Facilities now chairs the Energy Subcommittee and the Assistant
Vice President of Internal Communications chairs the Communications Subcommittee. Capps
felt that by assigning responsibilities in this way, the chairs were more likely to feel a sense of
ownership and responsibility for keeping their respective staff members involved with the entire
process. In fact, she believes that if outside consultants are used without the leadership and
involvement of internal Duke staff, recommendations would be much less likely to be
implemented in many cases.
Whereas the CSC sets the overarching goals, for the day-to-day implementation of the CAP,
Duke‘s Sustainability Office plays a key role in either coordinating or directly overseeing
activities. In many cases though, other departments such as Parking and Transportation Services
are responsible for specific initiatives and not the Sustainability Office. There have been some
new hires recently, including two new staff members in the Sustainability Office to work on
local offsets and a Transportation Demand Coordinator has been hired by the Parking and Transit
Department.
Engaging Stakeholders throughout the Campus:
At the time when Duke‘s carbon inventory and CAP were being developed, most colleges with
health system components did not include those parts of their campuses in their climate
~ 79 ~
strategies. Therefore, in order to be able to better compare Duke to other institutions, the CSC
decided to exclude Duke‘s medical groups. As a result, only staff members from Duke‘s hospital
and medical system were present in the initial climate discussions, but not the leadership from
those divisions.
Looking back at the organizational changes and the involvement of key stakeholders over the last
several years, Capps did express misgivings about the initial decision to essentially exclude the
hospital and medical system from the carbon inventory and CAP (even though it was known at
the time that this decision would lead to problems in the future). Now, in the implementation
phase, it has become evident that it is very difficult to separate those systems from the main
Duke University campus; as a result, a greater level of engagement may be needed from the
medical groups. This may become a challenge, and in hindsight, Capps believes that it would
have been better to have had more authority figures from the hospital and medical system present
in the early discussion.
Among other upcoming projects, Capps said that the CSC has begun to look beyond the CAP
and into developing a comprehensive sustainability plan that incorporates other environmental
topics, such as water and green purchasing. In addition, the Education Subcommittee has been
discussing numerous ideas for incorporating climate issues and sustainability into curriculum and
making these types of courses more transparent, such as having an official ―sustainability label‖
for courses. Furthermore, the Communications Subcommittee is continuing to encourage the use
of a Duke-specific carbon calculator that has been created to help the campus community
understand their impact on Duke‘s GHG footprint.
~ 80 ~
The Evergreen State College
Based on an interview with Scott Morgan, Sustainability Coordinator, conducted on February 7,
2011.
Institution Profile:
• Location: Olympia, WA
• Enrollment: 4,891
• Campus Locale: Mid-Size City
• Public
• Commitments/Affiliations: ACUPCC, AASHE, United Nations Environment Programme
Climate Neutral Network, ACUPCC Leadership Circle
• Accountable Person(s) for Climate Response: Sustainability Council
Overview:
The Evergreen State College is a small pubic liberal arts college located in the capital city of
Olympia, WA with a reputation for interdisciplinary, collaborative, and team-taught programs.
The campus culture requires that the direction of the college be strongly connected to students
and academic work, which therefore creates a unique relationship among students, faculty, and
staff.
Sustainability is an important value for the college, as evidenced in the following statement from
their 2007 Updated Strategic Plan:
Evergreen will become a laboratory for sustainability — as demonstrated in our
operations, our curriculum, and in the quality of life for our employees and students —
and commit to becoming a carbon neutral college by the year 2020. Already the premier
national model for interdisciplinary liberal arts education, ultimately Evergreen will
become similarly known for its leadership in sustainability — providing educational and
employment opportunities throughout the academic, public, nonprofit, and business
communities.24
~ 81 ~
In addition to a commitment to sustainability in their strategic plan, Evergreen‘s President Les
Purce is a member of the ACUPCC Leadership Circle, which is an agreement to develop a
comprehensive plan to achieve climate neutrality as soon as possible. Within this commitment,
Evergreen completed its first carbon inventory in 2007 and discovered that its carbon footprint is
less than half the national average for colleges and universities.25
History of Climate Governance Structure:
Mr. Scott Morgan, Evergreen‘s Sustainability Coordinator, believes that the catalyst for recent
environmental efforts at Evergreen came from a small group of faculty and students who were
interested in improving sustainability on campus. This led to the development of a disappearing
task force that was charged with engaging the campus to define the concept of sustainability as
well as discrete goals and recommendations. At the time, the college was updating its strategic
plan and campus master plan; therefore, these recommendations could be (and were)
incorporated into the formal plans.
Along with recommendations for the strategic plan and campus master plan, the task force
recommended having a formal administrative structure for sustainability on campus, which
resulted in the creation of the Office of Sustainability and Sustainability Council. A Director of
Sustainability was hired in 2008 as a member of the President‘s staff. The Sustainability Council
and its subsequent working groups draw members from across campus, including high-level
directors. The council is responsible for ensuring that sustainability goals and targets within the
college‘s institutional commitments are met, particularly with regard to carbon neutrality and
zero waste. It also strives to provide vision for a sustainable future. Therefore, the Sustainability
Council is the main governing body that oversees the college‘s response to climate change.
There have been some additional organizational changes very recently, mostly as a result of
budget challenges. The Director of Sustainability moved on to another university, and while an
interim position was put in place, there are no concrete plans for a permanent position. The
Council remains in place, however it is shifting away from having a predominantly advisory role
and now taking responsibility for decision-making and implementation. Because this function is
new to them, Morgan said that they are in an adjustment period and are working on finding more
efficient processes.
~ 82 ~
When asked if this was an efficient top-down structure, Morgan explained that ―top-down‖ was
not the culture of Evergreen; their hierarchy was more bottom-up. He explained there was an
advantage of having the Sustainability Director report to the President, because it put the
department at the same level as other departments. However, it also makes it more difficult to
connect with students and keep them informed of activities and efforts. He explained that a big
challenge at Evergreen is the relationship and decision-making process that occurs between
students and administrators. As a state college, the administration must answer to the state
legislature while Evergreen‘s governance structure also calls on the administration to be
accountable to the student body. This can create tension at times, especially regarding substantial
sustainability efforts and other issues of change around campus. Morgan said that if students are
opposed to a decision then they have the freedom to express their opposition and to try and
change the decision, and the students frequently exercise this right.
Adapting Organizational Structures:
As for any future changes to the governance structure, Morgan said that they are currently
evaluating the Director of Sustainability position and where it should be placed. He said that the
decision at hand seems to be whether or not the position should be on the President‘s staff or on
the academic side; this is a discussion still in process. Morgan mentioned that this topic has come
up because of the large number of student projects happening on the academic side and the heavy
engagement of students with the administrative decisions. Placing the position in academics
would allow for more connection to the students.
~ 83 ~
Middlebury College
Based on an interview with Jack Byrne, Director of Sustainability Integration, conducted on
February 11, 2011.
Institution Profile:
• Location: Middlebury, VT
• Enrollment: 2,482
• Campus Locale: Rural
• Private
• Commitments/Affiliations: ACUPCC, AASHE, UN Climate Neutral Network, EPA Climate
Leaders
• Accountable Person(s) for Climate Response: President
Overview:
Middlebury College has a long history of promoting environmental conservation. In fact, its
undergraduate Environmental Studies Program is the oldest undergraduate ES program in the
United States. In addition, Bill McKibben, (one of the early voices warning of climate change) is
a scholar in residence.26 In 1994, President John McCardell set goals, including making
Middlebury, ―the environmentally aware campus" and establishing its ES program as the
preeminent one of its kind.27
In 1995, the Middlebury College Trustees adopted the following:
Middlebury College as a liberal arts institution is committed to environmental
mindfulness and stewardship in all its activities. This commitment arises from a sense of
concerned citizenship and moral duty and from a desire to teach and lead by example.
The College gives a high priority to integrating environmental awareness and
responsibility into the daily life of the institution. Respect and care for the environment,
sustainable living, and intergenerational responsibility are among the fundamental values
that guide planning, decision making, and procedures. All individuals in this academic
community have personal responsibility for the way their actions affect the local and
global environment.28
~ 84 ~
History of Climate Governance Structure:
As was indicated on the Duke/ACCO survey, the President of the college is ultimately
responsible for the institution‘s climate response. However, many different positions and groups
have been established over the decades to help the president address environmental sustainability
and climate. It is also worth noting, that there has been both organizational expansion and
subsequent contraction as tasks have been completed.
To begin with, an Energy Council was formed in the mid-70s, which became the Environmental
Council (EC) in 1992.29
This ad hoc committee is appointed by the Vice President for
Administration and Treasurer, and it principally undertakes assessments, recommends policy,
and advises the President.30,31 As just one example of the EC‘s role, in 2008 the EC made a
recommendation to require the use of 100% recycled paper, which then went to the president,
and was subsequently approved.32 As is highlighted in this example, the EC has no decision-
making authority.
There have been a few other major organizational expansions as well. In the mid-90s,
Middlebury created a new position, the Director of Environmental Affairs, which eventually
became the Dean of Environmental Affairs. The dean is responsible for advancing environmental
academic programs and fostering ―…an integrated institutional vision for sustainability.‖33
In
addition, a full-time Sustainability Coordinator was hired in 1998. A decade later, the
Sustainability Integration Office (SIO) was created, and it housed SIO‘s Director as well as an
Outreach and Communications Coordinator. SIO takes on development, implementation, and
support roles; and it reports to the dean, who subsequently reports to the Vice President for
Academic Affairs.34,35
There have also been organizational changes specifically related to developing and implementing
a climate action plan. Several years ago, the EC proposed that a Climate Action Implementation
Working Group be created to develop a plan for achieving carbon neutrality by 2016, which was
eventually approved. The sixteen-member group was co-chaired by the Director of Sustainability
Integration and the Director of Human Resources. Three committees were created for the
implementation stages: 1) Communications and Engagement Committee, 2) Master Plan
Implementation Committee, and 3) Carbon Neutrality Coordinating Team.36 Today, all except
~ 85 ~
the Master Plan Implementation Committee have been absorbed by the Sustainability Integration
Office.
No Need to Address Curriculum:
The individuals and groups who are responsible for the climate action plan and implementing
emission reduction strategies do not need to play a large role when it comes to the development
of climate curriculum. According to Jack Byrne, the Director of Sustainability Integration, this is
because, ―…it‘s almost naturally being addressed…there is so much interest, knowledge and
concern about the topic on the part of the faculty.‖ As the oldest environmental studies program
in the country, it appears the program has an expansive reach throughout the college. Although
there are only twelve core faculty members, there are seventy affiliated faculty who teach
environmental topics, including climate change. For example, a sociology professor may offer a
course that relates to climate change, which also provides a more interdisciplinary approach to
environmental topics.
The Sustainability Integration Office and the Program in Environmental Studies also sponsor an
annual faculty development program. The Director of Sustainability Integration and a faculty
member teach a two-day workshop, specifically for non-Environmental Studies faculty who want
to integrate sustainability into their courses. After completing the workshops, participants then
revise or write a new course with a sustainability focus.
~ 86 ~
Stanford University
Based on an interview with Joseph Stagner, Executive Director, Department of Sustainability
and Energy Management, on February 8, 2011.
Institution Profile:
• Location: Stanford, CA
• Enrollment: 18,498
• Campus Locale: Mid-Size City
• Private
• Commitments/Affiliations: AASHE, The Climate Registry
• Accountable Person(s) for Climate Response: President - John Hennessy
Overview:
Stanford is a large, private research university located within the San Francisco Bay Area in
Northern California. It has an expansive campus with multiple large facilities such as stadiums,
research labs, a hospital, and several professional schools.
With their many sustainability initiatives and programs, Stanford is focused on being a leader in
research, teaching, and institutional practices of environmental sustainability. A comprehensive
and long-range Energy and Climate Action Plan was released in October, 2009 and
implementation of this plan has begun.
Overview and History of Climate Governance Structure:
According to Mr. Joseph Stagner, the Executive Director of the Department of Sustainability and
Energy Management, a reorganization process started at Stanford in 2005, in response to the
growing public concern over climate change. To begin with, the Sustainability Working Group
was formed in 2006, and it was tasked with taking a broad view of sustainability and ensuring
that different units of the university worked collectively to achieve the university‘s sustainability
goals. To develop long-term plans and also execute those plans, Sustainability Working Teams
were later created, which involved six operations-focused teams and three cross-functional
teams.37
~ 87 ~
Both the Working Group and Working Teams are similar in that they both include a cross section
of faculty, staff, and student representatives; however, the Working Group includes senior
leaders from the different groups. The Working Group often provides guidance and support to
Working Teams and serves as a bridge to senior campus leadership with policy and funding
recommendations from the Working Teams. The Working Group and the Working Teams
collaborate, along with sustainability staff members, to be the driving force behind Stanford‘s
sustainability efforts.38
It is important to note that at the core of the organizational changes was an emphasis on
leveraging Stanford‘s experts and efficiently grouping different climate activities. As part of the
reorganization process that led to the Working Group and Working Teams, Stanford looked at
what their governance structure should look like, and decided to put greenhouse gas reduction
strategies in one category and academic research in another category. In terms of dealing with
Stanford‘s own emissions, they decided that the operations and facilities staff would be the
people to turn to.
Stagner said the university decided that whoever crafts the long term energy plans both on the
supply and demand side should be intimately involved with the operational functions that are
related to emissions. There was a high degree of collaboration between the academic side and the
operational side to seek input and knowledge in order to produce a plan that was long term, but
still flexible enough to react to changes in the future.
One of the most significant changes that took place was the consolidation of departments
working on climate change, energy and sustainability efforts. This led to the creation of the
Office of Sustainability and the Department of Sustainability and Energy Management, which
put the different operational groups that have control over procurement and use of energy and
transportation in one place. This includes Parking & Transportation, Utilities and Sustainability
Programs.
Previously, demand-side energy was managed by three different departments within a zone and
maintenance program. This included buildings and zone engineers managing energy retrofits
and building operations, a maintenance group dealing with HVAC systems and other physical
systems on campus, and an energy efficiency group. The decision was made to bring all of the
~ 88 ~
demand side management under the Department of Sustainability and Energy Management so
the management was moved and a new zone facilities management group was created. Now,
management of both the supply and demand sides is located in the same department. As a result,
the majority of all emissions and the ability to plan and control emissions in the future are
centrally located.
Integration and Expertise:
Stagner believes that having direct operation control over all of these groups is working well for
Stanford as it provides an efficient structure to take plans directly to the decision makers
(President and Board). This minimizes bureaucracy and puts the people in charge that have
knowledge and control over emissions and energy procurement. He also believes it is also very
beneficial to have a person that has knowledge of the energy industry. Lastly, whether at a public
or private institution, it is critical to have supportive and knowledgeable administrators.
When asked what the barriers to success were for Stanford, Stagner said that there are very few
internal barriers and most barriers are external to the University, such as procurement of energy
and local utilities. Stagner said the biggest tool a climate change officer needs is regulatory
relief; they need to be empowered to procure energy of the carbon content they want. Stanford is
currently working to find ways to overcome the California regulatory challenges and is hopeful
for success.
Although addressing climate change and reducing emissions is of great importance to Stanford, it
is worth noting that they do not have external pressure from the ACUPCC. Many colleges that
took part in the Duke/ACCO survey stated that they have made organizational and strategic
changes directly as a result of their commitments. Stanford is not under this pressure and
presumably this offers greater flexibility with long-term planning. When asked why Stanford has
not signed the ACUPCC, Stagner said that the university did not want to commit to a goal that
they may not be able to reach. The university first wanted to determine what goal was realistic
and then work towards that goal rather than set the goal first and then determine how to reach it.
The President was not comfortable making a promise that they were unsure they could keep.
~ 89 ~
Tulane University
Based on an interview with Liz Davey, Director, Environmental Affairs, conducted on February
23, 2011.
Institution Profile
• Location: New Orleans, LA
• Enrollment: 11,464
• Campus Locale: Large City
• Private
• Commitments/Affiliations: ACUPCC, AASHE, U.S. Green Building Council
• Accountable Person(s) for Climate Response: Multiple People
Overview:
Even though student research and activism led to new sustainability initiatives and the
development of the Director of Environmental Affairs position in the late ‗90s, the real turning
point for the university came after Hurricane Katrina hit New Orleans. Following the flooding of
the city, Tulane undertook many initiatives to make its campus more sustainable, including
energy-efficiency and LEED Green Building projects and developing a climate action plan (it is
currently awaiting final action by senior administration).39
To impact the larger community,
Tulane created the Center for Public Service to implement public service requirements in the
undergraduate curriculum and Tulane‘s Center for Bioenvironmental Research helped develop
the Holy Cross Historic District and Lower Ninth Ward Sustainable Restoration Plan.40
In fact,
according to one environmental ranking, the Sustainable Endowments Institute‘s ―The College
Sustainability Report Card,‖ Tulane has gone from a grade of C in 2007 to an A- in 2011.41,42
History of Climate Governance Structure:
When Liz Davey became the first environmental sustainability coordinator on campus in 1999,
she was a program manager and reported to an academic research unit, the Center for
Bioenvironmental Research. Later she moved to the Office of Facilities Management and
Campus Development once it became clear that being in an academic research unit was no
~ 90 ~
longer a good fit given the sustainability goals and current organizational structure. For instance,
after switching offices, Davey was then present at meetings when building decisions were being
made, which is important when working on tasks such as energy efficiency.
The other major organizational change was the creation of the Climate Commitment Advisory
Committee in 2009. The presidentially-appointed committee is chaired by the Director of the
Center for Bioenvironmental Research and is composed of faculty, students, and staff. Its
principal role is to review ideas and suggestions from the campus community that impact energy
use and campus culture.
Campus Engagement:
Particularly after the events following Hurricane Katrina, Tulane has emphasized public service
and sustainability in its region. Davey said, ―…we had the elements of all these things here at the
university, but I think it just became an overriding mission for the university and for everyone at
the university to help rebuild the best city possible.‖ She added that Tulane is ―…thinking about
how to create a lasting sustainable community for the future.‖ To achieve such ambitious goals,
it is therefore critical to engage the entire campus population and get everyone involved.
Tulane has found several ways to integrate the campus population into its climate plans and
strategies. To start, part of the role of the Climate Commitment Advisory Committee is to listen
to students, faculty, and staff and review and consider their ideas for reducing the campus‘s
carbon emissions. The Committee even has a blog to keep the campus updated on their progress.
Additionally, the climate action plan was developed with the help of students. An environmental
sociology class and a global environmental politics class have conducted telephone surveys to
estimate emissions from transportation and a business class reviewed commercial renewable
energy technologies that could potentially be deployed on campus properties. To further foster
collaboration between staff, faculty, and students, Davey also piloted an introductory course
about climate change that features guest lectures by faculty.
~ 91 ~
University of Northern British Columbia
Based on an interview with Kyle Aben, Climate Change Site Coordinator, conducted on
February 8, 2011.
Institution Profile:
• Location: Prince George, British Columbia
• Enrollment: 4,200
• Campus Locale: Rural (Forest)
• Public (Canada)
• Commitments/Affiliations: AASHE, Pacific Institute for Climate Solutions
• Accountable Person(s) for Climate Response: Single Individual – VP of Administration and
Finance
Overview:
The University of Northern British Columbia is a small, northern, research-intensive university
in Canada. Located in a forest, the university is focused on the environment surrounding it.
Since its establishment in 1990, the university has provided a number of courses on forestry and
environmental science; thus, the concept of sustainability has been part of its curriculum since
the beginning. Today, a large proportion of the student body is enrolled in environmental
programs.
As a young university the infrastructure is already efficiently designed; however, it continues to
improve upon its energy savings. Not only does it aim to reduce the campus‘s carbon footprint, it
tries to better its surrounding city and the broader northern British Columbia area as well. The
effort is so strong that the university has trademarked itself as ―Canada‘s Green University‖.43
One of the most significant drivers of the university‘s climate actions is the provincial
government. Since the university is a public institution, UNBC was required to comply with the
Greenhouse Gas Reduction Targets Act and reach carbon neutrality by 2010. To do this, UNBC
must follow mandates from the Climate Action Secretariat, who coordinates climate action
activities across government and with stakeholders.
~ 92 ~
UNBC did indeed achieve carbon neutrality by 2010 through a combination of carbon reduction
efforts and carbon offsets; however UNBC‘s hope is to eventually be 100% emissions free and
100% renewable energy based. Among its environmental accolades, the university has received a
great deal of recognition for its efforts in bioenergy and efficient lighting.44
History of Climate Governance Structure:
In the past three years, UNBC has hired a Climate Change Site Coordinator as part of the new
Pacific Institute for Climate Solutions (PICS), a Sustainability Manager, and an Energy
Manager. Mr. Kyle Aben, the Climate Change Site Coordinator, indicated that these three
positions probably would not have been created so quickly if it hadn‘t been for the government
policies put in place. He said PICS is composed of four research universities in the province and
its task is to focus on climate change solutions; therefore they look to bridge the gap between
academia and the practitioners on the ground working on carbon neutrality, offsets, and GHG
mitigation.
With the growing interest and availability of biofuels and bioenergy, new government policies,
and support from the university administration, Aben said that things lined up to move them
towards their goal of being a green university.
Although UNBC has reached carbon neutrality, the university is still dependent on carbon
offsets. To reduce the offset portion, UNBC now focuses on expanding their bioenergy project.
However, there is some debate within the university about the effectiveness of bioenergy when
trying to reach carbon neutrality and this is a challenge the university will likely continue to face.
Effectively Communicating with Administrators:
Aben emphasized that he, the energy manager, and the sustainability manager are a team. He
said that they are getting the attention of the senior administration and they sit on decision-
making committees. He also said that the energy manager is particularly effective because he is
able to monetize and estimate financial returns on possible investments, which is most relevant
for the administration and therefore provides a more credible argument for environmental
projects. Aben said that these issues need to be addressed at every level of the university, and
they are in the process of gathering data to implement the AASHE STARS system, which has the

~ 93 ~
full support of the administration. This is their next big step and he hopes that benchmarking will
allow them to reach broadly across the departments to find further opportunities for
environmental stewardship.
~ 94 ~
University of Washington – Seattle Campus
Based on an interview with Claudia Frere, Manager, Environmental Stewardship and
Sustainability Office, conducted on February 11, 2011.
Institution Profile
• Location: Seattle, Washington
• 2010 Enrollment: - 48,02245
• Campus Locale: Large City
• Public
• Commitments/Affiliations: ACUPCC, AASHE, and National Wildlife Federation
• Accountable Person(s) for Climate Response: Other
Overview:
The University of Washington – Seattle campus (UW) is a large institution in downtown Seattle,
comprising 48,000 students and more than 33,778 faculty and staff.46
It has been the recipient of
many environmental awards and positive ratings, including an ―A-‖ on the Sustainable
Endowment Institute's College Sustainability Report Card, and a ranking of #4 in the nation on
the Sierra Club Magazine's ―Cool Schools‖ list.47, 48
History of Climate Governance Structure:
Over the last several years, significant organizational changes have occurred at the UW campus.
Ms. Claudia Frere, the Manager of the Environmental Stewardship and Sustainability Office,
said that the catalyst for the restructuring began when University President Mark Emmert
established a policy statement on environmental stewardship in 2004. The following year, the
Environmental Stewardship Advisory Committee (ESAC) was created, which is composed of
faculty, staff, and students, and it serves as an advisory group to the President, Provost and
Senior Vice President of Finance & Facilities. Later, ESAC was also charged with developing a
Climate Action Plan (CAP).
In 2008, the Environmental Stewardship and Sustainability Office was established and given two
primary roles: 1) coordinate information and activities related to sustainability on campus, and 2)
~ 95 ~
provide administrative support to the ESAC. One of its first tasks was to take the lead role and
facilitate the development of the university‘s CAP, which was a ten-month process and
ultimately included input from over one hundred and fifty faculty, administrative staff, and
students. Frere described the process in the following way: ―…it wasn‘t a formalized committee,
such as the Environmental [Stewardship] Committee, although it was sponsored by ESAC; it was
more of a collaboration. So the office was basically charged with project management for
development of the plan.‖
Interestingly, when interviewing Frere it became clear that both before and after all of the new
groups were created, there was not and is still not a fully vetted hierarchy for climate actions as
is the case at other colleges. Rather there is a strong collaborative effort and responsibilities are
shared among the different operational units, based on function and expertise. In the last year,
however, senior leadership has asked that policies be written and will be vetted in the 2012 fiscal
year.
The Environmental Stewardship and Sustainability Office operates within the F2
Administration/Strategy Management unit of UW Finance & Facilities (and therefore reports to
the Senior Vice President of Finance and Facilities), ESAC reports to the Provost and Senior
Vice President, and the Environmental Stewardship and Sustainability Office assists ESAC.
Thus, from Frere‘s viewpoint, in terms of the actual implementation of emission reduction
strategies there are many groups that essentially operate independently, but collaborate on
campus-wide projects and initiatives, since her office‘s role is primarily administrative.
In addition, as a public university, UW‘s policies are largely driven by the state government, and
this currently includes emissions targets--UW has set emissions targets that adhere to the State of
Washington‘s goals. Frere pointed out that UW is not only accountable to the State, but also
accountable to the public.
Students hold UW accountable as well. In 2010, after students collected 5,511 student signatures
and spent over 1,000 volunteer hours, the Campus Sustainability Fund (CSF) was formed and
seeded with almost $340,000 from the Services and Activities Fee Committee.49
A panel of
seven student voting members now decides how to allocate funding for student, faculty, and staff
projects.
~ 96 ~
A Decentralized, Yet Collaborative Structure that Works:
Looking back on the CAP and the many organizational changes, Frere said that the decentralized
structure that UW now has is the most appropriate arrangement for its campus when dealing with
climate. As a result, she believes UW has been able to fully utilize the extensive intellectual
capital on its campus, specifically in the environmental field.
According to Frere, the role of the Environmental Stewardship and Sustainability Office is to
serve as the ―glue‖ for the many different functional units. This is why the Environmental
Stewardship and Sustainability Office is part of the Strategy Management Office/Finance &
Facilities Administration. Frere believes the Strategy Management Office has a great
understanding of the university structure, and by being a part of it, it is easier to navigate and
coordinate with other groups.
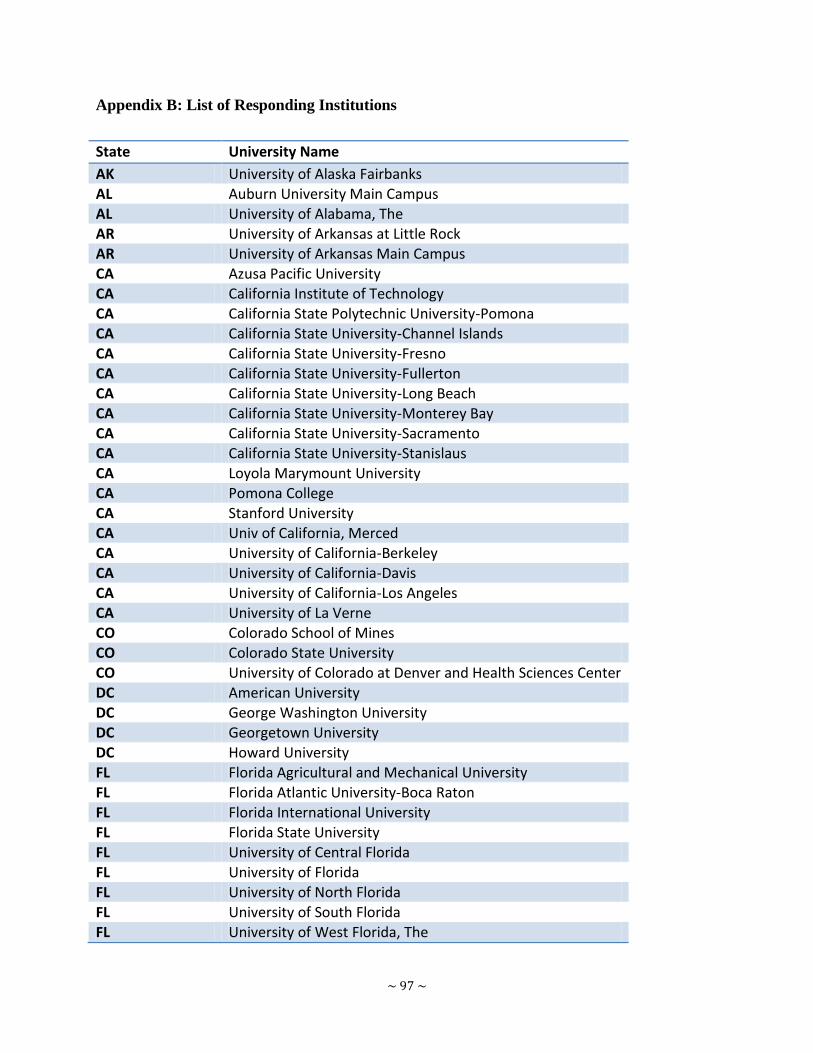
~ 97 ~
Appendix B: List of Responding Institutions
State University Name
AK University of Alaska Fairbanks AL Auburn University Main Campus AL University of Alabama, The AR University of Arkansas at Little Rock AR University of Arkansas Main Campus CA Azusa Pacific University CA California Institute of Technology CA California State Polytechnic University-Pomona CA California State University-Channel Islands
CA California State University-Fresno CA California State University-Fullerton CA California State University-Long Beach CA California State University-Monterey Bay CA California State University-Sacramento CA California State University-Stanislaus CA Loyola Marymount University CA Pomona College CA Stanford University CA Univ of California, Merced CA University of California-Berkeley
CA University of California-Davis CA University of California-Los Angeles CA University of La Verne CO Colorado School of Mines CO Colorado State University CO University of Colorado at Denver and Health Sciences Center DC American University
DC George Washington University DC Georgetown University DC Howard University FL Florida Agricultural and Mechanical University FL Florida Atlantic University-Boca Raton
FL Florida International University FL Florida State University FL University of Central Florida FL University of Florida FL University of North Florida FL University of South Florida FL University of West Florida, The

~ 98 ~
GA Agnes Scott College
GA Brenau University GA Emory University GA Kennesaw State University GA University of Georgia HI University of Hawaii at Manoa IA Central College IA Iowa State University IL Dominican University IL North Central College IL University of Chicago IL University of Illinois at Chicago
IN DePauw University IN Taylor University-Upland
KS Emporia State University KY Berea College KY Transylvania University KY University of Louisville LA Tulane University of Louisiana MA Bentley University MA Northeastern University MA University of Massachusetts Medical Sch Worcester MA University of Massachusetts-Lowell MD Bowie State University
MD Goucher College MD Johns Hopkins University MD Loyola College in Maryland MD University of Baltimore ME College of the Atlantic MI Central Michigan University MI Eastern Michigan University MI Grand Valley State University MI Oakland University MI Wayne State University MI Western Michigan University
MN Carleton College MN College of Saint Benedict MN Macalester College MN Saint Johns University MN University of Minnesota-Morris MO Missouri University of Science and Technology MO University of Missouri-Kansas City MO Washington University in St. Louis
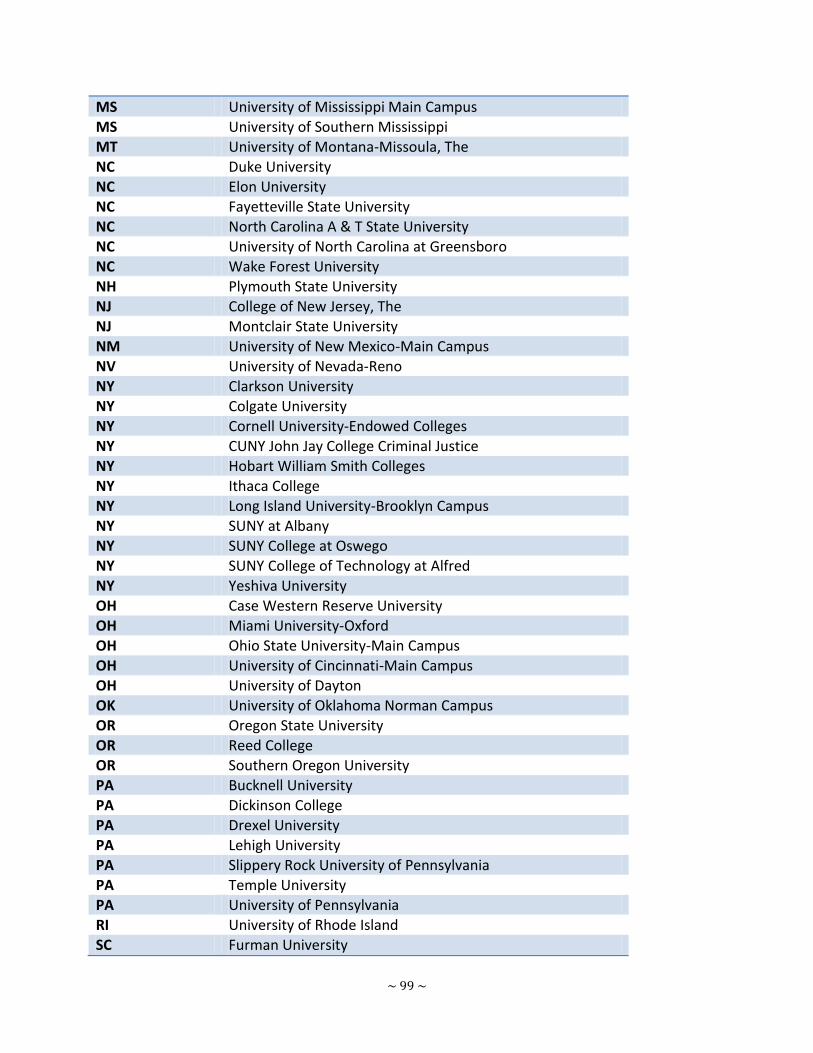
~ 99 ~
MS University of Mississippi Main Campus
MS University of Southern Mississippi MT University of Montana-Missoula, The NC Duke University NC Elon University NC Fayetteville State University NC North Carolina A & T State University NC University of North Carolina at Greensboro NC Wake Forest University NH Plymouth State University NJ College of New Jersey, The NJ Montclair State University
NM University of New Mexico-Main Campus NV University of Nevada-Reno
NY Clarkson University NY Colgate University NY Cornell University-Endowed Colleges NY CUNY John Jay College Criminal Justice NY Hobart William Smith Colleges NY Ithaca College NY Long Island University-Brooklyn Campus NY SUNY at Albany NY SUNY College at Oswego NY SUNY College of Technology at Alfred
NY Yeshiva University OH Case Western Reserve University OH Miami University-Oxford OH Ohio State University-Main Campus OH University of Cincinnati-Main Campus OH University of Dayton OK University of Oklahoma Norman Campus OR Oregon State University OR Reed College OR Southern Oregon University PA Bucknell University
PA Dickinson College PA Drexel University PA Lehigh University PA Slippery Rock University of Pennsylvania PA Temple University PA University of Pennsylvania RI University of Rhode Island SC Furman University
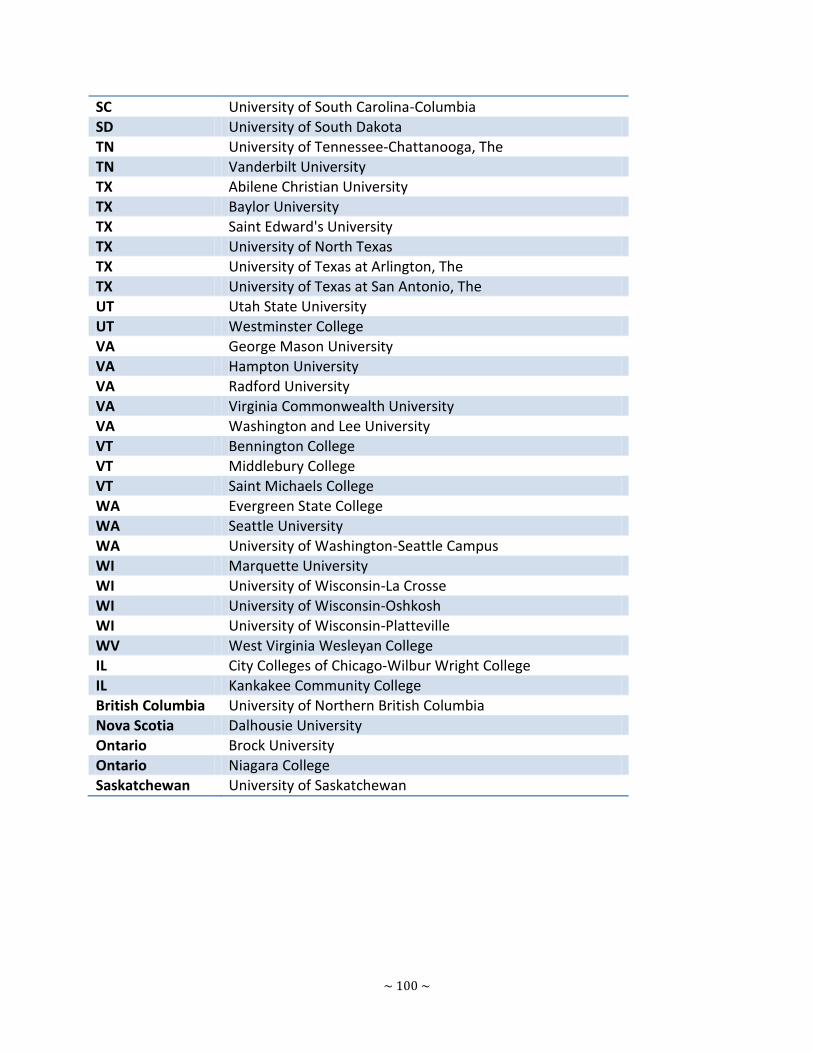
~ 100 ~
SC University of South Carolina-Columbia
SD University of South Dakota TN University of Tennessee-Chattanooga, The TN Vanderbilt University TX Abilene Christian University TX Baylor University TX Saint Edward's University TX University of North Texas TX University of Texas at Arlington, The TX University of Texas at San Antonio, The UT Utah State University UT Westminster College
VA George Mason University VA Hampton University
VA Radford University VA Virginia Commonwealth University VA Washington and Lee University VT Bennington College VT Middlebury College VT Saint Michaels College WA Evergreen State College WA Seattle University WA University of Washington-Seattle Campus WI Marquette University
WI University of Wisconsin-La Crosse WI University of Wisconsin-Oshkosh WI University of Wisconsin-Platteville WV West Virginia Wesleyan College IL City Colleges of Chicago-Wilbur Wright College IL Kankakee Community College British Columbia University of Northern British Columbia Nova Scotia Dalhousie University Ontario Brock University Ontario Niagara College Saskatchewan University of Saskatchewan
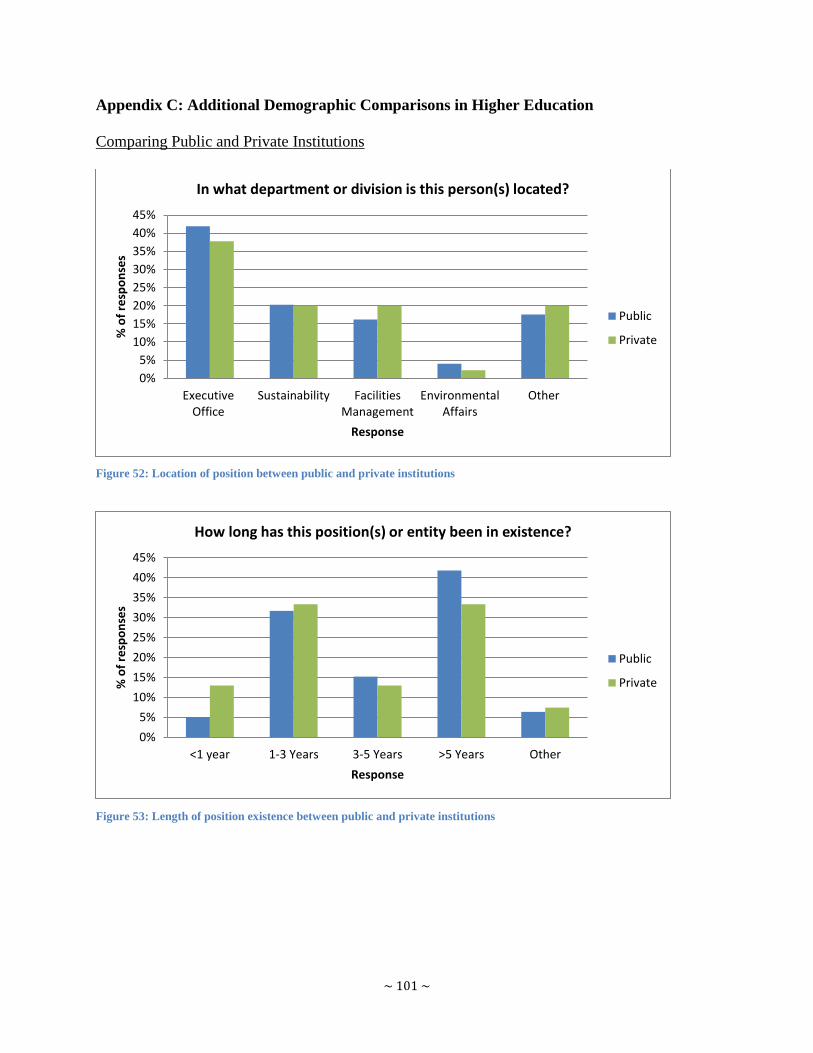
~ 101 ~
Appendix C: Additional Demographic Comparisons in Higher Education
Comparing Public and Private Institutions
Figure 52: Location of position between public and private institutions
Figure 53: Length of position existence between public and private institutions
0%
5%
10%
15%
20%
25%
30%
35%
40%
45%
ExecutiveOffice
Sustainability FacilitiesManagement
EnvironmentalAffairs
Other
% o
f re
spo
nse
s
Response
In what department or division is this person(s) located?
Public
Private
0%
5%
10%
15%
20%
25%
30%
35%
40%
45%
<1 year 1-3 Years 3-5 Years >5 Years Other
% o
f re
spo
nse
s
Response
How long has this position(s) or entity been in existence?
Public
Private
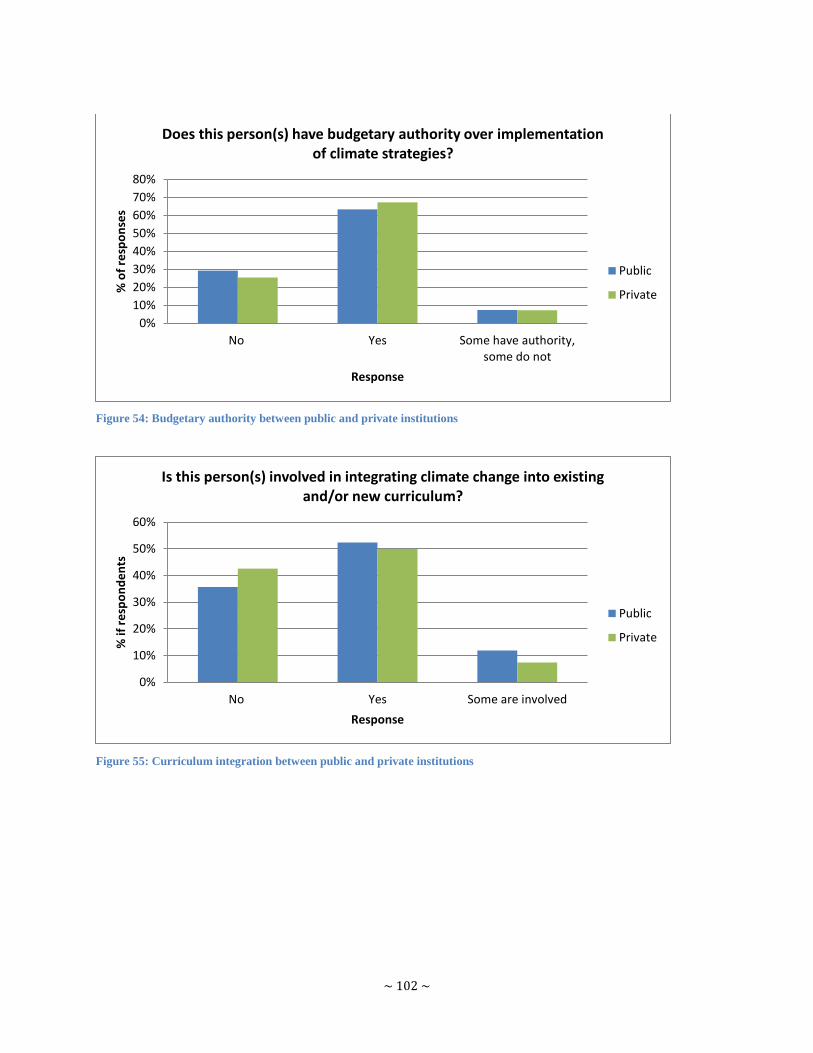
~ 102 ~
Figure 54: Budgetary authority between public and private institutions
Figure 55: Curriculum integration between public and private institutions
0%
10%
20%
30%
40%
50%
60%
70%
80%
No Yes Some have authority,some do not
% o
f re
spo
nse
s
Response
Does this person(s) have budgetary authority over implementation of climate strategies?
Public
Private
0%
10%
20%
30%
40%
50%
60%
No Yes Some are involved
% if
re
spo
nd
en
ts
Response
Is this person(s) involved in integrating climate change into existing and/or new curriculum?
Public
Private
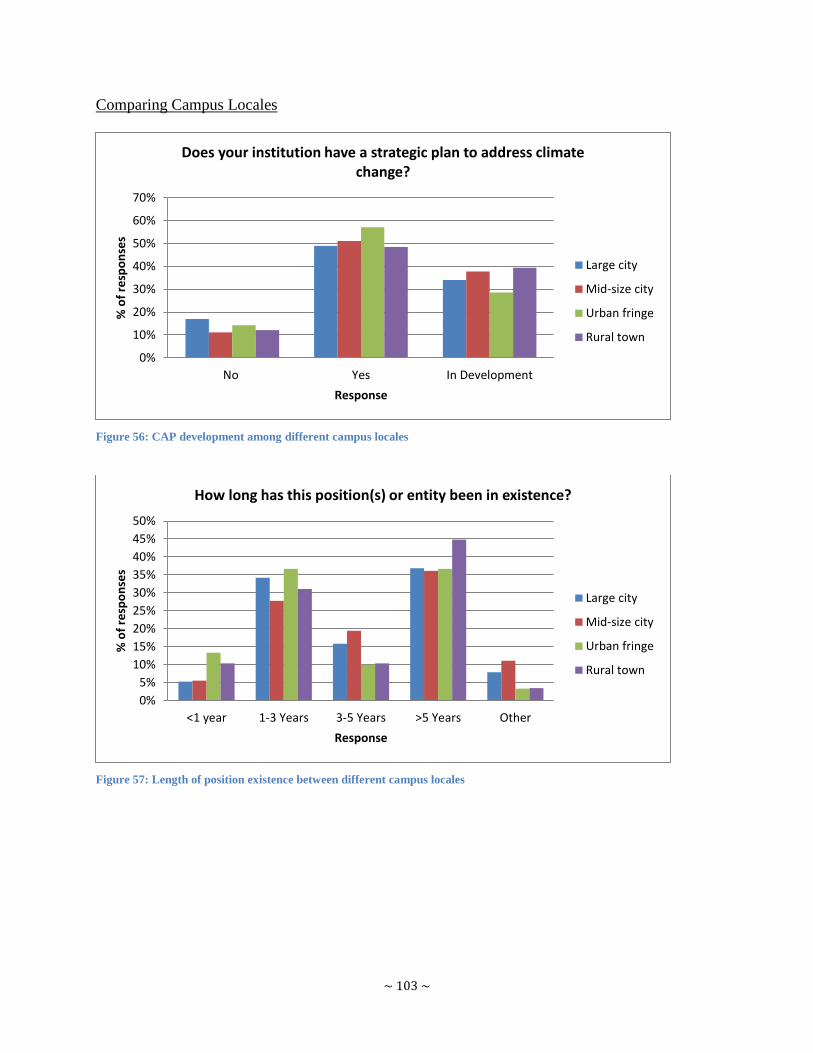
~ 103 ~
Comparing Campus Locales
Figure 56: CAP development among different campus locales
Figure 57: Length of position existence between different campus locales
0%
10%
20%
30%
40%
50%
60%
70%
No Yes In Development
% o
f re
spo
nse
s
Response
Does your institution have a strategic plan to address climate change?
Large city
Mid-size city
Urban fringe
Rural town
0%
5%
10%
15%
20%
25%
30%
35%
40%
45%
50%
<1 year 1-3 Years 3-5 Years >5 Years Other
% o
f re
spo
nse
s
Response
How long has this position(s) or entity been in existence?
Large city
Mid-size city
Urban fringe
Rural town
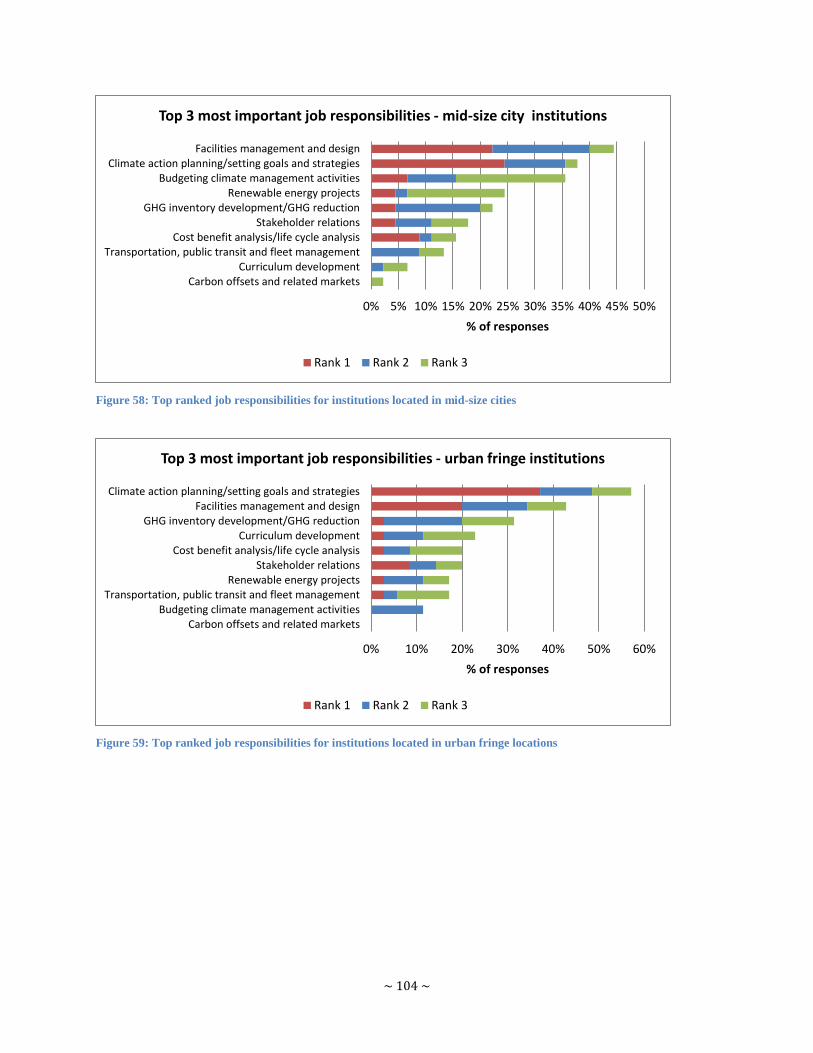
~ 104 ~
Figure 58: Top ranked job responsibilities for institutions located in mid-size cities
Figure 59: Top ranked job responsibilities for institutions located in urban fringe locations
0% 5% 10% 15% 20% 25% 30% 35% 40% 45% 50%
Carbon offsets and related marketsCurriculum development
Transportation, public transit and fleet managementCost benefit analysis/life cycle analysis
Stakeholder relationsGHG inventory development/GHG reduction
Renewable energy projectsBudgeting climate management activities
Climate action planning/setting goals and strategiesFacilities management and design
% of responses
Top 3 most important job responsibilities - mid-size city institutions
Rank 1 Rank 2 Rank 3
0% 10% 20% 30% 40% 50% 60%
Carbon offsets and related marketsBudgeting climate management activities
Transportation, public transit and fleet managementRenewable energy projects
Stakeholder relationsCost benefit analysis/life cycle analysis
Curriculum developmentGHG inventory development/GHG reduction
Facilities management and designClimate action planning/setting goals and strategies
% of responses
Top 3 most important job responsibilities - urban fringe institutions
Rank 1 Rank 2 Rank 3
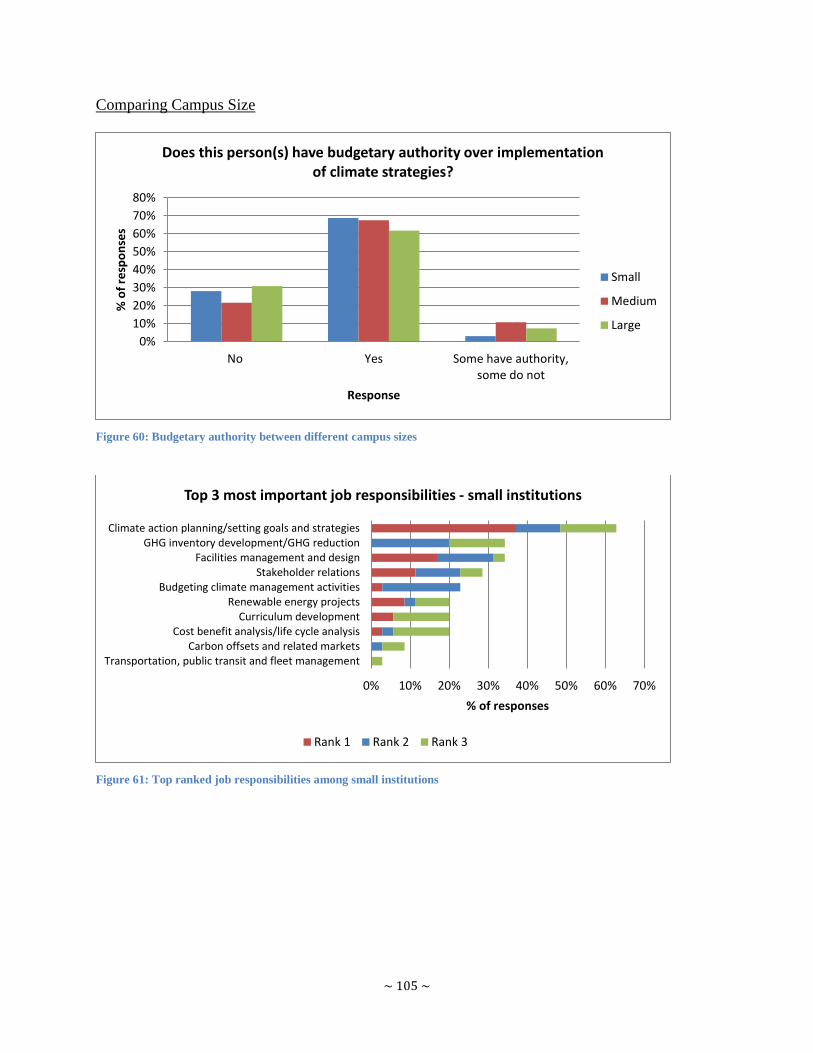
~ 105 ~
Comparing Campus Size
Figure 60: Budgetary authority between different campus sizes
Figure 61: Top ranked job responsibilities among small institutions
0%
10%
20%
30%
40%
50%
60%
70%
80%
No Yes Some have authority,some do not
% o
f re
spo
nse
s
Response
Does this person(s) have budgetary authority over implementation of climate strategies?
Small
Medium
Large
0% 10% 20% 30% 40% 50% 60% 70%
Transportation, public transit and fleet managementCarbon offsets and related markets
Cost benefit analysis/life cycle analysisCurriculum development
Renewable energy projectsBudgeting climate management activities
Stakeholder relationsFacilities management and design
GHG inventory development/GHG reductionClimate action planning/setting goals and strategies
% of responses
Top 3 most important job responsibilities - small institutions
Rank 1 Rank 2 Rank 3
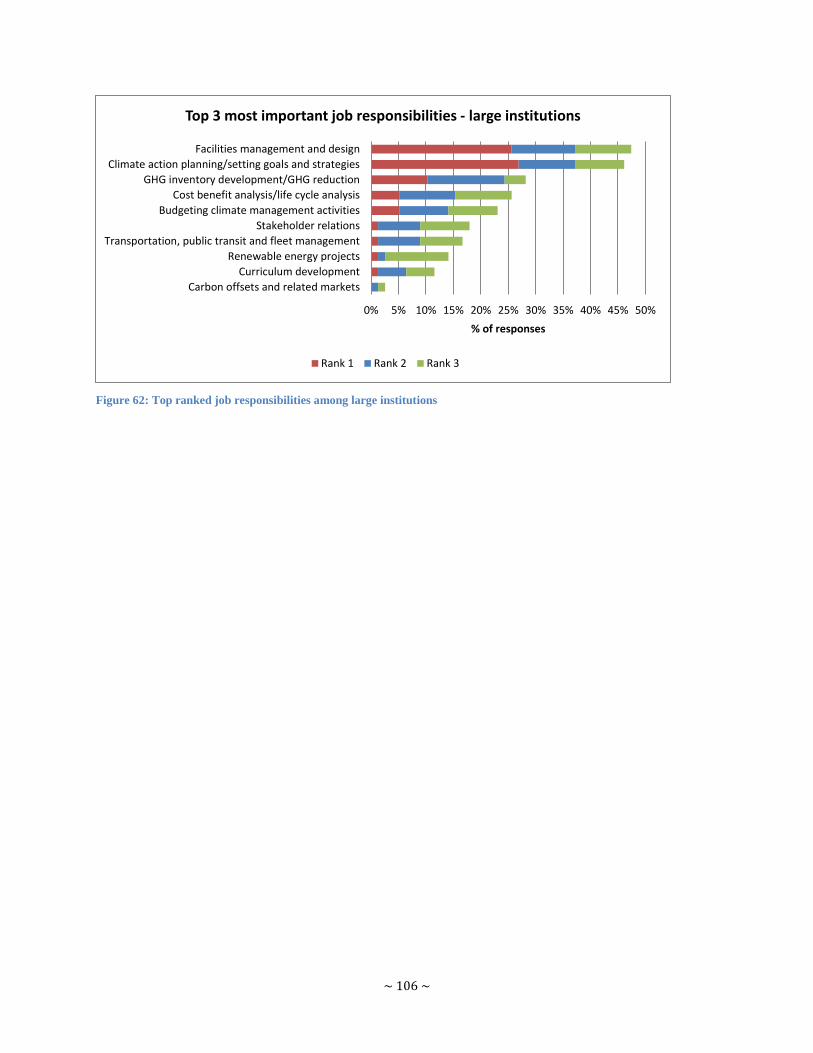
~ 106 ~
Figure 62: Top ranked job responsibilities among large institutions
0% 5% 10% 15% 20% 25% 30% 35% 40% 45% 50%
Carbon offsets and related markets
Curriculum development
Renewable energy projects
Transportation, public transit and fleet management
Stakeholder relations
Budgeting climate management activities
Cost benefit analysis/life cycle analysis
GHG inventory development/GHG reduction
Climate action planning/setting goals and strategies
Facilities management and design
% of responses
Top 3 most important job responsibilities - large institutions
Rank 1 Rank 2 Rank 3
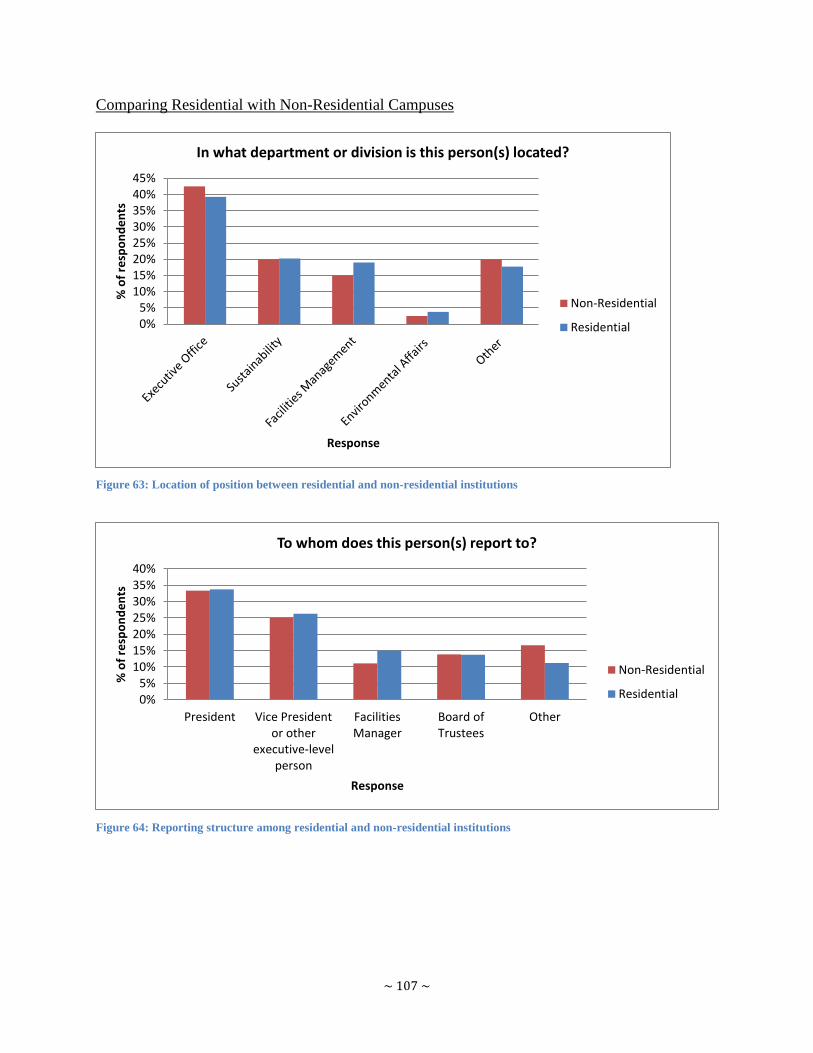
~ 107 ~
Comparing Residential with Non-Residential Campuses
Figure 63: Location of position between residential and non-residential institutions
Figure 64: Reporting structure among residential and non-residential institutions
0%5%
10%15%20%25%30%35%40%45%
% o
f re
spo
nd
en
ts
Response
In what department or division is this person(s) located?
Non-Residential
Residential
0%5%
10%15%20%25%30%35%40%
President Vice Presidentor other
executive-levelperson
FacilitiesManager
Board ofTrustees
Other
% o
f re
spo
nd
en
ts
Response
To whom does this person(s) report to?
Non-Residential
Residential
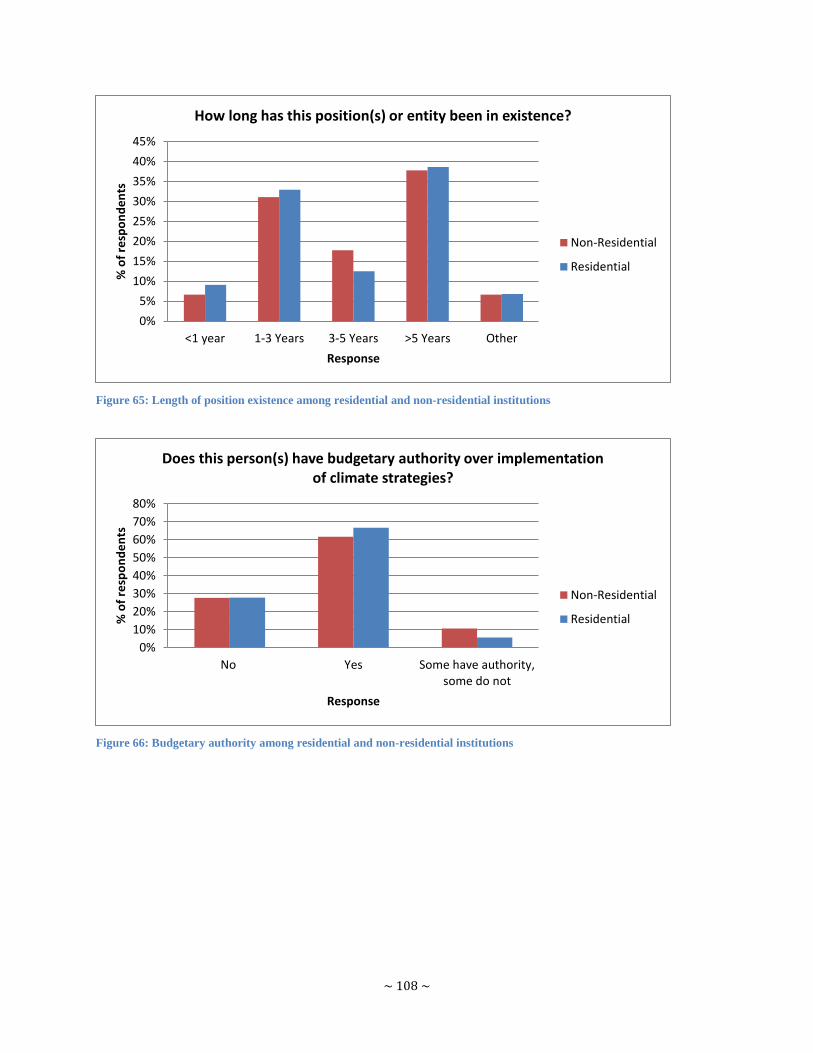
~ 108 ~
Figure 65: Length of position existence among residential and non-residential institutions
Figure 66: Budgetary authority among residential and non-residential institutions
0%
5%
10%
15%
20%
25%
30%
35%
40%
45%
<1 year 1-3 Years 3-5 Years >5 Years Other
% o
f re
spo
nd
en
ts
Response
How long has this position(s) or entity been in existence?
Non-Residential
Residential
0%
10%
20%
30%
40%
50%
60%
70%
80%
No Yes Some have authority,some do not
% o
f re
spo
nd
en
ts
Response
Does this person(s) have budgetary authority over implementation of climate strategies?
Non-Residential
Residential
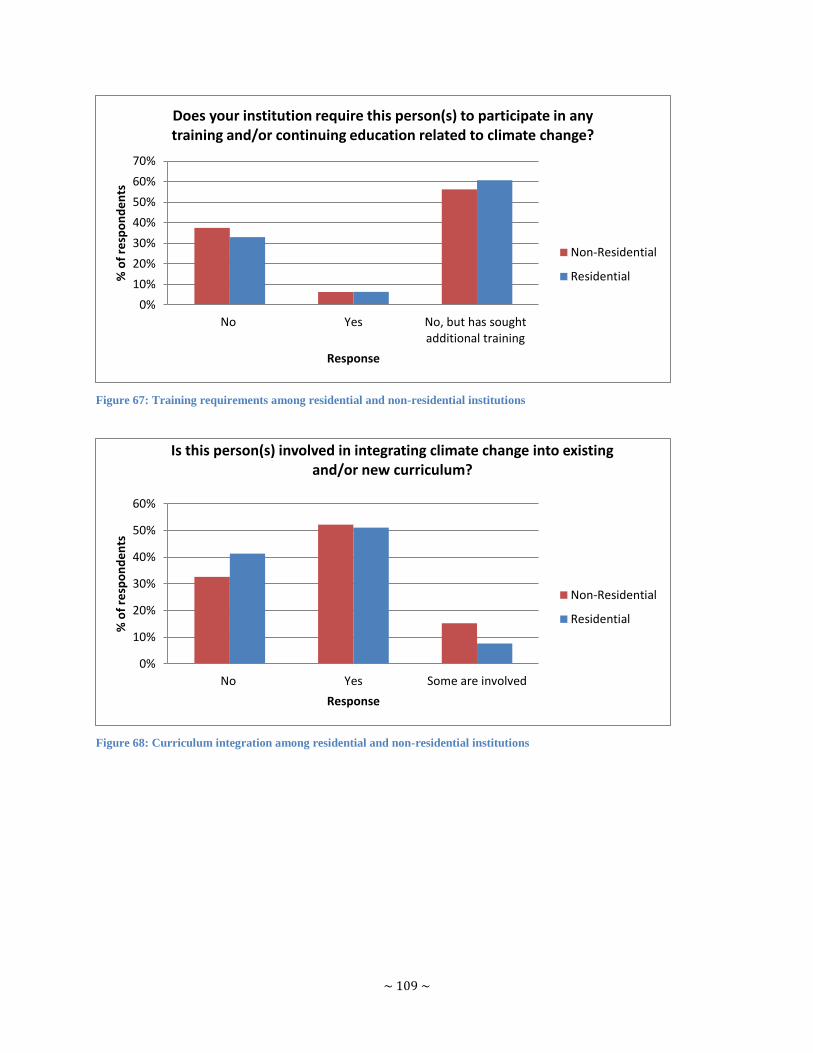
~ 109 ~
Figure 67: Training requirements among residential and non-residential institutions
Figure 68: Curriculum integration among residential and non-residential institutions
0%
10%
20%
30%
40%
50%
60%
70%
No Yes No, but has soughtadditional training
% o
f re
spo
nd
en
ts
Response
Does your institution require this person(s) to participate in any training and/or continuing education related to climate change?
Non-Residential
Residential
0%
10%
20%
30%
40%
50%
60%
No Yes Some are involved
% o
f re
spo
nd
en
ts
Response
Is this person(s) involved in integrating climate change into existing and/or new curriculum?
Non-Residential
Residential
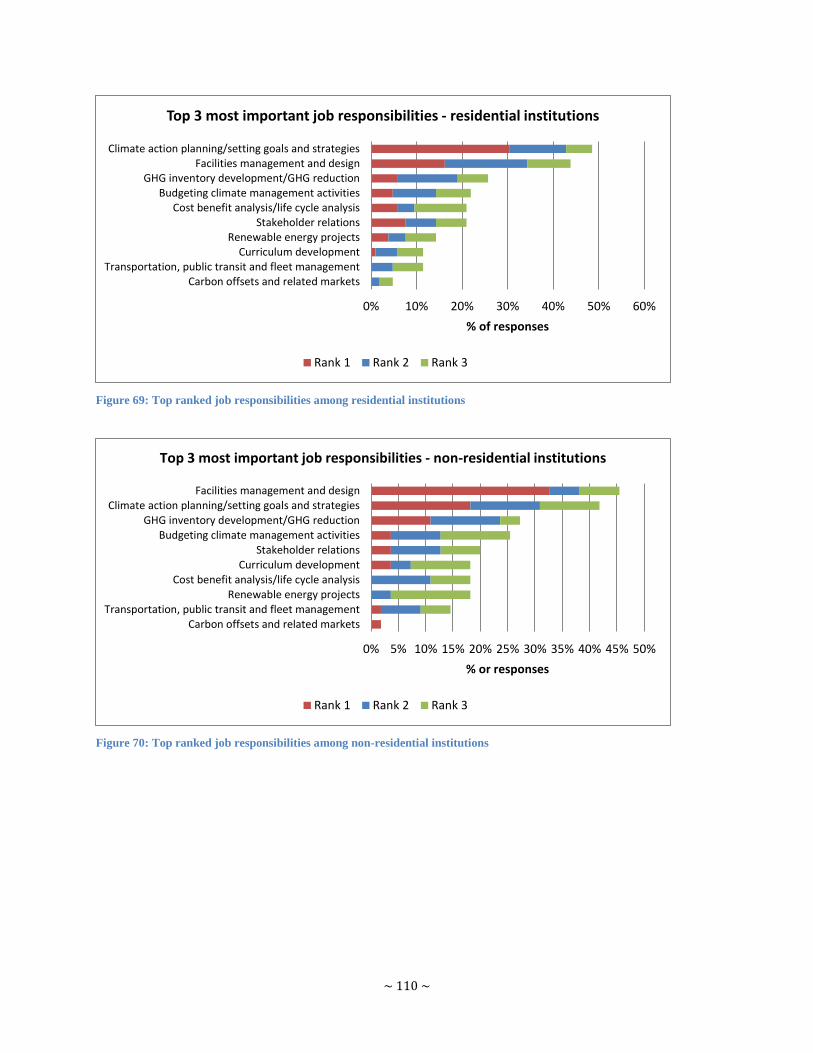
~ 110 ~
Figure 69: Top ranked job responsibilities among residential institutions
Figure 70: Top ranked job responsibilities among non-residential institutions
0% 10% 20% 30% 40% 50% 60%
Carbon offsets and related marketsTransportation, public transit and fleet management
Curriculum developmentRenewable energy projects
Stakeholder relationsCost benefit analysis/life cycle analysis
Budgeting climate management activitiesGHG inventory development/GHG reduction
Facilities management and designClimate action planning/setting goals and strategies
% of responses
Top 3 most important job responsibilities - residential institutions
Rank 1 Rank 2 Rank 3
0% 5% 10% 15% 20% 25% 30% 35% 40% 45% 50%
Carbon offsets and related marketsTransportation, public transit and fleet management
Renewable energy projectsCost benefit analysis/life cycle analysis
Curriculum developmentStakeholder relations
Budgeting climate management activitiesGHG inventory development/GHG reduction
Climate action planning/setting goals and strategiesFacilities management and design
% or responses
Top 3 most important job responsibilities - non-residential institutions
Rank 1 Rank 2 Rank 3
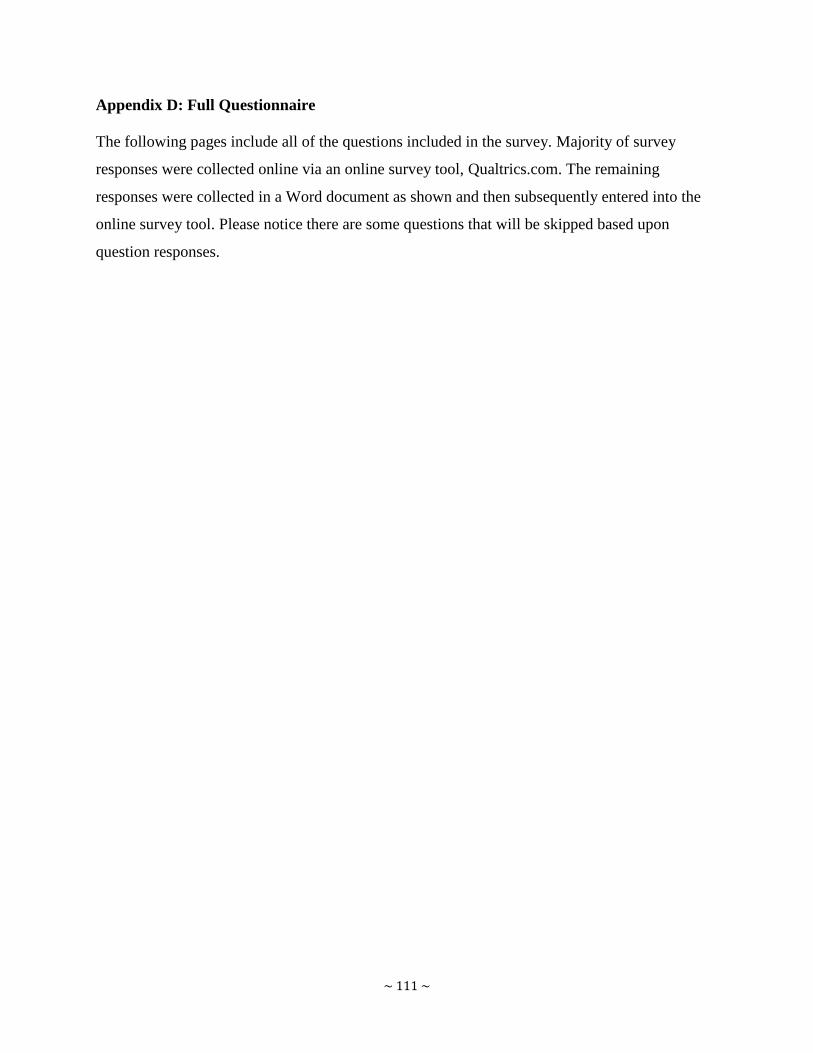
~ 111 ~
Appendix D: Full Questionnaire
The following pages include all of the questions included in the survey. Majority of survey
responses were collected online via an online survey tool, Qualtrics.com. The remaining
responses were collected in a Word document as shown and then subsequently entered into the
online survey tool. Please notice there are some questions that will be skipped based upon
question responses.
~ 112 ~
ACCO-Duke Research Project on Climate Governance
in U.S. and Canadian Higher Education Institutions
About this Questionnaire
This project is a joint effort between graduate students at Duke University and the Association of Climate Change
Officers (ACCO). The purpose of this survey is to assess climate change governance and climate change
professionals in higher education institutions. The information gathered and reported by the project managers will
be used to draw conclusions on the state of climate change as a profession and will be shared via a publication and
an April 2011 event to unveil the findings.
Please only submit one questionnaire response per institution.
Deadline for all submissions is COB on December 17, 2010.
This survey is expected to take approximately 15 to 20 minutes.
IMPORTANT: Please note that some questions posed in the questionnaire are dependent upon answers to
previous questions. In this particular document, we‘ve highlighted instructions in red and questions in
blue.
Key Terms
Project Managers: Four Duke University graduate students in partnership with the Association of Climate
Change Officers (ACCO)
Higher Education Institution: Includes accredited 2 year, 4 year, and community colleges and
universities
University Executive: Refers to executive level positions such as the University President, Vice President,
Provost etc.
Climate Change: Refers to any distinct change in measures of climate lasting for a long period of time. In
other words, ―climate change‖ means major changes in temperature, rainfall, snow, or wind patterns lasting
for decades or longer.
Answer Type Terms (pertains to this Word document)
Radio Box: Only one response may be selected.
Check Box: One, multiple or all choices may be selected.
Questions Please contact the Duke project managers ([email protected]) or ACCO Executive Director Daniel
Kreeger ([email protected] - 202-496-7390) with questions about the research project.
An FAQ can be found at the following link: http://www.accoonline.org/duke/faq.html
By continuing with this survey, you agree that you have read and understand the above information and consent to
participate in this survey.
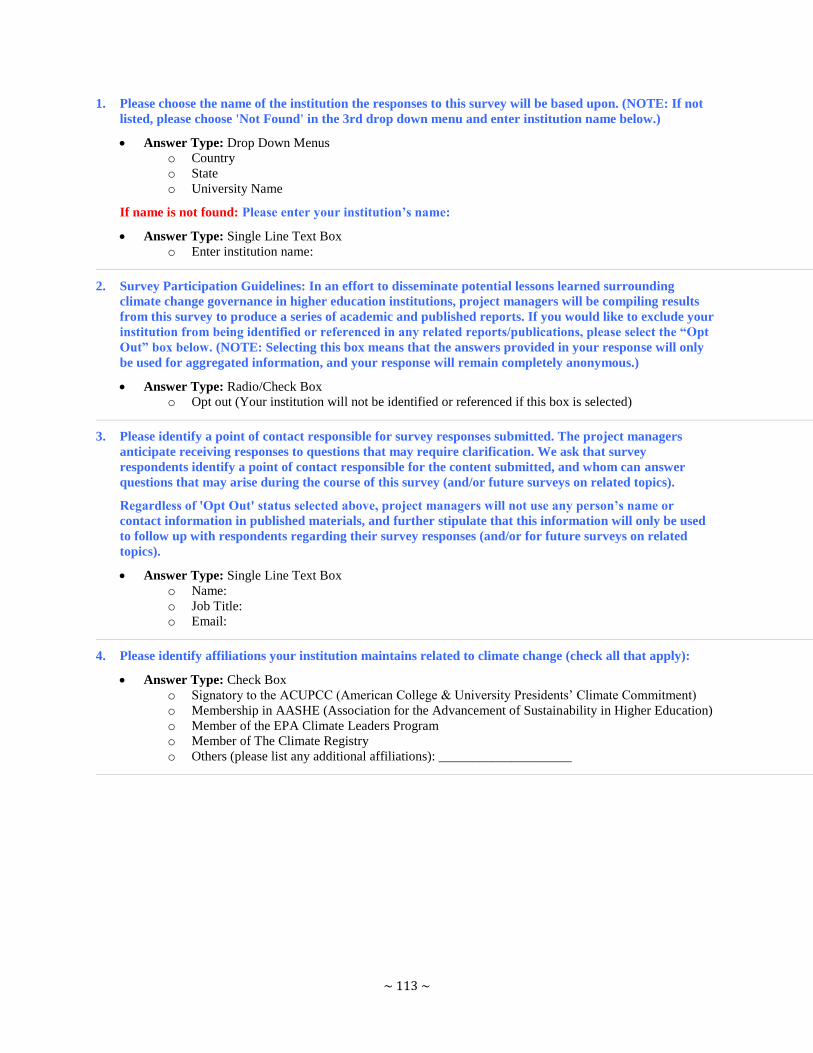
~ 113 ~
1. Please choose the name of the institution the responses to this survey will be based upon. (NOTE: If not
listed, please choose 'Not Found' in the 3rd drop down menu and enter institution name below.)
Answer Type: Drop Down Menus
o Country
o State
o University Name
If name is not found: Please enter your institution’s name:
Answer Type: Single Line Text Box
o Enter institution name:
2. Survey Participation Guidelines: In an effort to disseminate potential lessons learned surrounding
climate change governance in higher education institutions, project managers will be compiling results
from this survey to produce a series of academic and published reports. If you would like to exclude your
institution from being identified or referenced in any related reports/publications, please select the “Opt
Out” box below. (NOTE: Selecting this box means that the answers provided in your response will only
be used for aggregated information, and your response will remain completely anonymous.)
Answer Type: Radio/Check Box
o Opt out (Your institution will not be identified or referenced if this box is selected)
3. Please identify a point of contact responsible for survey responses submitted. The project managers
anticipate receiving responses to questions that may require clarification. We ask that survey
respondents identify a point of contact responsible for the content submitted, and whom can answer
questions that may arise during the course of this survey (and/or future surveys on related topics).
Regardless of 'Opt Out' status selected above, project managers will not use any person’s name or
contact information in published materials, and further stipulate that this information will only be used
to follow up with respondents regarding their survey responses (and/or for future surveys on related
topics).
Answer Type: Single Line Text Box
o Name:
o Job Title:
o Email:
4. Please identify affiliations your institution maintains related to climate change (check all that apply):
Answer Type: Check Box
o Signatory to the ACUPCC (American College & University Presidents‘ Climate Commitment)
o Membership in AASHE (Association for the Advancement of Sustainability in Higher Education)
o Member of the EPA Climate Leaders Program
o Member of The Climate Registry
o Others (please list any additional affiliations): ____________________
~ 114 ~
5. Which of the following has significant climate and energy related implications for the institution (e.g.
these operations would indicate significant energy consumption and/or climate-related
risks/opportunities)? Please include facilities on satellite campuses. (Choose all that apply)
Answer Type: Check Box (Other category includes a single line text box)
o Membership in AASHE
(Association for the Advancement
of Sustainability in Higher
o Research facilities/laboratories
o Hospital or large clinics
o Athletic facilities (capacity >
10,000)
o Large Residence Halls
o Professional schools
(Business, Law, Medical)
o Others (please describe and/or list):
__________________
6. Has your institution undergone any organizational restructuring related to climate change governance in
the past 3 years? (e.g. creation of a new position and/or department; other changes to the organization
chart)
Answer Type: Radio Box
o Yes
o No
If “YES”: Please describe the restructuring that took place and the reasoning for the restructuring.
Answer Type: Multi-line Text Box
7. Does your institution have a strategic plan (e.g. Climate Action Plan) to address climate change?
Note: This question is a branch question. Please note secondary questions or instructions based on the
answers selected.
Answer Type: Radio Box
o Yes
o A plan is in development
o No
If “Yes”: Who is and/or was involved in the development of this climate plan? (Please identify the job
titles of the people and/or parties involved and their roles)
Answer Type: Multi-line Text Box
If “In Progress”: Who is and/or will be involved in the implementation of this climate plan? (Please
identify the job titles of the people and/or parties involved and their roles)
Answer Type: Multi-line Text Box
If “No”: Please Proceed to Question 13
~ 115 ~
8. Who directly oversees your institution's response to climate change and is accountable (i.e. possesses the
highest authority regarding climate change decisions) for addressing the economic, operational and
environmental implications of climate change, potentially including directing strategies and/or overseeing
budgetary considerations?
Note: This question is a branch question. Please note secondary questions or instructions based on the
answers selected.
Answer Type: Radio Box
o (a) The President or Chief Executive of your institution
o (b) A single individual (either executive-level or staff-level)
o (c) A committee, panel or task force (e.g. sustainability/climate change committee, a Board of
Trustees committee or the Board of Trustees itself)
o (d) Multiple people (e.g. multiple people are accountable for various components but are not
formally in a committee)
o (e) Other (e.g. any combination of the above options; governance not described by any of the
options above)
o (f) There is currently no person or persons accountable for climate change issues within your
institution
If answer (a) or (b) above: Please proceed to the next question.
If answer (c) above: Please skip the next question and proceed directly to question 22 (page 8).
If answer (d) above: Please skip the next question and proceed directly to question 32 (page 11).
If answer (e) above: Please skip the next question and proceed directly to question 39 (page 14).
If answer (f) above: Please skip the next question and proceed directly to question 52 (page 18).
9. Please provide the specific job title of the individual who is accountable (i.e. possesses the highest
authority regarding climate change decisions) for the institution's response to climate change issues:
Answer Type: Single Line Text Box
o Job Title:
10. In what department or division is this person located? (Check all that apply)
Answer Type: Check Box
o Executive Office (e.g. Office of the
President)
o Sustainability
o Facilities Management
o Environmental Affairs (or EH&S)
o Other (Please specify):
___________________
11. To whom does this person report administratively? (Check all that apply)
Answer Type: Check Box
o President
o Vice President or other executive-
level person
o Facilities Manager
o Board of Trustees
o Other (Please specify):
________________
12. What other governing bodies, groups or departments oversee the work of this person? (Check all apply)
Answer Type: Check Box
o Board of Trustees
o University system governing body (e.g. University of California, Office of the President)
o State-level government agencies
o University Staff (e.g. Director of Sustainability)
o Faculty
o Students
o Other (Please specify): ____________________
13. Does this position receive any support from other people and/or groups (e.g. staff, students, faculty,
external advisors)?
Answer Type: Multi-line Text Box
o Please describe.
14. How long has this person’s position been in existence at your institution?
Answer Type: Check Box
o Less than 1 year
o 1-3 years
o 3-5 years
o More than 5 years
15. Please choose the areas in which this person has professional experience (Check all that apply):
Answer Type: Check Box
o University Administration
o Environmental Management
o Business Administration
o Climate Change Strategies
o Sustainability
o Government/Public Affairs
o Facilities Management
o Other (Please specify any additional areas): ____________________
16. Did this person previously hold a position within your institution? (i.e. Were they hired from within?)
Answer Type: Check Box + Single Line Text Box
o Yes (please specify previous job title): ____________________
o No (please specify the job title at the previous employer): ____________________
17. Does this person have any budgetary authority over implementation of climate change strategies?
Answer Type: Check Box + Single Line Text Box
o Yes (please describe the nature of this authority): ____________________
o No (please describe who does have authority) ____________________

~ 117 ~
18. Please indicate which topics are of importance to this person's job responsibilities particularly related to
climate change (check all that apply):
Answer Type: Check Box + Single-Line Text Box
o Carbon offsets and related markets
o Facilities management and design
o Transportation, public transit and fleet management
o Renewable energy projects
o Stakeholder relations
o Cost benefit analysis/life cycle analysis
o GHG inventory development and/or identification of GHG reductions goals
o Climate action planning/setting goals and strategies
o Budgeting climate management activities
o Curriculum development
o Other 1 (Please describe): ____________________
o Other 2 (Please describe): ____________________
o Other 3 (Please describe): ____________________
19. Please rank the top 3 most important topics listed above (and below):
Answer Type: Check Box + Single-Line Text Box
o Carbon offsets and related markets
o Facilities management and design
o Transportation, public transit and fleet management
o Renewable energy projects
o Stakeholder relations
o Cost benefit analysis/life cycle analysis
o GHG inventory development and/or identification of GHG reductions goals
o Climate action planning/setting goals and strategies
o Budgeting climate management activities
o Curriculum development
o Other 1 (Please describe): ____________________
o Other 2 (Please describe): ____________________
o Other 3 (Please describe): ____________________
20. Does your institution require that this person participate in any training and/or continuing education
related to climate change?
Answer Type: Radio Box + Single-Line Text Box
o Yes. (Please describe the training and if it was paid for by your institution):
____________________
o No, however, this person has sought additional training/education. (Please describe the training
and if it was paid for by your institution): ____________________
o No, and this person has not received additional training/education.

~ 118 ~
21. Is this person involved in integrating climate change into existing and/or new curriculum?
Answer Type: Radio Box
o Yes
o No
If “Yes”: Please describe the nature of involvement below.
Answer Type: Multi-line Text Box
If “No”: Please discuss how climate change is being integrated into existing and new curriculum with a
description of those who are accountable for this area.
Answer Type: Multi-line Text Box
Please proceed to question 53 (page 19).
~ 119 ~
Proceed with this section only if you answered choice (c) to question 8.
22. Please describe the roles and responsibilities of the entity (committee, panel or task force) that is
accountable (i.e. possesses the highest authority regarding climate change decisions) for the institution's
response to climate change issues, including the job titles of the people involved:
Answer Type: Multi-Line Text Box
23. Does this entity report to an executive-level person or the Board of Trustees of your institution? If so,
please describe:
Answer Type: Radio Box + Single-Line Text Box
o Yes (please specify): ____________________
o No (please specify to whom they report): ____________________
24. What other governing bodies, groups or departments oversee the work of this entity? (Check all apply)
Answer Type: Check Box + Single Line Text Box
o University system governing body (i.e. University of California, Office of the President)
o State-level government agencies
o University staff (e.g. Director of Sustainability)
o Faculty
o Students
o Other (Please specify): ____________________
25. Does this entity receive any support from other people and/or groups (e.g. staff, students, faculty,
external advisors)?
Answer Type: Multi-Line Text Box
o Please describe
26. How long has this entity been in existence at your institution?
Answer Type: Radio Box
o Less than 1 year
o 1-3 years
o 3-5 years
o More than 5 years
27. Does the entity identified above have any budgetary authority over implementation of climate change
strategies?
Answer Type: Radio Box + Single Line Text Box
o Yes (please describe the nature of this authority): ____________________
o No (please describe who does have authority): ____________________
~ 120 ~
28. Please indicate which topics are of importance to this entity's responsibilities particularly related to
climate change (check all that apply):
Answer Type: Check Box + Single Line Text Box
o Carbon offsets and related markets
o Facilities management and design
o Transportation, public transit and fleet management
o Renewable energy projects
o Stakeholder relations
o Cost benefit analysis/life cycle analysis
o GHG inventory development and/or identification of GHG reductions goals
o Climate action planning/setting goals and strategies
o Budgeting climate management activities
o Curriculum development
o Other 1 (Please describe): ____________________
o Other 2 (Please describe): ____________________
o Other 3 (Please describe): ____________________
29. Please rank the top 3 most important topics listed above:
Answer Type: Check Box + Single Line Text Box
o Carbon offsets and related markets
o Facilities management and design
o Transportation, public transit and fleet management
o Renewable energy projects
o Stakeholder relations
o Cost benefit analysis/life cycle analysis
o GHG inventory development and/or identification of GHG reductions goals
o Climate action planning/setting goals and strategies
o Budgeting climate management activities
o Curriculum development
o Other 1 (Please describe): ____________________
o Other 2 (Please describe): ____________________
o Other 3 (Please describe): ____________________
30. Does your institution require any members of this entity to participate in training and/or continuing
education related to climate change?
Answer Type: Radio Box + Single Line Text Box
o Yes, all of the members are required to participate. (Please describe the training and if it was paid
for by your institution): ____________________
o Some of the members are required to participate. (Please describe the training and if it was paid
for by your institution): ____________________
o No, however, some or all of the members have sought additional training/education. (Please
describe the training and if it was paid for by your institution): ____________________
o No, and none of the members have received additional training/education.

~ 121 ~
31. Is this entity involved in integrating climate change into existing and/or new curriculum?
Answer Type: Radio Box
o Yes
o No
If “Yes”: Please describe the nature of involvement below.
Answer Type: Multi-line Text Box
If “No”: Please discuss how climate change is being integrated into existing and new curriculum with a
description of those who are accountable for this area.
Answer Type: Multi-line Text Box
Please proceed to question 53 (page 19).
~ 122 ~
Proceed with this section only if you answered choice (d) to question 8.
32. Please describe the people (roles and responsibilities) who are accountable (i.e. possess the highest
authority regarding climate change decisions) for the institution's response to climate change issues.
Please include their names and positions, as well as who they each report to and any support they receive
from other people and/or groups (e.g. staff, students, faculty, external advisors).
Answer Type: Multi-line Text Box
33. For each person (who was listed in the previous question), please describe how long his/her position has
been in existence in its current form.
Answer Type: Multi-line Text Box
34. Do the people listed above have any budgetary authority over implementation of climate change
strategies?
Answer Type: Radio Box + Single Line Text Box
o Yes, all of them do (please describe the nature of this authority): ____________________
o Some have authority, some do not (please describe who has authority and the nature of this
authority): ____________________
o No, none of them do (please describe who does have authority): ____________________
~ 123 ~
35. In this question, please consider all of the individuals (who were listed at the top of the page) to be one
single entity, then please indicate which topics are of importance to this entity's responsibilities
particularly related to climate change (check all that apply):
Answer Type: Check Box + Single Line Text Box
o Carbon offsets and related markets
o Facilities management and design
o Transportation, public transit and fleet management
o Renewable energy projects
o Stakeholder relations
o Cost benefit analysis/life cycle analysis
o GHG inventory development and/or identification of GHG reductions goals
o Climate action planning/setting goals and strategies
o Budgeting climate management activities
o Curriculum development
o Other 1 (Please describe): ____________________
o Other 2 (Please describe): ____________________
o Other 3 (Please describe): ____________________
36. Of the topics selected in the previous question, please rank the 3 most important ones relative to the job
responsibilities of these people (if this varies between people please describe). Note: when ranking the top
3 topics, please include the numbers 1-3 with the corresponding topics, with 1 meaning the most
important.
Answer Type: Check Box + Single Line Text Box
o Carbon offsets and related markets
o Facilities management and design
o Transportation, public transit and fleet management
o Renewable energy projects
o Stakeholder relations
o Cost benefit analysis/life cycle analysis
o GHG inventory development and/or identification of GHG reductions goals
o Climate action planning/setting goals and strategies
o Budgeting climate management activities
o Curriculum development
o Other 1 (Please describe): ____________________
o Other 2 (Please describe): ____________________
o Other 3 (Please describe): ____________________
37. Does your institution require that the people (who were described at the top of the page) participate in
any training and/or continuing education related to climate change?
Answer Type: Radio Box + Single Line Text Box
o Yes, all of them are required to participate. (Please describe the training and if it was paid for by
your institution): ____________________
o Some of them are required to participate. (Please describe the training and if it was paid for by
your institution): ____________________
o No, however, some or all of them have sought additional training/education. (Please describe the
training and if it was paid for by your institution): ____________________
o No, and none of them have received additional training/education

~ 124 ~
38. Are any of these people (who were described at the top of the page) involved in integrating climate
change into existing and/or new curriculum?
Answer Type: Radio Box
o Yes, at least one person is involved in curriculum development
o No
If “Yes”: Please describe the nature of involvement below.
Answer Type: Multi-line Text Box
If “No”: Please discuss how climate change is being integrated into existing and new curriculum with a
description of those who are accountable for this area.
Answer Type: Multi-line Text Box
Please proceed to question 53 (page 19).
~ 125 ~
Proceed with this section only if you answered choice (e) to question 8.
39. Please describe the climate change governance structure at your institution, including the names and
titles of any individuals or groups involved (i.e. describe how your institution is organized to respond to
climate change issues and who has the highest authority regarding climate change decisions):
Answer Type: Multi-line Text Box
NOTE: Questions x-y in this section refer to the individuals or groups identified in your response to question
39. If any of the following questions do not apply to the current climate change governance at your
institution, please select 'Not Applicable'.
40. In what department or division is this person(s) located? (Check all that apply)
Answer Type: Check Box + Single Line Text Box
o Executive Office (e.g. Office of the President)
o Sustainability Office
o Facilities Management
o Environmental Affairs (or EH&S)
o Other (please specify any additional affiliations): ____________________
o Not Applicable
41. To whom does this person(s) report administratively? (Check all that apply)
Answer Type: Check Box + Single Line Text Box
o President
o Vice President or other executive level person
o Facilities Manager
o Board of Trustees
o Other (please specify any additional entities): ____________________
o Not Applicable
42. What other governing bodies or departments oversee the work of this person(s)? (Check all apply)
Answer Type: Check Box + Single Line Text Box
o Board of Trustees
o University system governing body (i.e. University of California, Office of the President)
o State-level government agencies
o University Staff (e.g. Director of Sustainability)
o Faculty
o Students
o Other (please specify any additional entities): ____________________
o Not Applicable
43. How long has this position(s) been in existence at your institution?
Answer Type: Radio Box
o Less than 1 year
o 1-3 years
o 3-5 years
o More than 5 years
o Not Applicable
~ 126 ~
44. Please choose the areas in which this person(s) has professional experience (Check all that apply):
Answer Type: Check Box + Single Line Text Box
o University Administration
o Environmental Management
o Business Administration
o Climate Change Strategies
o Sustainability
o Government/Public Affairs
o Facilities Management
o Other (Please specify any additional areas): ____________________
o Not Applicable
45. Did this person(s) previously hold a position within your institution? (i.e. Were they hired from within?)
Answer Type: Radio Box + Single Line Text Box
o Yes, (please specify previous title): ____________________
o No (please specify job title at previous employer): ____________________
o Not Applicable
46. Does the person(s) identified above have any budgetary authority over implementation of climate change
strategies? NOTE: If there are multiple people involved in responding to climate change, choose 'Yes' if
any people have any authority, then describe that nature of the authority.
Answer Type: Radio Box + Single Line Text Box
o Yes, (please describe the nature of this authority): ____________________
o No (please describe who does have authority): ____________________
o Not Applicable
~ 127 ~
47. Please indicate which topics are of importance to this person(s) job responsibilities particularly related to
climate change (check all that apply):
Answer Type: Check Box + Single Line Text Box
o Carbon offsets and related markets
o Facilities management and design
o Transportation, public transit and fleet management
o Renewable energy projects
o Stakeholder relations
o Cost benefit analysis/life cycle analysis
o GHG inventory development and/or identification of GHG reductions goals
o Climate action planning/setting goals and strategies
o Budgeting climate management activities
o Curriculum development
o Other (Please describe): ____________________
o Other (Please describe): ____________________
o Other (Please describe): ____________________
48. Of the topics selected in the previous question, please rank the 3 most important ones relative to the job
responsibilities of this person(s) (if relative to multiple people, please also describe what led you to rank
the topics in the way that you did). Note: when ranking the top 3 topics, please include the numbers 1-3
with the corresponding topics, with 1 meaning the most important.
Answer Type: Check Box + Single Line Text Box
o Carbon offsets and related markets
o Facilities management and design
o Transportation, public transit and fleet management
o Renewable energy projects
o Stakeholder relations
o Cost benefit analysis/life cycle analysis
o GHG inventory development and/or identification of GHG reductions goals
o Climate action planning/setting goals and strategies
o Budgeting climate management activities
o Curriculum development
o Other (Please describe): ____________________
o Other (Please describe): ____________________
o Other (Please describe): ____________________
49. Does your institution require this person(s) participate in training and/or continuing education related to
climate change? NOTE: If there are multiple people involved in responding to climate change, choose
'Yes' if any people have participated in training, then please describe.
Answer Type: Radio Box + Single Line Text Box
o Yes, (Please describe the training and if it was paid for by your institution):
____________________
o No, however, this person(s) has sought additional training/education. (Please describe the training
and if it was paid for by your institution): ____________________
o No, and this person(s) has not received additional training/education
o Not Applicable
~ 128 ~
50. Is this person(s) involved in integrating climate change into existing and/or new curriculum?
Answer Type: Radio Box
o Yes
o No
o Not Applicable
If “Yes”: Please describe the nature of involvement below.
Answer Type: Multi-line Text Box
If “No”: Please discuss how climate change is being integrated into existing and new curriculum with a
description of those who are accountable for this area.
Answer Type: Multi-line Text Box
51. Are there any aspects surrounding your institution's response to climate change issues that have not been
addressed in the survey thus far (i.e. any other arrangements within your institution that may be
unique)?
Answer Type: Multi-line Text Box
o Please describe.
Please proceed to question 53 (page 19).

~ 129 ~
Proceed with this section only if you answered choice (f) to question 8.
52. Please describe any plans to create a position, function or entity which will be accountable for the
institution's response to climate change issues, including addressing the economic, operational and
environmental implications of climate change.
Answer Type: Multi-line Text Box
Please proceed to question 53 (page 19).
~ 130 ~
53. Please indicate which of the following Greenhouse Gas Protocol scopes your institution is working on
to address emissions (check all that apply).
Answer Type: Check Box + Single Line Text Box
o Scope 1 (All direct GHG emissions)
o Scope 2 (Indirect GHG emissions from consumption of purchased electricity, heat or steam)
o Scope 3 (Other indirect GHG emissions, such as the extraction and production of purchased
materials and fuels, transport-related activities in vehicles not owned or controlled by the reporting
entity, electricity-related activities not covered in Scope 2, outsourced activities, waste disposal,
etc.). Please describe which aspects of Scope 3 your institution works on:
____________________
o Not Applicable
54. Please rate the challenges or organizational barriers to addressing climate change facing the institution.
Answer Type: Matrix Radio Box + Single Line Text Box
(Minor Concern)
1 2 3 4
(Major Concern)
5 N/A
Budget Issues О О О О О О
Organizational structure issues О О О О О О
Educating and training
university executives О О О О О О
Educating and training staff,
students and/or faculty О О О О О О
Lack of communication between
institutional groups О О О О О О
Accommodating various
stakeholder needs О О О О О О
Competing institutional
priorities О О О О О О
Other (please specify):
______________________ О О О О О О
Other (please specify):
______________________ О О О О О О
Other (please specify):
______________________ О О О О О О
55. Please elaborate on the challenges or organizational barriers to addressing climate change facing the
institution selected in the above question.
Answer Type: Multi-line Text Box
56. Please feel free to add any additional comments related to topics covered in this survey.
Answer Type: Multi-line Text Box
57. In an effort to gather more qualitative data surrounding how higher education institutions are
addressing climate change, the project managers will be conducting case studies of individual institutions.
~ 131 ~
Would you be willing to participate in a case study interview regarding how your institution is addressing
climate change? (These interviews will take place early 2011 and will take approximately 30 to 60
minutes)
NOTE: Responding institutions can only participate in this case study if the institution has NOT selected
the opt out clause at the beginning of the survey
Answer Type: Radio Box + Single Line Text Box
o Yes, I am interested in participating in a case study. Enter name, email and phone number here:
____________________
o No
58. Please confirm by checking below that the information entered into this survey is accurate to the best of
your knowledge.
Answer Type: Radio Box
o Yes, I have reviewed all survey question responses and they are accurate to the best of my
knowledge
~ 132 ~
Works Cited
1 Sinha, P, et al. "Greenhouse gas emissions from U.S. institutions of higher education." Journal of the Air & Waste
Management Association. 2010 May;60(5):568-73. <http://www.ncbi.nlm.nih.gov/pubmed/20480856>.
2 ―Mission and History‖ American College and University Presidents’ Climate Commitment.
http://www.presidentsclimatecommitment.org/about/mission-history
3 ―Timeline‖ STARS Sustainability Tracking Assessment and Rating System. AASHE.
https://stars.aashe.org/pages/about/history/timeline.html
4 Wright, T.S.A. 2002. Definitions and frameworks for environmental sustainability in higher education. Higher
Education Policy, V.15, N2. Pp105-120.
5 Bekessy, S.A., Samson, K., Clarkson, R.E. 2007. The failure of non-binding declarations to achieve university
sustainability: A need for accountability. International Journal of Sustainability in Higher Education. Vol.8, No.3.
Pp 301-316.
6 Bekessy, S.A., Samson, K., Clarkson, R.E. 2007. The failure of non-binding declarations to achieve university
sustainability: A need for accountability. International Journal of Sustainability in Higher Education. Vol.8, No.3.
Pp 301-316.
7 Wright, T.S.A. 2002. Definitions and frameworks for environmental sustainability in higher education. Higher
Education Policy, V.15, N2. Pp105-120.
8 Wright, T.S.A. 2002. Definitions and frameworks for environmental sustainability in higher education. Higher
Education Policy, V.15, N2. Pp105-120.
9 Herremans, I. and Allwright, D. 2000. Environmental management systems at North American universities: what
drives good performance? International journal of Sustainability in Higher Education, Vol.1 No.2 pp 179-185.
10 Wright, T.S.A. 2002. Definitions and frameworks for environmental sustainability in higher education. Higher
Education Policy, V.15, N2. Pp105-120.
11 Herremans, I. and Allwright, D. 2000. Environmental management systems at North American universities: what
drives good performance? International journal of Sustainability in Higher Education, Vol.1 No.2 pp 179-185.
12 Velazquez, L., Munguia, N., Sanchez, M. 2005. Deterring sustainability in higher education institutions: An
appraisal of the factors which influence sustainability in higher education institutions. International Journal of
Sustainability in Higher Education. 6. 4. Pp.383-391.
13 Bekessy, S.A., Samson, K., Clarkson, R.E. 2007. The failure of non-binding declarations to achieve university
sustainability: A need for accountability. International Journal of Sustainability in Higher Education. Vol.8, No.3.
Pp 301-316.
14 Herremans, I. and Allwright, D. 2000. Environmental management systems at North American universities: what
drives good performance? International journal of Sustainability in Higher Education, Vol.1 No.2 pp 179-185.
15 Survey created using Qualtrics, www.qualtrics.com
16 The Carnegie Classification of Institutions of Higher Education. <http://classifications.carnegiefoundation.org/>.
17"Number of degree-granting institutions and enrollment in these institutions, by size, type, and control of
institution: Fall 2006." National Center for Education Statistics.
<http://nces.ed.gov/programs/digest/d08/tables/dt08_234.asp>.
18 Buckner, Jay. "Berea Is the Greenest School in Kentucky, According to College Sustainability Report Card."
Berea Spotlight. Berea College, 11 Jan. 2011. <http://www.berea.edu/bcspotlight/20110111-berearankeco.asp>.
19 "History — Nicholas School of the Environment at Duke University." Duke Environment at the Nicholas School.
Nicholas School of the Environment at Duke University. Web. <http://www.nicholas.duke.edu/about/history/>.
~ 133 ~
20
―About - Introduction." Duke Forest at Duke University. Duke University.
<http://www.dukeforest.duke.edu/about/index.html>.
21 "Medical Center and Health System Facts." Duke Medicine - Facts and Statistics. Duke Medicine, 2011.
<http://www.dukemedicine.org/AboutUs/Facts_and_Statistics>.
22 "Diversity at Duke: Demographic Statistics." Diversity at Duke University. Duke University.
<http://diversity.duke.edu/atduke/demographics.php>.
23 "GHG Report for Duke University." GHG Report for Duke University. ACCUPC, 19 Nov. 2010.
<http://acupcc.aashe.org/ghg/1510/>.
24 "Planning and Leadership." Planning and Leadership. Evergreen State College.
<http://www.evergreen.edu/sustainability/planningandleadership.htm>.
25 "Planning and Leadership." Planning and Leadership. Evergreen State College.
<http://www.evergreen.edu/sustainability/planningandleadership.htm>.
26 "About the Program." Middlebury. Middlebury College. <http://www.middlebury.edu/academics/es/about>.
27 "Middlebury Environmental Council Pathways to a Green Campus, Awareness and Education." Middlebury
College: Community Home Page. Middlebury College. <http://community.middlebury.edu/~enviroc/aande.html>.
28 "Middlebury Environmental Council Index." Middlebury College: Community Home Page. Middlebury College.
<http://community.middlebury.edu/~enviroc/>.
29 "Middlebury Environmental Council Pathways to a Green Campus, Awareness and Education." Middlebury
College: Community Home Page. Middlebury College. <http://community.middlebury.edu/~enviroc/aande.html>.
30 "Middlebury Environmental Council Pathways to a Green Campus, Awareness and Education." Middlebury
College: Community Home Page. Middlebury College. <http://community.middlebury.edu/~enviroc/aande.html>.
31 "The Mission of the Environmental Council Is to Engage and Support All Members of the College Community in
Advancing Leadership in Sustainability and Environmental Citizenship." Environmental Council. Middlebury
College. <http://www.middlebury.edu/sustainability/fech/ec>.
32 "News & Events." Middlebury College News & Events. Middlebury College.
<http://www.middlebury.edu/sustainability/news-events?page=7>.
33 "Dean of Environmental Affairs." Franklin Environmental Center at Hillcrest. Middlebury College.
<http://www.middlebury.edu/sustainability/fech/doenv>.
34 ―Middlebury College - Green Report Card 2011." The College Sustainability Report Card. Sustainable
Endowments Institute, 2011. http://www.greenreportcard.org/report-card-2011/schools/middlebury-
college/surveys/campus-survey.
35 "Sustainability Integration Office." Franklin Environmental Center at Hillcrest. Middlebury College.
<http://www.middlebury.edu/sustainability/fech/sio>.
36 "Evolution of Sustainability at Middlebury College." History | Middlebury. Middlebury College.
<http://www.middlebury.edu/sustainability/tools/history>.
37 "About." Sustainable Stanford. Stanford University. <http://sustainablestanford.stanford.edu/about>
38 "About." Sustainable Stanford. Stanford University. <http://sustainablestanford.stanford.edu/about>
39 "Tulane University 2008 Campus Sustainability Leadership Award Application." Campus Sustainability Profiles |
Association for the Advancement of Sustainability in Higher Education. AASHE.
<http://www.aashe.org/resources/profiles/cat4_132.php>.
40 Brannon, Keith. "Tulane University Receives Campus Sustainability Leadership Award."Tulane University.
Tulane University, 3 Nov. 2008. <http://tulane.edu/news/releases/11032008_pr.cfm>.
41 "Tulane University - Green Report Card 2011." Green Report Card. The College Sustainability Report Card.
<http://www.greenreportcard.org/report-card-2011/schools/tulane-university>.
~ 134 ~
42
"Tulane University - Green Report Card 2007." Green Report Card. The College Sustainability Report Card.
<http://www.greenreportcard.org/report-card-2007/schools/tulane-university>.
43 "UNBC - Canada's Green University." University of Northern British Columbia. University of Northern British
Columbia. <http://www.unbc.ca/green/>.
44 "Campus Operations." UNBC - University of Northern British Columbia. University of Northern British
Columbia. <http://www.unbc.ca/green/campus.html>.
45 "2010 Annual Report." University of Washington. http://f2.washington.edu/fm/uw-annual-
reports/sites/default/files/file/2010_Annual_Report.pdf
46 "2010 Annual Report." University of Washington. http://f2.washington.edu/fm/uw-annual-
reports/sites/default/files/file/2010_Annual_Report.pdf
47 "UW Receives A- for the 2011 Green Report Card." University of Washington Environmental Stewardship &
Sustainability. University of Washington. http://f2.washington.edu/oess/awards-recognition/recognition/uw-
receives-2011-green-report-card
48 "Cool Schools: Top 100 Schools – September/October 2010‖ Sierra Magazine. Sierra Club.
http://www.sierraclub.org/sierra/201009/coolschools/top100.aspx
49 Roseth, Robert. "New Campus Sustainability Fund Will Support Projects By Students, Faculty, Staff." University
of Washington. http://www.washington.edu/news/archive/uweek/58054