Embed Size (px)
Citation preview
Climate Change: Is the Science Sound?
Special Report to the Legislative Assembly of Ontario
Submitted by Gord Miller, Environmental Commissioner of Ontario November 19, 2002
1075 BAY STREET, SUITE 605, TORONTO, ON, M5S 2B1

Table of Contents
Introduction........................................................................................................1
Observed Changes..............................................................................................2 Rising greenhouse gas concentrations.............................................................2 Rising global temperature................................................................................2 Temperature over the last thousand years .......................................................3 Satellite data do not invalidate warming .........................................................3 Glaciers retreating ...........................................................................................4 Reduced snow and ice cover ............................................................................4 Sea level rising more quickly ...........................................................................4 Summary of observed changes .........................................................................4
Causes of Observed Changes ............................................................................5 Explaining the increase in greenhouse gas concentrations.............................5 Factors contributing to climate change ...........................................................5 Human contributions to climate change ..........................................................6 Debates about the evidence..............................................................................6 Debates about natural factors: ........................................................................7 Causes of recent sea level rise .........................................................................8
Projecting Future Climate Change ..................................................................9
Conclusion.........................................................................................................11
APPENDIX A: FIGURES Figure 1. Variation in atmospheric concentrations of carbon dioxide and methane to
400,000 years before present Figure 2. Variation in global average surface temperature during the period 1856-2000 Figure 3. Variation in Northern Hemisphere average surface temperature Figure 4. Global mean radiative forcing of the climate system for the year 2000 Figure 5. Simulated annual global mean surface temperatures Figure 6. Carbon dioxide emission projections during the period 2000-2100
APPENDIX B: TECHNICAL APPENDIX
Climate Change: ECO Special Report to the Is the Science Sound? 1 Legislative Assembly of Ontario
Climate Change: Is the Science Sound? A Special Report to the Legislative Assembly of Ontario
Introduction As the Environmental Commissioner of Ontario (ECO), I have the mandate to release special reports on matters of particular urgency. In the past couple of months, I have become convinced that the question of the scientific evidence regarding climate change has become a matter of urgency for Ontario legislators and the Ontario public. We are currently immersed in a national debate on the appropriate response to climate change – a debate in which Ontario, with a large population, a strong manufacturing base and major greenhouse gas emissions, has a key role to play. Recently there have been numerous assertions in the media that there is little scientific basis for climate change, and that “go-slow” or even “business-as-usual” approaches are therefore appropriate. There are also opposing voices, from all points on the political spectrum, which are urging speedy reductions in greenhouse gas emissions. For example, a recent editorial in the business weekly The Economist argued that climate change is a key reason to call for an energy revolution. “The most sensible way for governments to tackle this genuine (but long-term) problem is to send a powerful signal that the world must move towards a low-carbon future,” the editorial stated. The controversy about climate change science is fundamental to the policy process. If the science is not credible, then there is no basis for enacting policy change. But if the science is sound, then our society will face significant consequences by sticking to a business-as-usual course, and we must, at a minimum, factor those consequences into our economic, social and environmental planning. The ongoing questions about the strength of the scientific evidence seem to be having a paralyzing effect on many policymakers in both public and private sectors. They are, on the one hand, prevented by time pressures from delving deeply into the many technical issues, yet on the other hand, are deluged daily by new findings, arguments, points and counterpoints. It is very hard to make good decisions in such a context. I hope that the report that I am releasing today will help to provide some clarity, and help Ontario policymakers move to the next stage of the debate. This special report reviews the key scientific issues regarding climate change, and offers an opinion as to the strength of these arguments. While I do not want to prejudge what Ontario’s policy response to climate change should be in advance of a government decision, I do think it is vital for me to review and report on the science for the benefit of the members of the Ontario Legislative Assembly and the Ontario public. My report focuses on the findings of the Intergovernmental Panel on Climate Change (IPCC) in their Third Assessment Report, published in 2001 (the 2001 IPCC Report). The IPCC is a body
Climate Change: ECO Special Report to the Is the Science Sound? 2 Legislative Assembly of Ontario
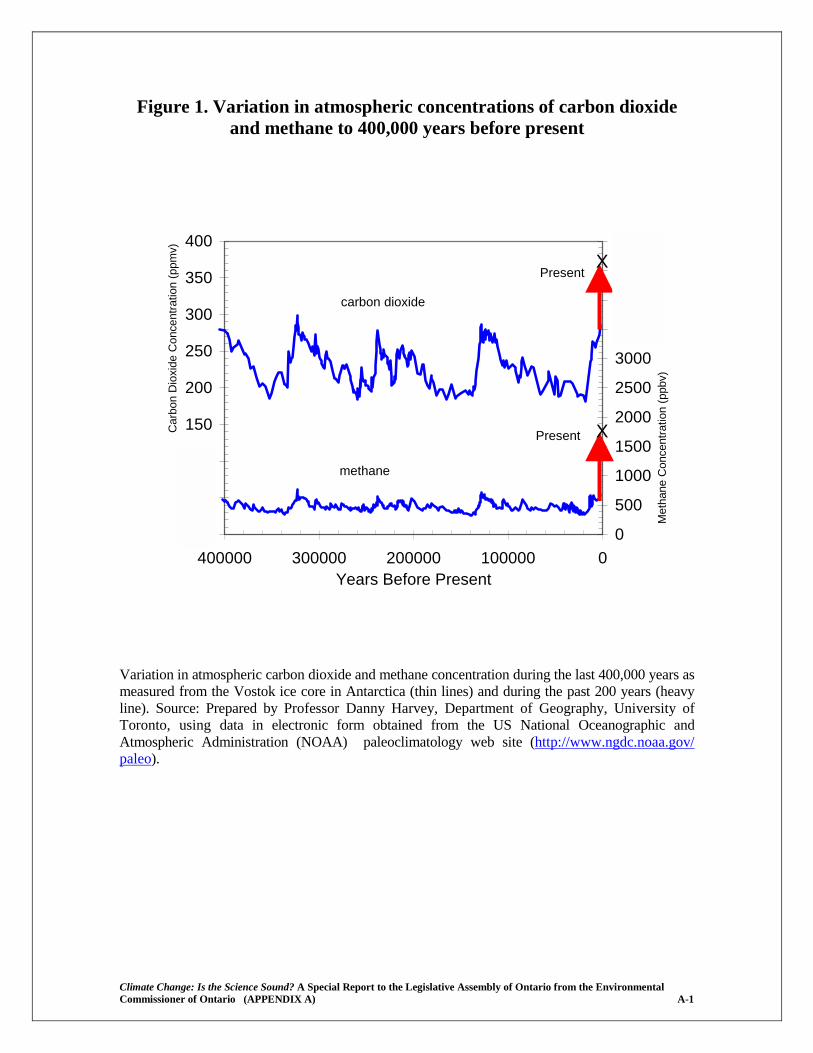
of scientists from around the world, convened in 1988 by the United Nations jointly under the United Nations Environment Programme (UNEP) and the World Meteorological Organization (WMO). The mandate of the IPCC is to provide policymakers with an objective assessment of the scientific and technical information available about climate change, its environmental and socio-economic impacts, and possible options for response. Many hundreds of scientists from around the world (including Canada) participate in the preparation and review of IPCC reports. These reports represent the definitive work of the scientific community on the science of global climate change and human impacts. The IPCC has published assessments in 1990, 1995, and, most recently, in 2001, each assessment being the culmination of an enormous body of research over the previous five years. My report also refers to several recent publications of the U.S. National Research Council on this subject, particularly the Council’s June 2001 report. This report was commissioned by the Administration of U.S. President George W. Bush, which requested the Council’s advice on climate change science, as well as an independent critique of the findings of the IPCC. In the pages that follow, I have tried to summarize the most recent findings of the IPCC, as well as the key debates and uncertainties around the scientific evidence regarding climate change. I have also appended a longer technical appendix, which provides more detail and extensive references regarding the same issues. Observed Changes Rising greenhouse gas concentrations For several decades now, scientists have been observing rising concentrations of several greenhouse gases in the earth’s atmosphere, especially carbon dioxide, methane, nitrous oxide and tropospheric ozone. There is no scientific dispute about these observations, which are based in part on a program of continuous monitoring of carbon dioxide concentrations that began in the late 1950s. Both carbon dioxide and methane are now at higher concentrations than at any time during at least the last 420,000 years (Figure 1). Other greenhouse gases have also shown recent abrupt concentration increases. During the industrial era, carbon dioxide has increased over 30 per cent, methane more than 150 per cent, and nitrous oxide more than 15 per cent. To compare the makeup of our current atmosphere with that of the distant past, researchers have analysed ice cores extracted from the massive, ancient ice sheets covering Antarctica and Greenland. The air bubbles trapped in these ice cores provide a chronological record of the atmosphere dating back hundreds of thousands of years. Researchers are able to measure the concentrations of gases in these air bubbles, and can confidently track how the earth’s atmosphere has changed over time. Rising global temperature Scientists have concluded that the global average temperature of the earth’s surface has risen over the last hundred years, by about 0.6 º Celsius. Since we have no intuitive sense of global
Climate Change: ECO Special Report to the Is the Science Sound? 3 Legislative Assembly of Ontario
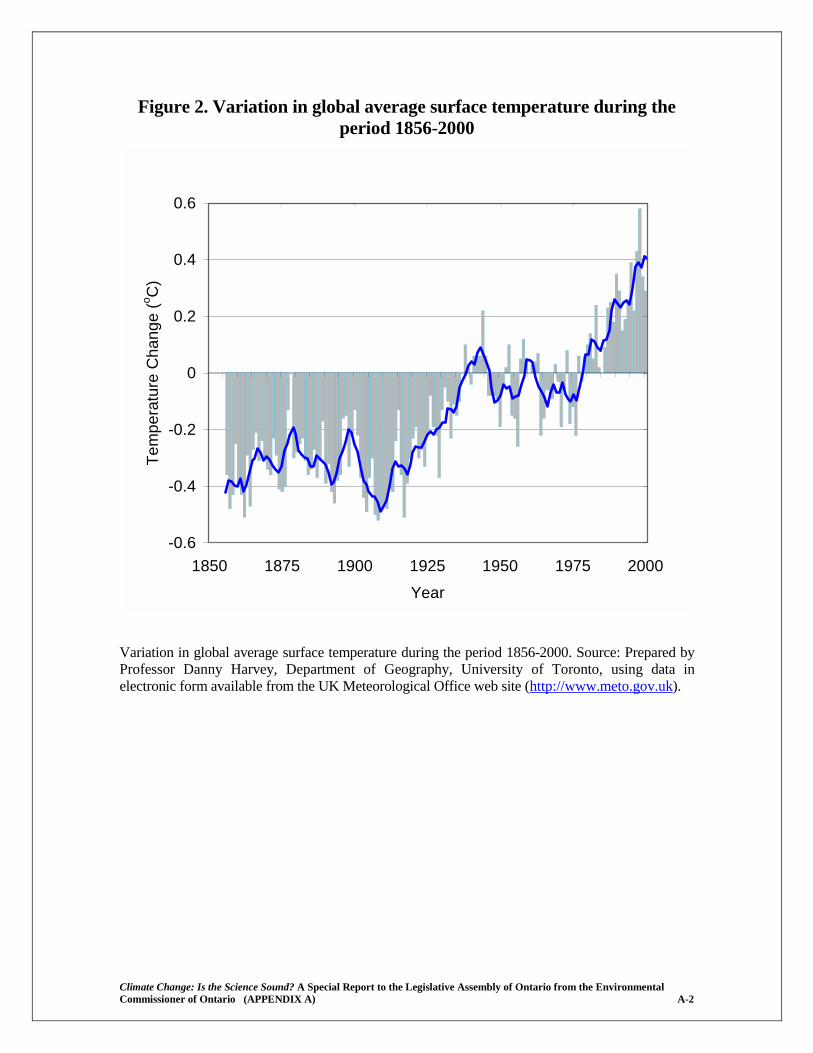
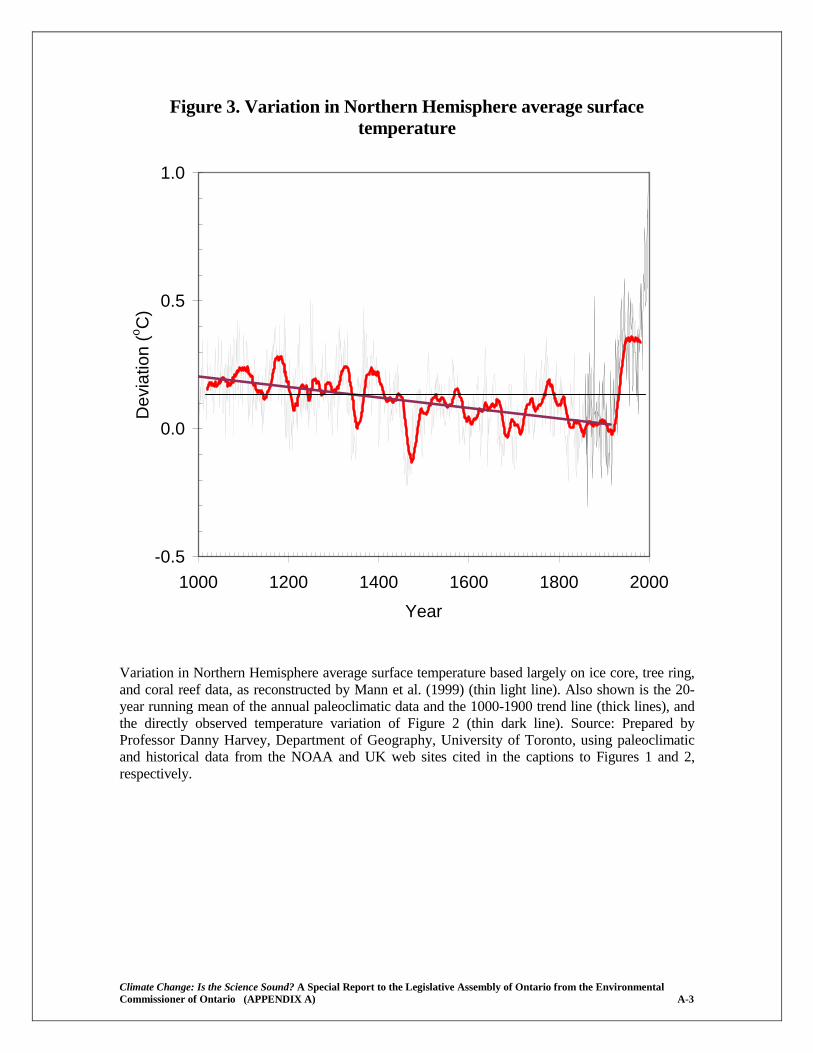
average temperature, we tend to rely on our own daily experience of local weather, and so a change of half a degree may seem small. But global average temperature is a measure of global climate change, and on this scale the observed change is unusually large. Since the invention of thermometers, temperatures have been regularly monitored at thousands of land stations worldwide, and from thousands of ships at sea. Climate research institutes have compiled these temperature readings into very large, publicly available databases, which have been thoroughly scrutinized by researchers the world over. There is very broad scientific agreement that the observed global average surface temperature increase over the past hundred years is real (Figure 2). Even scientists who are prominent skeptics about the human connection to climate change do agree that the global average temperature has risen significantly. It is sometimes argued that the heat radiated from buildings and vehicles - the “urban heat island effect”- is influencing thermometer measurements in urban settings, and that the observed warming reflects these localized effects rather than a truly global phenomenon. But the IPCC has evaluated this, and has been pointing out since 1992 that the urban heat island effect can only be responsible for a very small part of the observed warming. Temperature over the last thousand years The 2001 IPCC Report notes that it is likely that the northern hemisphere’s temperature increase in the 20th century has been the largest of any century during the past 1,000 years (Figure 3). To estimate global temperatures before the invention of thermometers, researchers have analysed several types of natural phenomena that are affected by temperature, such as tree rings, polar ice cores and the growth of tropical corals. These are called “proxy indicators” of temperature. The technique involves seeing how proxy indicators match with actual temperature records of the last century or so, and then extrapolating backwards in time based on this relationship. Because the tree rings, polar ice cores and tropical corals are collected from very different geographic regions, researchers are able to combine these indicators to create large-scale reconstructions of past global climate trends. Compared to the reconstructed temperature trends of the past thousand years, the temperature rise over the last century stands out as being highly unusual. Over the last thousand years, there was an episode of regionally variable warming, labelled the “medieval warm” period, and more recently also a cooling period, the so-called “Little Ice Age.” Some argue that the current warming trend could just be another natural variation. But the 2001 IPCC Report concludes that the historical warming and cooling episodes appeared to be regional phenomena, whereas the current temperature rise is being observed simultaneously across many parts of the globe. Satellite data do not invalidate warming Since 1979, satellites have been taking measurements that can be used to calculate temperatures at various altitudes within the atmosphere. These measurements indicate that the lower atmosphere has not warmed as much as the surface of the earth. This has caused debate among scientists, with some doubting the validity of the satellite data, and others doubting the surface temperature data. The U.S. National Research Council established a panel to consider this issue, and in 2000 the panel concluded that the surface temperature trends were in no way invalidated
Climate Change: ECO Special Report to the Is the Science Sound? 4 Legislative Assembly of Ontario
by the satellite data. The panel also concluded that there was probably a real difference in temperature trends between the surface and the lower atmosphere. Among the possible causes cited by the panel for the relatively cooler lower atmosphere were volcanic eruptions and human-caused stratospheric ozone depletion. Glaciers retreating The 2001 IPCC Report states that glaciers in most parts of the world have had a “negative mass balance” in the past 20 years; in other words, they have lost more mass on average, than they have gained. Measurements of the size and lengths of glaciers and analyses of moraines have also provided abundant evidence that most mountain glaciers have been retreating during the last 100 years. There are some glaciers that are advancing, for example in Norway and in New Zealand, but the 2001 IPCC Report notes that these cases involve unusual increases in precipitation. Reduced snow and ice cover In many areas of the world, researchers are observing reduced snow cover and earlier spring melting of ice on rivers and lakes. The 2001 IPCC report notes that annual snow cover in the northern hemisphere has decreased by about 10 per cent since 1996. Sea ice covers about five per cent of the earth’s surface. Both the thickness and the extent of sea ice influence how the atmosphere and the oceans interact. Over the last three decades, the extent of Arctic sea ice has been declining at a rate of about three per cent per decade, and its summer minimum thickness has decreased by nearly 40 per cent. Permafrost is also warming in many regions; for example in Alaska, deep permafrost has warmed by 2 to 4º Celsius over the last century. Sea level rising more quickly Tidal gauges measure the level of the sea surface relative to the land where the gauge is located. Changes in the mean sea level of a coast can be affected by the movement of land as well as by the change in the height of sea level. In many locations, land is still rebounding from the weight of the last glaciation, so researchers have to factor this in when they interpret the records of tidal gauges. The 2001 IPCC Report estimates that the average rate of sea level rise has increased from 0.1-0.2 millimetres/year during the past 3,000 years to 1-2 millimetres/year during the 20th century. This is an increase by a factor of ten. As well, the average rate of sea level rise during the 20th century has been higher than that of the 19th century. Summary of observed changes Greenhouse gas concentrations are higher now than at any time during at least the past 420,000 years, and have been rising at an ever-increasing rate since the industrial revolution. Many of the observed changes in climate and other indicators are consistent with each other and provide increased evidence of a changing climate system. For example, land temperatures and sea surface temperatures show consistent increasing trends. The widespread decrease in mountain glaciers is consistent with global temperature increases. Decreases in spring snow cover, in lake and river ice and in Arctic sea ice parallel increases in temperatures in the Northern Hemisphere.
Climate Change: ECO Special Report to the Is the Science Sound? 5 Legislative Assembly of Ontario
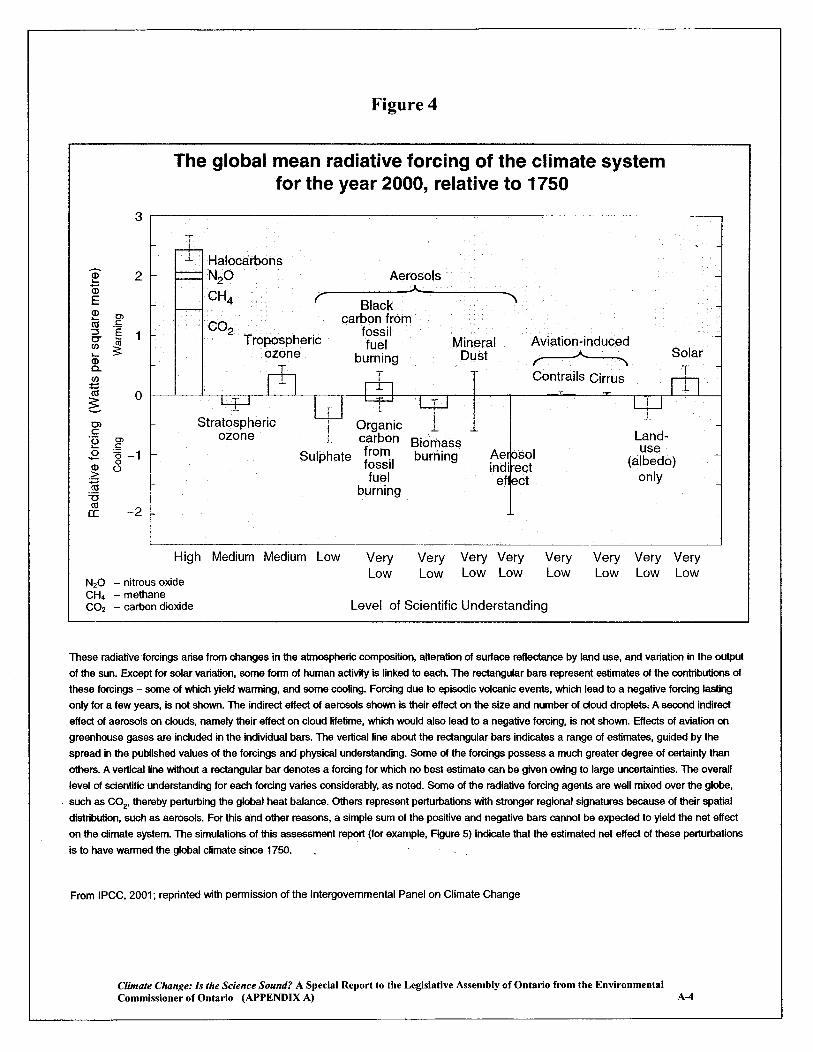
The IPCC concludes in its 2001 report that the trends “consistently and very strongly support an increasing global surface temperature over at least the last century.” Causes of Observed Changes Explaining the increase in greenhouse gas concentrations Concentrations of greenhouse gases have increased dramatically in the atmosphere, and these increases are clearly caused by human activities. There is essentially no debate in the scientific community about this point, and there are several independent supporting lines of evidence. First, the rate of increase of greenhouse gases over the past century matches the rate of human-caused emissions. Second, atmospheric oxygen has been declining at the same rate as fossil fuel emissions of carbon dioxide have been increasing. This is because oxygen is consumed when fossil fuel is burned. Third, there are changes in the atmospheric proportions of carbon isotopes, which indicate that the atmosphere is becoming enriched with carbon from fossil fuel sources, rather than from natural sources. The IPCC estimates that 70 to 90 per cent of the increase in carbon dioxide emissions is due to fossil fuel burning and the rest to land use change, particularly deforestation. The U.S. National Research Council also agrees that human activities are responsible for the increase in carbon dioxide concentrations. Until the industrial revolution, the natural carbon cycle of the earth was essentially in equilibrium, as vast quantities of carbon continually circulated through the planet’s atmosphere, oceans, soils and biomass. Compared to quantities that are cycled naturally, human emissions of carbon dioxide are small, but they have perturbed a cycle that was almost in balance. Other greenhouse gases also have natural and human sources, but it is emissions from human activities that have caused the increase in atmospheric concentrations. Greenhouse gases like chlorofluorocarbons are entirely human-made. Factors contributing to climate change We have seen that global average temperature has increased, and that greenhouse gas concentrations have increased. However, a key question remains as to whether the observed increases in greenhouse gases have indeed caused the increase in global average temperature. Several external factors, both natural and human caused, can play a role in climate change, and they are often all at work at the same time. These factors, which can alter the balance of incoming and outgoing energy in the earth-atmosphere system, are termed “radiative forcings” by climate scientists. Positive radiative forcings tend to produce warming and negative radiative forcings produce cooling. The most important radiative forcings include greenhouse gases, aerosols, solar forcing (variation in solar output) and volcanic eruptions. Radiative forcing is measured in Watts/square metre. The 2001 IPCC Report summarizes the relative importance of various radiative forcings over the last several centuries, and concludes that greenhouse gases, especially carbon dioxide, have been the most important positive radiative forcing (Figure 4). Solar forcing has contributed only a small amount of warming compared to greenhouse gases. At the same time, several factors
Climate Change: ECO Special Report to the Is the Science Sound? 6 Legislative Assembly of Ontario
have exerted cooling influences, especially sulphate aerosols, emissions from volcanic eruptions, biomass aerosols and depletion of the stratospheric ozone layer. The 2001 IPCC Report also evaluates how strong the level of scientific understanding is for each radiative forcing agent. The Report notes that there is a high level of scientific understanding about most greenhouse gases; excellent measurements of their concentrations exist, and their radiative properties are well-known. There is a medium level of scientific understanding of the radiative properties of ozone. Because major uncertainties remain about aerosols and their effects on clouds and also solar forcing, the IPCC acknowledges there is a very low level of scientific understanding in these areas. Human contributions to climate change The 2001 IPCC Report concludes that there is new and stronger evidence than in past reports that most of the warming observed over the past 50 years is attributable to human activities. The report also states,
“There are new estimates of the climate response to natural and anthropogenic forcing, and new detection techniques have been applied. Detection and attribution studies consistently find evidence for an anthropogenic signal in the climate record of the last 35 to 50 years.”
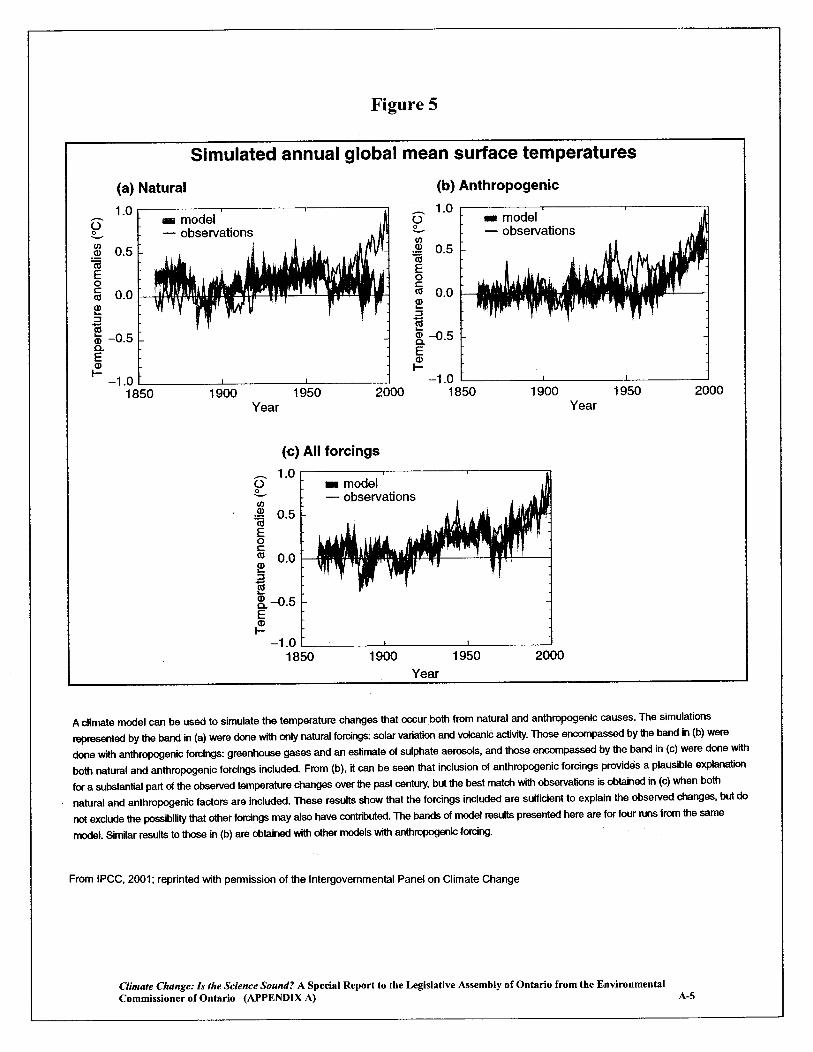
To tease out human influences, researchers compare various model simulations of global temperature with observed global temperatures over recent decades (Figure 5). When the models simulate only the influences of solar variation and volcanic eruptions during this time frame, the resulting temperature graphs do not closely match the observed record. When the models simulate only the influences of human impacts (greenhouse gases, stratospheric ozone depletion and sulphate aerosols), somewhat better matches with the observed record are achieved. But the best match with observations is achieved when both natural and human-caused influences are all combined. While there is not absolute proof that greenhouse gases have caused warming, there is strong evidence. The U.S. President received a report from the U.S. National Research Council in June 2001 which summarized the current scientific views on this point as follows: “The IPCC’s conclusion that most of the observed warming of the last 50 years is likely to have been due to the increase in greenhouse gas concentrations accurately reflects the current thinking of the scientific community on this issue.” Debates about the evidence There are a number of debates about the importance of various influences on observed climate changes. Some people wonder how carbon dioxide, a gas that accounts for less than one per cent of total atmospheric gases, could be the cause of rising global temperature. Nitrogen and oxygen, which together make up 99 per cent of atmospheric gases, are essentially transparent to radiation, and are therefore not greenhouse gases. But chemistry and biology provide abundant examples of substances that have large impacts in trace concentrations.
Climate Change: ECO Special Report to the Is the Science Sound? 7 Legislative Assembly of Ontario
Some believe there is conflicting evidence about the importance of various factors. For example, a cooling episode in the Northern Hemisphere from 1946 to 1975 has led some critics to argue that since this episode coincided with rising greenhouse gas emissions, it is evidence against human caused warming. However, the U.S. National Research Council suggests instead that sulphate aerosols, which were higher at that time, may have provided a cooling effect during this time period, which masked the increase in the warming effect of greenhouse gases during this same time period. Carbon dioxide levels have been much higher in the distant past, leading some observers to question why a relatively small rise in carbon dioxide should be problematic now. It is true that, just as natural climate has varied in the past, so have carbon dioxide levels. Carbon dioxide levels were up to 20 times higher between 200 and 150 million years ago, but the climate was also much warmer and the sea level much higher. During the glacial-interglacial fluctuations of the more recent past, carbon dioxide varied between 180-300 ppmv, but was relatively stable at around 270-290 ppmv from the end of the last ice age until the beginning of the industrial era, when the rapid rise (currently at 370 ppmv) due to human-induced emissions began. Human civilizations developed under atmospheric conditions of around 270-290 ppmv carbon dioxide. There are also ongoing debates in the scientific community about how to interpret geologic evidence connecting carbon dioxide concentrations and temperature – and especially how to determine whether carbon dioxide increases drove or just amplified temperature increases at any given time in the distant past. What is uncontested is that Antarctic ice cores show a remarkable correlation between carbon dioxide levels and temperature, which increased and decreased together in the same pattern over the last 420,000 years. Some critics have also raised doubts about the reliability of climate models, since early models generally predicted more pronounced temperature rises than have actually been observed over the past century. However, it has been strongly suspected for a long time that aerosols have a net cooling effect on climate. When the effects of aerosols are incorporated into climate models, their simulations of temperature are consistent with observations. Debates about natural factors
The sun Some skeptics think that natural factors may be important contributors to the observed warming. The varying influence of the sun is brought up repeatedly in debates about the causes of climate change. Solar irradiance varies over the 11 year solar cycle, and may be increasing slightly from one cycle to the next. But the 2001 IPCC Report concludes that solar forcing is very small (between +0.1 to +0.5 Watts per square metre) when compared to the forcing of greenhouse gases (+2.43 Watts per square metre with an uncertainty of 10 per cent). Solar irradiance has been directly observed by satellite during the past 22 years and the variation is quite small, amounting to less than 0.1 per cent. The IPCC says that solar forcing may have contributed to some of the warming observed in the first half of the 20th century, but very little in the latter half.
Climate Change: ECO Special Report to the Is the Science Sound? 8 Legislative Assembly of Ontario
The only way that variation in solar radiation could have a major impact on climate would be if it were somehow amplified through another mechanism. Cosmic rays and their possible effects on clouds have been suggested as a possible mechanism. But the IPCC has considered this, and states that evidence for the impact of cosmic rays on clouds has not been established. Methane hydrates Methane hydrate is a crystalline solid which occurs naturally in deposits on land in polar regions and beneath the ocean floor in marine sediments. It has been hypothesized that large-scale natural releases of methane hydrate could be a factor in climate change. But a study by the U.S. Geological Survey in 1999 refuted this theory. The 2001 IPCC Report points out there is no evidence of rapid, massive releases of methane hydrates in the past, and that methane hydrates probably account for no more than two per cent of the current total natural and anthropogenic sources of methane. In any case, methane contributes only about 20 per cent of the total radiative forcing due to greenhouse gases. Other possible natural causes Some people wonder if changes in the earth’s orbit might be responsible for the currently observed warming trends. Slow, regular variations in the earth’s rotational axis and orbit (the so-called Milankovitch cycles) have played an important role in the advance and retreat of ice during past ice ages. But these influences are very slow, and significant changes require thousands of years to become evident. It has been suggested that some internal reorganization of the atmosphere and oceanic circulation caused the recent warming. This would be a remarkable coincidence, occurring at the very time that rapid increases in heat-trapping greenhouse gases occurred, but, apparently, without any climate effects from the greenhouse gas increases. As well, this theory does not appear to match observations. Direct observations indicate that the oceans have warmed consistent with the downward penetration of heat from the surface. Recent studies indicate that the ocean is likely to be acting as a net heat sink, rather than a heat source.
Causes of recent sea level rise As noted above, sea level has been rising more quickly in the 20th century than in recent previous centuries. The most recent report of the IPCC notes “It is very likely that 20th century warming has contributed significantly to the observed sea level rise…” To determine whether human causes are partially or largely responsible for this change, researchers have been working to evaluate and quantify many factors that contribute to sea level rise, such as the thermal expansion of water and contributions from glaciers and ice caps. The IPCC concludes that thermal expansion was one of the major contributors to 20th century sea level rise, and will be the major contributor over the next hundred years. Thermal expansion occurs because the volume of ocean water increases as it warms. Polar continental ice sheets contributed only in a minor way to sea level rise in the 20th century, and it is expected that the
Climate Change: ECO Special Report to the Is the Science Sound? 9 Legislative Assembly of Ontario
impact of climate change on ice sheets will occur over a time scale of centuries. The IPCC evaluated estimates of combined contributions from human causes compared to combined contributions by natural causes. Since the combined natural causes could not account for the magnitude of the sea level rise that has actually been observed, this suggests that 20th century climate change has made a contribution to 20th century sea level rise. Projecting Future Climate Change By the end of this century, if we continue on a business-as-usual basis, concentrations of greenhouse gases could rise much higher than current levels. In fact, concentrations could reach the equivalent of several times the carbon dioxide concentration that existed at the beginning of the industrial era. Computer modeling, supported by a variety of observational evidence, indicates that very large climatic changes will likely occur as a result. The IPCC projects the global mean temperature will increase by 1.4 to 5.8ºC over the period 1990 to 2100. Contrast that to the much slower rate of warming during the recovery from the last ice age of about 2ºC per millennium. There is broad agreement among climate scientists regarding the climate changes that can be expected over the coming century if we continue on a business-as-usual basis. The key changes are: • the warming will be greater at high latitudes than at low latitudes, due to the melting of
seasonal ice and snow; • the warming will tend be greater in winter than in summer adjacent to high latitude
oceans, due to the thinning of sea ice; • there will be an increasing tendency for the intensity of rainfall to increase (that is, more
rain will fall as intense downpours); and • there will be increased summer drying in the interiors of most mid-latitude continents,
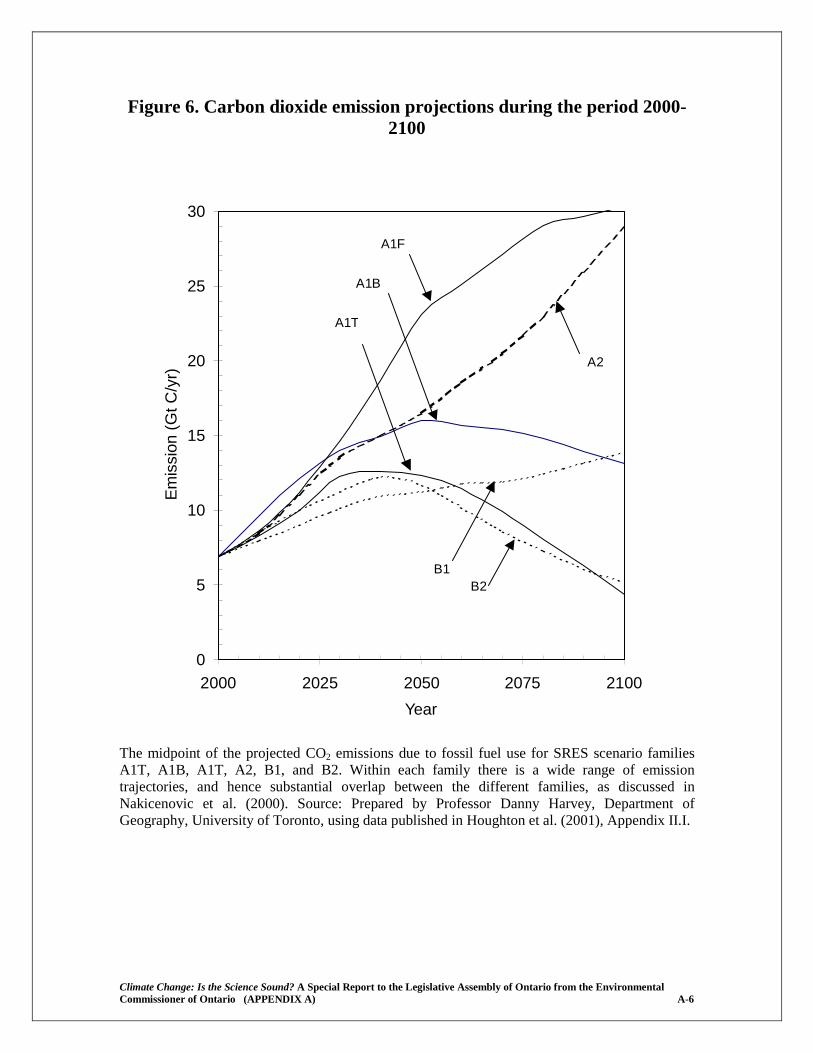
with associated risk of drought. To predict future climate trends, researchers first have to make predictions about each of the key factors that will influence climate, including the future emissions of greenhouse gases, how those greenhouse gases are likely to build up in the atmosphere and how much warming is likely to result. Researchers also need to consider and try to quantify any likely feedbacks between climate changes and the buildup of greenhouse gases. Future emissions of greenhouse gases will depend on many factors, such as the growth of the global economy and developments in technology and energy efficiency. The IPCC developed an extensive range of future emission scenarios in preparing for the 2001 IPCC Report. Each scenario involved a set of interconnected assumptions about population growth, economic and social well-being, trade and overall concern about the environment. The scenarios were considered plausible business-as-usual scenarios, since they did not assume societies would take deliberate actions to reduce greenhouse gas emissions (Figure 6).
Climate Change: ECO Special Report to the Is the Science Sound? 10 Legislative Assembly of Ontario
The buildup of greenhouse gases in the atmosphere depends on future emission rates, of course, but also on the key natural pathways which draw carbon dioxide back out of the atmosphere – absorption by forests and by the oceans. Researchers have to estimate how much these absorption pathways are likely to affect the buildup of atmospheric carbon dioxide. The 2001 IPCC Report notes that the absorption of carbon dioxide by forests may well weaken over the coming century. Oceans will tend to absorb carbon dioxide at rates slower than the predicted emission rates. Warming oceans will also be able to absorb less carbon dioxide, since carbon dioxide is less soluble in water at warmer temperatures. Weakening terrestrial absorption and slow ocean absorption will both exacerbate the buildup of atmospheric carbon dioxide. Researchers also have to estimate how quickly concentrations of other greenhouse gases are likely to build up in the atmosphere. It is common practice for climate scientists to use the doubling of carbon dioxide concentrations in the atmosphere as a benchmark for comparison. When the heating effects of all greenhouse gases add up to that which would occur from a doubling of carbon dioxide alone, this is said to be the climatic equivalent of a doubling of carbon dioxide. A key parameter in the projection of future climatic change is the climate sensitivity, which is often defined as the globally averaged warming once the climate has fully adjusted to a fixed doubling of atmospheric carbon dioxide (or its climatic equivalent). The greater the climate sensitivity, the greater the eventual warming that the climate is heading toward, and the greater and faster the warming along the way. There are several independent methods for estimating the climate sensitivity, and researchers have found that their results largely overlap. Given the overlapping evidence, the 2001 IPCC report has not altered its previous estimate of a climate sensitivity of 1.5-4.5º Celsius. To make projections of future regional patterns of climate change, researchers use three-dimensional computer models, referred to as atmospheric general circulation models or AGCMs. There are many such complex models in use. The models agree with each other concerning the large-scale features of climatic change that can be expected, such as greater warming at higher latitudes, greater warming in winter than in summer, and other features listed above. Over the past several decades, climate models have advanced greatly, and are well able to simulate the broad features of observed climate changes, such as the minimal warming to slight cooling in the northwest Atlantic Ocean and around parts of Antarctica. Climate scientists point out that climate models cannot provide certainty about the details of specific changes in specific places. Some regions may benefit from initial stages of global warming, while others will lose. Since no one can state with high confidence where the initial winners and losers are, climate modelers argue that all regions should be considered at risk. One of the critical issues in projecting future climatic change is the possibility of so-called climate “surprises,” such as an abrupt re-organization of ocean circulation as critical thresholds are crossed. The likelihood of these events is very uncertain, but if they were to occur, consequences could be enormous. Examples of climate surprises could include a reduction or even shutdown of the North Atlantic Gulf Stream, which carries warmth from the tropics to
Climate Change: ECO Special Report to the Is the Science Sound? 11 Legislative Assembly of Ontario
Europe. Another example could be a change in the intensity and frequency of El Niño, which is a periodic oscillation in tropical Pacific ocean temperature with repercussions worldwide. This phenomenon has a major influence on North America’s weather, including a link to drought cycles. There is evidence that some of these events have occurred in the past, but their likelihood of recurrence is difficult to estimate. However, there is a risk that if large climatic changes are allowed to occur, they may trigger abrupt shifts that can’t be precisely predicted. Conclusion With this Special Report and its technical appendix, I have tried to provide an objective assessment of the scientific and technical information available about climate change. Based on this body of evidence, I am confident in concluding that human-induced climate change is occurring. It will cause serious environmental consequences in the near future. We have already begun to see these impacts of climate change around the globe. These impacts will affect both the Ontario public and the environment in which they live. Science is not a static entity. It is an on-going process of learning. Uncertainties in science are an inherent part of the scientific process and serve to inform future inquiry. Science has provided strengthened evidence over the past decade that global climate change is occurring. This evolution of knowledge will continue to yield information that allows us to better understand the human role in climate change. The Province of Ontario has a key role to play in addressing climate change. There are still many legitimate debates ahead of us, and limited time. I encourage Ontario’s policymakers to review for themselves the evidence regarding climate change. If they conclude, as I have, that the evidence is compelling, then it will be clear that the status quo is no longer an option, and they will be ready to focus on Ontario’s response.

APPENDIX A:
Figures

Climate Change: Is the Science Sound? A Special Report to the Legislative Assembly of Ontario from the Environmental Commissioner of Ontario (APPENDIX A) A-1
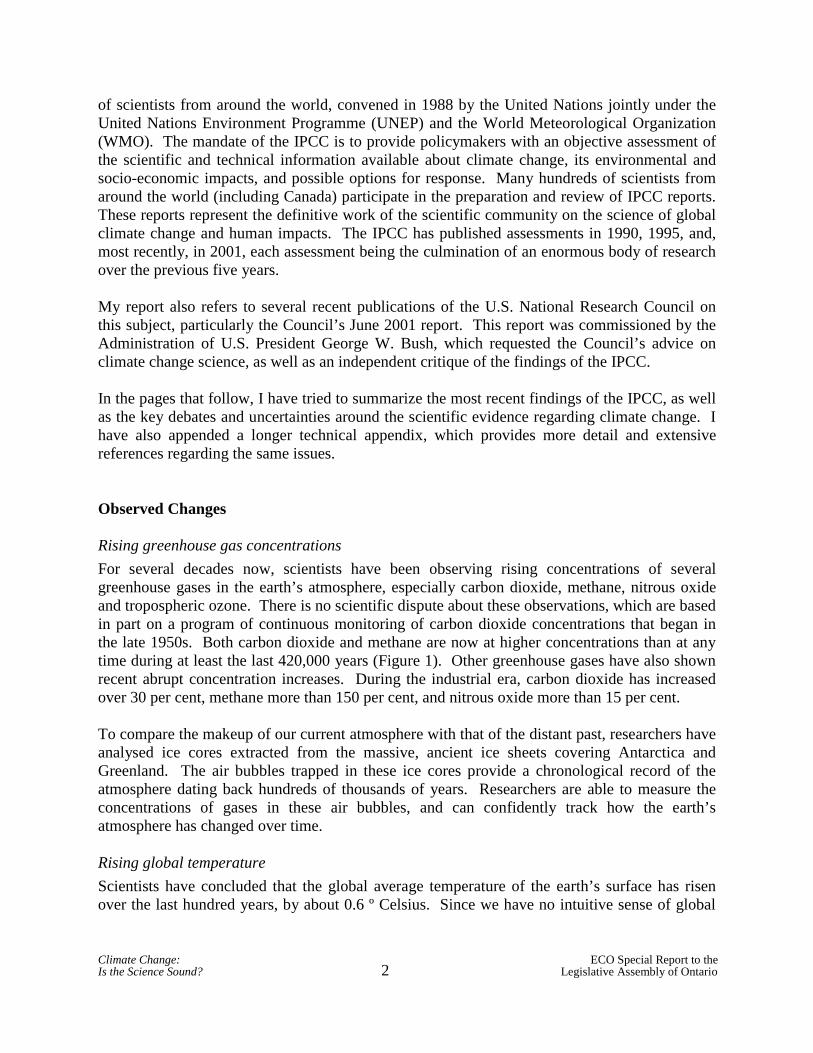
Figure 1. Variation in atmospheric concentrations of carbon dioxide and methane to 400,000 years before present
0
50
100
150
200
250
300
350
400
0100000200000300000400000Years Before Present
Car
bon
Dio
xide
Con
cent
ratio
n (p
pmv)
0
500
1000
1500
2000
2500
3000
3500
4000
4500
5000
Met
hane
Con
cent
ratio
n (p
pbv)
carbon dioxide
methane
Present
X
X
Present
Variation in atmospheric carbon dioxide and methane concentration during the last 400,000 years as measured from the Vostok ice core in Antarctica (thin lines) and during the past 200 years (heavy line). Source: Prepared by Professor Danny Harvey, Department of Geography, University of Toronto, using data in electronic form obtained from the US National Oceanographic and Atmospheric Administration (NOAA) paleoclimatology web site (http://www.ngdc.noaa.gov/ paleo).
Climate Change: Is the Science Sound? A Special Report to the Legislative Assembly of Ontario from the Environmental Commissioner of Ontario (APPENDIX A) A-2
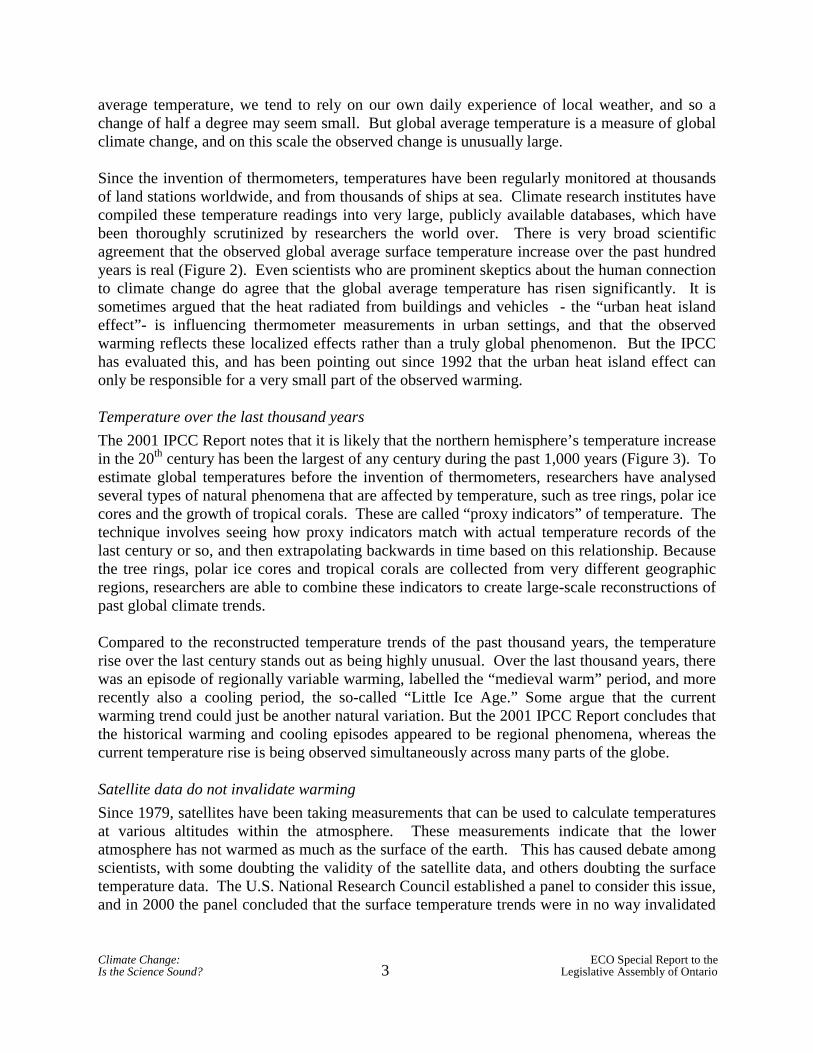
Figure 2. Variation in global average surface temperature during the period 1856-2000
Variation in global average surface temperature during the period 1856-2000. Source: Prepared by Professor Danny Harvey, Department of Geography, University of Toronto, using data in electronic form available from the UK Meteorological Office web site (http://www.meto.gov.uk).
-0.6
-0.4
-0.2
0
0.2
0.4
0.6
1850 1875 1900 1925 1950 1975 2000Year
Tem
pera
ture
Cha
nge
(o C)
Climate Change: Is the Science Sound? A Special Report to the Legislative Assembly of Ontario from the Environmental Commissioner of Ontario (APPENDIX A) A-3
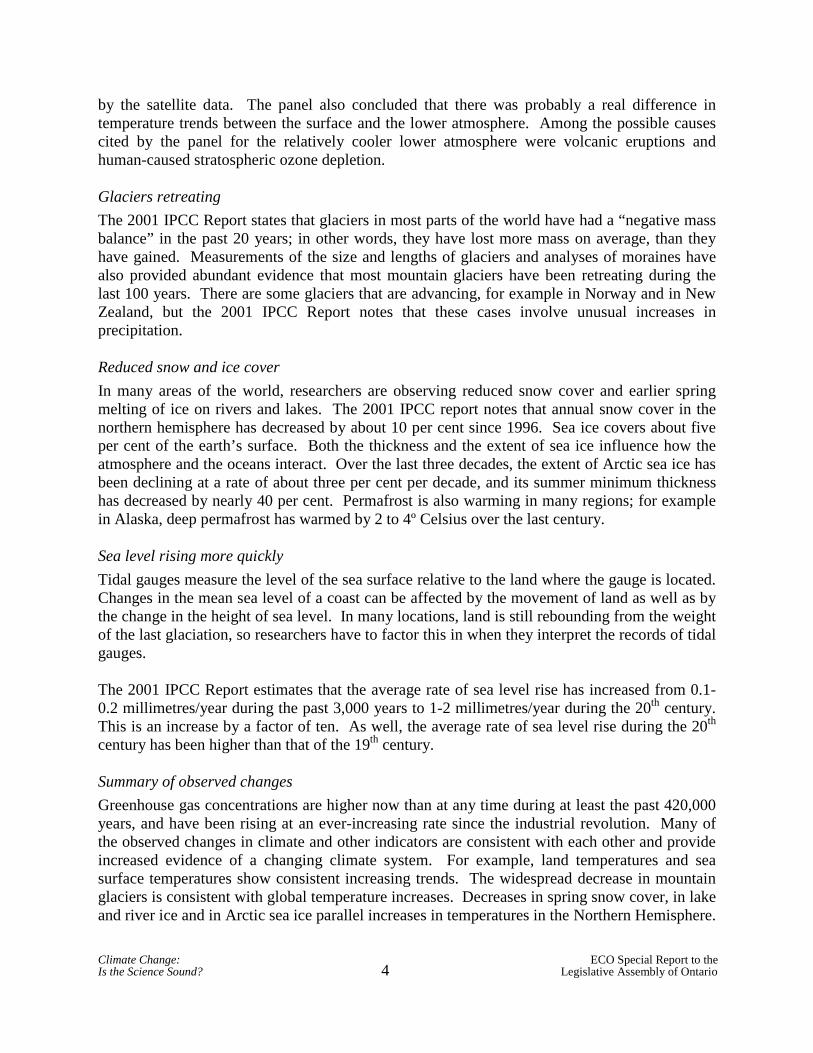
Figure 3. Variation in Northern Hemisphere average surface temperature
-0.5
0.0
0.5
1.0
1000 1200 1400 1600 1800 2000Year
Dev
iatio
n (o C
)
Variation in Northern Hemisphere average surface temperature based largely on ice core, tree ring, and coral reef data, as reconstructed by Mann et al. (1999) (thin light line). Also shown is the 20-year running mean of the annual paleoclimatic data and the 1000-1900 trend line (thick lines), and the directly observed temperature variation of Figure 2 (thin dark line). Source: Prepared by Professor Danny Harvey, Department of Geography, University of Toronto, using paleoclimatic and historical data from the NOAA and UK web sites cited in the captions to Figures 1 and 2, respectively.
Climate Change: Is the Science Sound? A Special Report to the Legislative Assembly of Ontario from the Environmental Commissioner of Ontario (APPENDIX A) A-6
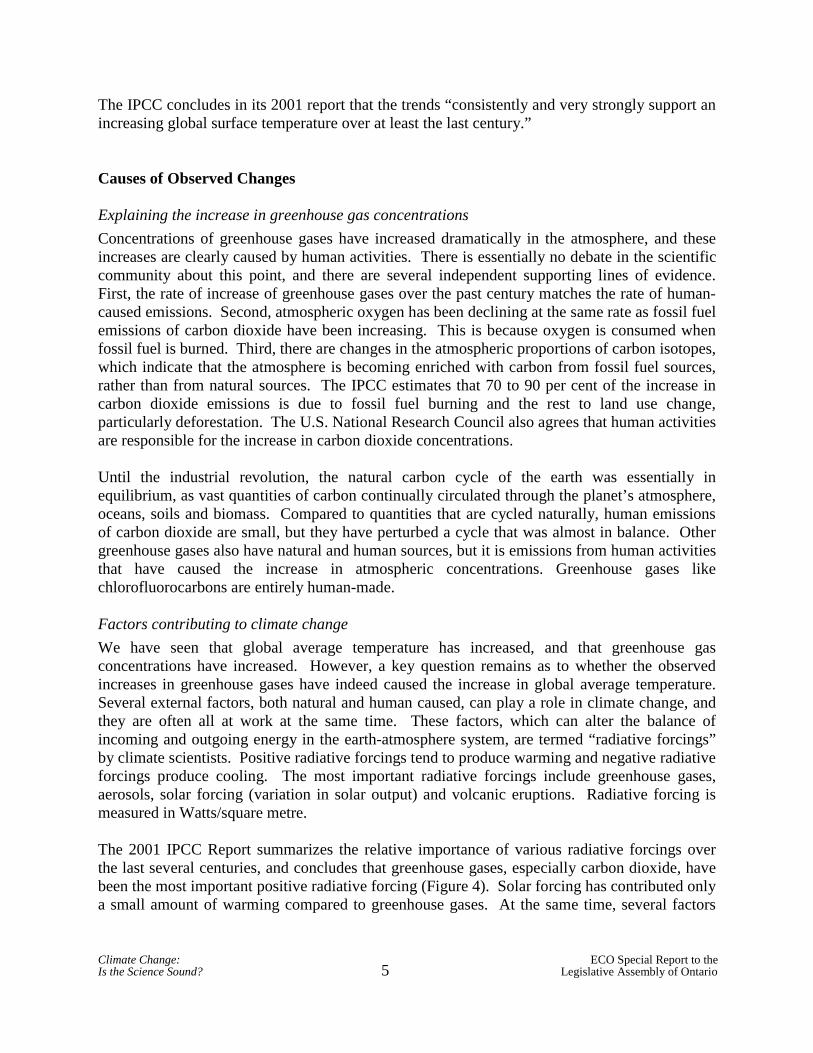
Figure 6. Carbon dioxide emission projections during the period 2000-2100
The midpoint of the projected CO2 emissions due to fossil fuel use for SRES scenario families A1T, A1B, A1T, A2, B1, and B2. Within each family there is a wide range of emission trajectories, and hence substantial overlap between the different families, as discussed in Nakicenovic et al. (2000). Source: Prepared by Professor Danny Harvey, Department of Geography, University of Toronto, using data published in Houghton et al. (2001), Appendix II.I.
0
5
10
15
20
25
30
2000 2025 2050 2075 2100Year
Emis
sion
(Gt C
/yr)
A1F
A1T
A1B
A2
B1B2
APPENDIX B:
TECHNICAL APPENDIX OF CLIMATE CHANGE: IS THE SCIENCE SOUND?
Table of Contents
SECTION 1 – Observed changes in climate and other indicators ........................1
1.1 Increasing greenhouse gas concentrations ..................................................................1
1.2 Rising temperatures.......................................................................................................2
1.3 Glaciers, ice caps, and other indicators........................................................................6
1.4 Sea level rise ..................................................................................................................7
1.5 Conclusion .....................................................................................................................8
SECTION 2 – Causes of observed changes in the climate system.........................8
2.1 Explaining the increase in greenhouse gas concentrations ........................................8
2.2 Concept of radiative forcing........................................................................................10
2.3 Human contributions to climate change ....................................................................11
2.4 Debates about natural and human factors in climate change...................................12
2.5 Debates about the evidence .........................................................................................14
2.6 Causes of recent sea level rise.....................................................................................16
2.7 Conclusion ...................................................................................................................17
SECTION 3 – Projecting future global scale climatic change ..............................18
3.1 Economic models to give scenarios of future emissions ............................................19
3.2 Carbon cycle models to compute the build-up of atmospheric carbon dioxide ........20
3.3 Climate models to compute the resulting change of climate .....................................21
3.4 Climate-carbon cycle feedbacks..................................................................................22
3.5 Regional patterns and features of climatic change....................................................22
3.6 Are climate models reliable? .......................................................................................24
Endnotes ......................................................................................................................................27
Technical Appendix of Climate Change: Is the Science Sound? B-1 ECO Special Report to the Legislative Assembly of Ontario
TECHNICAL APPENDIX OF CLIMATE CHANGE: IS THE SCIENCE SOUND?
SECTION 1 – Observed changes in climate and other indicators In this section the evidence indicating changes in the earth’s climate and climate systems is reviewed. Trends in the atmospheric concentrations of greenhouse gases are described. Observed changes in temperatures and other indicators of climate change such as glaciers, ice caps and snow-cover are presented. The section concludes with a discussion of changes in the rate of sea level rise. Greenhouse Effect – What is it? The greenhouse effect is a naturally occurring feature of the earth’s atmosphere that moderates temperature on the planet. In simple terms, it is the heat trapping property of the atmosphere (see figure below). The greenhouse effect is so-called because it could be likened to the glass of a greenhouse – greenhouse gases let the solar radiation in, but also trap much of the resulting heat from escaping. The sun’s radiation reaches and warms the surface of the earth and then is radiated back to space as infrared radiation. The so-called greenhouse gases absorb the outgoing radiation and re-radiate some of that heat back to the earth. Water vapour, carbon dioxide, methane, nitrous oxide and ozone are some of the most significant greenhouse gases. Without these greenhouse gases surrounding the earth, the earth would be about 33 ºC colder, so the natural greenhouse effect is essential for life on earth. The concern is that human activities are leading to an enhancement of the greenhouse effect, causing temperatures to rise, by adding to the natural atmospheric concentration of greenhouse gases.
1.1 Increasing greenhouse gas concentrations The observed increase in atmospheric greenhouse gas concentrations is an area of broad scientific consensus and very little debate. The following figures are largely taken from the Third Assessment Report of the Intergovernmental Panel on Climate Change (the 2001 IPCC Report) and confirmed by the U.S. National Research Council. The present carbon dioxide concentration in the atmosphere is higher than at any time during at least the past 420,000 years, as illustrated in Figure 1. Carbon dioxide concentrations varied between 180-300 parts per million by volume (ppmv) during the ice ages but then remained relatively stable between 270-290 ppmv from the end of the last ice age until the beginning of the industrial era. The atmospheric concentration of carbon dioxide then increased 31 per cent, first gradually and then at an increasing rate, from 280 ppmv in 1800 to 370 ppmv in 2000.1 The rate of increase over the past century is at least ten times faster than at any time during the preceding 20,000 years.2
Technical Appendix of Climate Change: Is the Science Sound? B-2 ECO Special Report to the Legislative Assembly of Ontario
Methane concentrations are also higher now than at any time during the past 420,000 years and have more than doubled since 1750, rising from approximately 700 parts per billion by volume (ppbv) to 1745 ppbv in 1998. 3 Nitrous oxide concentrations are at their highest level in at least the past thousand years and have risen from 270 ppbv in 1750 to 314 ppbv in 1998, an increase of about 16 per cent.4 Tropospheric ozone is estimated to have increased by 35 per cent since 1750.5 The concentration of ozone near the surface in summer is anywhere from two to five times its pre-industrial concentration over most of North America.6 Halocarbons such as chlorofluorocarbons and other human-made gases have been present in the atmosphere only since they were created and released in the 20th century. The concentrations of most gases that are also ozone-depleting substances are either declining or increasing more slowly in response to controls introduced in the mid-1990s under the Montreal Protocol. Concentrations of other synthetic greenhouse gases continue to increase.7 What are the IPCC findings based on? The historical record of greenhouse gas concentrations in the atmosphere has been recreated by measuring the concentration of the gases still present in trapped air bubbles in ice cores extracted from several locations in the Antarctic and Greenland. Figure 1 is based on data from the Vostok ice core from the Antarctic, which shows the record of atmospheric carbon dioxide, methane and nitrous oxide for 420,000 years, over the past four ice ages. Carbon dioxide, methane, nitrous oxide, and the halocarbons are referred to as “well-mixed” greenhouse gases because they last sufficiently long in the atmosphere that their concentration is almost exactly the same everywhere. Hence, measurements of their concentration at any given location are indicative of the worldwide increase in their concentration in the atmosphere. Slight regional and hemispheric variations in their concentration provide clues about the regional distribution of sources and of natural removal processes. Carbon dioxide has been measured continuously at two stations since 1958 and through a global network since the 1970s. Those highly precise, continuous measurements match the ice-core measurements where they overlap. Ozone and aerosols, on the other hand, do not last long in the atmosphere before being removed, so their concentrations vary markedly from one place to the next. This makes it harder to derive a global average concentration. 1.2 Rising temperatures There is compelling evidence and broad scientific consensus that the global average temperature has been rising in the last century. The 2001 IPCC Report concludes with a 95 per cent confidence level that the global average surface temperature has increased over the 20th century by 0.6ºC, plus or minus 0.2ºC.8 While an increase of 0.6ºC may be minor as a measure of everyday local weather, it is quite a remarkable change as a measure of global average climate. The same 2001 IPCC Report has also found it very likely that the 1990s was the warmest decade globally and 1998 the warmest year in the instrumental record since 18619 (Figure 2). Other scientific agencies have reviewed and supported the conclusions of the 2001 IPCC Report. Most prominently, the U.S. National Research Council was asked to report to the White
Technical Appendix of Climate Change: Is the Science Sound? B-3 ECO Special Report to the Legislative Assembly of Ontario
House in June 2001 on this question, and concluded that “Despite the uncertainties, there is general agreement that the observed warming is real and particularly strong within the past 20 years.”10
Agreed: Global Temperature is Rising Within the scientific community, there is virtually universal agreement that global average temperature is rising, even among scientists who are otherwise skeptics regarding the predicted impacts of climate change. For example Dr. Richard Lindzen, a member of the U.S. National Academy of Sciences, is a prominent scientist who doubts that human activities pose a threat to the climate. But he agrees that the world has warmed about 0.5ºC over the past 100 years or so, and that human activities have increased the amount of carbon dioxide in the atmosphere by about 30 per cent.11 Similarly, Dr. S. Fred Singer is a widely cited geophysicist who questions the importance of human contribution to climate change. Nevertheless, he notes that “There is general agreement that the global climate warmed between about 1880 and 1940….”12 Dr. Bjorn Lomborg, author of The Skeptical Environmentalist, also agrees that temperatures have been rising, and, moreover, that it is due to human causes: “… in my book I clearly use the U.N.’s Intergovernmental Panel on Climate Change (IPCC) as key documentation, and all the uncertainties notwithstanding, I accept that science points to anthropogenic global warming.”13
What are the IPCC’s findings based on? Temperature over the last century To determine global average temperatures over the last century, the most recent IPCC report reviewed several large, authoritative databases. These databases are collections of thermometer readings taken daily at thousands of land stations and on board thousands of ships dating back into the late 19th century.14 Two examples are the databases maintained by the University of East Anglia’s Climate Research Institute and the Global Historical Climatology Network (GHCN) maintained by the National Climate Data Centre in North Carolina, U.S. The GHCN can serve to illustrate the scope and quality of data that are used and the quality control efforts that are applied by organizations responsible for these databases.15 The GHCN was designed specifically for the study of climate change at global and regional scales. A version 2 of the GHCN was released in May 1997, and consists of monthly mean surface temperatures from 7,280 stations from around the world. The GHCN version 2 aims to provide more recent data, denser coverage and improved coverage of data-sparse areas compared to a previous 1992 version. Among other things, version 2 digitized early temperature records for stations operated by various European countries in overseas colonies, including hundreds of early African stations.16 All GHCN stations have at least 10 years of data. Approximately 1,000 GHCN stations have a century or more of mean temperature data, providing good historical coverage in North America, Europe, and parts of Asia and Australia. For the rest of the world, the pre-1900 era coverage is spotty, but is expected to improve as more early data are digitized and added to the database. The GHCN database contains 4.7 million station months of temperature data, starting
Technical Appendix of Climate Change: Is the Science Sound? B-4 ECO Special Report to the Legislative Assembly of Ontario
in 1701 and continuing to the present, derived from 300 million individual readings of thermometers. The GHCN database was scrutinized to identify and resolve numerous potential types of errors, such as duplicate datasets for the same station, mislocated stations and digitizing errors. Data outliers were identified, evaluated and where appropriate, removed. Each dataset was also tested statistically and adjusted for discontinuities that could be caused by changes over time in instruments, shelters or station locations.17 In summary, the record of temperature observations used by researchers covers an extensive timeframe and has been gathered from a vast geographic area, and the databases are subject to considerable quality control. The 2001 IPCC Report notes that sea surface temperature data were based on over 80 million observations, which have been checked for homogeneity and have been corrected for methodological changes such as use of wooden and canvas buckets prior to 1942.18 Land and sea surface data were collected independently, but both data sets show the same general pattern of temperature trends over the last century. In other words, they corroborate each other. Both data sets show increasing global average temperatures from 1900 to the 1940s, followed by leveling off or even decreasing temperatures until the mid to late 1970s, followed by temperature increases over the most recent twenty years. 19 20 Some critics have argued that thermometer readings are prone to many types of errors, including calibration problems and faulty transcription, digitization or transmission of data, and are influenced by many factors such as wind and design of weather stations.21 However, a panel of the U.S. National Research Council largely dismissed these concerns in 2000, stating that “such quality control problems add noise to the data, but are not likely to add a bias to the results because of the large number and variety of sites monitored.”22 There are also criticisms that global temperature databases focus much more on industrialized nations and urban areas than on sparsely populated regions.23 Urban areas are affected by heat radiated from buildings and vehicles, and this causes a well-known “heat island effect. Critics are concerned that this effect can skew results, showing more warming than has really occurred. However, IPCC reports have countered this concern consistently since 1992.24 The IPCC notes that researchers have evaluated the various databases of land surface air temperature, and have compared long-term trends for rural sites only with trends for all types of sites (rural plus urban combined). They found that the differences were not statistically significant, concluding that over all, urban effects on temperature measurements have not exceeded about 0.05ºC over the period 1900 to 1990.25 Temperatures over the last millennium To estimate global temperatures before the invention of thermometers, researchers have used a number of what are known as “proxy” indicators. For example, Dr. Michael Mann, an IPCC author, and his associates reconstructed global patterns of annual surface temperature back to AD 1000, using tree rings as well as ice cores from polar regions, historical documentary indicators and marine coral data.26 These proxy climate indicators derive not only from North America, but also from Europe and Asia, with some samples from the southern hemisphere.27 Because data from tree rings, polar ice cores and corals from shallow tropical waters are collected from very different geographic regions, researchers are able to combine these indicators to create large-scale reconstructions of past climate trends.28 The technique involves
Technical Appendix of Climate Change: Is the Science Sound? B-5 ECO Special Report to the Legislative Assembly of Ontario
determining the relationship between the proxy record and temperature using data from part of the period where the two are overlapping (a process called calibration), then verifying the relationship by testing the climate predictions with other data that were not used for calibration, and finally reconstructing temperature changes for the period before which we have any direct observations.29 Some observations have spurred debate: Satellite Data According to most climate modeling simulations, as carbon dioxide concentrations increase, the upper atmosphere (the stratosphere) is expected to cool, while the surface and the lower atmosphere (the troposphere) are expected to warm.30 Satellite data have, as predicted, been showing cooling trends in the stratosphere since 1979, when such data first became available. However, satellite data also indicate that, contrary to model predictions, temperatures in the lower troposphere have been rising significantly less than surface temperatures.31 These findings have led some to suggest that the surface temperature data may not be reliable, while others believe there may be problems with the satellite data. The Climate Research Committee of the U.S. National Research Council established a panel to consider these questions. The panel reported in 2000 that “the warming trend in global-mean surface temperature observations during the past 20 years is undoubtedly real and is substantially greater than the average rate of warming during the 20th century. The disparity between surface and upper air trends in no way invalidates the conclusion that surface temperature has been rising.”32 The panel also noted that surface temperatures have the most direct impacts on human life and society.33 Several causes may be responsible for the troposphere warming less rapidly than the surface, including volcanic eruptions between 1979 and the late 1990s, as well as human-caused ozone depletion in the stratosphere.34 The 2001 report of the U.S. National Research Council to the White House agreed that ozone loss in the stratosphere might be a contributing cause.35 The Importance of Sulphate Aerosols Aerosols are liquid or solid particles suspended in the air. There are many types of aerosols, derived from both human activities and natural sources. Sulphate aerosols are of special interest to climate researchers because they are derived from sulphur emissions produced by the burning of sulphur-containing fossil fuels and the smelting of metals and because their overall effect in the atmosphere is to cool temperatures. However, because their residence time in the atmosphere is on average only about four to seven days, their cooling impact is short-lived. It can be expected that sulphur emissions from fossil fuel burning will decrease during the 21st century as more nations put in place air pollution controls. As sulphur emissions decrease, the cooling effect of sulphate aerosols will also decrease, and one can expect that the climate will temporarily tend to warm more rapidly in response to the heating effect of greenhouse gases already in the atmosphere.36
Technical Appendix of Climate Change: Is the Science Sound? B-6 ECO Special Report to the Legislative Assembly of Ontario
Variable climate over the last thousand years Figure 3 illustrates a long-term cooling trend between AD 1000 to AD 1900, which was abruptly reversed by the warming of the past 100 years, making the last 100 years highly unusual. There is historical evidence of climatic anomalies over the past millennium in Europe and neighbouring regions.37 The most prominent episodes were a medieval warm period, which stretched roughly from the 11th to the 14th centuries, and also a so-called Little Ice Age, extending roughly from the 17th to the late 19th century. Some argue that the current warming trend may be simply part of that natural variability, and/or that the climate may be returning to “normal” after the Little Ice Age.38 But the most recent IPCC report concluded that these two historical episodes did not appear to have a uniform global signature. Peak warmth or coldness was observed during substantially different epochs in different regions, and may have been related to regional variations in the North Atlantic climate. In contrast, the warming observed during the 20th century has a more convincing synchronous global pattern.39 (Also, the observed rapid rise in temperature in the late 20th century does not conform to what would be predicted from a gradual return to normal conditions, and far exceeds the cooling that led to the Little Ice Age.) 1.3 Glaciers, ice caps, and other indicators Scientists have observed that glaciers and ice caps are particularly sensitive to climate change.40 Melting of glaciers and ice caps contributes to global sea level rise but also has significant local ecological implications because glaciers are important influences on alpine ecosystems and provide the baseflow for innumerable streams and rivers on several continents. Glaciers and ice caps gain mass by accumulation of snow, which is transformed to ice. Ablation is the loss of mass through surface melting and subsequent evaporation or run-off of the melt water. Net accumulation occurs at higher altitudes and net ablation occurs at lower altitudes. Mass balance studies are essentially a measure of change; the mass balance would be zero for a steady state. While the measurement of mass balance records for all of the world’s 10,000 glaciers is not feasible, it is possible to use an approximate approach based on glaciers in similar climatic regions.41 Scientists have developed regional totals of area and volume, further improved by high resolution remote sensing and by radio-echo-sounding.42 The specific mass balance of glaciers varies geographically and temporally. Based on the synthesis of available data, the IPCC states that glaciers in most parts of the world have had a negative mass balance in the past 20 years.43 Measurement of the size of glaciers, particularly their lengths, provides another form of climatic information. The IPCC concludes there is now abundant evidence of a major retreat of most mountain glaciers during the last 100 years.44 Some researchers point to locations where glaciers are advancing (i.e., growing in length) as evidence against climate change. The IPCC explains however that glaciers are advancing in Norway and New Zealand because of unusual increases in precipitation.45 There are many other indicators that the climate is warming, apart from a worldwide retreat of mountain glaciers. Annual snow cover in the Northern hemisphere has decreased since 1996 by about 10 per cent.46 Studies from throughout the Northern hemisphere have also shown an
Technical Appendix of Climate Change: Is the Science Sound? B-7 ECO Special Report to the Legislative Assembly of Ontario
overall reduction in spring snow cover in the latter half of the 20th century.47 Additionally, the analysis of lake and river ice records over the past 150 years demonstrates an accelerating trend of earlier spring ice break-ups and later autumn freeze-ups.48 Studies of sea ice processes using satellite data reveal varying impacts of climate change. Over approximately the last 30 years, the extent of Arctic sea-ice has been declining at a rate of about 3 per cent per decade and thickness data show a near 40 percent decrease in the summer minimum thickness of Arctic sea ice.49 A general warming in the permafrost in many regions, including a 2 to 4ºC warming of deep permafrost in the Alaskan Arctic over the last century.50 Satellite observations indicate that the growing season north of 45ºN increased by 12±4 days over the period 1981-1991.51 Finally, the distributions of a number of plant and animal species have shifted poleward or to higher elevations in recent years.52 1.4 Sea level rise The IPCC estimates an average sea level rise of 0.1 to 0.2 metres over the last hundred years.53 Scientists measure the mean sea level of a coast averaged over a given period of time to determine the extent of change. Tidal gauges measure the level of the sea surface relative to the land where the gauge is located. Changes in the mean sea level of a coast can be caused by both the movement of land, such as by glacial rebound, or by the change in the height of sea surface. The movement of land is important as the earth’s response to the past changes in ice and water loads resulted in an increase in sea level since the last ice age for localities far from the former ice margins. To infer changes in mean sea level, the movement of the land is subtracted from the records of tidal gauges and geological indicators of past sea level. Analysis of geological data indicates that the ocean volume may have added 2.5 to 3.5 metres to the global average sea level over the past 6,000 years.54 However, high-resolution sea level records indicate that much of this rise to sea levels occurred more than 3,000 years ago.55 The average rate of sea level rise has increased from 0.1-0.2 millimetres per year during the past 3000 years to 1-2 millimetres per year during the 20th century.56 This is an increase by a factor of ten, although there is no evidence of acceleration within the 20th century due to the inability to detect such changes with statistical confidence.57 The recent use of satellite radar altimetry also now provides data on oceans that approximates near global coverage, covering almost all the ice-free oceans from 66°N to 66°S. These data can be used to supplement and compare with data measuring tidal levels. Analysis of satellite data since 1992, allowing for instrumental drift and using corrections from tidal gauge comparisons, reveal a global sea level rise ranging from 1.4±0.2 to 3.1±1.3 millimetres per year.58 The data show variations during El Niño events, but suggest a rate of sea level rise during the 1990s greater than the mean rate of rise for much of the 20th century. The IPCC states that it is not yet clear whether this result is due to recent acceleration, to differences in the two measuring techniques, or to the relatively short length of the satellite data record.59 Despite the identification of anomalies by some researchers, such as site-specific decreases in sea levels, the accelerated global mean sea level rise compared to past centuries has been documented in studies around the globe.60
Technical Appendix of Climate Change: Is the Science Sound? B-8 ECO Special Report to the Legislative Assembly of Ontario
1.5 Conclusion Ice core records show that carbon dioxide and methane concentrations are higher now than at any time in at least the past 420,000 years, and have been rising at an ever-increasing rate since the industrial revolution. Many of the observed changes in climate and other indicators are consistent with each other and provide increased evidence of a changing climate system. For example, land temperatures and sea surface temperatures show consistent increasing trends. The widespread retreat of mountain glaciers is consistent with global temperature increases. Decreases in spring snow cover extent since the 1960s and in lake and river ice over the past century, match increases in temperatures in the Northern hemisphere. Decreases in spring and summer Arctic sea-ice extent and in sea-ice thickness are consistent with regional land and ocean temperature increases. The 2001 IPCC Report concludes that the trends of the examined indicators “consistently and very strongly support an increasing global surface temperature over at least the last century.”61 SECTION 2 – Causes of observed changes in the climate system The preceding section described the observed changes to the climate system, including the increase in atmospheric concentrations of greenhouse gases, the rise in global mean temperature and sea level rise. In this section, information is presented to explain the increases in greenhouse gas concentrations and to examine the question of whether the increases in greenhouse gases have caused the increase in global mean temperature. The major natural and human factors driving climate change are set out and a few key debates about the factors are discussed. The causes of sea level rise are also described. 2.1 Explaining the increase in greenhouse gas concentrations Carbon dioxide, methane and nitrous oxide have both natural and anthropogenic (human-caused) sources of emissions. Data from polar ice cores indicate that the concentrations of carbon dioxide, methane and nitrous oxide were relatively constant for millennia prior to the last two centuries. The recent increases (seen in Figure 1 for carbon dioxide and methane) are without any doubt due to human activities. Although human emissions of carbon dioxide are small compared to natural emissions, humans have perturbed what was close to a perfectly balanced cycle (with large natural emissions offset by large natural absorption processes). The IPCC estimates that 70 to 90 per cent of the increase in carbon dioxide emissions is due to fossil fuel burning and the rest to land use change, particularly deforestation.62 The U.S. National Research Council also agrees that human activities are responsible for the increase in carbon dioxide concentrations.63 The evidence is convincing. First, the recent increase in atmospheric carbon dioxide exceeds the bounds of natural variability over the past 420,000 years. Second, the rate of increase over the past century matches the rate of anthropogenic emissions. Another compelling piece of evidence is that fossil fuel burning consumes oxygen, and oxygen has been declining in the atmosphere at the same rate as fossil fuel emissions of carbon dioxide have been entering the
Technical Appendix of Climate Change: Is the Science Sound? B-9 ECO Special Report to the Legislative Assembly of Ontario
atmosphere. 64 Another unmistakable fingerprint of the burning of fossil fuel is the observed decrease in the atmosphere of the isotopes carbon-13 and carbon-14.65 The carbon in fossil fuels has relatively less carbon-13 than the free atmosphere and has zero carbon-14 because the carbon-14 decays during the time the fossil fuel spends underground. When fossil fuels are burned, they dilute the carbon-13 and carbon-14 in the air and this can be measured. The carbon dioxide concentration is slightly higher in the northern hemisphere than in the southern hemisphere, and this difference has increased in step with the growth of fossil fuel emissions, which are concentrated in the northern hemisphere.66 The Nature of Greenhouse Gases Water vapour is the most important greenhouse gas in terms of quantity but in this report, as in the reports of the IPCC, it is not discussed along with the other greenhouse gases because its abundance in the atmosphere is only very indirectly affected by human activities. Instead it is considered part of the natural hydrological cycle. Well-mixed greenhouse gases are those that remain in the atmosphere for at least one year and tend to be thoroughly mixed by winds before they are removed. They have a fairly uniform concentration anywhere in the atmosphere and so their concentrations can be easily measured. The well-mixed greenhouse gases include carbon dioxide, methane, nitrous oxide and halocarbons. Ozone is a non-uniform greenhouse gas because it is short-lived. It does not spread very far before it is removed from the atmosphere, so concentrations vary regionally. Ozone is not directly emitted like most of the other greenhouse gases, but is formed by the mixing of sunlight and certain gases in the atmosphere. These precursors or ozone-forming gases include nitrogen oxides, volatile organic compounds, hydrocarbons, methane and carbon monoxide.
Global warming potential (GWP) measures the ability of any greenhouse gas to contribute to the greenhouse effect. The global warming potential of carbon dioxide is arbitrarily assigned a value of 1, and is the basic unit of GWP for making comparisons to other gases – all other gases’ GWP are expressed in relation to it. GWP is measured over a specific timeframe since greenhouses gases vary in how long they last in the atmosphere. For much of their work, policy analysts use a 100-year period. The GWP for the most significant greenhouse gases on a 100-year timeframe are67:
• Carbon dioxide: 1 • Methane: 23 • Nitrous Oxide: 296 • Chlorofluorocarbon-11: 4,600 • Chlorofluorocarbon-12: 10,600
Many of the greenhouse gases are hundreds or even thousands of times more effective than carbon dioxide in trapping heat, and some of the man-made gases will persist in the atmosphere for thousands of years. But carbon dioxide has the most effect on climate because it is emitted in such large quantities.
It is estimated that more than half of methane emissions are currently due to human activities such as the handling of natural gas, cattle farming, rice agriculture and landfills. About one-
Technical Appendix of Climate Change: Is the Science Sound? B-10 ECO Special Report to the Legislative Assembly of Ontario
third of nitrous oxide emissions now come from agricultural soils, cattle feed lots and the chemical industry. Tropospheric ozone concentrations have increased because of increased emissions of carbon monoxide, nitrogen oxides and volatile organic compounds from vehicles, fossil fuel burning power plants, and biomass burning. Halocarbons and other synthetic compounds are entirely anthropogenic and are used as refrigerants, spray can propellants, solvents, industrial foams and plastics.68 Estimates of emissions from fossil fuel burning are derived from annual energy statistics compiled by the United Nations and British Petroleum.69 The data used for estimates of carbon dioxide emissions from land-use conversion are more variable and less accurate. Estimates of emissions of synthetic gases are reliable because their production and use is well documented. Estimates of emissions of methane and nitrous oxide are less certain because both the natural and the anthropogenic sources are difficult to measure.70 The Relationship of Anthropogenic Carbon Dioxide Emissions to Air Pollution Carbon dioxide is the principal greenhouse gas in terms of quantity emitted by human activity. The majority of the emissions from human activity come from fossil fuel combustion such as the burning of gasoline in vehicles or coal by industry. Carbon dioxide itself does not directly lead to the formation of air pollution problems such as ground level ozone or acid rain. However, some of the most significant sources of the contaminants that lead to the formation of ozone (i.e., nitrogen oxides, volatile organic compounds) and acid rain (nitrogen oxides and sulphur dioxide) also involve fossil fuel combustion, for example by vehicles, power plants and industry. Consequently, some of the principal sources of carbon dioxide also happen to be sources of emissions linked to certain air quality problems like smog or acid rain. Almost any measure that reduces carbon dioxide emissions will also reduce air pollution and related impacts on human health. Conversely, since ozone is a greenhouse gas and the key constituent of smog, and sooty particulate matter has a warming effect, efforts to reduce smog and particulate pollution will have some global warming benefits. 2.2 Concept of radiative forcing Several external factors, both natural and anthropogenic, can play a role in climate change. The term “radiative forcing” is used to describe any factor that alters the balance of incoming and outgoing energy in the earth-atmosphere system. Positive radiative forcings tend to result in warming and negative radiative forcings result in cooling. The measure of radiative forcing is expressed in Watts per square metre (Wm-2). The IPCC describes this as a concept that can be used to estimate the relative impacts of different natural and anthropogenic factors on climate. Figure 4 summarizes the IPCC’s estimates of the radiative forcings between 1750 and 2000 due to increased concentrations of greenhouse gases, aerosols, solar forcing and other factors and indicates the level of scientific understanding of each. This figure illustrates the IPCC’s conclusion that greenhouse gases, and carbon dioxide in particular, have had the most impact of the positive radiative forcing agents.71 (While water vapour is acknowledged to be the most important greenhouse gas, it is not evaluated as a forcing agent. Changes in water vapour are
Technical Appendix of Climate Change: Is the Science Sound? B-11 ECO Special Report to the Legislative Assembly of Ontario
considered a natural feedback within the climate system, and are discussed further in section 3.3.) The IPCC estimates that the radiative forcing attributable to increases in the well-mixed greenhouse gases since 1750 is +2.43 Wm-2, with an uncertainty of 10 per cent.72 The forcing attributed to carbon dioxide is +1.46 with an uncertainty of less than 10 per cent,73 which is roughly equal to all other greenhouse gases put together, and significantly higher than any other factor. Methane is the second most important greenhouse gas at +0.48 Wm-2 with an uncertainty of 15 per cent.74 Tropospheric ozone is the third most important with an estimate of +0.35±0.15 Wm-2.75 Solar forcing is estimated at +0.3±0.2 Wm-2.76 Black carbon from fossil fuel burning is a minor contributor. Some of the factors that cause cooling include depletion of the stratospheric ozone layer, organic carbon from burning fossil fuels and biomass, and emissions of sulphates and other aerosols. Volcanic aerosols following eruptions also cause significant short-term cooling but could not be assigned a value for the entire period of 1750 to 2000. What are the IPCC’s findings based on? The IPCC assigned a “level of scientific understanding” of high, medium, low and very low to each forcing agent to describe their confidence in the numerical estimates. They describe the best knowledge available and the major uncertainties or limitations associated with each forcing. The IPCC states that the estimates of radiative forcing for the well-mixed greenhouse gases were based on excellent measurements of their concentrations and knowledge of their radiative properties, resulting in a ranking of a high level of scientific understanding and an uncertainty of less than 10 per cent for carbon dioxide77 and 10 per cent for the others.78 The estimates for stratospheric and tropospheric ozone were based on a medium level of scientific understanding. The IPCC states that aerosols and their effect on clouds and solar forcing were assigned a very low level of scientific understanding, based on the lack of information and major uncertainties. Satellites have measured solar irradiance accurately and directly since the late 1970s and proxy data such as observations of sunspots and measurements of carbon-14 and beryllium in tree rings and ice cores are used to estimate solar irradiance for earlier periods. 2.3 Human contributions to climate change In its 2001 Report the IPCC concludes that there is new and stronger evidence that most of the warming observed over the past 50 years is attributable to human activities. The IPCC makes the following statements about human influence on global climate:
“The warming over the past 100 years is very unlikely to be due to internal variability alone, as estimated by current models. Reconstructions of climate data for the past 1,000 years also indicate that this warming was unusual and is unlikely to be entirely natural in origin.”79 “There are new estimates of the climate response to natural and anthropogenic forcing, and new detection techniques have been applied. Detection and attribution studies consistently find evidence for an anthropogenic signal in the climate record of the last 35 to 50 years.”80
Technical Appendix of Climate Change: Is the Science Sound? B-12 ECO Special Report to the Legislative Assembly of Ontario
The June 2001 report of the U.S. National Research Council to the White House also addresses this question, and finds evidence of a human link, but not absolute proof. The report summary states: “The IPCC’s conclusion that most of the observed warming of the last 50 years is likely to have been due to the increase in greenhouse gas concentrations accurately reflects the current thinking of the scientific community on this issue.”81 Several pages on, the report elaborates: “Because of the large and still uncertain level of natural variability in the climate record and the uncertainties in the time histories of the various forcing agents (and particularly aerosols), a causal linkage between the build-up of greenhouse gases in the atmosphere and the observed climate changes during the 20th century cannot be unequivocally established. The fact that the magnitude of the observed warming is large in comparison to natural variability as simulated in climate models is suggestive of such a linkage, but it does not constitute proof of one because the model simulations could be deficient in natural variability on the decadal to century time scale.”82 To try to tease out human influences, researchers have compared various model simulations of global temperature with observed global temperatures over the last 140 years. Figure 5 illustrates the results of these simulations. When the models simulated only the influences of solar variation and volcanic eruptions during this time frame, the resulting temperature graphs did not closely match the observed record. When the models simulated only the influences of human impacts (greenhouse gases, stratospheric ozone depletion and sulphate aerosols), somewhat better matches with the observed record were achieved. But the best match with observations was achieved when both natural and human-caused influences were all combined in the simulation models.83 2.4 Debates about natural and human factors in climate change Solar Forcing One issue of great debate is how much influence variation in total solar irradiance, the solar energy reaching the earth, could have on global warming. Solar irradiance varies by about 0.1 per cent between the minimum and maximum of each 11-year solar cycle and may be increasing slightly from one cycle to the next.84 But that is too little to cause much climate change.85 Based on historical reconstructions of total solar irradiance by several authors, the IPCC estimates a solar forcing of between +0.1 to +0.5 Wm-2 since 1750, compared to a forcing of +2.43 with only 10 per cent uncertainty for the well-mixed greenhouse gases.86 The IPCC says this solar forcing may have contributed to some of the warming observed in the first half of the 20th century but very little in the latter half. They state that the net effect of the two natural factors, solar variation and volcanoes, is estimated to be negative for the last 20 to 40 years.87 Despite the fact that measured solar variations are relatively insignificant, the “solar hypothesis” continues to be debated, fuelled by a 1995 study that showed a strong correlation between historical proxy temperature data and solar cycle lengths.88 A 1998 study pointed out several errors in the 1995 data and analysis, and concluded that a corrected analysis of the same data actually supports the IPCC assessment of man-made global warming.89 Skeptics have even claimed that the 1998 study is proof that solar variation is a major influence in global warming90, but its authors have gone out of their way to explain that their findings should not be
Technical Appendix of Climate Change: Is the Science Sound? B-13 ECO Special Report to the Legislative Assembly of Ontario
viewed as some kind of proof of the reality of an influence from solar activity upon terrestrial temperatures.91 The only way that variation in solar radiation could have a major impact on climate forcing would be if it had an indirect effect – if solar irradiance were somehow amplified through another mechanism. One theory that has garnered a lot of attention is that variations in cosmic rays may affect temperature through an indirect effect on cloud cover. Cosmic rays are high-energy particles of atoms that flow into our solar system from far away in the galaxy. One study found a connection between cloudiness and intensity of cosmic radiation, although the authors admitted “the actual microphysical explanation of such a relationship is still lacking.”92 The IPCC considered this and many other studies of the solar and cloud data and stated that evidence for the impact of cosmic rays on clouds has not been established.93 The U.S. National Research Council also concluded “numerous possible indirect forcings associated with solar variability have been suggested. However, only one of these, ozone changes induced by solar ultraviolet irradiance variations, has convincing observational support. Some studies have estimated this indirect effect to enhance the direct solar forcing by +0.1 Wm-2, but this value remains highly uncertain. Solar forcing is very uncertain, but almost certainly much smaller than the greenhouse gas forcing.”94 Other Possible Natural Causes Some people wonder if changes in the earth’s orbit might be responsible for the currently observed warming trends. Slow, regular variations in the earth’s rotational axis and orbit (the so-called Milankovitch cycles) have played an important role in causing climate change during past ice ages. But these changes occur in regular cycles over thousands of years and are not responsible for the current warming. It has also been suggested that internal changes in atmospheric and oceanic circulation may be responsible for the observed warming. This theory does not appear to match observations. Direct observations indicate that the oceans have warmed consistent with the downward penetration of heat from the surface. Recent studies indicate that the ocean is likely to be acting as a net heat sink, rather than a heat source.95 Methane Hydrates It has been hypothesized that releases of methane gas hydrate, which occurs naturally on land in polar regions and beneath the ocean floor in marine sediments, could be a major factor in climate change. Methane hydrate is a crystalline solid composed of water molecules that enclose methane gas molecules. A study by the U.S. Geological Survey concluded however, that gas hydrate is likely not a major factor in global climate change because much of the methane that could be released is probably converted to carbon dioxide and dissolved in the ocean as it rises to the surface; so most of the methane never reaches the atmosphere.96 A test in the Beaufort Sea of methane release from hydrate deposits failed to show much methane was being released and a global circulation model study concluded that even in the worst case scenario, the impact on future global warming caused by gas hydrate will be small. The 2001 IPCC Report points out that analysis of historical ice core records shows no evidence consistent with the rapid, massive release of methane hydrates in the past.97 Of the several studies reviewed by the IPCC, none estimated that hydrates would account for more than 2 per cent of
Technical Appendix of Climate Change: Is the Science Sound? B-14 ECO Special Report to the Legislative Assembly of Ontario
the current total natural and anthropogenic sources of methane. 98 In any case, methane contributes only about 20 per cent of the total radiative forcing due to greenhouse gases. 2.5 Debates about the evidence Warming hiatus in the northern hemisphere from 1946 to 1975 The 2001 IPCC Report states that “the northern hemisphere shows cooling during the period 1946 to 1975 while the southern hemisphere shows warming.”99 Since the cooling episode occurred at the same time as rapidly rising emissions of greenhouse gases, some researchers say this observation conflicts with the theory that warming has human causes.100 But the report to the White House by the U.S. National Research Council suggests several possible causes for this northern hemisphere cooling episode, including the build-up of sulfate aerosols due to the rapid growth in the emission of sulphur after the Second World War which can be attributed to rapid industrial growth and increased burning of coal and oil. In effect, the cooling influence of sulphur emissions increased more rapidly than the increase in heating from greenhouse gases, which contributed to temporarily stalling the increase in global average temperature. The report to the White House also notes that the observed warming in the early part of the 20th century, followed by a period of cooling, might be of natural origin, connected to changes either in oceanic currents, or solar luminosity, or the frequency of major volcanic emissions.101 Observed warming is less than predicted warming Some critics have raised concerns about the reliability of climate change models, since early models generally predicted more pronounced temperature rises than have actually been observed over the past century. For example, Dr. S. Fred Singer noted in 1999 that surface observations with conventional thermometers showed a rise of about 0.1ºC per decade, less than half that predicted by most general circulation models.102 However, it has been strongly suspected for a long time that aerosols have a net cooling effect on climate that could easily have offset half of the heating effect of the greenhouse gas build-up so far. Since the early 1990s, these effects have been incorporated in climate models and have been sufficient to reconcile observed and model-projected rates of warming. The 2001 IPCC Report notes that “most of these studies find that, over the last 50 years, the estimated rate and magnitude of warming due to increasing concentrations of greenhouse gases alone are comparable with, or larger than, the observed warming. Furthermore, most model estimates that take into account both greenhouse gases and sulphate aerosols are consistent with observations over this period.”103 The June 2001 Committee of the National Research Council reporting to the White House was also untroubled by the difference between the predicted warming trend in the 20th century and the observed warming, stating that “the warming that has been estimated to have occurred in response to the build-up of greenhouse gases in the atmosphere is somewhat greater than the observed warming. At least some of this excess warming has been offset by the cooling effect of sulphate aerosols, and in any case one should not necessarily expect an exact correspondence because of the presence of natural variability.”104
Technical Appendix of Climate Change: Is the Science Sound? B-15 ECO Special Report to the Legislative Assembly of Ontario
Trace Gases Some people wonder how an increase of carbon dioxide, a gas that accounts for only 0.037 per cent of total atmospheric gases, could be the cause of global warming. Nitrogen and oxygen, which make up 99 per cent of the atmosphere, are relatively transparent to radiation and are not greenhouse gases. The greenhouse gases, in contrast, are powerful absorbers of infrared radiation. Thus, a large relative increase in their concentration, although small in absolute terms, can indeed markedly affect the Earth’s climate. For an analogy, consider that even a little bit of mercury or cyanide can contaminate a huge body of water. Similarly, adding just a grain of salt to ice will change its properties and dissolve it into water. Relationship Between Carbon Dioxide Concentrations and Temperatures It is true that, just as natural climate has varied in the past, so have carbon dioxide levels. Carbon dioxide levels have been as much as 20 times higher in the far distant past,105 between 200 and 150 million years ago, but the climate was also much warmer and the sea level much higher. More importantly, the IPCC says there is evidence that carbon dioxide concentrations were below 300 ppmv by about 20 million years ago and stayed under 300 ppmv until they began to rise in the 19th century.106 Human civilizations developed under these atmospheric conditions. Skeptics have cited findings of studies showing past carbon dioxide concentrations that are not matched by temperature changes as proof that carbon dioxide could not be driving climate change. One analysis of the Vostok ice core records published in 1999 concluded that carbon dioxide concentrations increased anywhere between 200 and 1,000 years after the rapid warming at the end of each of the last three ice ages.107 But another team of Vostok scientists cautioned that it was premature to conclude that changes in carbon dioxide concentrations either preceded or followed changes in temperature, given the large uncertainty between the age of the gases and the age of the ice of ±1,000 yrs, or even more, if the accumulation-rate uncertainty is considered.108 The 2001 IPCC Report discussed this caution about the timing and said that, in any case, the Vostok ice core records do prove a remarkable correlation between carbon dioxide and methane levels and temperature, as they increased and decreased together in the same pattern over the 420,000 years. The IPCC says this is consistent with a significant contribution of carbon dioxide to climate change during the ice ages by amplifying the initial forcing due to changes in the earth’s orbit.109 Another study that received a great deal of attention in 1999 estimated the temperature of ancient tropical seas throughout the past 550 million years by analysing fossilized seashells and reported that two major episodes of predominantly cold tropical sea surface temperatures coincided with periods thought to have had high levels of atmospheric carbon dioxide. This led the authors to question the accuracy of reconstructed past carbon dioxide levels and the role of carbon dioxide as the main driving force of past global climate change.110 In 2001 another research team found that the previous studies underestimated temperatures, since the accuracy of the technique is affected by the quality of fossil preservation, geological age and burial depth. They presented new data using fossilized seashells that had been much better preserved because they had been encased in clay-rich sediments. Their analysis found that warm tropical sea surface temperatures occurred at the same time as increased carbon dioxide concentrations and
Technical Appendix of Climate Change: Is the Science Sound? B-16 ECO Special Report to the Legislative Assembly of Ontario
concluded that this new evidence supports the view that high levels of greenhouse gases contributed to global warming during these periods.111 2.6 Causes of recent sea level rise The 2001 IPCC Report notes that “it is very likely that 20th century warming has contributed significantly to the observed sea level rise, through thermal expansion of sea water and widespread loss of land ice.”112 The processes or components contributing to sea level change considered by the IPCC include thermal expansion, glaciers and ice caps, ice sheets, permafrost, sediment deposition and terrestrial storage. Changes to the global mean sea level may result from changes to the density of water or to the total mass of water. Changes to both density and mass can be caused by climate and human-induced climate change. Thermal expansion occurs because the density of water decreases as the ocean warms, so even at constant mass the volume of the ocean increases. The IPCC concluded that thermal expansion was one of the major contributors to 20th century sea level rise and will be the major contributor over the next hundred years.113 Scientists estimate that, averaged over the 20th century, thermal expansion has contributed 0.3 to 0.7 millimetres per year to global sea level rise. The models assume that the rate of thermal expansion has accelerated to 0.7 to 1.1 millimetres per year in recent decades. These figures are similar to recent observational estimates of about 1 millimetre per year.114 Glaciers, ice caps and ice sheets affect the mass of the oceans and thus sea level. Next to thermal expansion, the melting of glaciers and ice caps has made the biggest human contribution to sea level rise and this is expected to continue over the next hundred years. Studies indicate that the decrease in the size of glaciers and ice caps has contributed 0.2 to 0.4 millimetres per year over the last hundred years to global sea level rise.115 Greenland and Antarctica ice sheets are continental scale masses of fresh water ice formed by the burial and densification of snow. It should be noted that a small change in their mass balance would have a significant effect on sea level rise.116 Only the mass balance of ice sheets resting on bedrock needs to be considered, as changes to ice shelves do not affect sea level, as they are already afloat. Changes to the volume of the ice sheets by ablation through melting or calving (the breaking off of ice from land onto water as ice shelves or ice bergs) will affect sea level. Such changes take hundreds of years to affect sea level, however. Twentieth century human-induced climate change will not significantly impact Greenland and Antarctica for centuries to come. Scientists estimate that the ice sheet of Greenland has contributed between 0.0 to 0.1 millimetres per year to global sea level rise in the 20th century.117 These results also indicate that this ice sheet has been nearly in balance for the last several decades.118 This contribution to global sea level rise is the result of both increased accumulation and ablation. Even though Greenland has had a relatively neutral contribution to sea level rise to date, impacts of climate change on ice sheets are expected to occur over hundreds of years.
Technical Appendix of Climate Change: Is the Science Sound? B-17 ECO Special Report to the Legislative Assembly of Ontario
The West Antarctic ice sheet has received attention due to the recent break-ups of the Larsen ice shelves in the Antarctic Peninsula.119 Local imbalances have resulted in both positive and negative contributions to sea level rise.120 However, it is believed that the West Antarctic ice sheet is not currently making a significant contribution to global sea level change.121 The East Antarctic ice sheet is also believed to have not contributed to sea level rise in the recent past.122 The IPCC suggests that Antarctica contributed –0.2 to 0.0 millimetres per year to global sea level rise in the 20th century.123 Some researchers have used these data as evidence that climate change is not occurring. But the possible increase in Antarctica’s mass balance is thought to be due to greater precipitation levels as a result of changes in atmospheric circulation related to climate change.124 Natural geological processes also affect sea levels. Vertical land movements are still occurring as a result of the retreat of the ice sheets of the last glaciation. The IPCC reports that ice sheet models for the past 500 years estimate Greenland and Antarctica have contributed 0.0 to 0.5 millimetres per year as a result of long-term adjustment to the last deglaciation.125 This ongoing contribution of the ice sheets is anticipated to continue and is in addition to the effects of 20th century climate change. The conversion of permafrost ground ice to runoff is estimated to have contributed only 0.0 to 0.05 millimetres per year to sea level rise during the 20th century.126 Non-climate related changes to surface and groundwater storage also affect global sea level, but to a smaller degree. The IPCC observes that the largest contribution is the result of groundwater mining, such as the extraction of water from storage in aquifers in excess of the rate of natural recharge.127 Accelerated rates of deforestation and run-off as a result of urbanization are also positive contributors to global sea level rise.128 Including the recharge to water sources, it is estimated that these activities have contributed between –1.1 and 0.4 millimetres per year to global sea level rise in the 20th century.129 The IPCC reviewed estimates from a range of models and concluded that the estimated rate of sea level rise from anthropogenic climate change (thermal expansion, glaciers, ice caps and changes in ice sheets related to 20th century climate change) ranges from 0.3 to 0.8 millimetres per year, compared to a contribution from natural causes of –1.1 to +0.9 millimetres per year. The IPCC noted that the range for natural causes was less than the lower bound of observed sea level rise of 1 to 2 millimetres per year, suggesting that 20th century climate change has made a contribution to 20th century sea level rise.130 2.7 Conclusion There is no doubt that emissions of greenhouse gases from human activities have increased the abundance of greenhouse gases in the atmosphere. Scientists have examined the natural and human factors that could be causing climate change and have determined that the increase in greenhouse gases, particularly carbon dioxide, is the most important factor. Solar forcing may also have played a role, particularly in the first half of the 20th century, but it currently has a much smaller effect than greenhouse gases. Scientists also believe that human-caused climate change has contributed to sea level rise. There is increasing scientific consensus that the
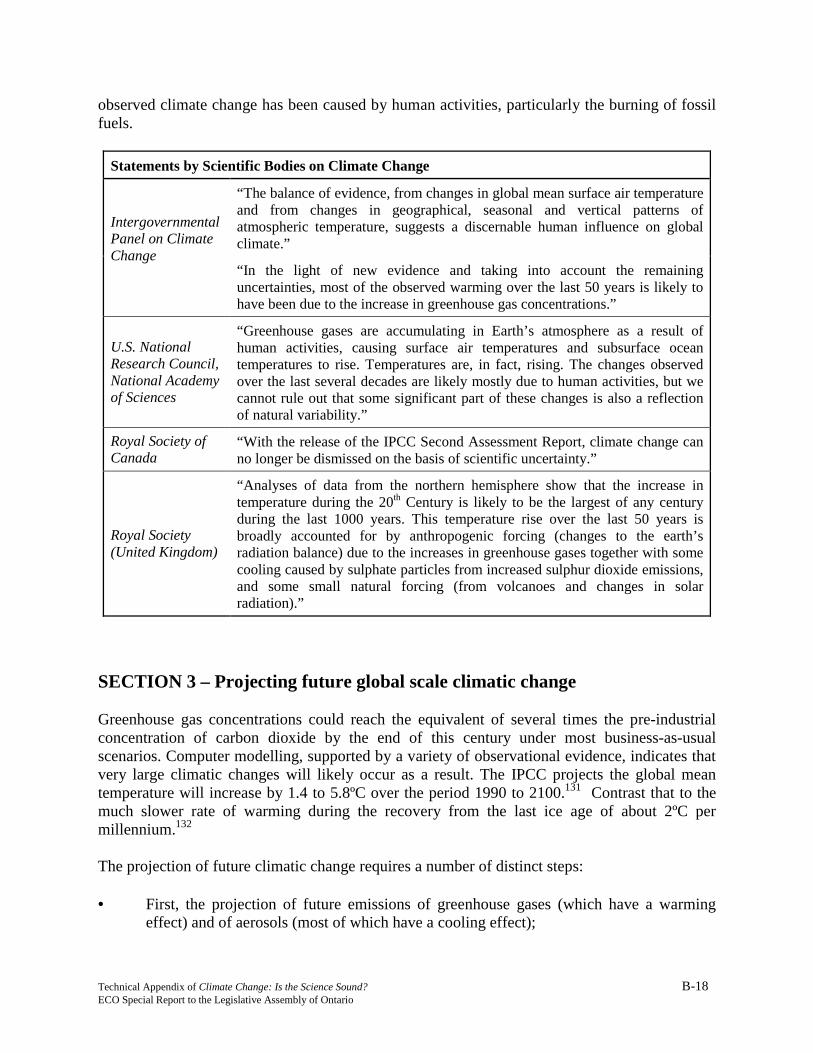
Technical Appendix of Climate Change: Is the Science Sound? B-18 ECO Special Report to the Legislative Assembly of Ontario
observed climate change has been caused by human activities, particularly the burning of fossil fuels.
Statements by Scientific Bodies on Climate Change
“The balance of evidence, from changes in global mean surface air temperature and from changes in geographical, seasonal and vertical patterns of atmospheric temperature, suggests a discernable human influence on global climate.”
Intergovernmental Panel on Climate Change “In the light of new evidence and taking into account the remaining
uncertainties, most of the observed warming over the last 50 years is likely to have been due to the increase in greenhouse gas concentrations.”
U.S. National Research Council, National Academy of Sciences
“Greenhouse gases are accumulating in Earth’s atmosphere as a result of human activities, causing surface air temperatures and subsurface ocean temperatures to rise. Temperatures are, in fact, rising. The changes observed over the last several decades are likely mostly due to human activities, but we cannot rule out that some significant part of these changes is also a reflection of natural variability.”
Royal Society of Canada
“With the release of the IPCC Second Assessment Report, climate change can no longer be dismissed on the basis of scientific uncertainty.”
Royal Society (United Kingdom)
“Analyses of data from the northern hemisphere show that the increase in temperature during the 20th Century is likely to be the largest of any century during the last 1000 years. This temperature rise over the last 50 years is broadly accounted for by anthropogenic forcing (changes to the earth’s radiation balance) due to the increases in greenhouse gases together with some cooling caused by sulphate particles from increased sulphur dioxide emissions, and some small natural forcing (from volcanoes and changes in solar radiation).”
SECTION 3 – Projecting future global scale climatic change Greenhouse gas concentrations could reach the equivalent of several times the pre-industrial concentration of carbon dioxide by the end of this century under most business-as-usual scenarios. Computer modelling, supported by a variety of observational evidence, indicates that very large climatic changes will likely occur as a result. The IPCC projects the global mean temperature will increase by 1.4 to 5.8ºC over the period 1990 to 2100.131 Contrast that to the much slower rate of warming during the recovery from the last ice age of about 2ºC per millennium.132 The projection of future climatic change requires a number of distinct steps: • First, the projection of future emissions of greenhouse gases (which have a warming
effect) and of aerosols (most of which have a cooling effect);
Technical Appendix of Climate Change: Is the Science Sound? B-19 ECO Special Report to the Legislative Assembly of Ontario
• Second, the projection of the buildup of carbon dioxide (and other greenhouse gases) in the atmosphere, resulting from a given emission scenario;
• Third, the calculation of the gradual warming of the climate in response to the increasing greenhouse gas concentrations; and
• Fourth, the calculation of any feedbacks between the changes in climate and the build-up of greenhouse gases themselves.
The ways in which these steps are performed and the evidence underlying projections of future climatic change are briefly described below. 3.1 Economic models to give scenarios of future emissions To project future emissions, one has to make a number of assumptions about the growth of the global economy, about the rates at which the efficiency with which energy is transformed and used will improve over time, about the relationship between income and energy demand and between price and energy demand, and about the availability and cost of different forms of energy. From this, the total use of energy in various forms, including as fossil fuels and as renewable energy, can be computed. Finally, emissions of a whole range of greenhouse gas emissions and of emissions of pollutants and precursors to aerosols are computed. Computer models are constructed to perform all of these steps in an internally consistent manner, but the output of the models is largely dependent on the chosen input assumptions. These models are nevertheless useful because they allow the analyst to explore the consequences of specific sets of alternative assumptions. They show, in large-scale macro-economic terms, what it would take to arrive at different alternative futures in terms of energy use and emissions of greenhouse gases and of pollutants. In advance of the preparation of its Third Assessment Report, the IPCC commissioned the development of a wide range of emission scenarios, that were published as the Special Report on Emission Scenarios.133 These scenarios are referred to as the SRES scenarios. The SRES scenarios are divided into four different “storylines”, where each storyline involves a set of interconnected assumptions concerning population, economic and social well being, trade, and overall concern about the environment. The storylines have been designated as A1, A2, B1, and B2, where the A storylines contain no explicit efforts to achieve greater international equity and social justice, the B storylines contain explicit efforts in this direction, the “1” storylines represent a fairly homogenous world (globalization, maximum trade, erosion of regional differences), and the “2” storylines represent a more heterogeneous world. Thus, for example, the B2 storyline represents a world with local solutions to problems of economic, environmental, and social sustainability; continuously increasing global population but at a slower rate than in A2; intermediate levels of economic development; and less rapid and more diverse technological change than in A1 or B1. The A1 storyline is further divided into storylines with a heavy reliance on fossil fuels (the A1F storyline), a storyline with a heavy reliance on advanced biomass energy systems (the A1T storyline) and a storyline with a mix of fossil fuel and biomass energy (the A1B storyline). However, none of the storylines include deliberate actions to reduce greenhouse gas emissions, so all are thought to be plausible “business-as-usual scenarios”.
Technical Appendix of Climate Change: Is the Science Sound? B-20 ECO Special Report to the Legislative Assembly of Ontario
Within each storyline, there is a wide range of future carbon dioxide emissions from energy use, as illustrated in Figure 6. Uncertainty about future greenhouse gas emissions is in itself a major source of uncertainty in future climatic change. However, this component of uncertainty is a reflection of the fact that future emissions are still largely a matter of choice, but we don’t know what future choices will be. A key conclusion from the SRES scenarios and related studies of the dynamics of technological change is that the future world energy system could evolve in two very different directions, either fossil fuel based or renewable-energy based, but that the further we move along one path or the other, the more difficult it will be to change paths. 3.2 Carbon cycle models to compute the build-up of atmospheric carbon dioxide Given a scenario of carbon dioxide emissions, the build-up of atmospheric carbon dioxide concentration can be computed with reasonable accuracy using a computer carbon cycle model. Carbon cycle models compute the absorption of a portion of the emitted carbon dioxide by the terrestrial biosphere (primarily by forests) and by the oceans. These are referred to as natural carbon sinks. Although we have an accurate knowledge of how much carbon dioxide is accumulating in the atmosphere each year (about 3.2 Gigatonnes (Gt) or billions of tonnes of C per year during the 1990s) and the annual fossil fuel emissions (about 6.3 Gt C/yr during the 1990s), the emissions due to deforestation and other changes in land cover are uncertain (1.6±1.0 Gt C/yr).134 A wide variety of methods indicates that the oceans are absorbing about 2.0 Gt C/yr at present, 135 which implies that land plants and soils are absorbing about 1-4 Gt C/yr. Since the difference between total emission and the observed atmospheric increase is being absorbed by the combination of the terrestrial biosphere and oceanic carbon sinks, the uncertainty in present land use emission implies an equal uncertainty concerning the magnitude of the total sink. As the atmospheric carbon dioxide concentration increases in response to continuing human emissions, it is widely expected that the absorption of carbon dioxide by the terrestrial biosphere will weaken, and may even became a net source of carbon dioxide to the atmosphere.136 This is a result of several factors, including the accumulation of soil carbon and litter which are recycled back to the atmosphere through respiration, a slowing in the rate of increase in photosynthesis as the carbon dioxide concentration continues to increase, and the disruptive effect of rapid climatic change on natural ecosystems. The oceanic sink will tend to grow more slowly than emissions, if emissions increase rapidly, for reasons that are tied to basic and well-understood features of ocean chemistry. 137 The combination of a weakening terrestrial carbon sink and a slowly growing ocean sink has the net effect that, if global emissions continue to grow exponentially, an increasing fraction of a growing annual emission will show up as an annual increase in atmospheric carbon dioxide concentration. This will exacerbate the build-up of atmospheric carbon dioxide. In spite of the uncertainties in the response of the terrestrial biosphere and (to a lesser extent) oceanic sinks, the effect of these uncertainties is much less than the uncertainty associated with different emission scenarios. Hence, the primary determinant of future carbon dioxide concentrations remains the choices that human societies make concerning future energy supply and use.
Technical Appendix of Climate Change: Is the Science Sound? B-21 ECO Special Report to the Legislative Assembly of Ontario
The build-up in the concentration of other greenhouse gases also needs to be simulated, but modelling other gases is a much more straightforward, and less uncertain, exercise than modelling the build-up of atmospheric carbon dioxide. These gases also trap heat, which is added to the heat trapped by carbon dioxide. The result is that we will have the climatic equivalent of a doubling in the concentration of carbon dioxide, for example, by as early as 2030,138 even though carbon dioxide itself will not have doubled (compared to the pre-industrial concentration of 280 ppmv) until around 2040-2050. 3.3 Climate models to compute the resulting change of climate Given a scenario for the build-up of carbon dioxide, other greenhouse gases, and aerosols, future climatic changes can be computed using a climate model. The single most important parameter in determining the climatic response to a given greenhouse build-up is the climate sensitivity. The climate sensitivity is the ratio of the globally averaged, equilibrium temperature change to the globally averaged radiative forcing. The term “equilibrium warming” refers to the warming once the climate has had a chance to fully adjust to a given, imposed change in the radiative balance (produced, for example, by a specified increase in greenhouse gas concentrations). It is common to refer to the globally averaged equilibrium warming for a doubling of atmospheric carbon dioxide concentration as the climate sensitivity. Once climate modellers have selected a scenario for the build-up of greenhouse gases and other factors that affect climate and have estimated the climate sensitivity and the delay in warming caused by the oceans, then it is a simple exercise to compute the variation in global average temperature over time.139 The greater the climate sensitivity, the greater the eventual warming that the climate is heading toward, and the greater and faster the warming along the way. Similarly, the greater the increase in radiative forcing, the faster and greater the climate warming. Conversely, the absorption of heat by the oceans slows down but does not prevent the eventual warming. The climate sensitivity can be estimated in three independent ways. The first is using complex, 3-dimensional models of the atmosphere and its coupling to the land surface, oceans, and snow and ice. These models – referred to as atmospheric general circulation models or AGCMs – attempt to compute the effect of the major climate feedbacks that, collectively, determine the climate sensitivity. The major feedbacks are (i) the increase in the amount of water vapour in the atmosphere as the climate warms (water vapour itself is a greenhouse gas, so its increase leads to further warming); (ii) the melting of ice and snow as the climate warms (this allows more solar radiation to be absorbed, leading to further warming concentrated at high latitudes); and (iii) changes in the properties of clouds. A critical feedback is the water vapour feedback, but, unfortunately, it is not possible to observe how strong this feedback is for long-term climatic change. However, individual processes involving water vapour and its variation in association with phenomena such as El Niño and the normal seasonal cycle can be observed, and current climate models compare well with observations in this respect. The major source of uncertainty in model calculations of the climate sensitivity involves clouds. Recent models simulate equilibrium climate sensitivities from about 2°C to 5°C.140
Technical Appendix of Climate Change: Is the Science Sound? B-22 ECO Special Report to the Legislative Assembly of Ontario
A second way to compute the climate sensitivity is to compare the global average warming over the past century, as simulated with simple climate models using a variety of different climate sensitivities, with the observed warming. Climate sensitivities which lead to a better fit to the observed warming are more likely than climate sensitivities which grossly underpredict or overpredict the observed warming. This requires taking into account all other factors that could have influenced temperature changes during the past century, including variations in the energy from the sun, volcanic eruptions, and the cooling effects of aerosols. Using this approach, one research team deduced that the true climate sensitivity is highly likely to fall somewhere between 1°C to 5°C, with a most likely value between 2°C and 3°C. 141 The third way to estimate the climate sensitivity is to estimate the global average temperature change and the global average radiative forcing for times in the past when the Earth’s climate was distinctly colder or warmer than at present. The climate sensitivity is simply given as the ratio of these two quantities. This approach has been applied using data from the Cretaceous Period (ending 65 million years ago), when the Earth’s climate was much warmer and the carbon dioxide concentration much higher than at present, and using data from the peak of the last ice age (18,000 years ago), when the Earth’s climate was much colder and the carbon dioxide concentration lower than at present. Interestingly, the deduced climate sensitivity is roughly the same using data from either the Cretaceous Period or the last ice age. If the climate sensitivity so-deduced is then multiplied by the radiative forcing for a carbon dioxide doubling, the result is a projected warming for a carbon dioxide doubling of about 1°C to 3°C.142 Thus, there are three independent methods for estimating the climate sensitivity, and they largely overlap. Given the overlapping evidence, the IPCC in its most recent assessment has not altered its previous estimate of a climate sensitivity of 1.5-4.5°C. Under most business-as-usual scenarios, greenhouse gas concentrations could reach the equivalent of several times the pre-industrial concentration by the end of this century. With a climate sensitivity range for a carbon dioxide doubling of 1.5-4.5°C, very large climatic changes will occur under such scenarios. 3.4 Climate-carbon cycle feedbacks As the climate warms in response to the increase in carbon dioxide concentration, the natural flows of carbon dioxide into and out of the atmosphere will be altered. That is, the natural carbon cycle itself will be altered. This in turn will alter the subsequent concentration of carbon dioxide in the atmosphere and subsequent climatic change, forming a climate-carbon cycle feedback. There are many possible climate-carbon cycle feedbacks, and most of them are positive feedbacks. That is, an initial warming changes the carbon cycle in such a way to cause a further increase in atmospheric carbon dioxide, which will cause yet further warming (i.e.: adding to the initial temperature change).143 3.5 Regional patterns and features of climatic change To make projections of future regional patterns of climate change, researchers use three-dimensional models – the AGCMs described in Section 3.3. There are many such complex models in use. The models agree with each other concerning the large-scale features of climatic change, and these large-scale features can be understood in terms of very simple and basic
Technical Appendix of Climate Change: Is the Science Sound? B-23 ECO Special Report to the Legislative Assembly of Ontario
principles. This lends confidence to the overall features of the simulated changes in climate. The features for which there is broad agreement and high confidence are as follows:144 • the warming will be greater at high latitudes than at low latitudes, due to the melting of
seasonal ice and snow; • the warming will tend be greater in winter than in summer over and adjacent to high
latitude oceans, due to the thinning of sea ice; • there will be an increasing tendency for the intensity of rainfall to increase (that is, more
rain will fall as intense downpours); and • there will be increased summer drying in the interiors of most mid-latitude continents,
with associated risk of drought.
Will the Carbon Dioxide Fertilization Effect Create a global Garden of Eden? It is well established from experiments with plants in greenhouses that higher carbon dioxide concentrations tend to have a direct beneficial effect on plant growth, by stimulating photosynthesis and improving the efficiency of water use. For a 100 per cent increase in carbon dioxide concentration, the rate of photosynthesis in greenhouse experiments typically increases by 40-70 per cent.145 It is claimed by some that, as a result, higher carbon dioxide will result in a more lush, biologically productive world – a veritable Garden of Eden. Since the natural global rate of photosynthesis on land is estimated to absorb about 60 billion tonnes of carbon per year, and since the atmospheric carbon dioxide concentration has already increased by 30 per cent, this would result in an extra absorption of 7-13 billion tonnes of carbon per year today. However, scientists caution that the results from greenhouse experiments cannot be simply extrapolated to natural conditions. Evidence in support of this comes from looking at the basic balance of carbon inputs and outputs to and from the atmosphere. Humans are presently emitting about 6.3 billion tonnes of carbon into the atmosphere every year from the burning of fossil fuels, and another 0.6-2.5 billion tonnes per year from land use changes, for a total emission of about 7-9 billion tonnes per year.146 The observed annual increase is about 3.2 billion tonnes per year, and the oceans could be absorbing 1.3-2.5 billion tonnes per year. The difference between fossil fuel and land use emission minus the annual increase in the atmosphere and what goes into the oceans must largely be going into land plants as a result of greater photosynthesis, the very effect expected from the high carbon dioxide concentration. The above information implies that land plants are absorbing about 1-4 billion tonnes of carbon per year. This is much smaller than the 7-13 billion tonnes per year stimulation that one would expect from a simple-minded extrapolation of experiments in greenhouses to the real world, and thus serves as direct evidence that the response of natural ecosystems to increasing carbon dioxide is nowhere near as favourable as obtained in ideal greenhouse settings. As explained in Section 3.2, scientists expect the current relatively small rate of absorption to get weaker over time.
Other features of the simulated climatic change, for which there is still considerable disagreement and uncertainty but which are of great importance to human societies and to natural ecosystems, include:
Technical Appendix of Climate Change: Is the Science Sound? B-24 ECO Special Report to the Legislative Assembly of Ontario
• changes in the intensity and frequency of the El Niño phenomenon; • changes in the intensity and frequency of tropical storms; and • a possible collapse in the North Atlantic Current, which brings warm water to western
Europe at present. 3.6 Are climate models reliable? It is sometimes claimed that climate models are too unreliable to form the basis for policy action on global warming, especially policies that require significant changes in our energy system. A variety of reasons are cited, including the supposed inability of climate models to simulate observed climatic change during the past century, disagreements over predictions of climatic change at the regional level, and the use – in some coupled atmosphere-ocean climate models – of a procedure called “flux adjustment”. The first point to keep in mind is that climate models form only one of several lines of evidence that forms the scientific basis of concern over greenhouse gas emissions. There are some very basic observations that in themselves provide a compelling case: There is a large natural greenhouse effect that keeps the climate about 33°C warmer on average than it would be otherwise. The concentrations of several of the gases that are key contributors to this large effect have increased dramatically during the past one or two centuries. On this basis alone, important effects on our climate are expected. Numerous observations indicate that these increases are a direct result of human emissions. The increase in carbon dioxide is, for all practical purposes, largely irreversible. The increase in global average temperature observed during the past century was rapid and unprecedented during the past 1000 years, and the increase in greenhouse gas concentrations is the only plausible explanation for this warming. The key parameter for climate modellers is the climate sensitivity, and here again, there is a combination of model results, observations, and inferences from past climates that serve to constrain the value of this parameter. Even an extreme lower bound for the climate sensitivity – a mere 1°C global average warming for a carbon dioxide doubling – combined with the prospects of greenhouse gas concentrations reaching the equivalent of 3-4 times the pre-industrial concentration by 2100, a global average warming of 2°C by the end of the century would occur. Although this in itself would have significant impacts, there is a risk of significantly larger climatic change. Climate modellers point out that the most basic features of the models can be understood in terms of basic, well-established principles. Thus, the most important points do not depend on the details of complex, difficult-to-understand computer models. Where the models disagree most concerns the details of specific changes in specific places. Some regions may indeed benefit from the initial stages of global warming, while others will lose. However, no one cannot state with high confidence who the initial winners and losers are. Thus, everyone is at risk. Furthermore, the greater the warming that is allowed to occur, the greater the risk, and the more widespread the negative impacts.
Technical Appendix of Climate Change: Is the Science Sound? B-25 ECO Special Report to the Legislative Assembly of Ontario
There is simply no substance to the claim that computer models cannot simulate the broad features of observed climatic change. Climate modellers point out that the models do very well in capturing the broad regional features of observed climatic change, including the observed minimal warming to slight cooling in the northwest Atlantic ocean and around parts of Antarctica. Some of the earlier coupled atmosphere-ocean climate models had a tendency, over several centuries of simulated climate, to drift toward completely unrealistic climatic states. To prevent this happening, adjustments were made in the regional flow of heat and moisture between the atmosphere and ocean (in such a way as to cancel out globally). This is because the simulated change in climate due to some perturbation such as increasing greenhouse gas concentrations depends strongly on the initial climate; an unrealistic initial climate would lead to erroneous changes in climate. This process is referred to as flux adjustment. Many of the models have now developed to the point where flux adjustment is not necessary. One of the critical issues in projecting future climatic change is the possibility of so-called ‘surprises’, such as an abrupt re-organization of the ocean circulation as critical thresholds are crossed. Flux adjustment is especially critical to the simulation of such phenomena, as it indicates errors in processes that in part determine where the thresholds lie, and it affects the extent to which the present climate is stable or unstable. However, the fact that scientists might not be able to accurately foresee abrupt changes in our climate does not imply that large climatic changes should be allowed to occur, since these large changes could trigger the abrupt shifts that scientists can’t precisely predict. 3.7 What are the key uncertainties? First and foremost is uncertainty147 concerning climate sensitivity. This could be as little as a 1°C global average warming for a carbon dioxide doubling to as much as 5°C. This is tied to uncertainty concerning the cooling effect of aerosols at present. If the cooling effect is relatively large (offsetting, say, half of the greenhouse heating in the global average), then the net heating effect is relatively small, and a 4-5°C climate sensitivity is permitted because, with the reduced net heating, the warming that is simulated during the past century by climate models is comparable to that observed. On the other hand, if the cooling effect of aerosols is small, then the net heating is large and the climate sensitivity must be near the low end of the 1-5°C range so as not to produce more warming during the past century than observed. Second, there are uncertainties concerning both temperature and precipitation changes in individual regions. In the interior of North America, summer warming ranges from as little as 2-3°C to in excess of 8°C. This is accompanied by precipitation increases in some parts of the continent, and precipitation decreases elsewhere, including in some of the areas subject to the greatest warming. Third, there are uncertainties concerning the impacts of projected climatic change. Models of the impacts of climatic change on forests, for example, contain a number of weaknesses that may cause them to overestimate the initial impacts, although the net result (once these possible errors are corrected) may simply be to delay an inevitable collapse. There is uncertainty
Technical Appendix of Climate Change: Is the Science Sound? B-26 ECO Special Report to the Legislative Assembly of Ontario
concerning how large a warming is required to provoke the irreversible melting of the Greenland ice sheet and the destabilization of the West Antarctic ice sheet; it could be as little as a 2°C global average warming or it could be more. There is uncertainty concerning the amount of warming at which massive dieback of the world’s coral reefs would occur; this could be at as little as 1°C warming. There is uncertainty concerning the extent to which adaptation can mitigate the adverse impacts of climatic change on agriculture, and concerning the benefits of carbon dioxide-fertilization. There is uncertainty concerning possible feedbacks between climate and the carbon cycle, whereby the initial warming promotes a significant release of carbon dioxide into the atmosphere through dieback of forests and respiration of soil carbon, leading to further warming and a further carbon dioxide flux into the atmosphere. This uncertainty is related to uncertainty concerning the present role of the terrestrial biosphere as a carbon sink and hence concerning how large the stimulatory effect of higher atmosphere carbon dioxide concentration on ecosystem productivity must be in order to match the observed rate of increase in atmospheric carbon dioxide. Although such positive feedback would not lead to a “runaway” greenhouse effect, it could nevertheless significantly increase the combined human plus natural carbon dioxide emissions for a century or more. Implications of Uncertainty None of the uncertainties override the fact that global carbon dioxide emissions will need to be strongly and rapidly restrained. Rather, they concern the extent of the damage to which we are already committed (as the climate “catches up” to the greenhouse gas build-up that has already occurred) and the further damage associated with various future concentration increases. Uncertainty is sometimes cited as a reason for delay in action to reduce greenhouse gas emissions. This is contrary to sound principles of risk management. Because uncertainty can work both ways, either making the problem less severe than the central estimate or making it more severe, proper consideration of the impact of uncertainty increases rather than decreases the rationale for preventative action. This is especially so when the impacts are irreversible. In other words, climate change needs attention, not in spite of the uncertainties, but because of the uncertainties.
Technical Appendix of Climate Change: Is the Science Sound? B-27 ECO Special Report to the Legislative Assembly of Ontario
Endnotes 1 Prentice I.C. et al. The Carbon Cycle and Atmospheric Carbon Dioxide. In: Houghton J.T. et al., editors. Climate Change 2001: The Scientific Basis. Contribution of Working Group I to the Third Assessment Report of the Intergovernmental Panel on Climate Change. Cambridge and New York: Cambridge University Press; 2001. p. 187. 2 Prentice I.C. et al. The Carbon Cycle and Atmospheric Carbon Dioxide. In: Houghton J.T. et al., editors. Climate Change 2001: The Scientific Basis. Contribution of Working Group I to the Third Assessment Report of the Intergovernmental Panel on Climate Change. Cambridge and New York: Cambridge University Press; 2001. p. 203. 3 Prather M et al. Atmospheric Chemistry and Greenhouse Gases. Climate Change 2001: The Scientific Basis. Contribution of Working Group I to the Third Assessment Report of the Intergovernmental Panel on Climate Change. Cambridge and New York: Cambridge University Press; 2001. p. 244. 4 Prather M et al. Atmospheric Chemistry and Greenhouse Gases. Climate Change 2001: The Scientific Basis. Contribution of Working Group I to the Third Assessment Report of the Intergovernmental Panel on Climate Change. Cambridge and New York: Cambridge University Press; 2001. p. 244. 5Prather M et al. Atmospheric Chemistry and Greenhouse Gases. Climate Change 2001: The Scientific Basis. Contribution of Working Group I to the Third Assessment Report of the Intergovernmental Panel on Climate Change. Cambridge and New York: Cambridge University Press; 2001. p. 261. 6 Levy II H et al. The global impact of human activity on tropospheric ozone. Geophysical Research Letters. 1997 April 1. 24(7): 791-794. 7 Prather M et al. Atmospheric Chemistry and Greenhouse Gases. Climate Change 2001: The Scientific Basis. Contribution of Working Group I to the Third Assessment Report of the Intergovernmental Panel on Climate Change. Cambridge and New York: Cambridge University Press; 2001. p. 241. 8 Folland C.K. et al. Observed Climate Variability and Change. In: Houghton J.T. et al, editors. Climate Change 2001: The Scientific Basis. Contributions of Working Group I to the Third Assessment Report of the Intergovernmental Panel on Climate Change. Cambridge, United Kingdom: Cambridge University Press; 2001. p.101 9 Albritton D.L. et al. Summary for Policymakers: A Report of Working Group I of the Intergovernmental Panel on Climate Change. Cambridge, United Kingdom: Cambridge University Press; 2001. p. 2 10 Committee on the Science of Climate Change; Division on Earth and Life Studies; National Research Council. Climate Change Science: An Analysis of Some Key Questions. National Academy Press; Washington, D.C.; 2001 11 Grossman D. Dissent in the Maelstrom; Maverick meteorologist Richard S. Lindzen keeps right on arguing that human-induced global warming isn’t a problem. Scientific American [online]; 2001 Nov. 16; Available from: URL: http://www.sciam.com/print_version.cfm?article ID=00095B0D-C331-1C6E-84A9809EC5 12 Singer S.F. Human Contribution to Climate Change Remains Questionable. EOS, Transactions, American Geophysical Society 1999 April 20;Vol. 80:183-187. 13 Lomborg B. The Skeptical Environmentalist Replies. Scientific American 2002 May; 14-15 14 Panel on Reconciling Temperature Observations; Climate Research Committee; Board on Atmospheric Sciences and Climate; Commission on Geosciences, Environment and Resources; National Research Council. Reconciling Observations of Global Temperature Change. Washington, D.C. National Academy Press 2000. p.9
Technical Appendix of Climate Change: Is the Science Sound? B-28 ECO Special Report to the Legislative Assembly of Ontario
15 Peterson T.C. and Vose R.S. An Overview of the Global Historical Climatology Network Temperature Database. Bulletin of the American Meteorological Society 1997; 78, 2837-2849 16 Peterson T.C. and Vose R.S. An Overview of the Global Historical Climatology Network Temperature Database. Bulletin of the American Meteorological Society 1997; 78, 2837-2849 17 Peterson T.C. and Vose RS. An Overview of the Global Historical Climatology Network Temperature Database. Bulletin of the American Meteorological Society 1997; 78, 2837-2849 18 Folland C.K. et al. Observed Climate Variability and Change. In: Houghton J.T. et al, editors. Climate Change 2001: The Scientific Basis. Contributions of Working Group I to the Third Assessment Report of the Intergovernmental Panel on Climate Change. Cambridge, United Kingdom: Cambridge University Press; 2001. p.112 19 Panel on Reconciling Temperature Observations; Climate Research Committee; Board on Atmospheric Sciences and Climate; Commission on Geosciences, Environment and Resources; National Research Council. Reconciling Observations of Global Temperature Change. Washington, D.C. National Academy Press 2000. p.32 20 Folland C.K. et al. Observed Climate Variability and Change. In: Houghton J.T. et al, editors. Climate Change 2001: The Scientific Basis. Contributions of Working Group I to the Third Assessment Report of the Intergovernmental Panel on Climate Change. Cambridge, United Kingdom: Cambridge University Press; 2001. p.101 21 Gray V. The Greenhouse Delusion: A Critique of Climate Change 2001. Multi-Science Publishing Co. 2001 Available from: URL:http://www.multi-science.co.uk 22 Panel on Reconciling Temperature Observations; Climate Research Committee; Board on Atmospheric Sciences and Climate; Commission on Geosciences, Environment and Resources; National Research Council. Reconciling Observations of Global Temperature Change. Washington, D.C. National Academy Press 2000. p.37. 23 Gray V. The Cause of Global Warming. Frontier Centre for Public Policy; Policy Series #7; 2001 Jan. ISSN 1491-7874 24 Houghton J.T. et al., editors. Climate Change 1992: The Supplementary Report to the IPCC Scientific Assessment, Cambridge University Press, Cambridge, UK. 1992. 198 pp. 25 Folland C.K. et al. Observed Climate Variability and Change. In: Houghton J.T. et al, editors. Climate Change 2001: The Scientific Basis. Contributions of Working Group I to the Third Assessment Report of the Intergovernmental Panel on Climate Change. Cambridge, United Kingdom: Cambridge University Press; 2001. p. 105-106 26 Mann M.E. and Bradley R.S. Northern Hemisphere Temperatures During the Past Millenium: Inferences, Uncertainties, and Limitations. Geophysical Research Letters 1999 March 15 Vol. 26, No. 6. pp759-762 27 Mann M.E. et al. Global-scale temperature patterns and climate forcing over the past six centuries. Nature 1998 April Vol. 392 pp. 779-787 28 Folland C.K. et al. Observed Climate Variability and Change. In: Houghton J.T. et al, editors. Climate Change 2001: The Scientific Basis. Contributions of Working Group I to the Third Assessment Report of the Intergovernmental Panel on Climate Change. Cambridge, United Kingdom: Cambridge University Press; 2001. p. 105-106 29 Mann M.E. Climate during the past millennium. Weather 2001 March Vol. 56 pp. 91-101
Technical Appendix of Climate Change: Is the Science Sound? B-29 ECO Special Report to the Legislative Assembly of Ontario
30 Harvey L.D.D. Global Warming: The Hard Science. Harlow: Prentice Hall; 2000. p.208. See also Hegerl GC and Wallace JM. Influence of Patterns of Climate Variability on the Difference between Satellite and Surface Temperature Trends. Journal of Climate 2002; Vol. 15, No. 17 Abstract. See also Singer SF. Human Contribution to Climate Change Remains Questionable. EOS, Transactions, American Geophysical Society 1999 April 20Vol. 80, 183-187. 31 Christy J.A. et al. Observed Climate Variability and Change. In: Houghton J.T. et al, editors. Climate Change 2001: The Scientific Basis. Contributions of Working Group I to the Third Assessment Report of the Intergovernmental Panel on Climate Change. Cambridge, United Kingdom: Cambridge University Press; 2001. p.102, p. 133 32 Panel on Reconciling Temperature Observations; Climate Research Committee; Board on Atmospheric Sciences and Climate; Commission on Geosciences, Environment and Resources; National Research Council. Reconciling Observations of Global Temperature Change. Washington, D.C. National Academy Press 2000. p.2 33 Panel on Reconciling Temperature Observations; Climate Research Committee; Board on Atmospheric Sciences and Climate; Commission on Geosciences, Environment and Resources; National Research Council. Reconciling Observations of Global Temperature Change. Washington, D.C. National Academy Press 2000. p.10 34 Panel on Reconciling Temperature Observations; Climate Research Committee; Board on Atmospheric Sciences and Climate; Commission on Geosciences, Environment and Resources; National Research Council. Reconciling Observations of Global Temperature Change. Washington, D.C. National Academy Press 2000. p.2 35 Committee on the Science of Climate Change; Division on Earth and Life Studies; National Research Council. Climate Change Science: An Analysis of Some Key Questions. National Academy Press; Washington, D.C.; 2001. See also Mahlman JD. Global Warming: Misuse of Data and Ignorance of Science; A review of the “global warming chapter of Bjorn Lomborg’s The Skeptical Environmentalist: Measuring the Real State of the World. Union of Concerned Scientists Dec. 6, 2001. 36 Harvey L.D.D. Global Warming: The Hard Science. Harlow: Prentice Hall; 2000. p.74, p. 284, p. 288-89 37 Mann M.E. Climate during the past millennium. Weather 2001 March Vol. 56 p. 95 38 Lomborg B. The Skeptical Environmentalist: Measuring the Real State of the World. Cambridge University Press; 2001. p.262 39 Folland C.K. et al. Observed Climate Variability and Change. In: Houghton J.T. et al, editors. Climate Change 2001: The Scientific Basis. Contributions of Working Group I to the Third Assessment Report of the Intergovernmental Panel on Climate Change. Cambridge, United Kingdom: Cambridge University Press; 2001. p.133 40 Church J. A. et al. Changes in Sea Level. In: J. T. Houghton et al., editors. Climate Change 2001: The Scientific Basis. Contribution of Working Group I to the Third Assessment Report of the Intergovernmental Panel on Climate Change. Cambridge, United Kingdom: Cambridge University Press; 2001. p. 647. 41 Kuhn M. et al. Measurements and models of the mass balance of Hintereisferner. Geographic Annaler 1999; 81A:659-670. 42 Qin D. et al. Evidence for recent climate change from ice cores in the central Himalaya. Annals of Glaciology 2000; 31:153-158. Rott, H. et al. Mass fluxes and dynamics of Moreno Glacier, Southern Patagonian Icefield. Geographic Research Letters 1998; 25:1407-1410. See also Kaser, G. A review of modern fluctuations of tropical glaciers. Global and Planetary Change 1999; 22:93-104.
Technical Appendix of Climate Change: Is the Science Sound? B-30 ECO Special Report to the Legislative Assembly of Ontario
43 Church J. A. et al. Changes in Sea Level. In: J. T. Houghton et al., editors. Climate Change 2001: The Scientific Basis. Contribution of Working Group I to the Third Assessment Report of the Intergovernmental Panel on Climate Change. Cambridge, United Kingdom: Cambridge University Press; 2001. p. 648. 44 Christy J. R. et al. Observed Climate Variability and Change. In: J. T. Houghton et al., editors. Climate Change 2001: The Scientific Basis. Contribution of Working Group I to the Third Assessment Report of the Intergovernmental Panel on Climate Change. Cambridge, United Kingdom: Cambridge University Press; 2001. p. 129. 45 Lamont G. N. et al. Slopes of glacier ELAs in the Southern Alps of New Zealand in relation to atmospheric circulation patterns. Global and Planetary Change; 22:209-219. See also Tvede A. M. and T. Laumann. Glacial variations on a meso-scale example from glaciers in the Aurland Mountains, southern Norway. Annals of Glaciology; 24:130-134. See also Folland C.K. et al. Observed Climate Variability and Change. In: Houghton J.T. et al, editors. Climate Change 2001: The Scientific Basis. Contributions of Working Group I to the Third Assessment Report of the Intergovernmental Panel on Climate Change. Cambridge, United Kingdom: Cambridge University Press; 2001. p.129 and 153. 46 Folland C.K. et al. Observed Climate Variability and Change. In: Houghton J.T. et al, editors. Climate Change 2001: The Scientific Basis. Contributions of Working Group I to the Third Assessment Report of the Intergovernmental Panel on Climate Change. Cambridge, United Kingdom: Cambridge University Press; 2001. p.123. 47 Folland C.K. et al. Observed Climate Variability and Change. In: Houghton J.T. et al, editors. Climate Change 2001: The Scientific Basis. Contributions of Working Group I to the Third Assessment Report of the Intergovernmental Panel on Climate Change. Cambridge, United Kingdom: Cambridge University Press; 2001. p.124. 48 Magnuson J. J. et al. Historical trends in lake and river ice cover in the Northern Hemisphere. Science 2000; 1743-1746. 49 Stocker T. F. et al. Physical Climate Processes and Feedbacks. In: J. T. Houghton et al., editors. Climate Change 2001: The Scientific Basis. Contribution of Working Group I to the Third Assessment Report of the Intergovernmental Panel on Climate Change. Cambridge, United Kingdom: Cambridge University Press; 2001. p. 446 50 Folland C.K. et al. Observed Climate Variability and Change. In: Houghton J.T. et al, editors. Climate Change 2001: The Scientific Basis. Contributions of Working Group I to the Third Assessment Report of the Intergovernmental Panel on Climate Change. Cambridge, United Kingdom: Cambridge University Press; 2001. p.127. 51 Myeni R. B. et al. Increased plant growth in the northern high latitudes from 1981-1991. Nature. 1997; 386:698-702. 52 Ecosystems and Their Goods and Services. In McCarthy J.J. et al., editors. Climate Change 2001: Impacts, Adaptation and Vulnerability. Contribution of Working Group II to the Third Assessment Report of the Intergovernmental Panel on Climate Change. Cambridge, United Kingdom: Cambridge University Press; 2001. Section 5.2.1. 53 Church J. A. et al. Changes in Sea Level. In: J. T. Houghton et al., editors. Climate Change 2001: The Scientific Basis. Contribution of Working Group I to the Third Assessment Report of the Intergovernmental Panel on Climate Change. Cambridge, United Kingdom: Cambridge University Press; 2001. p. 643. 54 Fleming K. et al. Refining the eustatic sea level curve since the Last Glacial Maximum using far- and intermediate-field sites. Earth Planetary Science Letters 1999; 163:327-342.
Technical Appendix of Climate Change: Is the Science Sound? B-31 ECO Special Report to the Legislative Assembly of Ontario
55 Lambeck K. and Bard E. Sea level change along the French Mediterranean coast since the time of the Last Glacial Maximum. Earth Planetary Science Letters 2000; 175:203-222. 56 Church J. A. et al. Changes in Sea Level. In: J. T. Houghton et al., editors. Climate Change 2001: The Scientific Basis. Contribution of Working Group I to the Third Assessment Report of the Intergovernmental Panel on Climate Change. Cambridge, United Kingdom: Cambridge University Press; 2001. p. 663. 57 Church J. A. et al. Changes in Sea Level. In: J. T. Houghton et al., editors. Climate Change 2001: The Scientific Basis. Contribution of Working Group I to the Third Assessment Report of the Intergovernmental Panel on Climate Change. Cambridge, United Kingdom: Cambridge University Press; 2001. p. 663. 58 Cazene A. et al. Global mean sea level changes observed by Topex-Posedin and ERS-1. Physical Chemical Earth; 23:1069-1075. See also Nerem R. S. et al. Improved determination of global mean sea level variations using TOPEX/POSEDIN altimeter data. Geophysical Research Letters; 24:1331-1334. See also Nerm, R. S. Measuring very low frequency sea level variations using satellite altimeter data. Global and Planetary Change;20:157-171. 59 Church J. A. et al. Changes in Sea Level. In: J. T. Houghton et al., editors. Climate Change 2001: The Scientific Basis. Contribution of Working Group I to the Third Assessment Report of the Intergovernmental Panel on Climate Change. Cambridge, United Kingdom: Cambridge University Press; 2001. p. 664. 60 Elkman M. The world’s longest continued series of sea level rise. Global and Planetary Change 1999; 21:215-244. See also Woodworth, P. L. High waters at Liverpool since 1768: the UK’s longest sea level record. Geophysical Research Letters 1999; 26:1589-1592. See also Kearney, M. S. Sea level change during the last thousand years in Chesapeake Bay. Journal of Coastal Research 1996; 12:977-983. See also Maul, G. A. and D. M. Martin. Sea level rise at Key West, Florida, 1846-1992: America’s longest instrument record? Geophysical Research Letters 1993; 20:1955-1958. 61 Folland C.K. et al. Observed Climate Variability and Change. In: Houghton J.T. et al, editors. Climate Change 2001: The Scientific Basis. Contributions of Working Group I to the Third Assessment Report of the Intergovernmental Panel on Climate Change. Cambridge, United Kingdom: Cambridge University Press; 2001. p.164. 62 Prentice I.C. et al. The Carbon Cycle and Atmospheric Carbon Dioxide. In: Houghton J.T. et al., editors. Climate Change 2001: The Scientific Basis. Contribution of Working Group I to the Third Assessment Report of the Intergovernmental Panel on Climate Change. Cambridge and New York: Cambridge University Press; 2001. p. 187, 204. 63 Committee on the Science of Climate Change, Division on Earth and Life Studies, National Research Council. Climate Change Science: An analysis of some key questions. 2001. Washington D.C.: National Academy Press; 2001. p. 2. 64 Prentice I.C. et al. The Carbon Cycle and Atmospheric Carbon Dioxide. In: Houghton J.T. et al., editors. Climate Change 2001: The Scientific Basis. Contribution of Working Group I to the Third Assessment Report of the Intergovernmental Panel on Climate Change. Cambridge and New York: Cambridge University Press; 2001. p. 187. 65 Prentice I.C. et al. The Carbon Cycle and Atmospheric Carbon Dioxide. In: Houghton J.T. et al., editors. Climate Change 2001: The Scientific Basis. Contribution of Working Group I to the Third Assessment Report of the Intergovernmental Panel on Climate Change. Cambridge and New York: Cambridge University Press; 2001. p. 187. See also Committee on the Science of Climate Change, Division on Earth and Life Studies, National Research Council. Climate Change Science: An analysis of some key questions. 2001. Washington D.C.: National Academy Press; 2001. p. 10.
Technical Appendix of Climate Change: Is the Science Sound? B-32 ECO Special Report to the Legislative Assembly of Ontario
66 Prentice I.C. et al. The Carbon Cycle and Atmospheric Carbon Dioxide. In: Houghton J.T. et al., editors. Climate Change 2001: The Scientific Basis. Contribution of Working Group I to the Third Assessment Report of the Intergovernmental Panel on Climate Change. Cambridge and New York: Cambridge University Press; 2001. p. 187. 67 Prather M. et al. Atmospheric Chemistry and Greenhouse Gases. In: Houghton J.T. et al., editors. Climate Change 2001: The Scientific Basis. Contribution of Working Group I to the Third Assessment Report of the Intergovernmental Panel on Climate Change. Cambridge and New York: Cambridge University Press; 2001. p. 244. 68 Prather M. et al. Atmospheric Chemistry and Greenhouse Gases. In: Houghton J.T. et al., editors. Climate Change 2001: The Scientific Basis. Contribution of Working Group I to the Third Assessment Report of the Intergovernmental Panel on Climate Change. Cambridge and New York: Cambridge University Press; 2001. p. 243. 69 Prentice I.C. et al, editors. The Carbon Cycle and Atmospheric Carbon Dioxide. In: Houghton J.T. et al., editors. Climate Change 2001: The Scientific Basis. Contribution of Working Group I to the Third Assessment Report of the Intergovernmental Panel on Climate Change. Cambridge and New York: Cambridge University Press; 2001. p. 204. 70 Prather M. et al. Atmospheric Chemistry and Greenhouse Gases. In: Houghton J.T. et al., editors. Climate Change 2001: The Scientific Basis. Contribution of Working Group I to the Third Assessment Report of the Intergovernmental Panel on Climate Change. Cambridge and New York: Cambridge University Press; 2001. p. 246. 71 Ramaswamy V. et al. Radiative Forcing of Climate Change. In: Houghton J.T. et al., editors. Climate Change 2001: The Scientific Basis. Contribution of Working Group I to the Third Assessment Report of the Intergovernmental Panel on Climate Change. Cambridge and New York: Cambridge University Press; 2001. p. 392. figure 6.6 72 Ramaswamy V. et al. Radiative Forcing of Climate Change. In: Houghton J.T. et al., editors. Climate Change 2001: The Scientific Basis. Contribution of Working Group I to the Third Assessment Report of the Intergovernmental Panel on Climate Change. Cambridge and New York: Cambridge University Press; 2001. p. 358. 73 Ramaswamy V. et al. Radiative Forcing of Climate Change. In: Houghton J.T. et al., editors. Climate Change 2001: The Scientific Basis. Contribution of Working Group I to the Third Assessment Report of the Intergovernmental Panel on Climate Change. Cambridge and New York: Cambridge University Press; 2001. p. 358. 74 Ramaswamy V. et al. Radiative Forcing of Climate Change. In: Houghton J.T. et al., editors. Climate Change 2001: The Scientific Basis. Contribution of Working Group I to the Third Assessment Report of the Intergovernmental Panel on Climate Change. Cambridge and New York: Cambridge University Press; 2001. p. 358. 75 Ramaswamy V. et al. Radiative Forcing of Climate Change. In: Houghton J.T. et al., editors. Climate Change 2001: The Scientific Basis. Contribution of Working Group I to the Third Assessment Report of the Intergovernmental Panel on Climate Change. Cambridge and New York: Cambridge University Press; 2001. p. 393. 76 Ramaswamy V. et al. Radiative Forcing of Climate Change. In: Houghton J.T. et al., editors. Climate Change 2001: The Scientific Basis. Contribution of Working Group I to the Third Assessment Report of the Intergovernmental Panel on Climate Change. Cambridge and New York: Cambridge University Press; 2001. p. 352.
Technical Appendix of Climate Change: Is the Science Sound? B-33 ECO Special Report to the Legislative Assembly of Ontario
77 Ramaswamy V. et al. Radiative Forcing of Climate Change. In: Houghton J.T. et al., editors. Climate Change 2001: The Scientific Basis. Contribution of Working Group I to the Third Assessment Report of the Intergovernmental Panel on Climate Change. Cambridge and New York: Cambridge University Press; 2001. p. 358. 78 Ramaswamy V. et al. Radiative Forcing of Climate Change. In: Houghton J.T. et al., editors. Climate Change 2001: The Scientific Basis. Contribution of Working Group I to the Third Assessment Report of the Intergovernmental Panel on Climate Change. Cambridge and New York: Cambridge University Press; 2001. p. 394. 79 Mitchell J.F.B. et al. Detection of Climate Change and Attribution of Causes. In: Houghton J.T. et al, editors. Climate Change 2001: The Scientific Basis. Contributions of Working Group I to the Third Assessment Report of the Intergovernmental Panel on Climate Change. Cambridge, United Kingdom: Cambridge University Press; 2001. p.698-699 80 Mitchell J.F.B. et al. Detection of Climate Change and Attribution of Causes. In: Houghton J.T. et al, editors. Climate Change 2001: The Scientific Basis. Contributions of Working Group I to the Third Assessment Report of the Intergovernmental Panel on Climate Change. Cambridge, United Kingdom: Cambridge University Press; 2001. p.699 81 Committee on the Science of Climate Change; Division on Earth and Life Studies; National Research Council. Climate Change Science: An Analysis of Some Key Questions. National Academy Press; Washington, D.C.; 2001 p. 3 82 Committee on the Science of Climate Change; Division on Earth and Life Studies; National Research Council. Climate Change Science: An Analysis of Some Key Questions. National Academy Press; Washington, D.C.; 2001 p.17 83 Mitchell J.F.B. et al. Detection of Climate Change and Attribution of Causes. In: Houghton J.T. et al, editors. Climate Change 2001: The Scientific Basis. Contributions of Working Group I to the Third Assessment Report of the Intergovernmental Panel on Climate Change. Cambridge, United Kingdom: Cambridge University Press; 2001. p.710; Figure 12.7 84 Willson R.C.. Total solar irradiance trend during solar cycles 21 and 22. Science. 1997 September 26;277:1963-1965. 85 Svensmark H. and Friis-Christensen E. Variation of cosmic ray flux and global cloud coverage – a missing link in solar-climate relationships. Journal of Atmospheric and Solar-Terrestrial Physics 1997;59(11):1225. 86 Ramaswamy V. et al. Radiative Forcing of Climate Change. In: Houghton J.T. et al., editors. Climate Change 2001: The Scientific Basis. Contribution of Working Group I to the Third Assessment Report of the Intergovernmental Panel on Climate Change. Cambridge and New York: Cambridge University Press; 2001. p. 393. 87 Albritton D.L. et al. Summary for Policymakers: A Report of Working Group I of the Intergovernmental Panel on Climate Change. Cambridge, United Kingdom: Cambridge University Press; 2001, p. 9. 88 Lassen K. and Friis-Christensen E. Variability of the solar cycle length during the past five centuries and the apparent association with terrestrial climate. Journal of Atmospheric and Terrestrial Physics. 1995; 57: 835-845. 89 Laut P. and Gundermann J. Solar cycle length hypothesis appears to support the IPCC on global warming. Journal of Atmospheric and Terrestrial Physics. 1998; 60:1719-1728. 90 Lomborg B. The Skeptical Environmentalist: Measuring the Real State of the World. Cambridge University Press; 2001. p 278.
Technical Appendix of Climate Change: Is the Science Sound? B-34 ECO Special Report to the Legislative Assembly of Ontario
91 Laut P. and Gundermann P. Solar cycle length hypothesis appears to support the IPCC assumptions on global warming: earlier analyses are shown to be misleading and to contain serious errors. Background for and commentary on new scientific article by Peter Laut and Jesper Gunderman. Available from: URL: http://www.dea-ccat.dk/sun/JASTP2.htm 92 Svensmark H. and Friis-Christensen E. Variation of cosmic ray flux and global cloud coverage – a missing link in solar-climate relationships. Journal of Atmospheric and Solar-Terrestrial Physics 1997;59(11):1229. 93 Ramaswamy V. et al. Radiative Forcing of Climate Change. In: Houghton J.T. et al., editors. Climate Change 2001: The Scientific Basis. Contribution of Working Group I to the Third Assessment Report of the Intergovernmental Panel on Climate Change. Cambridge and New York: Cambridge University Press; 2001. p. 385. 94Committee on the Science of Climate Change, Division on Earth and Life Studies, National Research Council. Climate Change Science: An analysis of some key questions. 2001. Washington D.C.: National Academy Press; 2001. p. 14. 95 Levitus S. et al. Warming of the world ocean. Science 2000 March 24; 287:2225-2229. 96 Kvenvolden KA. Potential effects of gas hydrate on human welfare. Proceedings of the National Academy of Sciences, USA. 1999 March; 96:3420-3426. 97 Prather M. et al. Atmospheric Chemistry and Greenhouse Gases. In: Houghton J.T. et al., editors. Climate Change 2001: The Scientific Basis. Contribution of Working Group I to the Third Assessment Report of the Intergovernmental Panel on Climate Change. Cambridge and New York: Cambridge University Press; 2001. p. 250. 98 Prather M. et al. Atmospheric Chemistry and Greenhouse Gases. Climate Change 2001: The Scientific Basis. Contribution of Working Group I to the Third Assessment Report of the Intergovernmental Panel on Climate Change. Cambridge and New York: Cambridge University Press; 2001. p. 250. 99 Folland C.K. et al. Observed Climate Variability and Change. In: Houghton J.T. et al, editors. Climate Change 2001: The Scientific Basis. Contributions of Working Group I to the Third Assessment Report of the Intergovernmental Panel on Climate Change. Cambridge, United Kingdom: Cambridge University Press; 2001. p.101. 100 Singer S.F.. Human Contribution to Climate Change Remains Questionable. EOS, Transactions, American Geophysical Society 1999 April 20Vol. 80, 183-187. 101 Committee on the Science of Climate Change; Division on Earth and Life Studies; National Research Council. Climate Change Science: An Analysis of Some Key Questions. National Academy Press; Washington, D.C.; 2001 p.16 102 Singer S.F.. Human Contribution to Climate Change Remains Questionable. EOS, Transactions, American Geophysical Society 1999 April 20Vol. 80, 183-187. 103 Mitchell J.F.B. et al. Detection of Climate Change and Attribution of Causes. In: Houghton J.T. et al, editors. Climate Change 2001: The Scientific Basis. Contributions of Working Group I to the Third Assessment Report of the Intergovernmental Panel on Climate Change. Cambridge, United Kingdom: Cambridge University Press; 2001. p. 699 104 Committee on the Science of Climate Change; Division on Earth and Life Studies; National Research Council. Climate Change Science: An Analysis of Some Key Questions. National Academy Press; Washington, D.C.; 2001 p.17
Technical Appendix of Climate Change: Is the Science Sound? B-35 ECO Special Report to the Legislative Assembly of Ontario
105 Berner R.A. The rise of plants and their effect on weathering and atmospheric CO2. Science 1997 April 25; 276:544-546. 106 Prentice I.C. et al. The Carbon Cycle and Atmospheric Carbon Dioxide. In: Houghton J.T. et al., editors. Climate Change 2001: The Scientific Basis. Contribution of Working Group I to the Third Assessment Report of the Intergovernmental Panel on Climate Change. Cambridge and New York: Cambridge University Press; 2001. p. 202. 107 Fischer H. et al. Ice core records of atmospheric CO2 around the last three glacial terminations. Science 1999 March 12;1712-1714. 108 Petit J.R. et al. Climate and atmospheric history of the past 420,000 years from the Vostok Ice Core, Antarctica. Nature 1999;399: 429-436. 109 Folland C.K. et al. Observed Climate Variability and Change. In: Houghton J.T. et al, editors. Climate Change 2001: The Scientific Basis. Contributions of Working Group I to the Third Assessment Report of the Intergovernmental Panel on Climate Change. Cambridge, United Kingdom: Cambridge University Press; 2001. p. 137. 110 Veizer J. et al. Evidence for decoupling of atmospheric CO2 and global climate during the Phanerozoic eon. Nature 2000 December 7; 408:698-701. 111 Pearson P.N. et al. Warm tropical sea surface temperatures in the Late Cretaceous and Eocene epochs. Nature 2001 October 4; 413: 481-486. 112 Church J. A. et al. Changes in Sea Level. In: J. T. Houghton et al., editors. Climate Change 2001: The Scientific Basis. Contribution of Working Group I to the Third Assessment Report of the Intergovernmental Panel on Climate Change. Cambridge, United Kingdom: Cambridge University Press; 2001. p. 641. 113 Church J. A. et al. Changes in Sea Level. In: J. T. Houghton et al., editors. Climate Change 2001: The Scientific Basis. Contribution of Working Group I to the Third Assessment Report of the Intergovernmental Panel on Climate Change. Cambridge, United Kingdom: Cambridge University Press; 2001. p. 643. 114 Church J. A. et al. Changes in Sea Level. In: J. T. Houghton et al., editors. Climate Change 2001: The Scientific Basis. Contribution of Working Group I to the Third Assessment Report of the Intergovernmental Panel on Climate Change. Cambridge, United Kingdom: Cambridge University Press; 2001. p. 641. 115 Church J. A. et al. Changes in Sea Level. In: J. T. Houghton et al., editors. Climate Change 2001: The Scientific Basis. Contribution of Working Group I to the Third Assessment Report of the Intergovernmental Panel on Climate Change. Cambridge, United Kingdom: Cambridge University Press; 2001. p. 649. 116 Church J. A. et al. Changes in Sea Level. In: J. T. Houghton et al., editors. Climate Change 2001: The Scientific Basis. Contribution of Working Group I to the Third Assessment Report of the Intergovernmental Panel on Climate Change. Cambridge, United Kingdom: Cambridge University Press; 2001. p. 650. 117 Church J. A. et al. Changes in Sea Level. In: J. T. Houghton et al., editors. Climate Change 2001: The Scientific Basis. Contribution of Working Group I to the Third Assessment Report of the Intergovernmental Panel on Climate Change. Cambridge, United Kingdom: Cambridge University Press; 2001. p. 653. 118 Kabril W. et al. Rapid thinning of parts of the southern Greenland Ice Sheet. Science 1999; 289:428-430. See also Davis, C. H. et al. Elevation change of the southern Greenland Ice Sheet. Science 1998; 279:2086-2088.
Technical Appendix of Climate Change: Is the Science Sound? B-36 ECO Special Report to the Legislative Assembly of Ontario
119 Doake C. S. M. et al. Breakup and conditions for stability of the northern Larsen Ice Shelf, Antarctica. Nature 1998; 391:778-780. 120 Whillans I. M. and Bindschadler R. A.. Mass balance of ice stream B, West Antarctica. Annals of Glaciology 1988; 11:187-193. . See also Hamilton G. S. et al First point measurements of ice-sheet thickness change in Antarctica. Annals of Glaciology 1998; 27:125-129. See also Rignot E. J. Fast recession of a West Antarctic glacier. Science 1998; 281:549-551. 121 Bentley C. R. and Wahr J. Satellite gravimetry and the mass balance of the Antarctic ice sheet. Journal of Glaciology 1998; 44:207-213. See also Oppenheimer M. Global warming and the stability of the West Antarctic ice sheet. Nature 1998; 393:325-331. 122 Church J. A. et al. Changes in Sea Level. In: J. T. Houghton et al., editors. Climate Change 2001: The Scientific Basis. Contribution of Working Group I to the Third Assessment Report of the Intergovernmental Panel on Climate Change. Cambridge, United Kingdom: Cambridge University Press; 2001. p. 679. 123 Church J. A. et al. Changes in Sea Level. In: J. T. Houghton et al., editors. Climate Change 2001: The Scientific Basis. Contribution of Working Group I to the Third Assessment Report of the Intergovernmental Panel on Climate Change. Cambridge, United Kingdom: Cambridge University Press; 2001. p. 653. 124 Church J. A. et al. Changes in Sea Level. In: J. T. Houghton et al., editors. Climate Change 2001: The Scientific Basis. Contribution of Working Group I to the Third Assessment Report of the Intergovernmental Panel on Climate Change. Cambridge, United Kingdom: Cambridge University Press; 2001. p. 653. 125 Church J. A. et al. Changes in Sea Level. In: J. T. Houghton et al., editors. Climate Change 2001: The Scientific Basis. Contribution of Working Group I to the Third Assessment Report of the Intergovernmental Panel on Climate Change. Cambridge, United Kingdom: Cambridge University Press; 2001. p. 661. 126 Church J. A. et al. Changes in Sea Level. In: J. T. Houghton et al., editors. Climate Change 2001: The Scientific Basis. Contribution of Working Group I to the Third Assessment Report of the Intergovernmental Panel on Climate Change. Cambridge, United Kingdom: Cambridge University Press; 2001. p. 665. 127 Church J. A. et al. Changes in Sea Level. In: J. T. Houghton et al., editors. Climate Change 2001: The Scientific Basis. Contribution of Working Group I to the Third Assessment Report of the Intergovernmental Panel on Climate Change. Cambridge, United Kingdom: Cambridge University Press; 2001. p. 657. 128 Gornitz V. et al. Effects of anthropogenic intervention in the land hydrological cycle on global sea level rise. Global and Planetary Change 1997; 14:147-161. See also Sahagian, D. Global physical effects of anthropogenic hydrological alterations: sea level and water redistribution. Global and Planetary Change 2000; 25:39-48. 129 Church J. A. et al. Changes in Sea Level. In: J. T. Houghton et al., editors. Climate Change 2001: The Scientific Basis. Contribution of Working Group I to the Third Assessment Report of the Intergovernmental Panel on Climate Change. Cambridge, United Kingdom: Cambridge University Press; 2001. p. 666. 130 Church J. A. et al. Changes in Sea Level. In: J. T. Houghton et al., editors. Climate Change 2001: The Scientific Basis. Contribution of Working Group I to the Third Assessment Report of the Intergovernmental Panel on Climate Change. Cambridge, United Kingdom: Cambridge University Press; 2001. p. 666. 131 Cubasch U. et al. Projections of future climate change. In: J. T. Houghton et al., editors. Climate Change 2001: The Scientific Basis. Contribution of Working Group I to the Third Assessment Report of the Intergovernmental Panel on Climate Change. Cambridge, United Kingdom: Cambridge University Press; 2001. pp. 525-582. 132 Folland C.K. et al. Observed climate variability and change. In: J. T. Houghton et al., editors. Climate Change 2001: The Scientific Basis. Contribution of Working Group I to the Third Assessment Report of the
Technical Appendix of Climate Change: Is the Science Sound? B-37 ECO Special Report to the Legislative Assembly of Ontario
Intergovernmental Panel on Climate Change. Cambridge, United Kingdom: Cambridge University Press; 2001p.139. 133 Nakicenovic N. et al. IPCC Special Report on Emissions Scenarios, Cambridge, United Kingdom, Cambridge University Press, and New York, NY, USA; 2000. 134 Prentice I.C. et al. The Carbon cycle and atmospheric carbon dioxide. In: Houghton J.T. et al., editors. Climate Change 2001: The Scientific Basis. Contribution of Working Group I to the Third Assessment Report of the Intergovernmental Panel on Climate Change. Cambridge and New York: Cambridge University Press; 2001. Table 3.1 135 Harvey L.D.D. Global Warming: The Hard Science. Harlow; Prentice Hall; 2000. Section 8.9; See also Prentice I.C. et al. The Carbon cycle and atmospheric carbon dioxide. In: Houghton J.T. et al., editors. Climate Change 2001: The Scientific Basis. Contribution of Working Group I to the Third Assessment Report of the Intergovernmental Panel on Climate Change. Cambridge and New York: Cambridge University Press; 2001. Table 3.4 136 Harvey L.D.D. Global Warming: The Hard Science. Harlow; Prentice Hall; 2000. Section 8.2; See also Prentice I.C. et al. The Carbon cycle and atmospheric carbon dioxide. In: Houghton J.T. et al., editors. Climate Change 2001: The Scientific Basis. Contribution of Working Group I to the Third Assessment Report of the Intergovernmental Panel on Climate Change. Cambridge and New York: Cambridge University Press; 2001. Section 3.7.1 137 Harvey L.D.D. Global Warming: The Hard Science. Harlow; Prentice Hall; 2000. Section 8.6 138 Cubasch, U. et al. Projections of future climate change. In: J. T. Houghton et al., editors. Climate Change 2001: The Scientific Basis. Contribution of Working Group I to the Third Assessment Report of the Intergovernmental Panel on Climate Change. Cambridge, United Kingdom: Cambridge University Press; 2001. Figure 9.13 139 Harvey L.D.D. et al. An Introduction to Simple Climate Models used in the IPCC Second Assessment Report, Intergovernmental Panel on Climate Change, Technical Paper No. 2. 1997. 140 Cubasch U. et al. Projections of future climate change. In: J. T. Houghton et al., editors. Climate Change 2001: The Scientific Basis. Contribution of Working Group I to the Third Assessment Report of the Intergovernmental Panel on Climate Change. Cambridge, United Kingdom: Cambridge University Press; 2001.Table 9.1; see also Harvey, L.D.D. Global Warming: The Hard Science. Harlow; Prentice Hall; 2000. Table 9.6 141 Harvey L.D.D., and Kaufmann, R.K. Simultaneously constraining climate sensitivity and aerosol radiative forcing. Journal of Climate 2002;15:2837-2861. 142 Hoffert M.I., and Covey C. Deriving global climate sensitivity from paleoclimatic reconstructions. Nature 1992; 360:573-576. 143 Prentice I.C. et al. The Carbon Cycle and Atmospheric Carbon Dioxide. In: Houghton J.T. et al., editors. Climate Change 2001: The Scientific Basis. Contribution of Working Group I to the Third Assessment Report of the Intergovernmental Panel on Climate Change. Cambridge and New York: Cambridge University Press; 2001. Section 3.7 144 Cubasch U. et al. Projections of future climate change. In: J. T. Houghton et al., editors. Climate Change 2001: The Scientific Basis. Contribution of Working Group I to the Third Assessment Report of the Intergovernmental Panel on Climate Change. Cambridge, United Kingdom: Cambridge University Press; 2001. Table 9.1. See also Harvey L.D.D. Global Warming: The Hard Science. Harlow; Prentice Hall; 2000. Chapter 10. See also Giorgi F. et al. Regional climate information – evaluation and projections. In: J. T. Houghton et al., editors. Climate Change
Technical Appendix of Climate Change: Is the Science Sound? B-38 ECO Special Report to the Legislative Assembly of Ontario
2001: The Scientific Basis. Contribution of Working Group I to the Third Assessment Report of the Intergovernmental Panel on Climate Change. Cambridge, United Kingdom: Cambridge University Press; 2001. 145 Harvey L.D.D. Global Warming: The Hard Science. Harlow; Prentice Hall; 2000. Figure 8.1 146 Prentice I.C. et al. The Carbon Cycle and Atmospheric Carbon Dioxide. In: Houghton J.T. et al., editors. Climate Change 2001: The Scientific Basis. Contribution of Working Group I to the Third Assessment Report of the Intergovernmental Panel on Climate Change. Cambridge and New York: Cambridge University Press; 2001. p.185 147 adapted from: Harvey L.D.D. Climatic Change: Addressing complexity, uncertainty, and conflict. In B. Mitchell (ed.), Resource and Environmental Management in Canada: Addressing Conflict and Uncertainty, 3rd Edition, Oxford University Press (in press).

Environmental Commissioner of Ontario 1075 Bay Street, Suite 605 Toronto, Ontario M5S 2B1
Phone: (416) 325-3377 Toll-Free: 1-800-701-6454
Fax: (416) 325-3370
E-mail: [email protected] Web site: www.eco.on.ca