Embed Size (px)
Citation preview

Climate Change Impacts on the Future Cost of Living (SSC/CCC004)
Summary to the Joseph Rowntree Foundation and the Project Advisory Group
Paul Watkiss Associates
Paul Watkiss, Federica Cimato, Alistair Hunt, Bruce Morley
March 2016
Executive Summary Climate change will affect people in the UK unevenly, and there could potentially be strong distributional variations by income and deprivation level. These differences have been investigated in this project ‘Climate Change Impacts on the Future Cost of Living’ (SSC/CCC004), commissioned by the Joseph Rowntree Foundation, and undertaken by Paul Watkiss Associates. The aim is to explore how climate change could affect the future costs of living in the UK at the household level and the implications for low income households. The study has considered a broad range of impacts from climate change on households, focusing on the period up to mid‐century (i.e. the 2050s) including:
Direct expenditures, e.g. changing temperatures and the impact on household energy‐use;
Indirect cost pathways, e.g. additional costs from the effects of flooding;
International effects, e.g. climate change affecting global agriculture and thus UK food prices;
Policy costs, e.g. from mitigation (greenhouse gas emission reduction) policy;
Non‐market costs, which affect people’s quality of life and well‐being (economic welfare). To investigate these impacts, four evidence lines have been investigated.
1. A review and analysis of the available information on the costs of climate change in the UK, primarily drawing on the UK Climate Change Risk Assessment (CCRA) of 2012 and updates including the evidence gathered for CCRA2 (2015).
2. A review and analysis of the cost of mitigation policy on consumer prices and on energy bills.
3. An econometric analysis, to investigate the observed links between climate and major household expenditure items in the UK, and the potential effects of future climate change.
4. A review and analysis of the international effects of climate change and their potential to impact on the UK.
The analysis of these four areas provides information on the different impacts (i.e. on direct expenditures, international effects, etc.) and the results have been combined to provide an overall analysis of the impacts of climate change on household expenditure items and broader household prospects. As well as the impact on the average household, the analysis has considered the distributional patterns and whether there are disproportionate effects on low income households. In undertaking this analysis, the study has captured the impacts of climate change (the costs), which impact detrimentally on the cost of living, but it has also considered where climate change could have benefits, which in turn would have positive effects. These are presented as costs (‐£) and benefits (+£) in the report. The results are presented for the near‐term (2020s) and mid‐century (2050s). As the analysis draws on a number of studies which use different scenarios and ranges, the values are not directly comparable, but they do provide indicative estimates of the importance of climate change on various household expenditure items. One of the largest current household expenditure items is food (11% of average household expenditure), which is related to agricultural production: a highly climate sensitive sector. Climate change has the potential to lead to major effects on the costs of living for this item, though it is rather complicated to assess due to the global nature of production, and trade involved, as well as the variation in the literature which suggests a wide range of potential

outcomes from future climate change. Based on the international literature review, and noting the indicative nature of the analysis, the results indicate minor effects in the short‐term, but larger, although still modest effects on family budgets towards the middle of the century. The food bill for an average family could rise by 9% by 2050 due to climate change (with a range of 0%‐28%, reflecting impact range) assuming all other things being equal. This would be equivalent to a cost of ‐£275/household/year (with a range of 0 to ‐£856). Importantly, such an increase would have much greater impacts on low income households, because they spend a larger proportion of average household expenditure (16%) on food. Climate change will also affect energy demand, which is also a major household expenditure item (at around 5% of average household expenditure). The warmer temperatures from climate change will bring benefits (i.e. lower costs) by reducing household energy bills due to lower winter heating demand, even in the short‐term. However, at the same time, there will be higher temperatures in summer, which will increase the potential need for cooling or lead to lower comfort levels from increasing building temperatures. Based on a review and an update of the UK CCRA estimates, the potential benefits of reduced winter heating indicate a potentially minor reduction in household costs of +£87/household/year in the 2020s (central projection) and a minor to modest saving of +£135/household/year by the 2050s (with a range from +£58 to +£226 for low and high emission scenarios) for the latter period. There would be disproportionately larger benefits for low income households from these changes, as they spend a higher proportion of their incomes on fuel (10%). With higher summer‐time temperatures, there will also be an increase in cooling demand, i.e. a potential cost. Because the UK is a temperate country, the increase in cooling demand is projected to be much lower than the reduction in winter heating demand (in energy terms), although cooling is more expensive than heating. The costs of additional cooling were only considered indicatively in CCRA1, and the estimated costs are negligible relative to overall household expenditure (in the range of ‐£3 to ‐£32/household/year for a low and high warming scenario respectively) by the 2050s. However, this is an area of high uncertainty, and more recent studies indicate these indicative cooling estimates may be too low, especially under scenarios where the uptake of cooling is high (due to the additional costs of equipment and the increased electricity demand). There are also some important distributional differences. The additional costs of cooling will be higher for households in the south of England and in particular in London. Furthermore, while the reduction in heating bills (benefits) will largely happen automatically (autonomously), the additional cooling impacts will vary by household, with additional direct expenditures for high income households (due to higher projected purchase and use of air conditioning) while low income households will experience higher economic welfare costs from the associated discomfort and health related impacts (as AC purchase and use varies strongly with income, and is lower for those on lower incomes). There are also some types of housing which are poorly designed and subject to greater over‐heating. There are also policy costs associated with the UK’s mitigation (greenhouse gas emissions reduction) commitments that affect the energy sector and thus household energy costs. These have also been considered in the study. While there are several climate change mitigation policies in place that potentially increase electricity and energy costs, some UK households have been directly targeted by policies to encourage improvements in energy efficiency, to reduce energy demand and to lower household energy costs. Previous assessments (by DECC and the ASC) have concluded that when these energy savings are included, the typical household energy bill will actually decrease overall (up to 2020) as a result of policies. However, it is noted that many of these energy savings policies (such as the Green Deal) have recently been removed. Furthermore,
in general, low income households tend to be lower adopters of energy efficiency measures and have benefited less from previous policies– although some vulnerable groups have been targeted through specific policies aimed at regulating the efficiency standards of the social housing stock and providing support to pensioners. These average figures also mask large differences between income groups and thus the effects of these policies. The costs of policies on homes heated using electricity (7% of UK households) are considerably higher than for gas, and critically, a large percentage of the fuel poor in England use electricity as their main source of energy. A key conclusion is that without new explicit policies that address these distributional aspects, there is the potential for large negative impacts to fall on low income households. In terms of the effects of climate change on more general housing costs (e.g. insurance, maintenance, repair), the dominant effect is from the increase in flooding. The most recent estimates of the increase in the national costs of flooding (CCRA2) for residential properties from climate change (over and above the current baseline) in the UK are equivalent to ‐£1 to ‐£5 per
household per year by the 2020s (for a 2 and 4C scenario respectively), with an upper value (High ++) of ‐£9, increasing to ‐£4 to ‐£11 per household per year by the 2050s (for 2 and 4C) with a high++ estimate of ‐£37/household/year. These increases are additional to the current risk levels, which equate to around ‐£13/household/year. These costs are based on the total UK annual average damage (expressed as an average for all households) that is projected to occur. There is, however, an issue about exactly how these costs will affect household expenditure, i.e. whether the costs of increased flooding will pass through to higher insurance premiums. When expressed as an average cost across the population, this only represents a minor increase in household costs, but in practice, floods could lead to large costs for a smaller number of affected households. There are also distributional impacts with these flood risks and the associated costs. First, there are differential patterns of exposure in the UK, with higher risks of flooding for many areas with high levels of deprivation/lower average incomes, particularly coastal areas. Second, there is an issue of insurance cover: while most owner occupiers have building insurance, there are much lower levels of contents insurance among tenants, with many in the lowest income decile having no insurance at all. This is important given the high individual cost to property or contents of a flood; thus the increase in flooding from climate change has the potential to disproportionately lead to major (life‐changing) impacts on a large number of low income households. This issue is particularly important in the context of a potential long‐term shift to risk‐reflective insurance and if the frequency of flooding increases such as to affect property prices. Alongside flooding, there are also increased risks from building subsidence from climate change, which would also increase household costs. The additional costs per average household are low (‐£2 to ‐£4 per household by the 2050s), but again the impacts of individual events are large. The other potentially important impact for households relates to the costs of water, which is around 2% of average household expenditure. However, the regulated nature of the UK’s water sector means that any impacts of climate change on household costs are indirect. The CCRA1 estimates, which focused on water deficits and increasing supply‐side costs indicate low values, which would have negligible impacts on household budgets at around ‐£2/household/year in the 2020s and ‐£9 (central) with a range of ‐£3 to ‐£14/household/year in the 2050s. CCRA2 has updated the water demand‐supply deficit and while the specific estimates vary a little, the broad order of magnitude is similar. As the lowest income decile of household spends 2.9% of their budget on water supply services compared to 1.2% for the highest decile, the pass through of higher costs would impact more strongly on low income households.
Direct health costs are not a large direct expenditure item, but there are effects on household (economic) welfare resulting from the potential impacts of climate change on health. These effects can be expressed in monetary terms using non‐market valuation – and they have been considered in the analysis – although they affect wellbeing rather than household expenditure. In this case, there are again both positive benefits and negative costs, with strong distributional patterns. The key benefits (reduced economic welfare costs) are from warmer winters and the reduction in cold related mortality and morbidity – the main negative impacts (increased economic welfare costs) are from the increased mortality and morbidity from higher temperatures and heat extremes. Recent analysis in the UK indicates that the increase in heat related benefits and decrease in cold related impacts under climate change will be similar in magnitude in terms of overall valuation. However, when other health impacts from climate change are included, such as from the direct and indirect effects of flooding, changes in patterns of food‐borne disease, etc., the negative health impacts of climate change (as an average) significantly outweigh the positives. Nonetheless, the health related (economic) welfare costs from climate change on households are low when compared to the categories above. Health effects also have strong distributional impacts on low income households, as heat and cold‐related mortality/morbidity is primarily an issue for the elderly, those with existing health conditions, those with budget constraints that restrict their use of energy and those with access to low levels of social care. There will therefore be larger impacts from climate change for low income or vulnerable households, but also larger benefits. A large number of other direct and especially indirect costs are identified from national level analysis which could have some impacts on household costs. Indeed, the CCRA1 identified 700 potential risks / opportunities from climate change, of which around 40 were considered to have medium or high impacts by the end of the century. The analysis of household costs above should therefore only be considered partial. Some of these omissions are large (e.g. non‐residential building and indirect costs of flooding has been estimated to lead to costs that are 5 – 6 times greater than from residential flooding alone, i.e. ‐£19 to ‐£174/household/year), but it is difficult to assess how these will pass through to household costs, i.e. in terms of increased prices for goods and services, or wider employment and economic prospects. Furthermore, there are a large number of additional economic welfare costs that will arise from climate change. These do not directly affect household expenditure, but have potentially very large costs (when expressed in monetary terms using non‐market valuation), such as the impacts on biodiversity and ecosystem services. It is stressed that the focus of this study on household costs omits these issues, and it is difficult to even identify the potential societal welfare costs of these issues, due to the challenges of quantification and valuation. The consideration of these additional direct, indirect and economic welfare impacts is critical in assessing the overall impacts of climate change in the UK – noting this goes beyond the focus on household budgets in this study. The results are summarised below, indicating the potential impact on various components of a household budget, and highlighting where there are potentially larger impacts and distributional effects. Overall, the study finds that there are likely to be relatively modest impacts from climate change on the costs of living in the UK up to the middle of the century, but these will have differentiated effects with distributional impacts. There will, of course, be variations in the exposure of households according to location, age, etc. Nonetheless, a common finding is that low income
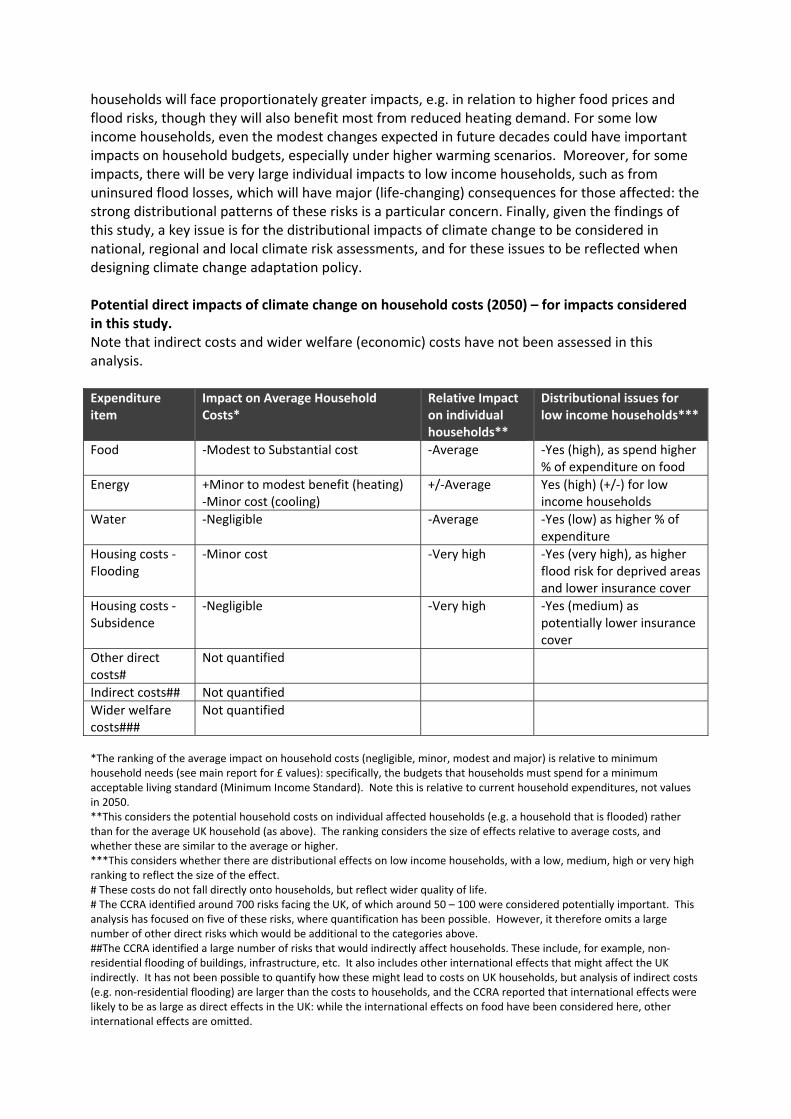
households will face proportionately greater impacts, e.g. in relation to higher food prices and flood risks, though they will also benefit most from reduced heating demand. For some low income households, even the modest changes expected in future decades could have important impacts on household budgets, especially under higher warming scenarios. Moreover, for some impacts, there will be very large individual impacts to low income households, such as from uninsured flood losses, which will have major (life‐changing) consequences for those affected: the strong distributional patterns of these risks is a particular concern. Finally, given the findings of this study, a key issue is for the distributional impacts of climate change to be considered in national, regional and local climate risk assessments, and for these issues to be reflected when designing climate change adaptation policy. Potential direct impacts of climate change on household costs (2050) – for impacts considered in this study. Note that indirect costs and wider welfare (economic) costs have not been assessed in this analysis. Expenditure item
Impact on Average Household Costs*
Relative Impact on individual households**
Distributional issues for low income households***
Food ‐Modest to Substantial cost ‐Average ‐Yes (high), as spend higher % of expenditure on food
Energy +Minor to modest benefit (heating)‐Minor cost (cooling)
+/‐Average Yes (high) (+/‐) for low income households
Water ‐Negligible ‐Average ‐Yes (low) as higher % of expenditure
Housing costs ‐ Flooding
‐Minor cost ‐Very high ‐Yes (very high), as higher flood risk for deprived areas and lower insurance cover
Housing costs ‐ Subsidence
‐Negligible ‐Very high ‐Yes (medium) as potentially lower insurance cover
Other direct costs#
Not quantified
Indirect costs## Not quantified
Wider welfare costs###
Not quantified
*The ranking of the average impact on household costs (negligible, minor, modest and major) is relative to minimum household needs (see main report for £ values): specifically, the budgets that households must spend for a minimum acceptable living standard (Minimum Income Standard). Note this is relative to current household expenditures, not values in 2050. **This considers the potential household costs on individual affected households (e.g. a household that is flooded) rather than for the average UK household (as above). The ranking considers the size of effects relative to average costs, and whether these are similar to the average or higher. ***This considers whether there are distributional effects on low income households, with a low, medium, high or very high ranking to reflect the size of the effect. # These costs do not fall directly onto households, but reflect wider quality of life. # The CCRA identified around 700 risks facing the UK, of which around 50 – 100 were considered potentially important. This analysis has focused on five of these risks, where quantification has been possible. However, it therefore omits a large number of other direct risks which would be additional to the categories above. ##The CCRA identified a large number of risks that would indirectly affect households. These include, for example, non‐residential flooding of buildings, infrastructure, etc. It also includes other international effects that might affect the UK indirectly. It has not been possible to quantify how these might lead to costs on UK households, but analysis of indirect costs (e.g. non‐residential flooding) are larger than the costs to households, and the CCRA reported that international effects were likely to be as large as direct effects in the UK: while the international effects on food have been considered here, other international effects are omitted.

### These costs do not fall directly onto households, but reflect wider quality of life.
Table of Contents
1. INTRODUCTION, OBJECTIVES AND METHODS 1
StudyMethod 1
HouseholdBudgets/EconomicWelfareandDistributionalPatterns 4
ClimateChangeScenarios,Socio‐EconomicsandUncertainty 8
2. IMPACTS OF CLIMATE CHANGE ON HOUSEHOLD COSTS 11
Food(agriculture) 11
Energy 13
Housing(floodingandinsurance,maintenanceandrepair) 16
Watersupply 19
Health 20
Widereconomiceffects,welfarecostsandthe4Ps 22
3. DISCUSSION AND CONCLUSIONS 25
Acknowledgements 27
References 28

1
1. Introduction, Objectives and Methods
There is a large literature –as reported in the IPCC 5th Assessment Report (2014) – that highlights that people who are socially, economically, culturally, politically, institutionally, or otherwise marginalized are especially vulnerable to climate change. This primarily concerns the high impacts of climate change that are likely to arise in developing countries, and the higher relative impact on the poorest within these countries. However, it is also likely that climate change will affect groups in the UK unevenly, and there could be strongly distributional variations, especially by income and deprivation level. This issue has been investigated in this project ‘Climate Change Impacts on the Future Cost of Living’ (SSC/CCC004), commissioned by the Joseph Rowntree Foundation, and undertaken by Paul Watkiss Associates. The objective of this study is to explore how climate change could affect the future costs of living in the UK at the household level and the implications for low income households. The specific aims are to understand:
How the future costs of living might change due to climate change, considering different likely scenarios of climate impacts in the UK and internationally;
How changes in costs may impact on household budgets, considering the core components of a household budget in the UK; and
How these costs might affect different households, particularly those on low incomes.
This analysis focuses on the impacts of climate change on households as the unit of analysis, rather than on the UK as a whole. It therefore has a different focus compared to most previous studies to date, including the UK Climate Change Risk Assessment (CCRA) (Defra, 2012), which took an aggregated national‐scale approach. The analysis also focuses in on specific categories of climate change that affect households, rather than trying to estimate the total combined impacts of climate change, which is important to consider when interpreting the overall results.
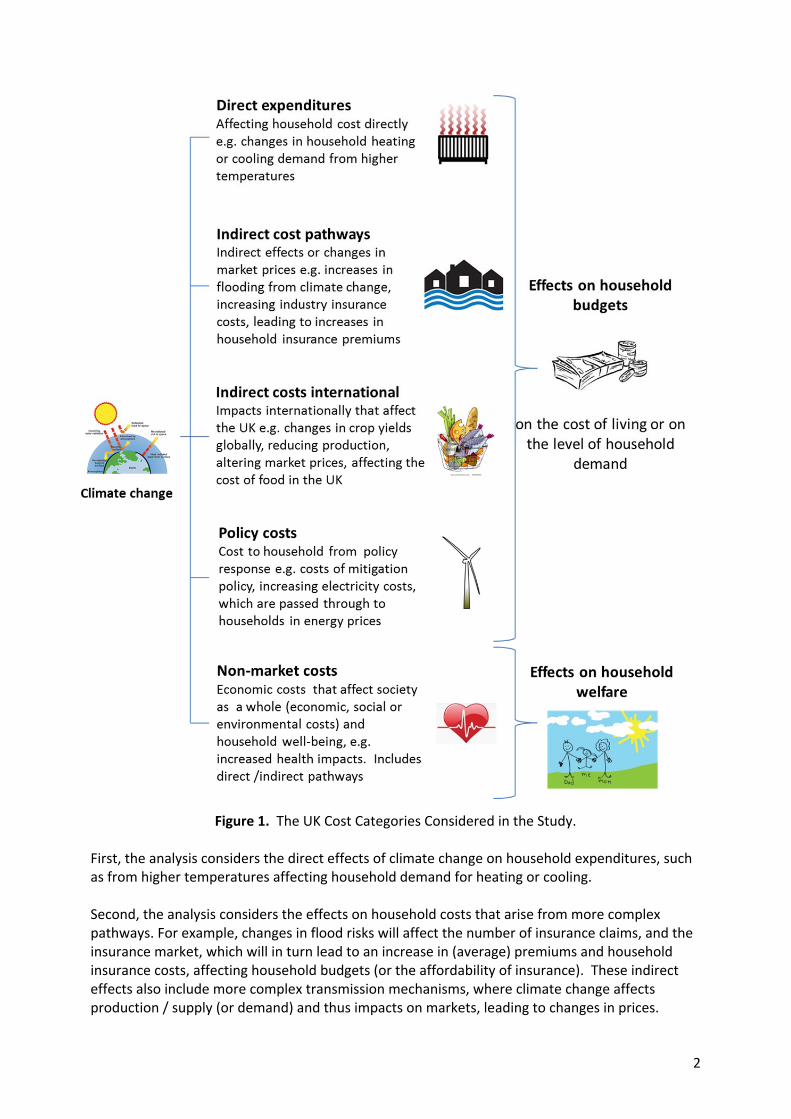
Study Method The analysis has considered how climate change might affect the cost of living and household budgets, thus it investigates the impacts on the main household expenditure items, considering the distributional patterns across household income deciles. Climate change affects household living costs through a variety of direct and indirect mechanisms, including the effects on supply and demand for market‐traded goods and services, and in turn on prices (with associated feedbacks). However, climate change will also affect households in other ways that go beyond the cost of living, i.e. affecting people’s quality of life and well‐being (or in economic terms, welfare). Therefore to fully capture the effects of climate change on households, a number of further aspects are considered in the study. These are shown in Figure 1. The study method has therefore investigated each of these different pathways.
2
Figure 1. The UK Cost Categories Considered in the Study. First, the analysis considers the direct effects of climate change on household expenditures, such as from higher temperatures affecting household demand for heating or cooling. Second, the analysis considers the effects on household costs that arise from more complex pathways. For example, changes in flood risks will affect the number of insurance claims, and the insurance market, which will in turn lead to an increase in (average) premiums and household insurance costs, affecting household budgets (or the affordability of insurance). These indirect effects also include more complex transmission mechanisms, where climate change affects production / supply (or demand) and thus impacts on markets, leading to changes in prices.
3
These effects can occur at the UK scale, but they may also occur at the global scale and feed‐back to the UK (international effects). As an example, as climate change will affect global agricultural production (yields) and this will alter market conditions, it will (via supply chains) lead to changes in food prices in the UK. In all these cases, climate change may affect potential household costs, which in turn may lead to a change in the demand from these households for these goods and services. It is therefore important to understand how the quantity or demand for a good or services changes with its price (the price elasticity of demand). However, understanding the market response to climate impacts, the price transmission effects and how this affects demand, requires more complex economic modelling, which is rarely undertaken in climate impact studies. Alongside these effects, there are certain policies that are being introduced, as a result of climate change, which will also lead to changes in the prices of some goods and services: most notably the UK’s commitments to reduce greenhouse gas emissions (mitigation policy) and the subsequent effects on household energy costs. It is important to understand these policy costs, and to examine whether they impact households differently. Finally, many of the impacts of climate change lead to impacts that are not captured by markets, and thus do not feed through to prices, though these are still important for households in terms of well‐being. For example, this includes changes in health resulting from climate change. Economic assessments can attach a monetary value to these non‐market goods by looking at the impact they have on utility, by using a range of techniques (revealed preference and stated preference) derived either from primary research or transferred from existing studies. This expresses impacts in monetary terms to capture the economic, social and environmental costs borne by society as a whole (i.e. on societal welfare), in order to make sure they are considered equally alongside market costs. The consideration of the effects of climate change on all these direct and indirect pathways, on both household expenditure and wider economic welfare, is a major undertaking. For this short study, the focus has been on collating and synthesizing existing literature and information. To advance this, a number of different evidence lines have been used.
Review and synthesis of the impact assessment literature. There are existing studies that have assessed the potential impacts and economic costs of climate change in the UK, and these have been used as a key source of information. This analysis has primarily drawn on an analysis of the economic costs of climate change published in the UK’s 1st Climate Change Risk Assessment (CCRA) in 2012 (Defra, 2012), which included a mixture of direct, indirect, policy costs and welfare costs. The analysis has used these economic costs to assess the impact on a) household budgets, estimating the costs per average household from climate change and b) economic welfare, and the impact per average household. This information has also been used to consider the distributional patterns of effects, e.g. for low income households. Recent updates from the ASC (2014) and the current Climate Change Risk Assessment 2017 evidence reporti have also been included. Further information is presented in Appendix 1.
Review of international effects. CCRA1 focused on the domestic impacts of climate change in the UK. However, this largely omitted the potential international effects of climate change on other countries, and their subsequent impact on the UK. The study has therefore undertaken a review and analysis of the international literature on the possible economic costs of climate
4
change and the impact on prices of international goods, notably food, and how these might affect households in the UK. Further information is presented in Appendix 3.
Review of the cost of mitigation policy. While these costs do not arise as a direct result of climate change, their inclusion recognises the UK’s international commitment to tackling climate change, as outlined in the legally binding targets in the Climate Change Act (2008)ii, noting also that the level of future impacts in the UK (and thus the impact of climate change on the cost of living) are determined by the amount of international mitigation. This task reviewed the literature on the impact of UK climate mitigation policies on consumer prices, including energy bills. It also assessed how these costs vary across different income groups (distributional analysis) and the reasons behind this. Further information is presented in Appendix 2.
Econometric analysis. The final part of the study undertook a new econometric analysis of the observed links between climate and major household expenditure items in the UK. The aim was to identify elasticities between climate and the price of key household budget items, i.e. for food, energy, water and other expenditure items. This stage also involved an initial analysis of the effect of extreme weather events, such as floods, on prices. Using econometrics to provide evidence on the effects of climate can provide useful information on how the climate and the wider economy interact, but as it is based on historic data it has some limitations, notably as future climate change will be different to the recent past and include additional effects which are not evident as yet. Further information is presented in Appendix 4.
The analysis of these four areas provides information on the different impacts and the evidence lines have been combined to provide an overall analysis of the impacts of climate change on household expenditure items and broader household prospects, by risk. In practice, the international review provided information on food prices, the review of mitigation policy provided information on policy costs, and the review and update of the CCRA impact assessment provided the other key results (for energy use and household costs). The econometric analysis provided useful information to inform other parts of the study, but was not used in the actual cost analysis. The findings from these various evidence lines has been brought together and is presented by risk category below, considering effects on household budgets and on household prospects.
Household Budgets/Economic Welfare and Distributional Patterns In undertaking the analysis, a key issue has been to investigate how climate change affects the average household, but also whether it disproportionately affects low income households. The distributional effects of climate change may arise in different ways. Some of the impacts of climate change may fall primarily on certain locations or particular groups in society, e.g. due to their higher exposure to particular climate hazards such as heat or floods. For many households, income is their most important economic resource for meeting everyday living expenses. However, it is the consumption of goods and services (best reflected by expenditure rather than income) that is pivotal in meeting a household's requirements: evidence suggests that income and expenditure together represent a better determinant of economic well‐being than income alone (ONS, 2014). Total average weekly household expenditure in the UK was £517.30 in 2013 (ONS, 2014). However, spending varies significantly with income. The lowest earning ten per cent of households spent an average of £189.80 per week, while the highest earning ten per cent of

5
households spent an average of £1,119.50 per week (ONS, 2014). However, spending patterns by total gross household income don’t tell the whole story. Households of different sizes, and with different numbers of adults and children, need different levels of income in order to maintain a comparable standard of living. Expenditure patterns after income are therefore adjusted to account for different demands on resources, by considering the household size and composition. This process, known as equivalisation, reduces the differences in income between the highest and lowest earning households and allows more meaningful comparisons to be made (ONS, 2014). Importantly, expenditure in the lower income decile groups increases after income is equivalised. The latest household expenditure is shown in the table below, from the 2014 UK Living Costs and Food Survey (ONS, 2014). The table shows the differences in expenditure for different income decile groups, as even when impacts are evenly distributed, the impact of higher costs (or prices) may affect low income households to a greater extent, because they spend a greater proportion of their income on certain expenditure items, such as food or household energy. Table 1. Household expenditure as a % of total expenditure by equivalised disposable income decile group, 2013 Commodity or service Lowest decile Highest decile All
Food and non‐alcoholic drinks 16.4 8.0 11.4
Alcoholic drink, tobacco & narcotics 3.4 1.8 2.3
Clothing & footwear 3.8 4.0 4.4
Housing (net), fuel & power, of which 25.0 10.7 14.4
Gross rent 38.3 4.0 9.3
less housing benefit, rebates & allowances rec'd 26.5 [0.0] 3.1
Net rent 11.8 4.0 6.2
Maintenance and repair of dwelling 0.7 1.9 1.4
Water supply and miscellaneous services 2.9 1.2 1.7
Electricity, gas and other fuels 9.6 3.6 5.1
Household goods & services 6.2 7.4 6.4
Health 0.7 1.1 1.2
Transport 9.8 15.3 13.6
Communication 3.5 2.0 2.8
Recreation and Culture 8.7 14.6 12.4
Education 2.2 2.2 1.7
Restaurant and hotels 5.9 8.7 7.8
Miscellaneous goods and services 6.5 7.8 7.6
Other expenditure items 7.9 16.4 14.1
Lines in bold are major focus areas for the study for direct and indirect cost pathways. Note that equivalised income adjusts for household composition, to take into account the fact that households with many members are likely to need a higher income to achieve the same standard of living as households with fewer members. Source 2014 UK Living Costs and Food Survey
The table shows that all households spend a large proportion of their budget on a small number of major items. Of particular relevance to this study are those areas which are most likely to be affected by climate change (shown in bold). Aside from housing, this is dominated by food (11% of average household expenditure) and household energy costs (5% of average household expenditure) which will be impacted through direct effects. However, the Table also shows how
6
the expenditure of different income groups varies for the same items. For example, for low income households (in the lowest decile), food forms 16% of household expenditure and household energy costs are almost 10%. Price rises for these items will therefore have a larger impact on low income household budgets (affordability) or will reduce their available budget for other goods or services. At the same time, there are a wider set of climate impacts that also affect households in other ways. These include impacts on well‐being or quality of life (economic welfare). They can include, for example, health impacts. The study also considers the effects of climate change on these broader quality of life aspects, and again, also looks to see whether these disproportionately affect low income households. To help frame these broader effects, the study has considered the Joseph Rowntree Foundation 4Ps framework for understanding poverty – outlined in the box below. While the direct effects of climate change (on expenditures and through indirect cost pathways) will fall into the category of ‘pockets’ (household resources), the effects of climate change on the non‐market costs will have greater influence on other aspects affecting poverty, including the places where people live and their prospects.
Box 1 JRF’s poverty framework and implications of climate change and policy responses for 4 Ps The JRF has developed a framework – the 4Ps ‐ to assess the effectiveness of policies aimed at reducing poverty. The framework builds on the four main measures of poverty, namely, pockets, prospects, prevention and places: Pockets: policies concerned with boosting households’ resources now – primarily by increasing their income – so they are better able to meet their needs. Key areas include: • ensuring people get the benefits they need and have contributed to; • supporting people to take up work, applying conditions where appropriate; • making sure markets for essential goods and services – like housing, childcare and energy – operate effectively for low‐income families, so it costs less to meet needs; • working with employers to boost productivity and pay. The impact of climate change on pockets – i.e. on household resources ‐ is the main focus of this report. It assesses how climate might directly and indirectly affect the cost of living, and whether these effects fall disproportionately on low income groups. Prospects: policies concerned with improving the life chances of individuals and their families, so people are able to escape poverty in a sustainable way. Key areas include: • supporting child development and educational achievement; • ensuring it always pays to work; • employers providing opportunities to progress at work; • addressing issues such as discrimination, which reduce opportunities for some groups. The impact of climate change on prospects is relevant with respect to life chances and whether impacts fall disproportionately on some individuals or vulnerable groups, or affect the development and regeneration of certain areas. Prevention: almost anyone can experience poverty during their lifetime, so policies that insure against sliding into poverty are important. Key areas: • delivering public services and other essential services in a way that enables people to access advice and support early, rather than waiting for a crisis; • mechanisms that can help people to protect against future poverty risk, such as savings and access to low‐cost credit.
7
In some cases, the additional effects of climate change could tip some people into poverty, especially in cases when there are major impacts on individuals or households. The report therefore investigates the potential size of individual effects, as well as an average and in aggregate. The identification of such effects highlights the potential need for targeted policies or support. Places: where people live shapes their lives, affecting their job prospects and access to essential goods and services and affordable housing. Key areas: • transport availability and accessibility; • quality and affordability of housing; • local initiatives to address crime and improve the local environment; • activities to link skills provision to the needs of the local labour market; • ensuring the impacts of climate change do not exacerbate poverty and disadvantage. The final element is the degree to which climate change impacts vary with place, across the UK (geographically), as well as between different areas or housing in terms of socio‐economic profile. A key issue is to understand any distributional patterns to risks and where these exist, to highlight the need to address these issues in the design of adaptation policy.
Following from this, the results of the study are presented in terms of the potential risks to various household budget and well‐being (economic welfare) categories in turn. In each case, the analysis of average effects is followed by an assessment of the distributional effects. For the latter, this includes consideration of how much low income deciles spend compared to the average (Table 1). In presenting the results, it is useful to benchmark impacts against current household costs. This gives some perspective on the size of the effects measured, and the extent to which they could make a tangible difference to living standards. In order to relate the analysis to social impacts, this can be expressed as a percentage of minimum household needs: specifically, the budgets that households must spend for a minimum acceptable living standard. The Joseph Rowntree Foundation’s Minimum Income Standard, which is based on deliberation by members of the public about what is required as a minimum (Centre for Research in Social Policy 2015), gives such benchmarks. A weekly budget, net of housing, varies by household type, ranging from over £600 for a couple with four children to just under £200 for a single person. The following classifications are based on a standard example in between these extremes: the case of a couple without children, who require £321 a week (this is also the standard household type used to express official poverty benchmarks). On this basis, the following classifications have been used to describe orders of magnitude of the effects in this report:
Negligible: <£1 a week/£50 per couple household (hh) per year
Minor: £1‐£3 a week/£50‐£150 /hh/year – up to around 1% of minimum budget (net of rent/mortgage) of a couple without children
Modest: £3‐£15 a week/£150‐750/hh/year – 1‐5% of minimum budget of couple
Substantial: higher than £15 a week/£750/hh/year >5% of minimum budget of couple. Note that even the major costs are small in comparison with normal fluctuations in costs due to inflation and other factors. However, it is worth bearing in mind that for certain groups, the disposable equivalised income will involve higher spend on key household items (e.g. low income families spend a greater proportion of their available income on food for example) or lower
8
available disposable income (e.g. pensioners living alone). For this reason, the analysis also considers the potential effects on low income households, and makes a qualitative judgement (low, medium, high, very high) of these distributional effects. It is also highlighted that while the analysis has taken total UK impacts, and then assessed these in terms of the costs per household on average, there are certain impacts that will lead to a large impact on the individual households affected (e.g. with flooding). The analysis has therefore also considered whether impacts are broadly experienced similarly across all households, or whether there are higher relative impacts (than the average) for households affected.
Climate Change Scenarios, Socio‐Economics and Uncertainty The climate is changing already: the atmosphere and ocean have warmed, the amounts of snow and ice have diminished and sea level has risen (IPCC, 2013, globally and in the UK, Jenkins et al., 2007). This warming is unequivocal. Continued emissions of greenhouse gases will cause further warming and changes in the climate system, though there will be different patterns and impacts across the world (IPCC, 2014). In very general terms (Defra, 2014), as a consequence of climate change, the UK is expected to experience warmer temperatures and changes in patterns of variability, including heavier rainfall events (with increased risk of flooding) and more and longer‐lasting heat waves. There will also be increases in sea levels, affecting coastal areas. More detailed analysis of these future changes requires climate models to make projections of changes in temperature, precipitation and other meteorological variables. These models require inputs of future greenhouse gas emissions or radiative forcing, which directly or indirectly, rely on future projections of global socio‐economic scenarios. However, this involves considerable uncertainty, which takes a number of forms.
First, it is not currently clear what future emission pathway the world is on, and therefore
whether we are heading towards a future 2C or a 4C world, relative to pre‐industrial levels. At the current time (November 2015), and based on the pledges from countries as part of the INDC process (Intended Nationally Determined Contributions), it is estimated that warming
would be limited to 2.7C by 2100iii if these commitments were delivered (noting there is actually a significant range around this, due to the sensitivity of the models). This still falls some way short of the international goal – agreed at the Conference of the Parties (UNFCCC,
2010) ‐ to limit future warming to 2C relative to pre‐industrial levels, and to consider lowering the goal to 1.5C in the near future. Clearly the future emission or forcing pathway makes a major difference to the level of climate change and impacts. To take account of these issues, projections of future climate change are presented for defined future scenarios. In earlier studies, defined socio‐economic scenarios (the IPCC SRES scenarios) were used. In more recent studies, these use the new RCP and SSPs (Representative Concentration Pathways and Shared Socio‐economic Pathways). All of these broadly map out the range
between a 2C and >4C world (by 2100, relative to pre‐industrial levels).
Second, even if the future emission pathway were known (or is defined for an assessment), there is large additional uncertainty that arises from different climate models. In the medium‐term, up to 2050, this modelling uncertainty is as large as the future emission pathway uncertainty. To consider this model uncertainty, climate information is usually taken from an ensemble (a group of model simulations that are used to consider a climate projection for the same scenario) and uncertainty is presented.
9
A further issue relates to the considerably variability of the weather from year to year. To take account of this, future climate projections are usually presented as the average of 30 year time periods (e.g. the period 2041 – 2070, which is then referenced as the ‘2050s’). These future projections are also usually presented as the change from a baseline climate period, e.g. the period 1961 – 1990. This has a number of rather major implications. When undertaking a synthesis exercise such as this, the analysis is complicated by the different scenarios, model/ensembles, future and baseline time periods used in the original studies. This makes direct comparison and integration challenging. In this study, we try and provide broadly similar time periods and scenario, but stress that due to the differences in studies and the underlying assumptions, care must be taken in directly comparing values for different risk categories. Further, there is a large uncertainty around the future climate change that will occur, and the use of ‘average’ values is somewhat meaningless (and inappropriate) given scenario as well as model uncertainty. It is not possible to provide a ‘best guess’ of what will happen. Indeed, it is more important to capture the uncertainty, including from more extreme scenarios as well as more central projections and thus to indicate the range of resulting cost implications. For many of the cost categories, estimates are based on an updated analysis of the first UK Climate Change Risk Assessment (CCRA1). This captured these uncertainty aspects by considering three emission scenarios, i.e. LOW, MEDIUM and HIGH (based on underlying SRES scenarios B1, A1B and A1F1). The low emission scenario is broadly equivalent to a high level of mitigation, i.e.
very approximately a 2C stabilisation scenario. The high emission scenario exceeds 4C by the end of the centuryiv. The medium emission scenario is broadly between these two scenarios, and thus closer to the current global emission reduction pledges. The CCRA also looked at model uncertainty by constructing probability like distributions for each emission scenario, reporting the 10th, median (50th) and 90th percentile of the distribution. However, the recent modelling work
for CCRA2 has used different scenarios, presenting for a low and high scenario (broadly 2C and 4C) but also looking at a high end scenario (High++), e.g. as for the flood estimates reported here. In other areas, notably for agriculture, we have used a further set of studies and scenarios, which have limited climate uncertainty, but broader uncertainty analysis around impacts and valuation. We have presented the main results for all risks for similar time periods (the near‐term, i.e. 2020s and the middle of the century, around the 2050s) and tried to report the range of available information from the original, but it is stressed that the estimates are not directly equivalent. They therefore should be considered as indicative estimates of the importance of climate change on various household expenditure items. Alongside these climate elements, there is also an issue of future socio‐economic change. At the global level, this influences future emissions and climate change, due to the number of people and the level of economic growth, as well as the choices on energy use for example. Similarly, socio‐economic changes will also occur in the UK which will influence the impacts of climate change. This will affect the number of people and assets at risk (e.g. due to the future population size, levels of growth and development), the vulnerability and exposure (i.e. depending on where new homes are built, on whether there is increased protection in place), etc. They will also affect future household incomes, consumption patterns, etc. As the study largely synthesises other research, assumptions about future socio‐economic conditions also vary in underlying studies (e.g. some studies assume static conditions, while some change some future metrics such as population and income). For presenting the results, we broadly relate future climate changes to the current profile of household expenditure and

10
incomes, but highlight that future changes could significantly affect these outcomes. We therefore stress that we consider the impacts of future climate change on current household costs, to provide an indication of the possible magnitude of effects. However, we strongly highlight that society, economy and household costs in 2050 will be very different to that of today, and thus some care must be taken in interpreting the results.
11
2. Impacts of Climate Change on Household Costs
The results of the assessment are presented below, set out by expenditure item/economic welfare impact. In each case, the analysis collates cost information from the relevant evidence stream/s, i.e. from the direct impact studies, econometric analysis, international review, etc. and considers first the effect on (average) households and then whether there are any distributional effects for low‐income groups. In undertaking this analysis, the study has captured the impacts of climate change (the costs), which impact detrimentally on the cost of living, but it has also considered where climate change could have benefits, which in turn would have positive effects. There are presented as costs (‐£) and benefits (+£) in the report. The results are presented for the near‐term (2020s) and mid‐century (2050s). As the analysis draws on a number of studies which use different scenarios and ranges, the values are not directly comparable, but they do provide indicative estimates of the importance of climate change on various household expenditure items.
Food (agriculture) One of the largest household expenditure items is food, and production (agriculture) is a highly climate sensitive sector globally. Climate change therefore has the potential to lead to major effects on the cost of living related to the price of this item. The future effects of climate change on food prices are, however, rather complicated to assess. First, there are a very large number of effects to consider. These involve potentially negative effects (e.g. from lower rainfall and/or increasing variability) but also potentially positive effects (e.g. from CO2 fertilization and from extended growing seasons), as well as complex chains of effects from the changing risks of extreme events, the range and prevalence of pests and disease, etc. These effects vary strongly with the existing climate and current location. They also vary strongly with crop type, management practice (including irrigation), as well as with the exact future changes that arise, notably in relation to changes in precipitation and climate variability. Second, changes in agricultural production involve rather complex transmission mechanisms through to the changes in prices that households are likely to experience under climate change. Much of the food purchased in the UK is part of global supply chains, and thus the consideration of how climate change impacts on these requires analysis of changes in production globally and the effects on trade. These, in turn, should be viewed within the wider context of food policy more generally, including farm support, food security and production technology developments.
Effects of climate change There is a large literature on the potential effects of climate change on agriculture, which shows a very large range of potential outcomes (including both positive as well as negative effects),
though a general finding is that significantly negative effects are likely after 2050 or above 2C of warming (Porter et al, 2014). However, the key issue for this study relates to how changes in agricultural production feed through to prices, and the affordability of household expenditure on food. The CCRA1 (Defra, 2012, see Appendix 1) did consider the agriculture sector, and reported some positive ‐ as well as negative ‐ effects on UK crops. The econometric analysis completed for this study (Appendix 4) has also looked at the observed correlation between the climate of the UK and food prices, finding changes in temperature variability negatively affect agricultural prices. It found that the prices of bread and cereals fall as mean temperatures increase, but prices increase when temperature extremes occur.
12
However, neither of these approaches takes into account the international effects of current and future climate on UK food prices. This is important because the UK is not self‐sufficient in food production, and most production is linked to international markets (and prices). Indeed, the UK imported £39.5 billion of food in 2014 – twice the value of food exports (Defra, 2015). For this reason, the analysis here draws on the review of the effects of climate change on agriculture from the assessment of international impacts (Appendix 3). This addressed the question of how changes in agricultural production feed through to prices (and household affordability of food in the UK) and how food prices may vary due to the future effects of climate change. The assessment first reviewed the relationship between current weather shocks and global food prices. This found an observed pattern between climate shocks and international food prices. This was extended to consider the link with UK household expenditures, as reflected by changes in UK food prices, during periods of higher international prices. The analysis revealed a link between the global price and UK consumer price of food. The analysis then looked at the potential effects of climate change on global agriculture. As highlighted above, this is challenging, and results vary strongly with study, assumptions, etc. For this study, the analysis drew on the most recent comprehensive review and synthesis of the literature on the global impacts of climate change on agriculture (Agricultural Model Inter‐comparison and Improvement Project ‐ AGMIP) and the main results which were reported in Nelson et. al. (2013). This study compares the outputs of seven economic models – three economy‐wide (general equilibrium) models and four agricultural market‐specific (partial equilibrium) models – from simulations that consider the yield output from climate change in the year 2050 for a common climate scenario (a high emission scenario, RCP8.5) and a common reference socio‐economic scenario for population and GDP (SSP2). The inter‐comparison also used seven scenarios of biophysical crop yield changes under climate change – based on a combination of five different crop models and two general circulation models. Yields of four crop aggregates—coarse grains, oil seeds, wheat, and rice— were modelled. On average, the Nelson et al study estimates that global food prices under climate change will increase by 20% by 2050, though with a considerable range (0% to 60%, although this relates to the agricultural modelling uncertainties only, and does not include alternative future scenario or climate model uncertainty range). The results of these two elements – the rise in UK food prices resulting from changing international prices, and the implied 20% (average) price rise in global prices under climate change ‐ was used to provide an initial estimate of the potential effect of climate change on UK household food costs. This assumes linear responses (including consumer responses) and a very large number of assumptions (see Appendix 3), and so can only be considered as indicative. It also assumes that the modelled food items in Nelsen et al. (2013) apply equally to the full basket of food types consumed in the UK (including foodstuffs, processed food and non‐alcoholic drinks). Nonetheless, the results indicate the changes in the food bill for an average family could be important, with the results indicating a rise of 9% (with a range of 0%‐28%) in 2050 with climate change (assuming all other things being equal, i.e. future climate change projected onto current conditions). The average weekly household expenditure in the UK in 2014 was £517.30, with the amount spent on food and non‐alcoholic drinks being £58.80 (11% of average household expenditure). This increase therefore equates to an effect of‐ £275/year (with a range of 0 to ‐£856), indicating a modest to substantial increase in household expenditures.

13
Distributional effects Food is a major household expenditure item and a core human necessity. Importantly, low income households spend a greater proportion of their household expenditure on food and non‐alcoholic drink (16% for the lowest income decile) than the average household (11%), so the impacts of higher food prices will have a disproportionate impact on these groups. Food is also rather inelastic, i.e. families will still purchase similar quantities of food if prices go up, which in turn reduces their available income for other items. Nonetheless, there is some response in purchase volumes as a result of higher prices. An analysis of these distributional effects finds that while the average family food bill would increase by 9% (with a range of 0%‐28%) with climate change, the bill for the lowest income decile would rise by 13% (with a range of 0%‐39%), given the composition of the typical food bills of these two groups (i.e. while . This suggests that for a low income decile family, the projected climate effect on food prices would add about 2% to overall household costs, with a range from 0 to 6%. This compares to an effect on all households of around half this amount: with climate change adding 1% to household costs, with a range from 0 to 3%. This highlights the disproportionate impact of food price rises on the poor, reducing income left to spend on other items (although changes in future household income also have to be considered). The econometric analysis (Appendix 4) also found that expenditure on basic food items shows that the climate has more significant effects on poorer members of society, especially the climatic effects, such as flooding and extreme heat events, relevant to food production.
Energy The existing climate already influences the use of energy in the UK, because of the major influence of temperature on the heating demand for buildings. The warmer temperatures from climate change will have potentially large effects in reducing household energy demand and therefore costs for winter heating. However, at the same time, there will be higher temperatures in summer, which will increase the potential need for cooling (or otherwise lead to lower comfort levels from increasing building temperatures). Alongside this, there are already policies in place in the UK for reducing greenhouse gas emissions. These are affecting households through charges on energy bills. While these costs do not arise as a direct result of climate change, their inclusion recognises the UK’s international commitment to tackling climate change, noting also that the level of future impacts in the UK (and thus the impact of climate change on the cost of living) are determined by the amount of international mitigation that occurs.
Effects of climate change The costs of electricity, gas and other fuels are a major component of current household expenditure (5% of average household expenditure). A large proportion of this is for winter heating. Climate change will lead to warmer winters, which will have benefits in reducing the costs of heating (this can be called an impact, but is also private autonomous adaptation). This benefit is largely due to the high levels of current energy demand, the high cost of heating in the UK and the large fall in heating demand anticipated. There is a high confidence in the direction of change (i.e. in this benefit), although considerable variation in the exact level of change and the household level benefit. The analysis in CCRA1 (Appendix 1) estimated the potential costs of the reduction in winter heating demand. These estimates have been updated here using current DECC retail (market) prices for energy costs (2013 values), rather than the values used in CCRA1

14
(DECC government appraisal values, which were based on the long‐run variable cost of energy supply rather than the costs paid by households). By the 2020s, the benefit from the reduction in winter heating costs (on average) is estimated at +£87/household/year (for a central projection, with a range from +£38 to +£135 for low and high warming scenarios), rising to +£135/ household/year by the 2050s (with a range from +£58 to +£226 for low and high scenarios and model uncertainty). This compares to current average expenditure of around £500/household/year. The benefits are modest, but important. However, these changes assume static prices and current socio‐economics. Energy costs to households will change in the future, with low or high price scenarios, with low or high growth scenarios, and critically on the implementation of mitigation policy (overall and at the household level). For example, even in the 2030s, prices are around 25% higher under DECC’s high price scenario. This highlights that future prices (for the same unit of a good or service) may be very different from today, and that a degree of self‐consistency is needed: future prices will be determined by the level of future mitigation, which in turn will affect how large the impacts of climate change are in the future (in the 2050s and beyond). There is also the issue of how much the building stock is improved in terms of energy efficiency, and under more aggressive uptake scenarios, this would dominate future reductions in winter heating demand (compared to any benefits due to climate change), noting that major changes in building stock/retrofitting will be needed to deliver the UK’s 2050 carbon targets. However, at the same time that winter heating demand decreases, there will be higher summer‐ temperatures. Because the UK is a temperate country, there are currently low levels of cooling and air conditioning in place today: cooling of buildings is estimated to be around 4% of electricity demand (Day et al., 2009) and cooling equipment is only fitted in around 3% of houses. Nevertheless, even under future warming scenarios, the increase in demand (cooling degree days and energy for cooling) is likely to be lower than the reduction in winter heating. However, cooling is more expensive to deliver than heating, as it relies on electricity: thus it is important to consider the change in costs rather than just the change in energy. The costs of increased cooling (demand) were only considered indicatively in CCRA1, and this reported that the estimated costs were broadly an order of magnitude lower than the changes in heating demand, i.e. in the range of ‐£3 to ‐32/household/year in the 2050s (for a low and high scenario), though rising quickly thereafter. However, more recent estimates (compiled as part of the CCRA2 review, Kovats and Osborn, 2015) indicate much higher levels of cooling demand are possible in the UK, driven by rising temperatures and heat‐extremes, and the low cost/marketing of air conditioning. These studies also report that the UK housing stock has not been designed with higher temperatures in mind, and already around 20% of households in the UK experience overheating during relatively cool summers. This is likely to be a growing issue, with warmer temperatures and heat extremes, especially for some properties. Overheating risks exist for a wide range of properties, and the factors involved are complicated (BRE, 2014), but higher risks are apparent for some dwellings built in the 1960s, some top‐floor flats (especially conversions), but also some new build homes, and particular locations (notably London) due to the urban heat island effect. It is also worth highlighting that as well as the higher cost of cooling (which is more expensive per unit delivered), increased cooling demand will involve the incremental purchase of air conditioning units/cooling systems (which are not currently in place, unlike heating systems), presenting additional costs to households. The estimates from CCRA1 are therefore likely to be an underestimate, but further work is needed to assess an updated figure. Finally, there are important costs of mitigation policy (see Appendix 2 for more information) that
15
could potentially increase household energy costs. This is an area that has been comprehensively covered in previous studies. The UK currently has several climate change mitigation policies and these potentially affect electricity and energy costs and, in turn, household bills. There are two major studies that have assessed the costs of these policies, by the Department for Energy and Climate Change (DECC, 2014) and the Committee of Climate Change (CCC, 2014). DECC estimated that (mitigation) policy measures together would cost an average dual‐fuel household £188 extra a year, while helping to save £276 in 2020, leading to an overall saving of £92 in 2020 in a scenario with climate change policies compared to a scenario with no policies (2014 real prices). The Committee of Climate Change (CCC, 2014) reported that meeting the carbon budgets would add policy costs to a standard dual‐fuel bill (representing 87% of UK households) of £160 in 2020 (in 2013 prices) or £45 more than in 2013. Climate change mitigation policies would lower wholesale costs to £940 (a decrease of £85 pounds from 2013), and generate potential savings of £80. This is lower than the DECC’s estimate – although the two studies used slightly different approaches. Both studies therefore estimate that the costs to households from mitigation policy will actually fall. While both these studies suggest energy costs for households will fall due to policy measures, these findings are predicated on previous Government policies, some of which were removed during 2015. This includes the removal of the Green Deal and the new zero carbon home standard, as well as plans to replace the Energy Companies Obligation, and a reduction in the budget of the Renewable Heat Incentive. These changes may affect the potential energy savings outlined above. While they are expected to be replaced by other policies, there is no detail on what these will be, and thus the effects on energy savings and household costs are unclear.
Distributional effects It is clear that changes in energy costs will affect households differently. Lower income households allocate a higher percentage of their total expenditure to energy relative to the wealthiest households, with the cost of living survey reporting 9.6% of total expenditure for the former (the lowest income decile) compared to 3.6% for the latter (the highest). The reduction in winter heating will therefore have disproportionately large benefits for the poorest households, as heating is a necessity (i.e. heating demand is quite inelastic and demand does not change much with higher prices, thus the price elasticity is close to zero). Increasing energy prices can result in lower income households reducing their energy consumption somewhat, decreasing comfort levels. As low income households currently spend a higher proportion of their available income on fuel, as the demand for heating reduces with climate change, this will increase income available for other spending. For cooling, the picture is more complex, because the ownership of air conditioning is strongly income dependent (there is a strong correlation between income and air conditioning (AC) appliances (Isaac and van Vuuren, 2008), and demand for electricity for cooling is likely to be more elastic. The take up of air conditioning (AC) is likely to be extremely low amongst low‐income groups, and instead they will experience higher temperatures and impacts on economic welfare as temperatures increase (lower comfort levels, and potentially higher health impacts. Indeed, studies from the US report reduced heat related impacts among those with air conditioning (Ostro et al, 2010). There are also some types of housing, which are poorly designed and subject to greater overheating (– see previous section). These heating and cooling patterns will also have a strong geographical pattern across the UK: winter heating demand (and thus benefits) will be greatest in Scotland and the North, while summer cooling demand will be greatest in the South and particularly in London.

16
Finally, for the policy costs, there are strong distributional patterns. The DECC and CCC studies above – which report positive effects from current policies on energy bills ‐ have implicit assumptions about the level of uptake of energy efficiency, i.e. policies such as the Green Deal or the effectiveness of industry obligations (from the ECO), which in turn lead to the reduction in household energy costs reported. Indeed, Preston et al (2013) estimated that climate change policies would benefit high‐income households the most: the highest decile group would see a greater reduction in their bills, both in absolute terms (of £182 or more than double that of the lowest decile group of £69) and as a percentage of their bill, compared to a scenario with no policies, (a reduction of 12%, or 5% more than for the lowest income decile). In contrast, the uptake of options would ordinarily be expected to be lower among low‐income or vulnerable groups, e.g. due to access to finance or their interest in finance orientated measures such as the Green Deal. However, this has been partly addressed with policies aimed at regulating the efficiency standards of the social housing stock; and low‐income pensioners are the largest recipient group of policies to subsidise fuel bills, such as the winter fuel payment (WFP), the cold weather payment (CWP), and the warm home discount (WHD) (IFS, 2013b). There is also another factor of relevance. The policy costs cited above relate to average households, which in the UK are primarily fuelled by gas (central heating). The costs of mitigation policies on households that heat their homes using electricity (7% of UK households) are considerably higher. Electrically heated homes consume three to four times as much electricity as the average dual‐fuel home (CCC, 2012), and CCC (2014) estimated the policy costs for these households could increase by £210 by 2020 (out of a total bill of £1,025) and to £360 by 2030 (out of a total bill of £1,255). Increases could be higher in certain regions, such as Northern Scotland, where the costs of low‐carbon policies for the electrically heated could reach £390 by 2030. Critically, a large proportion of the fuel poor in England use electricity as their main source of energy (including prepayment for electricity which is expensive). They include off‐gas households with older occupants (338,000 households), and households in small, urban flats, living in predominantly electrically‐heated rented dwellings (almost 400,000 households) (CSE, 2014). The CCC (2014) reports that if the energy efficiency measures foreseen by the fourth carbon budget are not targeted to the fuel poorv, then numbers in fuel poverty will sharply increase, from 5.6 million in 2013 to an estimated 8 million in 2030. Note, however, that households that use electricity for heating will also see the largest benefits from the reduction in winter heating demand as a result of climate change. As highlighted above, the changes in energy policy announced in 2015 (Budget and Autumn Spending review 2015) will lead to potential changes, but until any policy replacements are announced, it is difficult to know what impact they will have. Nevertheless, a key conclusion is that without new explicit policies that address distributional aspects, there is the potential for large negative impacts to fall on low income households.
Housing (flooding and insurance, maintenance and repair) There are a number of potential effects of climate change on housing and indeed, this includes some of the largest impacts among any considered. However, the patterns through which the impacts of climate change cascade through to household costs are complex. The primary effect here is from flooding (from coastal, river and surface water floods). However, it also includes other aspects where climate is a factor, such as wind‐storms and subsidence.
17
Effects of climate change Floods are among the most important weather‐related loss events in the UK currently and can have large economic consequences. Climate change has the potential to increase the economic costs of these events, and as identified in CCRA1 (Defra, 2012), these are likely to represent one of the largest impacts in the short‐ and medium term. These events directly affect households, but the costs that are experienced involve more complex pathways, as in practice, most of the flooding cost will be borne by insurance companies. The pathway to cost increases to households is therefore rather complex, feeding through to higher insurance payouts, and in turn to changes in risk that are then captured through higher insurance premiums. Note that there are also economic welfare effects from flooding (captured in the health section). The estimated costs of flooding at the aggregate national level) were estimated in CCRA1 and updated by the CCC (ASC, 2014) and mostly recently for CCRA2 (Sayers et al, 2015). These provide estimates of the future economic costs of floods on residential properties, expressed as an equivalent annual damage, to take account of the probabilistic nature of these events. These studies also estimate the costs of floods on non‐residential buildings, as well as the indirect losses in other areas of the economy.
The latest study (Sayers et al, 2015) estimates future damages for a 2C and 4C pathway, and also for a High ++ scenario (a more extreme scenario that includes higher sea‐level rise). The estimated national costs of flooding for residential properties in the UK are equivalent to an
increase (above baseline) of ‐£1 to ‐£5 per household per year by the 2020s (for a 2C and 4C scenario respectively), with an upper value (High ++) of ‐£9. These increase to ‐£4 to ‐£11 per
household per year by the 2050s (for 2C and 4C) with a high++ estimate of ‐£37/household/year. These increases are additional to the current risk levels, which equate to around £13/household/year. However, the analysis also reports that flooding will lead to indirect effects that will be much higher than the direct costs alone (see later section). These estimates indicate a minor to modest increase in impacts (if passed through) to household budgets. However, over time, there is the likelihood that more substantial insurance premiums will be passed through to those most at risk. This is particularly important as flooding is a climate impact which can have a very large impact on an individual household, i.e. those households directly affected may face substantial costs. The individual household cost is therefore more relevant than the average in relation to social vulnerability. Further discussion on insurability and the impacts of repeated flooding is included in the distributional section below. In addition to costs associated with flooding, there is also a smaller cost on households from the increase in subsidence due to climate change. The pathway for this impact is similar to floods (via insurance), but the overall impact is much lower. The average costs, at ‐£2 to ‐£4 per household on average by the 2050s, would fall into the negligible category, or <£50 a year/household, though again the costs to individual households affected is high. There is the potential for other effects on housing costs, notably if there are changes in wind‐storms under climate change: however, the current evidence base is not robust enough to estimate the potential change in risks.
Distributional effects There are a number of distributional aspects with respect to flooding. First, there are differential patterns of exposure to risk. Deprived (generally lower income)

18
communities are disproportionately exposed to the risk of coastal flooding, where there is a high correlation between risk and deprivation (Defra, 2012). At the national level, the CCRA1 found that some of the areas that are at particular risk of flooding, in Yorkshire and the Humber and the East Midlands, are areas that have (relatively) high levels of deprivation/lower average incomes. It is also likely that low income groups may be more adversely affected, in that their financial resources to prepare for or recover after being flooded are lower, affecting their adaptive capacity. The latest analysis of UK flood risks (Sayers et al, 2015) estimates that there are 1.8 million people currently at a 1 in 75 (year) risk of flooding, of which 320,000 are in deprived areas. The increased risk of flooding ‐ under climate change ‐ for these deprived areas by 2050 (current population)
increases by 26%, 60% and 110% (for the 2C, 4C and High ++ scenarios respectively), which is a slightly higher percentage increase than for the overall population at risk. This increase (in deprived areas) is important because adaptive capacity may be lower. There are also differentiated patterns of flood protection in place. As highlighted by the CCRA1, London has a higher standard of protection than elsewhere in the UK (with an annual probability of flooding of 0.1%, or 1 in 1000 years). In other areas, there is a much higher risk of flooding. The distributional effects of floods on households will also be mediated by their take up of insurance, which in turn will be influenced by insurance costs and affordability. The 2014 UK Living Costs and Food Survey reports that insurance represents less than 1% of total expenditure for the lowest decile group (0.8%) as well as for the highest (0.9%). However, the Association of British Insurers (ABI) (2010) (based on the 2010 LCFS) reports that almost 40% of people in the lowest decile did not have any insurance at all in 2010, compared to 2% in the highest decile group. Low income households are also unlikely to invest in the costs of household measures to reduce flood impacts, as while the benefits of these are high, they involve up‐front costs (Grant et al. 2011). Tenure is also important, due to the different incentives for owner occupiers, landlords and tenants. While owner occupiers will be responsible for both building and contents insurance, tenants will typically rely on landlords to insure their buildings, while being responsible for their own contents, although some social landlords may offer discounted insurance with rent schemes. There is some information on insurance take‐up by tenure (Flood Re, 2016): mortgage lenders in the UK require their customers have building protection, which includes cover for flooding, thus take‐up of insurance is as high as 98% for homeowners and coverage of households at‐risk of flooding is similar to that of those not in risk areas. Take‐up for renters is lower, with only around half of these households having insurance, and take‐up in at risk areas is only marginally higher at 55% (compared to 46% in non‐flood risk areas). In the event of flooding, the impact of an event on an uninsured individual household (owner occupier) will be extremely large, both in terms of direct costs and economic welfare (well‐being). The cost of a flood event depends on depth, duration and velocity of the flood as well as property type, but the average insurance claim per domestic property has most recently been reported by the ABI at £50,000, higher than previously when it was £23,000‐£30,000 (Appendix 1). Even for those living in rented accommodation, the costs of an uninsured flood on home contents will be high, and there is also the issue of finding alternative accommodation and expenses incurred when damage to the rental property is repaired. The combination of low levels of insurance cover amongst the poorest households, and the potentially very large impact of an uninsured flood, has the potential for dramatic impacts on households in relation to the 4Ps of poverty

19
(even if households borrowed to offset costs, this would lead to a substantial reduction in household expenditure). It is clear that when considering the estimates of the number of properties in deprived areas at risk of flooding, and assuming current levels of uninsured properties (structural or contents) among low income households living here (ABI, 2010), that the number of low income households that could be affected dramatically from future climate induced flooding could be very significant. The increase in the population in deprived areas that will experience flooding under climate change therefore becomes a critical issue. The implications of these effects will be determined by how the UK household insurance market evolves, and the policies introduced by Government. Currently, the proposed Flood Re scheme, (a collaboration between the insurance industry and the Government, due to commence in April 2016) will cap the cost of insurance to households in high risk areas. It will use a banded system, with premiums increasing according to council tax band, to provide affordable cover (though note houses built since 2009 are excluded to prevent building in high flood risk areas). However, as Flood Re is only in place for 25 years and is expected to support a transition to market prices which reflect risk, this could have very important implications for future access to insurance for low income households – at the very time that risks start to increase significantly. There are also issues with the nature of the insurance agreement and the planned level of Government investment in flood protection, which could alter the future landscape. Although the eligibility for Government flood finance takes account of the Index of Multiple Deprivation, policy is seeking to leverage other source of funds (partnerships) to meet the necessary flood protection investment levels. Analysis in a recent JRF report (England and Knox, 2015) highlights that, in practice, there is not such a strong link in levels of funds being directed to areas with higher deprivation and higher flood risk. Finally, flooding could have potentially large impacts on property prices (Pryce et al, 2011). When flood events are rare, house prices may fall initially but recover following repair. However, when events occur frequently, and there is insufficient time to recover, house prices may remain lower (effectively flood damages start to be capitalised into house prices). As there is the potential for climate change to increase flood frequency, potentially significantly for some high risk areas, this effect is potentially important. This may be a particular issue where current (or planned future) protection levels are lower. There will be similar insurance related issues with subsidence for owner occupiers. The unit values in the CCRA1 for a case of subsidence used a value of £10,000 (see Appendix 1), although the ABI reports the average cost of dealing with subsidence is running at £6,900. Irrespective of the exact value, there is potential for large costs, and, again, there may be lower insurance cover levels for low income (owner occupier) households. Overall, there is therefore a strong distributional profile to risks, in terms of exposure, protection levels, and differential levels of take up of insurance, which will affect the costs borne by households directly.
Water supply Climate change is projected to have a significant impact on water cycles. This will potentially lead to a number of changes in risks. This includes more frequent and/or intense floods (covered in
20
the previous section on household costs), and changes to the water supply‐demand balance, including potential water deficits and potential changes in water quality.
Effects of climate change Water charges are around 2% of average household expenditure currently. However, while climate change may have potentially important impacts on the supply and availability of water, the regulated nature of the UK’s water sector means that any impacts on household costs are indirect and passed on through water bills. The CCRA1 looked at estimates on the amount of water available for abstraction – and compared this with demand forecasts to estimate when resource zones might fall into deficit. The resulting water deficits were valued using supply‐side cost data, as a proxy for the economic welfare value of water. These were estimated at‐£9/household/year by the 2050s (for a central projection, with a range from ‐£3 to ‐£14 for the low and high warming scenarios), thus the changes are negligible when compared to current household expenditure. This assumes the current structure of the sector and that the increases in supply side costs from measures taken by the water companies (under most scenarios) would be passed on in the form of water charges to customers. Note that for households with water meters, there would be the potential for changes in demand as a result. The costs above would then translate into additional direct costs to households. It is highlighted that this was one area where the uncertainty is large. There are also geographical patterns of risk across the UK, with the south more potentially at risk. CCRA2 has updated the water demand‐supply deficit for the UK. The pattern of projected supply‐demand deficits is approximately the same as the original CCRA analysis, with the greatest deficits in England, particularly London and the north east. Such deficits are projected to become more acute and widespread in the 2080s and would present significant challenges in most parts of the UK, but particularly across England. There are some differences in the volumes of deficit calculated, with CCRA2 projecting slightly less severe deficits than the first CCRA analysis, but in terms of costs, the overall results are broadly similar.
Distributional effects The lowest income decile household spends 2.9% of their budget on water supply services compared to 1.2% for the highest decile, and 1.7% for the average UK household. The increases in costs associated with additional supply side measures would therefore impact more strongly on these low income households, especially those with higher needs (Benzie et al, 2011). In cases where the structure of the industry changed, or even if there was more water metering, this might have stronger distributional impacts, unless distributional effects were taken into account in tariffs or through other policies.
Health As health care costs are largely covered by service providers (e.g. NHS and health facilities), the additional effects of climate change on health do not feed through to changes in household expenditure, other than through general taxation (noting that climate related impacts are negligible when compared to the total health burden). However, these effects have much more significant impacts with respect to people’s health and well‐being (or ‘economic welfare’ costs). These effects can be valued in economic terms from the perspective of social welfare, to capture the wider costs and benefits to society as a whole. Three

21
components are included for such valuation: the resource costs i.e. medical treatment costs; the opportunity costs, in terms of lost productivity; and the dis‐utility i.e. pain or suffering, concern and inconvenience to family and others (the latter derived through elicitation techniques such as contingent valuation and stated preference). While some care must be taken in comparing these non‐market costs to the earlier sections, their inclusion provides a way of comparing these additional impacts using a common metric.
Effects of climate change The most measurable effect of climate change on health – at least in economic terms – is the change in temperature related mortality. Higher temperatures increase the number of fatalities, an effect which is heightened during prolonged heat‐waves (as observed in the European 2003 summer). However, in a temperate climate such as the UK, there are also additional fatalities during colder periods. CCRA1 (Defra, 2012) reported a large direct benefit from warmer winters in reducing cold related mortality and morbidity, but also an impact from increased summer temperatures and heat extremes. It reported that the cold‐related effects (and costs) outweighed the heat related costs by some margin, though the difference narrows in the longer‐term after mid‐century. The change in the risk of mortality was monetised using the recommended approach in Government economic appraisal, with adjustments for the climate change context (HMT, 2007: Defra, 2012) The temperature related mortality health estimates were updated as part of the ASC (2014) report, and these health impacts – when monetised using the same unit values as the CCRA analysis – indicate much higher costs. The increase in heat related mortality is equivalent to an average household cost (noting this is a social welfare cost, not one borne by the household) of ‐£0.4/household/year in the 2020s rising to ‐£1.4/household/year in the 2050s (for the central projection), although this is still lower than the benefits from decreased winter mortality (+£1.2/household/year in the 2020s rising to +£3.6/household/year in the 2050s for the central projection)1. More recent assessments (Hajat et al. 2014) seem to indicate a lower reduction in cold related deaths (partly driven by an ageing population). Irrespective of this, when other health costs (from CCRA1, Defra, 2012) are included, climate change is estimated to lead to overall net health costs (in economic terms) from climate change (i.e. the overall economic impacts from heat‐related and other impacts are larger than the reduced cold‐related benefits). These additional health costs include flood related deaths (a further ‐£0.9 and ‐£1.9/household/year as a societal welfare cost per average household in the 2020s and 2050 (central projection), flood related injuries (a similar order), and ozone related deaths, skin cancer cases and mental stress from flooding (which were all low in terms of economic costs when compared to temperature related mortality). It is stressed, however, that while the aggregate social welfare impact of these health effects are low relative to other impacts identified in this report, they lead to very large effects on a small number of individuals. Expressing aggregate effects in monetary terms cannot adequately compare the impact of more people getting seriously ill and even some additional fatalities with changes in average expenditure on home energy. It is therefore inappropriate to add these costs together to produce an aggregate impact
1 There is an issue with the valuation of the change in the risks of fatalities, which introduces a large additional range. The approach used in CCRA1 uses an extremely conservative valuation for the additional fatalities from heat and cold related mortality, as it adjusts for the period of life lost and uses a value of life lost. This results in a value for a fatality that is a factor of 15 lower than used for the valuation of traffic fatalities in standard transport appraisal in the UK. The use of these adjusted values remains controversial, and the use of the full value of a prevented fatality would increase the health related impacts into the minor category.

22
of climate change.
Distributional effects Direct health costs are not a large direct expenditure item, and indeed high income households spend more on health than low income households (presumably due to private health care). Some of the additional health impacts might therefore affect high income households more (in the form of higher taxes, or higher health insurance). The health impacts do, however, have distributional impacts, with some larger impacts on low income households, though these will include beneficial as well as detrimental effects. First, vulnerability to health impacts, particularly heat and cold‐related mortality, is higher for certain population groups, notably the elderly, those with existing health conditions and those with access to low levels of social care. These vulnerable groups tend to involve a higher proportion of low‐income households. This is a particular concern as it means major life changing impacts (including death) are more likely in vulnerable groups. One additional area of inequality that may arise under future climate change is for heat‐related mortality, as there are lower rates of heat related mortality and morbidity (in other countries) in households with air conditioning, which itself is strongly correlated with higher income (Ostro et al, 2010). However, while there will be greater impacts from heat related mortality on low income households, there will be greater benefits for similar groups from reduced cold‐related mortality, again to more vulnerable groups. For morbidity, where costs arise, such as the lost time at work, it may have greater impacts on low income households due to temporary work contracts.
Wider economic effects, welfare costs and the 4Ps As well as the impacts of climate change directly on households, there are a number of impacts that will affect business, industry and the wider economy. These include domestic impacts (Appendix 1) and international effects and supply chains (Appendix 3). These have the potential to affect households indirectly, either by increasing the costs of goods or services, or in affecting their prospects in relation to employment.
Other direct and indirect costs A large number of other direct and indirect costs have been identified from national level analysis which could have some impacts on household costs. Indeed, the CCRA1 identified 700 potential risks / opportunities from climate change, of which 50 or so were considered to have medium or high consequences by the end of the century. Many of these effects could not be quantified or valued and thus the analysis of household costs above can therefore only be considered partial. Some of these omissions are potentially large. There are a set of important economic impacts from climate change on non‐household categories. The most important of these for the UK, as identified in CCRA1 (and updated in CCRA2) – is the costs of flooding on non‐residential buildings and the additional indirect effects, i.e. flooding of energy infrastructure, transport infrastructure, agriculture, etc. As an example, the estimated annual costs of flooding on non‐residential properties were 2‐3 times larger than the costs of flooding for residential properties at the UK aggregate level (Sayers et al, 2015), and when the costs of indirect flooding (public infrastructure damages, transport disruption, etc.) as well were included, these increased to 5‐6 times more than residential flood damages alone. To illustrate, while the costs of residential flooding – expressed per average household – range from ‐£4 to ‐£37 per household per year by the 2050s
(from a 2C to high++ scenario), if the total direct and indirect costs of flooding are included,
23
these increase to ‐£19 to ‐£174/household/year. However, it is unclear quite how these costs will pass through to households, i.e. whether this will be in the form of higher prices for goods and services, changes in employment or pay, or changes in location (place) such as disinvestment from high flood risk areas, and thus it is difficult to know how it will affect household living costs. In principle, macro‐economic models now exist that could trace the effects of national and global climate risks and associated trade disruption on UK domestic markets, and ‐ by extension – on households. An example is the GTAP Multi‐Regional Input‐Output (MRIO) model developed by Owen and Barrett (2013), which offers a comprehensive study into trade dependences associated with UK consumption. However, further work on these transmission mechanisms is still needed to produce quantitative effects. What is likely, all other things being equal, is that climate change‐induced risks will result in higher market prices for households. This will be the case where there is some constraint in the supply of goods to market resulting from a climate risk. There are also a large number of small additional impacts (and costs) which will add to the major categories above. While individually these may have negligible effects on household budgets, when considered in aggregate, they could be important.
Macro‐economic effects of climate change As part of the econometric analysis (Appendix 4) the analysis found a number of current relationships that exist between the macro‐economy and climate variables. These relationships indicate that future climate and associated macro‐economic sensitivities will have implications for households at the micro‐economic scale. There is strong evidence that increased average precipitation reduces prices, whilst an increase in the difference between the minimum and maximum temperature produces a significant rise in prices. However both effects are relatively small, with a 1% rise in precipitation producing a 0.002% fall in inflation. An explanation for the first of these findings is that as precipitation increases water availability for agriculture and industry, this enables added productivity across the economy. In relation to the second finding, as the temperature becomes more variable, it is likely that prices rise and so it becomes more uncertain what the weather is likely to do and more difficult to plan ahead, reducing production and increasing prices across the economy. There was also found to be an effect of precipitation on recreation which is significant: clearly as it rains more, there is less demand for recreation, so there is a fall ‐ or less of an increase ‐ in prices. It is also possible that extreme weather events will have impacts on the macro‐economy. Appendix 4 explores the possibility of a link between a heavy precipitation event – in this case the Summer floods of July 2007 – and prices. There does indeed appear to be a potentially causative positive relationship between the flood event and higher prices later in the year and in 2008. This hypothesis is supported by other evidence that found that over 42,000 hectares of farmland were flooded in the three main regions affected, namely Yorkshire and Humberside, Worcestershire and Gloucestershire, and Oxfordshire (Environment Agency, 2010). The total cost of lost agricultural production was £48.5 million, of which £34.3 million was arable production. It is therefore possible that this lost production, together with other disruption, resulted in an increase in the retail prices of foodstuffs to which this production was an input. However, evidence of this form of relationship has not been found in other contexts we have investigated.
Wider welfare costs of climate change

24
Finally, there are a number of additional economic welfare costs that will arise from climate change. These do not directly affect household costs, but have potentially very large impacts for poverty. These include many elements of the wider set of 4Ps discussed earlier in the report. They also include impacts that affect the natural environment, such as on biodiversity and ecosystems, noting these provide major economic benefits to society (so called ‘ecosystem services’, which include: provision of food; supporting services, such as nutrient recycling; regulatory services, including flood protection; and recreational and cultural services, including tourism). The impacts on these ecosystem services will lead to a mix of direct, indirect and economic welfare costs (e.g. affecting food production and prices, flood damage protection and damage costs, and economic welfare as captured through non‐market valuation). It is stressed that the focus of this study on household costs omits these wider economic and indirect effects, and it is difficult to even identify the potential societal welfare costs of these issues, due to the challenge of impact quantification. Nevertheless, the consideration of these additional impacts is critical in assessing the overall impact of climate change in the UK.
Distributional effects It is more difficult to assess how these effects will translate through to different income or societal groups. In cases where they increase the costs of goods and services, they may have a higher impact on low income groups.
25
3. Discussion and Conclusions
Overall, the study concludes that there are likely to be relatively modest impacts on the costs of living and household budgets in the UK from climate change up to the middle of the century, though potentially large increases in household costs thereafter. These effects are likely to be dominated by a small number of significant effects, with negative impacts – i.e. cost increases to household budgets – resulting from higher food prices, flood related housing costs and cooling demand, but positive effects – i.e. reduced costs – from reduced heating demand. The results are summarised below, indicating the potential impact on various household budget items, and highlighting where there are potentially larger impacts on individuals and distributional effects, with greater effects for low income households. It is stressed that there is a considerable range of uncertainty around each category, which makes it inappropriate to provide an overall aggregation. Nonetheless, the results indicate a modest net cost for households overall, with potentially a substantial net cost under some high warming/impact scenarios. Further, these costs are likely to increase with higher levels of warming, potentially significantly so after mid‐century. It is highlighted that these results should only be interpreted in relation to the effects of climate change on household costs – not on household welfare and well‐being – and certainly not in relation to the total impacts of climate change to the UK or internationally. It is also stressed that the actual effects borne by households will be strongly influenced by future socio‐economic change (notably income levels), as well as general changes in the prices of goods and services, and so are subject to high uncertainty. Care should thus be taken in interpreting individual and especially aggregate figures. Perhaps more importantly, a clear and consistent finding is that low income households will be most affected by these climate change impacts, though they might also benefit most from the positives. In all areas, there are large and disproportionate impacts on low income households, either because of the reduction in the buying power of their disposable income (e.g. from rising food prices), a reduction in quality of life (e.g. from relative higher negative health outcomes) or because of differentiated patterns of risks (e.g. higher flood vulnerability), though low income households will also benefit most from reduced winter heating (increasing the real value of disposable income). The overall negative effects of climate change will have important impacts for low income households, even with the relatively modest changes expected in future decades, and could be substantial for the higher warming scenarios later in the century (although noting that the underlying socio‐economic situation is likely to be very different from today). Moreover, for some impacts, there are very large individual costs which are more likely to affect low‐income households, notably from the risks of uninsured flood losses. These will have major, life‐changing, consequences for those affected. Such shocks have the potential to increase the number of people in poverty (and even bring additional people into poverty) and the fact that the risks fall disproportionately on the most vulnerable groups in society is a particular concern. Finally, given these findings, a key issue is for the distributional impacts of climate change to be considered in national, regional and local risk assessments, and for these issues to be reflected when designing adaptation policy.
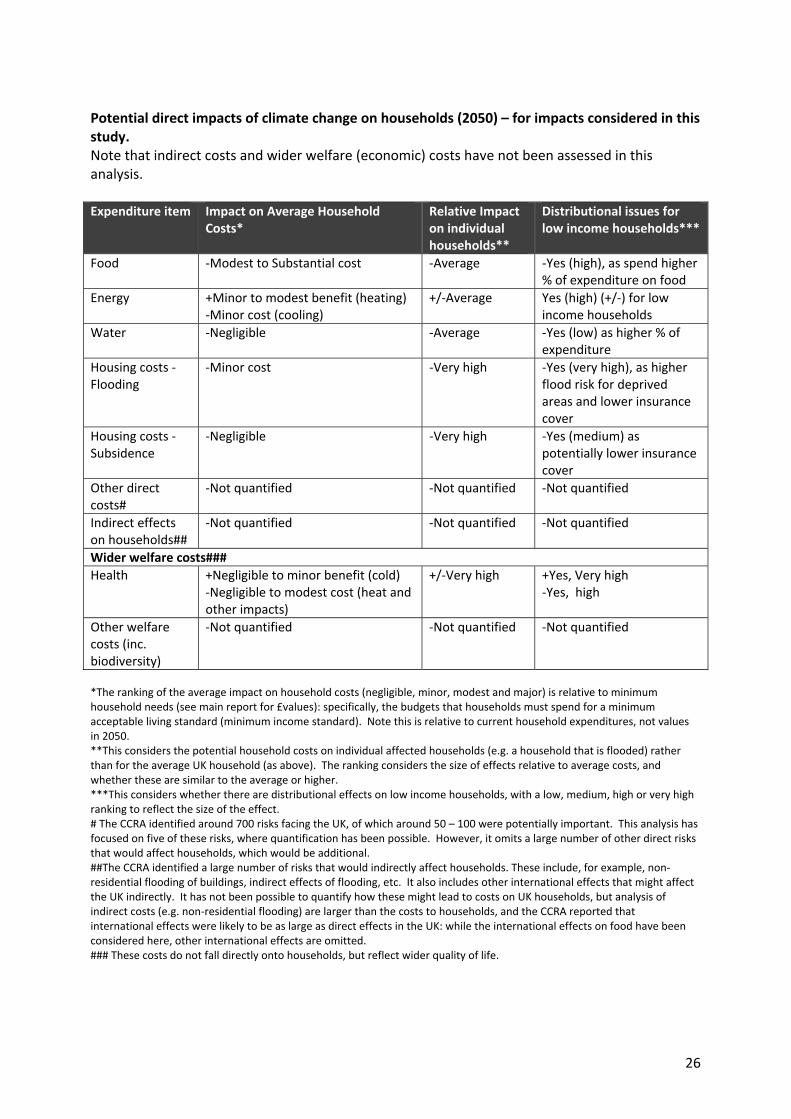
26
Potential direct impacts of climate change on households (2050) – for impacts considered in this study. Note that indirect costs and wider welfare (economic) costs have not been assessed in this analysis. Expenditure item Impact on Average Household
Costs* Relative Impact on individual households**
Distributional issues for low income households***
Food ‐Modest to Substantial cost ‐Average ‐Yes (high), as spend higher % of expenditure on food
Energy +Minor to modest benefit (heating)‐Minor cost (cooling)
+/‐Average Yes (high) (+/‐) for low income households
Water ‐Negligible ‐Average ‐Yes (low) as higher % of expenditure
Housing costs ‐ Flooding
‐Minor cost ‐Very high ‐Yes (very high), as higher flood risk for deprived areas and lower insurance cover
Housing costs ‐ Subsidence
‐Negligible ‐Very high ‐Yes (medium) as potentially lower insurance cover
Other direct costs#
‐Not quantified ‐Not quantified ‐Not quantified
Indirect effects on households##
‐Not quantified ‐Not quantified ‐Not quantified
Wider welfare costs###
Health +Negligible to minor benefit (cold)‐Negligible to modest cost (heat and other impacts)
+/‐Very high +Yes, Very high ‐Yes, high
Other welfare costs (inc. biodiversity)
‐Not quantified ‐Not quantified ‐Not quantified
*The ranking of the average impact on household costs (negligible, minor, modest and major) is relative to minimum household needs (see main report for £values): specifically, the budgets that households must spend for a minimum acceptable living standard (minimum income standard). Note this is relative to current household expenditures, not values in 2050. **This considers the potential household costs on individual affected households (e.g. a household that is flooded) rather than for the average UK household (as above). The ranking considers the size of effects relative to average costs, and whether these are similar to the average or higher. ***This considers whether there are distributional effects on low income households, with a low, medium, high or very high ranking to reflect the size of the effect. # The CCRA identified around 700 risks facing the UK, of which around 50 – 100 were potentially important. This analysis has focused on five of these risks, where quantification has been possible. However, it omits a large number of other direct risks that would affect households, which would be additional. ##The CCRA identified a large number of risks that would indirectly affect households. These include, for example, non‐residential flooding of buildings, indirect effects of flooding, etc. It also includes other international effects that might affect the UK indirectly. It has not been possible to quantify how these might lead to costs on UK households, but analysis of indirect costs (e.g. non‐residential flooding) are larger than the costs to households, and the CCRA reported that international effects were likely to be as large as direct effects in the UK: while the international effects on food have been considered here, other international effects are omitted. ### These costs do not fall directly onto households, but reflect wider quality of life.

27
Acknowledgements The work undertaken as part of this project received co‐funding from the European Community's Seventh Framework Programme, as part of the IMPACT2C Project (Quantifying projected impacts under 2°C warming, Grant Agreement 282746). The authors would also like to thank those who provided inputs and comments to the project; the report was greatly improved due to contributions from Donald Hirsch, updated flood damage costs from Paul Sayers, as well as from comments from the Project Advisory Group (Sam Fankhauser, LSE; Kathryn Humphrey, ASC; Peter Levell, IFS; Steven Wade, Met Office).

28
References Adaptation Sub Committee (2014). Managing climate risks to well‐being and the economy: ASC progress report 2014. ABI (2010) ‘Household Expenditure on Insurance 2010’. Association of British Insurers (ABI), 2013. Identifying the Challenges of a Changing World. The trends facing insurers towards the 2020s. Barthel, F. and E. Neumayer (2010) A trend analysis of normalized insured damage from natural disasters. Centre for Climate Change Economics and Policy. Working Paper No. 40. Munich Re Programme Technical Paper No. 5. Grantham Research Institute on Climate Change and the Environment, London. Belfield, C. et al., 2014. Living Standards Poverty and Inequality in the UK, 2014. IFS publication. Benzie, M et al (2011). Vulnerability to heatwaves and drought: adaptation to climate change. Joseph Rowntree Foundation, York. https://www.jrf.org.uk/report/vulnerability‐heatwaves‐and‐drought‐adaptation‐climate‐change BRE (2014). The Risks to Housing from Overheating. Report to Adaptation Sub Committee. https://www.theccc.org.uk/wp‐content/uploads/2014/07/2‐The‐risk‐to‐housing‐from‐overheating‐FINAL‐4_PDF_2‐with‐foreword‐BRE.pdf Centre for Research in Social Policy (2015) www.minimumincomestandard.org CIPS (2006) Supply Chain Vulnerability. www.cips.org Dailey, P., Huddleston, M., Brown, S. and D. Fasking (2009) The Financial Risks of Climate Change. Report by AIR Worldwide Corp. and the Met Office. ABI Research Paper No. 19. Department for Environment Food and Rural Affairs (DEFRA), 2012. The UK Climate Change Risk Assessment (CCRA). Presented to Parliament pursuant to Section 56 of the Climate Change Act 2008, Amended 23rd April 2012 from the version laid before Parliament on 25th January 2012. Defra (2012) Family Food 2011. http://www.defra.gov.uk/statistics/foodfarm/food/ Defra (2015) Food Statistics Yearbook 2014. https://www.gov.uk/government/uploads/system/uploads/attachment_data/file/423616/foodpocketbook‐2014report‐23apr15.pdf Defra, (2015). Affordability and availability of flood insurance. Final Report FD2688. Defra, London. England, K and Knox, K (2015) Targeting flood investment and policy to minimise flood disadvantage. Joseph Rowntree Foundation, York. https://www.jrf.org.uk/report/targeting‐flood‐investment‐and‐policy‐minimise‐flood‐disadvantage Environment Agency (2010) The costs of the summer 2007 floods in England Project: SC070039/R1. FAO (2011) The state of food insecurity in the world 2011. http://www.fao.org/docrep/014/i2330e/i2330e03.pdf Flood Re (2016). Transitioning to an affordable market for household flood insurance. The first Flood Re Transition Plan. Foresight (2011) International dimensions of climate change, Foresight Horizon Scanning Centre, Government Office for Science.

29
Grant Z. et al (2011). Research to identify potential low‐regrets adaptation options to climate change in the residential buildings sector. Commissioned by the Adaptation Sub‐Committee. Hajat, S., et al. (2014). "Climate change effects on human health: projections of temperature‐related mortality for the UK during the 2020s, 2050s and 2080s." Journal of Epidemiology and Community Health 68(7): 641‐648. Herweijer, C., Ranger, N. and R. E.T. Ward (2009). Adaptation to Climate Change: Threats and Opportunities for the Insurance Industry. The Geneva Papers, 34, 360–380. Hunt, A., Watkiss, P. and L. Horrocks (2009) International Impacts of Climate Change on the UK. Report to Defra. Report no. GA0208_8177_FRP (1). Isaac M., D.P. van Vuuren, 2008. Modeling global residential sector energy demand for heating and air conditioning in the context of climate change. Energy Policy 37 (2009), 507‐521. IFSL (2009) Fund Management 2009. IPCC, 2013: Summary for Policymakers. In: Climate Change 2013: The Physical Science Basis. Contribution of Working Group I to the Fifth Assessment Report of the Intergovernmental Panel on Climate Change [Stocker, T.F., D. Qin, G.‐K. Plattner, M. Tignor, S.K. Allen, J. Boschung, A. Nauels, Y. Xia, V. Bex and P.M. Midgley (eds.)]. Cambridge University Press, Cambridge, United Kingdom and New York, NY, USA. IPCC (Intergovernmental Panel on Climate Change) (2014), Climate Change 2014: Impacts, Adaptation, and Vulnerability, Contribution of Working Group II to the Fifth Assessment Report of the Intergovernmental Panel on Climate Change, Cambridge University Press, Cambridge and New York. Jenkins, G.J., Perry, M.C., and Prior, M.J.0 (2007). The climate of the United Kingdom and recent trends. Met Office Hadley Centre, Exeter, UK. Joseph Rowntree Foundation (JRF), 2014. A UK without poverty. Available at www.jrf.org.uk Lindley et al. (2011). Climate change, justice and social vulnerability. Joseph Rowntree Foundation, York. https://www.jrf.org.uk/report/climate‐change‐justice‐and‐vulnerability. Nelson, G. C., Valin, H., Sands, R. D., Havlík, P., Ahammad, H., Deryng, D., Elliott, J., Fujimori, S., Hasegawa, T., Heyhoe, E., Kyle, P., Von Lampe, M., Lotze‐Campen, H., Mason d’Croz, D., van Meijl, H., van der Mensbrugghe, D., Müller, C., Popp, A., Robertson, R., Robinson, S., Schmid, E., Schmitz, C., Tabeau, A., and Willenbockel, D. (2013). Climate change effects on agriculture: Economic responses to biophysical shocks. Proceedings of the National Academy of Sciences, 111(9): 3274–3279. Office of National Statistics (ONS), 2014. Living Costs and Food Survey. Family Spending. Office of National Statistics, (2010) United Kingdom National Accounts ‐ The Blue Book. Palgrave MacMillan, London Office of National Statistics, (2014) Family Spending, 2014 Edition. At: http://www.ons.gov.uk/ons/rel/family‐spending/family‐spending/2014‐edition/index.html Ostro O, Rauch S, Green R, Malig B, and Basu R. The Effects of Temperature and Use of Air Conditioning on Hospitalizations. American Journal of Epidemiology. 2010. Vol. 172, No. 9. DOI: 10.1093/aje/kwq231. Owen, A. and J. Barrett (2014) Estimating global value chain impacts associated with UK consumption patterns. Report for the Adaptation Sub‐Committee. At: https://www.theccc.org.uk/wp‐content/uploads/2014/07/8‐2014‐03‐19‐Estimating‐global‐value‐chain‐impacts‐associated‐with‐UK‐consumption‐patterns.pdf

30
Porter, et. al (2014), Food security and food production systems. In: Climate Change 2014: Impacts, Adaptation, and Vulnerability. Part A: Global and Sectoral Aspects. Contribution of Working Group II to the Fifth Assessment Report of the Intergovernmental Panel on Climate Change. Cambridge University Press, Cambridge, United Kingdom and New York, NY, USA, pp. 485‐533. Ian Preston, Joshua Thumim et al. (2015). Distribution of carbon emissions in the UK: Implications for domestic energy policy Joseph Rowntree Foundation, York. https://www.jrf.org.uk/report/distribution‐carbon‐emissions‐uk‐implications‐domestic‐energy‐policy Gwilym Pryce, Yu Chen & George Galster (2011). The Impact of Floods on House Prices: An Imperfect Information Approach with Myopia and Amnesia. Housing Studies, Vol. 26, No. 2, 259–279, March 2011. DOI: 10.1080/02673037.2011.542086 PwC (2013) International threats and opportunities of climate change for the UK. Report for Defra. Sayers P et al (2015). Climate Change Risk Assessment 2017: Projections of future flood risk in the UK. Report submitted to the Adaptation Sub Committee. Silver, N., Cox, M. and E. Garrett (2010) Foresight International Dimensions of Climate Change: The Impact of Climate Change Overseas on the UK Financial Services Sector. 6th March 2010. Government Office for Science, London. The City UK, (2011) Financial Services in Emerging Markets. Economic Trends Series. June 2011. UNFCCC (2010). The Cancun Agreements. United Nations Framework Convention on Climate Change. Available at: http://unfccc.int/meetings/cancun_nov_2010/meeting/6266.php Watkiss, P., and Hunt., A (2012). Reviewing the Coverage of Economic Impacts in the CCRA. Report to the Committee on Climate Change Adaptation Sub‐Committee. June 2012. Wegren, S. K. (2011) Food Security and Russia's 2010 Drought, Eurasian Geography and Economics, 52:1, 140‐156
i https://www.theccc.org.uk/tackling‐climate‐change/preparing‐for‐climate‐change/climate‐change‐risk‐assessment‐2017/ ii http://www.legislation.gov.uk/ukpga/2008/27/contents iii http://unfccc.int/resource/docs/2015/cop21/eng/07.pdf iviv The B1 scenario is not a mitigation scenario, but it leads to central temperature change of 2.3C: the A1B scenarios leads to a central temperature change of 3.3C, and the A1F1 scenario a central change of 4.5C, relative to pre‐industrial levels by the end of the century. For all scenarios, there is a significant range around these central values. (Source, IPCC 4th Assessment Report, 2007). v noting definitions of the fuel poor have changed, see Appendix 2


![AREA - environmentclearance.nic.inenvironmentclearance.nic.in/writereaddata/FormB/EC/FORM_1/30032016...PROPOSED PRODUCTION -5, ... 2011, 2012, 2013, 2014, 2015 and 2016] I. Basic Information](https://img.pdfslide.us/doc/110x75/5aa8fa097f8b9a81188c3111/area-production-5-2011-2012-2013-2014-2015-and-2016-i-basic-information.jpg)