Embed Size (px)
Citation preview
Working Paper #2 Northern Ontario Multimodal Transportation Strategy
Climate Change Context
Prepared for Ministry of Transportation, Ontarioby IBI Group Hemson Consulting Ltd. and StantecJanuary 15, 2016
IBI GROUP WORKING PAPER #2: CLIMATE CHANGE CONTEXT Prepared for Ministry of Transportation, Ontario
January 15, 2016
IBI GROUP WORKING PAPER #2: CLIMATE CHANGE CONTEXT Prepared for Ministry of Transportation, Ontario
Table of Contents
January 15, 2016 i
1 Introduction and Purpose ......................................................................... 1
2 Climate Change Trends Affecting Northern Ontario Transportation .... 2
2.1 Global, Canadian and Northern Ontario Climate Trends .................. 2
2.1.1 Broad Historic Trends ............................................................ 2
2.1.2 Broad Projected Trends ......................................................... 4
2.2 Overview of Broad Climate Change Trends and Impacts in Northern Ontario ............................................................................................ 12
2.2.1 Near-Term ............................................................................ 12
2.2.2 Long-Term ........................................................................... 13
2.2.3 Economic Implications ......................................................... 14
2.3 Localized Climate Change Trends and Transportation Impacts ..... 14
2.3.1 Methodology......................................................................... 14
2.3.2 Historic Local Trends ........................................................... 17
2.3.3 Projected Local Trends ........................................................ 20
2.3.4 Transportation Impacts of Temperature Trends ................... 22
2.3.5 Transportation Impacts of Precipitation Trends .................... 25
3 Transportation Impacts and Possible Adaptation Strategies ............. 29
3.1 Mitigation and Adaptation ............................................................... 29
3.1.1 Mitigation Measures ............................................................. 29
3.1.2 Adaptation Strategies ........................................................... 31
3.2 Effects of Climate Change, Adaptation Strategies and Potential Opportunities by Transportation Mode ............................................ 33
3.2.1 All-Season Roads ................................................................ 35
3.2.2 Winter Roads ....................................................................... 37
3.2.3 Rail ................................................................................ 39
3.2.4 Air ................................................................................ 39
IBI GROUP WORKING PAPER #2: CLIMATE CHANGE CONTEXT Prepared for Ministry of Transportation, Ontario
Table of Contents (continued)
January 15, 2016 ii
3.2.5 Marine ................................................................................ 42
4 Risk Assessment and Priority Planning ................................................ 44
4.1 The Public Infrastructure Engineering Vulnerability Committee (PIEVC) Protocol ............................................................................ 45
4.1.1 Risk Assessment Process .................................................... 45
4.2 Setting Adaptation Priorities ........................................................... 50
4.2.1 Sudbury Vulnerability Workshop Example ........................... 50
4.2.2 Winter Roads Example ........................................................ 51
4.2.3 Remote Airport Runways Example ...................................... 54
4.3 MTO Climate Change Initiatives ..................................................... 55
4.3.1 Revised Transportation Infrastructure Maintenance/ Operations Standards .......................................................... 55
4.3.2 Increased Real-Time Road Condition Monitoring ................. 56
4.3.3 Revised Drainage Standards ............................................... 58
4.3.4 Review of Road Foundations for Discontinuous Permafrost Areas ................................................................................ 59
4.3.5 Pavement Design ................................................................. 61
4.3.5 Intelligent Transportation Systems (ITS) .............................. 61
5 Next Steps ................................................................................................ 64
References ....................................................................................................... 65
Alternate Text for Exhibits .............................................................................. 68
Appendix A: Graphs of Historical Temperature Trends at Northern Ontario Locations: Numbers of Days/Year with Average Daily Temperature below 0°Celsius
IBI GROUP WORKING PAPER #2: CLIMATE CHANGE CONTEXT Prepared for Ministry of Transportation, Ontario
Table of Contents (continued)
January 15, 2016 iii
List of Exhibits Exhibit 2.1: Global Average Temperature Trends, 1850-2012 ........................... 2
Exhibit 2.2: Temperature Trends, Canada, 1948-2014 ...................................... 3
Exhibit 2.3: Precipitation Trends, Canada: 1948-2014 ....................................... 4
Exhibit 2.4: Mean Summer Temperature (Change from 1971-2000 Baseline) ............................................................................................... 8
Exhibit 2.5: Mean Winter Temperature (Change from 1971-2000 Baseline) ...... 9
Exhibit 2.6: Total Summer Precipitation (Change from 1971-2000 Baseline) ............................................................................................. 10
Exhibit 2.7: Total Winter Precipitation (Change from 1971-2000 Baseline) ...... 11
Exhibit 2.8: Climate Data Availability by Location ............................................. 15
Exhibit 2.9: Historic Trends in Total Number Days per Year with Average Daily Temperature above 0°C in Three Representative Northern Ontario Locations ................................................................................ 16
Exhibit 2.10: Local Weather Event Frequencies in Mid-1950s and Mid-2010s .................................................................................................. 19
Exhibit 2.11: Local Weather Event Frequencies in Mid-2010s and Projections to Mid-2050s..................................................................... 21
Exhibit 2.12: Subsidence Effects of Permafrost Melting on Transportation Infrastructure ....................................................................................... 22
Exhibit 2.13: Rail Distortion Due to Hot Days with Intense Sunshine ............... 23
Exhibit 2.14: Estimated Winter Road Operating Season Trends in Northern Ontario ................................................................................. 24
Exhibit 2.15: Transport Truck Using Deteriorating Winter Road ....................... 25
Exhibit 2.16: Road Washout near Emo, Ontario ............................................... 26
Exhibit 2.17: Road Washout near Sudbury, Ontario ......................................... 26
Exhibit 2.18: Culvert Widening Strategy to Handle Major Flood Events ........... 27
Exhibit 2.19: Highway Off-Ramp in Sudbury Closed Due to Freezing Rain ..... 28
Exhibit 3.1: Ontario’s GHG Emissions Trajectory ............................................. 30
Exhibit 3.2: Relationship between the Coping Range, Critical Threshold, Vulnerability and Adaptation for a Climate Variable ............................ 31
IBI GROUP WORKING PAPER #2: CLIMATE CHANGE CONTEXT Prepared for Ministry of Transportation, Ontario
Table of Contents (continued)
January 15, 2016 iv
Exhibit 3.3: Northern Ontario Multimodal Transportation System ..................... 34
Exhibit 3.4: Road Transportation Impacts and Adaptation Strategies .............. 36
Exhibit 3.5: Winter Roads Impacts and Adaptation Strategies ......................... 38
Exhibit 3.6: Rail Transportation Impacts and Adaptation Strategies ................. 40
Exhibit 3.7: Air Transportation Impacts and Adaptation Strategies ................... 41
Exhibit 3.8: Marine Transportation Impacts and Adaptation Strategies ............ 43
Exhibit 4.1: Alternative Projections of Global Average Temperature Change ............................................................................................... 44
Exhibit 4.2: Overview of the Public Infrastructure Engineering Vulnerability Committee Protocol ............................................................................ 46
Exhibit 4.3: Example Risk Matrix and Climate Change Risk Reduction through Adaptation to Reduce Severity of Impact ............................... 47
Exhibit 4.4: Risk Assessment Process ............................................................. 48
Exhibit 4.5: Intensity-Duration-Frequency (IDF) Curve for Engineering Analysis, Sault Ste. Marie Example .................................................... 49
Exhibit 4.6: Operating Statistics for Northern Ontario Winter Roads, 2013 to 2014 Season ................................................................................... 52
Exhibit 4.7: Broad Modal Cost Comparisons for Regular Food Delivery to Remote Communities ......................................................................... 54
Exhibit 4.8: Northern Ontario Road Weather Information System (RWIS) ....... 57
Exhibit 4.9: Wireless Traffic Counter for Winter Roads .................................... 63
IBI GROUP WORKING PAPER #2: CLIMATE CHANGE CONTEXT Prepared for Ministry of Transportation, Ontario
January 15, 2016 1
1 Introduction and Purpose
This Working Paper is one in a series of background papers to support the development of a Northern Ontario Multimodal Transportation Strategy (NOMTS). The Ministry of Transportation (MTO) and The Ministry of Northern Development and Mines (MNDM), with support from The Northern Ontario Heritage Fund Corporation are developing NOMTS. This paper describes current and anticipated effects of climate change and related extreme weather events on the transportation system in Northern Ontario. It outlines possible adaptation strategies and priority planning approaches to help ensure that climate change implications are taken into account in the development of NOMTS.
The paper is structured as follows:
Section 2 outlines historic and projected climate change trends globally and regionally for Canada and for Northern Ontario in the near-term and longer-term, and their broad implications for Northern Ontario's transportation system and socio-economic development; the section also establishes historical climate change trends in twelve Northern Ontario locations, and provides approximate future projections of these trends in the context of broader climate change predictions by climate simulation models;
Section 3 discusses mitigation and adaptation, the focus of the paper being on the latter, and provides a more detailed description of the effects of climate change on transportation infrastructure and possible adaptation strategies in Northern Ontario for each of the major transportation modes: road, rail, air and marine;
Section 4 describes some of the risk assessment and priority planning methods that can be used in adapting for a more resilient transportation system; it also outlines current MTO climate change adaptation initiatives; and
Section 5 summarizes next steps for this report and related reports.
IBI GROUP WORKING PAPER #2: CLIMATE CHANGE CONTEXT Prepared for Ministry of Transportation, Ontario
January 15, 2016 2
2 Climate Change Trends Affecting Northern Ontario Transportation
This section describes global and regional historic and projected climate change trends and their anticipated broad effects on transportation in Northern Ontario, followed by a description of more localized trends and impacts in Northern Ontario.
2.1 Global, Canadian and Northern Ontario Climate Trends
2.1.1 Broad Historic Trends
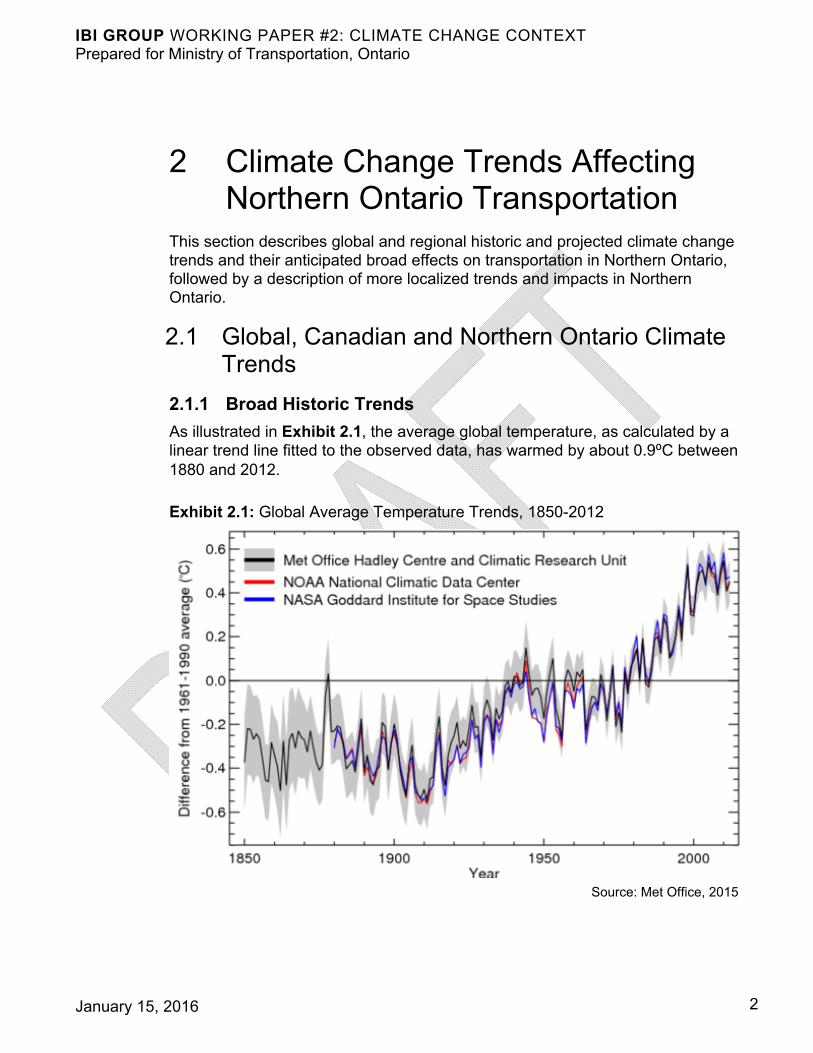
As illustrated in Exhibit 2.1, the average global temperature, as calculated by a linear trend line fitted to the observed data, has warmed by about 0.9⁰C between 1880 and 2012.
Exhibit 2.1: Global Average Temperature Trends, 1850-2012
Source: Met Office, 2015
IBI GROUP WORKING PAPER #2: CLIMATE CHANGE CONTEXT Prepared for Ministry of Transportation, Ontario
January 15, 2016 3
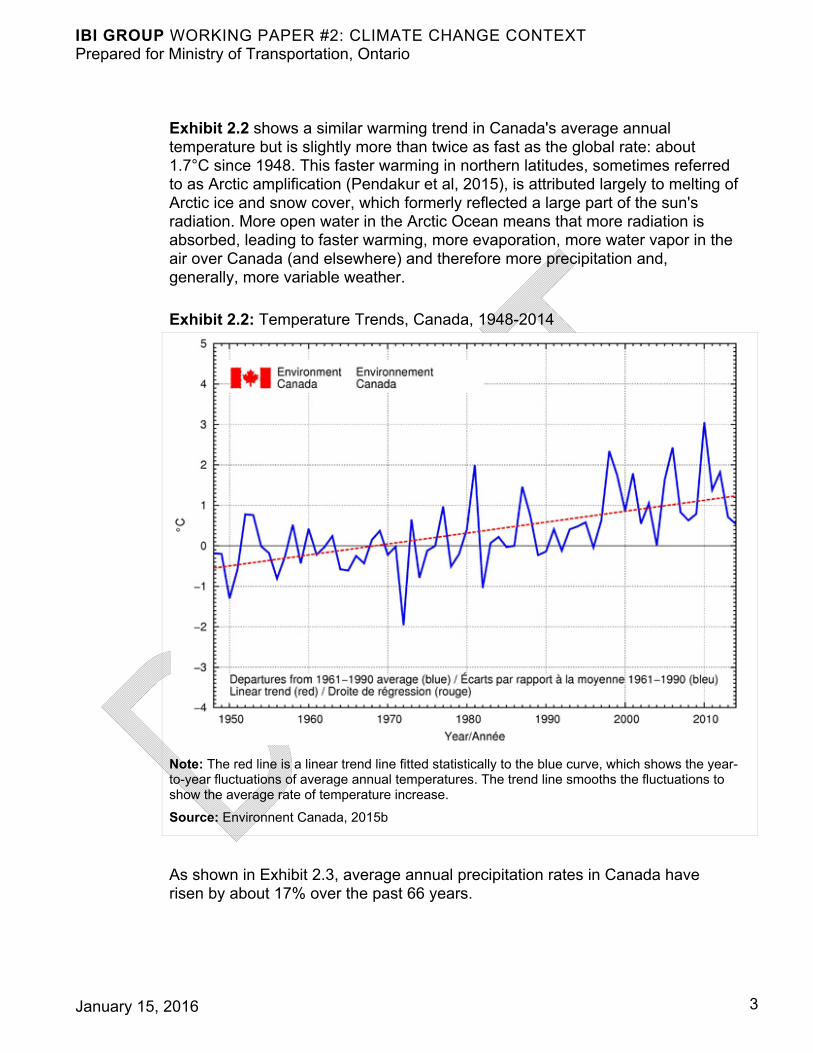
Exhibit 2.2 shows a similar warming trend in Canada's average annual temperature but is slightly more than twice as fast as the global rate: about 1.7°C since 1948. This faster warming in northern latitudes, sometimes referred to as Arctic amplification (Pendakur et al, 2015), is attributed largely to melting of Arctic ice and snow cover, which formerly reflected a large part of the sun's radiation. More open water in the Arctic Ocean means that more radiation is absorbed, leading to faster warming, more evaporation, more water vapor in the air over Canada (and elsewhere) and therefore more precipitation and, generally, more variable weather.
Exhibit 2.2: Temperature Trends, Canada, 1948-2014
Note: The red line is a linear trend line fitted statistically to the blue curve, which shows the year-to-year fluctuations of average annual temperatures. The trend line smooths the fluctuations to show the average rate of temperature increase.
Source: Environnent Canada, 2015b
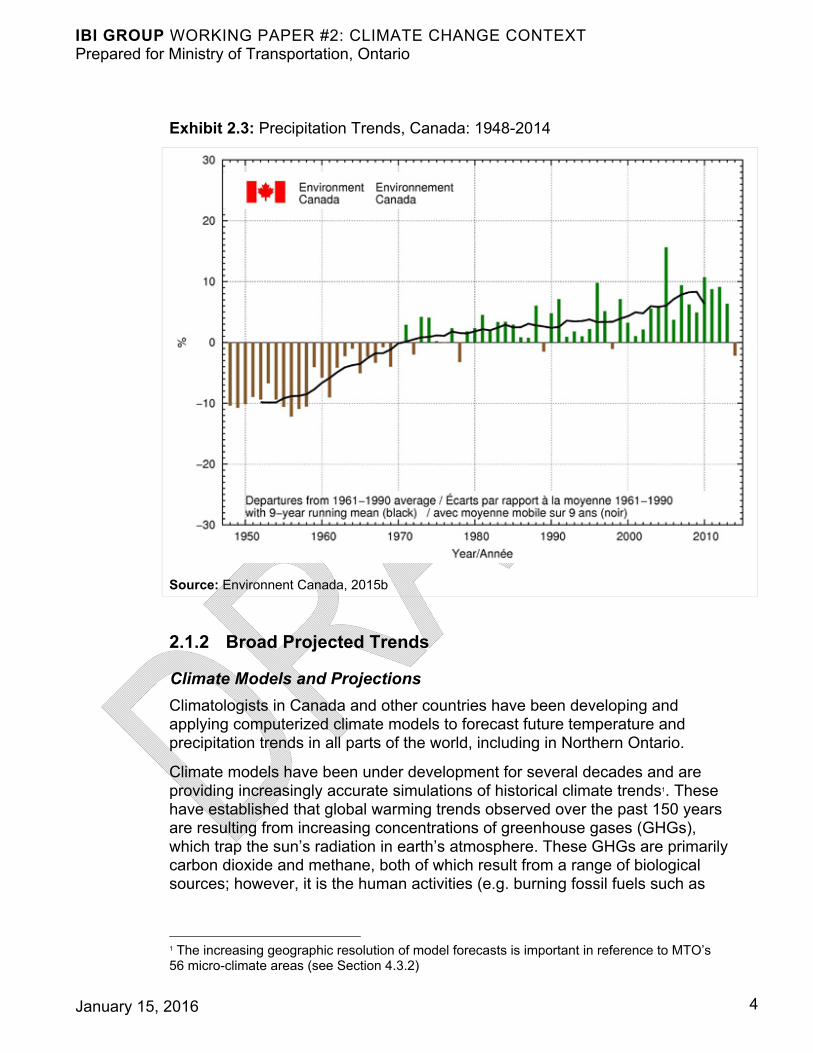
As shown in Exhibit 2.3, average annual precipitation rates in Canada have risen by about 17% over the past 66 years.
IBI GROUP WORKING PAPER #2: CLIMATE CHANGE CONTEXT Prepared for Ministry of Transportation, Ontario
January 15, 2016 4
Exhibit 2.3: Precipitation Trends, Canada: 1948-2014
Source: Environnent Canada, 2015b
2.1.2 Broad Projected Trends
Climate Models and Projections
Climatologists in Canada and other countries have been developing and applying computerized climate models to forecast future temperature and precipitation trends in all parts of the world, including in Northern Ontario.
Climate models have been under development for several decades and are providing increasingly accurate simulations of historical climate trends1. These have established that global warming trends observed over the past 150 years are resulting from increasing concentrations of greenhouse gases (GHGs), which trap the sun’s radiation in earth’s atmosphere. These GHGs are primarily carbon dioxide and methane, both of which result from a range of biological sources; however, it is the human activities (e.g. burning fossil fuels such as
1 The increasing geographic resolution of model forecasts is important in reference to MTO’s 56 micro-climate areas (see Section 4.3.2)
IBI GROUP WORKING PAPER #2: CLIMATE CHANGE CONTEXT Prepared for Ministry of Transportation, Ontario
January 15, 2016 5
Definitions
Weather is the short-term changes in temperature, precipitation and wind that can vary from minute to minute, hour to hour, day to day, or even month to month.
Climate is usually defined as the average weather over longer periods, often averaged over 30 year periods.
Climate Change is defined by the United Nations Framework Convention on Climate Change (UNFCCC) as
“a change of climate which is attributed directly or indirectly to human activity that alters the composition of the global atmosphere and which is in addition to natural climate variability observed over comparable time periods” (cited by Institute for Catastrophic Loss Reduction, 2012).
coal and oil, deforestation and intensive agriculture) that have significantly increased GHG emissions, particularly during the past two centuries.
As described by the Intergovernmental Panel on Climate Change (IPCC, 2013), the models are used by scientists to project future climate trends, such as ongoing warming of the atmosphere and oceans, increased amounts of water vapour (itself also a GHG) in the atmosphere, increased precipitation in many areas (and less in other areas), and increasingly variable weather events. The
latter includes more severe and/or frequent hurricanes, thunder storms, tornados, and ice storms. Rising ocean levels have also been a slow but steady onset effect of a warming climate. Increasingly variable weather has been disruptive to transportation and other human activities in recent years.
Modelled climate change projections differ greatly from each other, depending on the input assumptions for each model run regarding future levels of GHG emissions and other factors (e.g. rates of melting of polar ice caps, possible “tipping point” changes in ocean currents such as the Gulf Stream) that can have substantial impacts on warming (or cooling) trends, precipitation rates and severe weather events in various regions of the world.
The IPCC has defined several model input scenarios, reflecting a variety of assumptions about rates of population growth, economic activities, technological developments, etc. Model runs based on moderate growth rate and GHG emissions scenarios produce lower projections of warming rates and other climate change effects, than those based on higher levels of GHG emissions.
As outlined later in Section 4, model runs based on moderate input assumptions suggest that it may be possible to limit average global warming to 2 to 2.5 degrees Celsius (°C) by the end of this century through immediate and very effective international cooperation to limit GHG emissions. Other model runs, as discussed later in Section 4, suggest that the global average temperature increase could be as much as 4⁰C or more by the year 2100. Much uncertainty about the rate of increase exists and will remain, but the IPCC has concluded that “warming of the climate system is unequivocal, as is now evident from observations of increases in global average air and
IBI GROUP WORKING PAPER #2: CLIMATE CHANGE CONTEXT Prepared for Ministry of Transportation, Ontario
January 15, 2016 6
ocean temperatures, widespread melting of snow and ice, and rising global average sea level."
As is evident from the above, there is strong scientific consensus that climate change is real, is largely a result of GHG emissions generated by human activities, particularly over the past 150 years, and will continue unless GHG emissions are substantially reduced. The rate of change remains uncertain and depends on the effectiveness of international efforts to reduce GHG emissions, among other factors.
As shown in Exhibit 2.2, the average temperature in Canada has been rising on an approximately linear (straight-line) trend over the past 66 years. Linear rates of temperature increase over much of this same period have also been measured at twelve representative Environment Canada weather stations in Northern Ontario. In order to provide an approximate indication of likely warming trends at these locations, linear trends have been projected to the mid-2050s, as described in Section 2.3.
Linear projections used in this paper are approximate and probably conservative, in that the rate of temperature increase at the global and national levels is probably accelerating, as the cumulative effects of GHG emissions are increasingly felt and as simulated in various climate model runs. For the purposes of this paper, and given that available data from the twelve locations in Northern Ontario do not indicate that other trends have a better fit than linear trends, linear trends are therefore used to illustrate possible future trends in those locations.
Projected Trends for Northern Ontario
The discussion that follows differentiates between the Near North and the Far North of Ontario, as defined by the Ontario Far North Act. The boundary between these two areas is at about 51° north latitude (about 100 km north of Armstrong, ON). The Far North extends north from this boundary to the shores of Hudson Bay, while the Near North lies south of this boundary. The Far North constitutes about 42% of Ontario's land mass and contains 31 First Nations communities, two municipalities (Moosonee and Pickle Lake) and one community with a local service board (Moose Factory). The total population of the area is about 24,000.
Based on the results of climate modelling runs by the Intergovernmental Panel on Climate Change (IPCC, 2013) and summarized in Climate Change Research Report CCRR-44 prepared for the Ontario Ministry of Natural Resources and Forestry (MNRF) (McDermid et al 2015), Exhibits 2.4 through 2.7 show the distribution across Northern Ontario of projected changes in average temperature and precipitation by the following time periods — 2011 to 2040 (indicative of mid-2020s), 2040 to 2070 (indicative of mid-2050s), and 2070 to 2100 (indicative of mid-2080s) — relative to 1971 to 2000 averages. The projections are based on the Intergovernmental Panel on Climate Change
IBI GROUP WORKING PAPER #2: CLIMATE CHANGE CONTEXT Prepared for Ministry of Transportation, Ontario
January 15, 2016 7
Climate Change Projection Scenarios RCP2.6: Medium-low scenario with aggressive mitigation. Emissions peak early, and then fall due to active removal of atmospheric carbon dioxide. Requires all the main GHG emitters, including developing countries, to participate early on in climate change mitigation policy.
RCP4.5: A medium stabilization scenario where Radiative Forcing (RF) stabilizes by 2100. Similar to the lowest scenario assessed in the ICPP’s fourth report, AR4.
RCP8.5: Very high emission scenario and a failure to curb warming by 2100. GHG emissions are up to seven times higher than pre-industrial levels. Similar to the highest AR4 emission scenario
(IPCC, 2013)
climate projections downscaled for the Province of Ontario. The projections use the fifth assessment report (AR5), which uses four new emissions scenarios called representative concentration pathways (RCPs). The RCPs in the AR5 projections include climate driving forces such as aerosols and land cover, in
addition to the standard greenhouse gas measures.
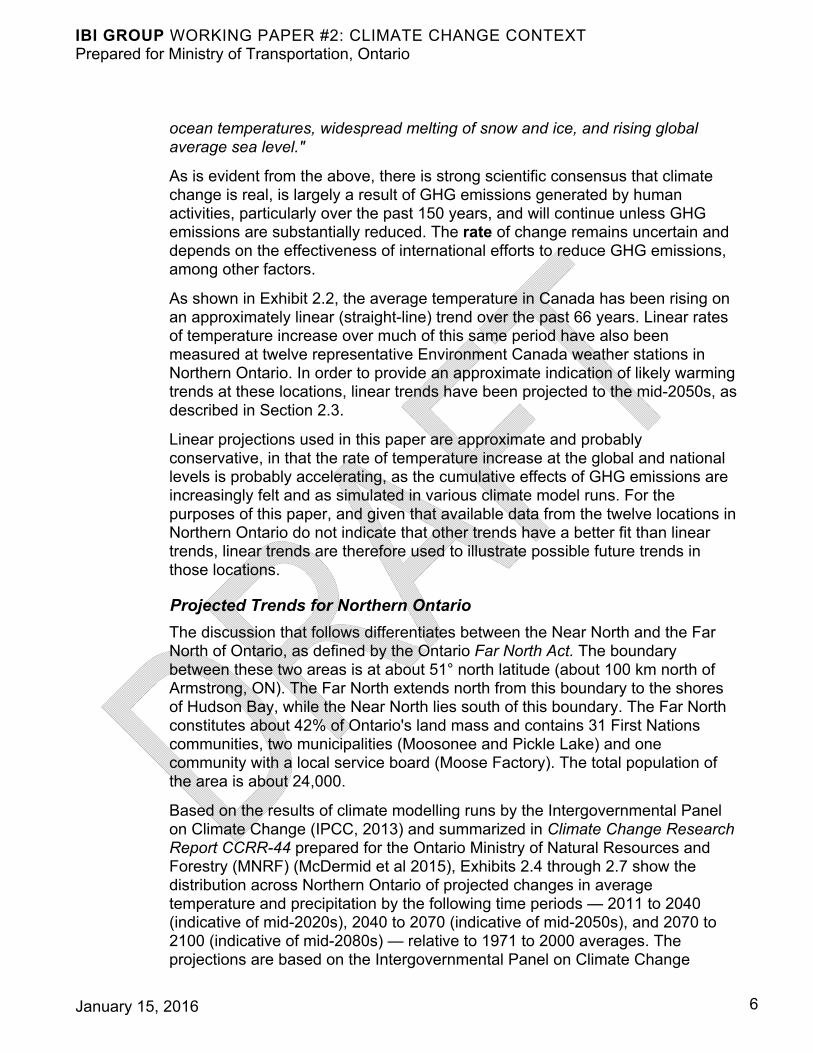
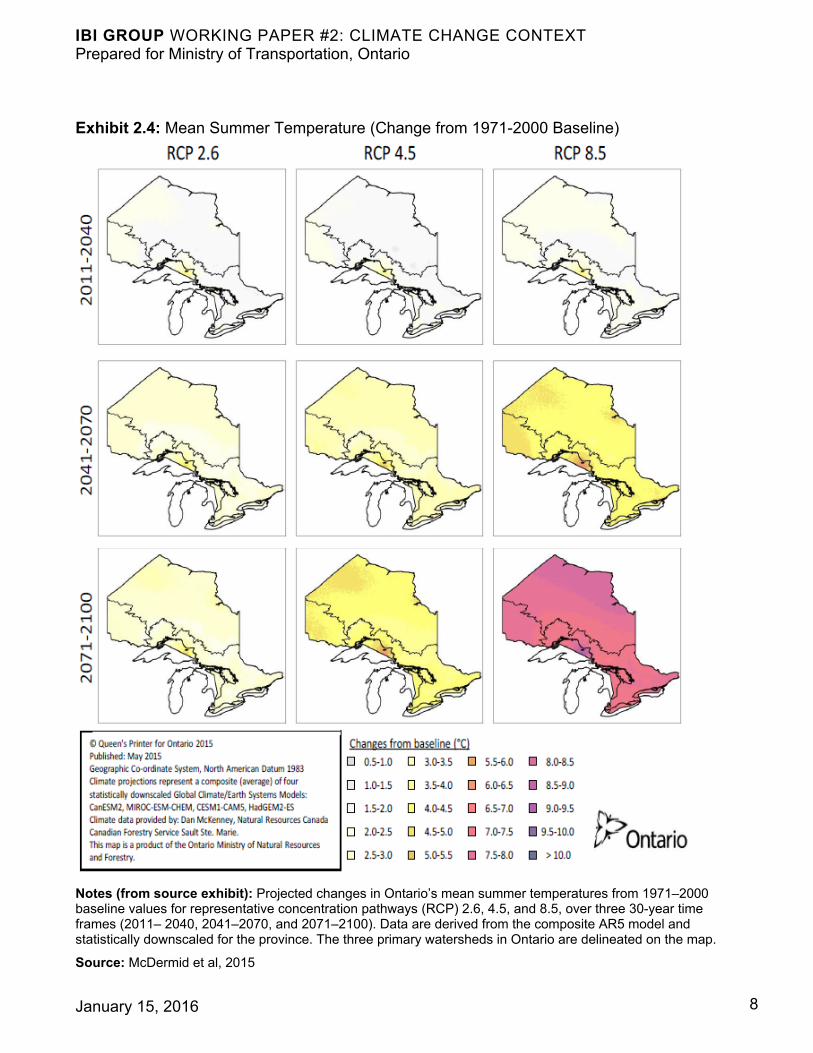
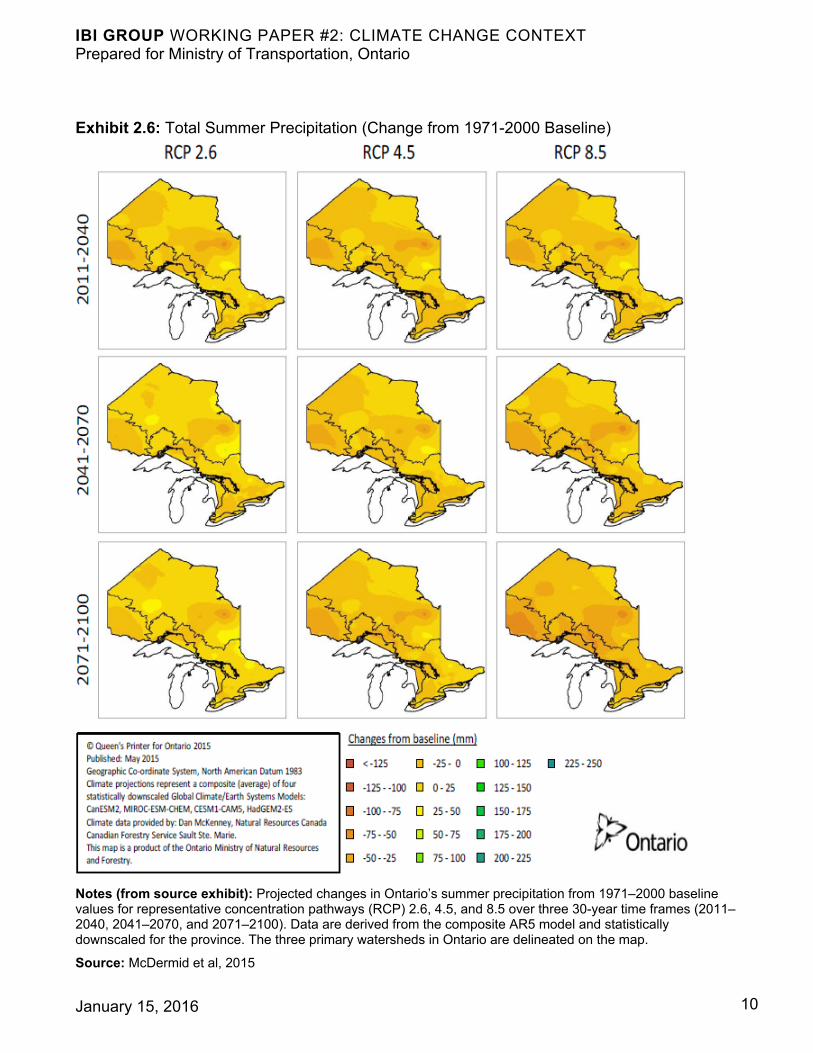
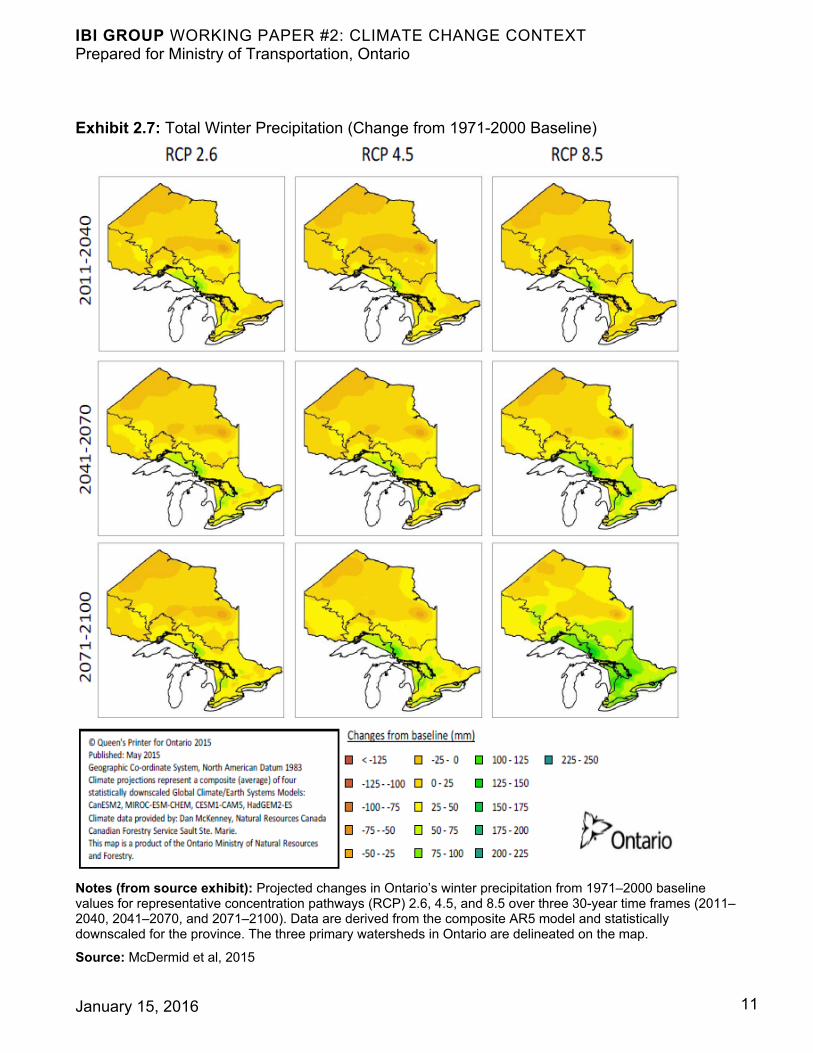
Exhibits 2.4 through 2.7 each show an array of nine maps, illustrating the various projections based, respectively, on three GHG emissions scenarios (RCP2.6 medium-low, RCP6.0 medium, and RCP8.5 very high, reading from left to right) and three future time periods (indicative of 2020s, 2050s, 2080s, reading from top to bottom). The three GHG emissions scenarios are defined in the sidebar.
For simplicity, the following discussion focusses on the temperature and precipitation projections shown on the map in the centre of each display, that is, projections to the 2050s based on the medium emissions scenario.
The central map in Exhibit 2.4 shows projected changes in average summer air temperatures in degrees Celsius over Ontario sub-districts for the 2050s compared with the 1971 to 2000 averages, under the medium greenhouse gas emissions scenario (Government of Ontario, 2015). As shown, and based on the underlying data, the average increase is estimated to be about 2.6 to 3.6°C in the Far North and 2.5 to 5.7 in the Near North.
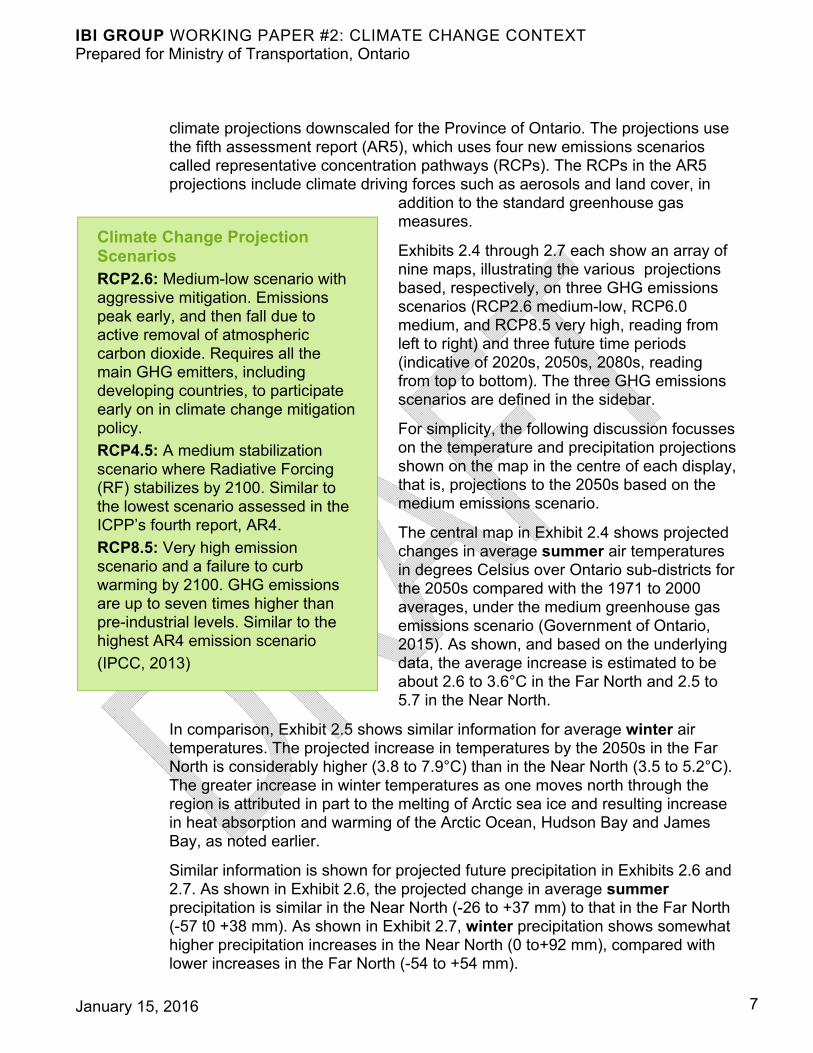
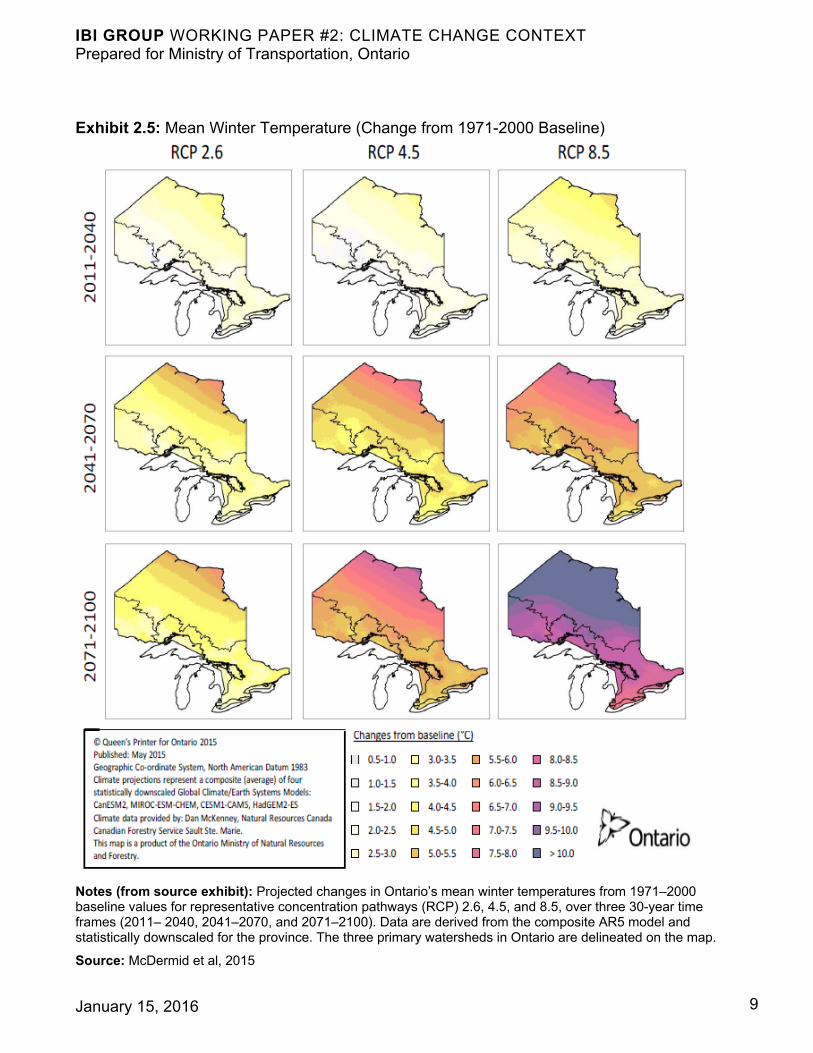
In comparison, Exhibit 2.5 shows similar information for average winter air temperatures. The projected increase in temperatures by the 2050s in the Far North is considerably higher (3.8 to 7.9°C) than in the Near North (3.5 to 5.2°C). The greater increase in winter temperatures as one moves north through the region is attributed in part to the melting of Arctic sea ice and resulting increase in heat absorption and warming of the Arctic Ocean, Hudson Bay and James Bay, as noted earlier.
Similar information is shown for projected future precipitation in Exhibits 2.6 and 2.7. As shown in Exhibit 2.6, the projected change in average summer precipitation is similar in the Near North (-26 to +37 mm) to that in the Far North (-57 t0 +38 mm). As shown in Exhibit 2.7, winter precipitation shows somewhat higher precipitation increases in the Near North (0 to+92 mm), compared with lower increases in the Far North (-54 to +54 mm).
IBI GROUP WORKING PAPER #2: CLIMATE CHANGE CONTEXT Prepared for Ministry of Transportation, Ontario
January 15, 2016 8
Exhibit 2.4: Mean Summer Temperature (Change from 1971-2000 Baseline)
Notes (from source exhibit): Projected changes in Ontario’s mean summer temperatures from 1971–2000 baseline values for representative concentration pathways (RCP) 2.6, 4.5, and 8.5, over three 30-year time frames (2011– 2040, 2041–2070, and 2071–2100). Data are derived from the composite AR5 model and statistically downscaled for the province. The three primary watersheds in Ontario are delineated on the map.
Source: McDermid et al, 2015
IBI GROUP WORKING PAPER #2: CLIMATE CHANGE CONTEXT Prepared for Ministry of Transportation, Ontario
January 15, 2016 9
Exhibit 2.5: Mean Winter Temperature (Change from 1971-2000 Baseline)
Notes (from source exhibit): Projected changes in Ontario’s mean winter temperatures from 1971–2000 baseline values for representative concentration pathways (RCP) 2.6, 4.5, and 8.5, over three 30-year time frames (2011– 2040, 2041–2070, and 2071–2100). Data are derived from the composite AR5 model and statistically downscaled for the province. The three primary watersheds in Ontario are delineated on the map.
Source: McDermid et al, 2015
IBI GROUP WORKING PAPER #2: CLIMATE CHANGE CONTEXT Prepared for Ministry of Transportation, Ontario
January 15, 2016 10
Exhibit 2.6: Total Summer Precipitation (Change from 1971-2000 Baseline)
Notes (from source exhibit): Projected changes in Ontario’s summer precipitation from 1971–2000 baseline values for representative concentration pathways (RCP) 2.6, 4.5, and 8.5 over three 30-year time frames (2011– 2040, 2041–2070, and 2071–2100). Data are derived from the composite AR5 model and statistically downscaled for the province. The three primary watersheds in Ontario are delineated on the map.
Source: McDermid et al, 2015
IBI GROUP WORKING PAPER #2: CLIMATE CHANGE CONTEXT Prepared for Ministry of Transportation, Ontario
January 15, 2016 11
Exhibit 2.7: Total Winter Precipitation (Change from 1971-2000 Baseline)
Notes (from source exhibit): Projected changes in Ontario’s winter precipitation from 1971–2000 baseline values for representative concentration pathways (RCP) 2.6, 4.5, and 8.5 over three 30-year time frames (2011– 2040, 2041–2070, and 2071–2100). Data are derived from the composite AR5 model and statistically downscaled for the province. The three primary watersheds in Ontario are delineated on the map.
Source: McDermid et al, 2015
IBI GROUP WORKING PAPER #2: CLIMATE CHANGE CONTEXT Prepared for Ministry of Transportation, Ontario
January 15, 2016 12
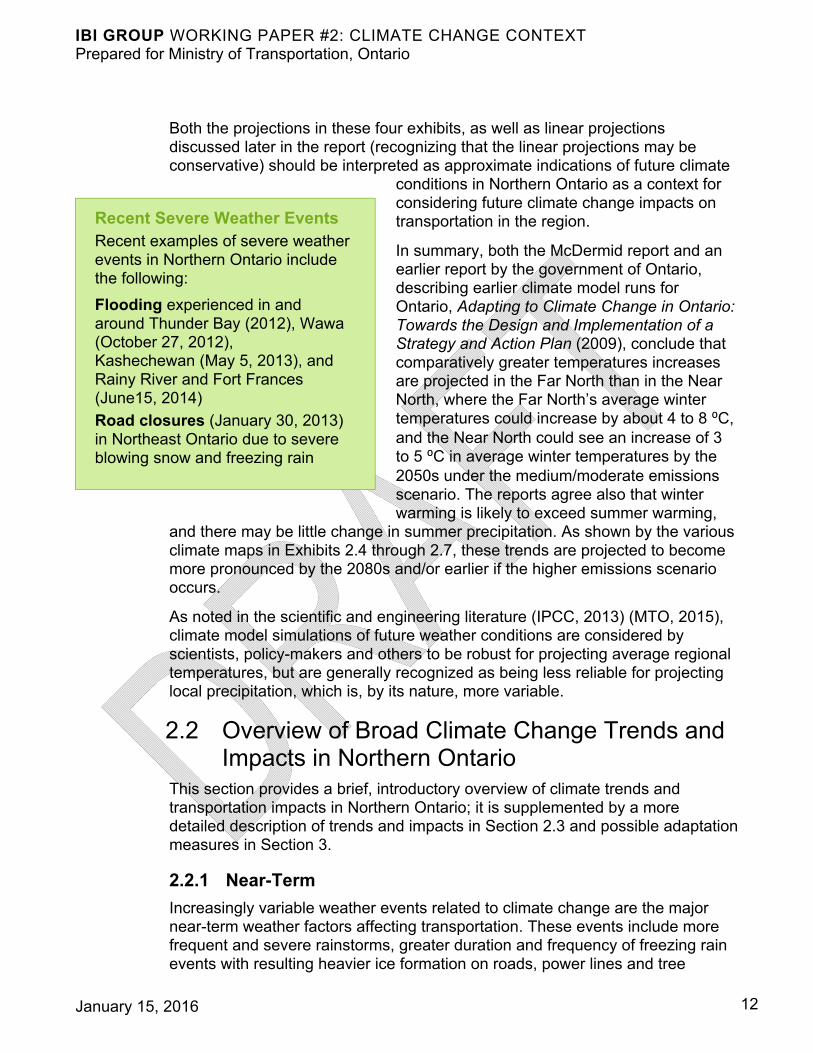
Recent Severe Weather Events Recent examples of severe weather events in Northern Ontario include the following:
Flooding experienced in and around Thunder Bay (2012), Wawa (October 27, 2012), Kashechewan (May 5, 2013), and Rainy River and Fort Frances (June15, 2014)
Road closures (January 30, 2013) in Northeast Ontario due to severe blowing snow and freezing rain
Both the projections in these four exhibits, as well as linear projections discussed later in the report (recognizing that the linear projections may be conservative) should be interpreted as approximate indications of future climate
conditions in Northern Ontario as a context for considering future climate change impacts on transportation in the region.
In summary, both the McDermid report and an earlier report by the government of Ontario, describing earlier climate model runs for Ontario, Adapting to Climate Change in Ontario: Towards the Design and Implementation of a Strategy and Action Plan (2009), conclude that comparatively greater temperatures increases are projected in the Far North than in the Near North, where the Far North’s average winter temperatures could increase by about 4 to 8 ⁰C, and the Near North could see an increase of 3 to 5 ⁰C in average winter temperatures by the 2050s under the medium/moderate emissions scenario. The reports agree also that winter warming is likely to exceed summer warming,
and there may be little change in summer precipitation. As shown by the various climate maps in Exhibits 2.4 through 2.7, these trends are projected to become more pronounced by the 2080s and/or earlier if the higher emissions scenario occurs.
As noted in the scientific and engineering literature (IPCC, 2013) (MTO, 2015), climate model simulations of future weather conditions are considered by scientists, policy-makers and others to be robust for projecting average regional temperatures, but are generally recognized as being less reliable for projecting local precipitation, which is, by its nature, more variable.
2.2 Overview of Broad Climate Change Trends and Impacts in Northern Ontario
This section provides a brief, introductory overview of climate trends and transportation impacts in Northern Ontario; it is supplemented by a more detailed description of trends and impacts in Section 2.3 and possible adaptation measures in Section 3.
2.2.1 Near-Term
Increasingly variable weather events related to climate change are the major near-term weather factors affecting transportation. These events include more frequent and severe rainstorms, greater duration and frequency of freezing rain events with resulting heavier ice formation on roads, power lines and tree
IBI GROUP WORKING PAPER #2: CLIMATE CHANGE CONTEXT Prepared for Ministry of Transportation, Ontario
January 15, 2016 13
branches, and higher wind velocities during storms. The effects on transportation include flooding, more frequent washouts of roads and rail lines, hazardous winter driving conditions during snow and ice storms, and route blockages due to fallen power lines and tree branches following prolonged freezing rain events, particularly when followed by high wind velocities. These are expected to be felt particularly in the Near North owing to its extensive network of roads and rail lines.
Increasing risks of poor driving conditions can be expected to contribute to an increase in motor vehicle collisions and fatalities. There are currently 70-80 fatalities each year from motor vehicle collisions in Northern Ontario, with associated social and economic costs.
A significant effect of climate change on Northern Ontario ground transportation in the Far North has been the degradation of winter roads. The effects include: shorter seasons of freezing conditions, thinner ice on northern watercourses, more varied weather, and more freeze-thaw cycles during the winter road season leading to operational problems, service interruptions, reduced safety and increased costs. This is both a near-term and a longer-term effect of climate change. Already the operating season length and reliability of these links between remote communities and roads/rail lines farther south are being reduced, resulting in lost opportunities and higher costs to move in heavy equipment, fuel, food staples and other supplies which are essential for the ongoing viability of many communities and mine sites in the Far North of Ontario and Canada (Pendakur et al, 2015; Prowse et al, 2009).
Near-term effects of climate change in the Near North on transportation infrastructure include pavement cracking due to increased frequency of freeze-thaw cycles and rutting of asphalt road surfaces due to movements of heavy vehicles on very hot days, which are also increasing in frequency as warming trends continue.
2.2.2 Long-Term
Continuing temperature increases and frequency of extreme weather events are expected to worsen the short-term impacts outlined above. Other, more gradual effects are also expected to come increasingly into play. In the Far North, these include melting of permafrost, which can cause subsidence and disruption of roads, winter roads, rail lines, runways and buildings.
In the Near North, anticipated reductions of water levels in the Great Lakes owing to increased evaporation rates caused by warming temperatures are expected to result in increasing marine shipping costs as vessels are forced to carry less cargo because of reduced drafts (Warren and Lemmen, 2014). This will be partially offset by increasing shipping season lengths, but the overall impact on shipping costs is expected to be negative.
IBI GROUP WORKING PAPER #2: CLIMATE CHANGE CONTEXT Prepared for Ministry of Transportation, Ontario
January 15, 2016 14
2.2.3 Economic Implications
Warming temperatures are anticipated to negatively affect some industrial activities in Northern Ontario, favouring other industrial activities. However, it remains to be seen whether the negative effects would outweigh any favourable aspects.
For example, provided that precipitation levels remain adequate and not too extreme, longer growing seasons, which are already being observed in terms of longer frost-free seasons (see Exhibit 2.9 and Section 2.3.2), could enable increased agricultural production, e.g. in the clay belt sub-region of the Near North and other areas with suitable soil and growing conditions. Shorter winters and less extreme cold could also favour the manufacturing and mining activities.
Forestry could be negatively affected by spruce budworm and mountain pine beetle infestations (owing to warmer winters and less winter-kill) and increases in forest fires (owing to hotter, drier summers). While warmer temperatures would favour a lengthened summer tourism season, shorter and warmer winters would reduce the viability of establishments catering to skiing, snowmobiling and other winter recreation activities.
2.3 Localized Climate Change Trends and Transportation Impacts
2.3.1 Methodology
For purposes of this study, temperature, precipitation and related weather records at twelve locations in Northern Ontario were analyzed to provide more localized understanding of climate change trends, including changes over time in the number of days per year that various types of weather events have been occurring.
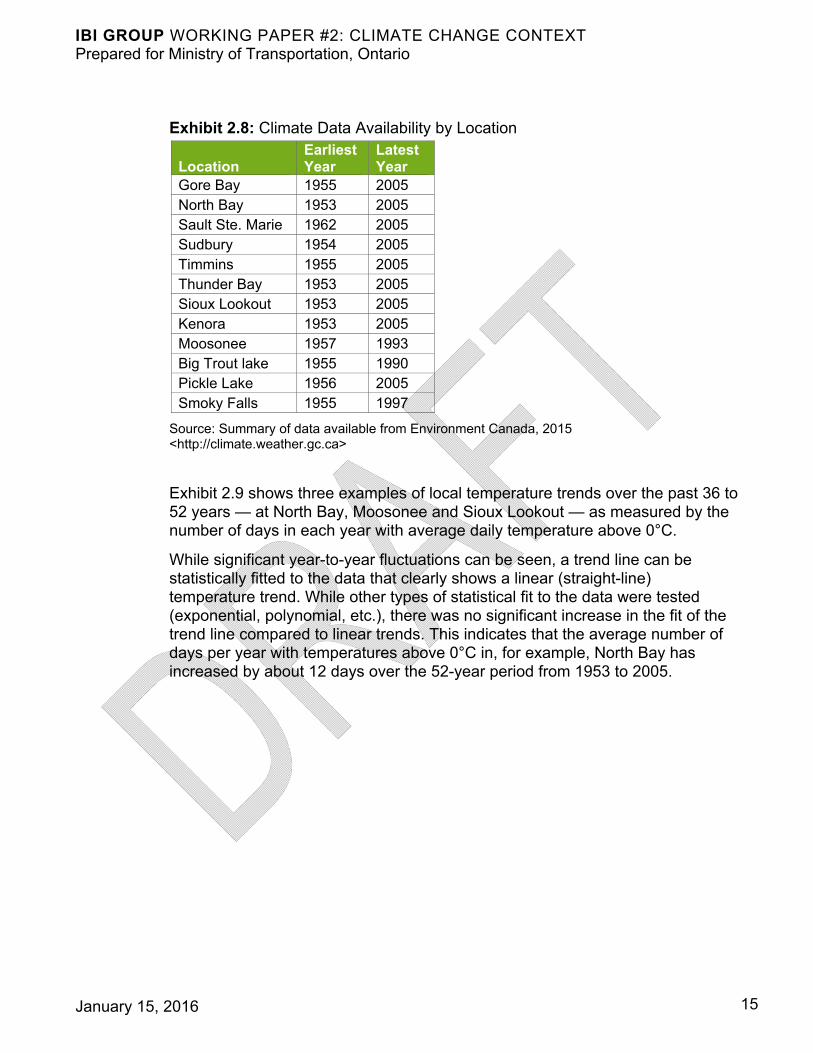
For this analysis, daily weather data available from Environment Canada were assembled for twelve locations in Northern Ontario. These locations are listed in Exhibit 2.8 in approximate order from south to north, together with the earliest and latest years of daily temperature and precipitation data that were available for analysis. For most locations, the most recent data available are from 1955 to 2005, but data from Moosonee, Big Trout Lake, and Smokey Falls are currently available only until the 1990s.
IBI GROUP WORKING PAPER #2: CLIMATE CHANGE CONTEXT Prepared for Ministry of Transportation, Ontario
January 15, 2016 15
Exhibit 2.8: Climate Data Availability by Location
Location Earliest Year
Latest Year
Gore Bay 1955 2005 North Bay 1953 2005 Sault Ste. Marie 1962 2005 Sudbury 1954 2005 Timmins 1955 2005 Thunder Bay 1953 2005 Sioux Lookout 1953 2005 Kenora 1953 2005 Moosonee 1957 1993 Big Trout lake 1955 1990 Pickle Lake 1956 2005 Smoky Falls 1955 1997
Source: Summary of data available from Environment Canada, 2015 <http://climate.weather.gc.ca>
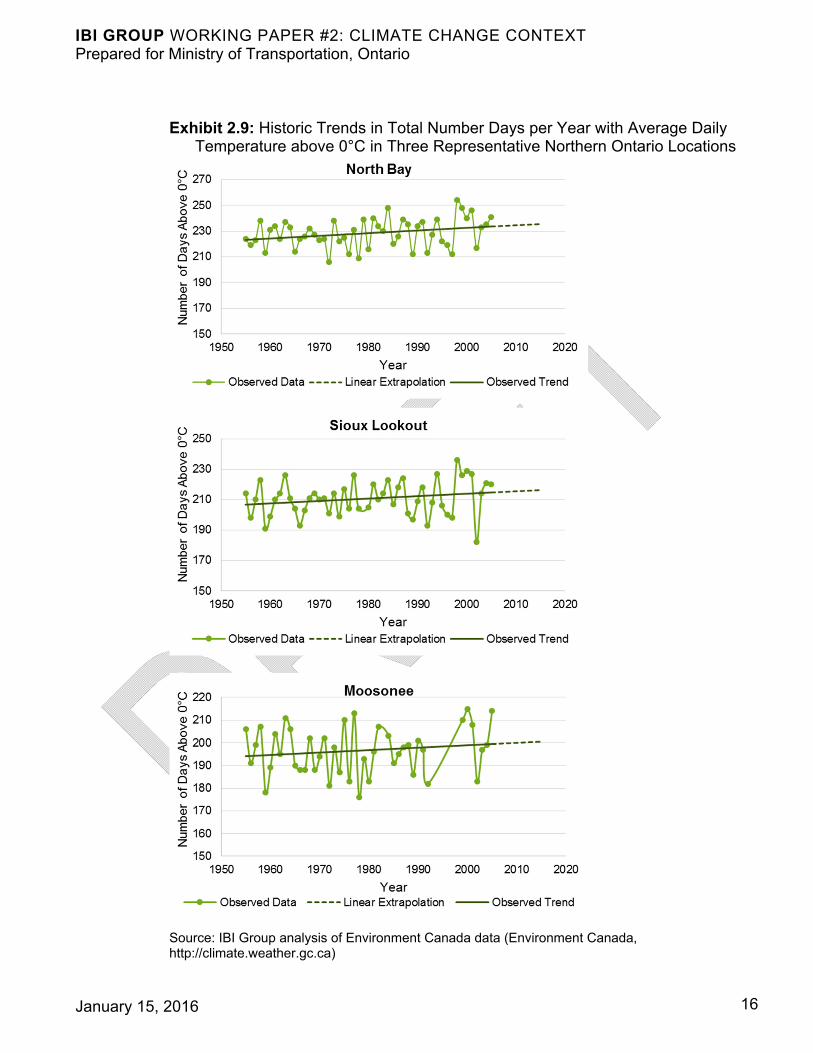
Exhibit 2.9 shows three examples of local temperature trends over the past 36 to 52 years — at North Bay, Moosonee and Sioux Lookout — as measured by the number of days in each year with average daily temperature above 0°C.
While significant year-to-year fluctuations can be seen, a trend line can be statistically fitted to the data that clearly shows a linear (straight-line) temperature trend. While other types of statistical fit to the data were tested (exponential, polynomial, etc.), there was no significant increase in the fit of the trend line compared to linear trends. This indicates that the average number of days per year with temperatures above 0°C in, for example, North Bay has increased by about 12 days over the 52-year period from 1953 to 2005.
IBI GROUP WORKING PAPER #2: CLIMATE CHANGE CONTEXT Prepared for Ministry of Transportation, Ontario
January 15, 2016 16
Exhibit 2.9: Historic Trends in Total Number Days per Year with Average Daily Temperature above 0°C in Three Representative Northern Ontario Locations
Source: IBI Group analysis of Environment Canada data (Environment Canada, http://climate.weather.gc.ca)
IBI GROUP WORKING PAPER #2: CLIMATE CHANGE CONTEXT Prepared for Ministry of Transportation, Ontario
January 15, 2016 17
2.3.2 Historic Local Trends
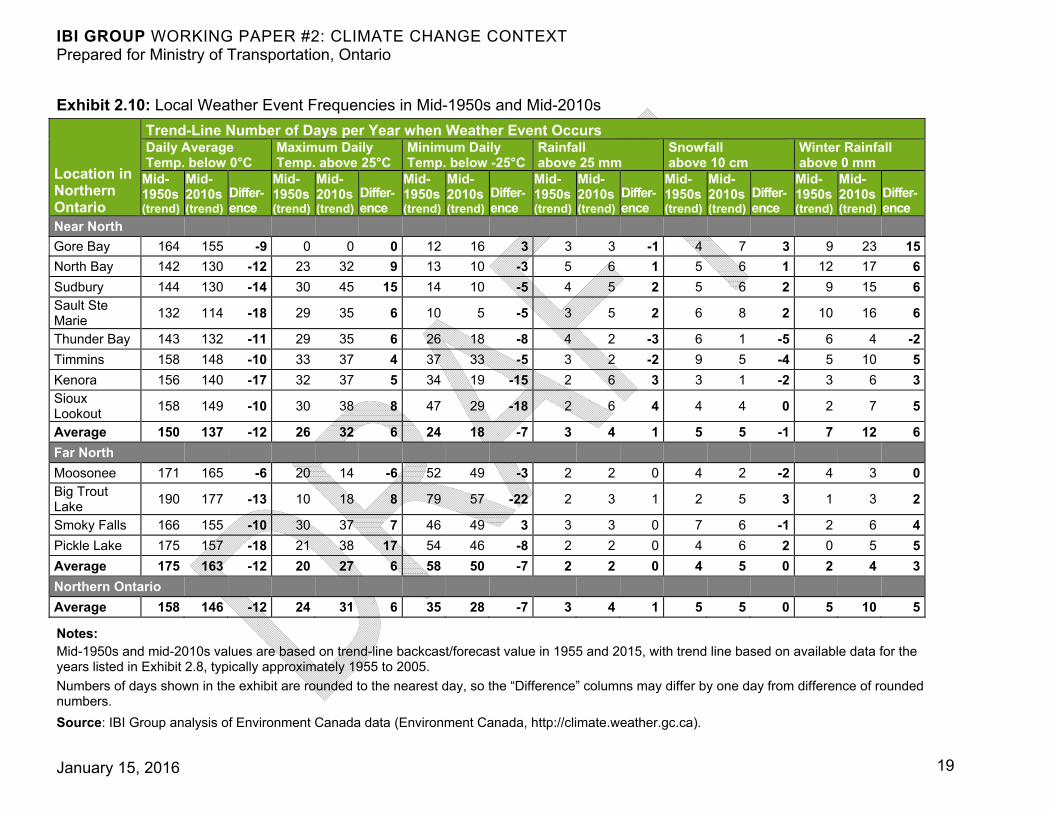
Exhibit 2.10 shows, in tabular form, the results of extending the linear trend lines slightly — back in time to 1955 where data are not available, and forward to the present, 2015 — for similar plots of a variety of weather events. At each location, the exhibit shows the “trend-line” number of days per year that six weather events have occurred in the mid-1950s, and in the mid-2010s:
average daily temperature below 0°C2;
temperature above 25°C;
temperature below minus 25°C;
rainfall more than 25 mm;
snowfall more than 10 cm; and
winter rainfall of more than 0 mm during the five months December 1 to April 30 each year.
These particular types of weather events were selected in order to demonstrate the ongoing local effects of climate change in terms of trends in numbers of cold and warm days per year and increases or decreases in rainfall, snowfall and freezing rain, and based on data availability. Limits on the types of analysis that could be reliably conducted were also a factor in the selection of events. For example, more-extreme temperature events such as the number of days per year with temperatures above 30⁰C and below -30⁰C, which are more likely to have effects on transportation, are not frequent enough for statistical reliability to measure trends, so the number of days with temperatures beyond +25⁰C and -25⁰C are analyzed instead.
As another example, the available data does not provide a direct measure of the number of days per year with freezing rain, so days per year with rainfall greater than 0 mm in the five coldest months is used as a proxy variable for days per year with freezing rain, reasoning that rainfall events in the coldest months are highly likely to start or end as freezing rain. While the proxy is approximate, it serves as an indicator of the frequency of freezing rain events in Northern Ontario. This is a particularly important type of data because of the severe effects freezing rain events can have on transportation operations (e.g. road blockages, motor vehicle collisions), traveller safety and the efficiency of goods movement.
Another extremely important influence of ongoing climate warming and more variable weather conditions in Northern Ontario is its effect on operating seasons, service reliability, safety, and operating costs for winter roads in the
2 The main purpose for including this variable in the analysis is to serve as a proxy for trends in the operating season length for winter roads in Northern Ontario; for this purpose the total number of days per year with average daily temperature below 0⁰C is more directly relevant than its inverse the total number of days per year with average daily temperature above 0⁰C.
IBI GROUP WORKING PAPER #2: CLIMATE CHANGE CONTEXT Prepared for Ministry of Transportation, Ontario
January 15, 2016 18
Far North. As described further in Subsections 2.3.4, 3.2.2 and 4.2.2, trends in the number of days per year with temperature below 0⁰C are used in this paper as a statistically reliable proxy for trends in winter roads operating season lengths. A month or two of temperatures less than 0⁰C is needed before the ice is thick enough for trucks to use winter roads. The trends in number of days per year less than 0⁰C are adopted as a suitable proxy for the trends in operating season length, given the absence of trend data for actual operating season lengths.
As noted above, these values were derived from the linear trend lines in each of the twelve locations for each of the six weather events, based on the types of weather data plotted for each location as shown in Exhibit 2.9 for three locations. They are therefore not the actual numbers of such days measured in those specific years, but rather trend-line or “smoothed” values; the values shown for 1955 should therefore be interpreted as representing conditions in the mid-1950s and, similarly, the 2015 values as representing conditions in the mid-2010s. The values for 2015 are continuations of the trend line from the last year of available data (2005 in most locations) to 2015. These smoothed values are more useful than actual, year-specific values for the purpose of quantifying average changes over decades of time.
The data curves of year-to-year fluctuations and statistically fitted linear trend lines for measured changes in the total numbers of day per year with average daily temperature less than 0⁰C at the twelve Northern Ontario locations are presented in Appendix A. For further detail, the source data provided by Environment Canada are available online (<http://climate.weather.gc.ca>).
Exhibit 2.10 also shows the changes in the numbers of days per year when the various weather events occurred, between the mid-1950s and the mid-2010s (continuing the trend from approximately 2005). It can be seen that over this 60-year period there has been a substantial decrease in the number of days per year with temperature below 0°C, lesser but significant increases in the number of days per year with temperature greater than 25°C, and significant decreases in the number of days per year with temperatures below -25°C. There has been little change in the number of days per year with significant rainfall or snowfall, but a more noticeable trend to increases in the frequency of days/year with winter rain; e.g. rainfall of more than 0 mm during the five coldest months of the year.
This latter trend supports the anecdotal evidence that freezing rain/ice storm events are becoming more frequent since, as noted above, rain events are more likely to begin as, or turn into, freezing rain events if they fall in the coldest winter months, and the growth in winter precipitation illustrated earlier in Exhibit 2.7 is increasingly falling as rain (or freezing rain), rather than as snow.
IBI GROUP WORKING PAPER #2: CLIMATE CHANGE CONTEXT Prepared for Ministry of Transportation, Ontario
January 15, 2016 19
Exhibit 2.10: Local Weather Event Frequencies in Mid-1950s and Mid-2010s
Location in Northern Ontario
Trend-Line Number of Days per Year when Weather Event Occurs Daily Average Temp. below 0°C
Maximum Daily Temp. above 25°C
Minimum Daily Temp. below -25°C
Rainfall above 25 mm
Snowfall above 10 cm
Winter Rainfall above 0 mm
Mid-1950s (trend)
Mid-2010s (trend)
Differ-ence
Mid-1950s (trend)
Mid-2010s(trend)
Differ-ence
Mid-1950s(trend)
Mid-2010s(trend)
Differ-ence
Mid-1950s(trend)
Mid-2010s (trend)
Differ-ence
Mid-1950s(trend)
Mid-2010s(trend)
Differ-ence
Mid-1950s(trend)
Mid-2010s(trend)
Differ-ence
Near North
Gore Bay 164 155 -9 0 0 0 12 16 3 3 3 -1 4 7 3 9 23 15
North Bay 142 130 -12 23 32 9 13 10 -3 5 6 1 5 6 1 12 17 6
Sudbury 144 130 -14 30 45 15 14 10 -5 4 5 2 5 6 2 9 15 6Sault Ste Marie
132 114 -18 29 35 6 10 5 -5 3 5 2 6 8 2 10 16 6
Thunder Bay 143 132 -11 29 35 6 26 18 -8 4 2 -3 6 1 -5 6 4 -2
Timmins 158 148 -10 33 37 4 37 33 -5 3 2 -2 9 5 -4 5 10 5
Kenora 156 140 -17 32 37 5 34 19 -15 2 6 3 3 1 -2 3 6 3Sioux Lookout
158 149 -10 30 38 8 47 29 -18 2 6 4 4 4 0 2 7 5
Average 150 137 -12 26 32 6 24 18 -7 3 4 1 5 5 -1 7 12 6
Far North
Moosonee 171 165 -6 20 14 -6 52 49 -3 2 2 0 4 2 -2 4 3 0Big Trout Lake
190 177 -13 10 18 8 79 57 -22 2 3 1 2 5 3 1 3 2
Smoky Falls 166 155 -10 30 37 7 46 49 3 3 3 0 7 6 -1 2 6 4
Pickle Lake 175 157 -18 21 38 17 54 46 -8 2 2 0 4 6 2 0 5 5
Average 175 163 -12 20 27 6 58 50 -7 2 2 0 4 5 0 2 4 3
Northern Ontario
Average 158 146 -12 24 31 6 35 28 -7 3 4 1 5 5 0 5 10 5
Notes: Mid-1950s and mid-2010s values are based on trend-line backcast/forecast value in 1955 and 2015, with trend line based on available data for the years listed in Exhibit 2.8, typically approximately 1955 to 2005.
Numbers of days shown in the exhibit are rounded to the nearest day, so the “Difference” columns may differ by one day from difference of rounded numbers.
Source: IBI Group analysis of Environment Canada data (Environment Canada, http://climate.weather.gc.ca).
IBI GROUP WORKING PAPER #2: CLIMATE CHANGE CONTEXT Prepared for Ministry of Transportation, Ontario
January 15, 2016 20
2.3.3 Projected Local Trends
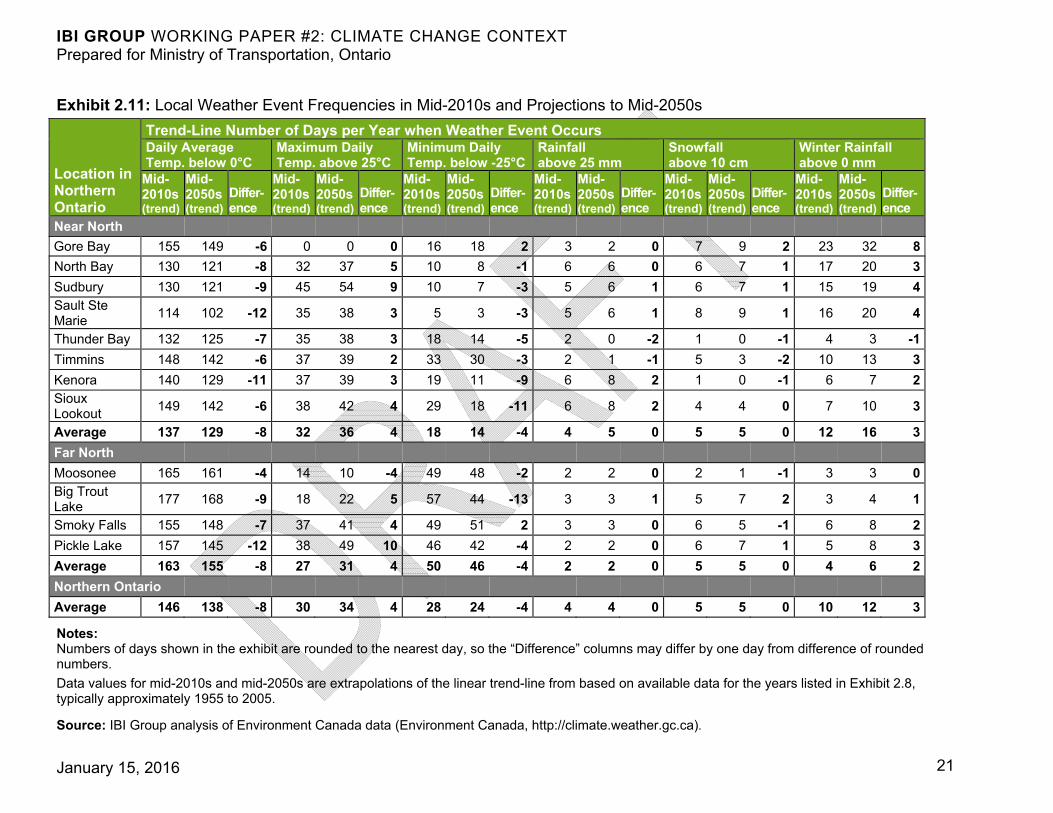
Based on the data in Exhibit 2.10 and on a linear projection of trend lines continuing 40 years into the future, to 2055, Exhibit 2.11 shows the average number of days per year that each weather event is estimated to occur in the mid-2050s. The exhibit also shows the existing number of days per year for each event in the mid-2010s and shows the projected changes in numbers of days per year that the various events may be expected to occur between now and the mid-2050s, in the same format as shown in Exhibit 2.10.
As discussed earlier in Section 2.1.2, a linear projection assumes that the warming trend of the past 60 years (i.e. 50 years with 10-year projected trend) will continue at the same rate for the next 40 years which, is by no means certain.
Linear projections may therefore be conservative — that is, the actual changes may be more extreme than the linear projections — but they provide a useful basis for assessing climate change trends to mid-century at the representative Northern Ontario locations. Because of these limitations, the data in Exhibits 2.10 and 2.11 should be interpreted as being approximate, and broadly representative of these general areas in Northern Ontario, rather than as measured data pertaining to each specific location.
Ontario and other governments worldwide (Ministry of the Environment and Climate Change 2015, Paris Agreement – European Commission 2015) are working to try to reduce the rate of warming; however, a stringent international climate change mitigation program will likely be required to achieve this — an objective which has had limited success in over 25 years of effort — and meanwhile the rate of increase has continued unabated and may be accelerating. See Section 3 for more details on mitigation actions.
Based on continuing trends from historical data to approximately 2005, Exhibits 2.10 and 2.11 show the changes in the annual number of days per year with average daily temperature below 0⁰C. It can be seen that the numbers of below 0⁰C days per year have decreased significantly over the past 60 years by an average of 12 days at both the eight Near North locations and at the four locations in the Far North, and are projected to continue decreasing during the coming 40 years at the same annual rates (or at higher rates if the linear trend lines turn out to be conservative). By the mid-2050s, the linear projections indicate an estimated eight fewer days with temperatures below 0⁰C averaged over the eight locations in the Near North and over the four locations in the Far North.
IBI GROUP WORKING PAPER #2: CLIMATE CHANGE CONTEXT Prepared for Ministry of Transportation, Ontario
January 15, 2016 21
Exhibit 2.11: Local Weather Event Frequencies in Mid-2010s and Projections to Mid-2050s
Location in Northern Ontario
Trend-Line Number of Days per Year when Weather Event Occurs Daily Average Temp. below 0°C
Maximum Daily Temp. above 25°C
Minimum Daily Temp. below -25°C
Rainfall above 25 mm
Snowfall above 10 cm
Winter Rainfall above 0 mm
Mid-2010s (trend)
Mid-2050s (trend)
Differ-ence
Mid-2010s (trend)
Mid-2050s (trend)
Differ-ence
Mid-2010s (trend)
Mid-2050s(trend)
Differ-ence
Mid-2010s (trend)
Mid-2050s (trend)
Differ-ence
Mid-2010s (trend)
Mid-2050s(trend)
Differ-ence
Mid-2010s (trend)
Mid-2050s(trend)
Differ-ence
Near North
Gore Bay 155 149 -6 0 0 0 16 18 2 3 2 0 7 9 2 23 32 8
North Bay 130 121 -8 32 37 5 10 8 -1 6 6 0 6 7 1 17 20 3
Sudbury 130 121 -9 45 54 9 10 7 -3 5 6 1 6 7 1 15 19 4Sault Ste Marie
114 102 -12 35 38 3 5 3 -3 5 6 1 8 9 1 16 20 4
Thunder Bay 132 125 -7 35 38 3 18 14 -5 2 0 -2 1 0 -1 4 3 -1
Timmins 148 142 -6 37 39 2 33 30 -3 2 1 -1 5 3 -2 10 13 3
Kenora 140 129 -11 37 39 3 19 11 -9 6 8 2 1 0 -1 6 7 2Sioux Lookout
149 142 -6 38 42 4 29 18 -11 6 8 2 4 4 0 7 10 3
Average 137 129 -8 32 36 4 18 14 -4 4 5 0 5 5 0 12 16 3
Far North
Moosonee 165 161 -4 14 10 -4 49 48 -2 2 2 0 2 1 -1 3 3 0Big Trout Lake
177 168 -9 18 22 5 57 44 -13 3 3 1 5 7 2 3 4 1
Smoky Falls 155 148 -7 37 41 4 49 51 2 3 3 0 6 5 -1 6 8 2
Pickle Lake 157 145 -12 38 49 10 46 42 -4 2 2 0 6 7 1 5 8 3
Average 163 155 -8 27 31 4 50 46 -4 2 2 0 5 5 0 4 6 2
Northern Ontario
Average 146 138 -8 30 34 4 28 24 -4 4 4 0 5 5 0 10 12 3
Notes: Numbers of days shown in the exhibit are rounded to the nearest day, so the “Difference” columns may differ by one day from difference of rounded numbers.
Data values for mid-2010s and mid-2050s are extrapolations of the linear trend-line from based on available data for the years listed in Exhibit 2.8, typically approximately 1955 to 2005.
Source: IBI Group analysis of Environment Canada data (Environment Canada, http://climate.weather.gc.ca).
IBI GROUP WORKING PAPER #2: CLIMATE CHANGE CONTEXT Prepared for Ministry of Transportation, Ontario
January 15, 2016 22
2.3.4 Transportation Impacts of Temperature Trends
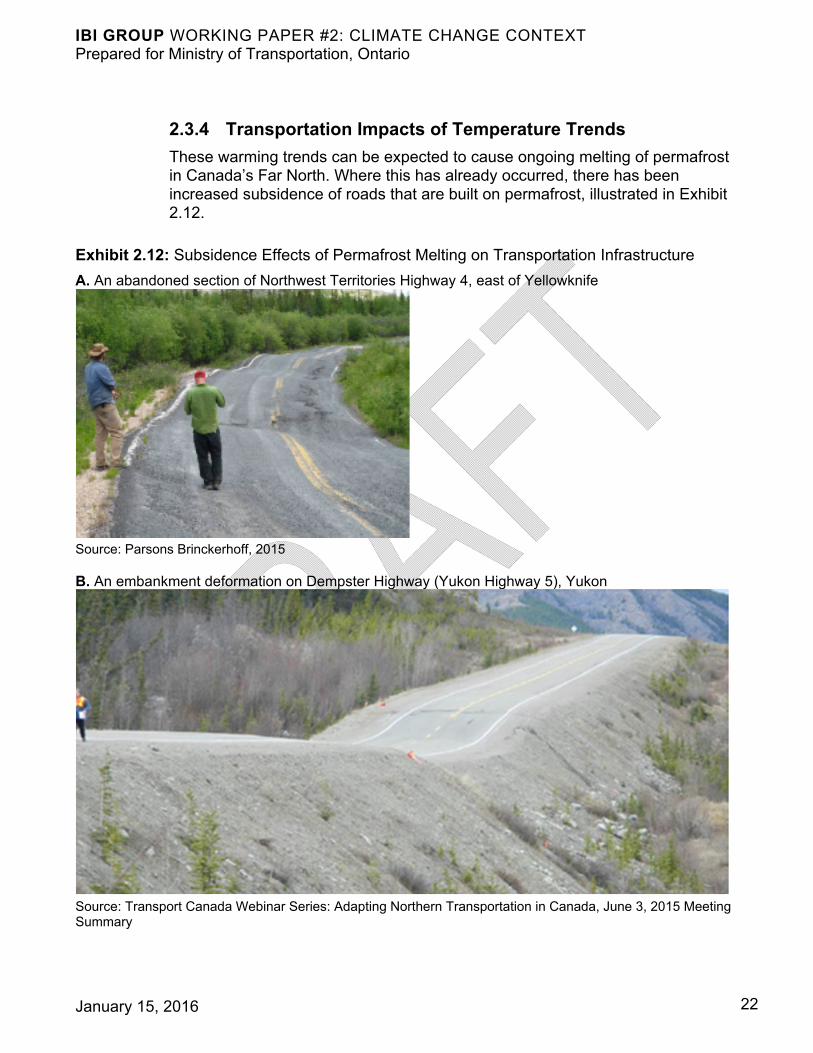
These warming trends can be expected to cause ongoing melting of permafrost in Canada’s Far North. Where this has already occurred, there has been increased subsidence of roads that are built on permafrost, illustrated in Exhibit 2.12.
Exhibit 2.12: Subsidence Effects of Permafrost Melting on Transportation Infrastructure
A. An abandoned section of Northwest Territories Highway 4, east of Yellowknife
Source: Parsons Brinckerhoff, 2015
B. An embankment deformation on Dempster Highway (Yukon Highway 5), Yukon
Source: Transport Canada Webinar Series: Adapting Northern Transportation in Canada, June 3, 2015 Meeting Summary
IBI GROUP WORKING PAPER #2: CLIMATE CHANGE CONTEXT Prepared for Ministry of Transportation, Ontario
January 15, 2016 23
As permafrost becomes discontinuous in the underlying soil, the volume and stability of the soil decreases, leading to the type of damage shown in the exhibits, which can affect not only roads but also rail lines, airport runways and structures of all kinds, with potential impacts on road user safety and goods movement efficiency. Permafrost issues in Ontario currently affect the Far North more than the Near North, since the southern boundary of the discontinuous permafrost zone lies north of the boundary between the two sub-regions (shown later in Exhibit 3.3) and is expected to move slowly northward with ongoing warming trends.
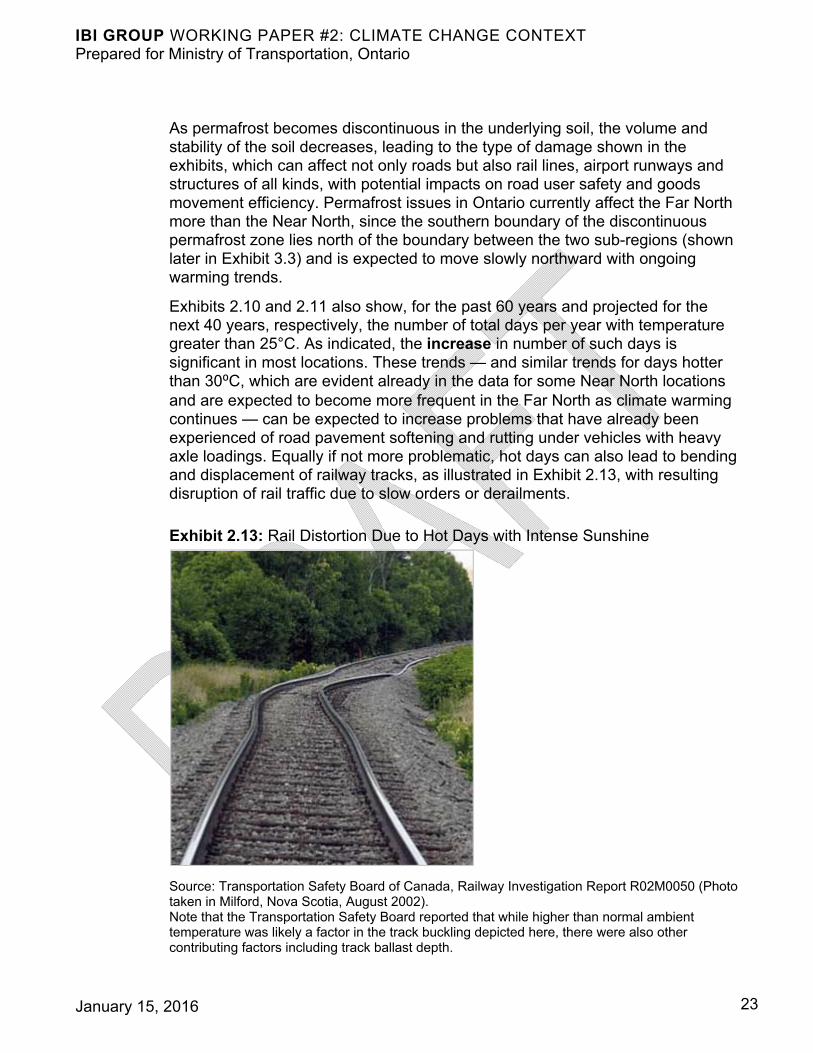
Exhibits 2.10 and 2.11 also show, for the past 60 years and projected for the next 40 years, respectively, the number of total days per year with temperature greater than 25°C. As indicated, the increase in number of such days is significant in most locations. These trends — and similar trends for days hotter than 30⁰C, which are evident already in the data for some Near North locations and are expected to become more frequent in the Far North as climate warming continues — can be expected to increase problems that have already been experienced of road pavement softening and rutting under vehicles with heavy axle loadings. Equally if not more problematic, hot days can also lead to bending and displacement of railway tracks, as illustrated in Exhibit 2.13, with resulting disruption of rail traffic due to slow orders or derailments.
Exhibit 2.13: Rail Distortion Due to Hot Days with Intense Sunshine
Source: Transportation Safety Board of Canada, Railway Investigation Report R02M0050 (Photo taken in Milford, Nova Scotia, August 2002). Note that the Transportation Safety Board reported that while higher than normal ambient temperature was likely a factor in the track buckling depicted here, there were also other contributing factors including track ballast depth.
IBI GROUP WORKING PAPER #2: CLIMATE CHANGE CONTEXT Prepared for Ministry of Transportation, Ontario
January 15, 2016 24
Exhibits 2.10 and 2.11 also show the number of days per year with temperature below -25°C. As indicated, in all but one of the 12 locations (i.e. Gore Bay) there has been a significant decrease in the number of such days per year over the past 60 years and the trend is expected to continue. This, plus the reduced number of days/year with average daily temperatures below 0⁰C and the overall warming trends shown in the first and second sets of three columns from the left in each exhibit, has decreased the number of days in which winter roads in the Far North can be safely operated.
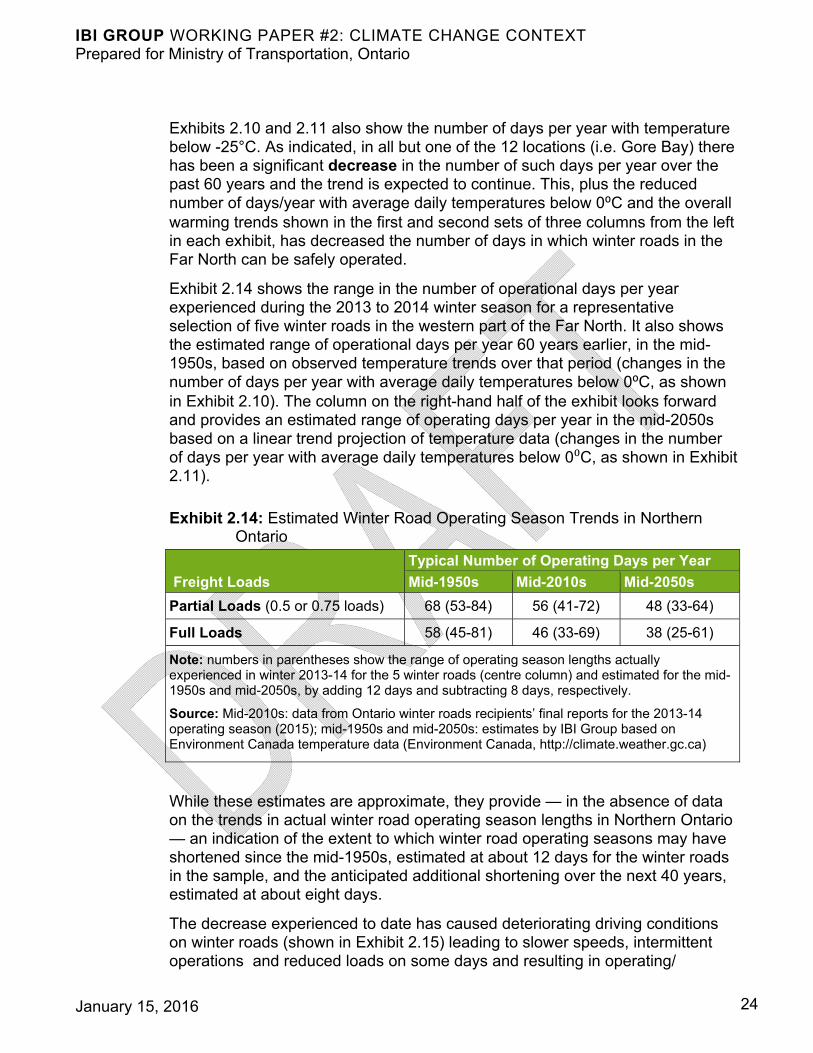
Exhibit 2.14 shows the range in the number of operational days per year experienced during the 2013 to 2014 winter season for a representative selection of five winter roads in the western part of the Far North. It also shows the estimated range of operational days per year 60 years earlier, in the mid-1950s, based on observed temperature trends over that period (changes in the number of days per year with average daily temperatures below 0⁰C, as shown in Exhibit 2.10). The column on the right-hand half of the exhibit looks forward and provides an estimated range of operating days per year in the mid-2050s based on a linear trend projection of temperature data (changes in the number of days per year with average daily temperatures below 0⁰C, as shown in Exhibit 2.11).
Exhibit 2.14: Estimated Winter Road Operating Season Trends in Northern Ontario
Freight Loads
Typical Number of Operating Days per Year
Mid-1950s Mid-2010s Mid-2050s
Partial Loads (0.5 or 0.75 loads) 68 (53-84) 56 (41-72) 48 (33-64)
Full Loads 58 (45-81) 46 (33-69) 38 (25-61)
Note: numbers in parentheses show the range of operating season lengths actually experienced in winter 2013-14 for the 5 winter roads (centre column) and estimated for the mid-1950s and mid-2050s, by adding 12 days and subtracting 8 days, respectively.
Source: Mid-2010s: data from Ontario winter roads recipients’ final reports for the 2013-14 operating season (2015); mid-1950s and mid-2050s: estimates by IBI Group based on Environment Canada temperature data (Environment Canada, http://climate.weather.gc.ca)
While these estimates are approximate, they provide — in the absence of data on the trends in actual winter road operating season lengths in Northern Ontario — an indication of the extent to which winter road operating seasons may have shortened since the mid-1950s, estimated at about 12 days for the winter roads in the sample, and the anticipated additional shortening over the next 40 years, estimated at about eight days.
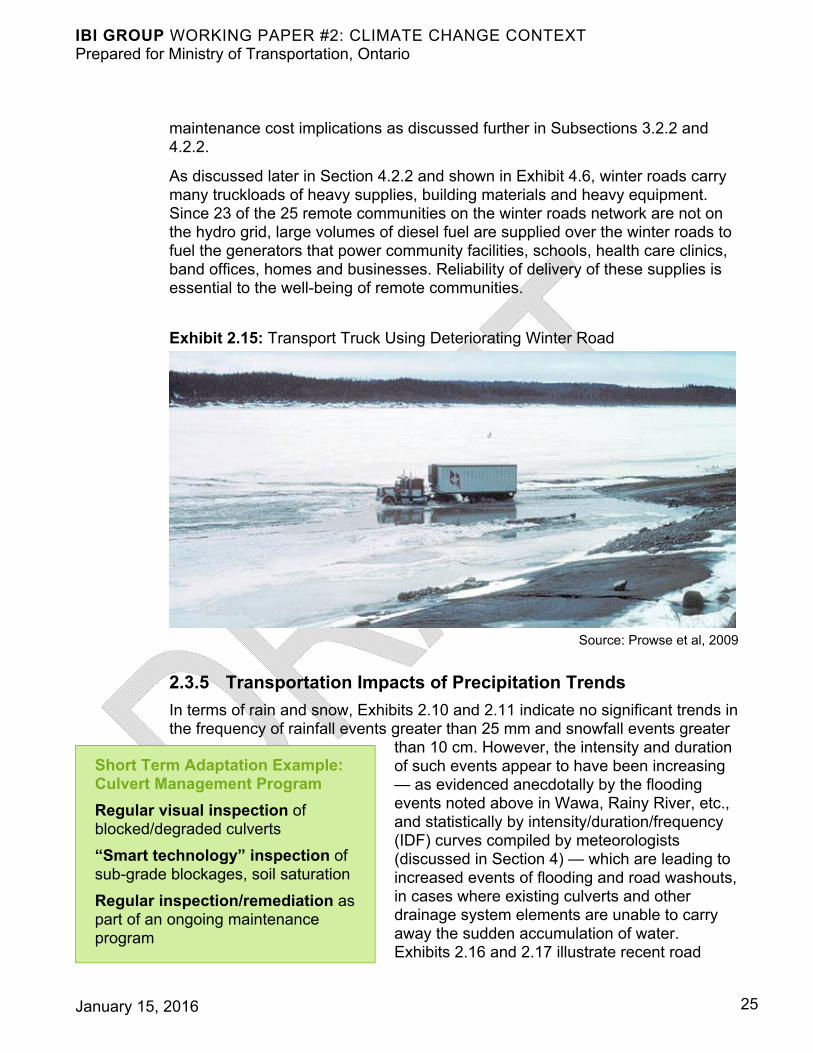
The decrease experienced to date has caused deteriorating driving conditions on winter roads (shown in Exhibit 2.15) leading to slower speeds, intermittent operations and reduced loads on some days and resulting in operating/
IBI GROUP WORKING PAPER #2: CLIMATE CHANGE CONTEXT Prepared for Ministry of Transportation, Ontario
January 15, 2016 25
Short Term Adaptation Example: Culvert Management Program
Regular visual inspection of blocked/degraded culverts
“Smart technology” inspection of sub-grade blockages, soil saturation
Regular inspection/remediation as part of an ongoing maintenance program
maintenance cost implications as discussed further in Subsections 3.2.2 and 4.2.2.
As discussed later in Section 4.2.2 and shown in Exhibit 4.6, winter roads carry many truckloads of heavy supplies, building materials and heavy equipment. Since 23 of the 25 remote communities on the winter roads network are not on the hydro grid, large volumes of diesel fuel are supplied over the winter roads to fuel the generators that power community facilities, schools, health care clinics, band offices, homes and businesses. Reliability of delivery of these supplies is essential to the well-being of remote communities.
Exhibit 2.15: Transport Truck Using Deteriorating Winter Road
Source: Prowse et al, 2009
2.3.5 Transportation Impacts of Precipitation Trends
In terms of rain and snow, Exhibits 2.10 and 2.11 indicate no significant trends in the frequency of rainfall events greater than 25 mm and snowfall events greater
than 10 cm. However, the intensity and duration of such events appear to have been increasing — as evidenced anecdotally by the flooding events noted above in Wawa, Rainy River, etc., and statistically by intensity/duration/frequency (IDF) curves compiled by meteorologists (discussed in Section 4) — which are leading to increased events of flooding and road washouts, in cases where existing culverts and other drainage system elements are unable to carry away the sudden accumulation of water. Exhibits 2.16 and 2.17 illustrate recent road
IBI GROUP WORKING PAPER #2: CLIMATE CHANGE CONTEXT Prepared for Ministry of Transportation, Ontario
January 15, 2016 26
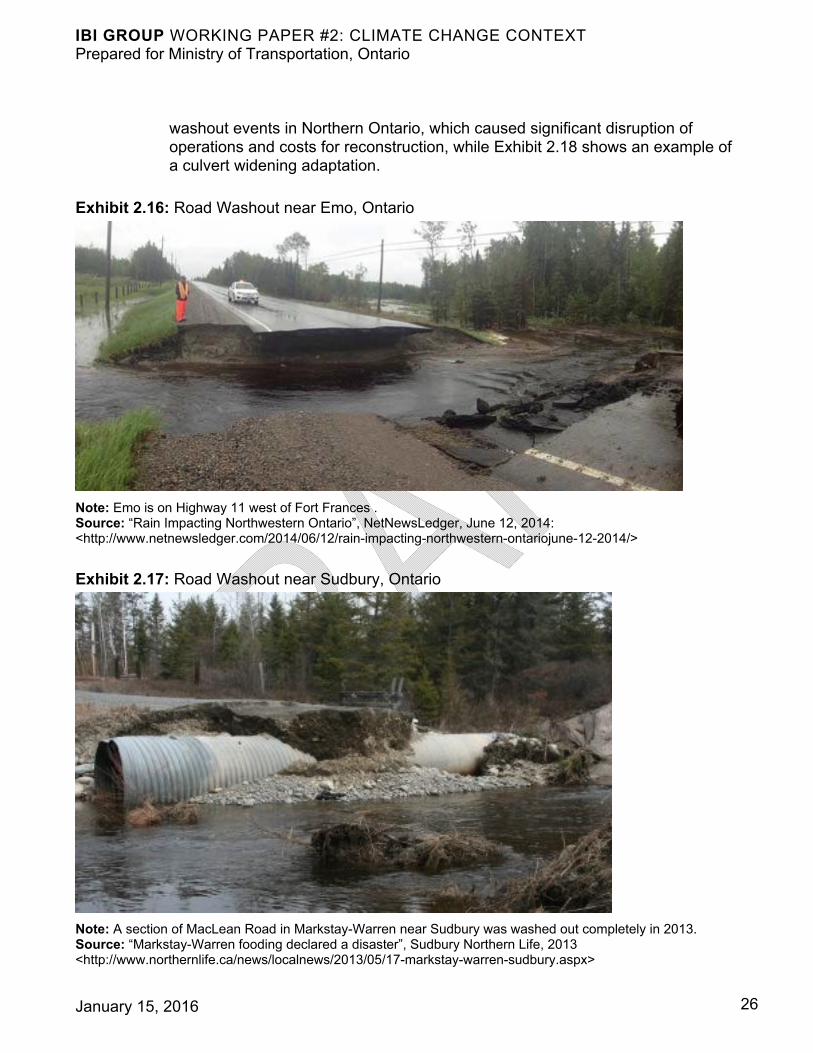
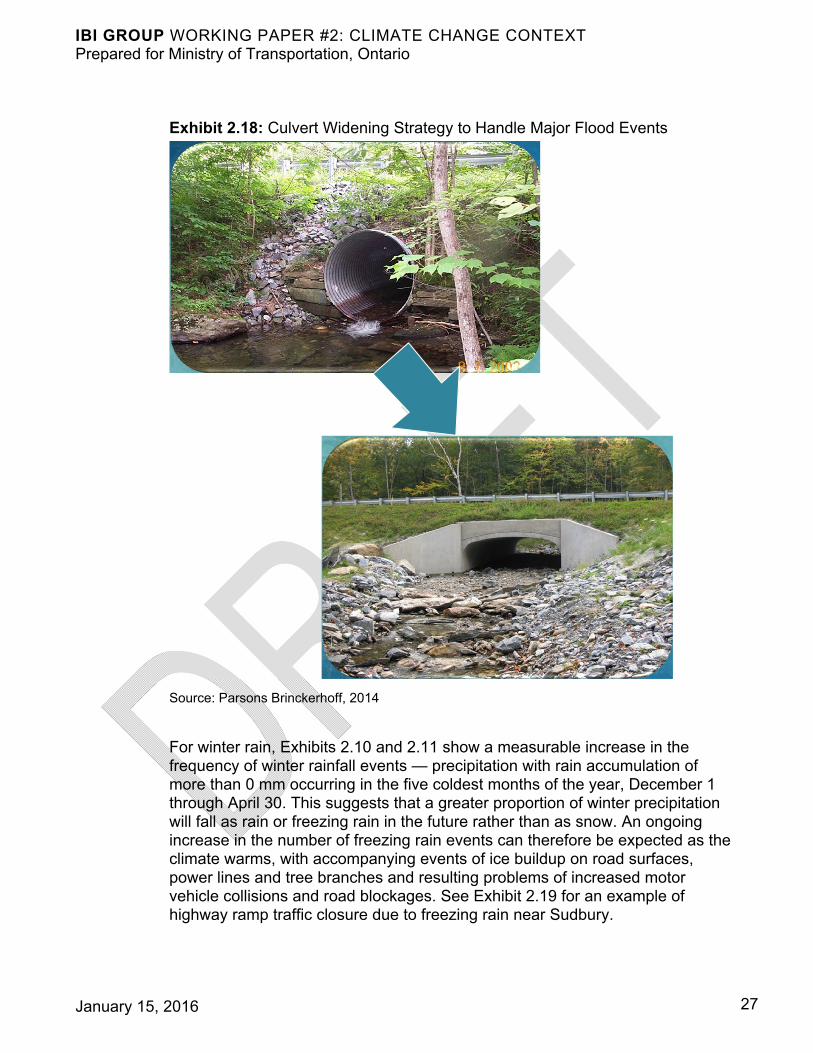
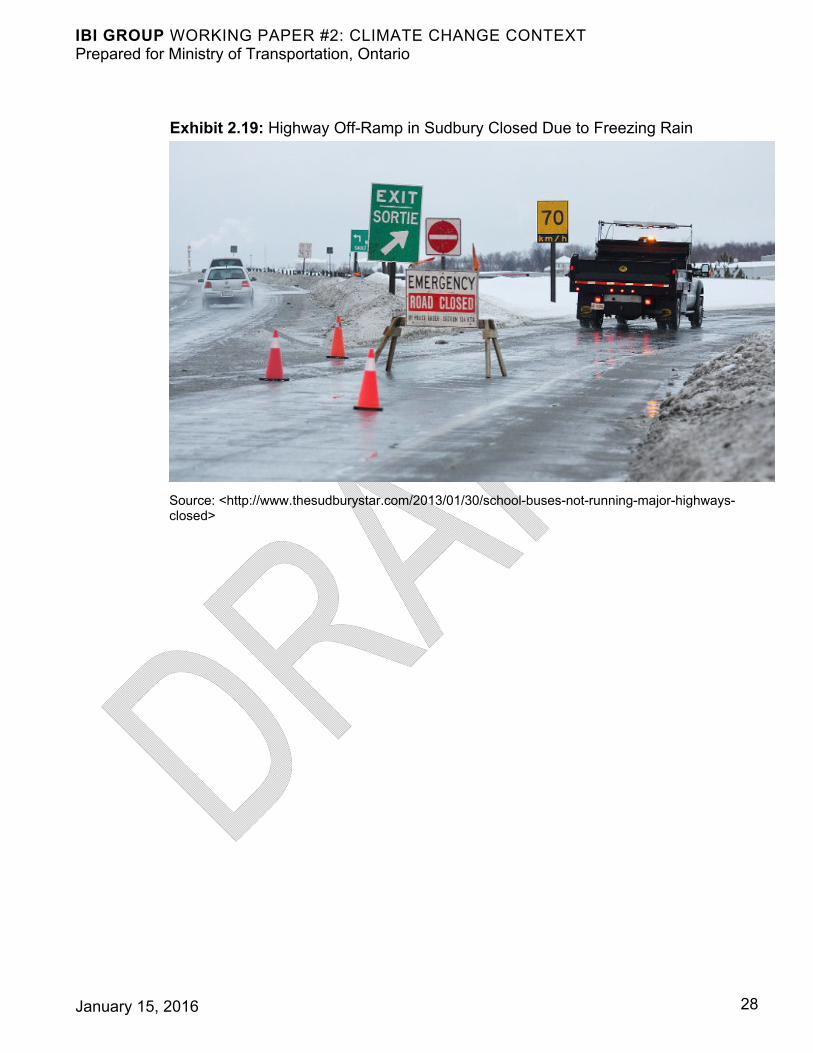
washout events in Northern Ontario, which caused significant disruption of operations and costs for reconstruction, while Exhibit 2.18 shows an example of a culvert widening adaptation.
Exhibit 2.16: Road Washout near Emo, Ontario
Note: Emo is on Highway 11 west of Fort Frances . Source: “Rain Impacting Northwestern Ontario”, NetNewsLedger, June 12, 2014: <http://www.netnewsledger.com/2014/06/12/rain-impacting-northwestern-ontariojune-12-2014/>
Exhibit 2.17: Road Washout near Sudbury, Ontario
Note: A section of MacLean Road in Markstay-Warren near Sudbury was washed out completely in 2013. Source: “Markstay-Warren fooding declared a disaster”, Sudbury Northern Life, 2013 <http://www.northernlife.ca/news/localnews/2013/05/17-markstay-warren-sudbury.aspx>
IBI GROUP WORKING PAPER #2: CLIMATE CHANGE CONTEXT Prepared for Ministry of Transportation, Ontario
January 15, 2016 27
Exhibit 2.18: Culvert Widening Strategy to Handle Major Flood Events
Source: Parsons Brinckerhoff, 2014
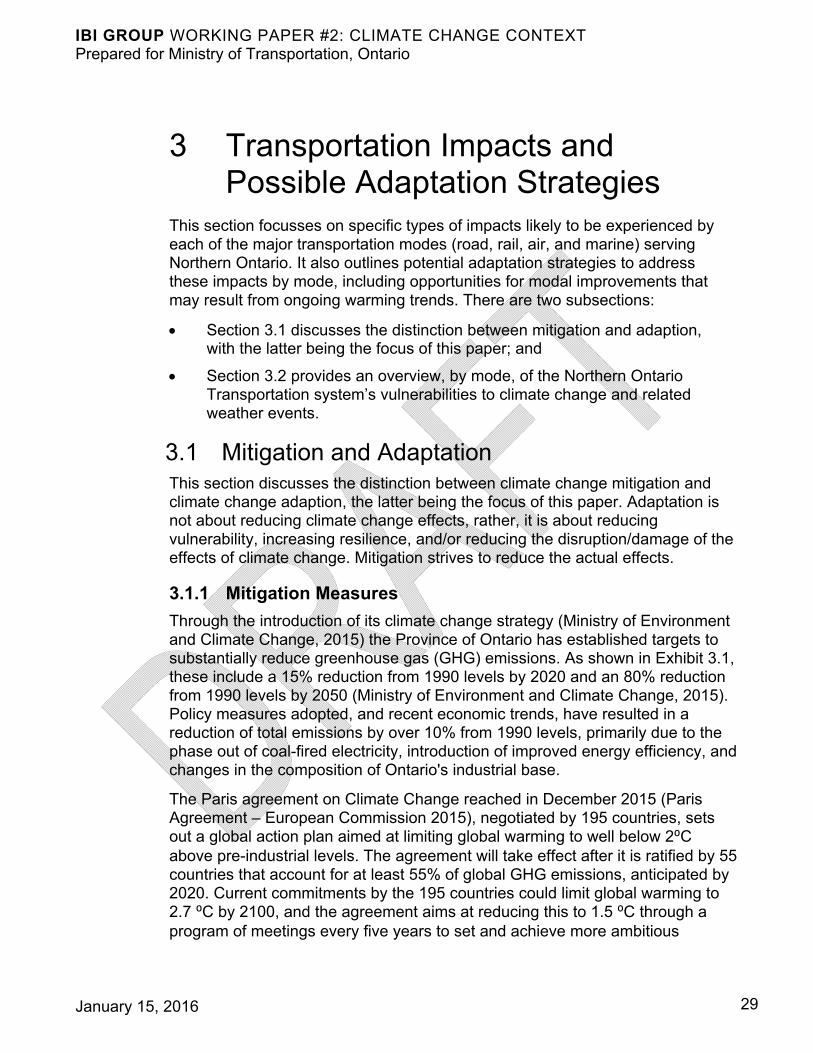
For winter rain, Exhibits 2.10 and 2.11 show a measurable increase in the frequency of winter rainfall events — precipitation with rain accumulation of more than 0 mm occurring in the five coldest months of the year, December 1 through April 30. This suggests that a greater proportion of winter precipitation will fall as rain or freezing rain in the future rather than as snow. An ongoing increase in the number of freezing rain events can therefore be expected as the climate warms, with accompanying events of ice buildup on road surfaces, power lines and tree branches and resulting problems of increased motor vehicle collisions and road blockages. See Exhibit 2.19 for an example of highway ramp traffic closure due to freezing rain near Sudbury.
IBI GROUP WORKING PAPER #2: CLIMATE CHANGE CONTEXT Prepared for Ministry of Transportation, Ontario
January 15, 2016 28
Exhibit 2.19: Highway Off-Ramp in Sudbury Closed Due to Freezing Rain
Source: <http://www.thesudburystar.com/2013/01/30/school-buses-not-running-major-highways-closed>
IBI GROUP WORKING PAPER #2: CLIMATE CHANGE CONTEXT Prepared for Ministry of Transportation, Ontario
January 15, 2016 29
3 Transportation Impacts and Possible Adaptation Strategies
This section focusses on specific types of impacts likely to be experienced by each of the major transportation modes (road, rail, air, and marine) serving Northern Ontario. It also outlines potential adaptation strategies to address these impacts by mode, including opportunities for modal improvements that may result from ongoing warming trends. There are two subsections:
Section 3.1 discusses the distinction between mitigation and adaption, with the latter being the focus of this paper; and
Section 3.2 provides an overview, by mode, of the Northern Ontario Transportation system’s vulnerabilities to climate change and related weather events.
3.1 Mitigation and Adaptation This section discusses the distinction between climate change mitigation and climate change adaption, the latter being the focus of this paper. Adaptation is not about reducing climate change effects, rather, it is about reducing vulnerability, increasing resilience, and/or reducing the disruption/damage of the effects of climate change. Mitigation strives to reduce the actual effects.
3.1.1 Mitigation Measures
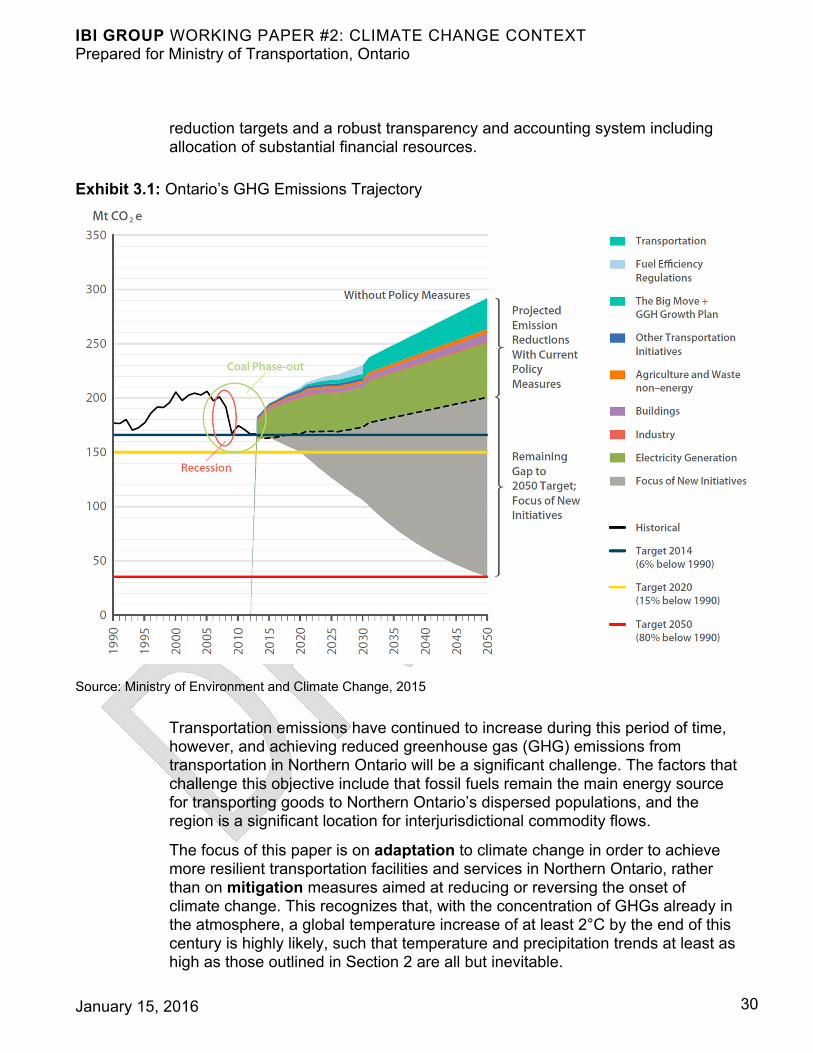
Through the introduction of its climate change strategy (Ministry of Environment and Climate Change, 2015) the Province of Ontario has established targets to substantially reduce greenhouse gas (GHG) emissions. As shown in Exhibit 3.1, these include a 15% reduction from 1990 levels by 2020 and an 80% reduction from 1990 levels by 2050 (Ministry of Environment and Climate Change, 2015). Policy measures adopted, and recent economic trends, have resulted in a reduction of total emissions by over 10% from 1990 levels, primarily due to the phase out of coal-fired electricity, introduction of improved energy efficiency, and changes in the composition of Ontario's industrial base.
The Paris agreement on Climate Change reached in December 2015 (Paris Agreement – European Commission 2015), negotiated by 195 countries, sets out a global action plan aimed at limiting global warming to well below 2⁰C above pre-industrial levels. The agreement will take effect after it is ratified by 55 countries that account for at least 55% of global GHG emissions, anticipated by 2020. Current commitments by the 195 countries could limit global warming to 2.7 ⁰C by 2100, and the agreement aims at reducing this to 1.5 ⁰C through a program of meetings every five years to set and achieve more ambitious
IBI GROUP WORKING PAPER #2: CLIMATE CHANGE CONTEXT Prepared for Ministry of Transportation, Ontario
January 15, 2016 30
reduction targets and a robust transparency and accounting system including allocation of substantial financial resources.
Exhibit 3.1: Ontario’s GHG Emissions Trajectory
Source: Ministry of Environment and Climate Change, 2015
Transportation emissions have continued to increase during this period of time, however, and achieving reduced greenhouse gas (GHG) emissions from transportation in Northern Ontario will be a significant challenge. The factors that challenge this objective include that fossil fuels remain the main energy source for transporting goods to Northern Ontario’s dispersed populations, and the region is a significant location for interjurisdictional commodity flows.
The focus of this paper is on adaptation to climate change in order to achieve more resilient transportation facilities and services in Northern Ontario, rather than on mitigation measures aimed at reducing or reversing the onset of climate change. This recognizes that, with the concentration of GHGs already in the atmosphere, a global temperature increase of at least 2°C by the end of this century is highly likely, such that temperature and precipitation trends at least as high as those outlined in Section 2 are all but inevitable.
IBI GROUP WORKING PAPER #2: CLIMATE CHANGE CONTEXT Prepared for Ministry of Transportation, Ontario
January 15, 2016 31
A stringent international agreement will be required to reduce emissions enough to change these trends significantly. The Paris Agreement is a significant step in that direction.
3.1.2 Adaptation Strategies
Adaptation initiatives include possible changes in the planning approach, design and construction standards, and maintenance and operations procedures. These are discussed in more detail in Section 3.2.
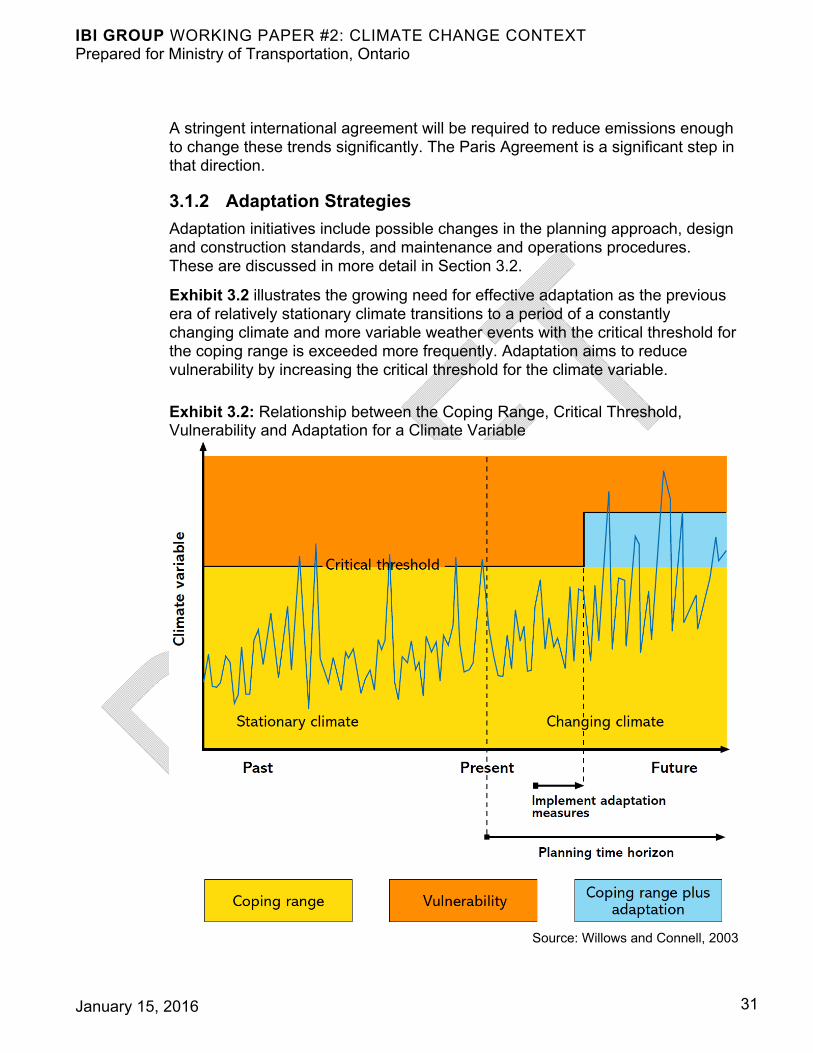
Exhibit 3.2 illustrates the growing need for effective adaptation as the previous era of relatively stationary climate transitions to a period of a constantly changing climate and more variable weather events with the critical threshold for the coping range is exceeded more frequently. Adaptation aims to reduce vulnerability by increasing the critical threshold for the climate variable.
Exhibit 3.2: Relationship between the Coping Range, Critical Threshold, Vulnerability and Adaptation for a Climate Variable
Source: Willows and Connell, 2003
IBI GROUP WORKING PAPER #2: CLIMATE CHANGE CONTEXT Prepared for Ministry of Transportation, Ontario
January 15, 2016 32
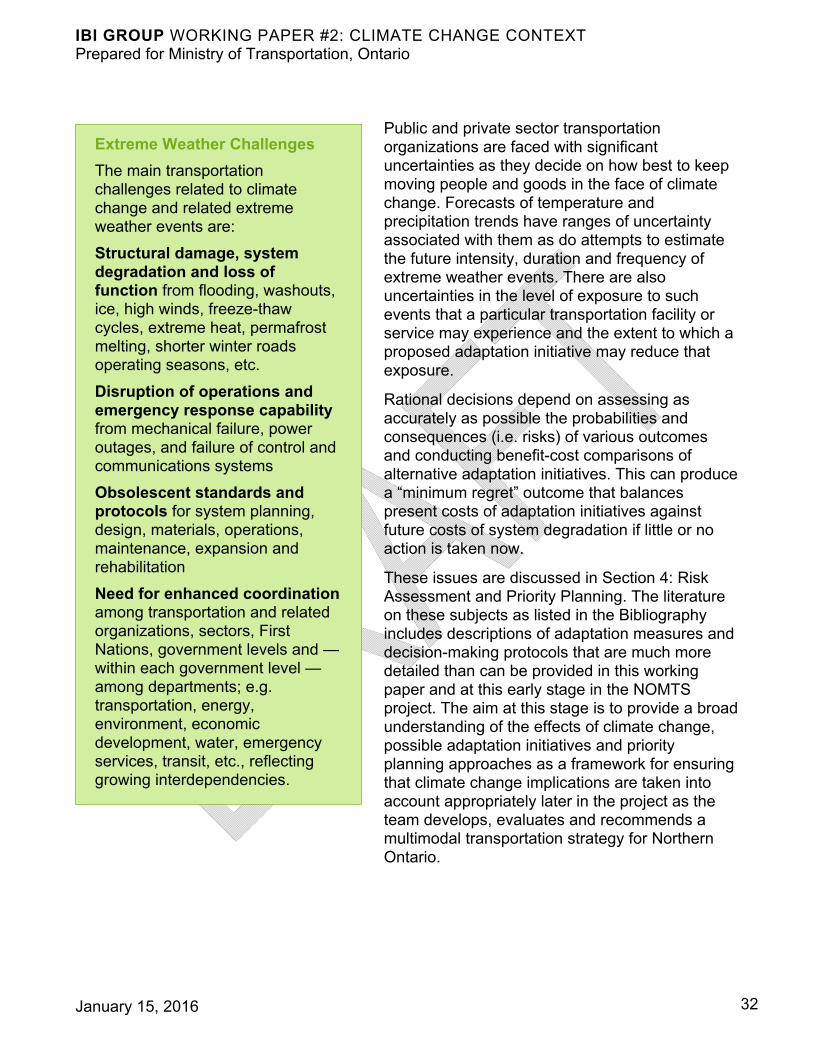
Extreme Weather Challenges
The main transportation challenges related to climate change and related extreme weather events are:
Structural damage, system degradation and loss of function from flooding, washouts, ice, high winds, freeze-thaw cycles, extreme heat, permafrost melting, shorter winter roads operating seasons, etc.
Disruption of operations and emergency response capability from mechanical failure, power outages, and failure of control and communications systems
Obsolescent standards and protocols for system planning, design, materials, operations, maintenance, expansion and rehabilitation
Need for enhanced coordination among transportation and related organizations, sectors, First Nations, government levels and — within each government level — among departments; e.g. transportation, energy, environment, economic development, water, emergency services, transit, etc., reflecting growing interdependencies.
Public and private sector transportation organizations are faced with significant uncertainties as they decide on how best to keep moving people and goods in the face of climate change. Forecasts of temperature and precipitation trends have ranges of uncertainty associated with them as do attempts to estimate the future intensity, duration and frequency of extreme weather events. There are also uncertainties in the level of exposure to such events that a particular transportation facility or service may experience and the extent to which a proposed adaptation initiative may reduce that exposure.
Rational decisions depend on assessing as accurately as possible the probabilities and consequences (i.e. risks) of various outcomes and conducting benefit-cost comparisons of alternative adaptation initiatives. This can produce a “minimum regret” outcome that balances present costs of adaptation initiatives against future costs of system degradation if little or no action is taken now.
These issues are discussed in Section 4: Risk Assessment and Priority Planning. The literature on these subjects as listed in the Bibliography includes descriptions of adaptation measures and decision-making protocols that are much more detailed than can be provided in this working paper and at this early stage in the NOMTS project. The aim at this stage is to provide a broad understanding of the effects of climate change, possible adaptation initiatives and priority planning approaches as a framework for ensuring that climate change implications are taken into account appropriately later in the project as the team develops, evaluates and recommends a multimodal transportation strategy for Northern Ontario.
IBI GROUP WORKING PAPER #2: CLIMATE CHANGE CONTEXT Prepared for Ministry of Transportation, Ontario
January 15, 2016 33
3.2 Effects of Climate Change, Adaptation Strategies and Potential Opportunities by Transportation Mode
Northern Ontario’s extensive multimodal transportation system is illustrated in Exhibit 3.3, showing that all four modes — road, rail, air and marine — have large roles in the Near North, while remote airfields and winter roads are the key transportation elements in the Far North. The approximate south boundary of permafrost in Ontario is also shown. As noted in Section 2, this boundary is expected to move slowly northward with increased melting of permafrost. The band of discontinuous permafrost north of it can be challenging for transportation and other built infrastructure. As permafrost melts in the underlying soil, roads, rail lines and airport runways can experience subsidence and embankment failure requiring extensive adaptation measures, discussed further below.
This section summarizes the most significant expected effects of climate change on Northern Ontario’s transportation system by transportation mode, and identifies adaptive strategies that could be taken to address these effects. Where available, potential transportation development opportunities presented by the warming climate are also identified, though these require further study to understand the requisite challenges posed in order to evaluate whether the net effect would be positive or negative.
In general, typical adaption strategies to address the types of effects listed in the sidebar involve the following:
Transportation Systems: new design, materials, monitoring, construction, operations, management, coordination, communications, maintenance and rehabilitation standards/actions;
Flooding: larger storm sewers and culverts, stronger/higher bridges, raising or relocating flood-prone roads and rail lines;
Wind Damage: stronger sign supports, wind shelters;
Ice: stronger overhead supports, automated monitoring and de-icing, tree canopy pruning, and exploration of future use of more subterranean infrastructure;
Heat: wider road/rail/runway expansion gaps, more use of concrete, heat tolerant asphalt;
Road/Rail/Runway Subsidence due to Permafrost Melting: ongoing corrective maintenance, reconstruction or relocation; and
Winter Roads Degradation: improved monitoring of ice thickness, ongoing corrective maintenance, realignment, or replacement with all-season roads.

IBI GROUP WORKING PAPER #2: CLIMATE CHANGE CONTEXT Prepared for Ministry of Transportation, Ontario
January 15, 2016 34
Exhibit 3.3: Northern Ontario Multimodal Transportation System
Source: Map by IBI Group, including MTO, MNDM and other map data
IBI GROUP WORKING PAPER #2: CLIMATE CHANGE CONTEXT Prepared for Ministry of Transportation, Ontario
January 15, 2016 35
The following subsections provide more detail, by mode, regarding impacts and possible adaptation strategies.
3.2.1 All-Season Roads
The Near North’s road network includes about 11,000 km of highways and 4,400 km of local roads. The two primary east-west corridors, Highway 11 and Highway 17, connect the region’s main urban centres (North Bay, Sudbury, Sault Ste. Marie, Timmins and Thunder Bay) and industrial sites to the rest of the provincial highway system and to smaller centers by municipal and township roads. As also shown in Exhibit 3.3, the region is directly connected to the United States via road-based border crossings at Rainy River, Fort Frances, Pigeon River and Sault Ste. Marie.
In contrast, the only northward paved highway into the Far North is Highway 599, which links Ignace on Highway 17 through Savant Lake on the CN transcontinental line northward to Pickle Lake. An all-season road, the Northern Ontario Resource Trail (NORT), extends about another 300 km northward from Pickle Lake to Windigo Lake and Weagamow Lake (North Caribou First Nation), and another all-season road links Red Lake about another 100 km further north to Pikangikum.
There are an additional four relatively short secondary provincial highways heading northward from Near North communities on Highway 11 or the CN transcontinental line, but none of them currently crosses into the Far North. These are as follows, moving from east to west, with the Pickle Lake connection also included:
Highway 652 northeast from Cochrane to Lawagamau Lake and the Detour Lake Gold Mine — virtually all of the traffic on this route is related to the mine itself (120 km);
Highway 634 north from Smooth Rock Falls to Fraserdale (73 km);
Highway 584 north from Geraldton to Nakina (64 km);
Highway 599 north from Savant Lake to Pickle Lake (157 km); and
Highway 105 north from Vermilion Bay through Ear Falls to Red Lake (171 km).
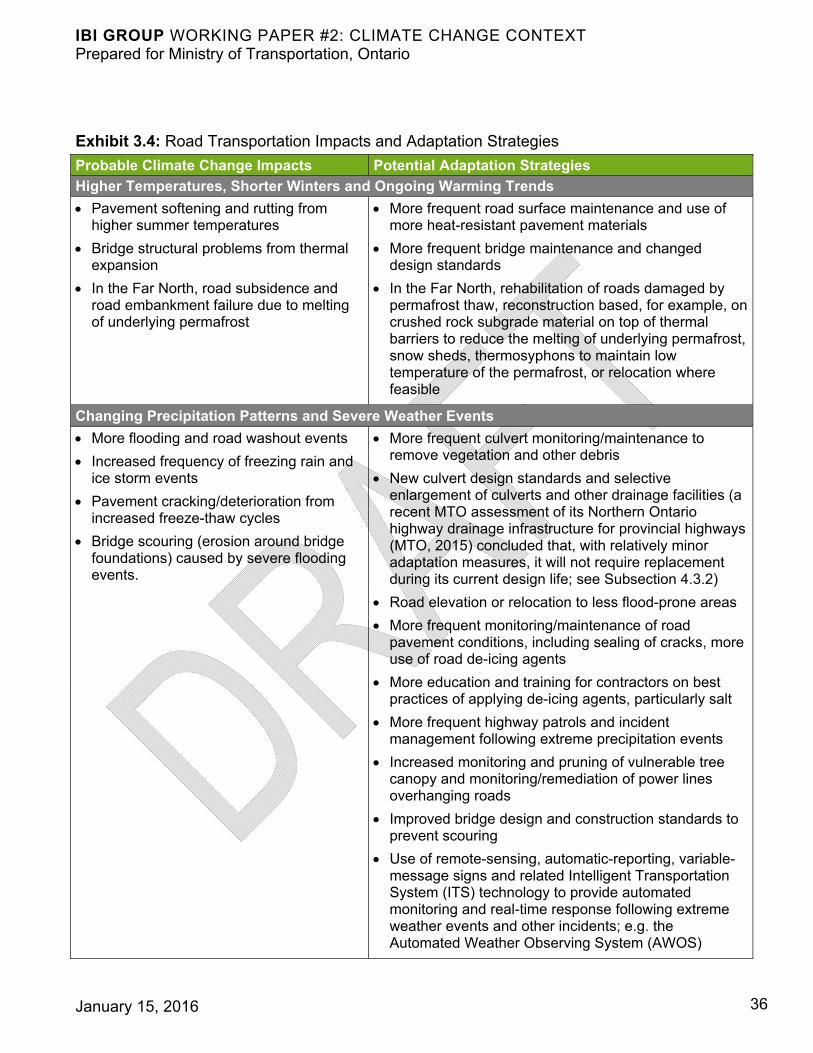
Provincial highways, municipal and other roads constitute by far the most extensive part of the transportation infrastructure network in Northern Ontario, serving travel by auto, truck, bus and active modes. Listed in Exhibit 3.4 are possible effects of climate change on Northern Ontario’s all-season roads and some adaptation initiatives identified based on local, national and international experience (Government of Canada, 2015; MTO, 2015; Pendakur, 2015; (Transportation Research Board, 2014; Warren and Lemmen, 2014).
IBI GROUP WORKING PAPER #2: CLIMATE CHANGE CONTEXT Prepared for Ministry of Transportation, Ontario
January 15, 2016 36
Exhibit 3.4: Road Transportation Impacts and Adaptation Strategies
Probable Climate Change Impacts Potential Adaptation Strategies
Higher Temperatures, Shorter Winters and Ongoing Warming Trends
Pavement softening and rutting from higher summer temperatures
Bridge structural problems from thermal expansion
In the Far North, road subsidence and road embankment failure due to melting of underlying permafrost
More frequent road surface maintenance and use of more heat-resistant pavement materials
More frequent bridge maintenance and changed design standards
In the Far North, rehabilitation of roads damaged by permafrost thaw, reconstruction based, for example, on crushed rock subgrade material on top of thermal barriers to reduce the melting of underlying permafrost, snow sheds, thermosyphons to maintain low temperature of the permafrost, or relocation where feasible
Changing Precipitation Patterns and Severe Weather Events
More flooding and road washout events
Increased frequency of freezing rain and ice storm events
Pavement cracking/deterioration from increased freeze-thaw cycles
Bridge scouring (erosion around bridge foundations) caused by severe flooding events.
More frequent culvert monitoring/maintenance to remove vegetation and other debris
New culvert design standards and selective enlargement of culverts and other drainage facilities (a recent MTO assessment of its Northern Ontario highway drainage infrastructure for provincial highways (MTO, 2015) concluded that, with relatively minor adaptation measures, it will not require replacement during its current design life; see Subsection 4.3.2)
Road elevation or relocation to less flood-prone areas
More frequent monitoring/maintenance of road pavement conditions, including sealing of cracks, more use of road de-icing agents
More education and training for contractors on best practices of applying de-icing agents, particularly salt
More frequent highway patrols and incident management following extreme precipitation events
Increased monitoring and pruning of vulnerable tree canopy and monitoring/remediation of power lines overhanging roads
Improved bridge design and construction standards to prevent scouring
Use of remote-sensing, automatic-reporting, variable-message signs and related Intelligent Transportation System (ITS) technology to provide automated monitoring and real-time response following extreme weather events and other incidents; e.g. the Automated Weather Observing System (AWOS)
IBI GROUP WORKING PAPER #2: CLIMATE CHANGE CONTEXT Prepared for Ministry of Transportation, Ontario
January 15, 2016 37
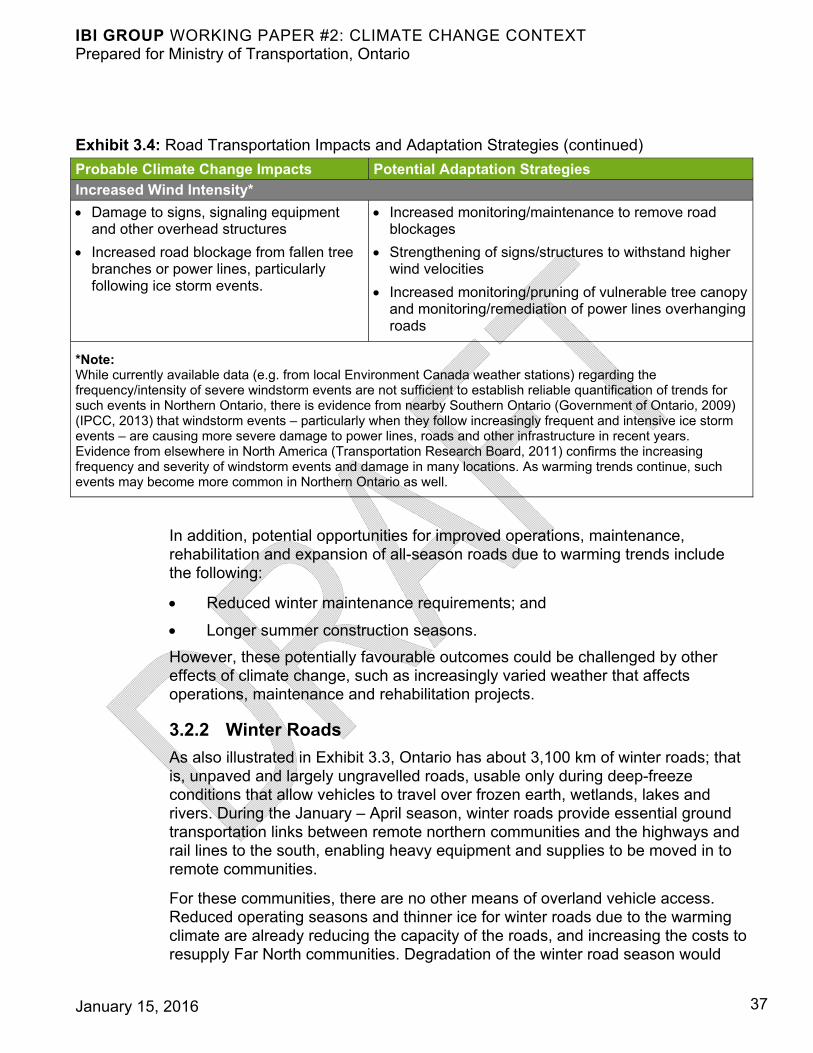
Exhibit 3.4: Road Transportation Impacts and Adaptation Strategies (continued)
Probable Climate Change Impacts Potential Adaptation Strategies
Increased Wind Intensity*
Damage to signs, signaling equipment and other overhead structures
Increased road blockage from fallen tree branches or power lines, particularly following ice storm events.
Increased monitoring/maintenance to remove road blockages
Strengthening of signs/structures to withstand higher wind velocities
Increased monitoring/pruning of vulnerable tree canopy and monitoring/remediation of power lines overhanging roads
*Note: While currently available data (e.g. from local Environment Canada weather stations) regarding the frequency/intensity of severe windstorm events are not sufficient to establish reliable quantification of trends for such events in Northern Ontario, there is evidence from nearby Southern Ontario (Government of Ontario, 2009) (IPCC, 2013) that windstorm events – particularly when they follow increasingly frequent and intensive ice storm events – are causing more severe damage to power lines, roads and other infrastructure in recent years. Evidence from elsewhere in North America (Transportation Research Board, 2011) confirms the increasing frequency and severity of windstorm events and damage in many locations. As warming trends continue, such events may become more common in Northern Ontario as well.
In addition, potential opportunities for improved operations, maintenance, rehabilitation and expansion of all-season roads due to warming trends include the following:
Reduced winter maintenance requirements; and
Longer summer construction seasons.
However, these potentially favourable outcomes could be challenged by other effects of climate change, such as increasingly varied weather that affects operations, maintenance and rehabilitation projects.
3.2.2 Winter Roads
As also illustrated in Exhibit 3.3, Ontario has about 3,100 km of winter roads; that is, unpaved and largely ungravelled roads, usable only during deep-freeze conditions that allow vehicles to travel over frozen earth, wetlands, lakes and rivers. During the January – April season, winter roads provide essential ground transportation links between remote northern communities and the highways and rail lines to the south, enabling heavy equipment and supplies to be moved in to remote communities.
For these communities, there are no other means of overland vehicle access. Reduced operating seasons and thinner ice for winter roads due to the warming climate are already reducing the capacity of the roads, and increasing the costs to resupply Far North communities. Degradation of the winter road season would
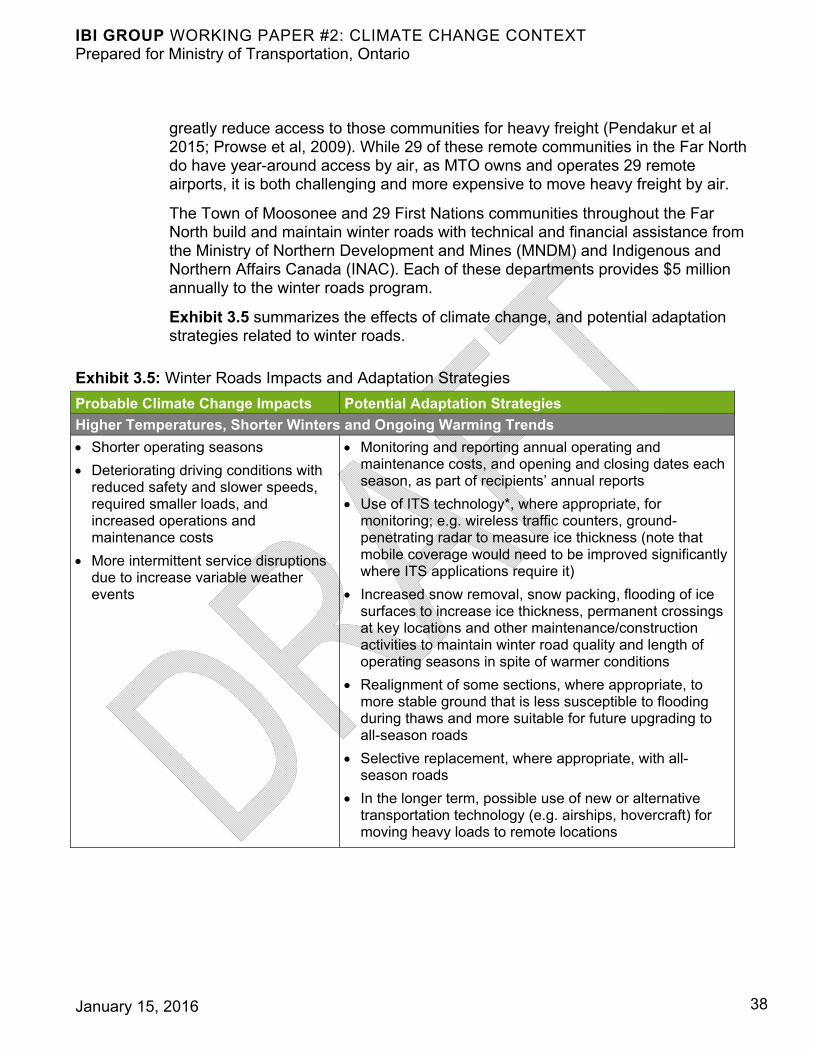
IBI GROUP WORKING PAPER #2: CLIMATE CHANGE CONTEXT Prepared for Ministry of Transportation, Ontario
January 15, 2016 38
greatly reduce access to those communities for heavy freight (Pendakur et al 2015; Prowse et al, 2009). While 29 of these remote communities in the Far North do have year-around access by air, as MTO owns and operates 29 remote airports, it is both challenging and more expensive to move heavy freight by air.
The Town of Moosonee and 29 First Nations communities throughout the Far North build and maintain winter roads with technical and financial assistance from the Ministry of Northern Development and Mines (MNDM) and Indigenous and Northern Affairs Canada (INAC). Each of these departments provides $5 million annually to the winter roads program.
Exhibit 3.5 summarizes the effects of climate change, and potential adaptation strategies related to winter roads.
Exhibit 3.5: Winter Roads Impacts and Adaptation Strategies
Probable Climate Change Impacts Potential Adaptation Strategies
Higher Temperatures, Shorter Winters and Ongoing Warming Trends
Shorter operating seasons
Deteriorating driving conditions with reduced safety and slower speeds, required smaller loads, and increased operations and maintenance costs
More intermittent service disruptions due to increase variable weather events
Monitoring and reporting annual operating and maintenance costs, and opening and closing dates each season, as part of recipients’ annual reports
Use of ITS technology*, where appropriate, for monitoring; e.g. wireless traffic counters, ground-penetrating radar to measure ice thickness (note that mobile coverage would need to be improved significantly where ITS applications require it)
Increased snow removal, snow packing, flooding of ice surfaces to increase ice thickness, permanent crossings at key locations and other maintenance/construction activities to maintain winter road quality and length of operating seasons in spite of warmer conditions
Realignment of some sections, where appropriate, to more stable ground that is less susceptible to flooding during thaws and more suitable for future upgrading to all-season roads
Selective replacement, where appropriate, with all-season roads
In the longer term, possible use of new or alternative transportation technology (e.g. airships, hovercraft) for moving heavy loads to remote locations
IBI GROUP WORKING PAPER #2: CLIMATE CHANGE CONTEXT Prepared for Ministry of Transportation, Ontario
January 15, 2016 39
3.2.3 Rail
As shown in Exhibit 3.3, CN and CP operate the two transcontinental rail lines spanning the region from east to west which, together with several regional lines — including the Huron Central and Ottawa Valley short line Railways — total about 7,000 km of railway. The Ontario Northland Transportation Commission (ONTC) rail runs from Moosonee to North Bay with a line running into Quebec to link with CN.
The rail mode is subject to the following effects of climate change: flooding, washouts, ice buildup, wind damage, buckling/distortion of rails and bridges from extreme heat and, for the ONTC line to Moosonee, subsidence from melting permafrost.
Potential opportunities for improved rail operations, maintenance, rehabilitation and expansion due to warming trends include the following:
Reduced winter maintenance/operating requirements; and
Longer summer construction seasons.
However, as stated in Section 3.2.1, these potentially favourable outcomes could be challenged by other climate change effects, such as increasingly varied weather that affects operations, maintenance and rehabilitation projects. It remains to be seen whether there will be any net favourable effects of climate change.
Exhibit 3.6 summarizes the effects of climate change and potential adaptation strategies as they relate to the rail mode in Northern Ontario.
3.2.4 Air
There are 67 public airports in the region, including Thunder Bay International Airport, and 37 Municipal airports, as shown in Exhibit 3.3, which also shows the 29 remote airfields operated by the Ministry of Transportation to serve remote Northern Ontario communities. They receive 100% of their operating funds and most of their capital expenditure funds from the Province.
Airport taxiways and runways are subject to the effects of climate change such as flooding, washouts, ice buildup, and freeze-thaw degradation. The gravel runways and taxiways of remote airports in the discontinuous permafrost area of the Far North are also subject to subsidence from melting permafrost. Airport operating reliability and maintenance/operations costs are vulnerable to interruptions and damage from extreme and variable weather events.
Exhibit 3.7 summarizes the effects of climate change and potential adaptation strategies as they relate to the air mode.
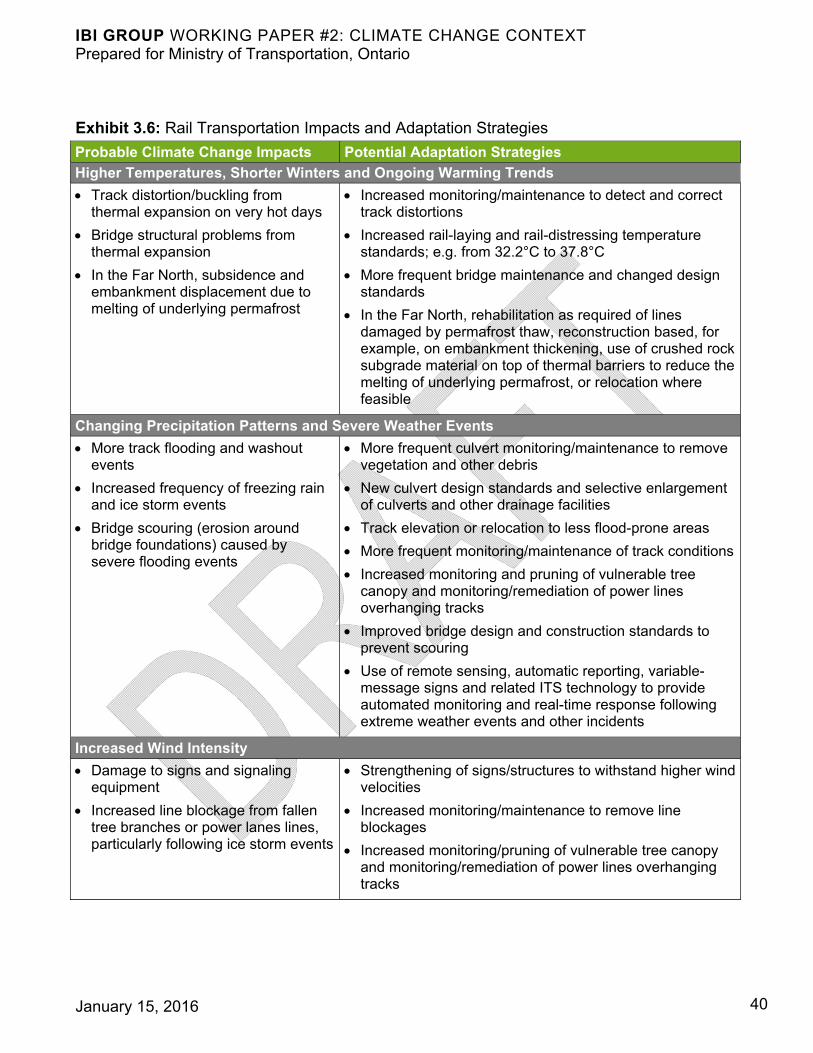
IBI GROUP WORKING PAPER #2: CLIMATE CHANGE CONTEXT Prepared for Ministry of Transportation, Ontario
January 15, 2016 40
Exhibit 3.6: Rail Transportation Impacts and Adaptation Strategies
Probable Climate Change Impacts Potential Adaptation Strategies
Higher Temperatures, Shorter Winters and Ongoing Warming Trends
Track distortion/buckling from thermal expansion on very hot days
Bridge structural problems from thermal expansion
In the Far North, subsidence and embankment displacement due to melting of underlying permafrost
Increased monitoring/maintenance to detect and correct track distortions
Increased rail-laying and rail-distressing temperature standards; e.g. from 32.2°C to 37.8°C
More frequent bridge maintenance and changed design standards
In the Far North, rehabilitation as required of lines damaged by permafrost thaw, reconstruction based, for example, on embankment thickening, use of crushed rock subgrade material on top of thermal barriers to reduce the melting of underlying permafrost, or relocation where feasible
Changing Precipitation Patterns and Severe Weather Events
More track flooding and washout events
Increased frequency of freezing rain and ice storm events
Bridge scouring (erosion around bridge foundations) caused by severe flooding events
More frequent culvert monitoring/maintenance to remove vegetation and other debris
New culvert design standards and selective enlargement of culverts and other drainage facilities
Track elevation or relocation to less flood-prone areas
More frequent monitoring/maintenance of track conditions
Increased monitoring and pruning of vulnerable tree canopy and monitoring/remediation of power lines overhanging tracks
Improved bridge design and construction standards to prevent scouring
Use of remote sensing, automatic reporting, variable-message signs and related ITS technology to provide automated monitoring and real-time response following extreme weather events and other incidents
Increased Wind Intensity
Damage to signs and signaling equipment
Increased line blockage from fallen tree branches or power lanes lines, particularly following ice storm events
Strengthening of signs/structures to withstand higher wind velocities
Increased monitoring/maintenance to remove line blockages
Increased monitoring/pruning of vulnerable tree canopy and monitoring/remediation of power lines overhanging tracks
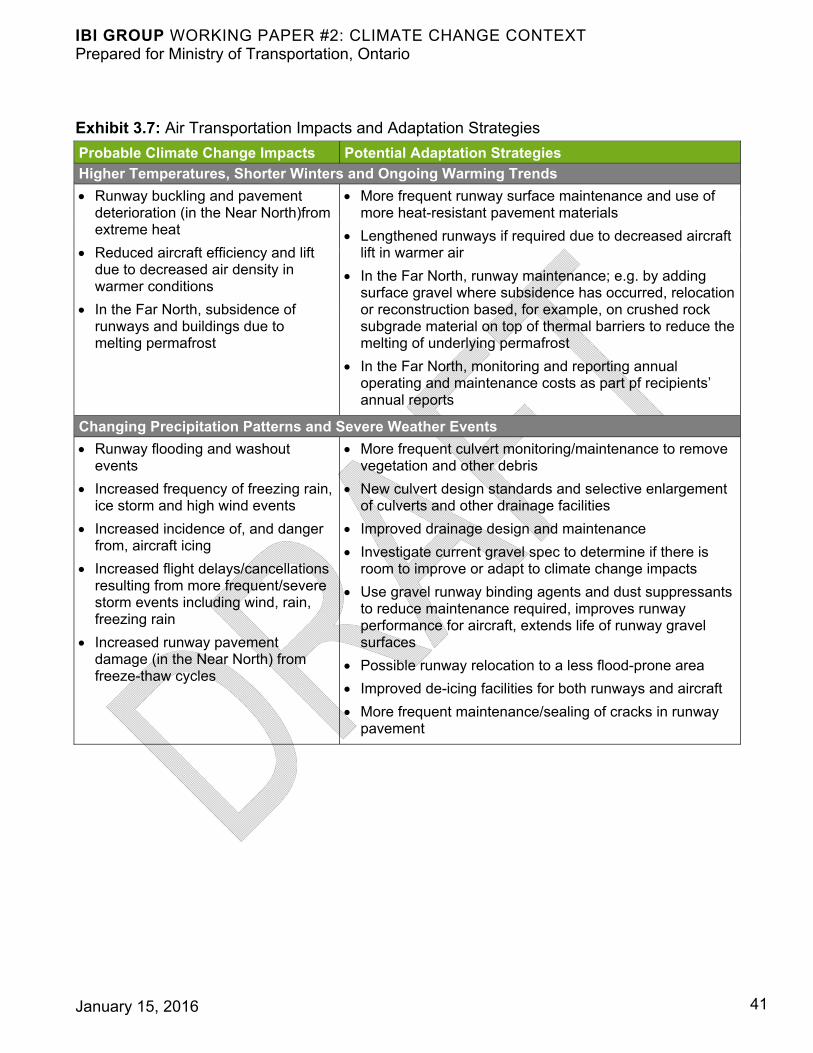
IBI GROUP WORKING PAPER #2: CLIMATE CHANGE CONTEXT Prepared for Ministry of Transportation, Ontario
January 15, 2016 41
Exhibit 3.7: Air Transportation Impacts and Adaptation Strategies
Probable Climate Change Impacts Potential Adaptation Strategies
Higher Temperatures, Shorter Winters and Ongoing Warming Trends
Runway buckling and pavement deterioration (in the Near North)from extreme heat
Reduced aircraft efficiency and lift due to decreased air density in warmer conditions
In the Far North, subsidence of runways and buildings due to melting permafrost
More frequent runway surface maintenance and use of more heat-resistant pavement materials
Lengthened runways if required due to decreased aircraft lift in warmer air
In the Far North, runway maintenance; e.g. by adding surface gravel where subsidence has occurred, relocation or reconstruction based, for example, on crushed rock subgrade material on top of thermal barriers to reduce the melting of underlying permafrost
In the Far North, monitoring and reporting annual operating and maintenance costs as part pf recipients’ annual reports
Changing Precipitation Patterns and Severe Weather Events
Runway flooding and washout events
Increased frequency of freezing rain, ice storm and high wind events
Increased incidence of, and danger from, aircraft icing
Increased flight delays/cancellations resulting from more frequent/severe storm events including wind, rain, freezing rain
Increased runway pavement damage (in the Near North) from freeze-thaw cycles
More frequent culvert monitoring/maintenance to remove vegetation and other debris
New culvert design standards and selective enlargement of culverts and other drainage facilities
Improved drainage design and maintenance
Investigate current gravel spec to determine if there is room to improve or adapt to climate change impacts
Use gravel runway binding agents and dust suppressants to reduce maintenance required, improves runway performance for aircraft, extends life of runway gravel surfaces
Possible runway relocation to a less flood-prone area
Improved de-icing facilities for both runways and aircraft
More frequent maintenance/sealing of cracks in runway pavement
IBI GROUP WORKING PAPER #2: CLIMATE CHANGE CONTEXT Prepared for Ministry of Transportation, Ontario
January 15, 2016 42
3.2.5 Marine
As shown in Exhibit 3.3, the region’s four busiest ports are located along the northern shore of Lake Superior and Lake Huron — at Thunder Bay, Sault Ste. Marie, Meldrum Bay, and Whitefish on Manitoulin Island. Closure of the St. Lawrence Seaway occurs on average between January 15 and March 25, pending conditions. Arctic resupply barges operate from Churchill, Manitoba and from Moosonee to several small Ontario communities on the shores of Hudson Bay and James Bay, e.g. Fort Severn, Attawapiskat and Fort Albany, during ice-free summer months.
Exhibit 3.8 summarizes the effects of climate change and potential adaptation strategies as they relate to marine transportation.
The ongoing warming trends of climate change could potentially provide opportunities for increased marine facilities serving Northern Ontario but there are anticipated negative considerations also, primarily from reduced Great Lakes water levels:
Lengthening ice-free shipping seasons could open up the opportunity to establish a deep water port serving the Far North in the long term, although shallow drafts in James Bay and much of the Hudson Bay shore would have to be considered including the implications on construction and operating costs. An underwater canyon at the mouth of the Winisk River provides a location with deeper water on the shore of Hudson Bay, but is far from any existing ground transportation links. This is the location of the former community of Winusk that was destroyed by a flood in 1986 (the Weenusk First Nation community relocated 30 km south/upstream at Peawnuck).
Lengthening shipping seasons on the Great Lakes could favour expanded cruise ship and cargo vessel operations. This would partially offset declining productivity for the latter, anticipated from reduced water levels that would require reduced cargo loads for vessels using the St. Lawrence Seaway system and Great Lakes ports.
A complicating factor in this regard is ongoing reduction of water depths in the coastal areas of Hudson Bay and James Bay owing to post-glacial rebound as the land recovers from the weight of massive glaciers that covered the area during the last ice age. At Churchill, Manitoba, tidal gauge records show that the sea-level has fallen nearly 10 mm/year (1 m/century) since 1940 (Warren and Lemmen, 2014) and is continuing to do so.
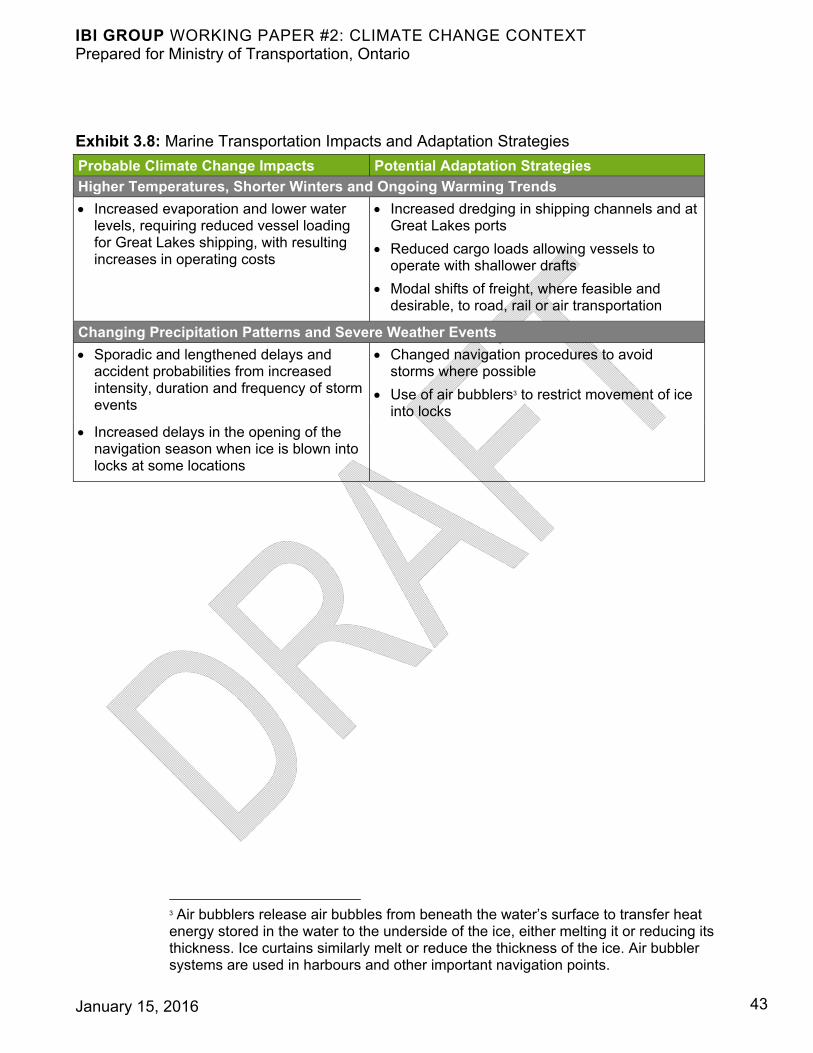
IBI GROUP WORKING PAPER #2: CLIMATE CHANGE CONTEXT Prepared for Ministry of Transportation, Ontario
January 15, 2016 43
Exhibit 3.8: Marine Transportation Impacts and Adaptation Strategies
Probable Climate Change Impacts Potential Adaptation Strategies
Higher Temperatures, Shorter Winters and Ongoing Warming Trends
Increased evaporation and lower water levels, requiring reduced vessel loading for Great Lakes shipping, with resulting increases in operating costs
Increased dredging in shipping channels and at Great Lakes ports
Reduced cargo loads allowing vessels to operate with shallower drafts
Modal shifts of freight, where feasible and desirable, to road, rail or air transportation
Changing Precipitation Patterns and Severe Weather Events
Sporadic and lengthened delays and accident probabilities from increased intensity, duration and frequency of storm events
Changed navigation procedures to avoid storms where possible
Use of air bubblers3 to restrict movement of ice into locks
Increased delays in the opening of the navigation season when ice is blown into locks at some locations
3 Air bubblers release air bubbles from beneath the water’s surface to transfer heat energy stored in the water to the underside of the ice, either melting it or reducing its thickness. Ice curtains similarly melt or reduce the thickness of the ice. Air bubbler systems are used in harbours and other important navigation points.
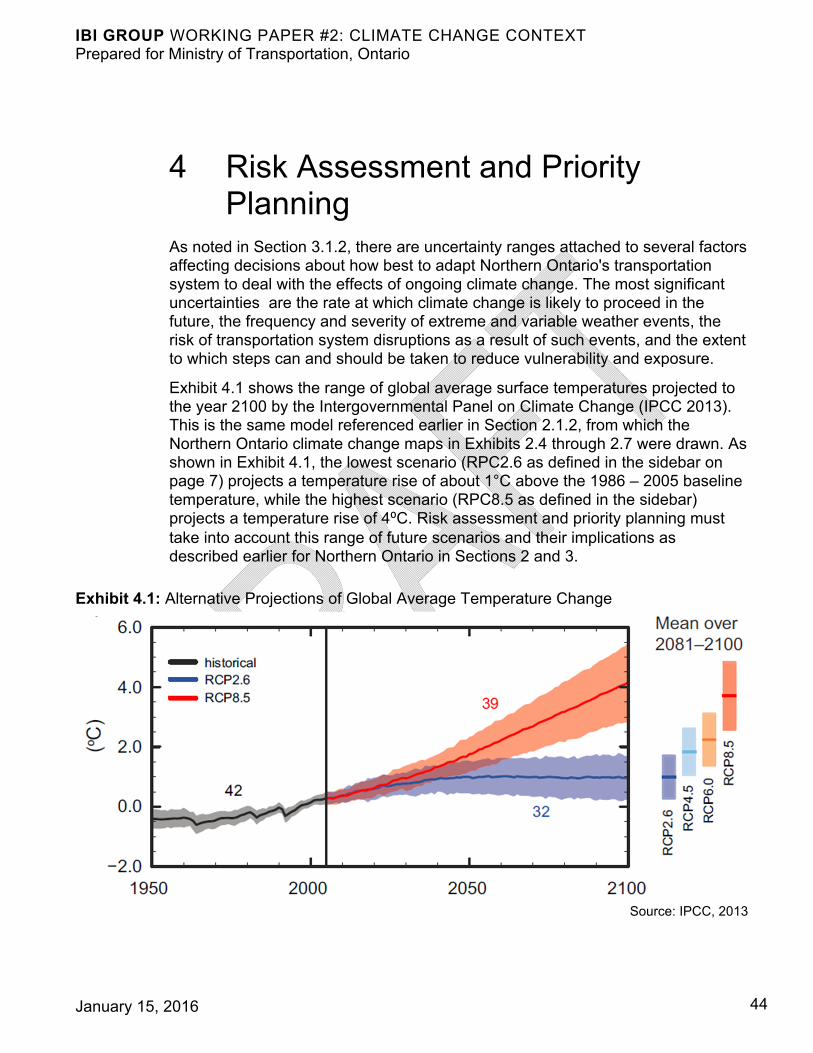
IBI GROUP WORKING PAPER #2: CLIMATE CHANGE CONTEXT Prepared for Ministry of Transportation, Ontario
January 15, 2016 44
4 Risk Assessment and Priority Planning
As noted in Section 3.1.2, there are uncertainty ranges attached to several factors affecting decisions about how best to adapt Northern Ontario's transportation system to deal with the effects of ongoing climate change. The most significant uncertainties are the rate at which climate change is likely to proceed in the future, the frequency and severity of extreme and variable weather events, the risk of transportation system disruptions as a result of such events, and the extent to which steps can and should be taken to reduce vulnerability and exposure.
Exhibit 4.1 shows the range of global average surface temperatures projected to the year 2100 by the Intergovernmental Panel on Climate Change (IPCC 2013). This is the same model referenced earlier in Section 2.1.2, from which the Northern Ontario climate change maps in Exhibits 2.4 through 2.7 were drawn. As shown in Exhibit 4.1, the lowest scenario (RPC2.6 as defined in the sidebar on page 7) projects a temperature rise of about 1°C above the 1986 – 2005 baseline temperature, while the highest scenario (RPC8.5 as defined in the sidebar) projects a temperature rise of 4⁰C. Risk assessment and priority planning must take into account this range of future scenarios and their implications as described earlier for Northern Ontario in Sections 2 and 3.
Exhibit 4.1: Alternative Projections of Global Average Temperature Change
Source: IPCC, 2013
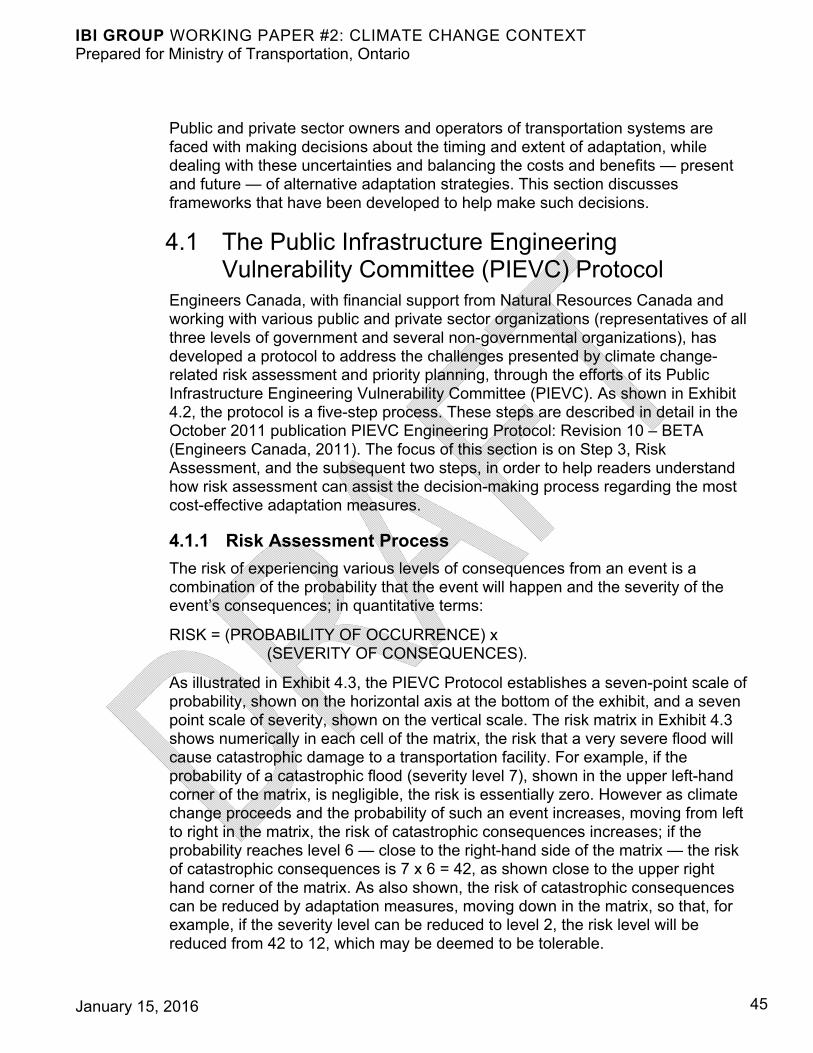
IBI GROUP WORKING PAPER #2: CLIMATE CHANGE CONTEXT Prepared for Ministry of Transportation, Ontario
January 15, 2016 45
Public and private sector owners and operators of transportation systems are faced with making decisions about the timing and extent of adaptation, while dealing with these uncertainties and balancing the costs and benefits — present and future — of alternative adaptation strategies. This section discusses frameworks that have been developed to help make such decisions.
4.1 The Public Infrastructure Engineering Vulnerability Committee (PIEVC) Protocol
Engineers Canada, with financial support from Natural Resources Canada and working with various public and private sector organizations (representatives of all three levels of government and several non-governmental organizations), has developed a protocol to address the challenges presented by climate change-related risk assessment and priority planning, through the efforts of its Public Infrastructure Engineering Vulnerability Committee (PIEVC). As shown in Exhibit 4.2, the protocol is a five-step process. These steps are described in detail in the October 2011 publication PIEVC Engineering Protocol: Revision 10 – BETA (Engineers Canada, 2011). The focus of this section is on Step 3, Risk Assessment, and the subsequent two steps, in order to help readers understand how risk assessment can assist the decision-making process regarding the most cost-effective adaptation measures.
4.1.1 Risk Assessment Process
The risk of experiencing various levels of consequences from an event is a combination of the probability that the event will happen and the severity of the event’s consequences; in quantitative terms:
RISK = (PROBABILITY OF OCCURRENCE) x (SEVERITY OF CONSEQUENCES).
As illustrated in Exhibit 4.3, the PIEVC Protocol establishes a seven-point scale of probability, shown on the horizontal axis at the bottom of the exhibit, and a seven point scale of severity, shown on the vertical scale. The risk matrix in Exhibit 4.3 shows numerically in each cell of the matrix, the risk that a very severe flood will cause catastrophic damage to a transportation facility. For example, if the probability of a catastrophic flood (severity level 7), shown in the upper left-hand corner of the matrix, is negligible, the risk is essentially zero. However as climate change proceeds and the probability of such an event increases, moving from left to right in the matrix, the risk of catastrophic consequences increases; if the probability reaches level 6 — close to the right-hand side of the matrix — the risk of catastrophic consequences is 7 x 6 = 42, as shown close to the upper right hand corner of the matrix. As also shown, the risk of catastrophic consequences can be reduced by adaptation measures, moving down in the matrix, so that, for example, if the severity level can be reduced to level 2, the risk level will be reduced from 42 to 12, which may be deemed to be tolerable.
IBI GROUP WORKING PAPER #2: CLIMATE CHANGE CONTEXT Prepared for Ministry of Transportation, Ontario
January 15, 2016 46
Exhibit 4.2: Overview of the Public Infrastructure Engineering Vulnerability Committee Protocol
Source: (Engineers Canada, 2011)
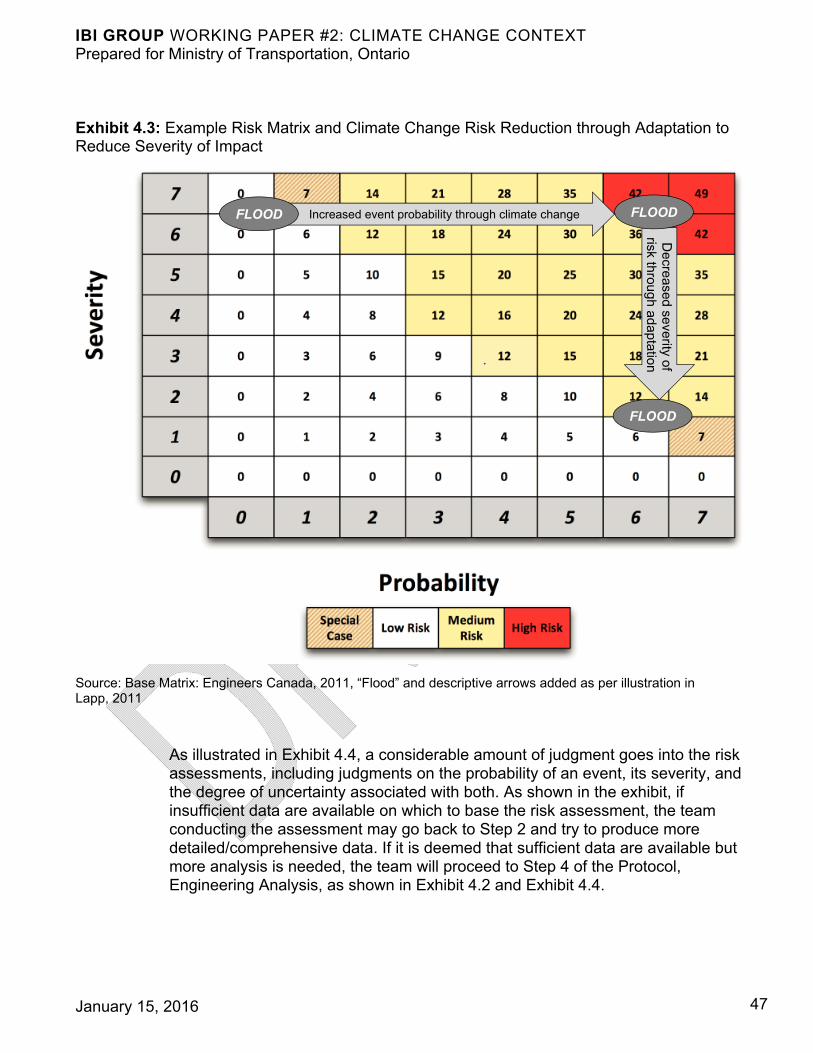
IBI GROUP WORKING PAPER #2: CLIMATE CHANGE CONTEXT Prepared for Ministry of Transportation, Ontario
January 15, 2016 47
Exhibit 4.3: Example Risk Matrix and Climate Change Risk Reduction through Adaptation to Reduce Severity of Impact
Source: Base Matrix: Engineers Canada, 2011, “Flood” and descriptive arrows added as per illustration in Lapp, 2011
As illustrated in Exhibit 4.4, a considerable amount of judgment goes into the risk assessments, including judgments on the probability of an event, its severity, and the degree of uncertainty associated with both. As shown in the exhibit, if insufficient data are available on which to base the risk assessment, the team conducting the assessment may go back to Step 2 and try to produce more detailed/comprehensive data. If it is deemed that sufficient data are available but more analysis is needed, the team will proceed to Step 4 of the Protocol, Engineering Analysis, as shown in Exhibit 4.2 and Exhibit 4.4.
Increased event probability through climate change
FLOOD
Decreased severity of
risk through adaptation
FLOODFLOOD
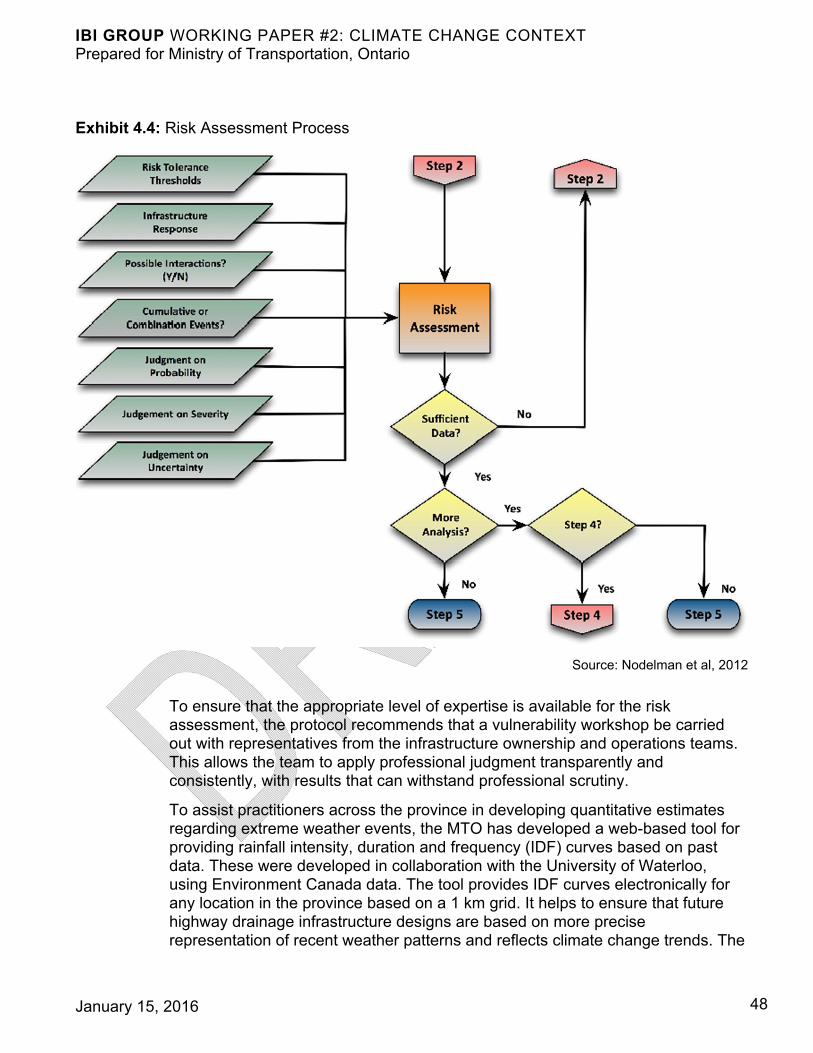
IBI GROUP WORKING PAPER #2: CLIMATE CHANGE CONTEXT Prepared for Ministry of Transportation, Ontario
January 15, 2016 48
Exhibit 4.4: Risk Assessment Process
Source: Nodelman et al, 2012
To ensure that the appropriate level of expertise is available for the risk assessment, the protocol recommends that a vulnerability workshop be carried out with representatives from the infrastructure ownership and operations teams. This allows the team to apply professional judgment transparently and consistently, with results that can withstand professional scrutiny.
To assist practitioners across the province in developing quantitative estimates regarding extreme weather events, the MTO has developed a web-based tool for providing rainfall intensity, duration and frequency (IDF) curves based on past data. These were developed in collaboration with the University of Waterloo, using Environment Canada data. The tool provides IDF curves electronically for any location in the province based on a 1 km grid. It helps to ensure that future highway drainage infrastructure designs are based on more precise representation of recent weather patterns and reflects climate change trends. The
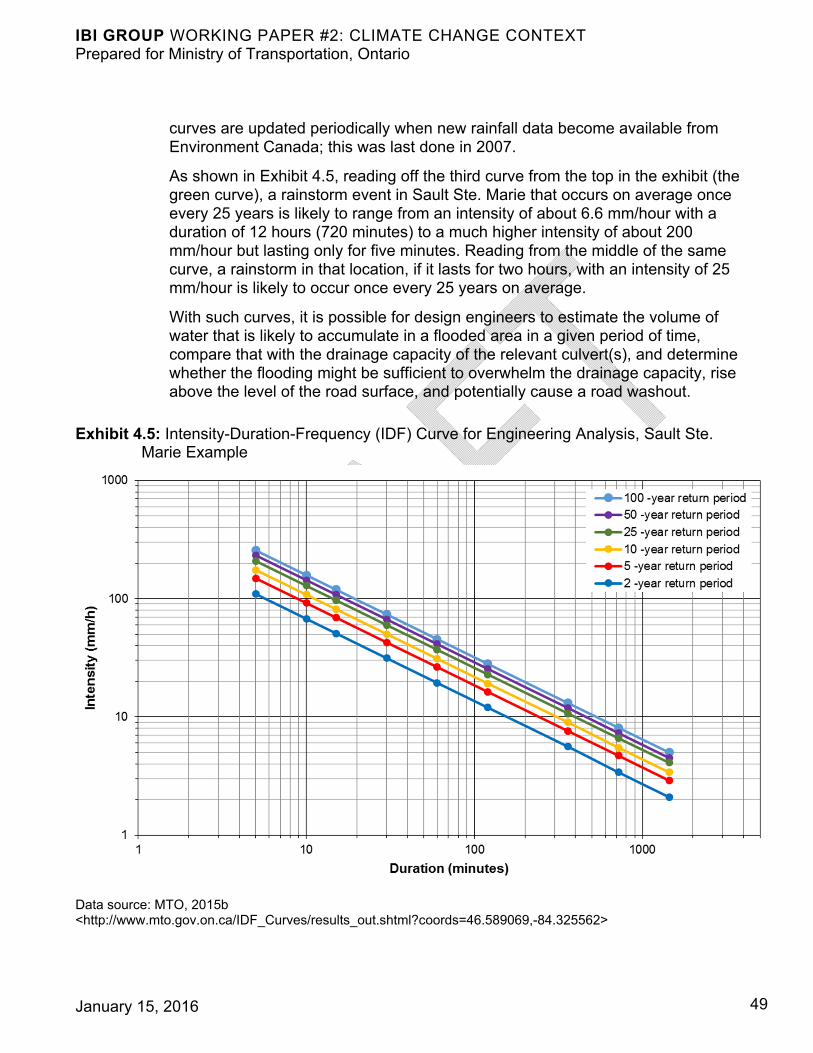
IBI GROUP WORKING PAPER #2: CLIMATE CHANGE CONTEXT Prepared for Ministry of Transportation, Ontario
January 15, 2016 49
curves are updated periodically when new rainfall data become available from Environment Canada; this was last done in 2007.
As shown in Exhibit 4.5, reading off the third curve from the top in the exhibit (the green curve), a rainstorm event in Sault Ste. Marie that occurs on average once every 25 years is likely to range from an intensity of about 6.6 mm/hour with a duration of 12 hours (720 minutes) to a much higher intensity of about 200 mm/hour but lasting only for five minutes. Reading from the middle of the same curve, a rainstorm in that location, if it lasts for two hours, with an intensity of 25 mm/hour is likely to occur once every 25 years on average.
With such curves, it is possible for design engineers to estimate the volume of water that is likely to accumulate in a flooded area in a given period of time, compare that with the drainage capacity of the relevant culvert(s), and determine whether the flooding might be sufficient to overwhelm the drainage capacity, rise above the level of the road surface, and potentially cause a road washout.
Exhibit 4.5: Intensity-Duration-Frequency (IDF) Curve for Engineering Analysis, Sault Ste. Marie Example
Data source: MTO, 2015b <http://www.mto.gov.on.ca/IDF_Curves/results_out.shtml?coords=46.589069,-84.325562>
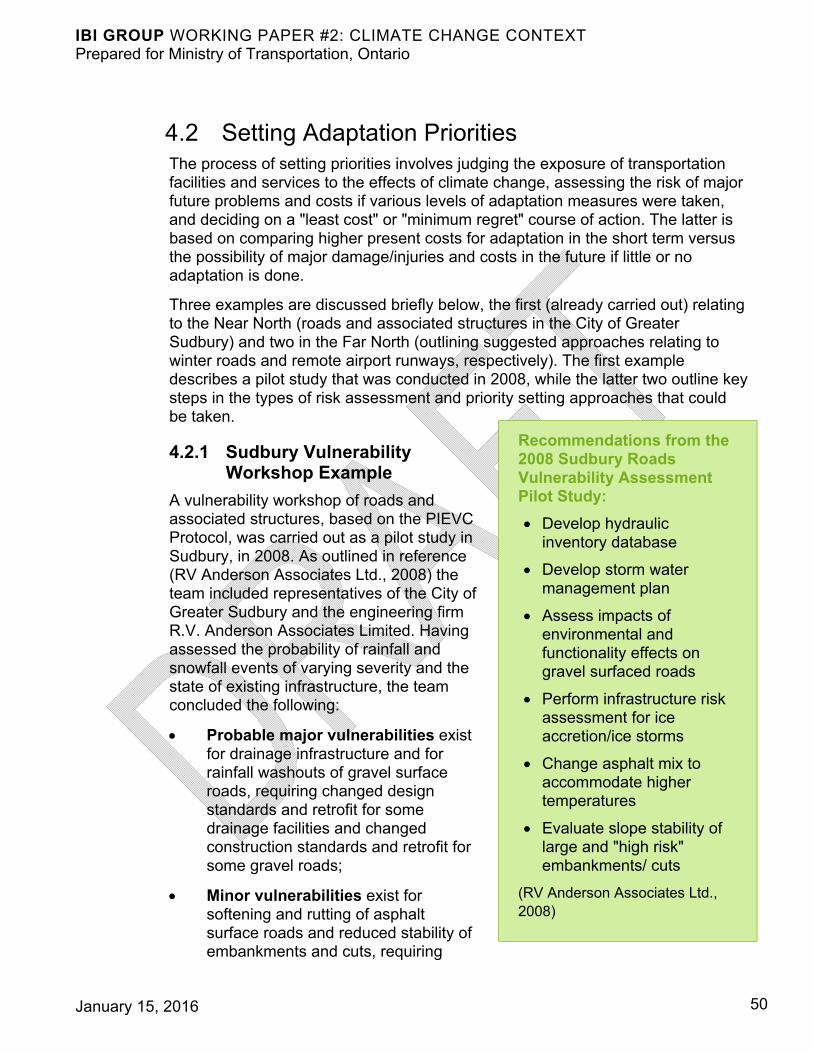
IBI GROUP WORKING PAPER #2: CLIMATE CHANGE CONTEXT Prepared for Ministry of Transportation, Ontario
January 15, 2016 50
Recommendations from the 2008 Sudbury Roads Vulnerability Assessment Pilot Study:
Develop hydraulic inventory database
Develop storm water management plan
Assess impacts of environmental and functionality effects on gravel surfaced roads
Perform infrastructure risk assessment for ice accretion/ice storms
Change asphalt mix to accommodate higher temperatures
Evaluate slope stability of large and "high risk" embankments/ cuts
(RV Anderson Associates Ltd., 2008)
4.2 Setting Adaptation Priorities The process of setting priorities involves judging the exposure of transportation facilities and services to the effects of climate change, assessing the risk of major future problems and costs if various levels of adaptation measures were taken, and deciding on a "least cost" or "minimum regret" course of action. The latter is based on comparing higher present costs for adaptation in the short term versus the possibility of major damage/injuries and costs in the future if little or no adaptation is done.
Three examples are discussed briefly below, the first (already carried out) relating to the Near North (roads and associated structures in the City of Greater Sudbury) and two in the Far North (outlining suggested approaches relating to winter roads and remote airport runways, respectively). The first example describes a pilot study that was conducted in 2008, while the latter two outline key steps in the types of risk assessment and priority setting approaches that could be taken.
4.2.1 Sudbury Vulnerability Workshop Example
A vulnerability workshop of roads and associated structures, based on the PIEVC Protocol, was carried out as a pilot study in Sudbury, in 2008. As outlined in reference (RV Anderson Associates Ltd., 2008) the team included representatives of the City of Greater Sudbury and the engineering firm R.V. Anderson Associates Limited. Having assessed the probability of rainfall and snowfall events of varying severity and the state of existing infrastructure, the team concluded the following:
Probable major vulnerabilities exist for drainage infrastructure and for rainfall washouts of gravel surface roads, requiring changed design standards and retrofit for some drainage facilities and changed construction standards and retrofit for some gravel roads;
Minor vulnerabilities exist for softening and rutting of asphalt surface roads and reduced stability of embankments and cuts, requiring
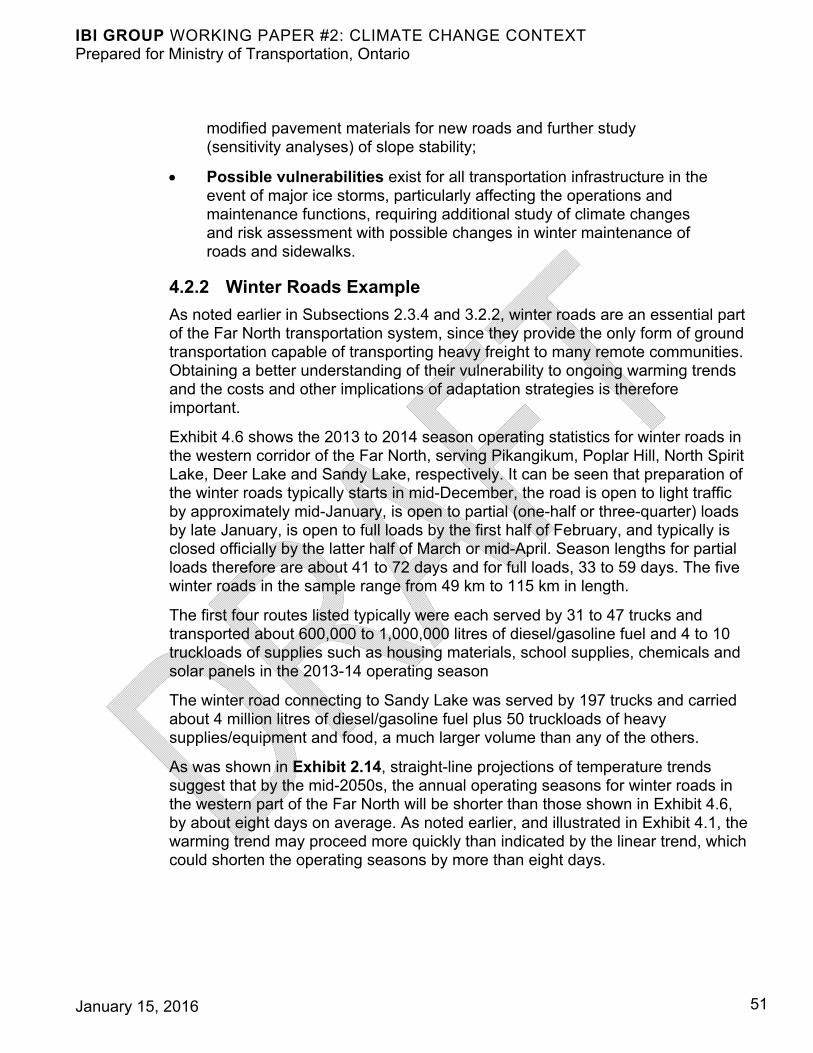
IBI GROUP WORKING PAPER #2: CLIMATE CHANGE CONTEXT Prepared for Ministry of Transportation, Ontario
January 15, 2016 51
modified pavement materials for new roads and further study (sensitivity analyses) of slope stability;
Possible vulnerabilities exist for all transportation infrastructure in the event of major ice storms, particularly affecting the operations and maintenance functions, requiring additional study of climate changes and risk assessment with possible changes in winter maintenance of roads and sidewalks.
4.2.2 Winter Roads Example
As noted earlier in Subsections 2.3.4 and 3.2.2, winter roads are an essential part of the Far North transportation system, since they provide the only form of ground transportation capable of transporting heavy freight to many remote communities. Obtaining a better understanding of their vulnerability to ongoing warming trends and the costs and other implications of adaptation strategies is therefore important.
Exhibit 4.6 shows the 2013 to 2014 season operating statistics for winter roads in the western corridor of the Far North, serving Pikangikum, Poplar Hill, North Spirit Lake, Deer Lake and Sandy Lake, respectively. It can be seen that preparation of the winter roads typically starts in mid-December, the road is open to light traffic by approximately mid-January, is open to partial (one-half or three-quarter) loads by late January, is open to full loads by the first half of February, and typically is closed officially by the latter half of March or mid-April. Season lengths for partial loads therefore are about 41 to 72 days and for full loads, 33 to 59 days. The five winter roads in the sample range from 49 km to 115 km in length.
The first four routes listed typically were each served by 31 to 47 trucks and transported about 600,000 to 1,000,000 litres of diesel/gasoline fuel and 4 to 10 truckloads of supplies such as housing materials, school supplies, chemicals and solar panels in the 2013-14 operating season
The winter road connecting to Sandy Lake was served by 197 trucks and carried about 4 million litres of diesel/gasoline fuel plus 50 truckloads of heavy supplies/equipment and food, a much larger volume than any of the others.
As was shown in Exhibit 2.14, straight-line projections of temperature trends suggest that by the mid-2050s, the annual operating seasons for winter roads in the western part of the Far North will be shorter than those shown in Exhibit 4.6, by about eight days on average. As noted earlier, and illustrated in Exhibit 4.1, the warming trend may proceed more quickly than indicated by the linear trend, which could shorten the operating seasons by more than eight days.
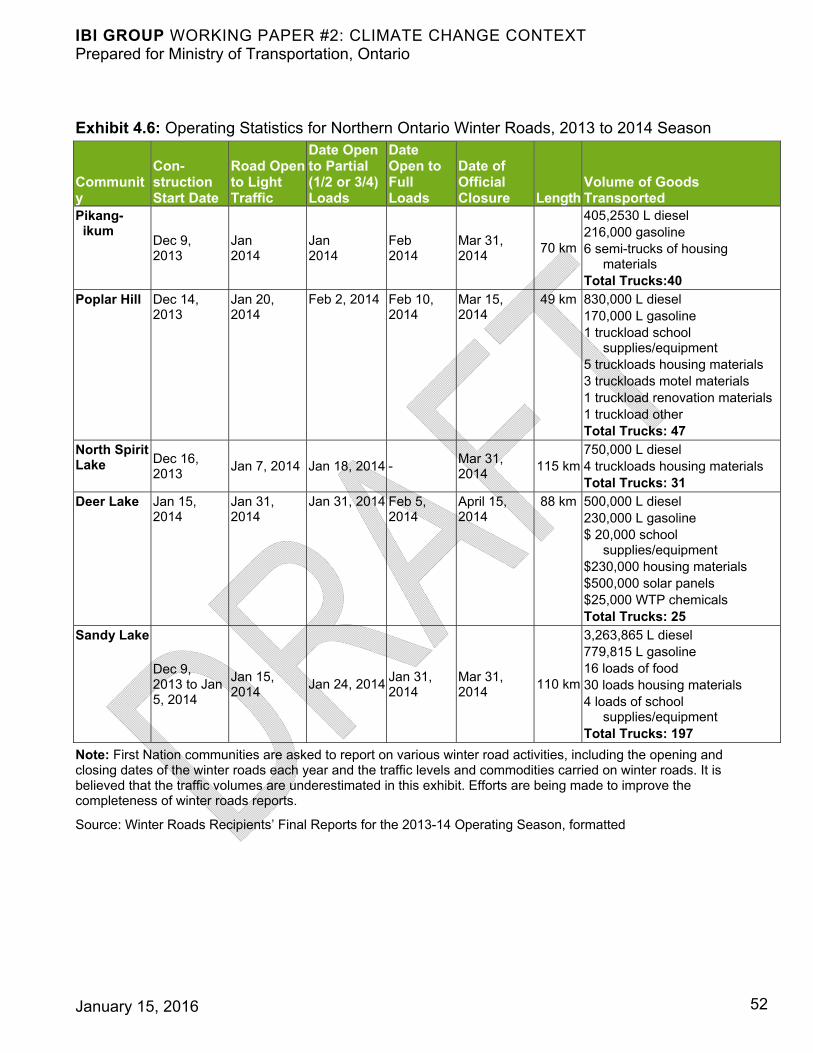
IBI GROUP WORKING PAPER #2: CLIMATE CHANGE CONTEXT Prepared for Ministry of Transportation, Ontario
January 15, 2016 52
Exhibit 4.6: Operating Statistics for Northern Ontario Winter Roads, 2013 to 2014 Season
Community
Con-struction Start Date
Road Open to Light Traffic
Date Open to Partial (1/2 or 3/4) Loads
Date Open to Full Loads
Date of Official Closure Length
Volume of Goods Transported
Pikang- ikum
Dec 9, 2013
Jan 2014
Jan 2014
Feb 2014
Mar 31, 2014
70 km
405,2530 L diesel 216,000 gasoline 6 semi-trucks of housing
materials Total Trucks:40
Poplar Hill Dec 14, 2013
Jan 20, 2014
Feb 2, 2014 Feb 10, 2014
Mar 15, 2014
49 km 830,000 L diesel 170,000 L gasoline 1 truckload school
supplies/equipment 5 truckloads housing materials 3 truckloads motel materials 1 truckload renovation materials 1 truckload other Total Trucks: 47
North Spirit Lake Dec 16,
2013 Jan 7, 2014 Jan 18, 2014 -
Mar 31, 2014
115 km 750,000 L diesel 4 truckloads housing materials Total Trucks: 31
Deer Lake Jan 15, 2014
Jan 31, 2014
Jan 31, 2014 Feb 5, 2014
April 15, 2014
88 km 500,000 L diesel 230,000 L gasoline $ 20,000 school
supplies/equipment $230,000 housing materials $500,000 solar panels $25,000 WTP chemicals Total Trucks: 25
Sandy Lake
Dec 9, 2013 to Jan 5, 2014
Jan 15, 2014
Jan 24, 2014Jan 31, 2014
Mar 31, 2014
110 km
3,263,865 L diesel 779,815 L gasoline 16 loads of food 30 loads housing materials 4 loads of school
supplies/equipment Total Trucks: 197
Note: First Nation communities are asked to report on various winter road activities, including the opening and closing dates of the winter roads each year and the traffic levels and commodities carried on winter roads. It is believed that the traffic volumes are underestimated in this exhibit. Efforts are being made to improve the completeness of winter roads reports.
Source: Winter Roads Recipients’ Final Reports for the 2013-14 Operating Season, formatted
IBI GROUP WORKING PAPER #2: CLIMATE CHANGE CONTEXT Prepared for Ministry of Transportation, Ontario
January 15, 2016 53
The issue here is to compare the increasing costs of continuing to operate "as is", versus the costs of one or more adaptation initiatives. The most basic type of adaptation — already being employed for most or all winter roads in Northern Ontario, to the extent that provincial guidelines are being followed (Winter Roads Working Group, 2010) — includes initiatives such as regular snow clearing to remove its insulating effects on the underlying ice, regular measurement of ice thickness with ground-penetrating radar where available, flooding ice surfaces to increase thickness, and related measures aimed at strengthening the winter road and keeping it operating as long as possible.
Transportation costs to distribute goods to remote Far North communities can be as much as $2.00 per pound ($4.41 per kilogram) or more if delivered by winter roads and $3.50 per pound ($7.72 per kilogram) or more if delivered by air (Transport Institute, University of Manitoba 2002)). Replacement of some winter roads by all-season roads — if the capital costs of these were born by government and/or mining companies — could reduce these delivery costs significantly, but they would still be substantially more than the $0.08 to $0.10 per pound ($0.18 to $0.22 per kilogram) to distribute goods in the south, owing to the long distances involved to reach Far North communities.
A third set of adaptation initiatives could be the use of lighter-than-air (LTA) dirigibles, although LTA airships with lifting capacity, maneuverability and ground crew facilities specifications suitable for this application are not yet commercially available. Development of airships and airship ports suitable for northern operations would require q significant capital investment. This tends to put the airship alternative into a longer-term time frame unless significant government funding were to be made available for accelerated airship development. Possible use of hovercraft could also be considered as a nearer-term initiative, since the technology is more developed.
Reference (Prentice and Adaman, 2015) provides a recent study comparing the costs of food delivery to remote communities in the western Far North of Ontario and the area east of Lake Winnipeg in Manitoba. As illustrated in Exhibit 4.7, the delivery costs via airships are estimated to be substantially lower than by cargo airplanes, but significantly higher than via trucks on winter roads or on all-season roads if the shipper does not bear the costs of providing those roads.
The range and complexity of these adaption alternatives is such that detailed engineering assessment and cost-benefit estimates would be required (i.e. Step 4 of the PIEVC Protocol) to determine the most cost-effective course of action for each winter road and for the network as a whole.
IBI GROUP WORKING PAPER #2: CLIMATE CHANGE CONTEXT Prepared for Ministry of Transportation, Ontario
January 15, 2016 54
Exhibit 4.7: Broad Modal Cost Comparisons for Regular Food Delivery to Remote Communities
Note: The Y-axis had been removed from the original chart for confidentiality purposes.
Source: (Prentice and Adaman, 2015)
4.2.3 Remote Airport Runways Example
Another example of an approach for deciding how best to adapt to climate change relates to permafrost degradation of remote airport runways and taxiways, which leads to increased costs for maintenance and possibly for major rehabilitation or relocation. The basic decision in this case is whether to simply bear the incremental costs, for example of adding gravel as required to overcome subsidence of gravel runways, to thicken embankments or, instead, to bear higher costs in the short term of rebuilding the runways, for example with a thermal barrier to retard the melting of underlying permafrost, or of relocating runways where feasible to areas where permafrost will not be a problem, for example on bedrock or on soil or gravel with no permafrost present.
Again, engineering analysis and cost-benefit assessment are likely to be required, depending on the specific circumstances of each remote airport’s runway and taxiways. A key early step in this process will be to assemble data on: the runway subsidence experience and prospects at each remote airport; related data on operating cost trends for runway operations, maintenance and rehabilitation; and
Distance between Origin and Destination (km)
Tra
nsp
ort
atio
n C
ost
s ($
/MT
)
Cargo Airplanes
Highway Trucks
Winter Ice Road Trucks
Transport Airships
50 100 150 200 250 300 350 400 450 500 550 600 650 700 750 800 850
IBI GROUP WORKING PAPER #2: CLIMATE CHANGE CONTEXT Prepared for Ministry of Transportation, Ontario
January 15, 2016 55
feasibility/cost information regarding adaptation alternatives such as those outlined in the previous paragraph. This will provide the necessary basis for conducting engineering analysis and cost-benefit assessment to determine the most cost-effective adaptation strategy for each airport.
The PIEVC Protocol provides an extremely useful set of guidelines for transportation system owners and operators in both the public and private sectors, as they address the risks and adaptation requirements to keep their systems operating reliably, safely and efficiently in the context of ongoing climate change in Northern Ontario.
4.3 MTO Climate Change Initiatives The MTO has been taking action to address climate change challenges in terms of both short-term effects (e.g. road flooding and washouts from increasing frequency and intensity of severe weather events) and longer-term effects from ongoing warming trends (e.g. infrastructure subsidence from permafrost melting, pavement damage from heat and freeze-thaw cycles, shorter operating seasons for winter roads). Current and planned MTO climate change initiatives are briefly described in this section, including maintenance, drainage, foundations, pavement design, and Intelligent Transportation Systems (ITS).
4.3.1 Revised Transportation Infrastructure Maintenance/ Operations Standards
Maintaining the highway network during the winter season is a high priority activity for MTO and highly visible to the public and stakeholders.
Historically, winter weather operations have varied year-to-year, as well as regionally, and a new way to measure winter severity called the Winter Severity Index (WSI) is under development. It will be applied during the winter of 2015-2016 after calibration based on historical data. The WSI rates winter conditions on a numerical scale using an index based on data such as the number of days with temperature falling within specified ranges, number of days with freezing rain and icing conditions, and number of days with strong winds following icing conditions. This index will help the Ministry and the public to understand regional and seasonal differences in winter weather and the effect on winter operations. The index can be calculated for past seasons using historical data to help develop trend information.
The Ministry is reviewing and updating maintenance standards and best practices with a view to improving the measurement of in-storm and post-storm performance by winter 2016/17. Included in this review will be the potential influences and trends of climate change (e.g. changes to intensity, duration, frequency and type of precipitation), to assist in interpreting predictive modelling of standards and updating technical requirements such as equipment complement. To be determined is the operational flexibility required to deliver
IBI GROUP WORKING PAPER #2: CLIMATE CHANGE CONTEXT Prepared for Ministry of Transportation, Ontario
January 15, 2016 56
service levels and accommodate changes over time, as well as where costs (labour, equipment, materials) may shift as the intensity, duration, frequency and type of precipitation change over time.
4.3.2 Increased Real-Time Road Condition Monitoring
Exhibit 4.8 shows the Road Weather Information System (RWIS) infrastructure that the Ministry has established in Northern Ontario in order to provide weather and highway condition information as experienced on Northern Ontario highways, in particular Highways 11 and 17. The map shows that 58 stations are in operation (an additional station is planned in Fort Frances). The provincial RWIS network has been developed recognizing that Ontario has 56 micro-climate areas with different weather characteristics based on historical observations.
Temperature and precipitation data are collected at these stations, along with wind velocity and road surface conditions (e.g. wet, snow-covered, ice-covered) and camera images. The data are aggregated with regional weather forecast information to produce pavement condition forecasts and local area forecasts which are used to optimize winter road maintenance operations and provide advisories to travellers.
The Highway 11 crossing of the Magnetawan River expands upon the RWIS functionality to incorporate Fixed Automated Spray Technology (FAST) to mitigate bridge icing. FAST combines the RWIS data with sensors and spray nozzles in the bridge deck to apply pre-emptive anti-icing chemicals as warranted.
Additional information is also collected at the eight Seasonal Load Advisory (SLA) locations shown in red, including depth of snow and depth of ground frost, using special instruments: a thermistor string going down about 2 metres under the road surface and moisture sensors at about 0.5, 1 and 1.5 metres depth. The thermistor string provides a subsurface temperature profile that can be used to estimate the top and bottom of the frozen layer and the moisture sensors measure the water saturation. The stations also use software to predict the depth of frozen layer a few days into the future based on the air temperature forecast.
This information is used for improved forecasting of road conditions; for example data on frost depth enables winter driving conditions to be reported more accurately and spring road-load restrictions on secondary roads to be removed as soon as possible. Under current plans, winter severity and driving conditions will be reported at five stations by March 2016, with planned expansion to more stations thereafter. This reporting system is part of the Ministry's Intelligent Transportation System (ITS) development program, as described further in Subsection 4.3.5.
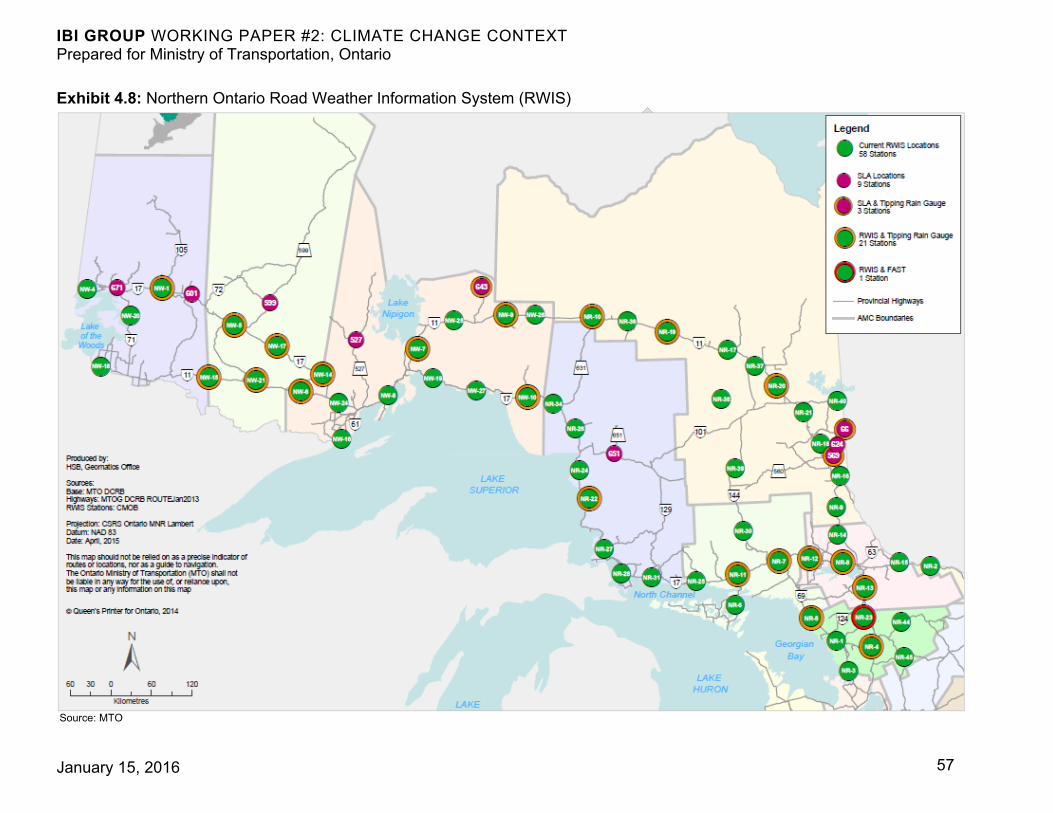
IBI GROUP WORKING PAPER #2: CLIMATE CHANGE CONTEXT Prepared for Ministry of Transportation, Ontario
January 15, 2016 57
Exhibit 4.8: Northern Ontario Road Weather Information System (RWIS)
Source: MTO
IBI GROUP WORKING PAPER #2: CLIMATE CHANGE CONTEXT Prepared for Ministry of Transportation, Ontario
January 15, 2016 58
4.3.3 Revised Drainage Standards
As described in earlier sections, highways and other transportation system elements are subject to flooding and washouts resulting from increasingly frequent and more severe weather events. The MTO has been taking a number of steps to address this, in collaboration with other agencies including Environment Canada, the Ontario Ministry of Environment and Climate Change, the Ministry of Natural Resources, the University of Waterloo and Engineers Canada. These steps have included:
developing and regularly updating the online tool of Intensity, Duration Frequency (IDF) curves described earlier in Subsection 4.1.1;
enhancing rainfall data collection by incorporating rainfall gauges into some of the RWIS stations in Northern Ontario – as outlined in subsection 4.3.1 above;
developing a Culvert Inventory System as part of its information management system; and
assessing the resilience of MTO drainage infrastructure to predicted changes in future rainfall. Rainfall forecasts are provided by various climate models and, based on these model results, a range of climate change scenarios (10%, 20%, and 30% increase in rainfall IDF from the 2007 base year) was used to assess the available hydraulic capacity of different components of the highway drainage system.
As described more fully in The Resilience of Ontario Highway Drainage Infrastructure to Climate Change (MTO, 2015), a number of important findings emerge from this work:
Owing to substantial differences in the results of various climate models – particularly as applied to precipitation forecasts at specific highway locations – caution should be used when considering applying climate model predictions directly to design; this is why three alternative climate change scenarios (10, 20 and 30% growth, respectively, as outlined above) were used in this study, based on the variability range established by forecasts from the various models, rather than using any of the model forecasts directly.
A sample of storm sewer facilities (located on Highway 417 in Ottawa and Highway 37 in Actinolite, Tweed County) was studied; a sample of 46 new or recently rehabilitated concrete and steel culverts was also studied; finally, two case studies of typical types of bridges were studied: Case 1 for bridges crossing a wide flood plain with various widths and slope abutments, and Case 2 for bridges crossing a confined flood plain.
The analysis indicated that a small percentage of the storm sewers studied (0%, 4% and 17% for the 10%, 20% and 30% growth
IBI GROUP WORKING PAPER #2: CLIMATE CHANGE CONTEXT Prepared for Ministry of Transportation, Ontario
January 15, 2016 59
scenarios, respectively) would exceed their design flow rate capacity before the end of their design life, and a similarly small percentage of the culverts studied (2%, 7% and 11%, respectively) would be over-capacity; with relatively minor adaptation measures, all would therefore be resilient for the remainder of their design life for the range of climate change scenarios studied.
The study identifies a number of “Hard Strategies” (physical actions to modify infrastructure, similar to many of those outlined above in Section 3.2 of the current report) and “Soft Strategies” including effective monitoring/maintenance of drainage facilities, coordination among various agencies and disciplines, pilot infrastructure vulnerability assessments, and public information programs. Most of the “Soft Strategies” could potentially be implemented in the short-term and at manageable costs.
The bridges tested also appeared to suffer no risk to structures as a result of flow increases resulting from the three climate scenarios studied; the report noted, however, that effects on surrounding lands and buildings were not evaluated, as this would have to be done on a site by site basis.
The study concludes that current MTO design standards and procedures are such that existing drainage facilities for provincial highways have an inherent resilience to flow increases anticipated to result from climate change; this finding may not apply, however, to drainage infrastructure designed and operated by other jurisdictions, and each jurisdiction would have to undertake a similar analysis to identify the level of resilience of their drainage infrastructure.
The study report notes that “…new climate change studies will continue to produce climate predictions… this study reviewed findings up to 2014 for Ontario”, and continuing work will therefore be required to update the findings in light of new predictions. It notes that the inherent uncertainty involved “…should cause researchers and policymakers to pause and consider the socio-economic impacts of the results being presented…before any findings become a requirement of design.”
4.3.4 Review of Road Foundations for Discontinuous Permafrost Areas
MTO Engineers monitor permafrost melting trends across Canada and the resulting subsidence of roads and other structures. They have assembled considerable information based on the growing literature about this subject and have attended PIEVC workshops and related conferences. The following comments draw on a review of that literature, in particular reference (Bateripour, 2011), from which the following comments are drawn:
IBI GROUP WORKING PAPER #2: CLIMATE CHANGE CONTEXT Prepared for Ministry of Transportation, Ontario
January 15, 2016 60
“Climate warming and human activities can lead to increases in ground temperature and thickening of the active layer — the top layer of soil that freezes during winter months and thaws during summer.”
“Seasonal cycles of freezing and thawing can cause large settlements and non-recoverable shear deformations in fine-grained soils.”
“Permafrost is defined as ground, whether soil or rock, that remains at or below a temperature of 0° C for a minimum period of two years.”
Observations (Bateripour et al, 2011) show that mean annual air temperatures in Canada are increasing more rapidly close to the 0°C isotherm4 than either farther north or farther south; that is, at the approximate latitude of the southern boundary of discontinuous permafrost shown earlier in Exhibit 3.3. Permafrost is continuous (i.e. not subject to freeze-thaw cycling and therefore continuously frozen) within about 50 km of Hudson Bay Coast. A wide band stretching southward from the continuous permafrost boundary experiences discontinuous permafrost; that is, unstable soil owing to freeze-thaw cycling between winter and summer.
MTO engineers have been closely monitoring an ongoing project by the University of Manitoba and the Manitoba Infrastructure and Transportation Department (MIT) on Provincial Road PR 391, about 18 km northwest of Thompson, Manitoba (Bateripour, 2011). This was constructed as a compacted earthen road on discontinuous permafrost in the mid-1960s, converted to a gravel road in the early 1970s, and upgraded with a bituminous pavement surface in the early 1980s.
“Since construction, changes in heat transfer have melted permafrost that had been detected earlier, particularly under embankments. Thawing leads to large ongoing irregular deformations and dangerous traffic issues."
"The information results — based on two years of instrumented observation — indicate a combination of seasonal and cumulative displacements, with larger displacements at the toe (of the embankment) than at the shoulder. The results show a combination of seasonal heaving and lateral spreading."
"The data confirm field observations of the thawing of ice that was present in the first drilling of the site in 1991 but absent in recent drilling in 2008."
The report also notes that
"… Several methods are currently used to prevent or minimize thawing of permafrost and development of thermokarst. These include above-ground construction, use of thermal siphons, and building on gravel pads above the original ground level."
4 An isotherm is like a contour line, representing the line along which all locations experience the same average temperature.
IBI GROUP WORKING PAPER #2: CLIMATE CHANGE CONTEXT Prepared for Ministry of Transportation, Ontario
January 15, 2016 61
Since the site of this work is approximately at the mid-latitude of the discontinuous permafrost band mentioned above (i.e. at about 53⁰ north latitude), it is likely that the experience of dealing with subsidence of all-season roads due to permafrost melting at that location will be directly applicable to similar roads constructed at that latitude in the Far North of Ontario; e.g., in the area north of Pickle Lake or Nakina that would have to be traversed should a new all-season road to the Ring of Fire be considered as the transportation link between the area and the existing transportation network.
4.3.5 Pavement Design
New pavement design approaches and materials are being studied and applied to prevent degradation of road surfaces such as the types of pavement cracking and rutting illustrated earlier in Section 3.2.
In this context, the MTO is installing a new system called Mechanistic Empirical Pavement Design Guide (MEPDG) with an associated software package, AASHTOWare Pavement ME Design, which has been developed by the American Association of State Highway and Transportation Officials (AASHTO) to replace the old system.
MEPDG produces estimates of future pavement performance represented by means of the International Roughness Index (IRI), stress-related cracking, thermal cracking and rutting. It will potentially be a good tool to measure how climate change is affecting pavement performance as Pavement ME Design draws on data inputs from the climate and weather stations described above in Section 4.3.1.
MTO is in the process of obtaining licences and installing Pavement ME Design software, with installation expected to be completed by the end of 2015.
4.3.5 Intelligent Transportation Systems (ITS)
MTO utilizes various communications media to inform travellers of road conditions in Northern Ontario, thereby improving travel safety and reducing delays associated with road closures/restrictions and adverse road weather conditions. Ontario 511 (www.ontario.ca/511) is a province-wide 24/7 voice-activated telephone and web information service. This service incorporates Northern Ontario information related to construction work zones, road weather conditions, road weather camera images, and road closures.
MTO has also deployed a network of Variable Message Signs (VMSs) to provide motorists with advisory information particularly relevant to long-distance travellers. Conditions for signage include: winter closures due to unsafe driving conditions; highway or lane closures due to incidents; weather advisories and warnings; amber alerts; and construction activities or scheduled road maintenance. At other times the signs display safety messages. VMS are placed near opportunities for turnaround and near hotels and restaurants to allow long-distance travellers to
IBI GROUP WORKING PAPER #2: CLIMATE CHANGE CONTEXT Prepared for Ministry of Transportation, Ontario
January 15, 2016 62
stop and wait for the road to reopen. Where the opportunity exists, the signs are located in advance of key decision points to afford access to alternative routes as applicable.
To date, MTO Northeast Region has installed 14 medium-size VMSs on Highways 69, 11 and 17, and three small VMS on Highway 17 in Sault Ste. Marie and Wawa. The messages are posted by staff in Sudbury. The Northwest Region currently operates 13 small VMSs, with messages posted by staff in Thunder Bay.
As noted above, ITS technology is also being applied in some jurisdictions to provide automatic monitoring of traffic volumes and road conditions so that system operators have real-time information for quicker response and so that variable-message signs can provide such information to drivers, warning them of hazardous conditions ahead, for example.
While automatic traffic counters have been used for many years on conventional highways, the original pneumatic tube technology does not work under winter roads, and wired connections to provide power/communications are rarely available for such roads and other highways serving Northern Ontario. Faced with such conditions, the Government of the Northwest Territories Department of Transportation (GNWT DOT) deploys wireless traffic counters on its winter roads, as illustrated in Exhibit 4.9.
These counters are manufactured by Trafx Research Ltd., based in Canmore Alberta. They operate on three C-cell batteries and do not require the installation of loops or tubes in the roadway. They cost about $500 each and the GNWT DOT reports that, even in their harsh winter conditions, a set of batteries will last for at least six months, which is longer than their winter road operating season. On overland winter roads, the counters are installed along the roadside; for winter roads constructed on ice, the counters are installed near the centerline of the roadway by drilling a 30-cm deep hole.
For the 2015 to 2016 winter road season, MNDM purchased and plans to install equipment of this type on select winter roads in the Far North. The traffic count equipment detects changes in the electro-magnetic field as vehicles pass by the physical counter. This change in electro-magnetic field triggers a count which is accumulated by the device and stored for later collection when the device is inspected periodically or collected at the end of the operating season.
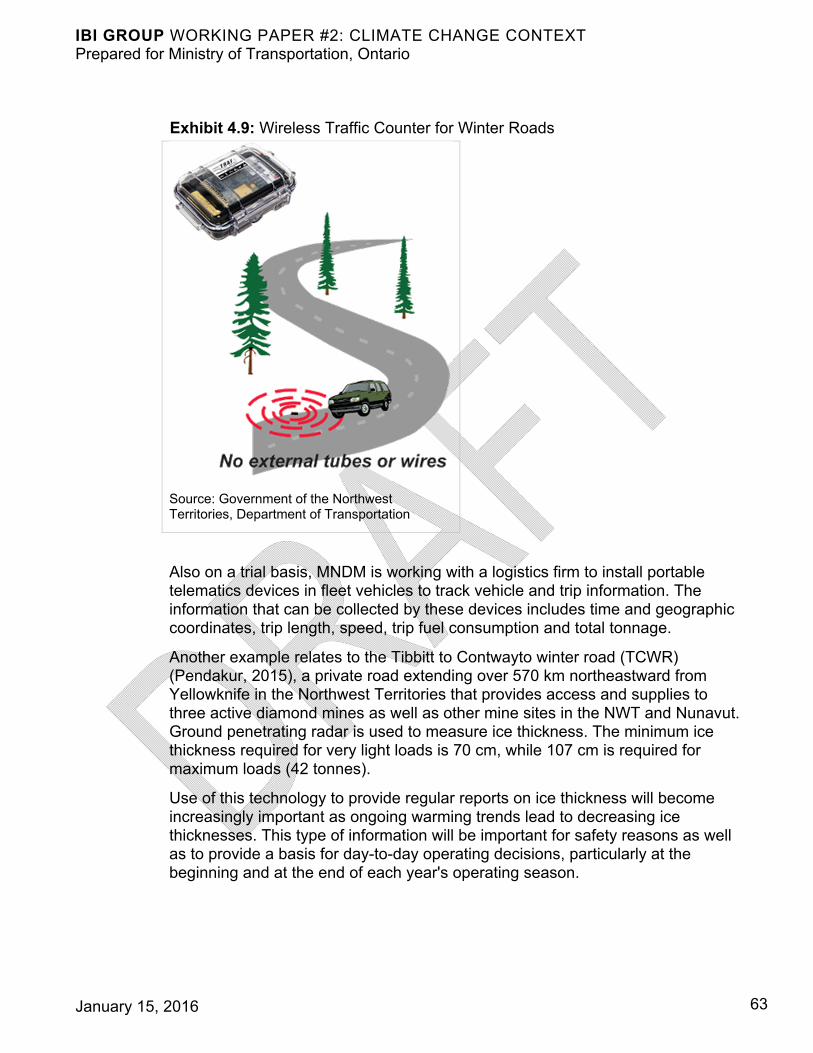
IBI GROUP WORKING PAPER #2: CLIMATE CHANGE CONTEXT Prepared for Ministry of Transportation, Ontario
January 15, 2016 63
Exhibit 4.9: Wireless Traffic Counter for Winter Roads
Source: Government of the Northwest Territories, Department of Transportation
Also on a trial basis, MNDM is working with a logistics firm to install portable telematics devices in fleet vehicles to track vehicle and trip information. The information that can be collected by these devices includes time and geographic coordinates, trip length, speed, trip fuel consumption and total tonnage.
Another example relates to the Tibbitt to Contwayto winter road (TCWR) (Pendakur, 2015), a private road extending over 570 km northeastward from Yellowknife in the Northwest Territories that provides access and supplies to three active diamond mines as well as other mine sites in the NWT and Nunavut. Ground penetrating radar is used to measure ice thickness. The minimum ice thickness required for very light loads is 70 cm, while 107 cm is required for maximum loads (42 tonnes).
Use of this technology to provide regular reports on ice thickness will become increasingly important as ongoing warming trends lead to decreasing ice thicknesses. This type of information will be important for safety reasons as well as to provide a basis for day-to-day operating decisions, particularly at the beginning and at the end of each year's operating season.
IBI GROUP WORKING PAPER #2: CLIMATE CHANGE CONTEXT Prepared for Ministry of Transportation, Ontario
January 15, 2016 64
5 Next Steps
Please share any feedback or new information for topics contained within this report with the NOMTS team through the project website: http://nomts.ca/contact-us/ .
This working paper accompanies a previously posted working paper, focusing on Northern Ontario’s geographic and policy context. A third working paper, focusing on Northern Ontario’s Socio-Economic Context, is expected to be posted on the project website by February 2016. Together, these three working papers help inform a report on the first phase of work on the Strategy.
A draft report of findings from the first phase of our work on the Strategy is expected to be posted on the project website for review and comment by March 2016.
IBI GROUP WORKING PAPER #2: CLIMATE CHANGE CONTEXT Prepared for Ministry of Transportation, Ontario
January 15, 2016 65
References
Bateripour, M.R. et al (2011): Deformations of a Highway Embankment on Degraded Permafrost, paper presented to the 2011 Pan-Am CGS Geotechnical Conference
Bloomberg, M.R. et al (2014): Risky Business, A Climate Risk Assessment for the United States
CPCS (2013): Transportation Requirements for Economic Sector Development in Northern Ontario, Final Report, prepared for Ministry of Transportation Ontario
Engineers Canada (2011): PIEVC Protocol for Infrastructure Vulnerability Assessment and Adaptation to a Changing Climate Revision 10 – BETA
Environment Canada (2015): National Climate Data and Archive <http://climate.weather.gc.ca>
Environment Canada (2015b): Climate Trends and Variations Bulletin – Annual for 2014 (Cat. No.: En81-23E-PDF). Her Majesty the Queen in Right of Canada, represented by the Minister of the Environment
Golden, D.M. et al (2014): “Blue-ice”: Framing Climate Change and Reframing Climate Change Adaptation from The Indigenous Peoples’ Perspective in the Northern Boreal Forest of Ontario, Canada, Climate and Development, DOI: 10.1080/17565529.2014.966048; retrieved from http://dx.doi.org/10.1080/17565529.2014/966048
Government of Canada (2015): Climate Risks and Adaptation Practices for the Canadian Transportation Sector (draft)
Government of Ontario (2009): Adapting to Climate Change in Ontario: Towards the Design and Implementation of a Strategy and Action Plan. Report to the Minister of the Environment.
Handwerk, Brian for National Geographic (2013: Arctic Hudson Bay Warming Rapidly, At Tipping Point
Institute for Catastrophic Loss Reduction (ICLR) for Insurance Bureau of Canada (IBC) (2012): Telling the Weather Story
IPCC (2013): Summary for Policymakers. In: Climate Change 2013: The Physical Science Basis. Contribution of Working Group I to the Fifth Assessment Report of the Intergovernmental Panel on Climate Change [Stocker, T.F., D. Qin, G.K. Plattner, M. Tignor, S.K. Allen, J. Boschung, A. Nauels, Y. Xia, V. Bex and P.M. Midgley (eds)]. Cambridge University Press, Cambridge, United Kingdom and New York, NY, USA
IBI GROUP WORKING PAPER #2: CLIMATE CHANGE CONTEXT Prepared for Ministry of Transportation, Ontario
January 15, 2016 66
Irwin, N.A. (January 27, 2015): Extreme Weather and Transportation in Toronto, in Transport Canada Webinar Series, Transportation: Adapting to a Changing Climate
Lapp, David (2011): Adapting Civil Infrastructure to a Changing Climate – From Policy to Practice; PowerPoint presentation on behalf of Engineers Canada to the Ontario Centre for Engineering and Public Policy, February 10, 2011
Met Office, 2015: "Global Surface Temperature." Web, accessed 2015-12-02. <http://www.metoffice.gov.uk/research/monitoring/climate/surface-temperature>.
McDermid, J., S. Fera and A. Hogg, 2015: Climate change projections for Ontario: An updated synthesis for policymakers and planners. Ontario Ministry of Natural Resources and Forestry, Science and Research Branch, Peterborough, Ontario. Climate Change Research Report CCRR-44
Ministry of Environment and Climate Change (2015): Ontario’s Climate Change Discussion Paper 2015
Ministry of Northern Development and Mines (2014): Northern Ontario Winter Roads
Ministry of Transportation, Ontario (2015): The Resilience of Ontario Highway Drainage Infrastructure to Climate Change
Ministry of Transportation, Ontario (2015b): IDF Curve Lookup (Online Tool) <http://www.mto.gov.on.ca/IDF_Curves>
Nodelman, J.R. et al (February 7, 2012): Climate Change and Infrastructure Vulnerability Assessment, FCM Workshop, Ottawa, Ontario
Ontario Centre for Climate Impacts and Adaptation Resources (November 2011): Climate Change Impacts and Adaptation in Northern Ontario – OCCIAR Workshop Report
Ontario Ministry of the Environment (March 9, 2011): Climate Change Adaptation in Ontario, Hamilton Workshop; retrieved from http://www.climateontario.ca/doc/workshop/2011FebMarch/Louis%20DesRosiers%20-%20Hamilton.pdf
Ontario Ministry of the Environment (2011): Climate Ready: Ontario’s Adaptation Strategy and Action Plan
Ontario Ministry of Infrastructure and Ministry of Northern Development and Mines (2011): Growth Plan for Northern Ontario
Ontario Ministry of Natural Resources and Forestry: Flood Forecasting and Warning Program; retrieved from www.ontario.ca/law-and-safety/flood-forecasting-and-forecasting-program
IBI GROUP WORKING PAPER #2: CLIMATE CHANGE CONTEXT Prepared for Ministry of Transportation, Ontario
January 15, 2016 67
Paris Agreement on Climate Change – European Commission (2015)
Parsons Brinckerhoff (July 28, 2015): TRB Webinar: Climate Change, Extreme Weather Events and the Highway System
Pendakur, K et al (2015) Climate Risks and Adaptation Practices for the Canadian Transportation Sector: The Northern Territories (draft chapter from reference (Government of Canada, 2015)
Prentice, B.E. and Adaman, M. (2015): Economics of Transport Airships for Food Distribution to Isolated Communities in Northern Manitoba and Ontario, Canada; prepared for presentation at the 10th Biennial International Airship Convention & Exhibition in conjunction with Aero Friedrichshafen, April 16-18, 2015
Prowse, T.D. et al (2009): Implications of Climate Change for Economic Development in Northern Canada: Energy, Resource, and Transportation Sectors
R.V. Anderson Associates Limited (March 13, 2008): Sudbury Roads and Associated Structure Vulnerability Assessment Phase II – Pilot Study; accessed through Engineers Canada PIEVC website
Transportation Research Board (2011): Adapting Transportation to the Impacts of Climate Change: State of the Practice 2011, Special Task Force on Climate Change and Energy
Transportation Research Board (2014): Climate Change, Extreme Weather Events, and the Highway System – Practitioner’s Guide and Research Report, NCHRP Report 750 Strategic Issues Facing Transportation Volume 2
Transport Institute, University of Manitoba (2002): Airships to the Arctic Symposium, October 22-24, 2002
U.S. Department of Transportation (2014): Climate Change Adaptation Plan
U.S. Department of Transportation (2015): International Practices on Climate Adaptation in Transportation, Synthesis Report
Warren, J.F. and Lemmen, D.S. (2014): Canada in a Changing Climate: Sector Perspectives on Impacts and Adaptation, Government of Canada, Ottawa, ON. 286 p; pp. 27 and 29 drawn on in Vincent, L. et al 2012 and Environment Canada 2011
Willows, R.I. and Connell, R.K., eds. (2003): Climate adaptation: Risk, uncertainty and decision-making. UKCIP Technical Report. UKCIP, Oxford.
Winter Roads Technical Working Group (2010): First Nations Guidelines for the Construction and Maintenance of Existing Winter Roads
IBI GROUP WORKING PAPER #2: CLIMATE CHANGE CONTEXT Prepared for Ministry of Transportation, Ontario
January 15, 2016 68
Alternate Text for Exhibits Exhibit 2.1: Global Average Temperature Trends, 1850-2012
This line chart depicts average global temperature annually from 1850 to 2012, presented as the difference in degrees Celsius from the 1961 to 1990 average global temperature, which is indicated as the zero point of the vertical axis. Global average temperatures from three data sources are used: the Met Office Hadley Centre and Climatic Research Unit, the NOAA National Climatic Data Center, and the NASA Goddard Institute for Space Studies. The temperatures for each of the three data sources are generally in agreement with each other, with only minor differences in the global temperatures for each year. There is some variability in the temperatures from year to year, but the general temperature trend is flat at approximately -0.3 to-0.4 degrees Celsius less than the 1961 to 1990 average from 1850 to 1990, and increasing from approximately year 1900 to year 2012, where the temperatures are in the range of 0.4 to 0.5 degrees above the 1961 to 1990 average.
Return to Exhibit 2.1.
Exhibit 2.2: Temperature Trends, Canada, 1948-2014
This line chart presents annual temperatures from 1948 to 2014 in Canada as the departure from the 1961 to 1990 average in degrees Celsius. The yearly data show temperature fluctuations from year to year. A linear trend line is fitted to the data, showing an increase from approximately 0.5 degrees Celsius below the 1961 to 1990 average in 1950, to approximately 1.2 degrees above the 1961 to 1991 average in 2014.
Return to Exhibit 2.2.
Exhibit 2.3: Precipitation Trends, Canada: 1948-2014
This bar chart shows average yearly precipitation from 1948 to 2014 as the departure from the 1961 to 1990 average precipitation levels. A 9-year running mean is shown as a line across the chart as well, indicating overall increases in precipitation levels from approximately 10 percent below 1961 to 1990 levels in 1950 to approximately 8 percent above 1991 to 1990 levels in 2010.
Return to Exhibit 2.3.
IBI GROUP WORKING PAPER #2: CLIMATE CHANGE CONTEXT Prepared for Ministry of Transportation, Ontario
January 15, 2016 69
Exhibit 2.4: Mean Summer Temperature (Change from 1971-2000 Baseline)
This exhibit displays an array of nine maps of Ontario arranged in three rows and three columns. Each map indicates projected mean summer temperature change in degrees Celsius under different scenarios, as compared to the 1971 to 2000 baseline. The three columns in order from left to right indicate three climate change scenarios: RCP 2.6, RCP 4.5, and RCP 8.5, and the three rows indicate three time periods: 2011 to 2040, 2041 to 2070, and 2071 to 2100. The greatest increases in temperature from the baseline can be seen in the RCP 8.5 scenario in 2071 to 2100, where precipitation changes from the baseline are in the range of 8 to 9 degrees Celsius across Ontario. The RCP 2.6 scenario for the same time period has summer temperature increases in the range of 2.5 to 4 degrees Celsius across Ontario.
Return to Exhibit 2.4.
Exhibit 2.5: Mean Winter Temperature (Change from 1971-2000 Baseline)
This exhibit displays an array of nine maps of Ontario arranged in three rows and three columns. Each map indicates projected mean winter temperature change in degrees Celsius under different scenarios, as compared to the 1971 to 2000 baseline. The three columns in order from left to right indicate three climate change scenarios: RCP 2.6, RCP 4.5, and RCP 8.5, and the three rows indicate three time periods: 2011 to 2040, 2041 to 2070, and 2071 to 2100. The greatest increases in temperature from the baseline can be seen in the RCP 8.5 scenario in 2071 to 2100, where precipitation changes from the baseline are in the range of 9 degrees to more than 10 degrees Celsius across Ontario. The RCP 2.6 scenario for the same time period has winter temperature increases in the range of 3 to 6 degrees Celsius across Ontario.
Return to Exhibit 2.5.
Exhibit 2.6: Total Summer Precipitation (Change from 1971-2000 Baseline)
This exhibit displays an array of nine maps of Ontario arranged in three rows and three columns. Each map indicates projected mean summer precipitation change in millimetres under different scenarios, as compared to the 1971 to 2000 baseline. The three columns in order from left to right indicate three climate change scenarios: RCP 2.6, RCP 4.5, and RCP 8.5, and the three rows indicate three time periods: 2011 to 2040, 2041 to 2070, and 2071 to 2100. The greatest change from the baseline can be seen in the RCP 8.5 scenario in 2071 to 2100, where precipitation changes from the baseline ranges from an increase of zero to 25 mm to a decrease of 125 to 100 mm across Ontario. The RCP 2.6 scenario for the same time period shows a lower change of precipitation, ranging from a
IBI GROUP WORKING PAPER #2: CLIMATE CHANGE CONTEXT Prepared for Ministry of Transportation, Ontario
January 15, 2016 70
reduction of 25 to 50 mm to an increase of 25 to 50 mm precipitation in some areas.
Return to Exhibit 2.6.
Exhibit 2.7: Total Winter Precipitation (Change from 1971-2000 Baseline)
This exhibit displays an array of nine maps of Ontario arranged in three rows and three columns. Each map indicates projected mean winter precipitation change in millimetres under different scenarios, as compared to the 1971 to 2000 baseline. The three columns in order from left to right indicate three climate change scenarios: RCP 2.6, RCP 4.5, and RCP 8.5, and the three rows indicate three time periods: 2011 to 2040, 2041 to 2070, and 2071 to 2100. The greatest change from the baseline can be seen in the RCP 8.5 scenario in 2071 to 2100, where precipitation change from the baseline ranges from an increase of 25 to 50 mm to an increase of 100 to 125 mm across Ontario. The RCP 2.6 scenario for the same time period has a lower magnitude of precipitation change, ranging from a decrease of 0 to 25 mm to an increase of 100 to 125 mm precipitation.
Return to Exhibit 2.7.
Exhibit 2.8: Climate Data Availability by Location
This chart outlines data availability by earliest year and latest year for each of the twelve cities used in discussing localized climate change trends. The twelve locations are: Gore Bay, North Bay, Sault Ste. Marie, Sudbury, Timmins, Thunder Bay, Sioux Lookout, Kenora, Moosonee, Big Trout Lake, Pickle Lake, and Smoky Falls. The data is available from the mid-1950s for most locations except Sault Ste. Marie, which has data from 1962. Data is available until 2005 for most locations with the exception of Moosonee and Big Trout Lake, which have data until the early 1990s and Smoky Falls, which has data until 1997.
Return to Exhibit 2.8.
Exhibit 2.9: Historic Trends in Total Number Days per Year with Average Daily Temperature above 0°C in Three Representative Northern Ontario Locations
This exhibit displays historic trends in the total number of days per year with an average daily temperature above 0 degrees Celsius in North Bay, Sioux Lookout, and Moosonee, using line plots to showing observed number of days annually. The line data shows some fluctuation from year to year, and the linear best-fit line shown on the graph shows a slight positive slope, indicting a gradual increase in the number of days with temperature above zero degrees Celsius annually. The
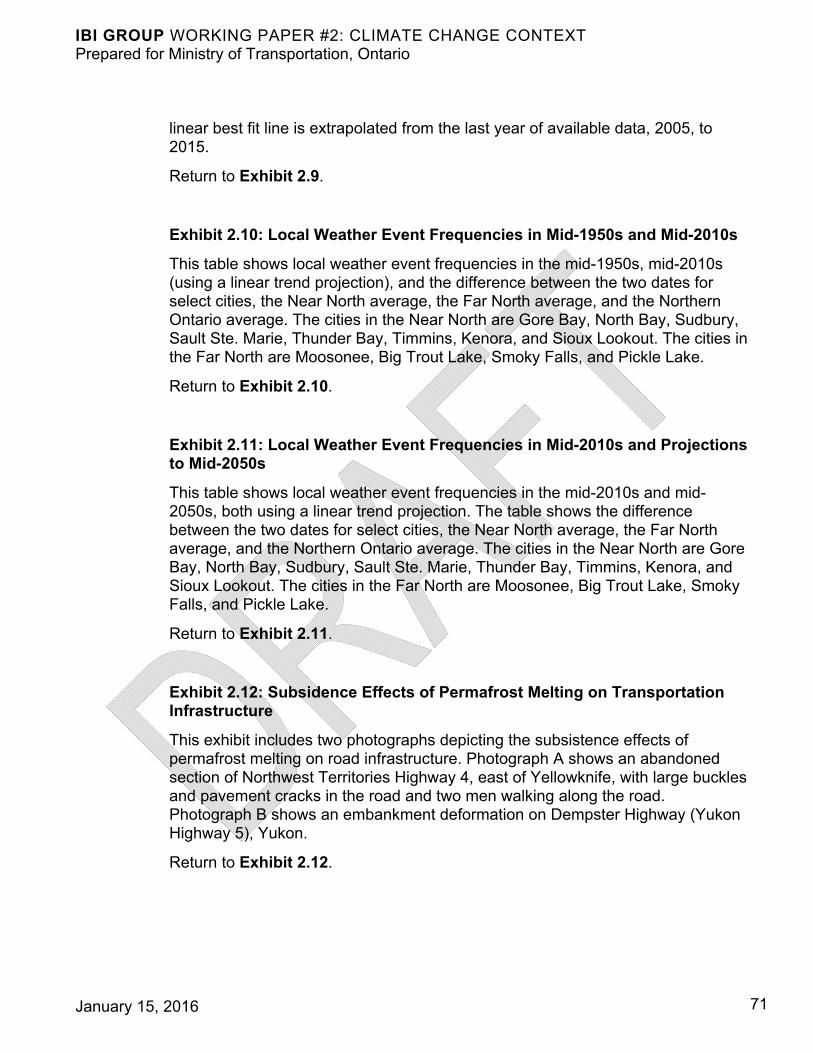
IBI GROUP WORKING PAPER #2: CLIMATE CHANGE CONTEXT Prepared for Ministry of Transportation, Ontario
January 15, 2016 71
linear best fit line is extrapolated from the last year of available data, 2005, to 2015.
Return to Exhibit 2.9.
Exhibit 2.10: Local Weather Event Frequencies in Mid-1950s and Mid-2010s
This table shows local weather event frequencies in the mid-1950s, mid-2010s (using a linear trend projection), and the difference between the two dates for select cities, the Near North average, the Far North average, and the Northern Ontario average. The cities in the Near North are Gore Bay, North Bay, Sudbury, Sault Ste. Marie, Thunder Bay, Timmins, Kenora, and Sioux Lookout. The cities in the Far North are Moosonee, Big Trout Lake, Smoky Falls, and Pickle Lake.
Return to Exhibit 2.10.
Exhibit 2.11: Local Weather Event Frequencies in Mid-2010s and Projections to Mid-2050s
This table shows local weather event frequencies in the mid-2010s and mid-2050s, both using a linear trend projection. The table shows the difference between the two dates for select cities, the Near North average, the Far North average, and the Northern Ontario average. The cities in the Near North are Gore Bay, North Bay, Sudbury, Sault Ste. Marie, Thunder Bay, Timmins, Kenora, and Sioux Lookout. The cities in the Far North are Moosonee, Big Trout Lake, Smoky Falls, and Pickle Lake.
Return to Exhibit 2.11.
Exhibit 2.12: Subsidence Effects of Permafrost Melting on Transportation Infrastructure
This exhibit includes two photographs depicting the subsistence effects of permafrost melting on road infrastructure. Photograph A shows an abandoned section of Northwest Territories Highway 4, east of Yellowknife, with large buckles and pavement cracks in the road and two men walking along the road. Photograph B shows an embankment deformation on Dempster Highway (Yukon Highway 5), Yukon.
Return to Exhibit 2.12.
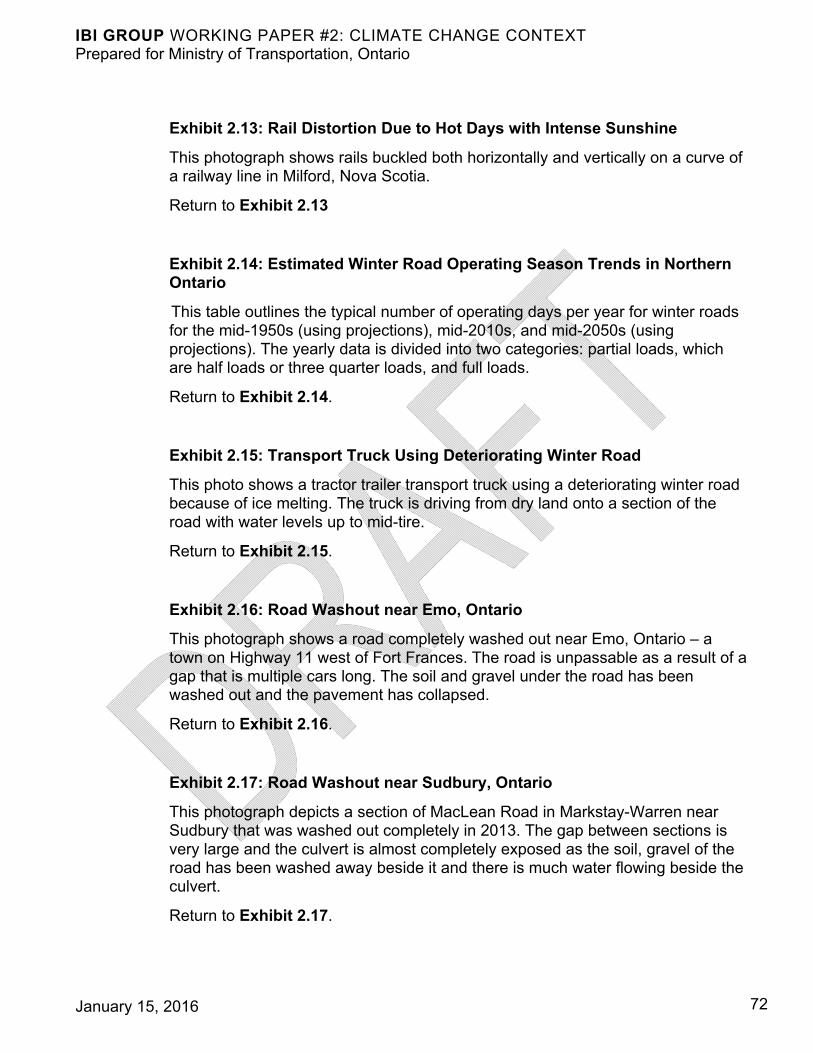
IBI GROUP WORKING PAPER #2: CLIMATE CHANGE CONTEXT Prepared for Ministry of Transportation, Ontario
January 15, 2016 72
Exhibit 2.13: Rail Distortion Due to Hot Days with Intense Sunshine
This photograph shows rails buckled both horizontally and vertically on a curve of a railway line in Milford, Nova Scotia.
Return to Exhibit 2.13
Exhibit 2.14: Estimated Winter Road Operating Season Trends in Northern Ontario
This table outlines the typical number of operating days per year for winter roads for the mid-1950s (using projections), mid-2010s, and mid-2050s (using projections). The yearly data is divided into two categories: partial loads, which are half loads or three quarter loads, and full loads.
Return to Exhibit 2.14.
Exhibit 2.15: Transport Truck Using Deteriorating Winter Road
This photo shows a tractor trailer transport truck using a deteriorating winter road because of ice melting. The truck is driving from dry land onto a section of the road with water levels up to mid-tire.
Return to Exhibit 2.15.
Exhibit 2.16: Road Washout near Emo, Ontario
This photograph shows a road completely washed out near Emo, Ontario – a town on Highway 11 west of Fort Frances. The road is unpassable as a result of a gap that is multiple cars long. The soil and gravel under the road has been washed out and the pavement has collapsed.
Return to Exhibit 2.16.
Exhibit 2.17: Road Washout near Sudbury, Ontario
This photograph depicts a section of MacLean Road in Markstay-Warren near Sudbury that was washed out completely in 2013. The gap between sections is very large and the culvert is almost completely exposed as the soil, gravel of the road has been washed away beside it and there is much water flowing beside the culvert.
Return to Exhibit 2.17.
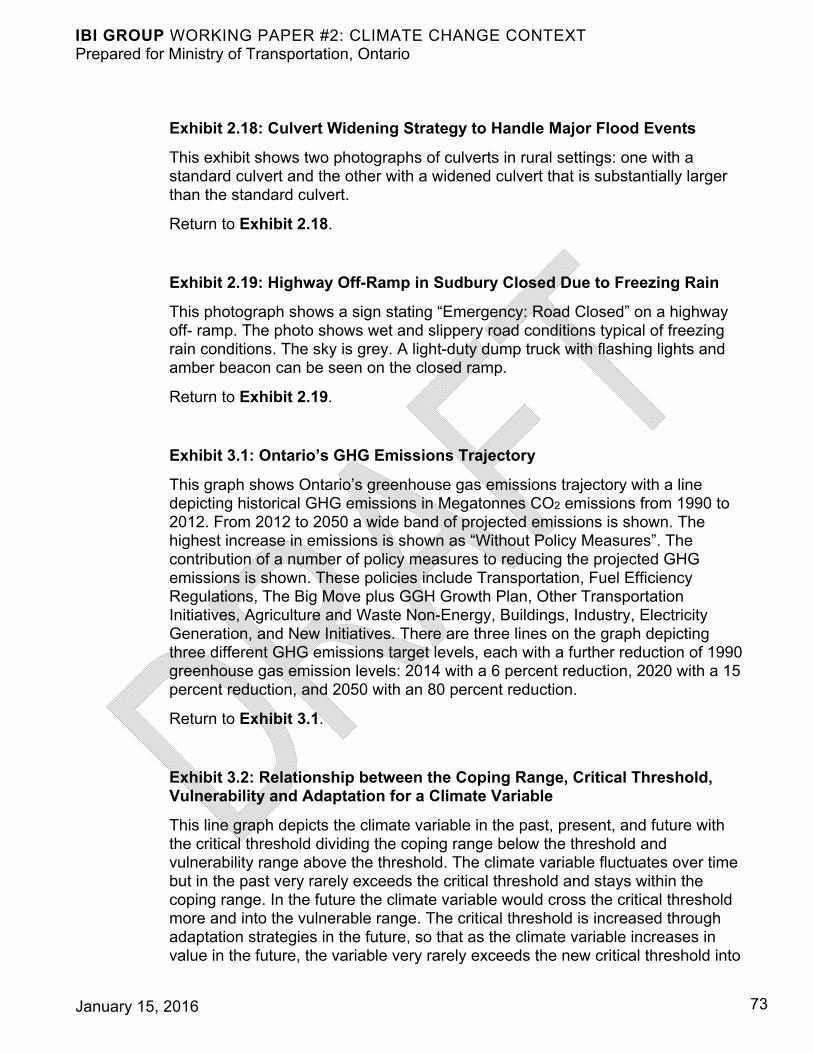
IBI GROUP WORKING PAPER #2: CLIMATE CHANGE CONTEXT Prepared for Ministry of Transportation, Ontario
January 15, 2016 73
Exhibit 2.18: Culvert Widening Strategy to Handle Major Flood Events
This exhibit shows two photographs of culverts in rural settings: one with a standard culvert and the other with a widened culvert that is substantially larger than the standard culvert.
Return to Exhibit 2.18.
Exhibit 2.19: Highway Off-Ramp in Sudbury Closed Due to Freezing Rain
This photograph shows a sign stating “Emergency: Road Closed” on a highway off- ramp. The photo shows wet and slippery road conditions typical of freezing rain conditions. The sky is grey. A light-duty dump truck with flashing lights and amber beacon can be seen on the closed ramp.
Return to Exhibit 2.19.
Exhibit 3.1: Ontario’s GHG Emissions Trajectory
This graph shows Ontario’s greenhouse gas emissions trajectory with a line depicting historical GHG emissions in Megatonnes CO2 emissions from 1990 to 2012. From 2012 to 2050 a wide band of projected emissions is shown. The highest increase in emissions is shown as “Without Policy Measures”. The contribution of a number of policy measures to reducing the projected GHG emissions is shown. These policies include Transportation, Fuel Efficiency Regulations, The Big Move plus GGH Growth Plan, Other Transportation Initiatives, Agriculture and Waste Non-Energy, Buildings, Industry, Electricity Generation, and New Initiatives. There are three lines on the graph depicting three different GHG emissions target levels, each with a further reduction of 1990 greenhouse gas emission levels: 2014 with a 6 percent reduction, 2020 with a 15 percent reduction, and 2050 with an 80 percent reduction.
Return to Exhibit 3.1.
Exhibit 3.2: Relationship between the Coping Range, Critical Threshold, Vulnerability and Adaptation for a Climate Variable
This line graph depicts the climate variable in the past, present, and future with the critical threshold dividing the coping range below the threshold and vulnerability range above the threshold. The climate variable fluctuates over time but in the past very rarely exceeds the critical threshold and stays within the coping range. In the future the climate variable would cross the critical threshold more and into the vulnerable range. The critical threshold is increased through adaptation strategies in the future, so that as the climate variable increases in value in the future, the variable very rarely exceeds the new critical threshold into
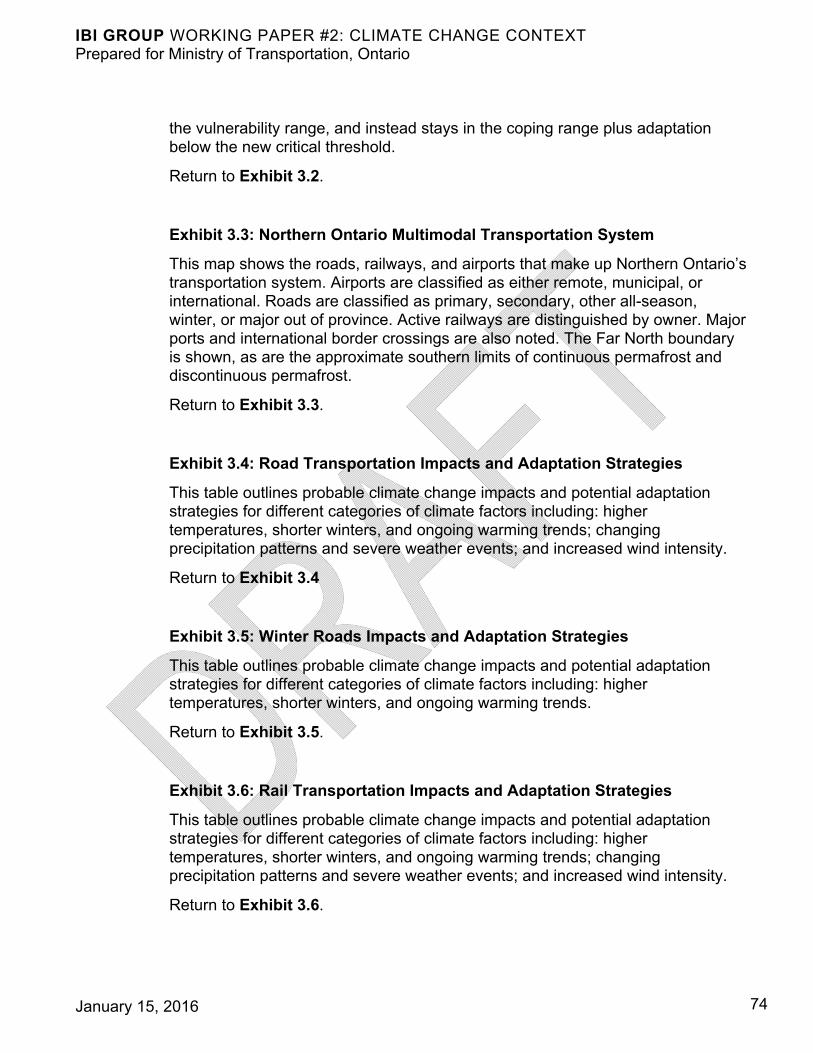
IBI GROUP WORKING PAPER #2: CLIMATE CHANGE CONTEXT Prepared for Ministry of Transportation, Ontario
January 15, 2016 74
the vulnerability range, and instead stays in the coping range plus adaptation below the new critical threshold.
Return to Exhibit 3.2.
Exhibit 3.3: Northern Ontario Multimodal Transportation System
This map shows the roads, railways, and airports that make up Northern Ontario’s transportation system. Airports are classified as either remote, municipal, or international. Roads are classified as primary, secondary, other all-season, winter, or major out of province. Active railways are distinguished by owner. Major ports and international border crossings are also noted. The Far North boundary is shown, as are the approximate southern limits of continuous permafrost and discontinuous permafrost.
Return to Exhibit 3.3.
Exhibit 3.4: Road Transportation Impacts and Adaptation Strategies
This table outlines probable climate change impacts and potential adaptation strategies for different categories of climate factors including: higher temperatures, shorter winters, and ongoing warming trends; changing precipitation patterns and severe weather events; and increased wind intensity.
Return to Exhibit 3.4
Exhibit 3.5: Winter Roads Impacts and Adaptation Strategies
This table outlines probable climate change impacts and potential adaptation strategies for different categories of climate factors including: higher temperatures, shorter winters, and ongoing warming trends.
Return to Exhibit 3.5.
Exhibit 3.6: Rail Transportation Impacts and Adaptation Strategies
This table outlines probable climate change impacts and potential adaptation strategies for different categories of climate factors including: higher temperatures, shorter winters, and ongoing warming trends; changing precipitation patterns and severe weather events; and increased wind intensity.
Return to Exhibit 3.6.
IBI GROUP WORKING PAPER #2: CLIMATE CHANGE CONTEXT Prepared for Ministry of Transportation, Ontario
January 15, 2016 75
Exhibit 3.7: Air Transportation Impacts and Adaptation Strategies
This table outlines probable climate change impacts and potential adaptation strategies for different categories of climate factors including: higher temperatures, shorter winters, and ongoing warming trends; changing precipitation patterns and severe weather events.
Return to Exhibit 3.7.
Exhibit 3.8: Marine Transportation Impacts and Adaptation Strategies
This table outlines probable climate change impacts and potential adaptation strategies for different categories of climate factors including: higher temperatures, shorter winters, and ongoing warming trends; changing precipitation patterns and severe weather events.
Return to Exhibit 3.8.
Exhibit 4.1: Alternative Projections of Global Average Temperature Change
This graph shows historical temperatures annually from 1950 to 2005, then shows alternative global temperature change under different scenarios from 2005 to 2100. Alternative future projections based on the RCP 2.6 scenario at the lower range of temperature change, and the RCP 8.5 scenario at the highest range. The mean over 2081 to 2100 is also shown at the right side for these two scenarios plus two other intermediate scenarios: RCP 4.5 and RCP 6.0.
Return to Exhibit 4.1.
Exhibit 4.2: Overview of the Public Infrastructure Engineering Vulnerability Committee Protocol
This flow chart provides an overview of the steps in the public infrastructure vulnerability committee protocol. There are five steps: Step 1 is project definition; Step 2 is data gathering and sufficiency; Step 3 is risk assessment, after which a decision on whether engineering analysis is needed is made. Engineering analysis, if needed, represents Step 4. Step 5 is to provide conclusions and recommendations.
Return to Exhibit 4.2.
IBI GROUP WORKING PAPER #2: CLIMATE CHANGE CONTEXT Prepared for Ministry of Transportation, Ontario
January 15, 2016 76
Exhibit 4.3: Example Risk Matrix and Climate Change Risk Reduction through Adaptation to Reduce Severity of Impact
This example risk matrix has an array of cells with probability of a weather event on the horizontal axis and the severity of impact of the event on the vertical axis, both rated from zero to seven. The risk matrix shows a risk value in each cell as the severity factor multiplied by the probability factor. A flood event at low probability and high severity in the past increases in probability and risk over time. The flood decreases in severity through adaptation strategies to make the flood event less of a risk.
Return to Exhibit 4.3.
Exhibit 4.4: Risk Assessment Process
This flow chart depicts Step 3 of the Public Infrastructure Engineering Vulnerability Committee Protocol, the Risk Assessment phase. Many factors go into risk assessment including: risk tolerance thresholds, infrastructure response, possible interactions, cumulative or combination events, judgement on probability, judgement on severity, and judgement on uncertainty. If there is insufficient data, one should return to Step 2, which is Data Collection. If there is sufficient data, one can decide whether more analysis is required. If no more analysis is required, proceed to Step 5. If more analysis is required, decide whether Engineering Analysis of Step 4 is also required needed; otherwise proceed to Step 5.
Return to Exhibit 4.4.
Exhibit 4.5: Intensity-Duration-Frequency (IDF) Curve for Engineering Analysis, Sault Ste. Marie Example
This chart provides an example of an intensity-duration-frequency curve for rainstorms in Sault Ste. Marie. The vertical axis depicts rain intensity in millimetres per hour on a logarithmic scale. The horizontal axis reports on the duration in minutes on a logarithmic scale. The chart provides IDF curves for six return periods: 2 year, 5 year, 10 year, 25 year, 50 year, and a 100 year return period. These curves appear as a series of parallel straight lines with decreasing slope.
Return to Exhibit 4.5.
Exhibit 4.6: Operating Statistics for Northern Ontario Winter Roads, 2013 to 2014 Season
This table shows the 2013 to 2014 operating statistics for winter roads in the western corridor of the Far North, serving Pikangikum, Poplar Hill, North Spirit
IBI GROUP WORKING PAPER #2: CLIMATE CHANGE CONTEXT Prepared for Ministry of Transportation, Ontario
January 15, 2016 77
Lake, Deer Lake and Sandy Lake, respectively. The categories of analysis are: construction start date, the date on which the road opened to light traffic, the date on which the road opened to half and/or three quarter loads, the date that the road opened to full loads, the date of closure, the length of the road, and the volume of goods transported.
Return to Exhibit 4.6.
Exhibit 4.7: Broad Modal Cost Comparisons for Regular Food Delivery to Remote Communities
This line graph compares the cost per tonne for cargo airplanes, transport airships, ice road trucks, and highway trucks. Transportation Costs are shown as dollars per Megatonne on the vertical axis, and distance between origin and destination on the y-axis. The transport modes in order of cost from highest to lowest are cargo planes, airships, ice road trucks, and highway trucks. The increase in transportation costs by distance is highest for cargo airplanes.
Return to Exhibit 4.7.
Exhibit 4.8: Northern Ontario Road Weather Information System (RWIS)
This map shows the locations of Northern Ontario Road Weather Information System (RWIS) stations, locations of stations with fixed automated spray technology, seasonal load advisory locations, and tipping rain gauge locations. All technology types are well represented on Highways 11 and 17, and other provincial highways have some of these technologies.
Return to Exhibit 4.8.
Exhibit 4.9: Wireless Traffic Counter for Winter Roads
This graphic shows a wireless traffic counter in the top left, and a drawing of a car driving down a tree-lined road with no wires across the road, highlighting the fact that wireless traffic counters do not have any external tubes or wires.
Return to Exhibit 4.9.
IBI GROUP WORKING PAPER #2: CLIMATE CHANGE CONTEXT Prepared for Ministry of Transportation, Ontario
January 15, 2016 78
January 15, 2016
Appendix A: Graphs of Historical Temperature Trends at Northern Ontario Locations: Numbers of Days/Year with Average Daily Temperature below 0 Celsius

January 15, 2016
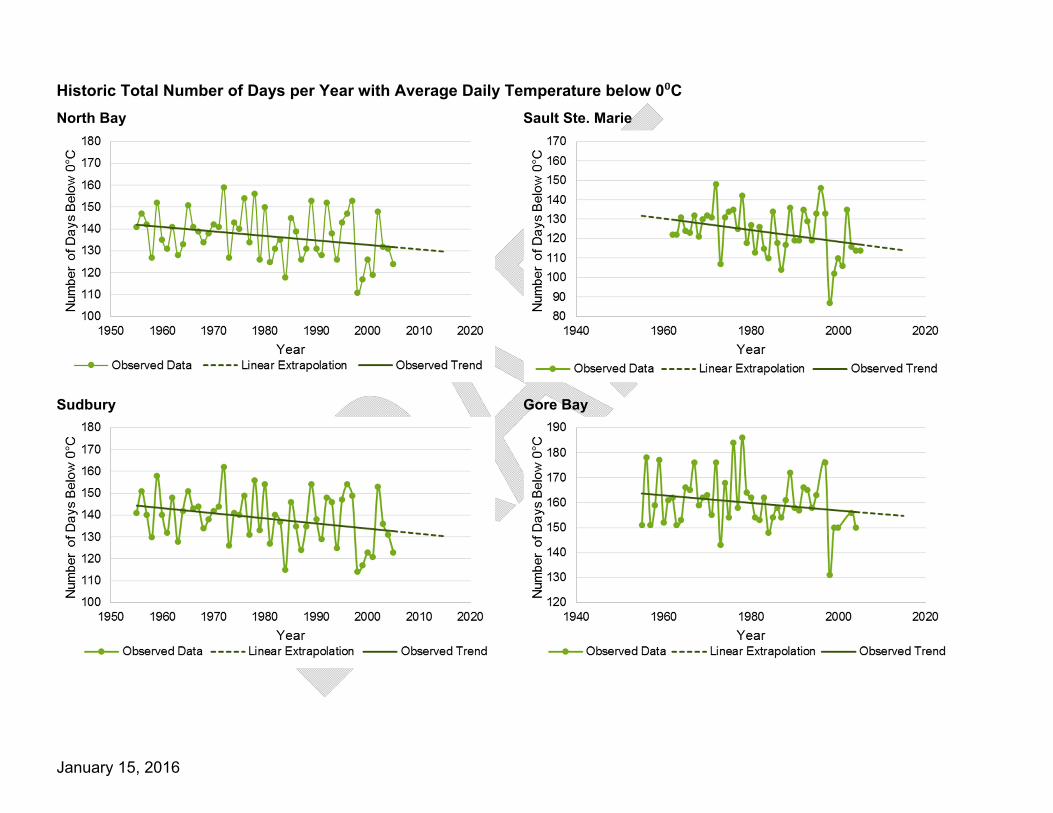
January 15, 2016
Historic Total Number of Days per Year with Average Daily Temperature below 0⁰C
North Bay
Sault Ste. Marie
Sudbury
Gore Bay
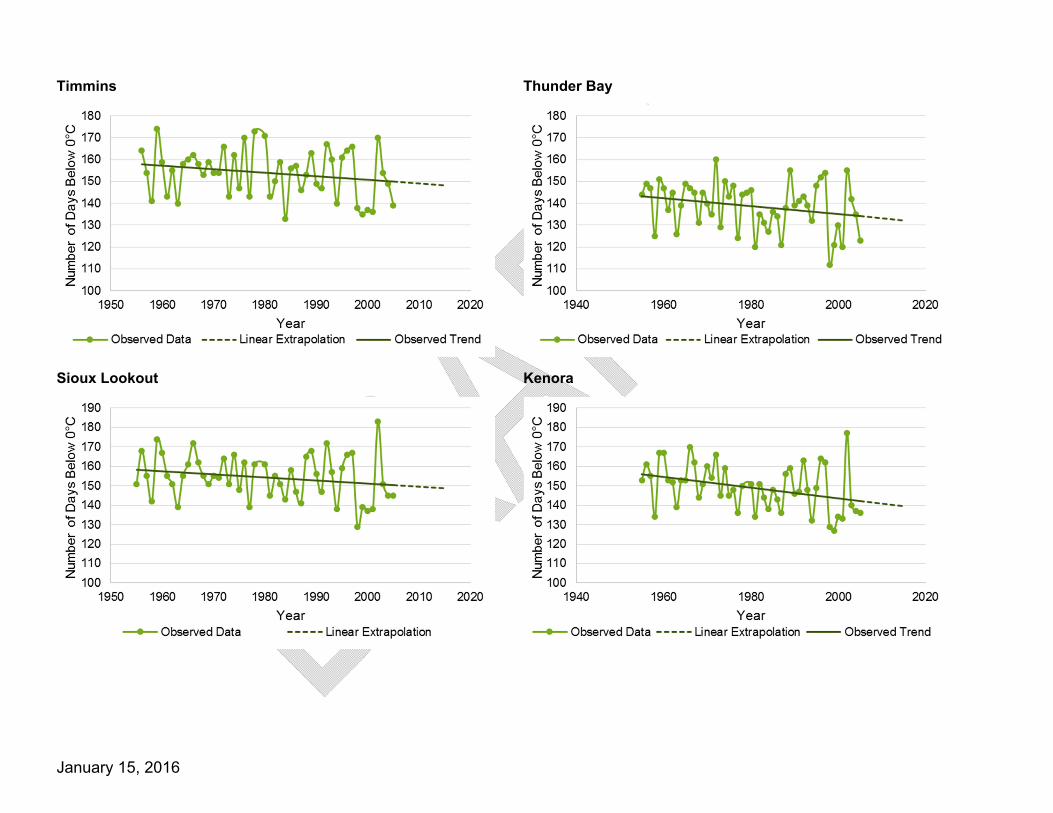
January 15, 2016
Timmins
Thunder Bay
Sioux Lookout
Kenora
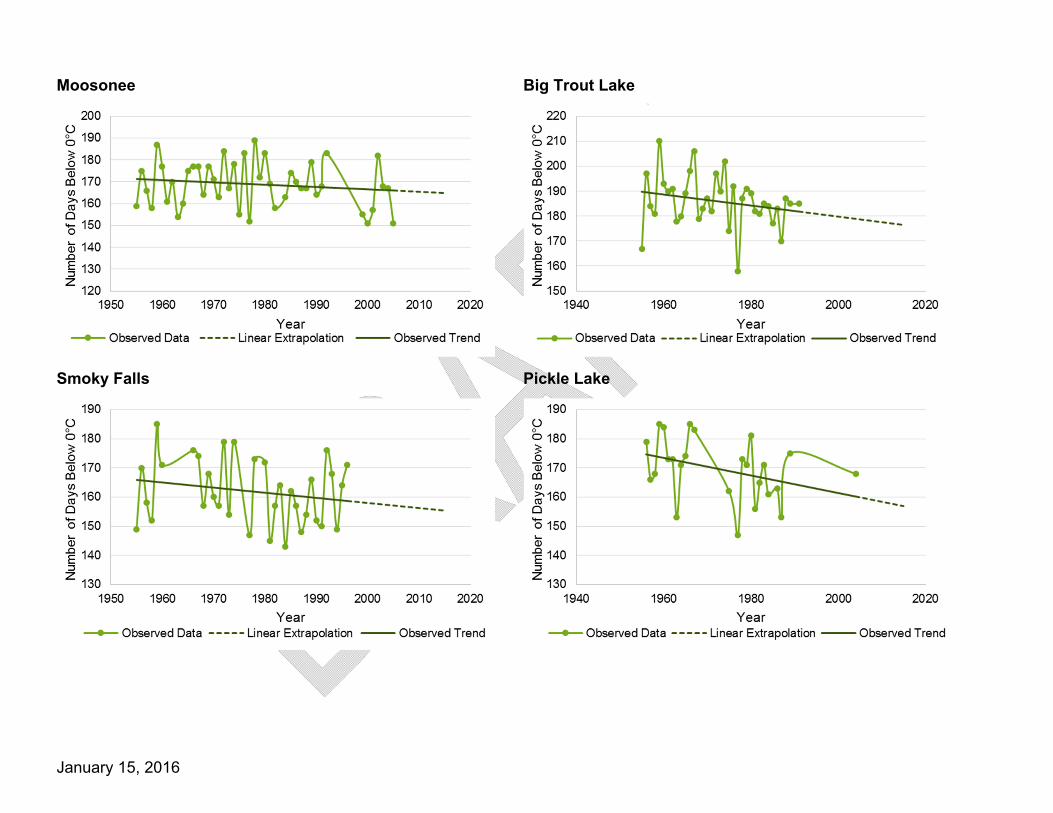
January 15, 2016
Moosonee
Big Trout Lake
Smoky Falls
Pickle Lake
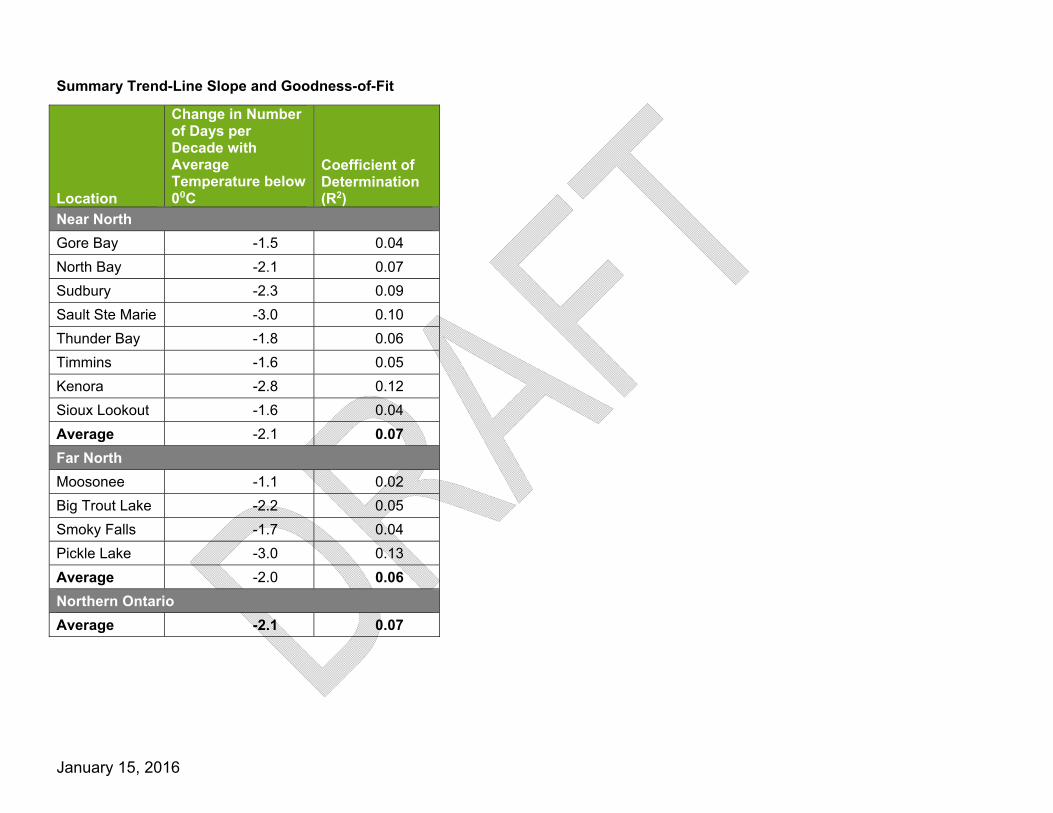
January 15, 2016
Summary Trend-Line Slope and Goodness-of-Fit
Location
Change in Number of Days per Decade with Average Temperature below 0⁰C
Coefficient of Determination (R2)
Near North
Gore Bay -1.5 0.04
North Bay -2.1 0.07
Sudbury -2.3 0.09
Sault Ste Marie -3.0 0.10
Thunder Bay -1.8 0.06
Timmins -1.6 0.05
Kenora -2.8 0.12
Sioux Lookout -1.6 0.04
Average -2.1 0.07
Far North
Moosonee -1.1 0.02
Big Trout Lake -2.2 0.05
Smoky Falls -1.7 0.04
Pickle Lake -3.0 0.13
Average -2.0 0.06
Northern Ontario
Average -2.1 0.07

January 15, 2016