Embed Size (px)
Citation preview

Climate Change - Brazilian context
Towards an equitable low carbon development:a science policy dialog for COP21
June 15th-16th 2015Paris, France

Slide 2
Observed change in surface temperature 1901-2012
Source: IPCC, 2013: Summary for Policymakers.
Brazil is among the regions with the largest observed temperature increases

Slide 3
Observed CO2 emissions
GHG emissions continueto rise because of humanactivities, especially fromintense and growingfossil fuel combustion,followed by deforestation,whose contributiondecreases and can bevirtually absorbed byterrestrial sink.
Source: IPCC, 2013: Technical Summary.

Slide 4
Brazilian GHG emissions
Total emissions in 2010 were 60% below emissions projected for 2020
Source: MCTI, 2014: Estimativas anuais de emissões de gases de efeito estufa - 2ª ediçãoTg = millions of tons
Brazilian pledge: to reduce between 36.1% and 38.9% of its projected GHG emissions by 2020,through National Appropriate Mitigation Actions (NAMAs)

Slide 5
Brazilian GHG Emissions
Forestry and land use sector showed a great decrease, but emissions from other sectorshave increased, either if they are far below what was projected for 2020.
Source: MCTI, 2014: Estimativas anuais de emissões de gases de efeito estufa - 2ª edição; World Data Bank;
10.98 tCO2eq / per capita
2.31 CO2eq / GDP(constant 2005 US$)
6.06 tCO2eq / per capita
1.06 CO2eq / GDP(constant 2005 US$)
Main drivers: population; GDP per capta; energy per capta

Slide 6
Brazilian mitigation & adaptation plans
challenges to be faced by the ministries and institutions
involved with the planscross-sectional analysis
complementarities and synergies
.
.
.
.
Energy
Agriculture
Steel industry
IndustryTransport
Mining
Health
Amazon forest
Savannah

Slide 7
Renewables Share
Source: BEN, 2014: Relatório Síntese, ano base 2013; MME, 2014: Energia no Mundo

Slide 8
Brazilian energy supply in 2013
Source: BEN, 2014: Relatório Síntese, ano base 2013
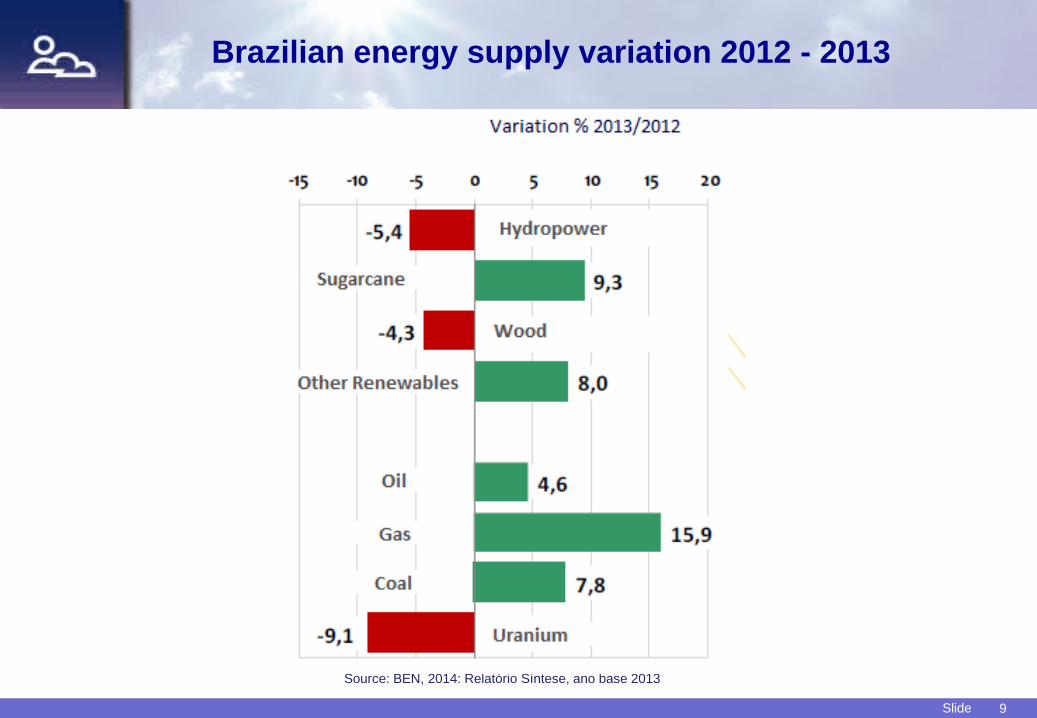
Slide 9
Brazilian energy supply variation 2012 - 2013
Source: BEN, 2014: Relatório Síntese, ano base 2013

Slide 10
Brazilian energy sector emissions
Source: BEN, 2014: Relatório Síntese, ano base 2013
In 2013 total anthropogenic emissions related to the Brazilian energy sector summed up to 459 MtCO2eq

Slide 11
Brazilian power supply
Source: BEN, 2014: Relatório Síntese, ano base 2013
1. Includes coke gas2. Includes importation3. Includes wood, sugarcane and others

Slide 12
Brazilian pathways to deep decarbonization
Main pillars:
• Fuel switching*• Efficiency gains• Zero net deforestation, reforestation and forest restoration
* Production of bioethanol from sugarcane is acknowledge as an advanced first generation biofuel and productionlevels can be considerably extended without compromising food security, moreover aggregating second generationtechnologies and utilising high-biomass cane (energycane)
Additional measures and deeper pathways might be designed considering:
• Combination of high-efficiency biomass production and use including biopower,biodiesel and aviation biofuel (biokerosene), associated with carbon capture andsequestration (BECCS)
• Substantial expansion of public transport and modal shifts towards railways andwaterways in the mobility and transportation sector
• Strengthening of renewable power generation, smart grids and electricitystorage, and development of electric plug-in vehicles
Source: DDPP 2014 report: Pathways to Deep Decarbonization

Slide 13
Brazilian pathways to deep decarbonization
Electricity generation deep decarbonization pathway
• Expansion of hydropowerwith environmentallyacceptable projects
• Growth of bioelectricitygeneration
• Increasing amount ofwind and solar
• Development of smartgrids and electricitystorage
Source: DDPP 2014 report: Pathways to Deep Decarbonization
Slide 14
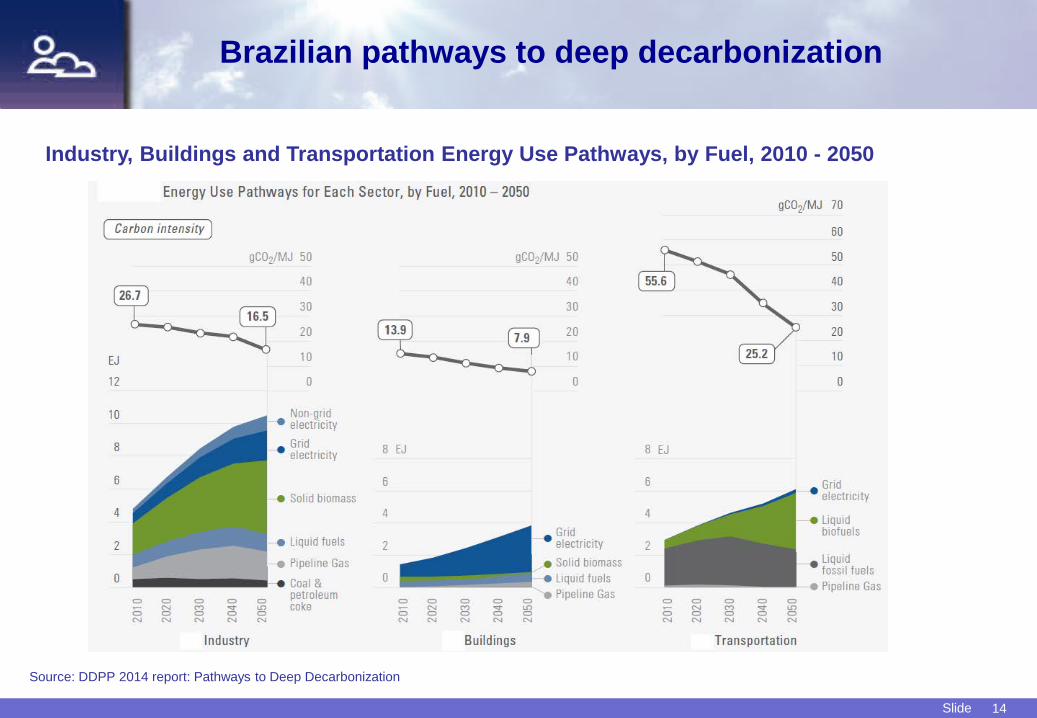
Brazilian pathways to deep decarbonization
Industry, Buildings and Transportation Energy Use Pathways, by Fuel, 2010 - 2050
Source: DDPP 2014 report: Pathways to Deep Decarbonization

Slide 15
Liquid biofuels in the world

Slide 16
Liquid biofuels in the world
milli
ons
of m
³
Sour
ce: A
NP,
IEA/
DO
E, M
APA,
UFO
P, IN
DEC
milli
ons
of m
³

Slide 17
Bioethanol productivity and energy balance
Source: IEA, 2005
Bioethanol yields (liters per hectare)

Slide 18
Biofuels GHG emission reduction
Source: IEA, 2006
Source: Doornbosch and Steenblik, OECD 2007

Slide 19
Cost perspective of biofuel technology

Slide 20
Sources: CGEE - NIPE-Unicamp, IBGE and CTC
Sugarcane land use in Brazil
Cultivated land area
70 Mha (8%)
Source: IBGE, 2008
Country total area
851 Mha (100%)
Rural properties
area 355 Mha (42%)
Sugarcane cropland for fuel
3,5 Mha (0.5%)
Amazon forest 400 Mha
Pantanal 13 Mha
Atlantic rain forest 3 Mha
Farming (2007) Area(Mha)
Soya 23Corn 12Sugar cane 7Agriculture 70Cattle 180

Slide 21
Sugarcane bioindustry
Source: BNDES

Slide 22
882
212
168
114
0
168
before PAISS
after PAISS
Production projection for the year 2015 (millions liters)Brazil EU USA
Adapted from.: AEO/EIA 2014, BNDES 2013
Cellulosic ethanol
PAISS Public-Private Partnership on Low-Carbon Technologies Second-Generation Sugarcane Bioenergy & Biochemicals
adequate financial instruments to mobilize private investments through positive economic incentives

Slide 23
6,900
7,200
10,000
17,000
0 6,000 12,000 18,000
Current 1G
Improved 1G
2G with sugarcane
2G with energy-cane
Technological scenarios of first and second generation – litters/hectare
Source: CGEE, BNDES
Bioethanol yields

Slide 24
Building Brazilian INDCs
• Consultation to the Brazilian society, conduced by the Ministry of InternationalRelations
• Civil society and economic sectors feedback and views during the preparation ofINDCs, in order to extend transparency
• Referring to National Climate Change Plan and the more recent Adaptation Plan
• Contributions from technical domestic initiatives, such as:• Economic and Social Implications of GHG Mitigation Scenarios 2030/2050 -
IES-Brazil – Brazilian Climate Change Forum (FBMC)• Mitigation GHG Emissions Options in Brazil Key Sectors – Ministry of
Science Technology and Innovation (MCTI)

Slide 25
• Have sustainable development as a pillar
• Be consistent with the principles and provisions of the UNFCCC, including differentiationbetween developed and developing countries
• Take into account the 5th IPCC Assessment Report, including its mitigation scenarios
• Consider updated data of national emissions and removals of greenhouse gases (GHG)and already made efforts in the last years
• Ponder industry analysis to consider the cost-effectiveness of combating climate changeactions
• Allow for the capacity to implement these actions in the context of a new agreement orprotocol
• Consider that the risks associated to severe climate change impacts outweigh risksassociated to implement mitigation actions and that relative costs to additional mitigationtend to get higher in the long term
General assumptions

Slide 26
• International support to reach Country’s full implementation potential
• Partly implemented with own resources, without refrain internationalencouragement or the use of mechanisms under the Convention for economicvaluation of mitigation actions implemented by the Country
• Identify and promote good practices and foment international cooperation withother developing countries within priority areas, based in the implementation ofthe National Climate Change Plan and the Adaptation Plan
Means of implementation

Slide 27
Enhanced climate action
Views on accelerating the implementation
• The recognition of the social and economic value of mitigation activities could createpositive incentives for accelerating the implementation of enhanced climate action
• Instruments to recognize the results of early and additional action undertaken by Partiesand to translate them into units of convertible financial value should be developed
• Early action could include pre-2020 activities that present quantified emissions reduction that have been undertaken voluntarily by Parties, with verified results
• Additional action could include post-2020 activities that exceed the achievement of Nationally Determined Contributions (NDC) that Parties will commit to under the 2015 agreement
• Multilateral recognition of the social and economic value of early and additional carbonmitigation activities would greatly contribute to closing the ambition gap before 2020 and tosupporting further ambition by Parties in the post-2020 period
• The agreement may achieve this objective through a continuous process of presentationand update of NDC over time, with a view to enhance ambition in a sustained andbalanced manner, in all pillars of the Convention

Slide 28
Positive Agenda
Environment preservation
Economic growth
Job creation
Welfare
Low carbon transition