Embed Size (px)
Citation preview
at SciVerse ScienceDirect
Estuarine, Coastal and Shelf Science xxx (2013) 1e12
Contents lists available
Estuarine, Coastal and Shelf Science
journal homepage: www.elsevier .com/locate/ecss
Climate change awareness and strategies for communicating the riskof coastal flooding: A Canadian Maritime case example
David J. Lieske a,*, Tracey Wade b, Lori Ann Roness a
aDepartment of Geography and Environment, Mount Allison University, Sackville, New Brunswick, Canada E4L 1A7b Tantramar Planning District Commission, 131 H Main Street, Sackville, New Brunswick, Canada E4L 4B2
a r t i c l e i n f o
Article history:Received 10 October 2012Accepted 24 April 2013Available online xxx
Keywords:climate changecoastal floodingrisk perceptionrisk communicationvisualization
* Corresponding author.E-mail address: [email protected] (D.J. Lieske).
0272-7714/$ e see front matter � 2013 Elsevier Ltd.http://dx.doi.org/10.1016/j.ecss.2013.04.017
Please cite this article in press as: Lieske, D.JCanadian Maritime case example, Estuarine
a b s t r a c t
Rising sea levels, due to thermal expansion of the ocean, and higher frequency and intensity of coastaland inland storms threaten coastal communities worldwide. The implementation of pro-active, plannedadaptation to reduce community vulnerability is strongly dependent upon people’s perception of thethreat posed to their communities at the local scale. Unfortunately, the scarcity of research into effectiverisk communication limits our understanding of how climate change evidence can most effectively raiserisk awareness and inspire community adaptation.
With a focus on a case study situated in the Tantramar area of South-East New Brunswick, Canada e anarea subject to very large tidal forces from the Bay of Fundy e this study set out to assess publicawareness about the link between climate change and elevated risk of regional dyke failure, measurehow different multi-media visualizations influence public risk perception, and provide general recom-mendations for the development of flood risk communication strategies in coastal zones.
The results from 14 focus groups (n ¼ 157 participants) revealed that 81% of respondents felt that theproblem of climate change was considerable or severe. However, when asked for their assessment ofpersonal vulnerability to dyke failure and subsequent coastal flooding, only 35.6% considered themselvesto be at considerable or severe personal risk. Gender, education, and age were found to significantlyinfluence initial risk perception to varying degrees, and were also associated with changes in riskperception following the communication session. While geovisually-enhanced communication strate-gies, involving 3D flood animations and web-based GIS maps, were no more effective at raising riskawareness than a non-enhanced communication package, qualitative responses suggested that thegeovisualizations had greater emotional impact (“shock”), and contributed disproportionately to anexpressed desire to become politically and socially active around the issue. In conclusion, in addition topresenting evidence in a clear and compelling way, effective coastal flood risk communication requires asupportive framework capable of building trust and encouraging public dialogue. Recommendationstowards creating this framework are provided.
� 2013 Elsevier Ltd. All rights reserved.
1. Introduction
Climate change is a problem of global scope, with significantconsequences for coastal communities. Risks include increased sealevels due to thermal expansion of the ocean, a higher frequencyand intensity of coastal and inland storms, and accelerated erosion(Dronkers et al., 1990; Wu et al., 2002). Unfortunately, these zonesare also heavily populated (Dronkers et al., 1990). In the face ofthese threats, pro-active, planned adaptation to reduce communityvulnerability is highly desirable. But the implementation of
All rights reserved.
., et al., Climate change aware, Coastal and Shelf Science (2
particular adaptation strategies is complicated by the ‘wicked’ na-ture of the climate change problem (Bord et al., 1998): there is ageneral lack of public awareness, or worse, complete misunder-standing, which undermines the public’s willingness to participateor support adaptation efforts (Seacrest et al., 2000; Lorenzoni et al.,2007; Jude, 2008); differential perception of the appropriate bal-ance between long- and short-term considerations can lead todivergent opinions about the efficacy of candidate options(Lorenzoni and Pidgeon, 2006); and the fact that people generallyresist making uncomfortable behavioural changes (Bord et al.,1998; McKenzie-Mohr, 2000; Seacrest et al., 2000).
A recent Gallup Poll reported that 55% of Americans worry agreat deal or fair amount about global warming (Newport, 2012),but historically, this has varied between 50% and 72% (Lorenzoni
ness and strategies for communicating the risk of coastal flooding: A013), http://dx.doi.org/10.1016/j.ecss.2013.04.017
D.J. Lieske et al. / Estuarine, Coastal and Shelf Science xxx (2013) 1e122
and Pidgeon, 2006). As summarized by Lorenzoni and Pidgeon(2006), a 1992 Gallup Health of the Planet (HOP) survey revealedthat 13 of 24 countries (of which eight were European) had>50% ofrespondents indicate climate change to be a serious problem. In amore recent, 2004 European survey poll, the greatest proportionsof concerned respondents resided in Sweden (68%), Luxembourg(58%), Germany (57%), the Netherlands (53%) and Finland (53%).Twenty-six percent of all EU-25 respondents felt they lacked in-formation specifically about climate change (Lorenzoni andPidgeon, 2006). While perceptions vary, there is a general andwidespread belief in the seriousness of global climate change (Bordet al., 1998; Lorenzoni and Pidgeon, 2006).
How does this general acceptance of the immediacy of theclimate change problem translate to the local scale? Do peopleunderstand the threats facing their own community? Bickerstaffet al. (2004, cited in Lorenzoni and Pidgeon, 2006; Burninghamet al., 2008) provide evidence that in the U.K., individuals in areasdirectly vulnerable to climate change are often unaware of theconnection to their local areas, or fail to see a potential impact ontheir day-to-day lives. A key challenge facing regional coastalmanagers, therefore, is how to develop public communication toolscapable of effectively illustrating possible future scenarios atmeaningful scales while simultaneously involving the public in thedifficult discussions surrounding adaptation (Jude, 2008).
Risk communication is complicated by idiosyncrasies in the waypeople perceive environmental threats, and research has shownthat this is partially shaped by human psychology. For example,people tend to draw inferences from information without regardfor the weight of the evidence (‘insensitivity to sample size’,Tsversky and Kahneman, 1974), display overconfidence in theirability to derive accurate inferences (Slovic, 1987), and exhibitarbitrariness in their risk tolerances (Burgman, 2005). Research hasalso shown that peoples’ perceptions of climate change are alsoheavily influenced by such factors as social background, culturalorientation, and behavioural disposition, which complicates theplanning of risk communication materials (Slovic, 1987; Nicholson-Cole, 2005). The paucity of research on effective risk communica-tion led Sterman (2011) to declare this a major bottleneck limitingthe effective application of science to climate policy. At worst, poorrisk communication efforts leave a “knowledge vacuum” that willbe filled by “error, disinformation and falsehood” (Sterman, 2011:402). Left to their own devices, risk communication recipients willcreate their own “mental models” to interpret the information theyare exposed to (Moser and Dilling, 2004).
Even if clearly articulated adaptation plans are in place, gainingpublic support (i.e., instilling the intention to adapt, Grothmann andPatt, 2005) is very unlikely to occur without successfully commu-nicating the risk of inaction. Sterman (2011) further argues that riskcommunication strategies will only be successful when they areinformed by a thorough understanding of the publics’ beliefs.Further to this notion, Pelletier and Sharp (2008) suggest that theform and nature of the communication has also to accommodate the“psychological state” of the intended recipient. The general public isunlikely to accept adaptation strategies (i.e., be in a “decisionphase”) without first passing through a “detection phase”.
Inpractice, risk communicators often rely tooheavily on technicalexperts’ opinions about what should be communicated rather thandirectly assessing the perception states of their intended audiences.Also,most communicationproducts are produced for and by domainexperts, leaving their effectiveness in the public communicationarena unevaluated (Lieske, 2012). People respond differently to thepresentationof different information, colouredbyeducation, gender,etc. Willingness to act is also eroded by overreliance on publicinfrastructure, e.g., dykes. This can lead to a dangerous, false sense ofsecurity in their integrity and reliability (see Tobin, 1995).
Please cite this article in press as: Lieske, D.J., et al., Climate change awareCanadian Maritime case example, Estuarine, Coastal and Shelf Science (2
The present study originated out of a number of pragmaticconcerns. First, while global models for temperature increases andsea level rise are widely available, community planners typicallyhave no specific information on potential impacts at the local level.Second, a significant role played by local planning authorities is toadvise and make recommendations to existing and prospectiveland owners in flood risk zones. Sporadic and episodic events canbe difficult to imagine until they actually occur, so visualizationsoffer a way to “talk about” the associated risks and vulnerabilities.
The chief question posed by this study is whether it is possible tocommunicate coastal flood risk in a way that appeals to the widestrange of people’s personalities but is, at the same time, construc-tive, and less likely to push people into maladaptive positions (e.g.,fatalism, anti-social behaviour). Visualizations, ranging from con-ventional 2Dmaps to 3D animations, may have an important role toplay in raising people’s awareness and encouraging them to forman adaptation intention. As a theoretical tool to support spatialreasoning, and as a means to stimulate spatial imagination, visu-alization has a long and established history in geographic research(Tukey, 1977; MacEachern et al., 1992; Andrienko et al., 2003; Keimet al., 2005). It is expected that visualization has an important roleto play in climate change communication through its capacity tomake sporadic (e.g., flooding) or gradual (e.g., erosion) risks‘visible’. With a focus on the Tantramar area of South East NewBrunswick, this article builds on the research described in Lieske(2012) to advance the following goals:
1. Assess public awareness about local climate-change impacts, inparticular, elevated risk of coastal flooding in the Tantramar;
2. Measure how different multi-media visualizations influencepublic risk perception and assess their potential for enhancingrisk communication;
3. Provide general recommendations for the development offlood risk communication strategies in coastal zones.
2. Methods
2.1. Tantramar study area
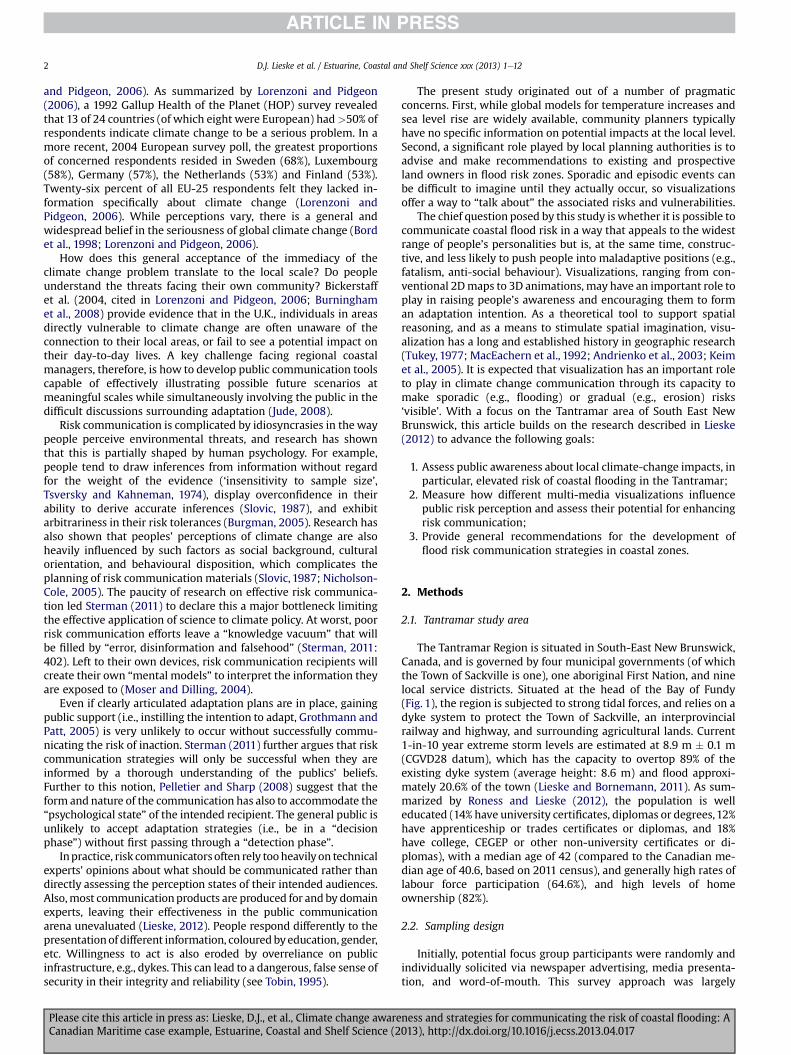
The Tantramar Region is situated in South-East New Brunswick,Canada, and is governed by four municipal governments (of whichthe Town of Sackville is one), one aboriginal First Nation, and ninelocal service districts. Situated at the head of the Bay of Fundy(Fig. 1), the region is subjected to strong tidal forces, and relies on adyke system to protect the Town of Sackville, an interprovincialrailway and highway, and surrounding agricultural lands. Current1-in-10 year extreme storm levels are estimated at 8.9 m � 0.1 m(CGVD28 datum), which has the capacity to overtop 89% of theexisting dyke system (average height: 8.6 m) and flood approxi-mately 20.6% of the town (Lieske and Bornemann, 2011). As sum-marized by Roness and Lieske (2012), the population is welleducated (14% have university certificates, diplomas or degrees,12%have apprenticeship or trades certificates or diplomas, and 18%have college, CEGEP or other non-university certificates or di-plomas), with a median age of 42 (compared to the Canadian me-dian age of 40.6, based on 2011 census), and generally high rates oflabour force participation (64.6%), and high levels of homeownership (82%).
2.2. Sampling design
Initially, potential focus group participants were randomly andindividually solicited via newspaper advertising, media presenta-tion, and word-of-mouth. This survey approach was largely
ness and strategies for communicating the risk of coastal flooding: A013), http://dx.doi.org/10.1016/j.ecss.2013.04.017
Fig. 1. Map of the Tantramar region within the Province of New Brunswick, Canada. Also indicated is the Sackville Municipal boundary, and the flood risk zone at an 8.9 m (CGVD28datum) extreme sea level. The basemap is OpenStreetMap (http://wiki.openstreetmap.org).
D.J. Lieske et al. / Estuarine, Coastal and Shelf Science xxx (2013) 1e12 3
unsuccessful, attracting less than a dozen people. To improverecruitment, schools, professional bodies and non-governmental,community-based organizations were contacted and pre-sentations delivered during their normal meeting times fromOctober, 2011 to March, 2012.
Sessions commenced with participants completing a pre-focusgroup questionnaire (Section 2.3). Focus group attendees werefree to decline to participate, and no personal identifiers (e.g.,name, home address) were recorded to ensure anonymity. Focusgroup content consisted of one of three randomly assignedcommunication treatments (Section 2.4), which took from 45 minto an hour to complete. All treatments were initiated using thebaseline communication material, which involved the presentationof a series of Powerpoint (Microsoft Corporation, 2002) slidesaccompanied by a verbal commentary by the authors. Treatments
Please cite this article in press as: Lieske, D.J., et al., Climate change awareCanadian Maritime case example, Estuarine, Coastal and Shelf Science (2
two and three were augmented by the presentation of specialgeovisualizations (Section 2.4). The sessions ended with partici-pants completing a post-focus group questionnaire, which repli-cated the same questions as appeared in the pre-focus groupversion, supplemented by a number of open-ended, qualitativequestions. At no point prior to completion of the post-focus groupquestionnairewere participants given an opportunity to discuss thetreatment materials with each other.
2.3. Assessment of risk perception
As with Lorenzoni et al. (2007), this study employed a mixed-methods approach combining both quantitative and qualitativeapproaches within pre- and post-focus group surveys. As pointedby Lorenzoni et al. (2007: 498) this “allows a certain degree
ness and strategies for communicating the risk of coastal flooding: A013), http://dx.doi.org/10.1016/j.ecss.2013.04.017
D.J. Lieske et al. / Estuarine, Coastal and Shelf Science xxx (2013) 1e124
of triangulation of the findings and underlines theircomplementariness”.
Perceptions were assessed in the pre-focus group survey usingfour key questions:
1) “Do you feel that global climate change is a problem?”2) “Do you think there is a link between a possible failure of the
Tantramar dykes and climate change”?3) “How likely to you think the risk is of a dyke failure in the
Tantramar?”4) “How vulnerable are you to the risk of a Tantramar dyke
failure?”
A number of socio-demographic variables have been previouslyidentified to influence risk perception, including: age, gender,annual family income, highest level of educational attainment, andhome ownership status (NRC, 2006; Burningham et al., 2008). All ofthese variables were gathered as part of the pre-focus groupassessment.
The same four key questions were also administered in the post-focus group survey, with a participant-provided code word used tolink the responses to particular individuals while preservinganonymity.
2.4. Communication strategies (treatment types)
Study participants were exposed to one of three differenttreatments: base communication strategy, base communicationstrategy þ animations, or base communication strategies þanimations þ dynamic web map. The latter two treatments arereferred to as “geovisually-augmented”. Participants were admin-istered a survey prior to the communication treatment, and after-wards, and given no opportunity to discuss the materials until thesurvey portion of the session was complete.
2.4.1. Base communication strategyAll three treatments shared the same base communication
strategy, which involved a verbal presentation and a series of staticimages. The following hierarchy of topics were considered: (1) thegeneral phenomenon of global climate change, with a focus onempirical evidence such as a time-series plot of sea levels recordedby the Saint John tide gauge e it was anticipated that this wouldhelp to counteract possible cognitive biases, e.g., denial of climatechange as theoretical or unknowable; (2) presentation of locally-relevant sea level estimates under current 1-in-10 year expectedreturn frequencies, based on a report by Daigle (2011); (3) anoverview of the role played by engineered dykes in the Tantramararea, their vulnerability to erosion, and their susceptibility to beingovertopped by new sea levels under intensified storm surge events,anticipating a possible overreliance on these structures on the part
Table 1Summary of datasets used in the study.
Dataset Source Date
LiDAR Leading Edge Geomatics, Govt. of NewBrunswick (GNB), ACASA
November 9, 200December 18, 201
Property mapping Service New Brunswick (SNB), TantramarPlanning District Commission (TPDC)
April 2011
High resolutionorthometric imagery
Leading Edge Geomatics, GNB, ACASA November 13, 20
Topographic SNB 1996
Environmental andcultural areas
Parks Canada 2011
Please cite this article in press as: Lieske, D.J., et al., Climate change awareCanadian Maritime case example, Estuarine, Coastal and Shelf Science (2
of the public (see Tobin, 1995); and (4) an overview of the potentialflood zone under 8.9 m and 9.7 m “bath tub” models.
Attention focused on communicating the risk of dyke compro-mise by illustrating the probability of occurrence and themaximumextent of floods under 8.9 m and 9.7 m sea levels. Economic andsocial impacts of flooding were not discussed, nor were short-termemergency responses and long-term community-wide adaptationstrategies mentioned.
Data was obtained from a number of sources (Table 1) and led toa number of derived products, for example, sea level-specific floodextents and vulnerable infrastructure. The base communicationstrategy presented static flood maps as part of the Powerpointpresentation, and also made a paper map available for closer ex-amination by interested participants.
2.4.2. Geovisually-augmented communication strategiesCommunication strategies two and three, in addition to
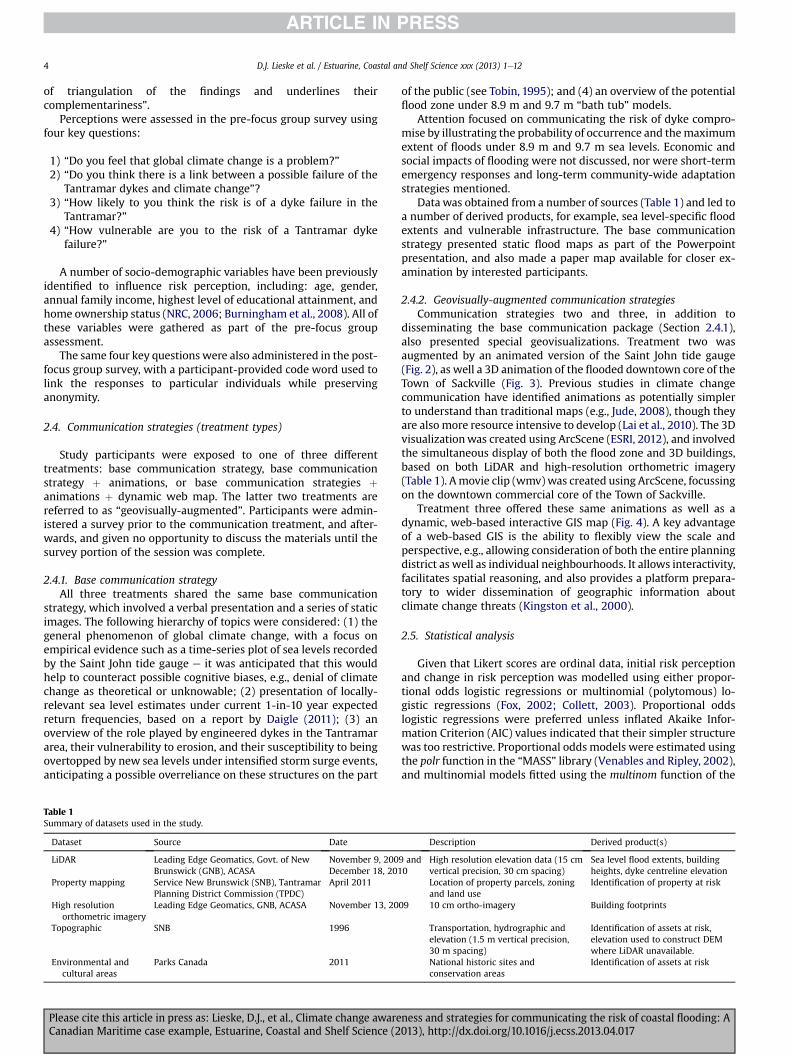
disseminating the base communication package (Section 2.4.1),also presented special geovisualizations. Treatment two wasaugmented by an animated version of the Saint John tide gauge(Fig. 2), as well a 3D animation of the flooded downtown core of theTown of Sackville (Fig. 3). Previous studies in climate changecommunication have identified animations as potentially simplerto understand than traditional maps (e.g., Jude, 2008), though theyare also more resource intensive to develop (Lai et al., 2010). The 3Dvisualizationwas created using ArcScene (ESRI, 2012), and involvedthe simultaneous display of both the flood zone and 3D buildings,based on both LiDAR and high-resolution orthometric imagery(Table 1). Amovie clip (wmv)was created using ArcScene, focussingon the downtown commercial core of the Town of Sackville.
Treatment three offered these same animations as well as adynamic, web-based interactive GIS map (Fig. 4). A key advantageof a web-based GIS is the ability to flexibly view the scale andperspective, e.g., allowing consideration of both the entire planningdistrict as well as individual neighbourhoods. It allows interactivity,facilitates spatial reasoning, and also provides a platform prepara-tory to wider dissemination of geographic information aboutclimate change threats (Kingston et al., 2000).
2.5. Statistical analysis
Given that Likert scores are ordinal data, initial risk perceptionand change in risk perception was modelled using either propor-tional odds logistic regressions or multinomial (polytomous) lo-gistic regressions (Fox, 2002; Collett, 2003). Proportional oddslogistic regressions were preferred unless inflated Akaike Infor-mation Criterion (AIC) values indicated that their simpler structurewas too restrictive. Proportional odds models were estimated usingthe polr function in the “MASS” library (Venables and Ripley, 2002),and multinomial models fitted using the multinom function of the
Description Derived product(s)
9 and0
High resolution elevation data (15 cmvertical precision, 30 cm spacing)
Sea level flood extents, buildingheights, dyke centreline elevation
Location of property parcels, zoningand land use
Identification of property at risk
09 10 cm ortho-imagery Building footprints
Transportation, hydrographic andelevation (1.5 m vertical precision,30 m spacing)
Identification of assets at risk,elevation used to construct DEMwhere LiDAR unavailable.
National historic sites andconservation areas
Identification of assets at risk
ness and strategies for communicating the risk of coastal flooding: A013), http://dx.doi.org/10.1016/j.ecss.2013.04.017
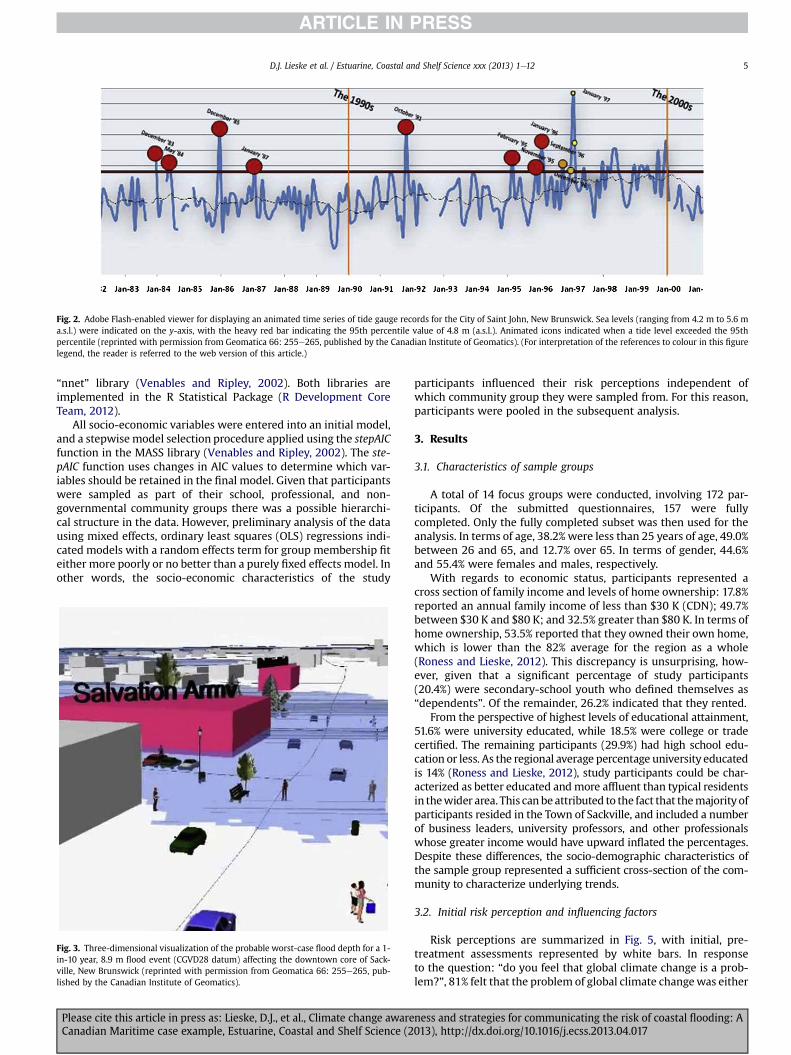
Fig. 2. Adobe Flash-enabled viewer for displaying an animated time series of tide gauge records for the City of Saint John, New Brunswick. Sea levels (ranging from 4.2 m to 5.6 ma.s.l.) were indicated on the y-axis, with the heavy red bar indicating the 95th percentile value of 4.8 m (a.s.l.). Animated icons indicated when a tide level exceeded the 95thpercentile (reprinted with permission from Geomatica 66: 255e265, published by the Canadian Institute of Geomatics). (For interpretation of the references to colour in this figurelegend, the reader is referred to the web version of this article.)
D.J. Lieske et al. / Estuarine, Coastal and Shelf Science xxx (2013) 1e12 5
“nnet” library (Venables and Ripley, 2002). Both libraries areimplemented in the R Statistical Package (R Development CoreTeam, 2012).
All socio-economic variables were entered into an initial model,and a stepwise model selection procedure applied using the stepAICfunction in the MASS library (Venables and Ripley, 2002). The ste-pAIC function uses changes in AIC values to determine which var-iables should be retained in the final model. Given that participantswere sampled as part of their school, professional, and non-governmental community groups there was a possible hierarchi-cal structure in the data. However, preliminary analysis of the datausing mixed effects, ordinary least squares (OLS) regressions indi-cated models with a random effects term for group membership fiteither more poorly or no better than a purely fixed effects model. Inother words, the socio-economic characteristics of the study
Fig. 3. Three-dimensional visualization of the probable worst-case flood depth for a 1-in-10 year, 8.9 m flood event (CGVD28 datum) affecting the downtown core of Sack-ville, New Brunswick (reprinted with permission from Geomatica 66: 255e265, pub-lished by the Canadian Institute of Geomatics).
Please cite this article in press as: Lieske, D.J., et al., Climate change awareCanadian Maritime case example, Estuarine, Coastal and Shelf Science (2
participants influenced their risk perceptions independent ofwhich community group they were sampled from. For this reason,participants were pooled in the subsequent analysis.
3. Results
3.1. Characteristics of sample groups
A total of 14 focus groups were conducted, involving 172 par-ticipants. Of the submitted questionnaires, 157 were fullycompleted. Only the fully completed subset was then used for theanalysis. In terms of age, 38.2% were less than 25 years of age, 49.0%between 26 and 65, and 12.7% over 65. In terms of gender, 44.6%and 55.4% were females and males, respectively.
With regards to economic status, participants represented across section of family income and levels of home ownership: 17.8%reported an annual family income of less than $30 K (CDN); 49.7%between $30 K and $80 K; and 32.5% greater than $80 K. In terms ofhome ownership, 53.5% reported that they owned their own home,which is lower than the 82% average for the region as a whole(Roness and Lieske, 2012). This discrepancy is unsurprising, how-ever, given that a significant percentage of study participants(20.4%) were secondary-school youth who defined themselves as“dependents”. Of the remainder, 26.2% indicated that they rented.
From the perspective of highest levels of educational attainment,51.6% were university educated, while 18.5% were college or tradecertified. The remaining participants (29.9%) had high school edu-cation or less. As the regional average percentage university educatedis 14% (Roness and Lieske, 2012), study participants could be char-acterized as better educated andmore affluent than typical residentsin thewider area. This can beattributed to the fact that themajority ofparticipants resided in the Town of Sackville, and included a numberof business leaders, university professors, and other professionalswhose greater income would have upward inflated the percentages.Despite these differences, the socio-demographic characteristics ofthe sample group represented a sufficient cross-section of the com-munity to characterize underlying trends.
3.2. Initial risk perception and influencing factors
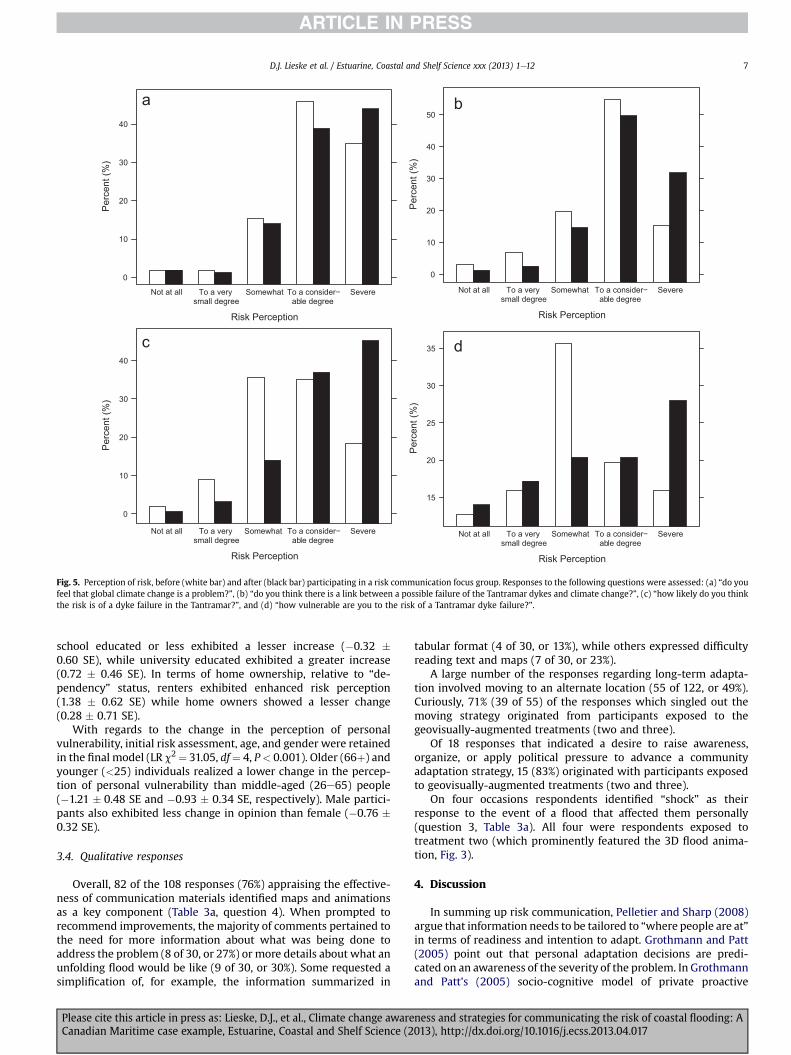
Risk perceptions are summarized in Fig. 5, with initial, pre-treatment assessments represented by white bars. In responseto the question: “do you feel that global climate change is a prob-lem?”, 81% felt that the problem of global climate changewas either
ness and strategies for communicating the risk of coastal flooding: A013), http://dx.doi.org/10.1016/j.ecss.2013.04.017
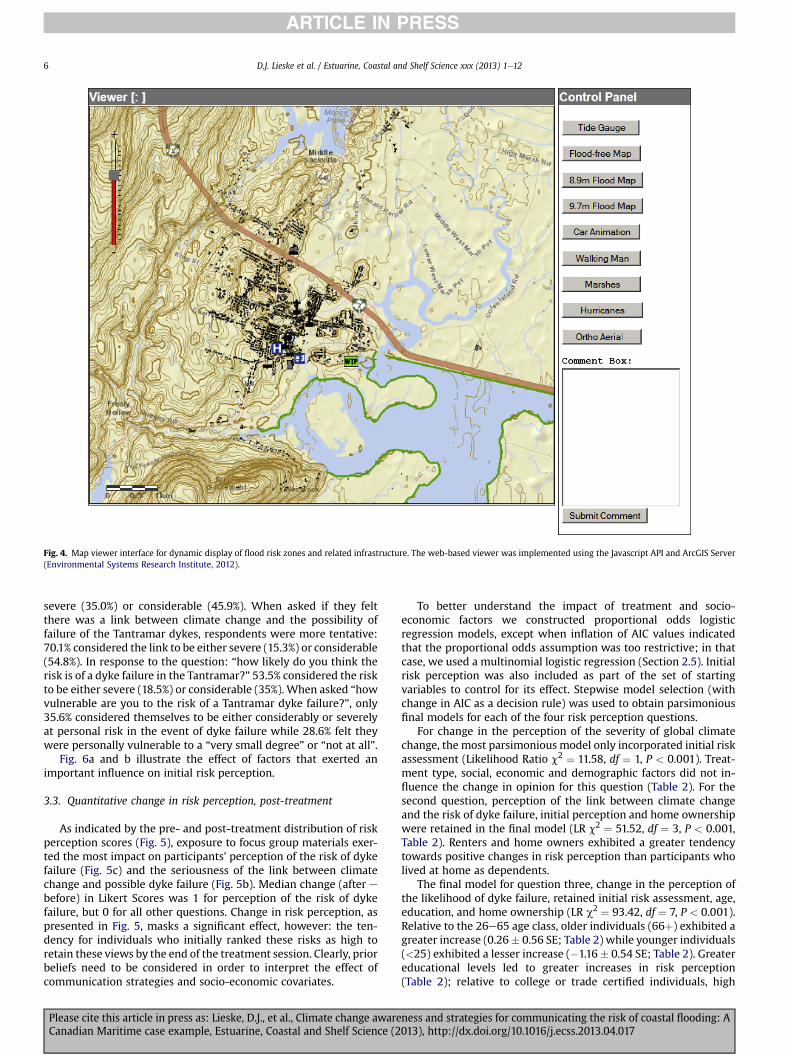
Fig. 4. Map viewer interface for dynamic display of flood risk zones and related infrastructure. The web-based viewer was implemented using the Javascript API and ArcGIS Server(Environmental Systems Research Institute, 2012).
D.J. Lieske et al. / Estuarine, Coastal and Shelf Science xxx (2013) 1e126
severe (35.0%) or considerable (45.9%). When asked if they feltthere was a link between climate change and the possibility offailure of the Tantramar dykes, respondents were more tentative:70.1% considered the link to be either severe (15.3%) or considerable(54.8%). In response to the question: “how likely do you think therisk is of a dyke failure in the Tantramar?” 53.5% considered the riskto be either severe (18.5%) or considerable (35%). When asked “howvulnerable are you to the risk of a Tantramar dyke failure?”, only35.6% considered themselves to be either considerably or severelyat personal risk in the event of dyke failure while 28.6% felt theywere personally vulnerable to a “very small degree” or “not at all”.
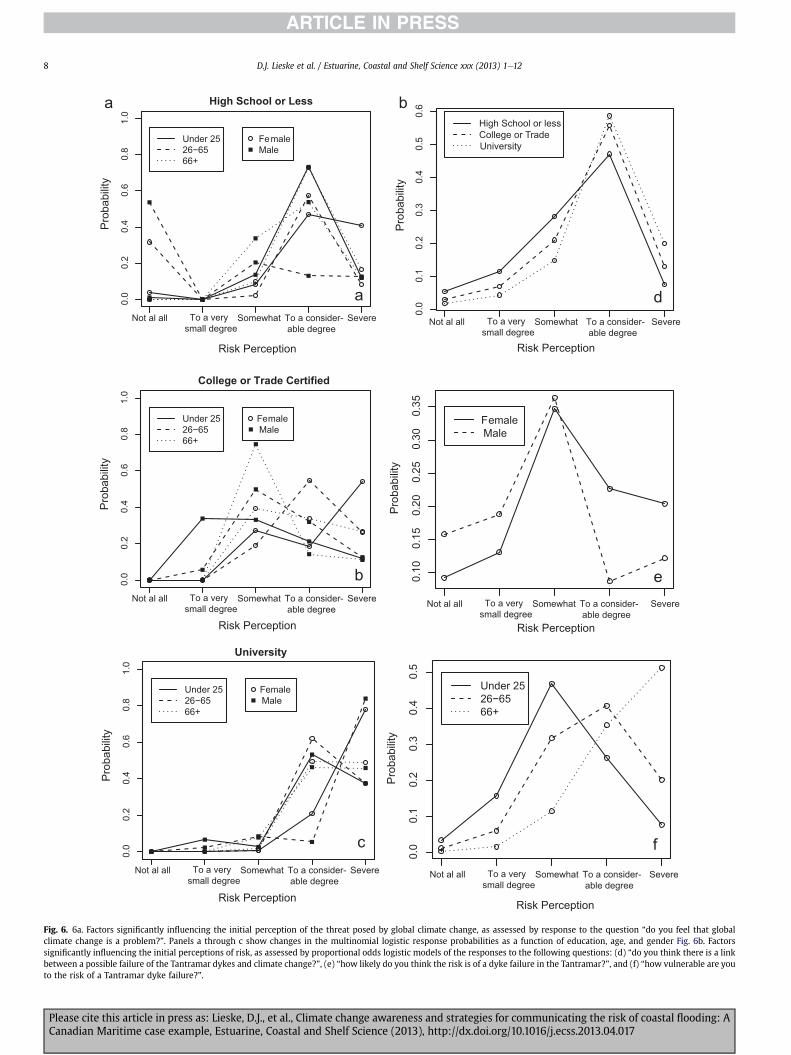
Fig. 6a and b illustrate the effect of factors that exerted animportant influence on initial risk perception.
3.3. Quantitative change in risk perception, post-treatment
As indicated by the pre- and post-treatment distribution of riskperception scores (Fig. 5), exposure to focus group materials exer-ted the most impact on participants’ perception of the risk of dykefailure (Fig. 5c) and the seriousness of the link between climatechange and possible dyke failure (Fig. 5b). Median change (after ebefore) in Likert Scores was 1 for perception of the risk of dykefailure, but 0 for all other questions. Change in risk perception, aspresented in Fig. 5, masks a significant effect, however: the ten-dency for individuals who initially ranked these risks as high toretain these views by the end of the treatment session. Clearly, priorbeliefs need to be considered in order to interpret the effect ofcommunication strategies and socio-economic covariates.
Please cite this article in press as: Lieske, D.J., et al., Climate change awareCanadian Maritime case example, Estuarine, Coastal and Shelf Science (2
To better understand the impact of treatment and socio-economic factors we constructed proportional odds logisticregression models, except when inflation of AIC values indicatedthat the proportional odds assumption was too restrictive; in thatcase, we used a multinomial logistic regression (Section 2.5). Initialrisk perception was also included as part of the set of startingvariables to control for its effect. Stepwise model selection (withchange in AIC as a decision rule) was used to obtain parsimoniousfinal models for each of the four risk perception questions.
For change in the perception of the severity of global climatechange, the most parsimonious model only incorporated initial riskassessment (Likelihood Ratio c2 ¼ 11.58, df ¼ 1, P < 0.001). Treat-ment type, social, economic and demographic factors did not in-fluence the change in opinion for this question (Table 2). For thesecond question, perception of the link between climate changeand the risk of dyke failure, initial perception and home ownershipwere retained in the final model (LR c2 ¼ 51.52, df ¼ 3, P < 0.001,Table 2). Renters and home owners exhibited a greater tendencytowards positive changes in risk perception than participants wholived at home as dependents.
The final model for question three, change in the perception ofthe likelihood of dyke failure, retained initial risk assessment, age,education, and home ownership (LR c2 ¼ 93.42, df ¼ 7, P < 0.001).Relative to the 26e65 age class, older individuals (66þ) exhibited agreater increase (0.26� 0.56 SE; Table 2) while younger individuals(<25) exhibited a lesser increase (�1.16� 0.54 SE; Table 2). Greatereducational levels led to greater increases in risk perception(Table 2); relative to college or trade certified individuals, high
ness and strategies for communicating the risk of coastal flooding: A013), http://dx.doi.org/10.1016/j.ecss.2013.04.017
a b
c d
Risk Perception
Perc
ent (
%)
0
10
20
30
40
Not at all To a verysmall degree
Somewhat To a consider−able degree
Severe
Risk Perception
Perc
ent (
%)
0
10
20
30
40
50
Not at all To a verysmall degree
Somewhat To a consider−able degree
Severe
Risk Perception
Perc
ent (
%)
0
10
20
30
40
Not at all To a verysmall degree
Somewhat To a consider−able degree
Severe
Risk Perception
Perc
ent (
%)
15
20
25
30
35
Not at all To a verysmall degree
Somewhat To a consider−able degree
Severe
Fig. 5. Perception of risk, before (white bar) and after (black bar) participating in a risk communication focus group. Responses to the following questions were assessed: (a) “do youfeel that global climate change is a problem?”, (b) “do you think there is a link between a possible failure of the Tantramar dykes and climate change?”, (c) “how likely do you thinkthe risk is of a dyke failure in the Tantramar?”, and (d) “how vulnerable are you to the risk of a Tantramar dyke failure?”.
D.J. Lieske et al. / Estuarine, Coastal and Shelf Science xxx (2013) 1e12 7
school educated or less exhibited a lesser increase (�0.32 �0.60 SE), while university educated exhibited a greater increase(0.72 � 0.46 SE). In terms of home ownership, relative to “de-pendency” status, renters exhibited enhanced risk perception(1.38 � 0.62 SE) while home owners showed a lesser change(0.28 � 0.71 SE).
With regards to the change in the perception of personalvulnerability, initial risk assessment, age, and gender were retainedin the final model (LR c2 ¼ 31.05, df¼ 4, P< 0.001). Older (66þ) andyounger (<25) individuals realized a lower change in the percep-tion of personal vulnerability than middle-aged (26e65) people(�1.21 � 0.48 SE and �0.93 � 0.34 SE, respectively). Male partici-pants also exhibited less change in opinion than female (�0.76 �0.32 SE).
3.4. Qualitative responses
Overall, 82 of the 108 responses (76%) appraising the effective-ness of communication materials identified maps and animationsas a key component (Table 3a, question 4). When prompted torecommend improvements, the majority of comments pertained tothe need for more information about what was being done toaddress the problem (8 of 30, or 27%) or more details about what anunfolding flood would be like (9 of 30, or 30%). Some requested asimplification of, for example, the information summarized in
Please cite this article in press as: Lieske, D.J., et al., Climate change awareCanadian Maritime case example, Estuarine, Coastal and Shelf Science (2
tabular format (4 of 30, or 13%), while others expressed difficultyreading text and maps (7 of 30, or 23%).
A large number of the responses regarding long-term adapta-tion involved moving to an alternate location (55 of 122, or 49%).Curiously, 71% (39 of 55) of the responses which singled out themoving strategy originated from participants exposed to thegeovisually-augmented treatments (two and three).
Of 18 responses that indicated a desire to raise awareness,organize, or apply political pressure to advance a communityadaptation strategy, 15 (83%) originated with participants exposedto geovisually-augmented treatments (two and three).
On four occasions respondents identified “shock” as theirresponse to the event of a flood that affected them personally(question 3, Table 3a). All four were respondents exposed totreatment two (which prominently featured the 3D flood anima-tion, Fig. 3).
4. Discussion
In summing up risk communication, Pelletier and Sharp (2008)argue that information needs to be tailored to “where people are at”in terms of readiness and intention to adapt. Grothmann and Patt(2005) point out that personal adaptation decisions are predi-cated on an awareness of the severity of the problem. In Grothmannand Patt’s (2005) socio-cognitive model of private proactive
ness and strategies for communicating the risk of coastal flooding: A013), http://dx.doi.org/10.1016/j.ecss.2013.04.017
c
0.0
0.2
0.4
0.6
0.8
1.0
University
Prob
abilit
y
Under 2526−6566+
FemaleMale
Not al all To a verysmall degree
Somewhat To a consider- able degree
Severe
aNot al all
0.0
0.2
0.4
0.6
0.8
1.0
High School or LessPr
obab
ility
Under 2526−6566+
FemaleMale
To a verysmall degree
Somewhat To a consider- able degree
Severe
Risk Perception
Risk Perception
b0.0
0.2
0.4
0.6
0.8
1.0
College or Trade Certified
Prob
abilit
y
Under 2526−6566+
FemaleMale
Not al all To a verysmall degree
Somewhat To a consider- able degree
Severe
Risk Perception
d
0.0
0.1
0.2
0.3
0.4
0.5
0.6
Prob
abilit
y
High School or lessCollege or TradeUniversity
Not al all To a verysmall degree
Somewhat To a consider- able degree
Severe
Risk Perception
e0.10
0.15
0.20
0.25
0.30
0.35
Prob
abilit
y
FemaleMale
Not al all To a verysmall degree
Somewhat To a consider- able degree
Severe
Risk Perception
f
0.0
0.1
0.2
0.3
0.4
0.5
Prob
abilit
y
Under 2526−6566+
Not al all To a verysmall degree
Somewhat To a consider- able degree
Severe
Risk Perception
a b
Fig. 6. 6a. Factors significantly influencing the initial perception of the threat posed by global climate change, as assessed by response to the question “do you feel that globalclimate change is a problem?”. Panels a through c show changes in the multinomial logistic response probabilities as a function of education, age, and gender Fig. 6b. Factorssignificantly influencing the initial perceptions of risk, as assessed by proportional odds logistic models of the responses to the following questions: (d) “do you think there is a linkbetween a possible failure of the Tantramar dykes and climate change?”, (e) “how likely do you think the risk is of a dyke failure in the Tantramar?”, and (f) “how vulnerable are youto the risk of a Tantramar dyke failure?”.
D.J. Lieske et al. / Estuarine, Coastal and Shelf Science xxx (2013) 1e128
Please cite this article in press as: Lieske, D.J., et al., Climate change awareness and strategies for communicating the risk of coastal flooding: ACanadian Maritime case example, Estuarine, Coastal and Shelf Science (2013), http://dx.doi.org/10.1016/j.ecss.2013.04.017
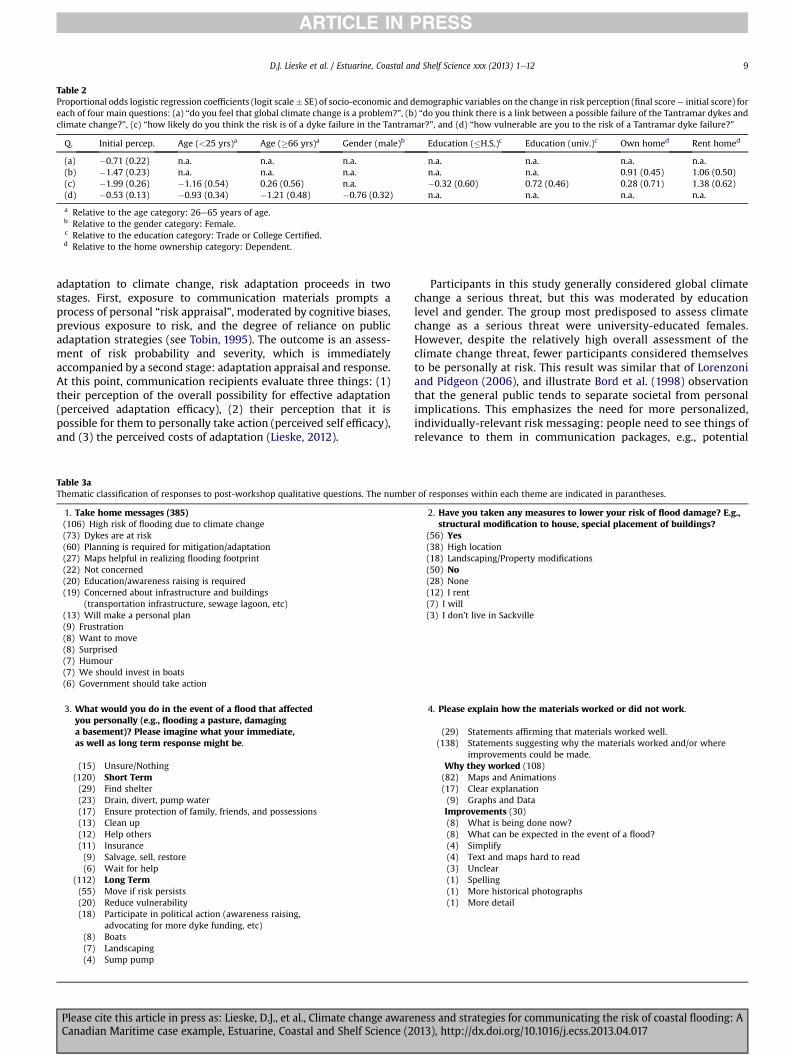
Table 2Proportional odds logistic regression coefficients (logit scale� SE) of socio-economic and demographic variables on the change in risk perception (final scoree initial score) foreach of four main questions: (a) “do you feel that global climate change is a problem?”, (b) “do you think there is a link between a possible failure of the Tantramar dykes andclimate change?”, (c) “how likely do you think the risk is of a dyke failure in the Tantramar?”, and (d) “how vulnerable are you to the risk of a Tantramar dyke failure?”
Q. Initial percep. Age (<25 yrs)a Age (�66 yrs)a Gender (male)b Education (�H.S.)c Education (univ.)c Own homed Rent homed
(a) �0.71 (0.22) n.a. n.a. n.a. n.a. n.a. n.a. n.a.(b) �1.47 (0.23) n.a. n.a. n.a. n.a. n.a. 0.91 (0.45) 1.06 (0.50)(c) �1.99 (0.26) �1.16 (0.54) 0.26 (0.56) n.a. �0.32 (0.60) 0.72 (0.46) 0.28 (0.71) 1.38 (0.62)(d) �0.53 (0.13) �0.93 (0.34) �1.21 (0.48) �0.76 (0.32) n.a. n.a. n.a. n.a.
a Relative to the age category: 26e65 years of age.b Relative to the gender category: Female.c Relative to the education category: Trade or College Certified.d Relative to the home ownership category: Dependent.
D.J. Lieske et al. / Estuarine, Coastal and Shelf Science xxx (2013) 1e12 9
adaptation to climate change, risk adaptation proceeds in twostages. First, exposure to communication materials prompts aprocess of personal “risk appraisal”, moderated by cognitive biases,previous exposure to risk, and the degree of reliance on publicadaptation strategies (see Tobin, 1995). The outcome is an assess-ment of risk probability and severity, which is immediatelyaccompanied by a second stage: adaptation appraisal and response.At this point, communication recipients evaluate three things: (1)their perception of the overall possibility for effective adaptation(perceived adaptation efficacy), (2) their perception that it ispossible for them to personally take action (perceived self efficacy),and (3) the perceived costs of adaptation (Lieske, 2012).
Table 3aThematic classification of responses to post-workshop qualitative questions. The numbe
1. Take home messages (385)(106) High risk of flooding due to climate change(73) Dykes are at risk(60) Planning is required for mitigation/adaptation(27) Maps helpful in realizing flooding footprint(22) Not concerned(20) Education/awareness raising is required(19) Concerned about infrastructure and buildings
(transportation infrastructure, sewage lagoon, etc)(13) Will make a personal plan(9) Frustration(8) Want to move(8) Surprised(7) Humour(7) We should invest in boats(6) Government should take action
3. What would you do in the event of a flood that affectedyou personally (e.g., flooding a pasture, damaginga basement)? Please imagine what your immediate,as well as long term response might be.
(15) Unsure/Nothing(120) Short Term(29) Find shelter(23) Drain, divert, pump water(17) Ensure protection of family, friends, and possessions(13) Clean up(12) Help others(11) Insurance(9) Salvage, sell, restore(6) Wait for help
(112) Long Term(55) Move if risk persists(20) Reduce vulnerability(18) Participate in political action (awareness raising,
advocating for more dyke funding, etc)(8) Boats(7) Landscaping(4) Sump pump
Please cite this article in press as: Lieske, D.J., et al., Climate change awareCanadian Maritime case example, Estuarine, Coastal and Shelf Science (2
Participants in this study generally considered global climatechange a serious threat, but this was moderated by educationlevel and gender. The group most predisposed to assess climatechange as a serious threat were university-educated females.However, despite the relatively high overall assessment of theclimate change threat, fewer participants considered themselvesto be personally at risk. This result was similar that of Lorenzoniand Pidgeon (2006), and illustrate Bord et al. (1998) observationthat the general public tends to separate societal from personalimplications. This emphasizes the need for more personalized,individually-relevant risk messaging: people need to see things ofrelevance to them in communication packages, e.g., potential
r of responses within each theme are indicated in parantheses.
2. Have you taken any measures to lower your risk of flood damage? E.g.,structural modification to house, special placement of buildings?
(56) Yes(38) High location(18) Landscaping/Property modifications(50) No(28) None(12) I rent(7) I will(3) I don’t live in Sackville
4. Please explain how the materials worked or did not work.
(29) Statements affirming that materials worked well.(138) Statements suggesting why the materials worked and/or where
improvements could be made.Why they worked (108)(82) Maps and Animations(17) Clear explanation(9) Graphs and DataImprovements (30)(8) What is being done now?(8) What can be expected in the event of a flood?(4) Simplify(4) Text and maps hard to read(3) Unclear(1) Spelling(1) More historical photographs(1) More detail
ness and strategies for communicating the risk of coastal flooding: A013), http://dx.doi.org/10.1016/j.ecss.2013.04.017
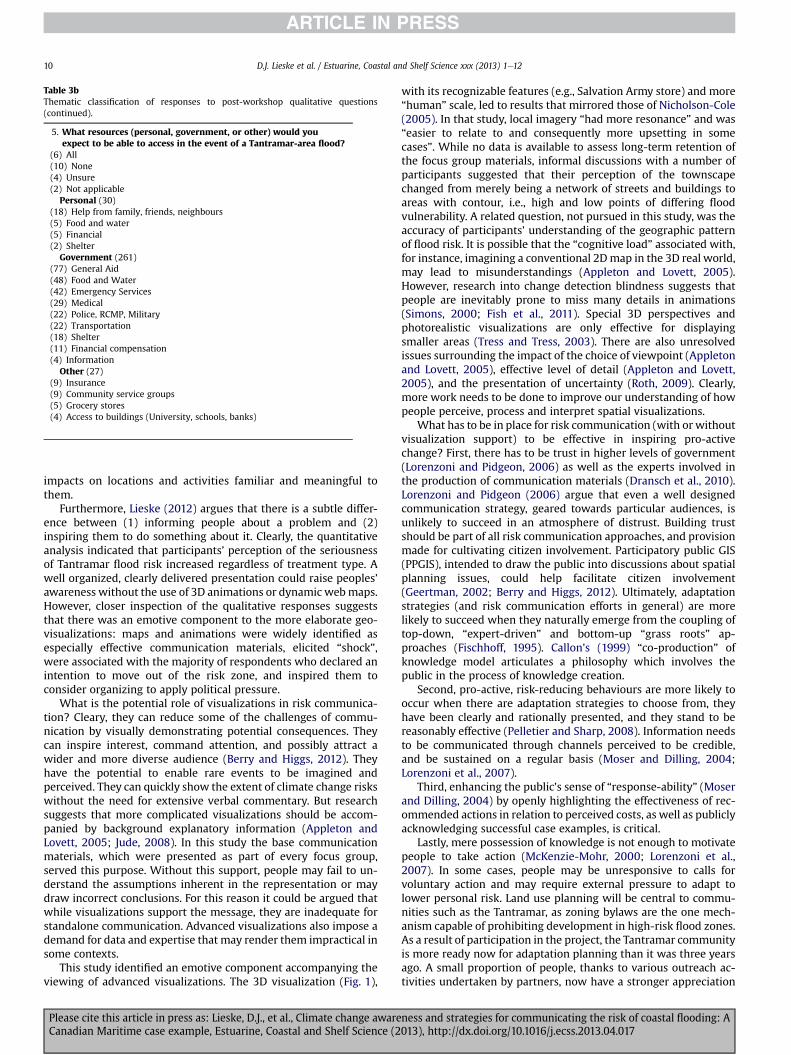
Table 3bThematic classification of responses to post-workshop qualitative questions(continued).
5. What resources (personal, government, or other) would youexpect to be able to access in the event of a Tantramar-area flood?
(6) All(10) None(4) Unsure(2) Not applicable
Personal (30)(18) Help from family, friends, neighbours(5) Food and water(5) Financial(2) Shelter
Government (261)(77) General Aid(48) Food and Water(42) Emergency Services(29) Medical(22) Police, RCMP, Military(22) Transportation(18) Shelter(11) Financial compensation(4) Information
Other (27)(9) Insurance(9) Community service groups(5) Grocery stores(4) Access to buildings (University, schools, banks)
D.J. Lieske et al. / Estuarine, Coastal and Shelf Science xxx (2013) 1e1210
impacts on locations and activities familiar and meaningful tothem.
Furthermore, Lieske (2012) argues that there is a subtle differ-ence between (1) informing people about a problem and (2)inspiring them to do something about it. Clearly, the quantitativeanalysis indicated that participants’ perception of the seriousnessof Tantramar flood risk increased regardless of treatment type. Awell organized, clearly delivered presentation could raise peoples’awareness without the use of 3D animations or dynamic webmaps.However, closer inspection of the qualitative responses suggeststhat there was an emotive component to the more elaborate geo-visualizations: maps and animations were widely identified asespecially effective communication materials, elicited “shock”,were associated with the majority of respondents who declared anintention to move out of the risk zone, and inspired them toconsider organizing to apply political pressure.
What is the potential role of visualizations in risk communica-tion? Cleary, they can reduce some of the challenges of commu-nication by visually demonstrating potential consequences. Theycan inspire interest, command attention, and possibly attract awider and more diverse audience (Berry and Higgs, 2012). Theyhave the potential to enable rare events to be imagined andperceived. They can quickly show the extent of climate change riskswithout the need for extensive verbal commentary. But researchsuggests that more complicated visualizations should be accom-panied by background explanatory information (Appleton andLovett, 2005; Jude, 2008). In this study the base communicationmaterials, which were presented as part of every focus group,served this purpose. Without this support, people may fail to un-derstand the assumptions inherent in the representation or maydraw incorrect conclusions. For this reason it could be argued thatwhile visualizations support the message, they are inadequate forstandalone communication. Advanced visualizations also impose ademand for data and expertise that may render them impractical insome contexts.
This study identified an emotive component accompanying theviewing of advanced visualizations. The 3D visualization (Fig. 1),
Please cite this article in press as: Lieske, D.J., et al., Climate change awareCanadian Maritime case example, Estuarine, Coastal and Shelf Science (2
with its recognizable features (e.g., Salvation Army store) and more“human” scale, led to results that mirrored those of Nicholson-Cole(2005). In that study, local imagery “had more resonance” and was“easier to relate to and consequently more upsetting in somecases”. While no data is available to assess long-term retention ofthe focus group materials, informal discussions with a number ofparticipants suggested that their perception of the townscapechanged from merely being a network of streets and buildings toareas with contour, i.e., high and low points of differing floodvulnerability. A related question, not pursued in this study, was theaccuracy of participants’ understanding of the geographic patternof flood risk. It is possible that the “cognitive load” associated with,for instance, imagining a conventional 2Dmap in the 3D real world,may lead to misunderstandings (Appleton and Lovett, 2005).However, research into change detection blindness suggests thatpeople are inevitably prone to miss many details in animations(Simons, 2000; Fish et al., 2011). Special 3D perspectives andphotorealistic visualizations are only effective for displayingsmaller areas (Tress and Tress, 2003). There are also unresolvedissues surrounding the impact of the choice of viewpoint (Appletonand Lovett, 2005), effective level of detail (Appleton and Lovett,2005), and the presentation of uncertainty (Roth, 2009). Clearly,more work needs to be done to improve our understanding of howpeople perceive, process and interpret spatial visualizations.
What has to be in place for risk communication (with or withoutvisualization support) to be effective in inspiring pro-activechange? First, there has to be trust in higher levels of government(Lorenzoni and Pidgeon, 2006) as well as the experts involved inthe production of communication materials (Dransch et al., 2010).Lorenzoni and Pidgeon (2006) argue that even a well designedcommunication strategy, geared towards particular audiences, isunlikely to succeed in an atmosphere of distrust. Building trustshould be part of all risk communication approaches, and provisionmade for cultivating citizen involvement. Participatory public GIS(PPGIS), intended to draw the public into discussions about spatialplanning issues, could help facilitate citizen involvement(Geertman, 2002; Berry and Higgs, 2012). Ultimately, adaptationstrategies (and risk communication efforts in general) are morelikely to succeed when they naturally emerge from the coupling oftop-down, “expert-driven” and bottom-up “grass roots” ap-proaches (Fischhoff, 1995). Callon’s (1999) “co-production” ofknowledge model articulates a philosophy which involves thepublic in the process of knowledge creation.
Second, pro-active, risk-reducing behaviours are more likely tooccur when there are adaptation strategies to choose from, theyhave been clearly and rationally presented, and they stand to bereasonably effective (Pelletier and Sharp, 2008). Information needsto be communicated through channels perceived to be credible,and be sustained on a regular basis (Moser and Dilling, 2004;Lorenzoni et al., 2007).
Third, enhancing the public’s sense of “response-ability” (Moserand Dilling, 2004) by openly highlighting the effectiveness of rec-ommended actions in relation to perceived costs, as well as publiclyacknowledging successful case examples, is critical.
Lastly, mere possession of knowledge is not enough to motivatepeople to take action (McKenzie-Mohr, 2000; Lorenzoni et al.,2007). In some cases, people may be unresponsive to calls forvoluntary action and may require external pressure to adapt tolower personal risk. Land use planning will be central to commu-nities such as the Tantramar, as zoning bylaws are the one mech-anism capable of prohibiting development in high-risk flood zones.As a result of participation in the project, the Tantramar communityis more ready now for adaptation planning than it was three yearsago. A small proportion of people, thanks to various outreach ac-tivities undertaken by partners, now have a stronger appreciation
ness and strategies for communicating the risk of coastal flooding: A013), http://dx.doi.org/10.1016/j.ecss.2013.04.017
D.J. Lieske et al. / Estuarine, Coastal and Shelf Science xxx (2013) 1e12 11
for the function of the dykes and the possible threat of flooding inthe town. The Town Council has also been involved throughout thelife of the project so that it can be ready to move in its decision-making on the topic. That being said, there still remain a rela-tively large proportion of the population who have paid no atten-tion to the news reports on climate change impacts, or the regularupdates on the project that partners provided. A targeted andwider-scale communication effort will need to be employed toprovide the population with the basic information to understandwhy certain actions (creation of new policies and regulations) needto be made by the local Council. Stakeholders are currently in theprocess of creating their own public communication materials, andare relying heavily on the visualizations produced during this study.It is expected that wider dissemination of this information,tempered by a greater understanding of the communication chal-lenges involved, will further stimulate a desire for pro-activeadaptation amongst the “grass-roots” community, and lead tofurther discussions about acceptable and effective adaptation sce-narios and strategies.
When borne out of well rationalized land use policies, zoningbylaws can help pave the way towards providing incentives forcommunities to adopt major adaptation initiatives. For example,freshwater flooding drove the American community of Dubuque,Iowa to devise a master plan to acquire 74 properties and open up asubmerged creek (Carey, 2011). While the Dubuque plannersinitially encountered community resistance, a serious flood helpedunite the city leaders and convince the public of the wisdom of the$21 million dollar (USD), 11-year plan. Community-based socialmarketing, where particular adaptation strategies are promoted aspart of an adaptive campaign that addresses perceived barriers tochange, may also constitute an important approach for encouragingpro-active adaptation (McKenzie-Mohr, 2000). While identificationof barriers to adaptation will lengthen the time required toimplement an adaptation-focused communication strategy(McKenzie-Mohr, 2000), it provides an evaluative framework (e.g.,through focus groups and pilot studies) that can also be used to testthe effectiveness of related communication and visualizationmaterials.
5. Conclusions
High levels of awareness of the threat posed by global climatechange do not necessarily translate into an awareness of personalflood risks at the local level. In coastal zones reliant on engineeringsolutions to abate flood waters, communities are commonly un-aware of the risk of dyke failure. Well designed communicationstrategies, which address cognitive biases and present the evi-dence with supporting context, are capable of addressing thisknowledge gap. Furthermore, the results of this study show thatthe type of communication strategy, whether or not it made use ofspecial 3D and web-based geovisualizations, did not significantlydiffer in the way it influenced quantitative measures of riskperception. Qualitative analysis showed that advanced visualiza-tions were accompanied by an emotive component that was ab-sent from the baseline communication strategy. This componentmanifested in, for example, greater expressions of sentiment tomobilize for political and community advocacy. While no data isavailable to assess long-term retention of the focus group mate-rials, informal discussions with a number of participants suggestedthat there may have been a persistent change in perceptionfollowing exposure to geovisualizations. Translation of riskawareness to a willingness to make proactive adaptation decisionsis poorly understood, but can be expected to require a supportingframework to occur. Necessary co-requisites include trust in higherlevels of government and the experts involved in the production of
Please cite this article in press as: Lieske, D.J., et al., Climate change awareCanadian Maritime case example, Estuarine, Coastal and Shelf Science (2
communication materials; an accessible set of alternative adapta-tion strategies to choose from; appeal to personal responsibilityand agency; and effective land use planning. Participatory publicGIS (PPGIS) and community-based social marketing may involvethe public in the process of knowledge creation and help identifyimpediments to adaptation.
Acknowledgements
The authors thank the following for funding and logisticalsupport: the Atlantic Climate Change Adaptation Association(ACASA), the Social Sciences and Humanities Research Council(SSHRC), and Mount Allison University. Also acknowledged is thespatial datamanagement and visualization development support ofJ. Bornemann and L. Salisbury. Finally, the authors thank R. Corbettfor providing valuable advice and recommendations early in theprojects genesis.
References
Andrienko, N., Andrienko, G., Gatalsky, P., 2003. Exploratory spatio-temporal visu-alization: an analytical review. Journal of Visual Languages and Computing 14,503e541.
Appleton, K., Lovett, A., 2005. GIS-based visualization of development proposals:reactions from planning and related professionals. Computers, Environmentand Urban 29, 321e339.
Berry, R., Higgs, G., 2012. Gauging levels of public acceptance of the use of visual-ization tools in promoting public participation; a case study of wind farmplanning in South Wales, UK. Journal of Environment Planning and Manage-ment 55, 229e251.
Bord, R.J., Fisher, A., O’Connor, R.E., 1998. Public perceptions of global warming:United States and international perspectives. Climate Research 11, 75e84.
Burgman, M., 2005. Risks and Decisions for Conservation and EnvironmentalManagement. Cambridge University Press, New York.
Burningham, J., Fielding, J., Thrush, D., 2008. ‘It’ll never happen to me’: under-standing public awareness of local flood risk. Disasters 32, 216e238.
Callon, M., 1999. The role of lay people in the production and dissemination ofscientific knowledge. Science, Technology and Society, 81e94.
Carey, J.A., 2011. After the deluge. Scientific American 305, 72e75.Collett, D., 2003. Modelling Binary Data, second ed. Chapman & Hall/CRC, p. 387.Daigle, R.J., 2011. Se-level Rise Estimates for New Brunswick Municipalities. R. J.
Daigle Enviro. Atlantic Climate Adaptation Solutions Association.Dransch, D., Rotzoll, H., Poser, K., 2010. The contribution of maps to the challenges
of risk communication to the public. International Journal of Digital Earth 3,292e311.
Dronkers, J., Gilbert, J.T.E., Butler, L.W., Carey, J.J., Campbell, J., James, E.,McKenzie, C., Misdorp, R., Quin, N., Ries, K.L., Schroder, P.C., Spradley, J.R.,Titus, J.G., Vallianos, L., Dadelszen, J. von., 1990. Strategies for Adaptation to SeaLevel Rise. In: Report of the IPCC Coastal Zone Management Subgroup: Inter-governmental Panel on Climate Change. (Geneva).
Environmental Systems Research Institute, 2012. ArcGIS Server. http://www.esri.com/software/arcgis/arcgisserver (accessed: September, 2012).
Fischhoff, B., 1995. Risk perception and communication unplugged: twenty years ofprocess. Risk Analysis 15, 137e145.
Fish, C., Goldsberry, K.P., Battersby, S., 2011. Change blindness in animated choro-pleth maps: an empirical study. Cartography and Geographic Information Sci-ence 38, 350e362.
Fox, J., 2002. An R and S-plus Companion to Applied Regression. Sage Publications,p. 312.
Geertman, S., 2002. Participatory planning and GIS: a PSS to bridge the gap. Envi-ronment and Planning B 29, 21e35.
Grothmann, T., Patt, A., 2005. Adaptive capacity and human cognition: the processof individual adaptation to climate change. Global Environmental Change 15,199e213.
Jude, S., 2008. Investigating the potential role of visualization techniques inparticipatory coastal management. Coastal Management 36, 331e349.
Keim, D.A., Panse, C., Sips, M., 2005. Information visualization: scope, techniquesand opportunities for geovisualization. In: Kraak, M.-J. (Ed.), Exploring Geo-visualization. Elsevier, Amsterdam, pp. 23e52.
Kingston, R., Carver, S., Evans, A., Turner, I., 2000. Web-based public participationgeographical information systems: an aid to local environmental decision-making. Computers, Environment and Urban 24, 109e125.
Lai, P.C., Kwong, K.-H., Mak, A.S.H., 2010. Assessing the applicability and effective-ness of 3D visualization in environmental impact assessment. Environment andPlanning B 37, 221e233.
Lieske, D.J., 2012. Towards a framework for designing spatial and non-spatial vi-sualizations for communicating climate change risks. Geomatica 66, 255e265.
Lieske, D.J., Bornemann, J., 2011. Coastal Dykelands in the Tantramar Area: Impacts ofClimate Change on Dyke Erosion and Flood Risk. Atlantic Climate Adaptation
ness and strategies for communicating the risk of coastal flooding: A013), http://dx.doi.org/10.1016/j.ecss.2013.04.017
D.J. Lieske et al. / Estuarine, Coastal and Shelf Science xxx (2013) 1e1212
Solutions Association. http://www.mta.ca/wdlieske/GML/docs/CoastalDykelandsinTantramar-ImpactsofClimateChange.pdf (accessed October, 2012).
Lorenzoni, I., Pidgeon, N.F., 2006. Public views on climate change: European andUSA perspectives. Climatic Change 77, 73e95.
Lorenzoni, I., Nicholson-Cole, S., Whitmarsh, L., 2007. Barriers perceived to engagingwith climate change among the UK public and their policy implications. GlobalEnviron Chang 17, 445e459.
MacEachern, A.M., Buttenfield, B.P., Campbell, J.B., DiBiase, D.W., Monmonier, M.,1992. Visualization. In: Abler, R., Marcus, M., Olson, J. (Eds.), Geography’s InnerWorlds: Pervasive Themes in American Geography. Rutgers University Press,New Brunswick, New Jersey, pp. 99e137.
McKenzie-Mohr, D., 2000. Fostering sustainable behavior through community-based social marketing. American Psychologist 55, 531e537.
Microsoft Corporation, 2002. Microsoft Powerpoint, 2002. http://www.microsoft.com.
Moser, S.C., Dilling, L., 2004. Making climate hot: communicating the urgency andchallenge of global climate change. Environment 46, 33e46.
Newport, F., 2012. Americans’ Worries about Global Warming up Slightly. http://www.gallup.com/poll/153653/Americans-Worries-Global-Warming-Slightly.aspx (accessed August, 2012).
Nicholson-Cole, S.A., 2005. Representing climate change futures: a critique of theuse of images for visual communication. Computers, Environment and Urban29, 255e273.
NRC, 2006. Facing Hazards and Disasters: Understanding Human Dimensions. TheNational Academies of Sciences Press, Washington, D.C.
Pelletier, L.G., Sharp, E., 2008. Persuasive communication and proenvironmentalbehaviours: how message tailoring and message framing can improve theintegration of behaviours through self-determined motivation. Canadian Psy-chology 49, 210e217.
Please cite this article in press as: Lieske, D.J., et al., Climate change awareCanadian Maritime case example, Estuarine, Coastal and Shelf Science (2
R Development Core Team, 2012. R: A Language and Environment for StatisticalComputing. R Foundation for Statistical Computing, Vienna, Austria. http://www.R-project.org.
Roness, L.A., Lieske, D.J., 2012. Tantramar Dyke Risk Project: The Use of Visualizationsto Inspire Action. Atlantic Climate Adaptation Solutions Association. http://www.mta.ca/wdlieske/GML/docs/Tantramar Dyke Risk Project e Risk CommunicationReport e FINAL.pdf (accessed October, 2012).
Roth, R.E., 2009. A qualitative approach to understanding the role of geographicinformation uncertainty during decision making. Cartography and GeographicInformation Science 36, 315e330.
Seacrest, S., Kuzelka, R., Leonard, R., 2000. Global climate change and risk percep-tion: the challenge of translation. Journal of American Water Resources Asso-ciation 36, 253e263.
Simons, D.J., 2000. Current approaches to change blindness. Visual Cognition 7, 1e15.Slovic, P., 1987. Perception of risk. Science 236, 280e285.Sterman, J.D., 2011. Communicating climate change risks in a skeptical world. Cli-
matic Change 108, 811e826.Tobin, G.A., 1995. The levee love affair: a stormy relationship? Journal of American
Water Resources Association 31, 359e367.Tress, B., Tress, G., 2003. Scenario visualization for participatory landscape
planningda study from Denmark. Landscape and Urban Planning 64, 161e178.Tsversky, A., Kahneman, D., 1974. Judgment under uncertainty: heuristics and bia-
ses. Science 185, 1124e1131.Tukey, J.W., 1977. Exploratory Data Analysis. Addison-Wesley, Ontario, p. 503.Venables, W.N., Ripley, B.D., 2002. Modern Applied Statistics with S, fourth ed.
Springer.Wu, S.-Y., Yarnal, B., Fisher, A., 2002. Vulnerability of coastal communities to sea-
level rise: a case study of Cape May County, New Jersey. USA. ClimateResearch 22, 255e270.
ness and strategies for communicating the risk of coastal flooding: A013), http://dx.doi.org/10.1016/j.ecss.2013.04.017