Embed Size (px)
Citation preview
Climate Change and Potato Productionin Contrasting South African Agro-ecosystems1. Effects on Land and Water Use Efficiencies
A. J. Haverkort* & A. C. Franke & F. A. Engelbrecht & J. M. Steyn
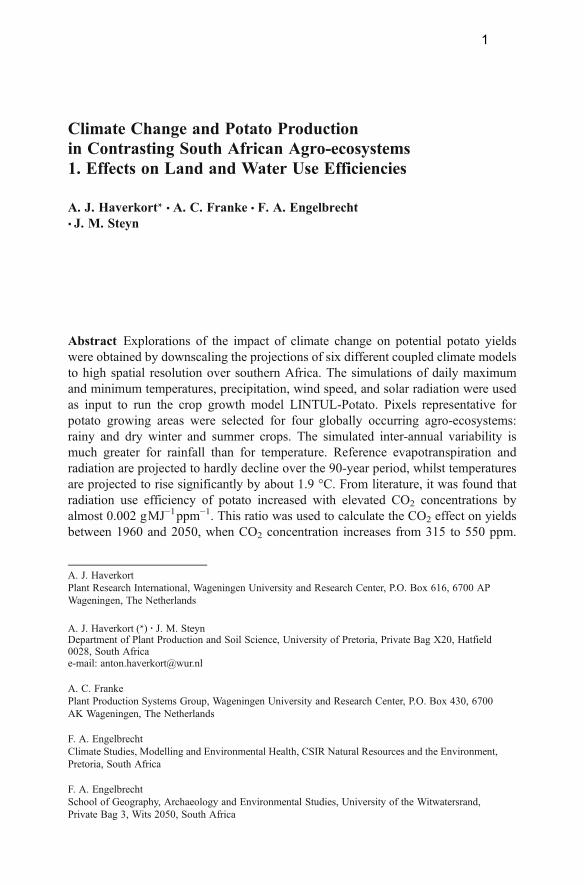
Abstract Explorations of the impact of climate change on potential potato yieldswere obtained by downscaling the projections of six different coupled climate modelsto high spatial resolution over southern Africa. The simulations of daily maximumand minimum temperatures, precipitation, wind speed, and solar radiation were usedas input to run the crop growth model LINTUL-Potato. Pixels representative forpotato growing areas were selected for four globally occurring agro-ecosystems:rainy and dry winter and summer crops. The simulated inter-annual variability ismuch greater for rainfall than for temperature. Reference evapotranspiration andradiation are projected to hardly decline over the 90-year period, whilst temperaturesare projected to rise significantly by about 1.9 °C. From literature, it was found thatradiation use efficiency of potato increased with elevated CO2 concentrations byalmost 0.002 gMJ−1ppm−1. This ratio was used to calculate the CO2 effect on yieldsbetween 1960 and 2050, when CO2 concentration increases from 315 to 550 ppm.
A. J. HaverkortPlant Research International, Wageningen University and Research Center, P.O. Box 616, 6700 APWageningen, The Netherlands
A. J. Haverkort (*) : J. M. SteynDepartment of Plant Production and Soil Science, University of Pretoria, Private Bag X20, Hatfield 0028, South Africae-mail: [email protected]
A. C. FrankePlant Production Systems Group, Wageningen University and Research Center, P.O. Box 430, 6700AK Wageningen, The Netherlands
F. A. EngelbrechtClimate Studies, Modelling and Environmental Health, CSIR Natural Resources and the Environment,Pretoria, South Africa
F. A. EngelbrechtSchool of Geography, Archaeology and Environmental Studies, University of the Witwatersrand,Private Bag 3, Wits 2050, South Africa
1
Within this range, evapotranspiration by the potato crop was reduced by about 13%according to literature. Simulated yield increase was strongest in the Mediterranean-type winter crop (+37%) and least under Mediterranean summer (+12%) and rela-tively warm winter conditions (+14%) closer to the equator. Water use efficiency alsoincreased most in the cool rainy Mediterranean winter (+45%) and least so in thewinter crop closer to the equator (+14%). It is concluded from the simulations that forall four agro-ecosystems possible negative effects of rising temperatures and reducedavailability of water for potato are more than compensated for by the positive effect ofincreased CO2 levels on water use efficiency and crop productivity.
Keywords Climate change .CO2-concentration . Contrastingagro-ecosystems .Potato .
Water use efficiency . Yield
Introduction
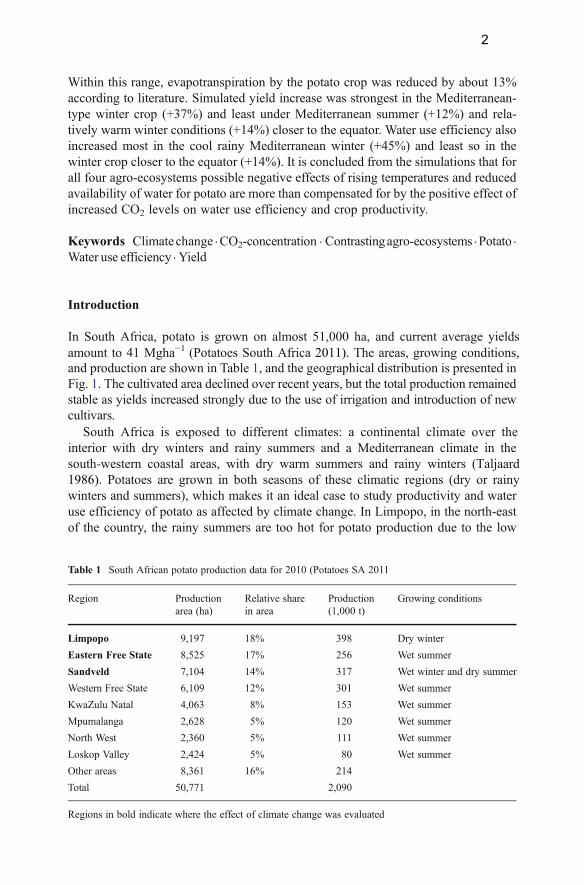
In South Africa, potato is grown on almost 51,000 ha, and current average yields amount to 41 Mgha−1 (Potatoes South Africa 2011). The areas, growing conditions, and production are shown in Table 1, and the geographical distribution is presented in Fig. 1. The cultivated area declined over recent years, but the total production remained stable as yields increased strongly due to the use of irrigation and introduction of new cultivars.
South Africa is exposed to different climates: a continental climate over the interior with dry winters and rainy summers and a Mediterranean climate in the south-western coastal areas, with dry warm summers and rainy winters (Taljaard 1986). Potatoes are grown in both seasons of these climatic regions (dry or rainy winters and summers), which makes it an ideal case to study productivity and water use efficiency of potato as affected by climate change. In Limpopo, in the north-east of the country, the rainy summers are too hot for potato production due to the low
Table 1 South African potato production data for 2010 (Potatoes SA 2011
Region Productionarea (ha)
Relative sharein area
Production(1,000 t)
Growing conditions
Limpopo 9,197 18% 398 Dry winter
Eastern Free State 8,525 17% 256 Wet summer
Sandveld 7,104 14% 317 Wet winter and dry summer
Western Free State 6,109 12% 301 Wet summer
KwaZulu Natal 4,063 8% 153 Wet summer
Mpumalanga 2,628 5% 120 Wet summer
North West 2,360 5% 111 Wet summer
Loskop Valley 2,424 5% 80 Wet summer
Other areas 8,361 16% 214
Total 50,771 2,090
Regions in bold indicate where the effect of climate change was evaluated
2
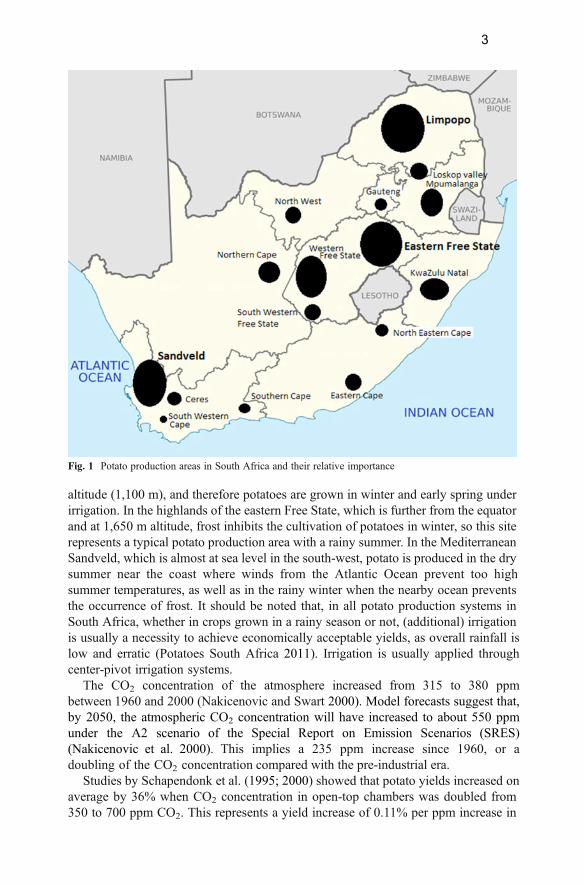
altitude (1,100 m), and therefore potatoes are grown in winter and early spring under irrigation. In the highlands of the eastern Free State, which is further from the equator and at 1,650 m altitude, frost inhibits the cultivation of potatoes in winter, so this site represents a typical potato production area with a rainy summer. In the Mediterranean Sandveld, which is almost at sea level in the south-west, potato is produced in the dry summer near the coast where winds from the Atlantic Ocean prevent too high summer temperatures, as well as in the rainy winter when the nearby ocean prevents the occurrence of frost. It should be noted that, in all potato production systems in South Africa, whether in crops grown in a rainy season or not, (additional) irrigation is usually a necessity to achieve economically acceptable yields, as overall rainfall is low and erratic (Potatoes South Africa 2011). Irrigation is usually applied through center-pivot irrigation systems.
The CO2 concentration of the atmosphere increased from 315 to 380 ppm between 1960 and 2000 (Nakicenovic and Swart 2000). Model forecasts suggest that, by 2050, the atmospheric CO2 concentration will have increased to about 550 ppm under the A2 scenario of the Special Report on Emission Scenarios (SRES) (Nakicenovic et al. 2000). This implies a 235 ppm increase since 1960, or a doubling of the CO2 concentration compared with the pre-industrial era.
Studies by Schapendonk et al. (1995; 2000) showed that potato yields increased on average by 36% when CO2 concentration in open-top chambers was doubled from 350 to 700 ppm CO2. This represents a yield increase of 0.11% per ppm increase in
Fig. 1 Potato production areas in South Africa and their relative importance
3
CO2 concentration of the atmosphere. The yield response differed between years and among varieties, with late cultivars benefiting more from increased CO2 levels. The authors hypothesized that, under higher CO2 concentration, more assimilates become available in the leaves, enhancing the production and benefiting the activity of the sink organs (tubers), thus resulting in a substantial enhancement of final yield. The late variety may have benefited more because of a relatively earlier tuber formation. Schapendonk et al. (2000) also noticed that elevated CO2 levels did not affect light interception and hardly affected total leaf formation. The higher productivity was primarily related to a higher photosynthetic capacity, which was limited by the plant’s ability to allocate assimilates to the tubers. Similarly, Rosenzweig and Hillel (1998) recorded yield increases of up to 51% for various crops, including potato, when doubling the CO2 concentration. A concerted program of the Commission of the European Union in 1998 and 1999 funded a European network of experiments in open-top chambers, free air CO2 enrichment (FACE), and a CHIP (Changing Climate Impact on Potato Yield and Quality) project, as described by Vorne et al. (2002). Experimental and modelling research was carried out to investigate the effects of increasing atmospheric CO2 and ozone concentrations under different climatic con-ditions on potato cv. Bintje (De Temmerman et al. 2002). These data were used by Wolf and Van Oijen (2003) to simulate potato yields in southern and northern Europe. They concluded that “Climate change gave increases in irrigated yields of 2,000–4,000 kgha−1 dry matter in most regions of the EU, mainly due to the positive response to increased CO2.” Assuming tubers have a dry matter concentration of 20%, this means fresh yield increases between 10 and 20 Mgha−1. T h e F A C E experiments (Miglietta et al. 1998; Magliulo et al. 2003) showed the highest tuber yield increases (between 29% and 54%) with a CO2 increase in the range from 370 to 550 ppm. Jaggard et al. (2010) suggested a 36% increase in potato yields due to the increased concentration of CO2 and a 7.5% decrease in yield due to the increased ozone level (also assessed in the FACE and CHIP trials), resulting in a net yield increase of 28.5%. This is in line with the findings of Schapendonk et al. (2000) and the expected 28.5% yield increase (Jaggard et al. 2010) when CO2 concentration reaches 550 ppm and O3 concentration 60 ppb.
The experiments reported by the authors mentioned above showed increased yields at levels of supply of nutrients and of water to the crop as recommended or customary for crops in their respective environments. Crops grown at higher CO2 levels were supplied with the same amount of nutrients and water as those grown under ambient conditions. A higher uptake was not compensated by additional supply in the trials reported by Jaggard et al. (2010). For potato, therefore, higher yields will also lead to higher uptake of, e.g. nitrogen, so a higher nitrogen use efficiency of the available nitrogen.
According to Jaggard et al. (2010) potato (a C3 crop) will benefit most from rising CO2 levels compared with other crops. Other C3 crops, such as wheat and rice, showed a benefit of only about 6%, while C4 crops do not benefit from CO2 enrichment at all and will suffer from increased ozone levels, leading to between 5% (maize) and 7.5% (sugar cane) yield reduction.
Various authors (Eamus 1991; Pospisilova and Catsky 1999; Schapendonk et al. 2000) argued that greater intracellular CO2 concentration due to increased atmospher-ic CO2 concentration leads to a smaller stomatal aperture and reduced water losses through transpiration from individual leaves, which could possibly lead to greater
4
water use efficiency. In the trial by Magliulo et al. (2003), water use of potato decreased by 11% when CO2 increased from 370 to 550 ppm. This, combined with a yield increase of 53%, resulted in an improved water use efficiency (WUE) of up to 70%. Similarly, Jaggard et al. (2010) observed an 11% decrease in water use during a crop season of unaltered length, when the CO2 concentration increased with 190 ppm. This means an increase in WUE of 0.058%ppm−1 CO2. Fleisher et al. (2008) also reported lower transpiration rate and substantially higher WUE for potato plants grown under elevated CO2 conditions (740 ppm).
Hijmans (2003) predicted global potato yield decreases of up to 32% by 2070 without adaptation and up to 18% with adaptation through the shifting of planting times and suggested breeding for heat adaptation, due to the likely increase in global temperatures by over 3 °C. He, however, did not take the benefit of increased CO2 levels on growth into consideration, so his conclusions ignored the beneficial aspect of atmospheric CO2 enrichment. Supit et al. (2012) concluded that “Crops planted in spring (potato, sugar beet) initially benefit from the CO2 increase, however, as time progresses, increasing temperatures reduce these positive effects. By the end of the century, yields decline in southern Europe and production may only be possible if enough irrigation water is available. In northern Europe, depending on the tempera-ture and CO2 concentration increases, yields either stagnate or decline. However, in some of the cooler regions, yield increase is still possible.” These authors used the ‘Crop Growth Monitoring System’ consisting of weather monitoring, crop growth modelling (the World Food Studies (WOFOST) model) and statistical methods that assist in yield forecasting. The negative aspects of climate change that these authors expect toward the end of the century are due to expected reduction of precipitation. This aspect of climate change, however, is surrounded with the greatest degree of uncertainty (e.g., NASA 2013).
In contrast to some of the studies mentioned above, e.g., the study by Wolf and Van Oijen (2003) in the European Union, such studies have not been conducted for South Africa before. Given the expected increase in average temperatures for south-ern Africa and the sensitivity of potato to heat stress, we hypothesize that the impact of climate change on potato production and water use efficiency will be negative. This is of major concern, since potato is the most important vegetable crop in South Africa, and potato production is the main economic activity in some production areas, such as the Western Cape Sandveld. Moreover, fresh water is expected to become increasingly scarce and a prime constraint to agricultural productivity in South Africa. Therefore, the objectives of this study were to explore the influence of climate change as derived from various downscaled coupled climate models on productivity and water use efficiency of the potato crop in South African conditions.
Models can be applied at various levels from the genome to the crop (Yin and Struik 2008) and further up to the agro-ecosystems level. For this study, we used simulated 90-year climate datasets (1961–2050) and a crop growth model with temperature, solar radiation, CO2 concentration, rainfall, and reference evapotranspi-ration as input data: LINTUL-Potato (Spitters 1990; Kooman and Haverkort 1994). The WOFOST model mentioned above and LINTUL hardly differ in assumptions. We decided to use LINTUL as it has more often been used for potato modelling, it has been validated under various agro-ecological conditions and its radiation use effi-ciency (RUE) and WUE parameter values can conveniently be adapted to
5
accommodate the yield and water use responses to climate change reported by Jaggard et al. (2010). Moreover, differences between the models may show some systematic deviations, but differences between various climate scenarios and con-clusions derived from them are not likely influenced by the choice of the crop growth model. The study presented here is based on current crop management. In a com-panion paper, we will look into possible adaptation strategies such as altered planting dates and harvest strategies (Franke et al. 2013). In a third study, we focus on possible repercussions of climate change on relative development rates of pests and diseases and control strategies (Van der Waals et al. 2013).
Material and Methods
Climate Change Models and Output Data
The detailed simulations of present-day and future climate over southern Africa appliedin this study were obtained by downscaling the output of six different coupled climatemodels (CGCMs), which contributed to Assessment Report Four of the Intergovern-mental Panel on Climate Change, to high spatial resolution over southern Africa. Thedownscaling was performed using a variable-resolution global circulation model, theconformal-cubic atmospheric model (CCAM) of the Commonwealth Scientific andIndustrial Research Organisation. A multiple-nudging procedure was used to obtainthe high-resolution simulations. First, the bias-corrected sea-surface temperatures andsea-ice concentration of the CGCMs were used to force CCAM at its lower boundary, toperform global simulations of climate over the period 1961–2050, at a horizontalresolution of about 200 km. These simulations were subsequently used to force a secondensemble of higher resolution CCAM simulations over southern Africa. In thesesimulations, the model was applied in stretched-grid mode over southern Africa andnudged within the output of the 200 km resolution CCAM simulations. In the stretched-grid simulations, the model resolution was about 60 km over southern Africa, decreasingto about 400 km in the far-field. All simulations were obtained using the A2 SRESscenario. For a more in-depth description of the experimental design, including adescription of a CCAM equation set and parameterization schemes, see Engelbrecht etal. (2011). CCAM has been shown to represent many aspects of the southern Africanclimate, such as the seasonal rainfall cycle, frequency of extreme rainfall events, andinter-annual rainfall variability, satisfactorily (Engelbrecht et al. 2009; 2011; 2013).
Each of the six different downscalings constitutes of 90 years (1961 to 2050) of dailyweather data (maximum and minimum temperature (Tmax and Tmin), solar radiation,precipitation, maximum and minimum relative humidity, and wind speed) for use in thecrop model and to calculate evapotranspiration (ETo) values. Monthly average mini-mum andmaximum temperatures and rainfall data generated were compared with actualdata sets from weather stations in each of the selected four regions. The names,coordinates, and elevations of the weather stations used to calibrate the simulations ineach region are given in Table 2. The regional climate model simulations generallyoverestimated current temperatures by about 1 °C and the amount of rainfall by about30%. The downscaled data were subsequently bias-corrected. The observed climatologyof each site was compared with each particular regional downscaling over the same
6
period, and temperature and rainfall values were reduced according to the average biasesidentified at each agro-ecosystem, in practice, about 25% reduction of those modelledfor the daily data over the complete period of 90 years.
Crop Growth Model
The LINTUL crop growth model used in the present study—similar to the one used byFranke et al. (2011) to calculate current potential potato yields and water use efficienciesin the Sandveld region—simulates potato dry matter production based on the amount ofintercepted radiation by its green foliage and a conversion factor for RUE (Spitters1990), following the approach of Kooman and Haverkort (1994) by calculating thetemperature-dependent phenological development of a potato crop. Higher temperatureslead to earlier crop emergence and a more rapid initial leaf growth, resulting in increasedinterception of solar radiation at early stages of crop growth, a more rapid maturation ofthe crop, and a reduced length of the growing cycle from planting to harvest. Moreover,very high temperatures reduce photosynthesis and increase respiration and therebyreduce the radiation use efficiency, and thus biomass accumulation.
We simulated shoot growth, foliar expansion, biomass accumulation, and tuber growth on a day-to-day basis. Climate input data required by the model include daily minimum and maximum temperatures, incoming solar radiation and rainfall, reference evapotranspiration, and CO2 concentration. Management input data include the depth and date of planting. Accumulated degree days from planting (with a base temperature of 2 °C) determines the time to crop emergence, leaf area development, and the time of crop termination. The leaf area index (LAI) increases exponentially from crop emer-gence until a leaf area index of 0.75 is achieved. Thereafter, its development depends on temperature and water availability until a full crop cover is reached (LAI>3). Daily biomass growth is calculated using the crop’s LAI, light interception (using an extinc-tion coefficient of 1 (Spitters and Schapendonk 1990)), and the RUE (1.25 g dry matter MJ−1 of intercepted global radiation). In the model, photosynthesis capacity is reduced when the average day temperature falls below 16 °C or when the maximum temperature exceeds 30 °C and is completely halted at temperatures below 2 °C and above 35 °C (Kooman and Haverkort 1994). The harvest index for all growing conditions was set at 0.75 (Kooman and Haverkort 1994), and simulated yields are presented as tuber fresh matter, assuming a dry matter concentration of 20%.
Daily evapotranspiration (ET) was calculated from the Penman-Monteith grass reference ETo (Smith et al. 1996) multiplied by a crop-specific coefficient (Kc) according to the procedure recommended by Allen et al. (1996). Daily ETo values
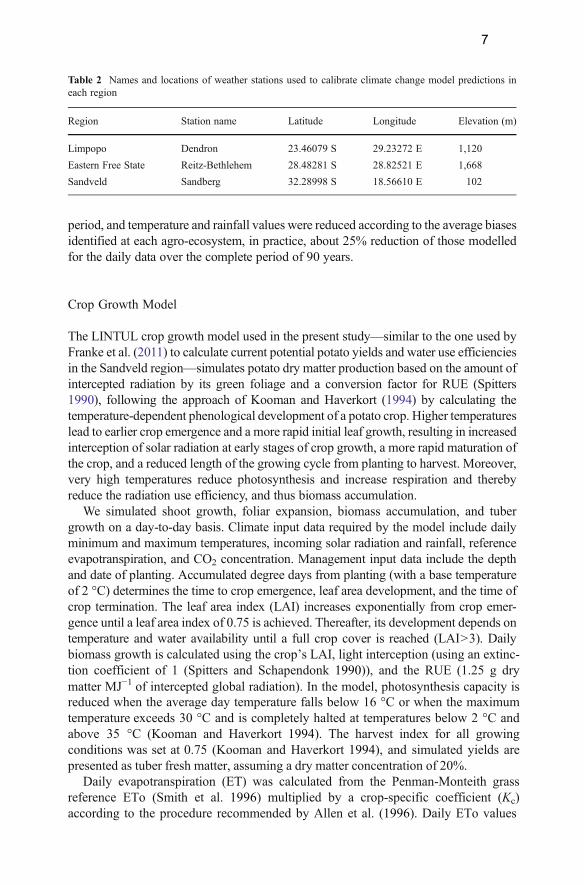
Table 2 Names and locations of weather stations used to calibrate climate change model predictions ineach region
Region Station name Latitude Longitude Elevation (m)
Limpopo Dendron 23.46079 S 29.23272 E 1,120
Eastern Free State Reitz-Bethlehem 28.48281 S 28.82521 E 1,668
Sandveld Sandberg 32.28998 S 18.56610 E 102
7
were calculated using the daily maximum and minimum temperatures, relative humidity, wind speed, and solar radiation as input parameters. Evaporation from the soil was quantified following Ritchie (1972), who calculated that a soil with an average water holding capacity that is wetted every 4 days by irrigation or rain has an evaporation rate that is one third of ETo until emergence of the crop. Thereafter, evaporation from the soil decreases linearly with ground cover (calculated from LAI) to 10% of ET at full ground cover at the LAI value of 3.
Both RUE and the crop coefficient (Kc) used to derive ET from ETo are affected by changing CO2 levels. Jaggard et al. (2010) assumed a net yield increase resulting from CO2 and O3 increase of 28.5% between 2010 and 2050, with an expected CO2 concentration increase of 190 ppm (the FACE experiments took place around the year 2000 with a CO2 concentration of 360 ppm). The relative increase (after 1990) or decrease (before 1990) in RUE per ppm CO2 change is therefore 0.15% of 1.25 g MJ−1=0.001875 gMJ−1ppm−1 CO2. Similarly, the impact of changing CO2 levels on the crop coefficient was modelled. Jaggard et al. (2010) assumed an 11% decrease in water use during a crop season of unaltered length between 1990 and 2050 when the CO2 concentration increased with 190 ppm. Hence, between 1960 (315 ppm) and 2050 (550 ppm), the crop is expected to use 13.6% less water if other climatic conditions remain the same. The crop coefficient was thus reduced from 1.20 in 1990 to 1.07 in 2050 and increased before 1990 as a function of atmospheric CO2 levels. The inves-tigations to which Jaggard et al. (2010) refer mention responses of final potato tuber yield to increased CO2 levels. This implies that they have taken into account any potential alteration in dry matter allocation patterns (to, e.g., leaves, stems and roots), as well as possible differences between the ratio of photosynthesis and respiration. Our approach therefore to relate past and future RUE to total dry matter production, assuming a harvest index of 0.75, is based on the same experimental evidence.
To estimate ET, WUE, and drainage, we calculated a daily water balance using theplant available water of the most prominent soil in any region. When rainfall was inexcess of what the soil can hold, it will not be available to the plant, as it may drainbelow the rooting zone (assumed to be 0.5 m deep throughout South Africa whenrunning the models). Farmers were assumed to irrigate when 50% of the plantavailable water has depleted and may have irrigated just prior to an excessiverainstorm (then all precipitation is lost through drainage) or may have been aboutto irrigate when the rainfall event took place (then an amount equal to 50% of theplant available water is utilized and the rest is lost through drainage). We thereforeassumed that only daily rainfall that is not in excess of 25% of the plant availablewater was available for crop growth. We also assumed that water was available forirrigation whenever needed.
We ran the model for four contrasting agro-ecosystems for the data in pixels inwhich we knew potato is an important part of the cropping system (Fig. 1, Table 1)and to cover the four combinations of summer and winter crops with and withoutsignificant precipitation during the growing season:
1. Sandveld (Leipoldville) winter crop planted on March 15 with cycle of 110 days(wet winter), coordinates: 18.5°E 32.5°S.
2. Sandveld (Leipoldville) summer crop planted on September 15 with cycle of130 days (dry summer), coordinates: 18.5°E 32.5°S.
8
3. Eastern Free State (Reitz-Bethlehem) planted on Oct 15 with cycle of 120 days(wet summer), coordinates: 28.5°E 28.0°S.
4. Limpopo (Dendron) planted on July 15 with cycle of 130 days (dry winter),coordinates: 29.0°E 23.5°S
Data Handling and Presentation
In Figs. 2, 3, 4, 5, 6, and 7, not the whole year average but the average during the periodbetween planting and harvest (between 110 and 130 days, depending on site and season) ispresented. The two solid lines in the graphs represent the maximum and minimum valuescalculated using any of the six downscalings, and the dots represent the average value of thecalculations from all six weather sets. With these average values, a linear regressionanalysis was carried out based on the equation y=a+bx, where y is the dependent variable,the value of a weather or crop parameter, and x the independent variable, i.e., the yearbetween 1961 and 2050. The coefficient of determination (R2) from the regression analysesrepresents the proportion of variation of y explained by variation of x. The 1960 and 2050values in Tables 3 and 4 were calculated using the equation derived from linear regression;theΔ values per year allow for easy comparison between sites and seasons. Tables 3 and 4also show results of regression analyses of data not shown in the figures.
All yields are given as fresh tuber yield (assuming 20% dry matter). The WUE wascalculated as the fresh tuber yield divided by the total evapotranspiration (from plantand soil). Possible irrigation losses and drainage were not considered here.
Results
Weather and Climate Change for the Four Contrasting Agro-Ecosystems
The Tmax and Tmin values of the Sandveld summer, the eastern Free State, andLimpopo are comparable (Fig. 2). However, Tmax values of the Sandveld in summerand Limpopo more frequently exceed 30 °C, especially in the next decades, reducingthe photosynthesis capacity of the potato crop. Temperatures of the Sandveld inwinter are considerably lower than in the other situations. The increase in Tmax overa century is about 2.3 °C at the coastal Sandveld and over 2.6 °C at the inland sites.Tmin increases on average by 1.8 °C at the coast and 2.5 °C inland. The temperaturesshow little variation among years and increase steadily as is shown by the highcoefficient of determination values of around 0.8 (Table 3).
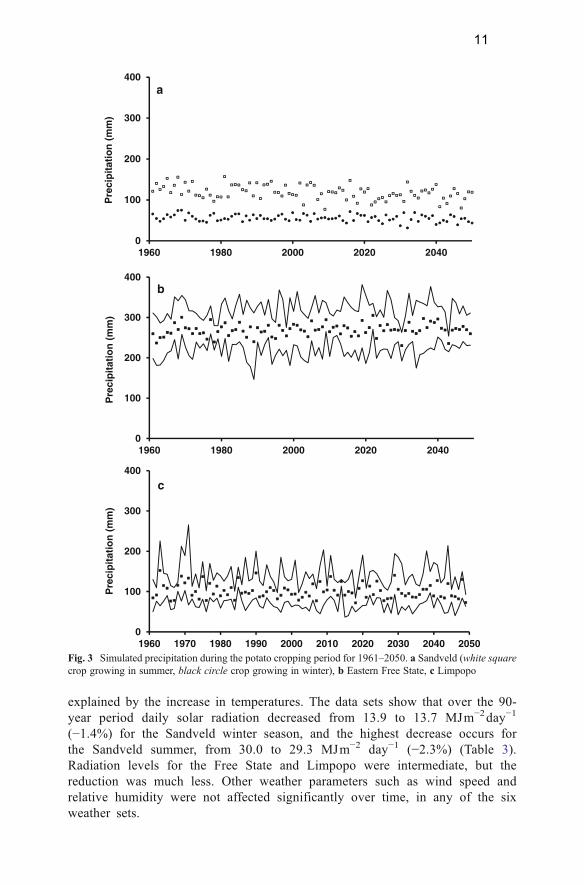
Rainfall data for the four agro-ecosystems are shown in Fig. 3. The “dry summer”and “dry winter” situation still have some rainfall (60 and 106 mm, respectively, in1960). The variation over years is much higher than for temperatures, and also thevariation between the different downscaled sets is greater, as shown by the distancebetween the two solid lines (not shown for the Sandveld situation because summerand winter lines interfered too much). Due to the greater variation between years, thecoefficient of determination values are very low (less than 0.14) (Table 3), indicatingthat the decrease in rainfall of 25, 9, and 10 mm in the Sandveld winter, summer, andLimpopo, respectively, and an increase of 10 mm in the Free State are associated witha high degree of uncertainty, although a downward trend for most situations is clear.
9
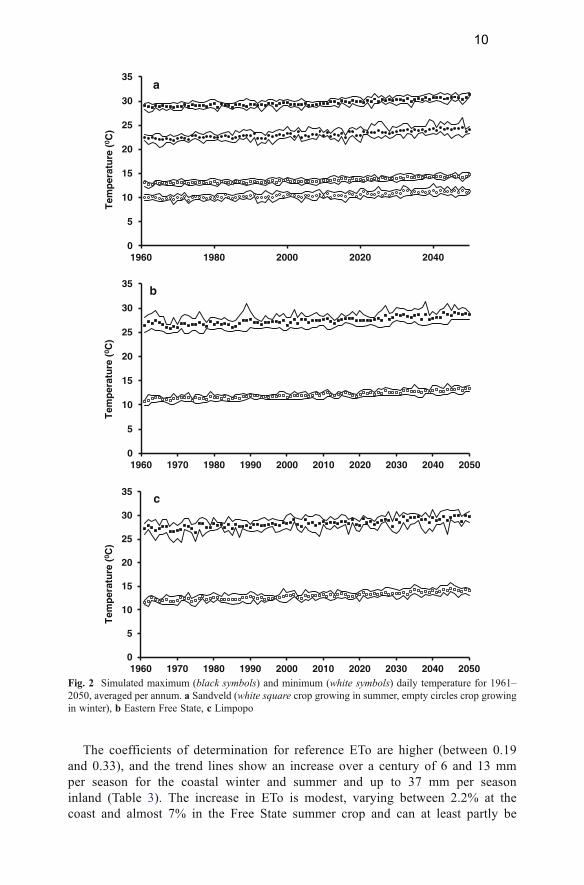
The coefficients of determination for reference ETo are higher (between 0.19and 0.33), and the trend lines show an increase over a century of 6 and 13 mmper season for the coastal winter and summer and up to 37 mm per seasoninland (Table 3). The increase in ETo is modest, varying between 2.2% at thecoast and almost 7% in the Free State summer crop and can at least partly be
0
5
10
15
20
25
30
35
1960 1980 2000 2020 2040
Tem
per
atu
re (
0 C)
a
0
5
10
15
20
25
30
35
1960 1970 1980 1990 2000 2010 2020 2030 2040 2050
Tem
per
atu
re (
0 C)
b
0
5
10
15
20
25
30
35
1960 1970 1980 1990 2000 2010 2020 2030 2040 2050
Tem
per
atu
re (
0 C)
c
Fig. 2 Simulated maximum (black symbols) and minimum (white symbols) daily temperature for 1961–2050, averaged per annum. a Sandveld (white square crop growing in summer, empty circles crop growingin winter), b Eastern Free State, c Limpopo
10
explained by the increase in temperatures. The data sets show that over the 90-year period daily solar radiation decreased from 13.9 to 13.7 MJm−2day−1
(−1.4%) for the Sandveld winter season, and the highest decrease occurs forthe Sandveld summer, from 30.0 to 29.3 MJm−2 day−1 (−2.3%) (Table 3).Radiation levels for the Free State and Limpopo were intermediate, but thereduction was much less. Other weather parameters such as wind speed andrelative humidity were not affected significantly over time, in any of the sixweather sets.
0
100
200
300
400
1960 1980 2000 2020 2040
Pre
cip
itat
ion
(m
m)
a
0
100
200
300
400
1960 1980 2000 2020 2040
Pre
cip
itat
ion
(m
m)
b
0
100
200
300
400
1960 1970 1980 1990 2000 2010 2020 2030 2040 2050
Pre
cip
itat
ion
(m
m)
c
Fig. 3 Simulated precipitation during the potato cropping period for 1961–2050. a Sandveld (white squarecrop growing in summer, black circle crop growing in winter), b Eastern Free State, c Limpopo
11
Crop Growth Model Explorations
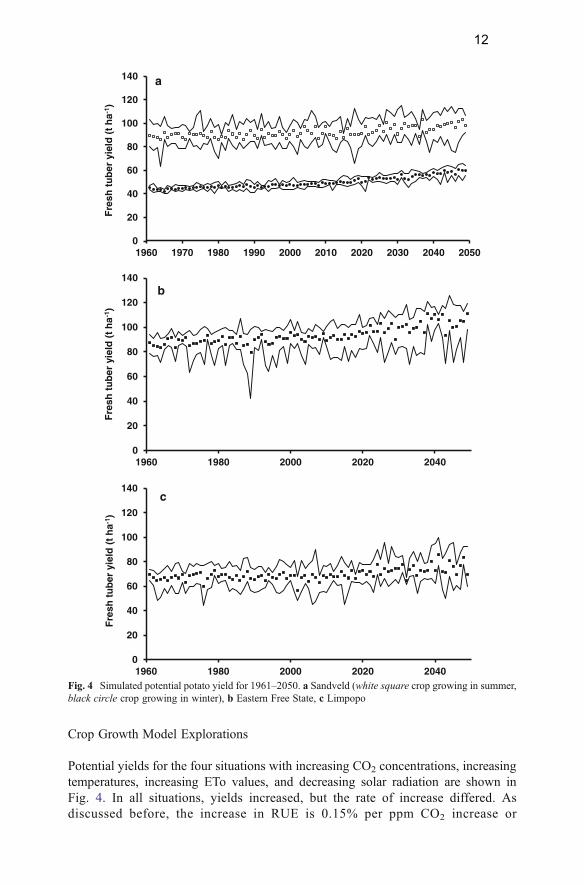
Potential yields for the four situations with increasing CO2 concentrations, increasingtemperatures, increasing ETo values, and decreasing solar radiation are shown inFig. 4. In all situations, yields increased, but the rate of increase differed. Asdiscussed before, the increase in RUE is 0.15% per ppm CO2 increase or
0
20
40
60
80
100
120
140
1960 1970 1980 1990 2000 2010 2020 2030 2040 2050
Fre
sh t
ub
er y
ield
(t
ha-
1 )
a
0
20
40
60
80
100
120
140
1960 1980 2000 2020 2040
Fre
sh t
ub
er y
ield
(t
ha-
1 )
b
0
20
40
60
80
100
120
140
1960 1980 2000 2020 2040
Fre
sh t
ub
er y
ield
(t
ha-
1 )
c
Fig. 4 Simulated potential potato yield for 1961–2050. a Sandveld (white square crop growing in summer,black circle crop growing in winter), b Eastern Free State, c Limpopo
12
0.001875 gMJ−1ppm−1 CO2 increase (with temperatures and radiation unchanged), with 1990 (360 ppm CO2) as a reference for our calculations when a RUE of 1.25 g MJ−1 was assumed (Kooman and Haverkort 1994). Hence, the RUE in 1960
0
100
200
300
400
500
600
700
800
1960 1980 2000 2020 2040
Pre
cip
itat
ion
def
icit
(m
m)
a
0
100
200
300
400
500
600
700
800
1960 1980 2000 2020 2040
Pre
cip
itat
ion
def
icit
(m
m)
b
0
100
200
300
400
500
600
700
800
1960 1980 2000 2020 2040
Pre
cip
itat
ion
def
icit
(m
m)
c
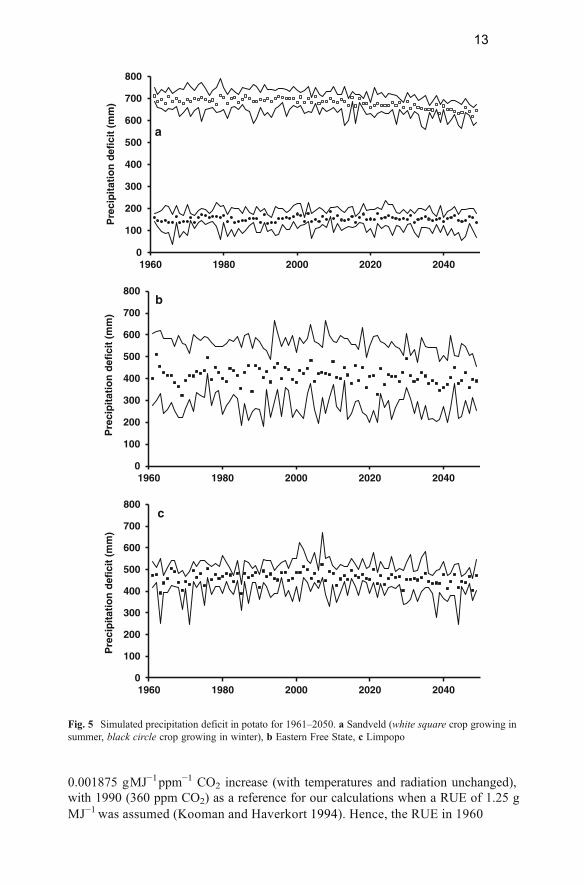
Fig. 5 Simulated precipitation deficit in potato for 1961–2050. a Sandveld (white square crop growing insummer, black circle crop growing in winter), b Eastern Free State, c Limpopo
13
(315 ppm) was 1.17 gMJ−1, and in 2050 (550 ppm), it will be 1.61. With yieldproportional to RUE, a yield increase of 38% is expected between 1960 and 2015.
The two summer crops, intercepting most radiation (Table 3), showed the highestyields, both in 1960 and in 2050 (Fig. 4 and Table 4). The two winter crops turned out
0
5
10
15
20
25
30
1960 1980 2000 2020 2040
WU
E (
g f
resh
tu
ber
l-1 w
ater
)
a
0
5
10
15
20
25
30
1960 1980 2000 2020 2040
WU
E (
g f
resh
tu
ber
l-1 w
ater
)
b
0
5
10
15
20
25
30
1960 1980 2000 2020 2040
WU
E (
g f
resh
tu
ber
l-1 w
ater
)
c
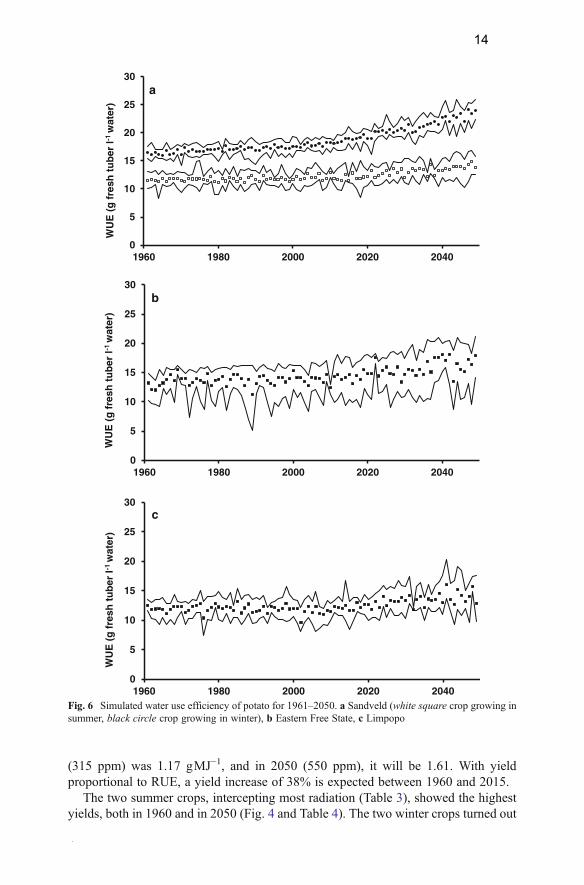
Fig. 6 Simulated water use efficiency of potato for 1961–2050. a Sandveld (white square crop growing insummer, black circle crop growing in winter), b Eastern Free State, c Limpopo
14
to have the lowest yields, with the Sandveld substantially lower than Limpopo. TheSandveld is further south with shorter day lengths in winter and crops receiving lesssolar radiation than in Limpopo. The strongest relative effect of increased CO2 onyield, however, is for the Sandveld winter crop, increasing from 42.0 to 57.6 Mgha−1,an increase of 37.1%, close to what was predicted from the CO2 increase (correctedfor the negative influence of O3). The next coolest site, the Free State, showed a yieldincrease of 23.7%, and the warmer Sandveld summer and Limpopo winter showed
0
10
20
30
40
50
1960 1980 2000 2020 2040
Dra
inag
e (m
m w
ater
)
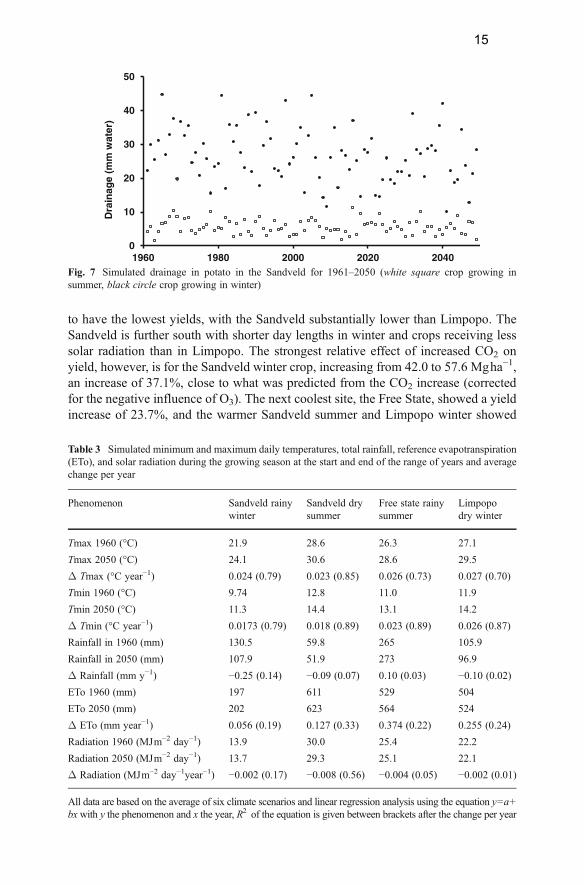
Fig. 7 Simulated drainage in potato in the Sandveld for 1961–2050 (white square crop growing insummer, black circle crop growing in winter)
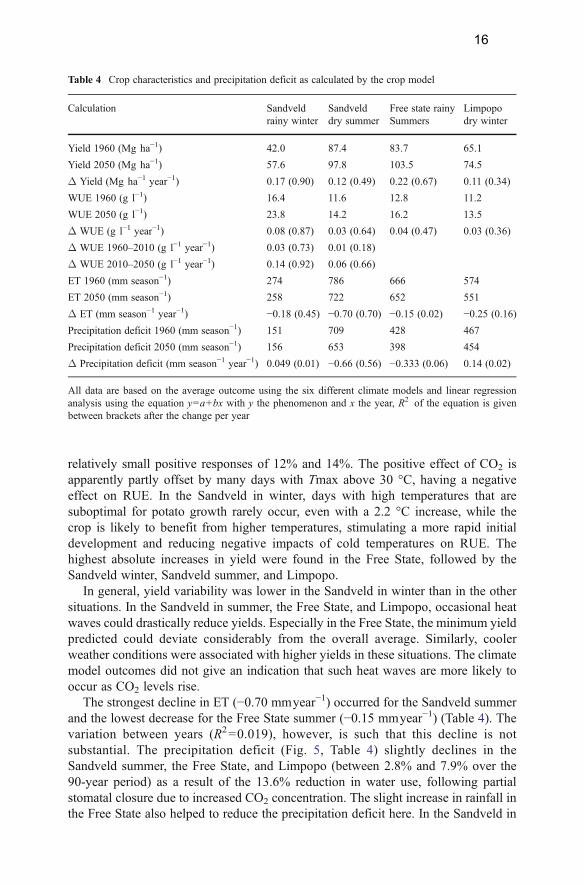
Table 3 Simulated minimum and maximum daily temperatures, total rainfall, reference evapotranspiration(ETo), and solar radiation during the growing season at the start and end of the range of years and averagechange per year
Phenomenon Sandveld rainywinter
Sandveld drysummer
Free state rainysummer
Limpopodry winter
Tmax 1960 (°C) 21.9 28.6 26.3 27.1
Tmax 2050 (°C) 24.1 30.6 28.6 29.5
Δ Tmax (°C year−1) 0.024 (0.79) 0.023 (0.85) 0.026 (0.73) 0.027 (0.70)
Tmin 1960 (°C) 9.74 12.8 11.0 11.9
Tmin 2050 (°C) 11.3 14.4 13.1 14.2
Δ Tmin (°C year−1) 0.0173 (0.79) 0.018 (0.89) 0.023 (0.89) 0.026 (0.87)
Rainfall in 1960 (mm) 130.5 59.8 265 105.9
Rainfall in 2050 (mm) 107.9 51.9 273 96.9
Δ Rainfall (mm y−1) −0.25 (0.14) −0.09 (0.07) 0.10 (0.03) −0.10 (0.02)
ETo 1960 (mm) 197 611 529 504
ETo 2050 (mm) 202 623 564 524
Δ ETo (mm year−1) 0.056 (0.19) 0.127 (0.33) 0.374 (0.22) 0.255 (0.24)
Radiation 1960 (MJm−2 day−1) 13.9 30.0 25.4 22.2
Radiation 2050 (MJm−2 day−1) 13.7 29.3 25.1 22.1
Δ Radiation (MJm−2 day−1year−1) −0.002 (0.17) −0.008 (0.56) −0.004 (0.05) −0.002 (0.01)
All data are based on the average of six climate scenarios and linear regression analysis using the equation y=a+bx with y the phenomenon and x the year, R2 of the equation is given between brackets after the change per year
15
relatively small positive responses of 12% and 14%. The positive effect of CO2 isapparently partly offset by many days with Tmax above 30 °C, having a negativeeffect on RUE. In the Sandveld in winter, days with high temperatures that aresuboptimal for potato growth rarely occur, even with a 2.2 °C increase, while thecrop is likely to benefit from higher temperatures, stimulating a more rapid initialdevelopment and reducing negative impacts of cold temperatures on RUE. Thehighest absolute increases in yield were found in the Free State, followed by theSandveld winter, Sandveld summer, and Limpopo.
In general, yield variability was lower in the Sandveld in winter than in the othersituations. In the Sandveld in summer, the Free State, and Limpopo, occasional heatwaves could drastically reduce yields. Especially in the Free State, the minimum yieldpredicted could deviate considerably from the overall average. Similarly, coolerweather conditions were associated with higher yields in these situations. The climatemodel outcomes did not give an indication that such heat waves are more likely tooccur as CO2 levels rise.
The strongest decline in ET (−0.70 mmyear−1) occurred for the Sandveld summerand the lowest decrease for the Free State summer (−0.15 mmyear−1) (Table 4). Thevariation between years (R2=0.019), however, is such that this decline is notsubstantial. The precipitation deficit (Fig. 5, Table 4) slightly declines in theSandveld summer, the Free State, and Limpopo (between 2.8% and 7.9% over the90-year period) as a result of the 13.6% reduction in water use, following partialstomatal closure due to increased CO2 concentration. The slight increase in rainfall inthe Free State also helped to reduce the precipitation deficit here. In the Sandveld in
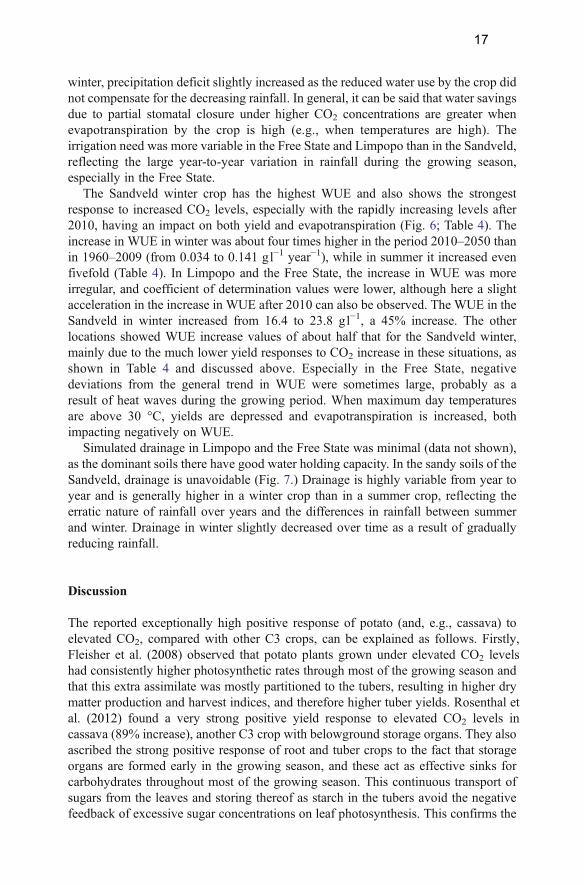
Table 4 Crop characteristics and precipitation deficit as calculated by the crop model
Calculation Sandveldrainy winter
Sandvelddry summer
Free state rainySummers
Limpopodry winter
Yield 1960 (Mg ha−1) 42.0 87.4 83.7 65.1
Yield 2050 (Mg ha−1) 57.6 97.8 103.5 74.5
Δ Yield (Mg ha−1 year−1) 0.17 (0.90) 0.12 (0.49) 0.22 (0.67) 0.11 (0.34)
WUE 1960 (g l−1) 16.4 11.6 12.8 11.2
WUE 2050 (g l−1) 23.8 14.2 16.2 13.5
Δ WUE (g l−1 year−1) 0.08 (0.87) 0.03 (0.64) 0.04 (0.47) 0.03 (0.36)
Δ WUE 1960–2010 (g l−1 year−1) 0.03 (0.73) 0.01 (0.18)
Δ WUE 2010–2050 (g l−1 year−1) 0.14 (0.92) 0.06 (0.66)
ET 1960 (mm season−1) 274 786 666 574
ET 2050 (mm season−1) 258 722 652 551
Δ ET (mm season−1 year−1) −0.18 (0.45) −0.70 (0.70) −0.15 (0.02) −0.25 (0.16)
Precipitation deficit 1960 (mm season−1) 151 709 428 467
Precipitation deficit 2050 (mm season−1) 156 653 398 454
Δ Precipitation deficit (mm season−1 year−1) 0.049 (0.01) −0.66 (0.56) −0.333 (0.06) 0.14 (0.02)
All data are based on the average outcome using the six different climate models and linear regressionanalysis using the equation y=a+bx with y the phenomenon and x the year, R2 of the equation is givenbetween brackets after the change per year
16
winter, precipitation deficit slightly increased as the reduced water use by the crop didnot compensate for the decreasing rainfall. In general, it can be said that water savingsdue to partial stomatal closure under higher CO2 concentrations are greater whenevapotranspiration by the crop is high (e.g., when temperatures are high). Theirrigation need was more variable in the Free State and Limpopo than in the Sandveld,reflecting the large year-to-year variation in rainfall during the growing season,especially in the Free State.
The Sandveld winter crop has the highest WUE and also shows the strongestresponse to increased CO2 levels, especially with the rapidly increasing levels after2010, having an impact on both yield and evapotranspiration (Fig. 6; Table 4). Theincrease in WUE in winter was about four times higher in the period 2010–2050 thanin 1960–2009 (from 0.034 to 0.141 gl−1 year−1), while in summer it increased evenfivefold (Table 4). In Limpopo and the Free State, the increase in WUE was moreirregular, and coefficient of determination values were lower, although here a slightacceleration in the increase in WUE after 2010 can also be observed. The WUE in theSandveld in winter increased from 16.4 to 23.8 gl−1, a 45% increase. The otherlocations showed WUE increase values of about half that for the Sandveld winter,mainly due to the much lower yield responses to CO2 increase in these situations, asshown in Table 4 and discussed above. Especially in the Free State, negativedeviations from the general trend in WUE were sometimes large, probably as aresult of heat waves during the growing period. When maximum day temperaturesare above 30 °C, yields are depressed and evapotranspiration is increased, bothimpacting negatively on WUE.
Simulated drainage in Limpopo and the Free State was minimal (data not shown),as the dominant soils there have good water holding capacity. In the sandy soils of theSandveld, drainage is unavoidable (Fig. 7.) Drainage is highly variable from year toyear and is generally higher in a winter crop than in a summer crop, reflecting theerratic nature of rainfall over years and the differences in rainfall between summerand winter. Drainage in winter slightly decreased over time as a result of graduallyreducing rainfall.
Discussion
The reported exceptionally high positive response of potato (and, e.g., cassava) to elevated CO2, compared with other C3 crops, can be explained as follows. Firstly, Fleisher et al. (2008) observed that potato plants grown under elevated CO2 levels had consistently higher photosynthetic rates through most of the growing season and that this extra assimilate was mostly partitioned to the tubers, resulting in higher dry matter production and harvest indices, and therefore higher tuber yields. Rosenthal et al. (2012) found a very strong positive yield response to elevated CO2 levels in cassava (89% increase), another C3 crop with belowground storage organs. They also ascribed the strong positive response of root and tuber crops to the fact that storage organs are formed early in the growing season, and these act as effective sinks for carbohydrates throughout most of the growing season. This continuous transport of sugars from the leaves and storing thereof as starch in the tubers avoid the negative feedback of excessive sugar concentrations on leaf photosynthesis. This confirms the
17
hypothesis of Schapendonk et al. (2000) that, under higher CO2 concentration, more sugars become available in potato, enhancing the production and the activity of the sink organs, thus resulting in a substantial enhancement of final tuber yield. Cereals, on the other hand, have shorter-lived reproductive sinks that form relatively late in their growing period and therefore react less favourably, or not at all, to an increased offer of CO2.
Potential yields as simulated in this study represent a hypothetical situation where water, nutrients, and biotic factors are not limiting potato growth. Actual yields are typically about 50–70% of the potential yields in well-managed systems, as was also observed for potato farmers in the Sandveld (Franke et al. 2011). The study suggested that in all four agro-ecosystems, potential yields will increase as a result of climate change. Whether actual yields will change proportionally depends on many other factors, including farmers’ ability to adjust management and crop genotypes to changing environmental conditions.
The precipitation deficits of between 150 and 710 mm shown in this study (Fig. 5,Table 4) are not equivalent to the irrigation need, as part of irrigation water is lostthrough evaporation and drainage. Actual application amounts may be between 50%and 100% higher, depending on soil type, rainfall patterns, and whether the groweruses an irrigation decision support system. The discrepancy between calculated andactual WUE is even greater, as actual yields are lower than potential yields. If farmersachieve 65% of the potential yields, WUEs are expected to equal between 35% and45% of the calculated values, as was observed by Franke et al. (2011) for theSandveld region. Still, the improved WUE as a result of enhanced CO2 levels maymitigate the impact of an expected reduction in future water availability in theSandveld due to current overuse (Archer et al. 2009) and possible declining rainfall.
We have not covered the effects of climate change on tuber quality in this study. Haverkort and Verhagen (2008) discussed the possible effects of climate change on tuber quality aspects and concluded that tuber size will increase if yields are higher while tuber numbers stay the same, dry matter concentration will be lower when average temperatures during tuber growth are higher, and reducing sugar concentration will increase when the growing season is shortened, and tubers are harvested at higher temperatures than currently. They also assumed that liberation of the markets in Europe is going to have a greater influence on where potatoes will be grown in future than shifting suitable areas resulting from climate change. Jaggard et al. (2010) s h o w e d t h a t sugar beet yields in the UK increased from about 35 Mgha−1
in 1975 to 50 Mgha−1 in 2010, a 70% increase due to improved crop management and improved varieties. A similar trend has been seen for South African potato production over the past 20 years (Potatoes South Africa 2011). The area under production has declined from about 66,000 ha in 1991 to about 51,000 ha in 2010. However, over this period, average yields have nearly doubled from 21.2 to 41.2 Mgha−1. These higher yields are mainly attributed to improved management practices, a substantial shift from rain-fed to irrigated cropping (from about 49% irrigated in 1992 to 86% of the total area in 2010) and new cultivars. These steep yield increases have started levelling off over the past 4 years. In the present analyses, we did not include such improved management and product quality aspects, but they will likely affect usable yield and finished product over the next 40 years, as significantly as the yield increase expected from the greater availability of CO2 and improved water use efficiency. We did also not discuss here
18
the effect of climate change on the length of the growing season, optimal planting and harvest times, and the effect thereof on production and resource use efficiency. That subject will be discussed in a following paper (Franke et al. 2013). Furthermore, we did not explore the influence of climate change on pests and diseases of potato, which is also addressed in a subsequent paper (Van der Waals et al. 2013).
Final Conclusions
It is concluded that, for all four contrasting agro-ecosystems, the possible negative effects of future raising temperatures and reduced availability of water will be more than compensated for by the positive effect of increased CO2 on potential water use efficiency and crop productivity. Therefore, we reject the hypothesis that, given the expected increase in average temperatures for southern Africa and the sensitivity of potato to heat stress, the impact of climate change on potato production and water use efficiency will be negative. The beneficial effect of CO2-enrichment for potatoes is much stronger than for cereals that generally benefit less or not at all from increased CO2-levels (e.g., Elsgaard et al. 2012). The importance of potato as a climate change robust crop for food security is, therefore, likely to increase in the decennia to come.
Acknowledgments We thank Potatoes South Africa and The Netherlands Ministry of Economic Affairs,especially Prof. Nico Visser, Agricultural Counsellor at The Netherlands Embassy in Pretoria until mid-2012, for financial support.
References
Allen RG, Smith M, Pruitt WO, Pereira LS (1996) Modifications to the FAO crop coefficient approach.Proc. Int. Conf. Evapotranspiration Irrigation Scheduling, San Antonio, Texas, USA, pp 124–132
Archer ERM, Conrad J, Munch Z, Opperman D, Tadross MA, Venter J (2009) Climate change and commercialagribusiness in the semi-arid northern Sandveld, South Africa. J Integr Environ Sci 6:139–155
De Temmerman L, Hacour A, Guns M (2002) Changing climate and potential impacts on potato yield andquality ‘CHIP’: introduction, aims and methodology. Eur J Agron 17:233–242
Eamus D (1991) The interaction of rising CO2 and temperatures with water use efficiency. Plant CellEnviron 14:843–852
Elsgaard L, Børgesen CD, Olesen JE, Siebert S, Ewert F, Peltonen-Sainio P, Rötter RP, Skjelvåg AO (2012)Shifts in comparative advantages for maize, oat, and wheat cropping under climate change in Europe.Food Addit Contam Part A 29:1514–1526. doi:10.1080/19440049.2012.700953
Engelbrecht FA, McGregor JL, Engelbrecht CJ (2009) Dynamics of the conformal cubic atmosphericmodel projected climate-change signal over southern Africa. Int J Climatol 29:1013–1033
Engelbrecht FA, Landman WA, Engelbrecht CJ, Landman S, Roux B, Bopape MM, McGregor JL,Thatcher M (2011) Multi-scale climate modelling over southern Africa using a variable-resolutionglobal model. Water SA 37:647–658
Engelbrecht CJ, Engelbrecht FA, Dyson LL (2013) High-resolution model-projected changes in mid-tropospheric closed-lows and extreme rainfall events over southern Africa. Int J Climatol 33:173–187
Fleisher DH, Timlin DJ, Reddy VR (2008) Elevated CO2 and water stress effects on potato canopy gasexchange, water use, and productivity. Agric For Meteorol 148:1109–1122
Franke AC, Steyn JM, Ranger KS, Haverkort AJ (2011) Developing environmental principles, criteria,indicators and norms for potato production through field surveys and modelling. Agric Syst 104:297–306
Franke AC,Haverkort AJ, Steyn JM (2013) Climate change and potato production in contrasting South Africanagro-ecosystems 2. Assessing risks and opportunities of adaptation strategies. Potato Res 56. doi:10.1007/s11540-013-9229-x
19
Haverkort AJ, Verhagen A (2008) Climate change and the repercussions for the potato supply chain. PotatoRes 51:223–237
Hijmans RJ (2003) The effect of climate change on global potato production. Am J Potato Res 80:271–279Jaggard KW, Qi A, Ober AA (2010) Possible changes to crop yield by 2050. Phil Trans R Soc Bot
365:2835–2851Kooman PL, Haverkort AJ (1994) Modelling development and growth of the potato crop influenced by
temperature and daylength: LINTUL-POTATO. In: Haverkort AJ, MacKerron DKL (eds) Ecology andmodeling of potato crops under conditions limiting growth. Kluwer Academic Publishers, Dordrecht,pp 41–60
Magliulo V, Bindi M, Rana G (2003) Water use of irrigated potato (Solanum tuberosum L.) grown underfree air carbon dioxide enrichment in central Italy. Agric Ecosyst Environ 97:65–80
Miglietta F, Magiulo V, Bindi M, Cerio L, Vaccari FP, Loduca V (1998) Free Air CO2 Enrichment of potato(Solanum tuberosum L.): development, growth and yield. Global Chang Biol 4:163–172
Nakicenovic N, Swart R (2000) Special report on emission scenarios. A special report of Working Group IIIof the Intergovernmental Panel on Climate Change. Cambridge University Press, Cambridge
Nakicenovic N, Alcamo J, Davis G, de Vries B, Fenhann J, Gaffin S, Gregory K, Griibler A, Yong Jung T, KramT, La Rovere EL, Michaelis L, Mori S, Morita T, Pepper W, Pitcher H, Price L, Riahi K, Roehrl A, RognerHH, Sankovski A, Schlesinger M, Shukla P, Smith S, Swart R, van Rooijen S, Victor N, Dadi Z (2000)Intergovernmental Panel on Climate Change (IPCC) Special Report on Emissions Scenarios. CambridgeUniversity Press, Cambridge, pp 85–89, http://www.ipcc.ch/pdf/special-reports/emissions_scenarios.pdf
NASA (2013) http://climate.nasa.gov/uncertainties (accessed January 2013)Pospisilova J, Catsky J (1999) Development of water stress under increased atmospheric CO2 concen-
trations. Biol Plant 42:1–24Potatoes South Africa (2011) SA Potato industry—hectares and crop size. http://www.potatoes.co.za/
industry-information/national-annual-information.aspx (accessed Jan 2013)Ritchie JT (1972) Model for predicting evaporation from a row crop with incomplete cover. Water Resour
Res 8:1204–1213Rosenthal DM, Slattery RA, Miller RE, Grennan AK, CavagnaroTR FCM, Gleadow RM, Ort DR (2012)
Cassava about-FACE: greater than expected yield stimulation of cassava (Manihot esculenta) by futureCO2 levels. Global Chang Biol 18:2661–2675
Rosenzweig C, Hillel D (1998) Climate change and the global harvest: potential impacts of the greenhouseeffect on agriculture. Oxford University Press, New York, 862 pp
Schapendonk AHCM, Pot CS, Goudriaan J (1995) Simulated effects of elevated carbon dioxide concen-tration and temperature on the productivity of potato. Interaction with cultivar differences for earliness.In: Haverkort AJ, MacKerron DKL (eds) Ecology and modelling of potato crops under conditionslimiting growth. Kluwer, Dordrecht, pp 101–117
Schapendonk AHCM, van Oijen M, Dijkstra M, Pot SC, Jordi WJRM, Stoopen GM (2000) Effects ofelevated CO2 concentration on photosynthetic acclimation and productivity of two potato cultivarsgrown in open-top chambers. Aust J Plant Physiol 7:1119–1130
Smith M, Allen RG, Pereira LS (1996) Revised FAO methodology for crop water requirements. Proc. Int.Conf. Evapotranspiration and Irrigation Scheduling, San Antonio, Texas, USA, pp. 133–140
Spitters CJT (1990) Crop growth models: their usefulness and limitations. Acta Horticult 267:349–368Spitters CJT, Schapendonk AHCM (1990) Evaluation of breeding strategies for drought tolerance in potato
by means of crop growth simulation. Plant Soil 123:193–203Supit I, Van Diepen CA, De Wit AJW, Wolf J, Kabat P, Baruth B, Ludwig F (2012) Assessing climate
change effects on European crop yields using the crop growth monitoring system and a weathergenerator. Agric For Meteorol 164:96–111
Taljaard JJ (1986) Change of rainfall distribution and circulation patterns over Southern Africa in summer.Int J Climatol 6:579–592
Van der Waals JE, Franke AC, Haverkort AJ, Krüger K, Steyn JM (2013) Climate change and potatoproduction in contrasting South African agro-ecosystems 3. Effects on relative development rates ofselected pests and pathogens. Potato Res 56. doi:10.1007/s11540-013-9231-3
Vorne V, Ojanperä K, De Temmerman L, Bindi M, Högy P, Jones MB, Lawson T, Persson K (2002) Effectsof elevated carbon dioxide and ozone on potato tuber quality in the European multiple-site experiment‘CHIP-project’. Eur J Agron 17:369–381
Wolf J, Van OijenM (2003)Model simulation of effects of changes in climate and atmospheric CO2 andO3 ontuber yield potential of potato (cv. Bintje) in the European Union. Agric Ecosyst Environ 94:141–157
Yin X, Struik PC (2008) Applying modelling experiences from the past to shape crop systems biology: theneed to converge crop physiology and functional genomics. New Phytol 179:629–642
20