Embed Size (px)
Citation preview
Climate change and number of Atlantic
tropical cyclones
S. Jevrejeva (POL)
J. Moore and A. Grinsted,
Arctic Centre, University of Lapland, Finland

Outline
• Introduction
• Motivation
• Objective
• Data
• Methods
• Results
• Conclusion

Extremes in changing climate
• In recent years there have been generally evident increases in the number of flooding events, hot spells and tropical cyclones.
• The economic consequences of changes in frequency of extreme events in weather far outweigh any change in mean climate.
• One of the central questions in climate research is:
Will extreme events be more frequent due to a warmer climate?
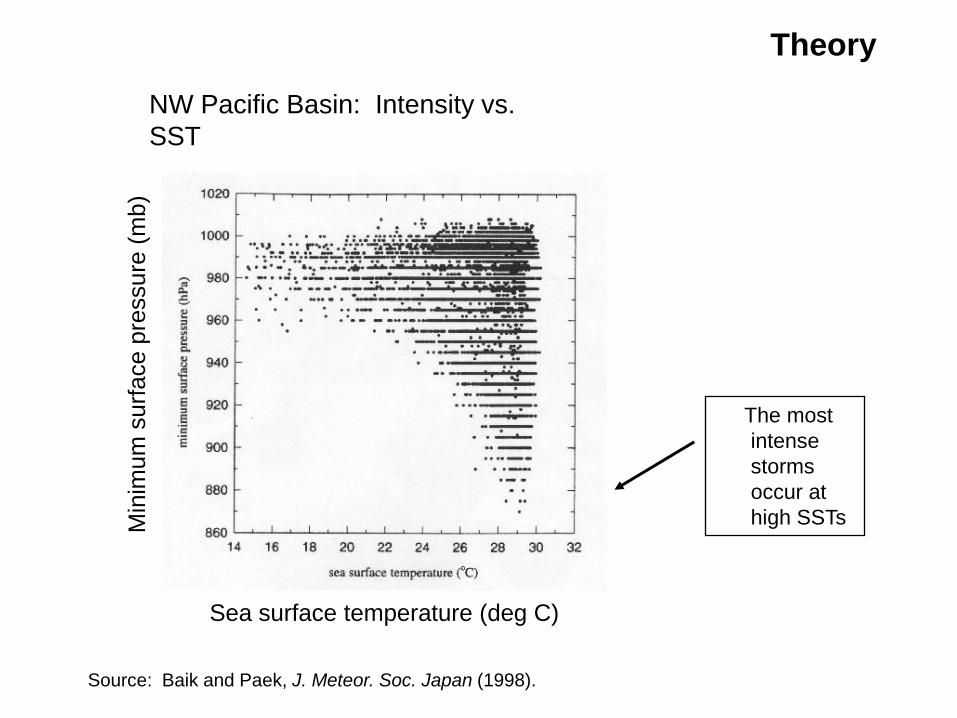
NW Pacific Basin: Intensity vs.
SST
Source: Baik and Paek, J. Meteor. Soc. Japan (1998).
Min
imum
surf
ace p
ressure
(m
b)
Sea surface temperature (deg C)
The most
intense
storms
occur at
high SSTs
Theory

Potential Intensity theories simulate an increase in the
intensity of hurricanes for higher sea surface temperatures
Source: Kerry Emanuel
Theory

What do the models show?
Intensity
• GFDL Model wind speed intensity, V vs SST: ~4-5% per oC (Knutson and Tuleya, 2004)
• Theoretical wind speed intensity, V (hurricane theory) vs SST:
~ 8-16 % per oC (Emanuel, 2006; Holland, 1997)
• Observations ????
Century-scale data: V increases ~10% per oC;
Data since 1980 only: ~30% per oC
Number of tropical cyclones
• reduction of 20% of number of tropical cyclones in 21st century
(Bengtsson et al., 2007)
• no changes in frequency
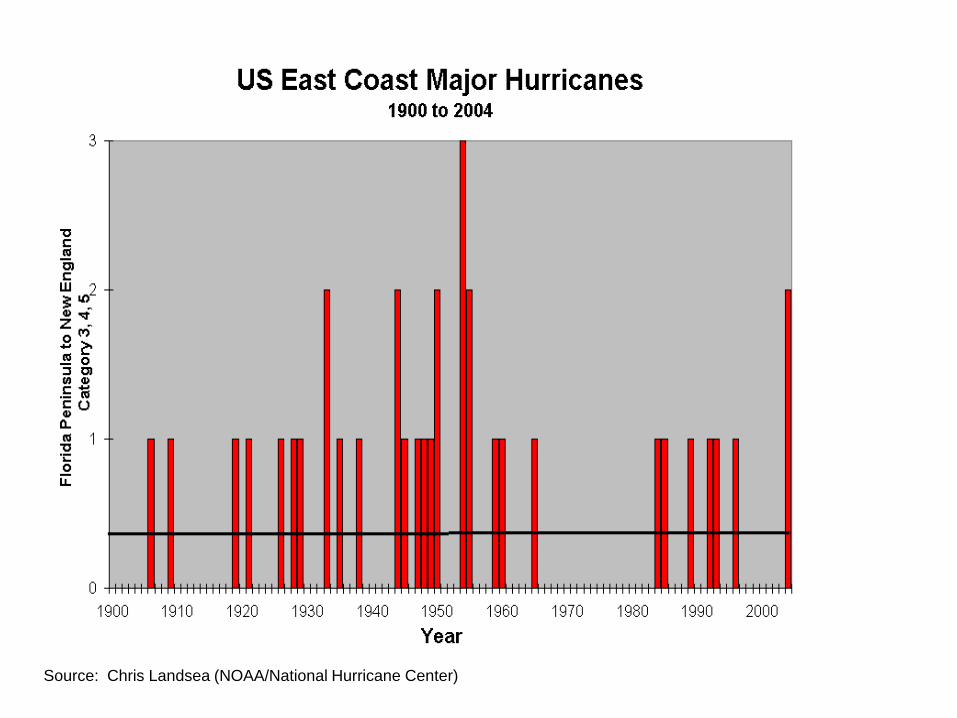
Source: Chris Landsea (NOAA/National Hurricane Center)
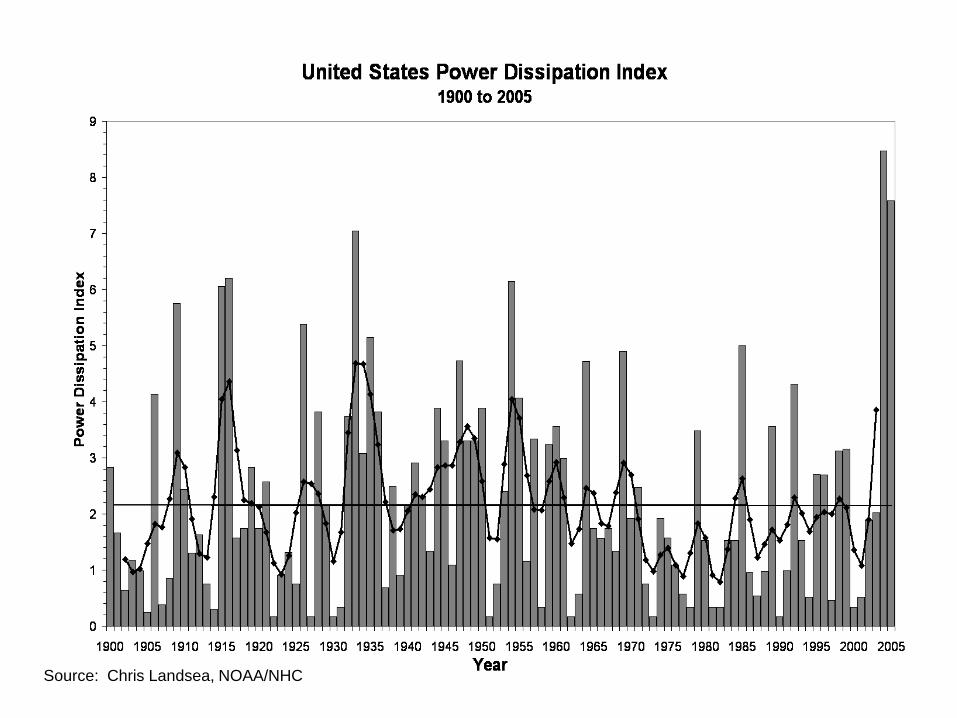
Source: Chris Landsea, NOAA/NHC

Tropical cyclones and rising global temperature
The nature of the link between hurricanes and the rising global temperatures is
controversial:
1. Links to natural climate variability (e.g. AMO), not climate related changes
- Goldenberg et al 2001 (Science);
2. Climate change is the main driving force for the increase in tropical cyclones
- Emanuel 2005 (Nature), Webster et al., 2005 (Science);
- Landsea 2005; Landsea et al. 2006;
- Mann and Emanuel 2006;
- Elsner 2006.
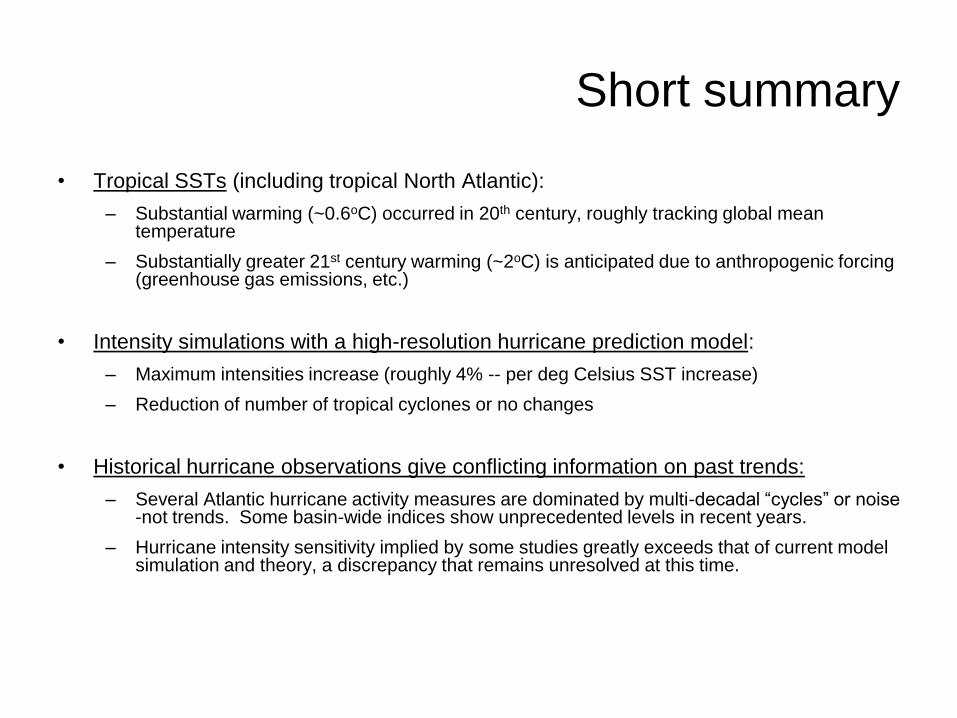
Short summary
• Tropical SSTs (including tropical North Atlantic):
– Substantial warming (~0.6oC) occurred in 20th century, roughly tracking global mean temperature
– Substantially greater 21st century warming (~2oC) is anticipated due to anthropogenic forcing (greenhouse gas emissions, etc.)
• Intensity simulations with a high-resolution hurricane prediction model:
– Maximum intensities increase (roughly 4% -- per deg Celsius SST increase)
– Reduction of number of tropical cyclones or no changes
• Historical hurricane observations give conflicting information on past trends:
– Several Atlantic hurricane activity measures are dominated by multi-decadal “cycles” or noise -not trends. Some basin-wide indices show unprecedented levels in recent years.
– Hurricane intensity sensitivity implied by some studies greatly exceeds that of current model simulation and theory, a discrepancy that remains unresolved at this time.
Motivation
• What is the link between the SST and numbers of tropical
cyclones?
• Alternative data
• Need for new statistical methods
Objectives
The main objective:
to identify the possible link between the SST and long-term
observational record (135 years) of numbers of tropical
cyclones using the advanced statistical methods, assuming that
relationship most probably is
non-stationary,
non-linear,
may be chaotic,
and as well develop over many years.
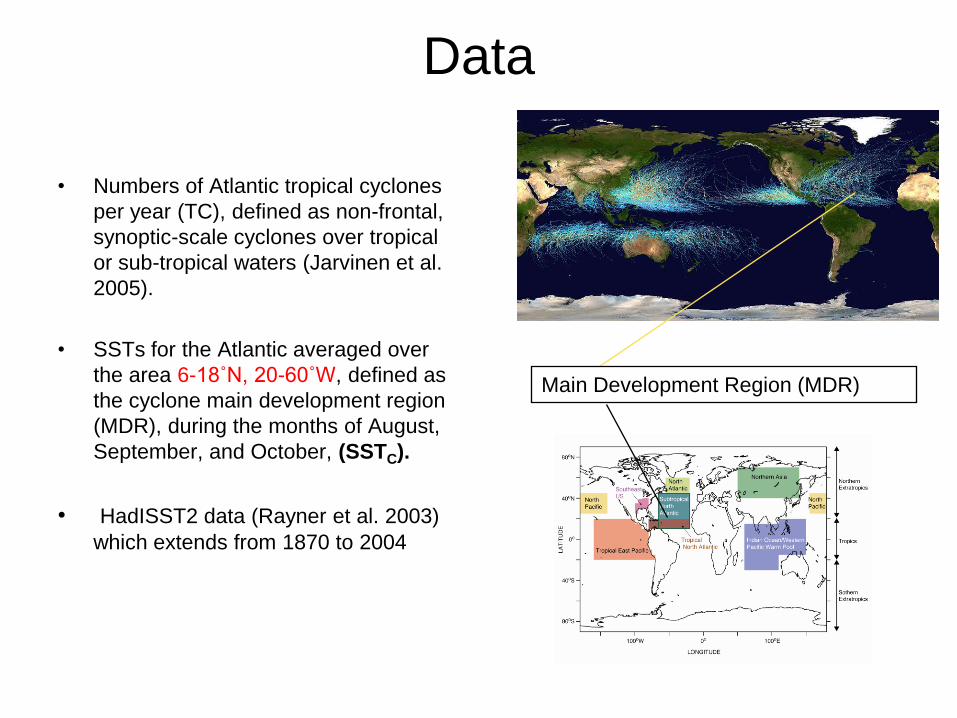
Data
• Numbers of Atlantic tropical cyclones
per year (TC), defined as non-frontal,
synoptic-scale cyclones over tropical
or sub-tropical waters (Jarvinen et al.
2005).
• SSTs for the Atlantic averaged over
the area 6-18˚N, 20-60˚W, defined as
the cyclone main development region
(MDR), during the months of August,
September, and October, (SSTC).
• HadISST2 data (Rayner et al. 2003)
which extends from 1870 to 2004
Main Development Region (MDR)

Correlation between PDI and TC in
10-year moving windows.
Atlantic tropical cyclone count (TC) and
Power Dissipation Index (PDI); correlation
coefficient (r=0.7)
1% significance
5%TC extends back to 1851

Lots of variability – needs sophisticated analysis
Historical record of Atlantic tropical cyclones

Advanced statistical methods
Trend
Oscillations
Noise
Original time series
Methods
• Granger causality
• Wavelet coherence
• Wavelet lag coherence
Granger-causality
• A variable X is said to Granger-cause a variable Y if it can be shown that time series values of X provide significantly improved predictions of future values of Y than predictions based on Y alone would.
• Strong Granger-causality, that is the causality relation applies in only one direction. Only one of the two time series appears to be a significant predictor of the other
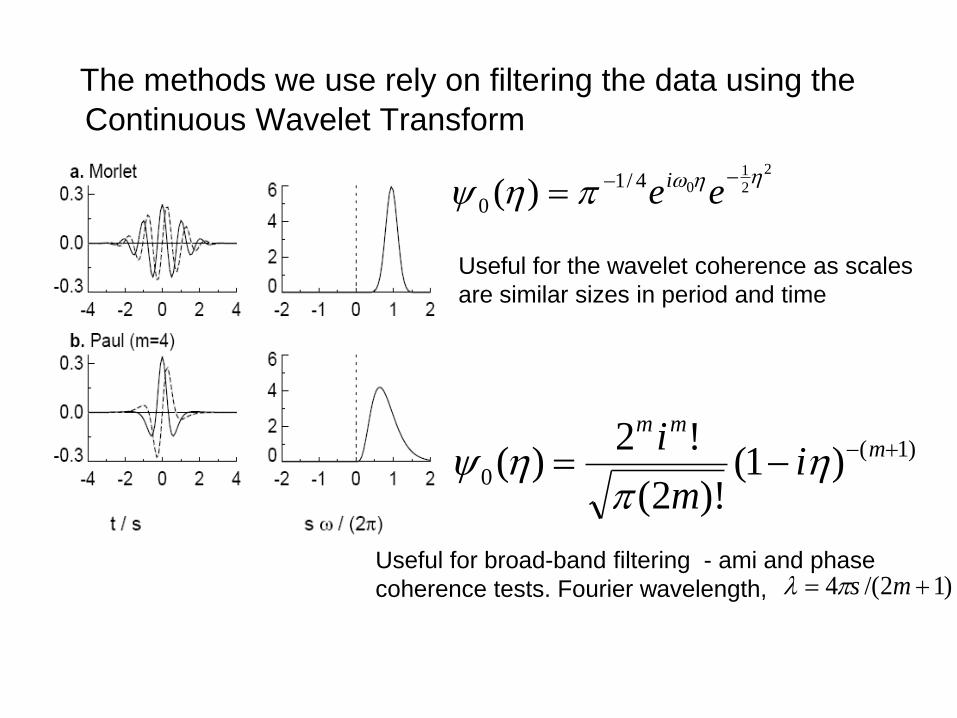
The methods we use rely on filtering the data using the
Continuous Wavelet Transform
2
2
104/1
0 )(
eei
Morlet
Useful for the wavelet coherence as scales
are similar sizes in period and time
)1(
0 )1()!2(
!2)( m
mm
im
i
Paul
Useful for broad-band filtering - ami and phase
coherence tests. Fourier wavelength, )12/(4 ms
Wavelet Coherence
• The definition of wavelet coherence closely resembles that of a
traditional correlation coefficient, and it is useful to think of it as a
localized correlation coefficient in time frequency space.
• Wavelet coherence gives relative phase relationships between two
time series over a wide spectrum of temporal scales
• Morlet wavelet provides good balance between time and frequency
localization.
Jevrejeva et al., 2003; Grinsted et al., 2004;
http://www.pol.ac.uk/home/research/waveletcoherence/

Wavelet coherence
between SSTC and TC
5% significance level against
red noise
Relative phase relationship
In-phase
SSTC leading TC by 90º
Running correlation (blue), and SSTC anomaly (red) 10 year windows.
Decadal SST
leads TC

Wavelet lag coherence
• A measure of coherence between two time series X and Y with
respective phases φ and θ is the angle strength of the phase angle
difference between the series, ρ (mean phase coherence):
• This is a measure of the variability in the phase lag between
X and Y.
2
1
2
1
)sin()cos(1
N
t
tt
N
t
ttN
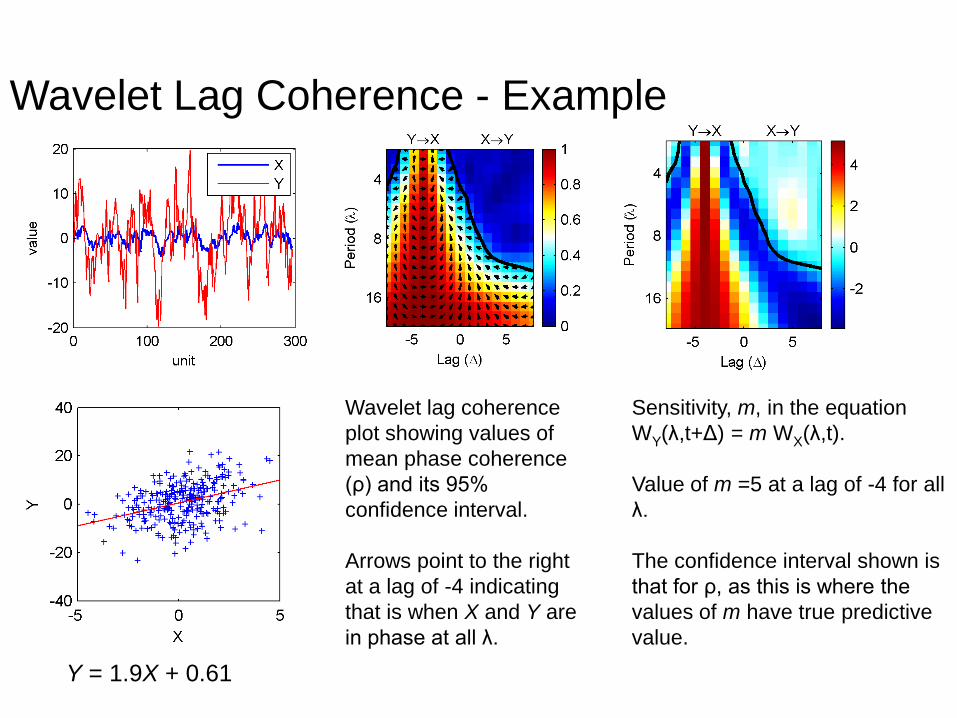
X is red noise with a first order regressive coefficient of 0.8, mean of zero and
unit variance, and series Y and equal to 5X plus white noise (zero mean, unit
variance). X is then lagged by 4 time units relative to the Y, so that Y leads and
hence is causative of X.
Wavelet lag coherence
plot showing values of
mean phase coherence
(ρ) and its 95%
confidence interval.
Arrows point to the right
at a lag of -4 indicating
that is when X and Y are
in phase at all λ.
Sensitivity, m, in the equation
WY(λ,t+Δ) = m WX(λ,t).
Value of m =5 at a lag of -4 for all
λ.
The confidence interval shown is
that for ρ, as this is where the
values of m have true predictive
value.
Wavelet Lag Coherence - Example
Y = 1.9X + 0.61

TC sensitivity on SSTC
number
per °C
Decadal signal
dominates At long periods which should be related to the
Atlantic Multidecadal Oscillation (AMO), there
is no significant region of ρ
Consistent that global
temperatures drive PDI and TC
(Mann and Emanuel 2006; Elsner 2006).
This also contradicts the
suggestion (Goldenberg et al. 2001)
that long-period Atlantic cyclicity
is a significant hurricane forcing
mechanism
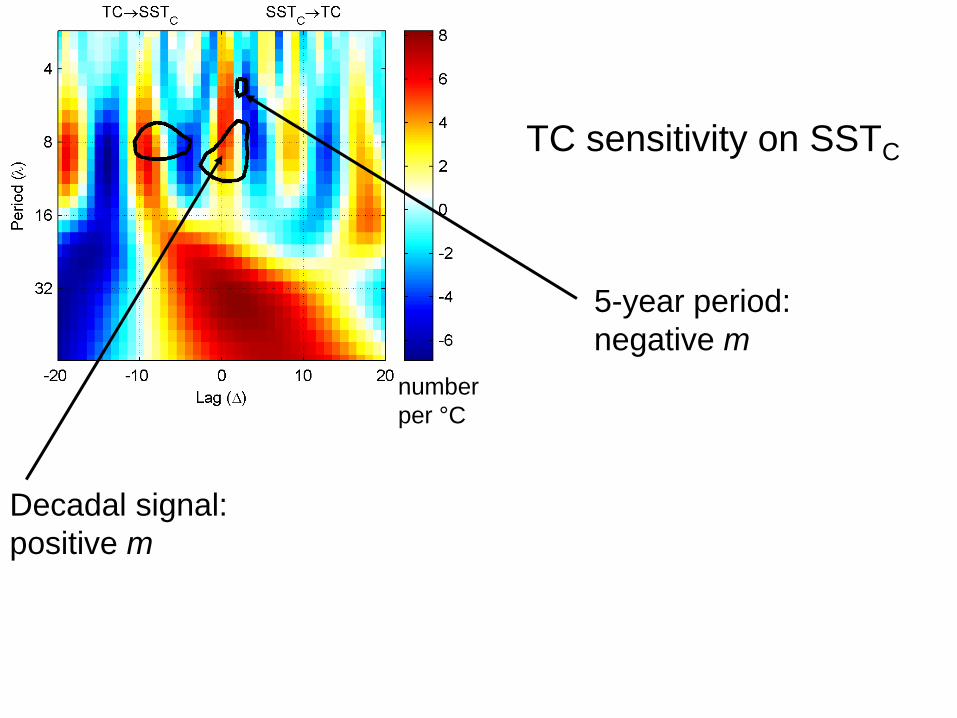
TC sensitivity on SSTC
number
per °C
Decadal signal:
positive m
5-year period:
negative m

TC sensitivity on SSTC TC sensitivity on d(SSTC)/dt
number
per °C
Negative Feedback between TC and SSTC
m=0 at Δ=0
Decadal signal
dominates
– but complex signal. Is TC driving SSTC?
+ & - m ?

Phase-aware teleconnections between TC and global SST 1870 to 2004
5-year periods
Decadal periods
Link to Global SST
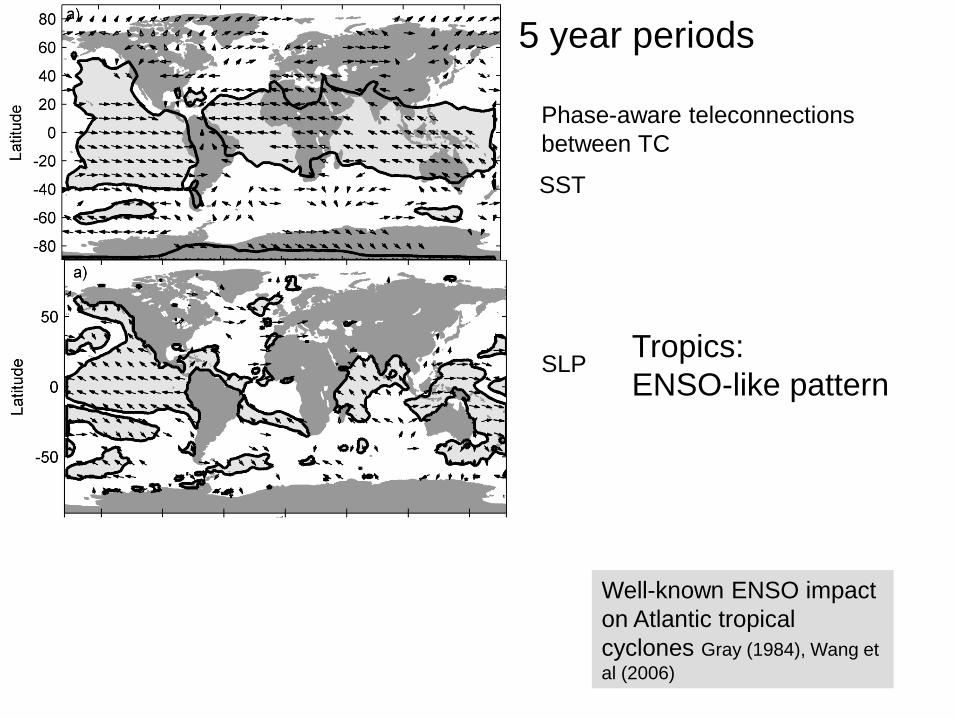
Phase-aware teleconnections
between TC
SST
SLPTropics:
ENSO-like pattern
5 year periods
Well-known ENSO impact
on Atlantic tropical
cyclones Gray (1984), Wang et
al (2006)
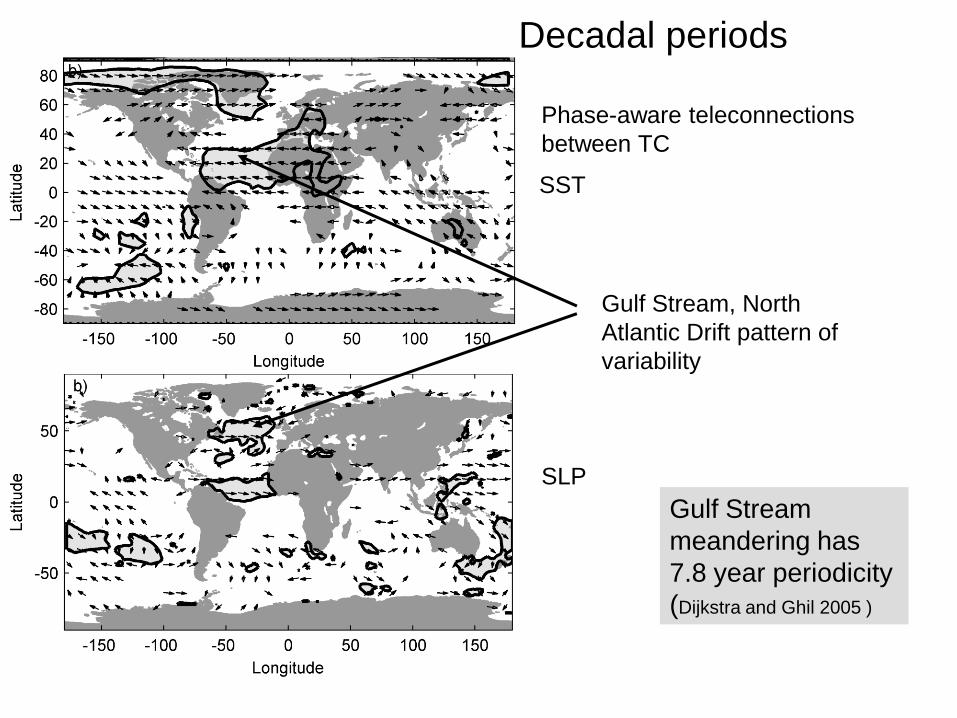
Phase-aware teleconnections
between TC
SST
Decadal periods
SLP
Gulf Stream, North
Atlantic Drift pattern of
variability
Gulf Stream
meandering has
7.8 year periodicity
(Dijkstra and Ghil 2005 )

Conclusions
• The there is a link between the SST and TC via 5 – year and 10-year variability.
• 5- year variability links to ENSO activity and increasing numbers of El Nino cause the reduction of tropical cyclones in North Atlantic
• Decadal variability in SST is mostly associated with North Atlantic variability (heat transport by the Gulf Stream) and it is a dominant factor for increase of TC
• This increase of TC is enhanced when the Gulf Stream is effectively exporting less heat northwards from the cyclone main development area than in previous decades.

For more information
“Gulf Stream and ENSO increase the temperature sensitivity of Atlantic
tropical cyclones”, Journal of Climate (In print)
“Wavelet-lag regression analysis of Atlantic tropical cyclones and snow
cover and their dependence on ENSO and Atlantic thermohaline
variability”, JGR (in review)